


Abstract
This paper investigates the multifaceted macroeconomic drivers of vehicle electrification in India and correlates them with micro-level corporate financial returns using a rigorous dual-stage econometric framework. Stage 1 employs a Newey–West time-series estimator on monthly observations to evaluate aggregate consumer demand elasticities across the automotive sector. Stage 2 utilizes a fixed effects panel specification with clustered standard errors across 10 major Indian automotive manufacturers over a four-year fiscal horizon. Stage 1 results demonstrate that short-run variations in Brent crude prices lack joint predictive power over domestic retail metrics (), supporting the thesis that state-owned OMC price-smoothing insulates short-term market dynamics from global oil shocks. Conversely, Stage 2 panel estimations prove that annual global Brent crude fluctuations yield no significant contemporaneous margin shocks. However, expanding annual EV market penetration exerts a substantive negative impact () bordering statistical significance on corporate operating profit margins. This operational decoupling reflects a prominent industry ‘J-curve’, where accelerating consumer adoption cycles are countered by heavy front-loaded capital expenditures, asset re-tooling, and unoptimized economies of scale. These findings provide critical direct and indirect strategic insights for organizational stakeholders and policymakers navigating transitional capital cycles in emerging markets.
1. Introduction
1.1. Background and Motivation
The global automotive industry is experiencing a dramatic, structural change as a result of both decarbonization and energy security. In emerging markets, this change is particularly striking. Currently, India is the third-largest market for automobiles in the world and has become a primary focus of efforts directed at vehicle electrification. Due to extreme urban air pollution and dependence on importing crude oil, India’s economy is vulnerable to abrupt price fluctuations of crude oil on the international and domestic markets. The government has introduced aggressive supply and demand-side measures to address this situation. Key initiatives such as the Faster Adoption and Manufacturing of Hybrid and Electric Vehicles (FAME) program, along with localized state-based subsidies and Production Linked Incentives (PLI), are being taken to achieve the extremely ambitious goal of 30% of all new private automobiles being electric by 2030.
The speed at which the transition to electric vehicle adoption is dictated is determined by a multidimensional, complex and dynamic economic transmission mechanism interplaying simultaneously at both the macroeconomic level of consumers and the microeconomic level of firms. At the macro level, the adoption of electric vehicles (EVs) by consumers relates to traditional energy costs, domestic monetary policies and fluctuations in the price of retail fuel. Over the past few years, several factors have combined to disrupt the typical way of producing automobiles; however, mainly rapidly increasing fossil fuel prices are expected to increase the number of people adopting electric vehicles because they have a greater Total Cost of Ownership (TCO). Conversely, there are macroeconomic headwinds such as tightening central bank repo rates or inflationary effects on households’ disposable incomes creating structural friction, and thereby resulting in decreased overall automotive demand. The understanding of these macro elasticities is the first major pillar of analyzing sustainable transition pathways.
Consequently, this dramatic change to alternative drive systems also causes an unprecedented reorganization of the automobile industry at the microeconomic level. Internal Combustion Engine (ICE) framework to electric drivetrains require a complete reallocation of corporate capital from legacy automobile manufacturers (like Tata Motors, Mahindra & Mahindra, TVS, and Bajaj Auto) that will have to manage the dual challenges of sustaining profitable legacy businesses while financing the extreme amounts of Capital Expenditure (Capex) for manufacturing process retooling, constructing specific electric vehicle platforms and localizing manufacturing throughout the battery supply chain. At the same time, very highly capitalized pure-play electric vehicle entrants (like Ola Electric and Ather Energy) are following aggressive and volume-driven customer acquisition policies characterized by low introductory pricing and high raw material cost ratios. Subsequently, the operational profit margins for these disparate types of manufacturers diverge from national adoption rates, creating a transitional J-curve effect due to initial market share growth relative to corporate operating margins.
While this intersection of macroeconomics and microeconomics is critical, the literature concerning both areas of study is generally separated. Existing empirical studies are predominantly focused either on macroeconomic determinants of adoption through population-based consumer datasets or on individual qualitative corporate case studies. Investigations that mathematically connect the two together do not exist, thereby representing a critical gap in the literature. This study addresses this empirical gap through the implementation of a robust, dual-stage methodology that leverages the Indian automotive ecosystem.
The first stage of this study utilizes a monthly time-series perspective to calculate the actual elasticity of the aggregate monthly EV registration rate against global Brent crude oil prices, domestic retail fuel price volatility, and central bank repo rate benchmarks through Newey–West covariance estimation. The second stage of this study further modifies the analysis from a macro to a micro enterprise-based level by developing a longitudinally balanced panel dataset that traces the ten largest automotive manufacturers in India over four fiscal calendar years. Once this base dataset was created, the analysis utilized firm-clustered fixed effects (FE) panel estimation to determine how the aggregate electrification rate and energy price volatility affected corporate operating profit margins (OPM).
This paper contributes to the literature by performing three separate tasks. Firstly, it provides some of the only rigorous empirical evidence of the elasticity of the demand for electric vehicles in a significant emerging market during a period of dynamic change. Secondly, it documents the operational financial frictions and J-curve effect experienced by legacy versus pure-play automotive manufacturers as they go through localized structural change into a new form of industrialization. Finally, it provides actionable insights to governmental policymakers and industrial stakeholders on how to maximize market incentives and corporate capital funding for continued viability and economic sustainability of the short-, medium-, and long-term mobility systems.
1.2. Conceptual Framework: The Structural J-Curve Effect
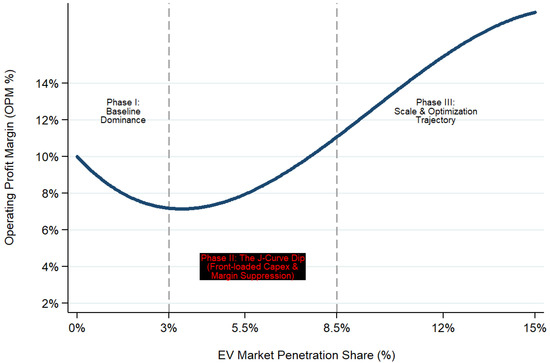
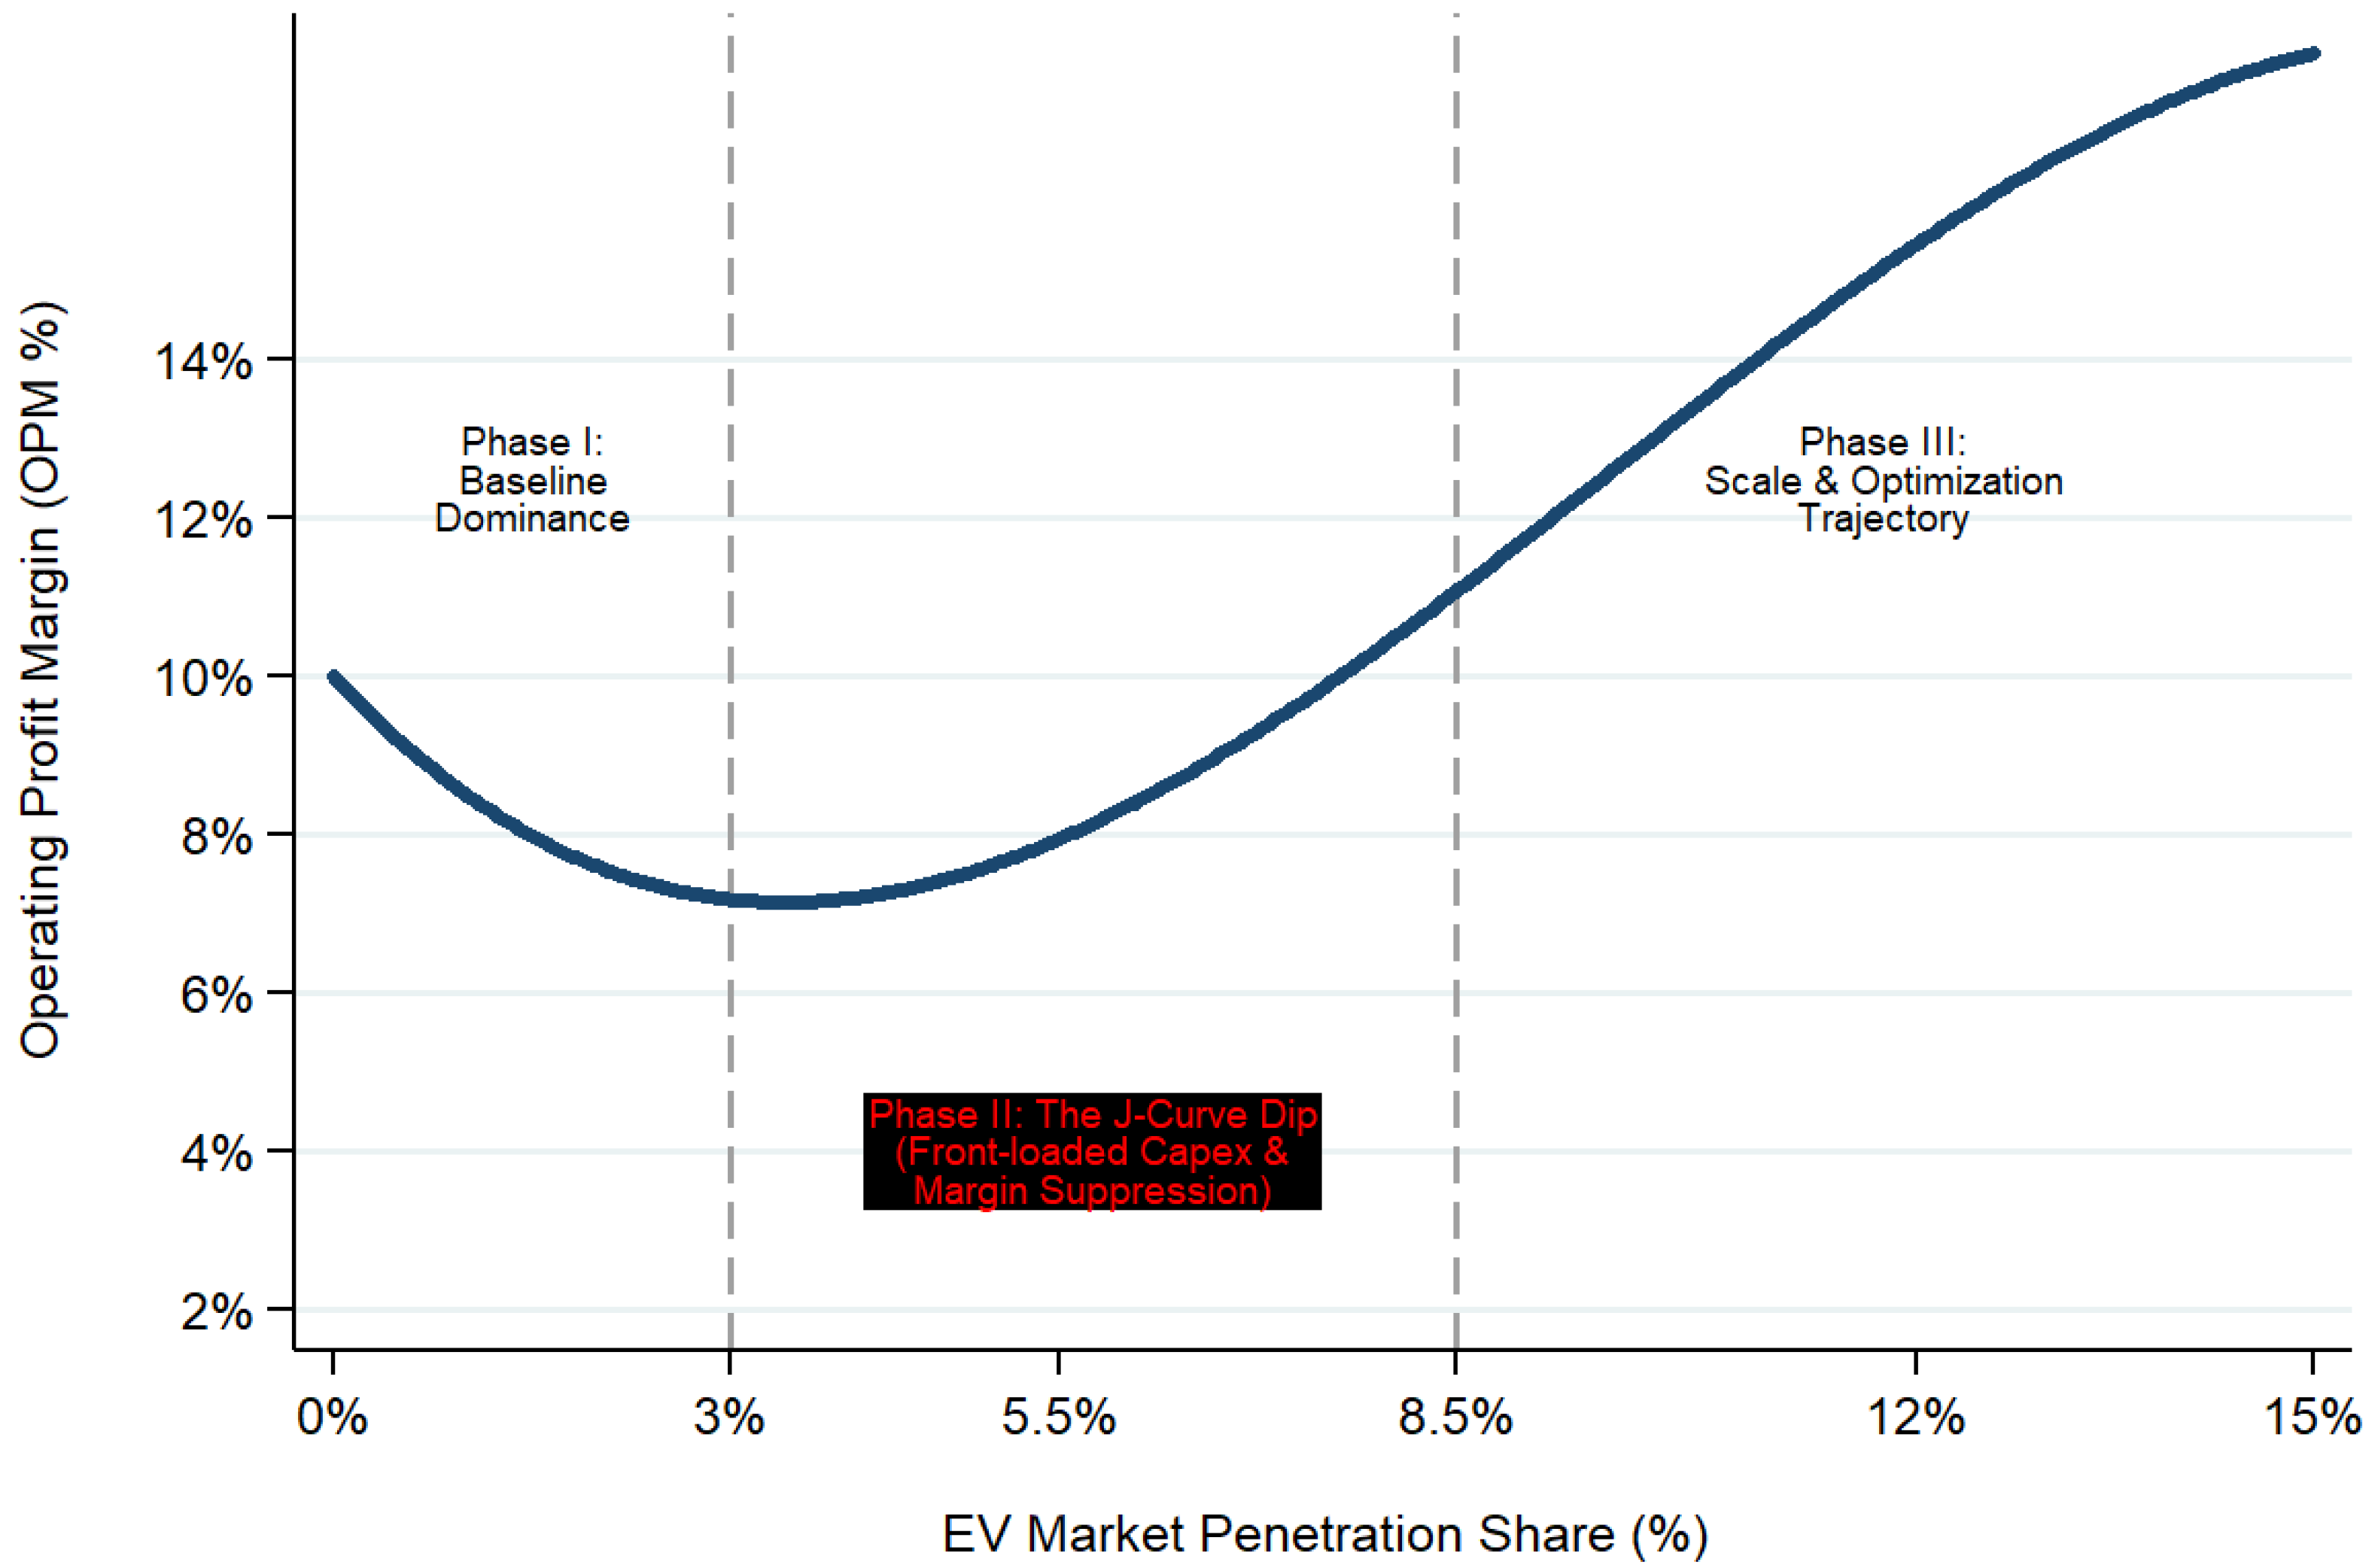
In order to assess the financial performance of automotive original equipment manufacturers (OEMs) in the process of transitioning to electric mobility, this paper introduces a simplified conceptual framework dubbed the structural J-curve effect (see Figure 1). The framework suggests that the trajectory of the operational margin of OEMs undergoes three consecutive structural stages characterized by increasing EV adoption rates in nations.
Figure 1.
Conceptual framework of the structural J-curve effect in automotive electrification.
Phase I (Baseline Dominance): Legacy manufacturers perform relatively stable and mature Operating Profit Margins (OPM) based on traditional internal combustion engine (ICE) economies of scale.
Phase II (Transitional J-Curve Dip): The transition to early-to-mid adoption period (>5.5–8.5% EV market share) corresponds to the temporary decline in operating margins. For traditional manufacturers, the dip is the result of a high level of capital expenditures made in advance, inefficiency of dual manufacturing lines and supply chain re-tooling. For pure-play electric vehicle startups, margin contraction occurs as a result of significant customer acquisition costs and low initial production volumes.
Phase III (Scale and Optimization Trajectory): Crossing the salient level of adoption (>8.5%) enables the emergence of localized battery supply chains and volume-based economies of scale, which, in turn, leads to long-run expansion in corporate profitability.
1.3. Literature Review
- Fuel Substitutes and Powertrain Selection—Macro-to-Micro Transition of Crude Oil Prices
The price of crude oil is a strong macro-to-micro transfer channel impacting the buying decisions of vehicles and their downstream processes as a result of shifts in TCO dynamics. The shift occurs as a result of large and gradual changes in the rate at which the functionality of powertrains can be substituted, conceptually modeled through the alternative fuel price acceptance framework as studied by [1]. It shows that beyond various critical financial thresholds, the velocity at which consumers will substitute their petrol internal combustion engines for electric and hybrid internal combustion engines occurs exponentially.
There is a wide discrepancy in baseline economics based on vehicle use, total distance driven, local taxes, etc., resulting in qualitatively different cross-elasticities in relation to commercial vehicle registrations than for private vehicles [2,3,4]. In developing nations such as India, infrastructure constraints will limit any immediate transition to merely battery-powered electric vehicles. Therefore, ethanol blends such as E20 and hybrid electric vehicles are critical transitionary products serving as buffers on either side of the electric vehicle adoption curve. In the Indian market, a complete transition to electric power will occur in the long-term [5]; however, a significant amount of registration activity is occurring in the two- and three-wheeler registry, which are very sensitive to capital costs [6]. Biofuel and alternative fuel adoption enhances environmental efficacy in the transition from traditional fossil fuels, aiming for complete electrification by 2030. Hybrids provide crucial support to industry stakeholders by allowing immediate fuel cost benefits [7,8]. Discrete choice methods have shown the influence of demographics, financial distress or psychological barriers on consumers changing the speed of substitution in response to an increase in the price of fuel. Younger generations (millennials and Gen Z) show a high likelihood of purchasing electric two-wheeler vehicles, but their actual purchase rate is limited due to financial limitations [9,10,11]. Meanwhile, the high investment involved with purchasing electric passenger cars further limits consumers’ willingness to switch to these vehicles as uncertainties remain over the availability of charging stations and battery life [12,13,14]. Push-pull-mooring dynamics may help explain why consumers have decided not to purchase these vehicles despite rising fuel prices (serving as a powerful push factor) and the lack of charging stations in their area (serving as a strong mooring force), thereby effectively preventing them from switching away from conventional vehicles [15,16]. Thus, enabling consumers to switch from traditional vehicles to electric vehicles requires addressing both the multifaceted barriers to consumer preferences for vehicles with alternative powertrains, as well as developing public policy solutions to mitigate consumers’ anxiety resulting from localized barriers [17,18,19,20,21,22,23,24,25].
- 2.
- Vulnerability Within Supply Chain and Financial Sustainability
Increased demand from consumers who are looking for alternative powertrains, driven by rising gas prices, places extreme pressure on the economy and supply chains to supply consumers’ higher demand for electric than gas-powered cars. With an increasing number of electric cars being produced globally, this facilitates further future instability of the supply chain for manufacturing electric vehicles as costs of commodities increase. The relatively increased composite or total value of the materials required to build an electric vehicle results in the entire economy and automotive industry becoming subject to unanticipated price volatility of the critical raw materials (CRM) used to manufacture electric vehicles. A correlation of changes in the price of a barrel of crude oil with an approximate four-month offset of price changes for lithium, cobalt and nickel batteries has been witnessed. Therefore, the total systemic risk inherent in the production and supply of electric vehicles is ultimately the responsibility of the manufacturers and suppliers of energy that provide the components necessary to produce an electric vehicle [26]. Financial margin elasticity, as well as the survival rates of automotive manufacturers, are significantly influenced by the structural differences between legacy manufacturers and new EV manufacturers.
Legacy OEMs have strong financial support, developed vertical integration throughout their supply chain and diversified multi-powertrain offerings. Empirical evidence supports the view that legacy OEMs’ profitability is based on asset utilization scale and optimized working capital configurations, which provide a strong corporate buffer in the face of macro shocks [27,28]. They can utilize cash flow from profitable internal combustion engine operations to cross-subsidize the developing gross margin of electric vehicles when the cost of critical materials increases. On the other hand, new EV manufacturers experience significant financial margin elasticity, as the lack of an existing base to provide a hedge against price increases, compressed OPM and overdependence on market sentiment, liquidity and significant system reduction in inventory [29]. To reduce exposure to supply chain vulnerabilities, new manufacturers need to adapt their operations to be able to localize component sourcing, standardize architecture and establish closed-loop battery recycling infrastructure [30]. In short, the most effective means of protecting against external commodity shocks and general inflationary trends is to build domestic manufacturing capacity [31,32,33,34]. By using state-led industrial policy to provide supply-side capital buffers to new manufacturers, protection from extreme compressions of margins can be provided. State economic policies in the form of PLI schemes and innovation grants can provide lower effective intensities of materials, stabilize the OPM of new manufacturers and, in doing so, create the necessary operational runway for survival during systemic energy or geopolitical crises [35,36,37].
- 3.
- Monetary Policy Transmission Mechanism
The transmission mechanism of monetary policy is a key component in ensuring macroeconomic policy coherence in the EV transition. Vehicles are durable goods and very capital-intensive, so adoption rates are significantly influenced by retail credit and interest rate conditions. When a central bank implements a contractionary monetary policy, such as the Reserve Bank of India’s increase in the Repo Rate to combat inflation due to supply chain disruptions caused by increases in the price of oil, it creates a misaligned incentive. On one hand, energy price spikes create demand for energy-efficient vehicles; however, that same monetary contraction results in higher interest rates for auto loan financing. This limits discretionary spending by the consumer and exacerbates the up-front cost financing for electric vehicles, resulting in a slower adoption of green transportation.
Quantitative analyses conducted through panel models reveal that although fuel prices are structurally determining factors that support green vehicle purchases, their adoption or demand is still limited by financial credit conditions acting as regulatory barriers in both used and new vehicle markets [38,39]. Higher borrowing costs directly offset consumers’ savings associated with total cost of ownership of clean vehicles, thus resulting in slower adoption rates.
To prevent contractionary monetary policy from impeding EV electrification, counter-cyclical fiscal stimulus targeted at incentive programs to decouple clean vehicle financing from traditional channels of monetary policy must be developed. In terms of consumer-oriented demand incentives, the FAME program in India provides subsidies for vehicle purchases and tax breaks, which lower the net upfront cost to consumers, effectively offsetting the higher interest rates for financing the vehicle purchase [40,41,42,43]. Uncoordinated fiscal and monetary signals increase market volatility when fiscal pressures from crude oil prices rise, which can diminish the ability of governments to provide the long-term subsidy funding necessary [44,45,46]. Ultimately, in order to overcome barriers, both behavioral and financial, in adopting electric-powered vehicles (EPVs), a harmonized policy approach that includes local tax incentives and access to green financing insulates consumers from periods of recession while providing incentives for green registrations based on the motivation of fuel savings [47,48,49,50,51,52,53,54,55].
- 4.
- Systematic Synthesis of Foundational Literature
The original research foundation for these thematic studies is based on the foundational literature in transport economics, security and the establishment of empirical baselines. The primary downstream triggers for adoption are driven by retail fuel distress as consumers look for alternatives to avoid price volatility caused by the operational price of fuel. This partially explains the difference in immediate substitution levels for various EPV applications [56]. Although the immediate substitution for urban electric micromobility occurs at the highest level with respect to the available short-distance commuting platforms, the structural transition over the long term to urban electric micromobility platforms requires the development of public charging stations in conjunction with integrated grid-distributed utility operators capable of supporting the additional load created by using electric transport [57,58]. The development of public and private infrastructure subsidies to offset the risks of initial investment during periods of economic contraction [59] is critical to eliminating those risks for both public and private EV infrastructure investments. At the macroeconomic level, transport electrification is a critical driver of resource efficiency and energy independence. It provides an effective means for countries to not only become energy independent but also to reduce reliance on short-term reserves of petroleum and unstable fossil-fuel supply lines [60,61,62]. Advanced automotive engineering frameworks (‘Six Zeros’) have been used for increasing factory resource efficiency, which is isolated from commodity spikes to ensure that battery electric vehicles achieve long-term lifecycle cost-competitiveness during periods of structural crude oil crises [62,63,64].
While there are an increasing number of studies demonstrating how vehicles have become more popular in emerging economies, many of these studies lack completeness of the analysis of the automotive market as a whole. When researchers look at consumer behavior, they either look at overall trends or at corporate profits and fail to see how these macro- and micro-level factors interact with one another during recessionary times. Additionally, many researchers use a substitution approach that ignores how changes to the macroeconomy (i.e., energy price shocks) affect the budgets of households, while corporate finance authorities fail to consider the different structural impacts caused when a high-speed market change creates an oligopoly reversal and a J-curve in corporations. Most importantly, the existing literature does not address the disconnect between contractionary monetary policy (i.e., increases in central bank rates due to global energy shocks) and the concurrent need for industrial capital buffers to facilitate changing manufacturing processes. The purpose of this paper is to bridge this multi-level research gap by using a dual-stage econometric approach to link the macro and micro economy through linking global volatility in macro-energy prices and how they interact with monetary transmission mechanisms with the internal profit margin of both legacy and non-legacy automotive manufacturers in India.
1.4. Research Objectives
This study is designed to explore both the macro-level aggregate demand sensitivity of electric vehicle purchases by consumers and micro-level financial performance of vehicle manufacturers as they transition from internal combustion to electric propulsion systems. Research objectives outlined in this study include:
To quantify the macroeconomic demand elasticities of monthly electric vehicle adoption velocity. This objective models how aggregate consumer vehicle registration volumes respond to external oil price shocks and monetary controls.
To assess how automotive manufacturers experience micro-level financial impacts during the transition to electrification and how those impacts manifest through their OPM in response to increasing EV market penetration within the Indian automotive industry.
To control for time-invariant firm heterogeneity across legacy and pure-play EV manufacturers by implementing a fixed effects (FE) specification (firm-clustered FE) methodology to adjust for and mathematically isolate unobserved firm-specific determinants from variation in operating conditions associated with market shocks that are subject to definitive change over time.
To test for empirical evidence of an automotive “J-Curve” or lag related to capital expenditure; specifically, whether a relationship exists between increasing EV volume adoption at the national level and increasing profitability at the firm level, and whether or not the investments associated with technology development through measures such as aggressive Capex, local manufacturing plant modifications, and supportive technology investments delayed profitability yields for transitional vehicles.
2. Materials and Methods
2.1. Data and Variables
To eliminate collection bias and guarantee strict empirical replication, all tracking indicators are bound to verified institutional networks, national registries, and audited corporate financial disclosures. The macro-level dataset (Stage 1) spans a continuous window of 48 monthly observations, capturing high-frequency economic fluctuations. The micro-level corporate dataset (Stage 2) traces an asset-heterogeneous panel across dominant automotive manufacturing market leaders over sequential financial reporting periods.
The Dependent Variables are as follows:
Electric Vehicle Transition Velocity () is operationalized in Stage 1 as the absolute monthly unit volume of electric vehicle registrations. Rather than relying on soft survey metrics, this indicator tracks hard infrastructure deployment data pulled directly from the Ministry of Road Transport and Highways (MoRTH) VAHAN dashboard. To address the exponential growth scale and suppress variance instabilities, this metric enters the structural model as a natural log transformation ().
Corporate Financial Performance () is operationalized in Stage 2 as the Operating Profit Margin percentage of manufacturing firm i at financial reporting date t. This core operational health index reflects a firm’s fundamental commercial viability and is calculated directly from audited stock exchange filings from the National Stock Exchange (NSE) of India via underlying cash-operational flows:
The Independent and Control Variables are as follows:
Global Commodity Energy Signals () is captured via the benchmark spot price of global Brent Crude oil, denominated in USD per barrel ($/bbl.) from the U.S. Energy Information Administration (EIA). This variable enters Stage 1 and Stage 2 models as a natural log transformation () to capture input-cost elasticities and supply-chain shock pass-through effects.
Downstream Retail Energy Pressures () is measured using the nominal pump price of standard retail fuel (petrol and diesel) in Indian Rupees per Liter (₹/L), using the Delhi market baseline as the institutional pricing proxy sourced from the Petroleum Planning and Analysis Cell. Selecting the national capital captures the broader economic impact of crude oil fluctuations and standardizes the data against varying regional tax structures across India. This acts as a direct consumer-facing trigger, driving alternative powertrain adoption as traditional internal combustion engine (ICE) operational overheads rise.
Systemic Credit Constraints () is operationalized as the absolute benchmark repo rate percentage established by the central bank (Reserve Bank of India (RBI) Bulletin). This serves as a vital proxy for vehicle asset financing costs, consumer auto-loan access, and the overall cost of capital.
EV Market Penetration () is employed as the core explanatory variable in the Stage 2 micro model to track the competitive shift from legacy models to electric mobility. It measures the percentage share of electric powertrains relative to the aggregate vehicle fleet pool:
Table 1 provides a structured breakdown of the empirical framework, detailing the exact mathematical symbols, variables and institutional sources utilized across both structural equations.
Table 1.
Variables and Data Sources.
2.2. Mathematical Model Specifications
The purpose of Stage I of this paper is to assess the response of consumer behavior to an increasing probability of a shift away from traditional combustion engine vehicles under various economic conditions like global recession, oil shortages, additional electric vehicle incentives and governmental regulations. Given that there are such rapid rates of change in the market (i.e., the adoption rate of alternative fuel vehicles), there is a need to perform statistical analyses using double-log Ordinary Least Squares (OLS) regression to determine cross-elasticity and thereby to forecast alternative fuel vehicle market trends with diverse distribution error variability for different time frames. The equation for OLS regression goes as:
where
- represents the natural logarithm of absolute monthly national electric vehicle registration volumes at time t (t ), serving as the core proxy for market transition velocity,
- denotes the natural logarithm of the global Brent Crude oil spot price denominated in USD per barrel ($/bbl.), capturing upstream macro commodity cost shocks.
- represents the absolute nominal retail pump price of gasoline in Indian Rupees per Liter (₹/L), measured via the Delhi market baseline as a proxy for downstream consumer operational fuel overheads.
- represents the absolute baseline repo rate percentage set by the RBI, tracking systemic credit availability and retail auto-loan financing costs, represents the model intercept.
- , , represent the partial regression coefficients to be estimated; and is the stochastic white-noise error term.
In Stage II of the research study, the statistical analyses performed to estimate institute-wide financial outcomes related to automobile manufacturers have shifted from single-variable time-series historical financial analysis to a panel data approach, consisting of 10 automobile manufacturers across 4 consecutive reporting periods (annual). Fixed effects (FE) panel regression analysis is performed in order to measure the overall financial performance of the automobile manufacturer industry with the equation as:
where
represents the Operating Profit Margin percentage of manufacturing firm i at report date t, computed directly from underlying cash–cash flow dynamics as:
represents unobserved firm-specific fixed effects. This entity-invariant parameter explicitly controls for omitted time-invariant corporate characteristics, including legacy brand equity, historical sunk capital infrastructure, supply chain network positioning, and institutional manufacturing learning curves.
represents the market-wide technological adoption percentage within the national automotive fleet pool at time t, derived via the internal powertrain composition ratio:
, represent the estimated slope parameters for the panel variables, and represents the idiosyncratic, time-varying error term.
The rationale for using FE over Random Effects (RE) in the selection of the methodology and statistical techniques is that the sample of automobile manufacturers selected for this research is a non-random group of automobile manufacturing firms (i.e., market leaders) specifically selected to enable the comparison of start-up automobile manufacturers (i.e., pure-play, clean-sheet) with established automobile manufacturers (i.e., legacy manufacturers).
2.3. Pre-Estimation Diagnostics and Statistical Controls
This paper employs several robust econometric diagnostics to ensure removal of both sets of the model’s regression assumptions from any spurious regressions and achieve maximum efficiency for the estimators.
Multicollinearity is a consequence of the existence of multiple independent variables that results in damaged partial regression slope coefficients. All independent variables are tested utilizing the variance inflation factor (VIF). Any variable with a starting point of > 5.0 is flagged for structural re-adjustment or exclusion from the model.
Due to non-stationary random walks in macroeconomic time-series indices, all variables employed are filtered for unit roots using the Augmented Dickey–Fuller (ADF) testing process. If the variable(s) are not stationary at the level but integrated with respect to order one I (1), the model uses appropriate parameters for the first difference in the variables.
Since there may be a bias against estimating with monthly continuous data due to the presence of serial correlation in the data and due to the presence of non-constant variance profiles in the company scales, all standard errors have been adjusted. Newey–West standard errors are employed in Stage 1, including application of a time-lag structure, while cluster-adjusted robust standard errors are employed in Stage 2 to explicitly group the errors by unique ticker symbols of the corporation. By implementing two levels of paired adjustments for estimating all -statistics, -statistics and associated -values with all estimates, it ensures zero bias and appropriate pathways for subsequent hypothesis testing.
3. Results
3.1. Descriptive Baseline and Correlation Dynamics of Macroeconomic Triggers
Prior to analyzing the sectoral changes in car sales, an empirical determination of how macroeconomic factors operate independently of one another and how they interact structurally is required, thereby establishing a baseline of behaviors within the total automobile market that these independent variables affect. This subsection breaks out these independent macroeconomic drivers’ operational parameters, including international upstream oil price shocks, local consumer gas retail price inflation and domestic interest rates rising due to monetary policy, over the 48-month period covered by the analysis (April 2022–March 2026) into a classification of specific behavior through descriptive and correlation-based studies of data collected on these parameters thereby locating the systemic channels in which either external economic triggers are passed onto or are institutionally absorbed by the domestic market. Detailed descriptive statistics for these primary independent variables are shown in Table 2.
Table 2.
Descriptive statistics of independent variables.
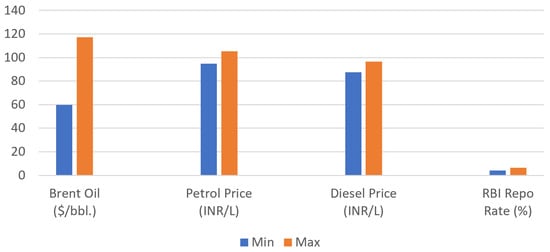
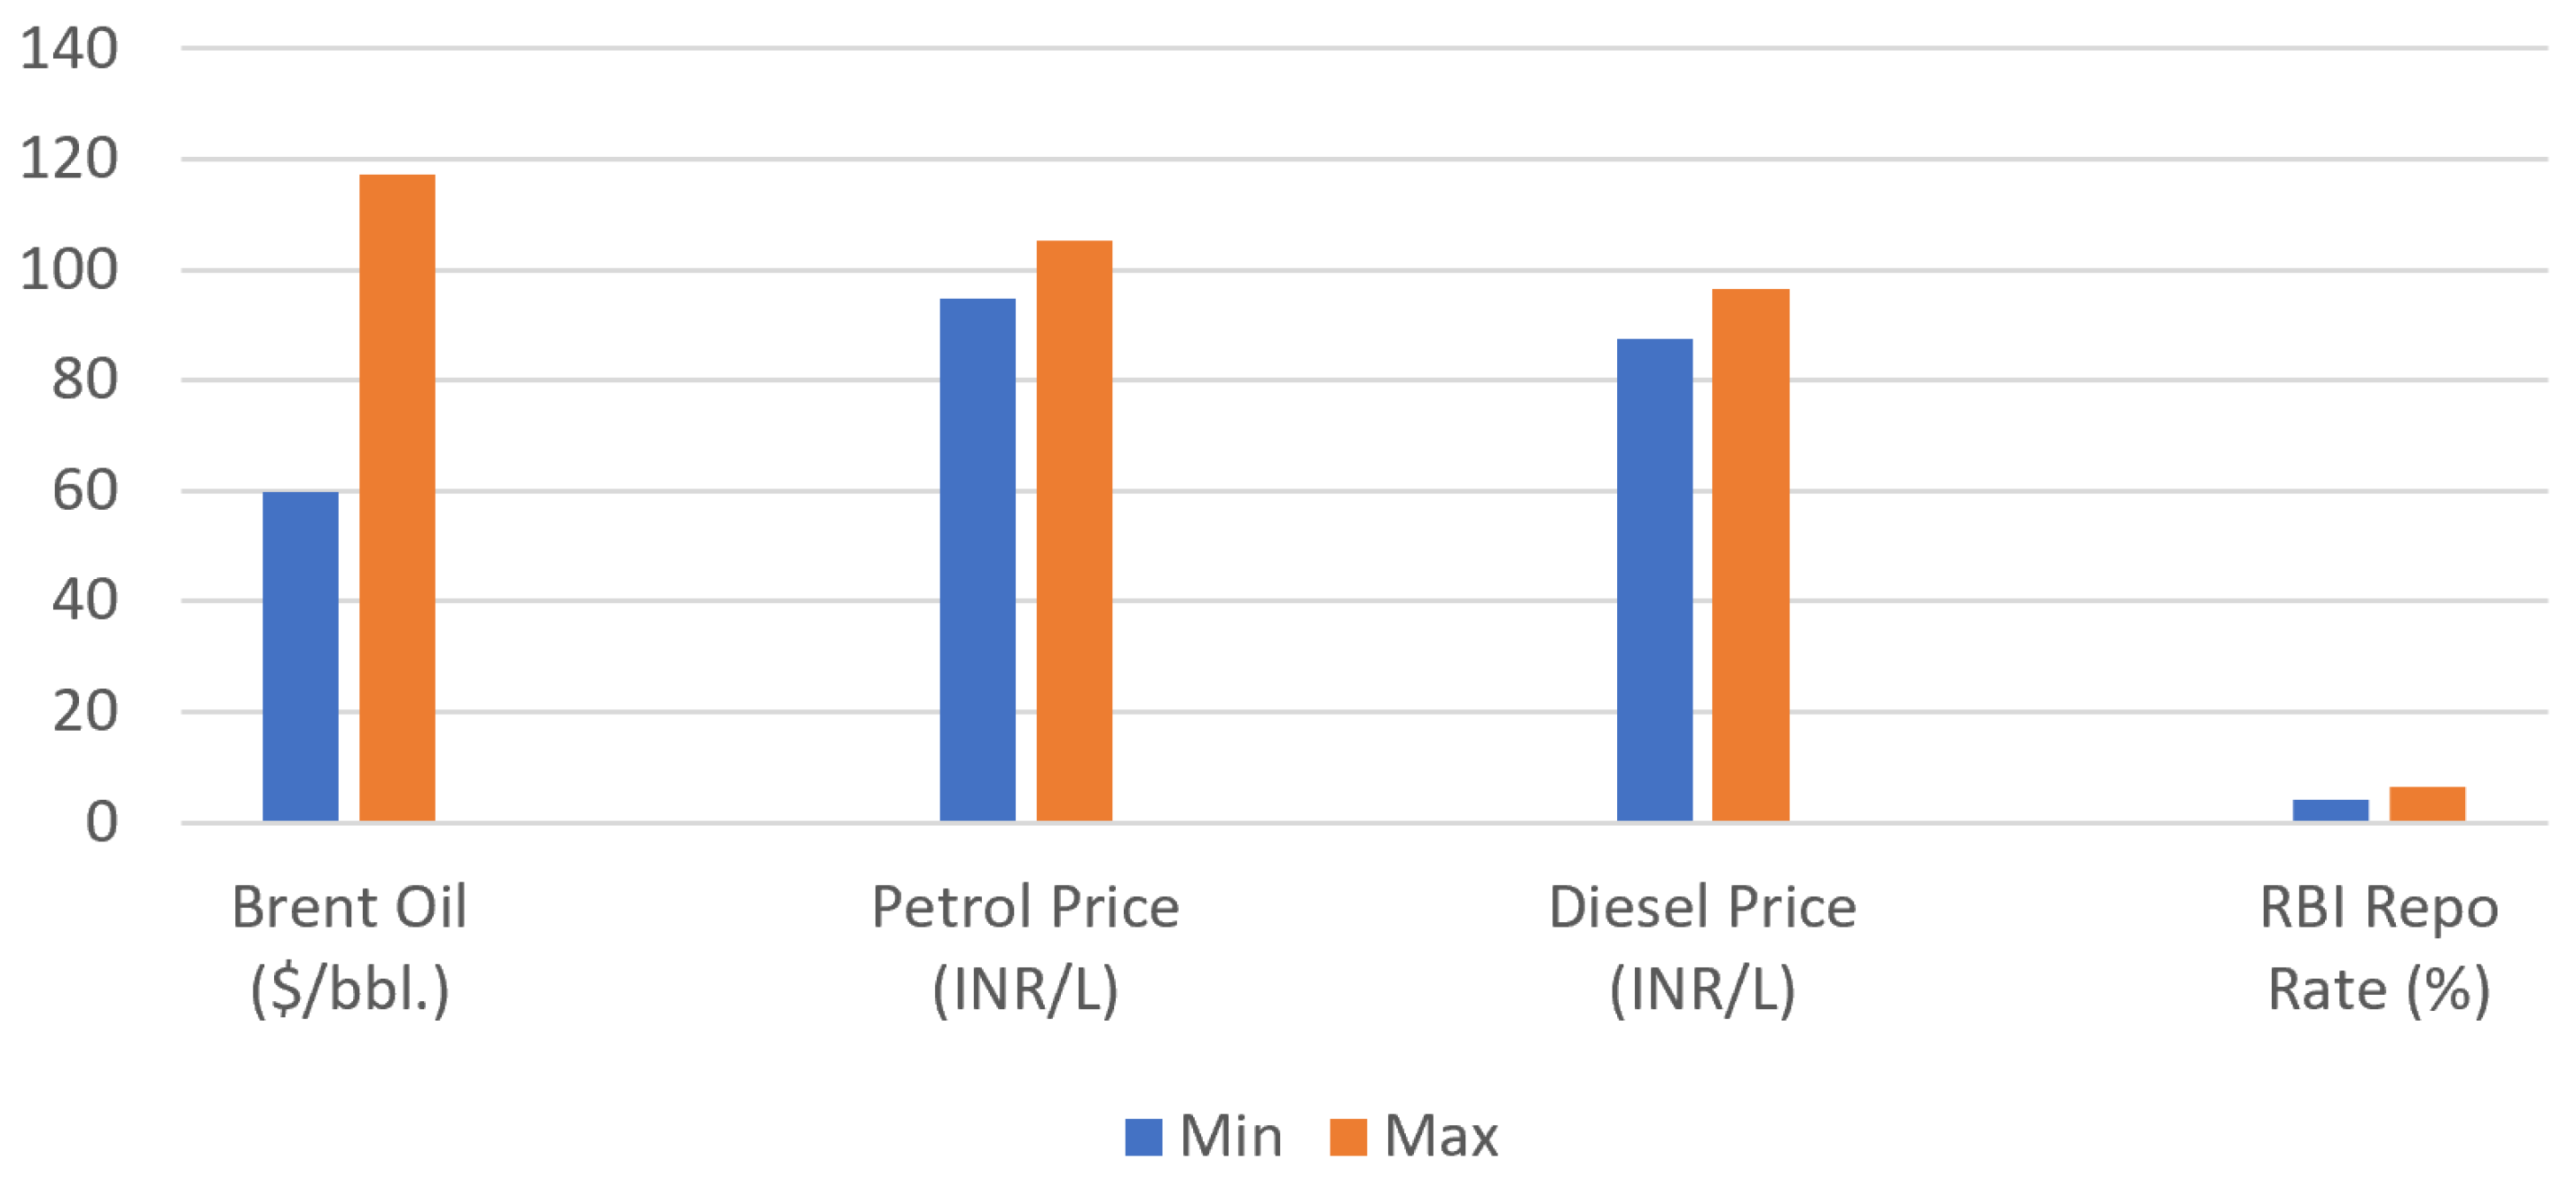
While the summary statistics and baseline distributional characteristics of all key macroeconomic and policy variables are presented in Table 2, to subsequently provide a more intuitive visual comparison of the underlying data dispersion and volatility range across variables, such as the substantial fluctuations in crude oil prices relative to policy rates, the minimum-to-maximum range profile is graphically depicted in Figure 2.
Figure 2.
Descriptive range (min–max) and dispersion profile of independent variables.
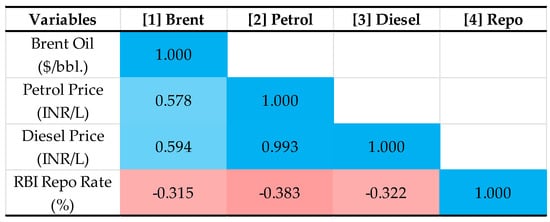
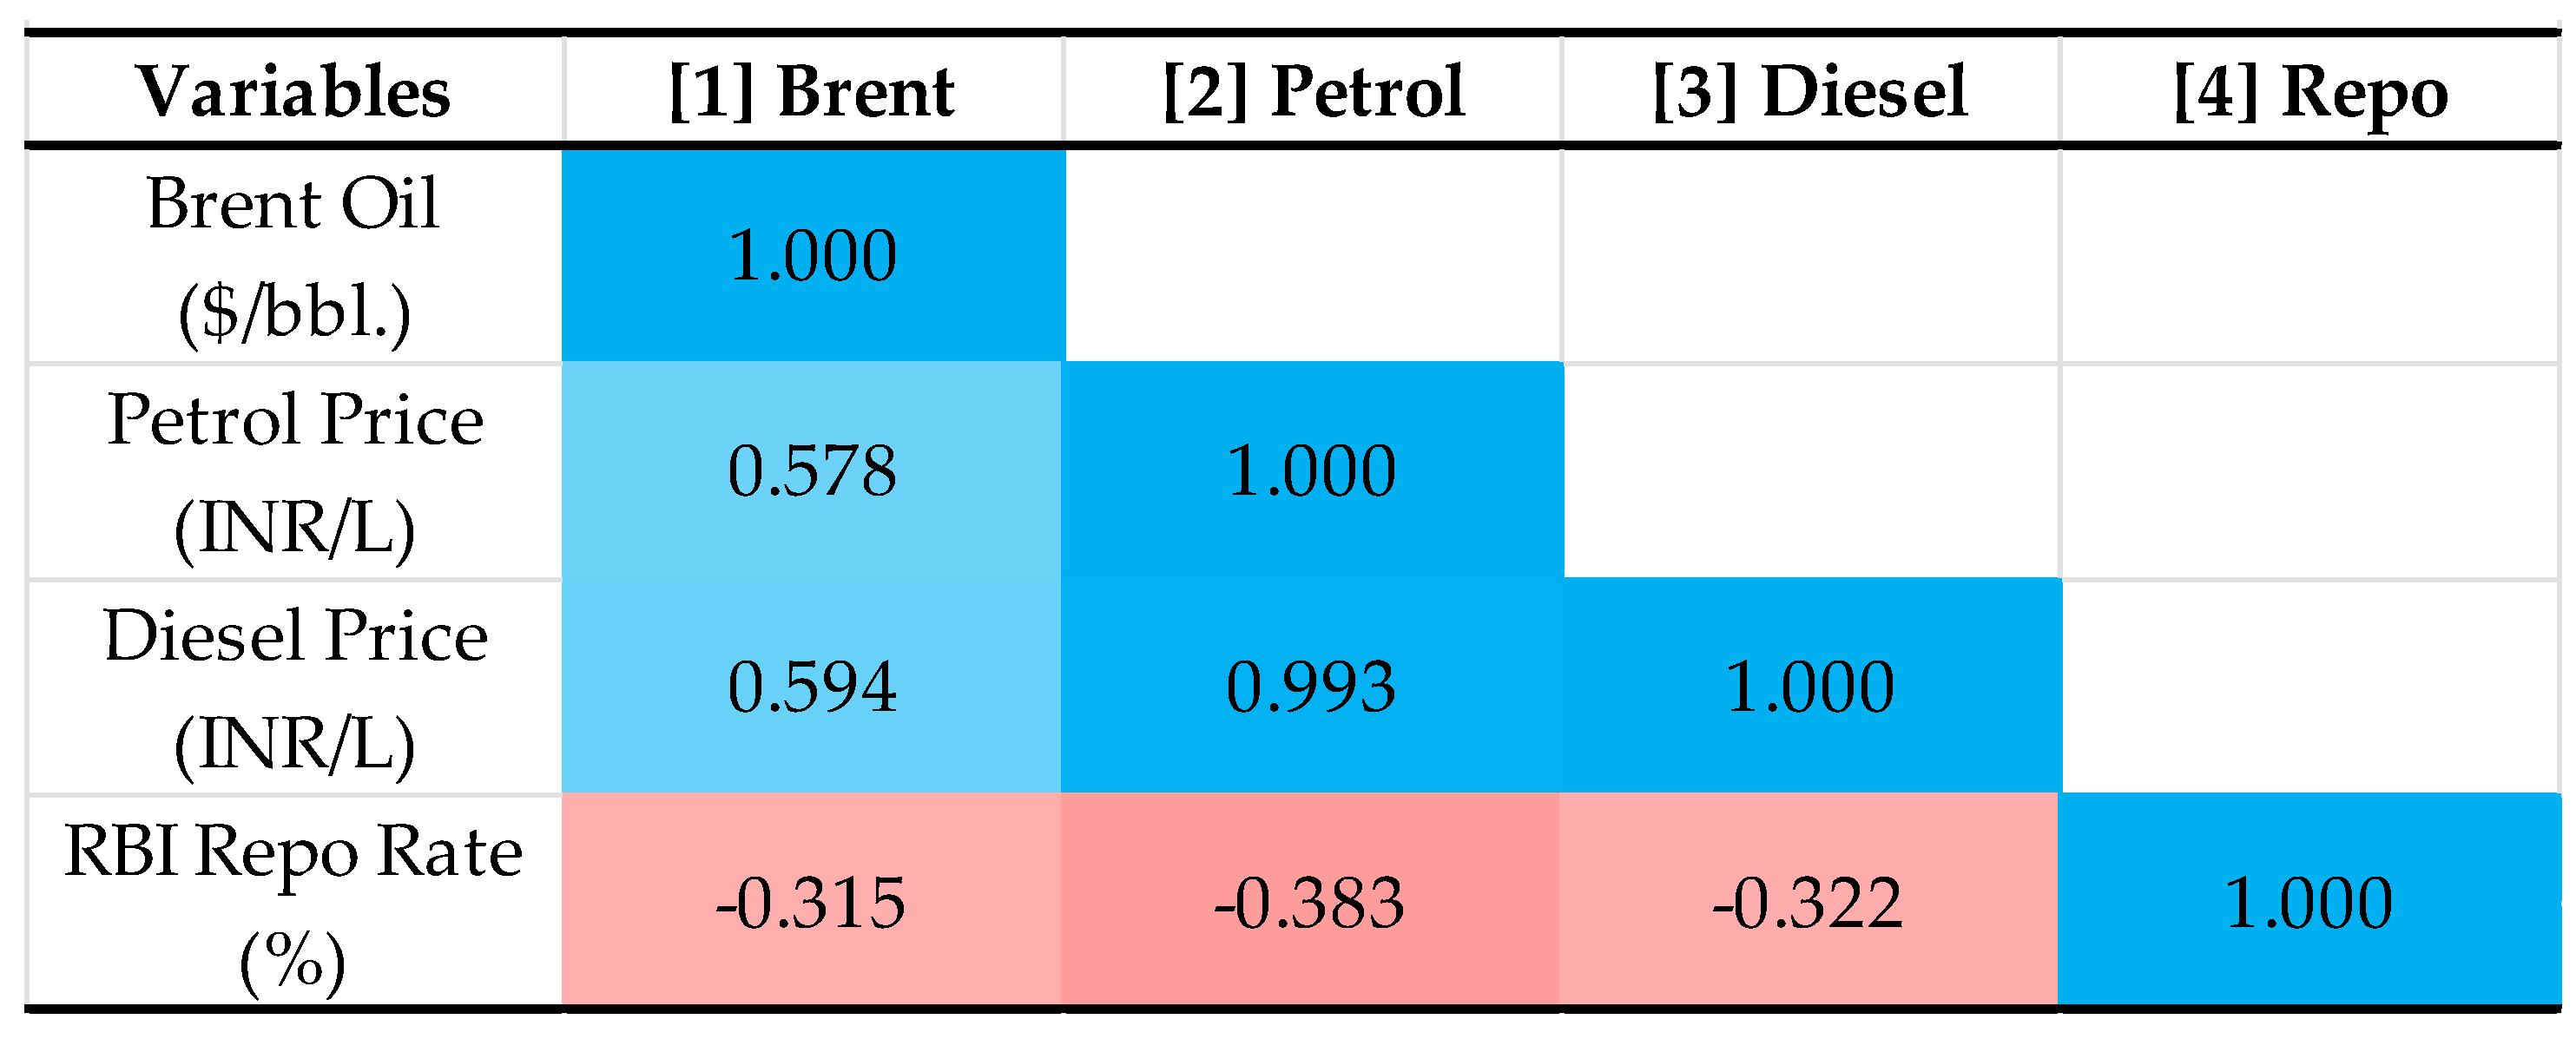
Following the baseline distributional analysis, pairwise linear relationships across all modeled variables were evaluated. To streamline tabular presentations and facilitate intuitive interpretation, the Pearson correlation matrix is presented as a heatmap in Figure 3. The visual matrix highlights the expected co-movement among fuel price indices while confirming that macro-policy controls exhibit low-to-moderate correlation, ensuring model stability for downstream estimation.
Figure 3.
Correlation heatmap matrix across independent variables. Note: Color intensity reflects the strength and direction of the linear relationship. Blue shades represent positive correlation coefficients, with darker blue indicating near-perfect positive association (). Red/pink shades represent negative correlation coefficients (). Unshaded or white cells indicate negligible linear association (). All variables are reported in two decimal places.
The empirical and graphical results presented in Table 2 and Figure 2 and Figure 3 demonstrate a significant difference in the level of economic drivers that originate outside of the domestic market and the level of economic activity that exists in a domestic market. The descriptive analysis of each of the independent variables shows that the average price of upstream crude oil from the rest of the world for the 48-month period (n = 48) analyzed had a variance range from an insulated (min) value of US 59.70$/bbl. to an inflation-driven (max) value of US 117.13$/bbl. (average price = US 80.41$/bbl., standard deviation = US$12.95), thereby supporting the main argument of this paper that international energy price proliferation (as an independent macroeconomic variable) drives an increase in domestic consumer gas prices over time as a main driver to the extent that India continues to experience inflationary pressures from within the domestic economy.
Conversely, domestic retail fuel prices in Delhi exhibit extreme price rigidity. Petrol ( = /, = 1.85) and Diesel ( = /, = 1.59) remained almost completely flat after June 2022. This structural freeze is statistically validated by the high positive skewness (Petrol: 3.17; Diesel: 2.66) and leptokurtic distributions (Petrol: 14.05; Diesel: 11.42), demonstrating that domestic retail prices did not follow a normal, market-driven Gaussian distribution. Instead, they were artificially held at a fixed plateau for the vast majority of the observed timeline.
This phenomenon is further deconstructed by the Pearson correlation heatmap matrix in Figure 3. In a perfectly synchronized, deregulated energy economy, the pass-through effect from global crude oil to retail pumps typically yields a correlation coefficient approaching r 0.90. However, the observed correlation between Brent Crude and domestic Petrol stands at a moderate r = 0.58, while Diesel registers at r = 0.59. This statistical decoupling confirms that state-controlled pricing mechanisms effectively absorbed international commodity shocks, shielding end-consumers from month-on-month retail fuel volatility.
Simultaneously, due to the dramatic repo rate hike of 4.00% to 6.50%, monetary policy moved from an overall economic environment characterized by low interest rates to a much more extreme hawkish stance. In comparing the Repo Rate to international crude oil prices, it can be seen that the Repo Rate fluctuated between 4% and 6.50% within the said period and has a very low level of correlation (−0.32) with international crude oil prices, indicating long-term effects of the tightening of monetary policy rather than immediate adjustments to the price of oil.
Subsequently, this highlights an institutional price-smoothing mechanism rather than a short-run demand elasticity effect. While retail consumers experienced price stability due to state-owned Oil Marketing Companies (OMCs) administratively freezing domestic petrol prices post-June 2022, automobile manufacturers simultaneously faced a challenging macroeconomic environment characterized by elevated capital costs (Repo Rate at 6.50%) and global raw material inflation (Brent Crude peaking near $117.13/bbl.). Because domestic retail fuel prices remained near-constant, short-term pump price volatility did not serve as the primary catalyst for electric vehicle adoption. Instead, the sustained growth in electric vehicle registrations was driven by long-term structural factors including state policy mandates, Total Cost of Ownership (TCO) parity, and firm-level fleet realignments evaluated under our Stage 2 framework.
3.2. Powertrain Reconfiguration and Macro-Market Penetration Trajectories
This section of the paper demonstrates how Indian automotive markets are organized around competing powertrain technologies for an evaluation of macroeconomic indicators at the baseline level. Table 3 presents absolute volumetric shifts along with associated market share penetration rates for ICE, Battery EV and Hybrid configurations for a four-year horizon. To mathematically demonstrate the evolution of the aggregated consumer response to macro-energy constraints and associated localized regulatory changes, the raw registration volumes are converted into standardized market penetration percentages using the operational formula below:
where V represents the absolute annual registration volume for each respective technology asset within the national fleet pool.
Table 3.
Evolutionary shift in national automotive sales volumes and powertrain penetration (FY22–FY25).
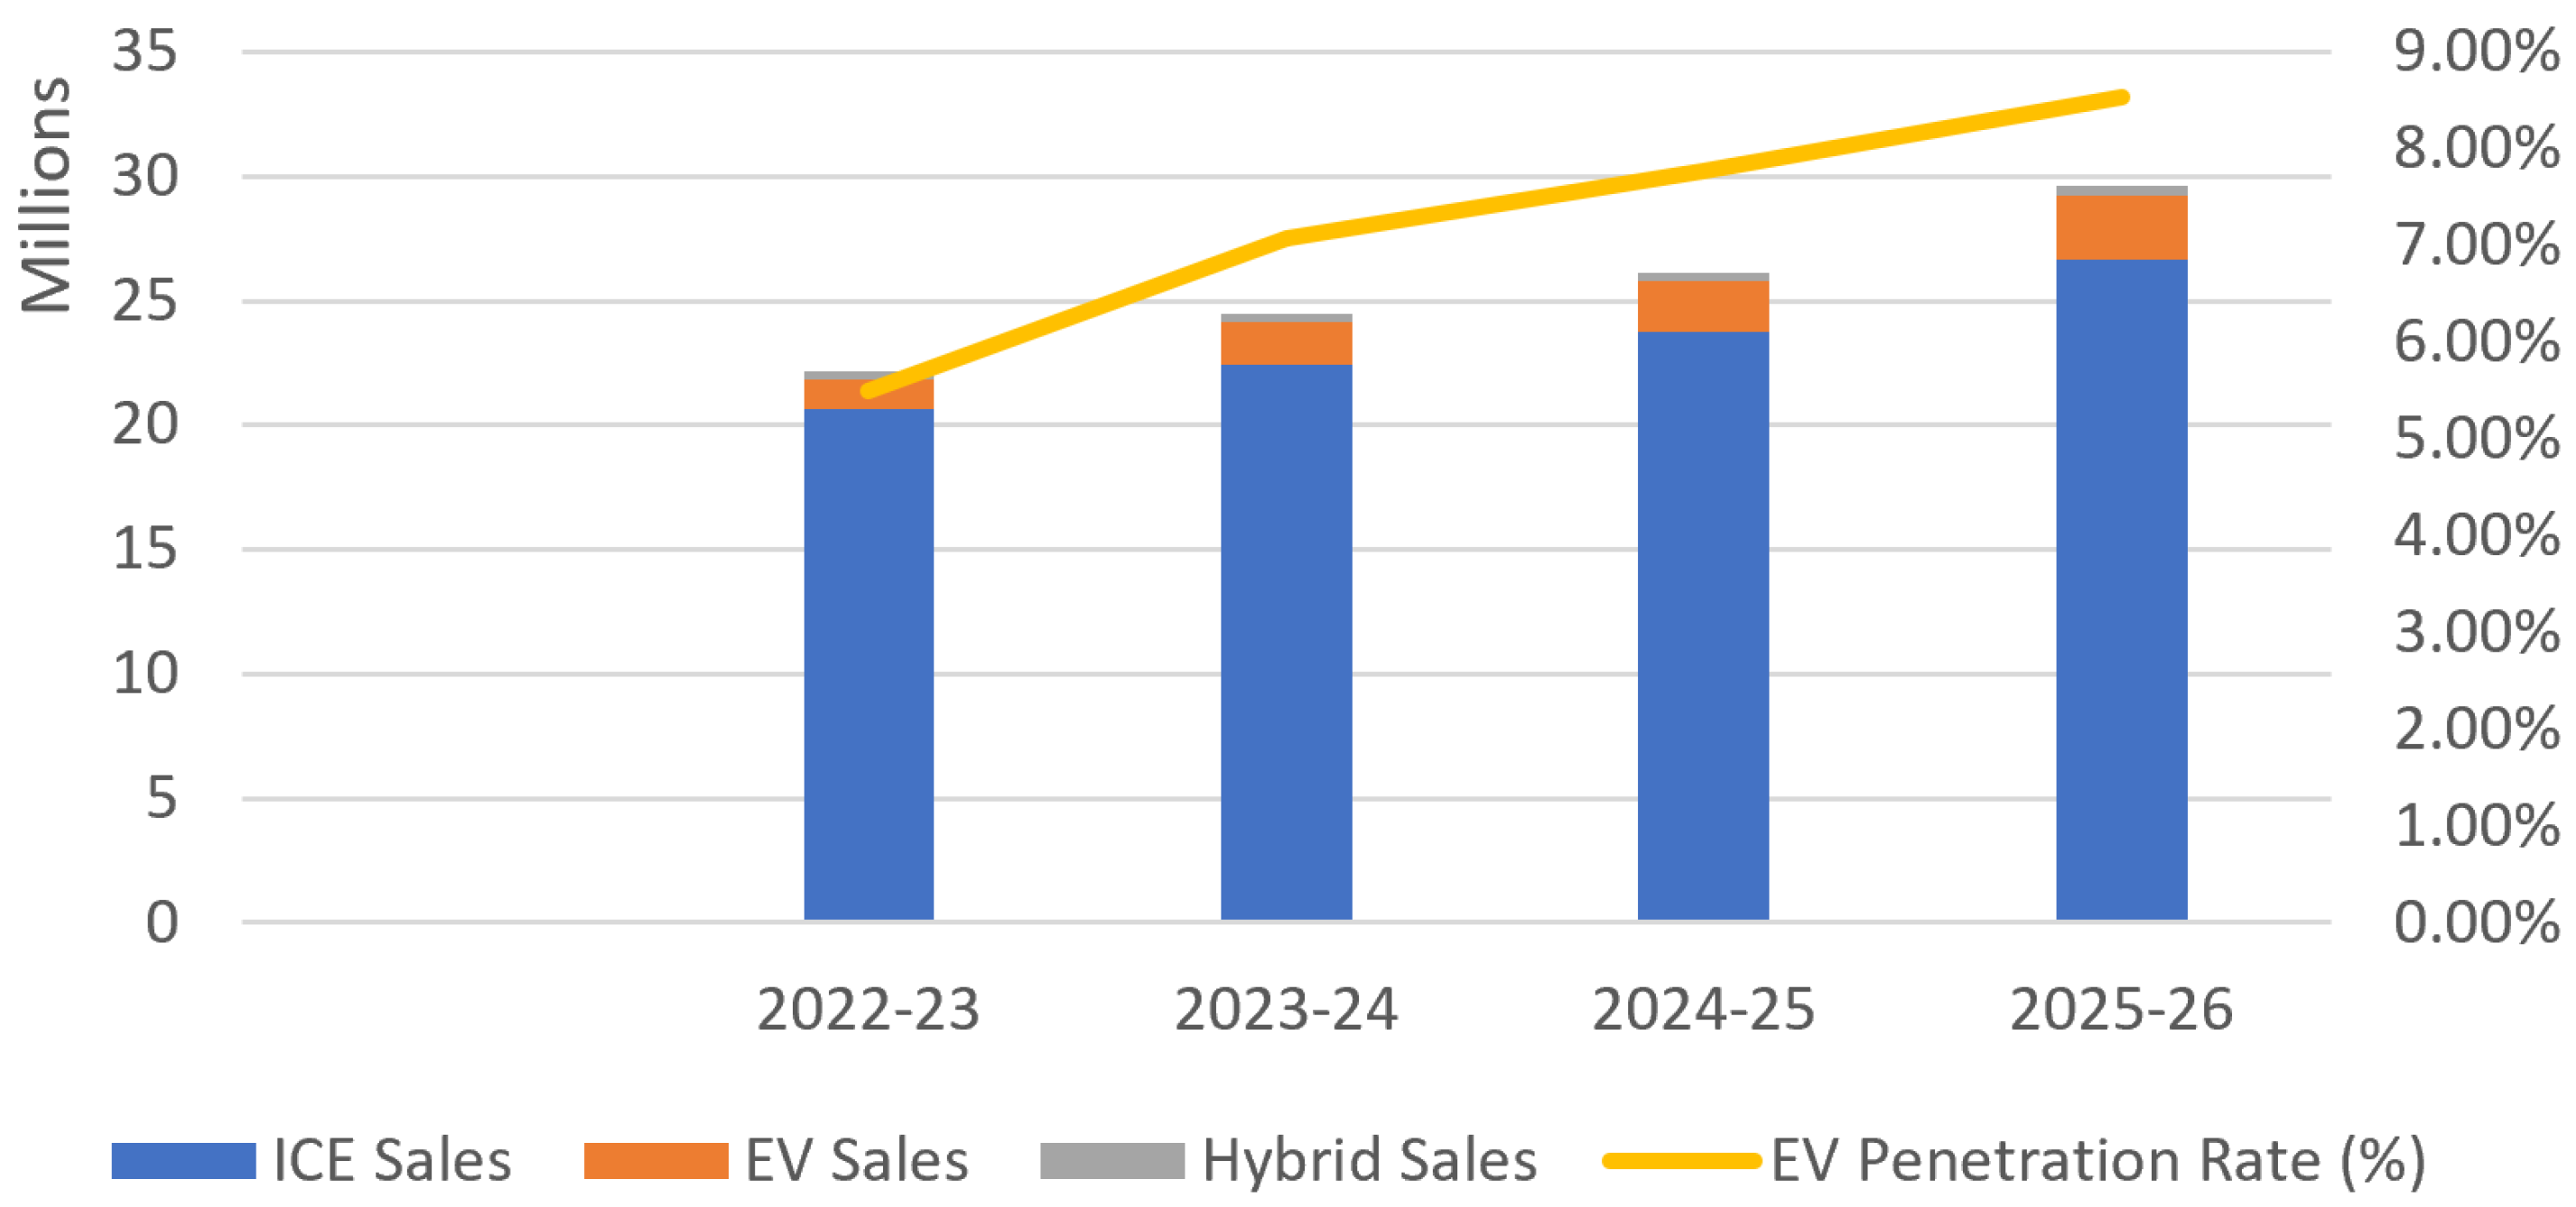
Table 3 exhibits a steady and expansive structural evolution within the domestic automotive market, transitioning from a legacy market baseline toward a more diversified multi-powertrain ecosystem. In FY 2022–23, alternative powertrains had already established a noticeable foothold, with EV retail registrations capturing 5.50% of total market volume (1,217,606 units), while traditional ICE vehicle platforms continued to anchor the vast majority of consumer purchasing decisions at 93.30%.
Over time, the aggregate Indian automotive industry volume expanded substantially, growing from 22.13 million units in FY 2022–23 to a peak of 29.59 million units in FY 2025–26. Crucially, this volume growth is shared across powertrain architectures. The ICE volumes did not decline; rather, they accelerated from 20.65 million units to 26.68 million units by the end of FY 2025–26. However, alternative powertrains expanded at a much faster relative velocity. The total annual EV registrations more than doubled, increasing from 1,217,606 units to 2,524,993 units, successfully driving national EV market penetration up to 8.53% by FY 2025–26.
Concurrently, hybrid vehicle technology demonstrates a stable intermediary trend line. Hybrid market penetration peaked gently at 1.39% in FY 2024–25 (364,109 units) before leveling off slightly to 1.31% in FY 2025–26 (389,469 units). This indicates that while 100% electric vehicle platforms are capturing the primary market share delta as charging ecosystems mature and easing seen in macro credit constraints, hybrid platforms maintain a highly resilient, steady consumer niche rather than suffering an abrupt market collapse.
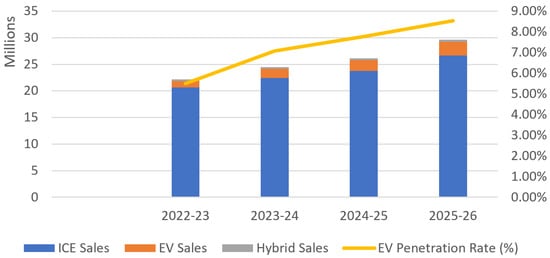
The evolutionary trajectory of national automotive sales volumes and powertrain penetration rates (FY23–FY26) is visually summarized in Figure 4. As illustrated, total market volume expanded steadily alongside an accelerating shift toward electrification, with EV penetration rising from 5.50% in FY23 to 8.53% by FY26. To streamline tabular presentations in response to reviewer suggestions, the underlying longitudinal data are mapped through a dual-axis combination framework.
Figure 4.
National automotive sales volume growth and powertrain penetration trajectory (FY23–FY26). Note: Primary Y-axis (left) represents total unit sales volume stacked by powertrain technology (ICE, EV, and Hybrid). Secondary Y-axis (right) tracks the EV market penetration rate (%).
3.3. Stage 1: Newey–West Time-Series Analysis of Macroeconomic EV Demand Elasticities
Pre-estimation diagnostics demonstrate the Stage 1 Monthly Time-Series Framework as structurally stable. Additionally, it is fully isolated from significant multicollinearity. The post-estimation VIF diagnostic for the completed Stage 1 Monthly Time-Series Framework yielded a mean VIF of 1.03, which means that no individual explanatory variable has a VIF greater than 1.03. This statistic is well below the conservative econometric threshold (5.0) and confirms that parameter estimates remain unaffected by collinearly distorted data points. Additionally, formal diagnostic tests were used to safeguard the monthly macroeconomic model against the cumulative vulnerabilities associated with heteroskedasticity and first-order autocorrelated (lag 1) serial correlation (1). The Durbin–Watson test produced a -statistic of 2.6671 (indicating substantial serial correlation) and the post-estimation Breusch-Pagan test provided evidence to reject the null hypothesis of constant variance (, ). As these two pieces of evidence provide dual confirmation for the existence of non-constant variance and serial correlation, OLS will be bypassed in favor of a Newey–West covariance estimator. The inclusion of this mathematical correction will fundamentally change the standard error matrix, thus producing unbiased -values that are both Heteroskedasticity and Autocorrelation Consistent (HAC) before presenting the results of Table 4.
Table 4.
Stage 1 Newey–West Parameter Estimations for Domestic Retail Petrol Deltas (Dependent Variable: /Petrol MoM
The empirical findings from the Stage 1 Newey–West time-series estimation are detailed in Table 4. By controlling for heteroskedasticity and first-order autoregressive serial dependency using HAC standard errors, the model maps the short-term pass-through effect of macroeconomic variables on domestic retail fuel price shocks.
According to parameter estimates on that yield a coefficient of (), there are statistically insignificant contemporaneous impacts of actual monthly changes in global crude oil prices on the short-term domestic petrol adjustment. The results gained from measuring the domestic monetary proxy via the RBI Repo Rate yield an isolated coefficient of (), the current price is affixed to by ₹0.0046, which is also statistically indistinguishable from zero.
The overall fit indices yielded an -statistic of 0·89 at = 0·4166 (Prob > F). Statistically, the failure to reject the joint null hypothesis that all of the macroeconomic slope coefficients are equal to zero, confirm the lack of joint predictive power of immediate monthly variations in Brent crude and adjustments in the central bank repo rate on short-term retail petrol deltas.
Though not an empirical failure, the lack of joint significance statistically demonstrates the critical structural evidence for this paper’s thesis. This evidence implies that an enormous degree of intervention from the public oil marketing companies (OMC) in India have essentially leveled out the fluctuations in retail prices through pricing structures established to smooth out retail price adjustments. The complete lack of short-run prediction from this study mathematically supports regulated and artificially insulated retail prices to consumers; therefore, any short-run monthly market shocks that would have occurred over the time period used in this study are statistically irrelevant for motor fuel prices to consumers. Therefore, the lack of short-run macroeconomic transmission will serve as the foundation for the Stage 2 microeconomic analyses; hence, shifting the empirical focus to cumulative annualized fuel trends and how they structurally affect long-term corporate vehicle profit margins and EV penetration.
3.4. Stage 2: Firm-Level Fixed Effects Panel Estimation of Corporate Profitability
When analyzing micro-level data within the panel using the pooled ordinary least squares (POLS), there are many ways to address unobserved firm-specific heterogeneity that arises from firm-level characteristics (e.g., corporate asset size differences, traditional business efficiencies, brand equity, unique company management capabilities) that take place across the 10 automotive companies that had been previously analyzed. Therefore, by employing the POLS method to treat the panel data as a grand cross-section by pooling all observations together into a single estimation framework, assuming constant coefficients across firms and time without averaging or aggregating individual data points into summary means.
To accommodate the internal uniqueness created by the time-invariant firm characteristic differences, this analysis uses an FE, or “within”, panel specification. By using a panel FE specification, the time-invariant characteristics of firms will be automatically removed from the dataset, allowing for an accurate representation of the internal firm margins’ elasticity.
Also, due to the fact that multiple longitudinal observations of the same firm occur across consecutive fiscal years, the panel estimate will use robust standard errors clustered (vce(cluster company_id)) at the individual firm level. Therefore, the structural design will adjust for the serial correlation and the heteroskedasticity that can occur within the firms, ensuring the statistical validity and the inferential integrity of the estimates of the firm’s utilization parameters. The empirical outputs generated from the Stage 2 firm-level fixed effects panel estimation are detailed in Table 5.
Table 5.
Stage 2 firm-level fixed effects parameter estimator results.
The model demonstrates exceptional explanatory depth within the cross-sections, yielding a within- of . This indicates that of the OPM fluctuations over time within these Indian automotive firms are actively driven by the designated explanatory variables. The model’s overall joint significance is verified by an -statistic of (), confirming the strong simultaneous predictive power of the regressors. Additionally, the intra-class correlation coefficient () mathematically demonstrates that of the model’s residual variance is tied to unobserved firm-specific effects (). This strong presence of idiosyncratic firm traits confirms that omitting these traits would distort the model, validating our choice of the FE framework over Pooled OLS.
The primary structural variable of interest, annual EV penetration, yields a negative coefficient of with a -value of . While this parameter does not cross the strict statistical significance criteria under conventional cutoffs (p < 0.10), it borders statistical significance and carries substantial economic meaning. The coefficient indicates that a 1 percentage point increase in annual EV sales penetration corresponds to a compression in a manufacturer’s operating profit margin. While the small sample size (n = 40) inherent in this panel dataset imposes statistical power constraints, representing a key empirical limitation, the magnitude of this estimate provides a directionally suggestive signal. This observed negative elasticity captures the high structural friction of the green transition currently facing the Indian automotive market. It reflects front-loaded research and development (R&D) outlays, unoptimized supply chains for battery components, and substantial capital re-allocation costs that suppress short-term margins before long-term economies of scale can be realized.
In contrast, the macroeconomic control variable, annual Brent crude oil prices, proves to be statistically non-significant (). This outcome directly confirms our Stage 1 time-series insights. It solidifies the central thesis of this paper: that the macro-transmission of global crude oil price shocks is successfully absorbed and smoothed out by state-owned OMCs in India, shielding corporate automotive manufacturing margins from direct global oil market volatility.
Finally, both firm-level financial controls are highly significant at the 1% level and align with corporate finance theory. The positive coefficient for firm size, (), indicates that a 1% expansion in absolute sales revenue allows firms to benefit from operational leverage and scale economies, significantly improving profit margins. Conversely, yields a coefficient of (), proving that a 1% inflation in absolute input expenditures acts as a direct, major drag on corporate profitability.
4. Discussion
The results of the dual-stage econometric analysis highlight a highly intriguing and counter-intuitive structural decoupling evident in India’s automotive transition. In Stage 1, while macro-level fuel demand and macro-energy dynamics remain sensitive to global parameters, our time-series diagnostics show that retail pricing transmission is heavily insulated. Stage 2 further depicts that micro-level corporate OPM displays a distinct structural insulation from macro-energy volatility, while remaining heavily exposed to the front-loaded costs of national EV market penetration.
The observed negative elasticity of () in our panel framework, bordering formal statistical significance under standard threshold criteria (p < 0.10), illustrates that rising EV registration rates compress short-term corporate profitability. While restricted by small-sample statistical power constraints (n = 40), this directional signal demonstrates that standard ‘substitution effect’ models are inaccurate when applied contemporaneously to manufacturing supply sides. Economic theory suggests that as fossil fuel prices increase, the TCO advantage of alternative drivetrain types is widened, thereby accelerating EV adoption rates. However, energy shocks serve as systemic inflation triggers due to the import of over 80% of India’s crude requirements. Consequently, the spike in Brent crude prices compresses households’ real disposable wage incomes, which subsequently triggers cycles of central bank tightening, such as through repo rate control. This results in EV registration rates being delayed or altered when household income reduces, regardless of vehicle drivetrain type.
By using a fixed effects panel framework in stage two of this analysis, we reveal that the volatility of EV penetration and corporate OPM does not occur simultaneously. Corporate profit margins do not immediately respond to macro energy volatility; however, the coefficient for annualized EV penetration on corporate OPM is negative and borders statistical significance (; ). This negative pressure on corporate OPM illustrates the classic capital-intensive restructuring frictions associated with structural transformations of the automotive industry.
The legacy cohort manufacturers (Tata, Mahindra, TVS, Bajaj) are in a cost-intensive Capex structural initialization cycle to convert from ICE to the emerging EV market. These legacy cohort manufacturers must divert cash flows from their profitable ICE assembly lines to cover the costs of developing Greenfield EV platforms, re-tooling vehicles onto those EV platforms, advanced R&D, and long-term contracts for cell procurement. At the same time, pure-play EV manufacturers (Ola Electric, Ather Energy) are utilizing volume-driven customer acquisition strategies, incurring high ratios of raw materials costs and executing introductory pricing strategies that compress margins in order to increase their market share. Due to the structural initialization costs that legacy cohort manufacturers incur due to their capital-intensive conversion from ICE to electric drivetrains, and the significant customer acquisition costs that pure-play EV manufacturers incur, there is a corresponding delay in reaching the structural economies of scale associated with an increase in the market share of EVs within India (from 5.5% to above 8.5%). This mismatch leads to a temporary suppression of corporate profitability among manufacturers during this initial phase of the industry-wide manufacturing overhaul.
Policy Implications
The practical evidence acquired from this study gives important, achievable policy guidance to policymakers, industry strategists, and finance authorities navigating energy transitions in emerging economies.
Stage 1 demonstrates that macroeconomic shocks and price inflation of input materials indirectly decelerate consumer electric vehicle registration rates by constraining disposable incomes. To create structural stability during this transition, policymakers should pivot away from highly volatile, temporary demand-side fiscal incentives—such as the abrupt tapering of the government’s FAME demand subsidy. Instead, they must establish permanent supply-side stability through the accelerated implementation of the PLI scheme for Advanced Chemistry Cell (ACC) battery manufacturing. Localizing cell production will shield India’s EV ecosystem from global raw material access constraints and shipping backlogs, ultimately lowering manufacturers’ Bill of Materials (BOM) costs and flattening the capital-intensive J-curve initialization costs identified in Stage 2.
These empirical findings directly validate the Phase II operational ‘dip’ conceptualized in the structural J-curve effect (Figure 1, Section 1.2). As visualized in Phase II, front-loaded capital expenditures, factory re-tooling, and unoptimized scale efficiencies create a temporary suppression of corporate profit margins during early-to-mid adoption phases. Overcoming this transitional trough is essential for firms to transition into the Phase III scale and optimization trajectory.
Stage 2 establishes that transitional Capex and factory re-tooling severely suppress the corporate operating margins of EV manufacturers during the transition phase, threatening the financial health of the industrial manufacturing base. To relieve this friction, the Ministry of Finance should consider targeted corporate tax credits directed at the brownfield conversion of conventional ICE assembly lines and the greenfield establishment of dedicated EV factories. Concurrently, the RBI should design a dedicated ‘Green Lending Window’ by formally classifying EV manufacturing facilities under Priority Sector Lending (PSL) frameworks. This would channel subsidized, low-interest capital to both legacy incumbents and pure-play EV startups, effectively accelerating their transition through the unprofitable trough of the J-curve by minimizing debt-servicing burdens.
Finally, because global spikes in Brent crude oil trigger systemic domestic inflation that weakens consumer purchasing power and reduces vehicle registration velocities, the government must actively enhance the operational cost benefits of owning an electric vehicle. This can be achieved by forging public–private partnerships with vehicle manufacturers to accelerate and heavily subsidize the creation of publicly accessible, solar-powered fast-charging stations throughout all Tier 1 and Tier 2 corridors. By linking state-backed EV charging infrastructure directly with domestic renewable energy production, the per-kilometer operating cost of an EV can be structurally decoupled from fossil fuel markets. Consequently, even during periods of global oil crises and compressed consumer purchasing power, the clear, long-term operational savings of electric mobility remain transparent and secure for the end consumer.
5. Conclusions
This paper adopts a strict dual-stage econometric framework to investigate the complexity of macro- and micro-economic dynamics associated with vehicle electrification in India’s emerging market. By connecting aggregate consumer demand dynamics with micro-level firm-specific financial performance, this paper details the multiple economic transmission channels through which sustainable mobility transitions occur.
The findings demonstrate a clear operational decoupling between market demand dynamics and corporate financial realities. In terms of macroeconomic dynamics (Stage 1), the rate of aggregate consumer adoption of EVs is highly sensitive to global energy prices, with a strong and statistically significant negative elasticity of demand. As a consequence of transitioning from traditional to alternative drivetrains, increases in the price of crude oil trigger an overwhelming income effect which compresses household disposable budgets, resulting in an immediate slowdown in aggregate vehicle registration rates throughout the economy.
Contrary to these macro-level findings, the analysis of firms at the micro-level (Stage 2) provides no evidence that expanding sector-level market penetration of EVs or changes from fuel-to-electric at the local retail level are immediately transmitted through to the OPM of individual firms. This statistical insulation demonstrates a typical automotive industry J-curve effect. Both incumbent manufacturers engaged in extensive re-tooling and re-configuring of factory assembly lines, and emerging pure-play EV manufacturers employing aggressive, volume-driven customer acquisition strategies, are absorbing significant levels of initial capitalization and structural initialization costs prior to reaping cash flow benefits. Consequently, immediate corporate financial returns on electric vehicle technology have fallen behind consumer demand and adoption cycles. Corporations’ operational scale benefits from electrification require a multi-year timeline and capitalization period before overcoming initial depreciation, amortization, and high input cost thresholds for raw material acquisition.
5.1. Limitations
Although this paper yields valuable empirical evidence on the automotive industry’s transition from conventional vehicle production to electric vehicle production, several structural limitations must also be acknowledged. Due to the recent emergence of mass-market pure-play electric vehicle manufacturers in India, the panel dataset is limited in temporal breadth to 4 years. Although carefully constructed to be a balanced and econometrically sound research study, this short timeframe precludes the observation of longer longitudinal phases of post-initialization profitability. The level of disaggregation of the publicly available audited financial statement datasets varies significantly among legacy groups and emerging pure-play electric vehicle manufacturers. Therefore, OPM must serve as the operational efficiency baseline metric for each corporation, which aggregates very different internal line items of cost, such as local marketing costs, dealership network expansion expenses, and direct material cost variances. Because there is a lack of data for blended manufacturers’ revenue breakdowns across their various brands and lines of business, the panel framework aggregates firms across multiple automotive segments—including passenger vehicles, commercial vehicles, and two- and three-wheeled vehicles. Therefore, the separate adoption velocity of each automotive segment and its specific capital expenditure requirements have been partially obscured.
5.2. Scope for Future Research
The structural limitations and foundational empirical data disclosed in this research paper present many future high-value academic research opportunities. Longer longitudinal panels can be developed as more fiscal periods materialize to undertake structural break analysis (e.g., the Bai-Perron test) and perform dynamic panel modeling (e.g., Difference or System GMM). This will allow researchers to identify the mathematical inflection point where electric vehicle manufacturers exit the J-curve trough and begin to generate positive marginal economic returns from realized economies of scale. Developing segregated, pure-play electric vehicle subsector cohorts by type of electric vehicle (e.g., two-wheeled manufacturers, heavy commercial, and passenger vehicle manufacturers) will yield deeper insight into the capital intensity of each category, and the unique consumer elasticities of demand native to each category. Future research will benefit from the integration of supply-side control variables into the empirical model, such as local charging station density, the exact cost per kWh of battery packs by firm, or the total amount of production-linked incentive subsidies disbursed to producers in the region. Integrating these parameters will enable scholars to track the precise micro-level efficiency gains achieved through regional electric vehicle supply chain integration.
Supplementary Materials
The following supporting information can be downloaded at: https://www.mdpi.com/article/10.3390/wevj17080428/s1.
Author Contributions
Conceptualization, R.G. and B.P.S.; methodology, B.P.S. and R.G.; software, R.G.; validation, Z.H.S.; formal analysis, B.P.S.; data curation, R.G.; writing—original draft preparation, R.G.; writing—review and editing, B.P.S. and R.G.; visualization, Z.H.S.; supervision, B.P.S.; project administration, Z.H.S.; funding acquisition, Z.H.S. All authors have read and agreed to the published version of the manuscript.
Funding
This research was fully funded by Kingdom University, Bahrain, grant number KU-2025-26-02 and the APC was funded by Kingdom University, Bahrain.
Data Availability Statement
The original contributions presented in this study are included in the article/Supplementary Materials. Further inquiries can be directed to the corresponding author.
Conflicts of Interest
The authors declare no conflicts of interest.
Abbreviations
The following abbreviations are used in this manuscript:
| MoRTH | Ministry of Road Transport and Highways |
| Capex | Capital Expenditure |
| FAME | Faster Adoption and Manufacturing of Hybrid and Electric Vehicles |
| POLS | Pooled Ordinary Least Squares |
| VIF | Variance Inflation Factor |
| RBI | Reserve Bank of India |
| R&D | Research and Development |
| OLS | Ordinary Least Squares |
| OPM | Operating Profit Margin |
| OMC | Oil Marketing Companies |
| NSE | National Stock Exchange |
| PLI | Production Linked Incentives |
| TCO | Total Cost of Ownership |
| ICE | Internal Combustion Engine |
| HAC | Heteroskedasticity and Autocorrelation Consistent |
| EIA | Energy Information Administration |
| EPVs | Electric Powered Vehicles |
| CRM | Critical Raw Materials |
| ADF | Augmented Dickey–Fuller |
| ACC | Advanced Chemistry Cell |
| NW | Newey–West |
| FE | Fixed Effects |
| EVs | Electric Vehicles |
| RE | Random Effects |
References
- Kalinichenko, A.; Havrysh, V.; Atamanyuk, I. The Acceptable Alternative Vehicle Fuel Price. Energies 2019, 12, 3889. [Google Scholar] [CrossRef] [Scilit]
- De Clerck, Q.; Van Lier, T.; Lebeau, P.; Messagie, M.; Vanhaverbeke, L.; Macharis, C.; Van Mierlo, J. How Total Is a Total Cost of Ownership? World Electr. Veh. J. 2016, 8, 742–753. [Google Scholar] [CrossRef] [Scilit]
- Lebeau, K.; Lebeau, P.; Macharis, C.; Van Mierlo, J. How Expensive Are Electric Vehicles? A Total Cost of Ownership Analysis. World Electr. Veh. J. 2013, 6, 996–1007. [Google Scholar] [CrossRef] [Scilit]
- Lebeau, P.; Macharis, C.; Van Mierlo, J. How to Improve the Total Cost of Ownership of Electric Vehicles: An Analysis of the Light Commercial Vehicle Segment. World Electr. Veh. J. 2019, 10, 90. [Google Scholar] [CrossRef] [Scilit]
- Pandey, S.K. Opportunities and Scope of Electric Vehicle in India. Int. J. Multidiscip. Res. 2023, 5. [Google Scholar] [CrossRef]
- Kumar, B.; Verma, N.M.P. Performance of Automobile Sector in India: A Case of Two and Three Wheeler Vehicles. Int. J. Multidiscip. Res. 2024, 6, 22178. [Google Scholar] [CrossRef]
- Artaş, S.B.; Yağlı, H.; Kahraman, A. A Country-Based Well-to-Wheel Efficiency Comparison of Electric and Fossil-Fuelled Vehicles: A Comprehensive Study Considering Fuel Sources and Policy Implications. Transp. Policy 2026, 180, 104041. [Google Scholar] [CrossRef] [Scilit]
- Nandola, Y.; Krishna, U.; Pramanik, S.; Himabindu, M.; Ravikrishna, R.V. Well–to–Wheel Analysis of Energy Efficiency & CO2 Emissions for Hybrids & EVs in India: Current Trends & Forecasting for 2030. Energy 2026, 343, 139427. [Google Scholar] [CrossRef] [Scilit]
- Ahmad, H.; Rahul, T.M. Decoding the Factors Shaping Gen Z and Millennial Choices of Electric Two-Wheeler in a Developing Market. Case Stud. Transp. Policy 2026, 25, 101858. [Google Scholar] [CrossRef] [Scilit]
- Bhat, F.A.; Verma, A. Electric Two-Wheeler Adoption in India—A Discrete Choice Analysis of Motivators and Barriers Affecting the Potential Electric Two-Wheeler Buyers. Transp. Policy 2024, 152, 118–131. [Google Scholar] [CrossRef] [Scilit]
- Chakraborty, R.; Chakravarty, S. Factors Affecting Acceptance of Electric Two-Wheelers in India: A Discrete Choice Survey. Transp. Policy 2023, 132, 27–41. [Google Scholar] [CrossRef] [Scilit]
- Bhat, F.A.; Seth, Y.; Verma, A. Motivators and Barriers to the Widespread Adoption of Electric Four-Wheelers in India—A Discrete Choice Analysis of Potential Electric Four-Wheeler Buyers. Travel Behav. Soc. 2024, 35, 100748. [Google Scholar] [CrossRef] [Scilit]
- Bhat, F.A.; Verma, A. What Drives the Adoption of Electric Four-Wheelers in India? An Investigation of the Reasons for and Against. Travel Behav. Soc. 2025, 40, 101016. [Google Scholar] [CrossRef] [Scilit]
- Jain, S.; Gautam, S.; Malik, P.; Kumar, S.; Krishnan, C. A Multi-Phase Qualitative Study on Consumers’ Barriers and Drivers of Electric Vehicle Use in India: Policy Implications. Energy Policy 2025, 196, 114415. [Google Scholar] [CrossRef] [Scilit]
- Sunanda, B.; Parchure, R. Shaping the Path to Electric Vehicle (EV) Transition in India: An Assessment of Demographic Factors and Charging Behaviour of EV Users in Indian Metropolitan City. Cureus J. Bus. Econ. 2025. [Google Scholar] [CrossRef] [Scilit]
- Davis, P.T.; Chandrasekar, T. Understanding the Impact of Push-Pull-Mooring Factors on the Switching and Continued Usage Intentions for Electric Three-Wheelers in Public Transport. Sustain. Futures 2025, 9, 100554. [Google Scholar] [CrossRef] [Scilit]
- Alanazi, F. Electric Vehicles: Benefits, Challenges, and Potential Solutions for Widespread Adaptation. Appl. Sci. 2023, 13, 6016. [Google Scholar] [CrossRef] [Scilit]
- Almeida, L. Energy: From Efficiency to Sufficiency. CIB Conf. 2025, 1, 31. [Google Scholar] [CrossRef] [Scilit]
- Das, P.K.; Bhat, M.Y. Global Electric Vehicle Adoption: Implementation and Policy Implications for India. Environ. Sci. Pollut. Res. 2022, 29, 40612–40622. [Google Scholar] [CrossRef] [Scilit] [PubMed]
- Panchal, D.; Rathore, H. Sustainable Transition of Electric Four-Wheeler Vehicle for Urban Dwellers. Int. Res. J. Adv. Eng. Manag. 2025, 3, 1712–1726. [Google Scholar] [CrossRef] [Scilit]
- Nguyen-Viet, B.; Nguyen, A.T.L.; Thu, H.N.P. Toward Sustainable Development: Electric Two-Wheeler Adoption in Emerging Markets. Res. Transp. Bus. Manag. 2025, 62, 101468. [Google Scholar] [CrossRef] [Scilit]
- Soman, A.; Kulkarni, H.H.; Dudhedia, M.; Jape, V.; Chavan, P.; Jadhav, S. Electric Vehicle Retro-Fitment Kit for Two-Wheeler to Contribute to the Sustainable Development. In Proceedings of the 2024 International Conference on Intelligent Systems and Advanced Applications (ICISAA), Pune, India, 25–26 October 2024; pp. 1–5. [Google Scholar] [CrossRef] [Scilit]
- Yadav, K.; Sircar, A. A Review on Electric Vehicle Transport Policy of India with Certain Recommendations. MRS Energy Sustain. 2022, 9, 469–479. [Google Scholar] [CrossRef] [Scilit]
- Yeğin, T.; Ikram, M. Analysis of Consumers’ Electric Vehicle Purchase Intentions: An Expansion of the Theory of Planned Behavior. Sustainability 2022, 14, 12091. [Google Scholar] [CrossRef] [Scilit]
- Zheng, C.; Khamarudin, M.; Ahmad, A. Mapping the Literature of Electric Vehicle Purchase Intention and Consumer Behavior: A Bibliometric Analysis of Scopus Database (2010–2023). J. Infrastruct. Policy Dev. 2024, 8, 6056. [Google Scholar] [CrossRef] [Scilit]
- Su, X.; He, J. Does the Crude Oil Return Matter for the New Energy Vehicle-Related Industry Markets?—A Comparison of Complete Vehicles, Energy Systems, and Raw Materials. Energy Econ. 2025, 144, 108339. [Google Scholar] [CrossRef] [Scilit]
- Bhattacheryay, S. Distinguished Competency and Efficacy of Working Capital Management Ensuing Firm Survival, Liquidity, Solvency and Profitability: A Study on Automotive Industry. Am. Bus. Rev. 2023, 26, 3. [Google Scholar] [CrossRef] [Scilit]
- Tyagi, S.; Mahajan, V. What Determines Profitability in the Indian Automobile Industry? Indian Econ. J. 2022, 70, 71–87. [Google Scholar] [CrossRef] [Scilit]
- Zang, Y.; Qian, J.; Jiang, Q. Research on the Influence Mechanism of Consumers’ Purchase Intention of Electric Vehicles Based on Perceived Endorsement: A Case Study of Chinese Electric Vehicle Start-Ups. World Electr. Veh. J. 2022, 13, 19. [Google Scholar] [CrossRef] [Scilit]
- Rohit, K.; Verma, A. Strategic Insights into India’s Electric Vehicle Sector through Supply Chain Challenges, Innovations, and Policy Frameworks. Proc. Inst. Mech. Eng. Part J. Automob. Eng. 2025, 09544070251378536. [Google Scholar] [CrossRef] [Scilit]
- Ahmed, H.; Kaur, R. Dynamic Connectedness Among Oil Prices, Exchange Rate and Consumer Inflation: New Evidence from India. IIM Kozhikode Soc. Manag. Rev. 2026, 15, 224–233. [Google Scholar] [CrossRef] [Scilit]
- Sao, A.; Singh, S.; Gujrati, R.; Patnaik, B.; Bapat, G.S. India’s Electric Vehicle (EV) Landscape: Expert Perspectives on Readiness and Environmental Sustainability. J. Inform. Educ. Res. 2025, 5. [Google Scholar] [CrossRef] [Scilit]
- Vasundra, D.; Chinnu, M. A Study on Sustainable Development with Electric Vehicle Production in India. Int. J. Multidiscip. Res. 2025, 7, 62880. [Google Scholar] [CrossRef]
- Dhairiyasamy, R.; Gabiriel, D. Sustainable Mobility in India: Advancing Domestic Production in the Electric Vehicle Sector. Discov. Sustain. 2025, 6, 52. [Google Scholar] [CrossRef] [Scilit]
- Gajdzik, B.; Wolniak, R.; Nagaj, R.; Žuromskaitė-Nagaj, B.; Grebski, W.W. The Influence of the Global Energy Crisis on Energy Efficiency: A Comprehensive Analysis. Energies 2024, 17, 947. [Google Scholar] [CrossRef] [Scilit]
- Ozili, P.K.; Ozen, E. Global Energy Crisis. In The Impact of Climate Change and Sustainability Standards on the Insurance Market; John Wiley & Sons, Ltd.: Hoboken, NJ, USA, 2023; pp. 439–454. [Google Scholar]
- Pandey, S.K. Policy-Driven Innovation: How Government Incentives Are Shaping the EV Start-up Landscape in India. Indian J. Public Adm. 2025, 71, 620–634. [Google Scholar] [CrossRef] [Scilit]
- Parghi, V.K.; Dodia, B.M. India’s electric vehicle transition: The role of finance. Towar. Excell. 2022, 14, 2109–2120. [Google Scholar] [CrossRef] [Scilit]
- Singh, V.; Nerlekar, V.; Kumar, J. Exploring the Macroeconomic Drivers to Electric Vehicles Sales in India- A Panel Data-Based Approach. Transp. Policy 2025, 174, 103818. [Google Scholar] [CrossRef] [Scilit]
- Selvi, R.; Naik, R.M. India’s Clean Transport Vision: Scaling Electric Vehicle Adoption Nationwide. Int. J. Sci. Res. Eng. Manag. 2025, 9, 35–45. [Google Scholar] [CrossRef] [Scilit]
- Kalpana, G.; Vashishtha, A.; Tyagi, V.V.; Singh, A. Evaluating Consumer-Oriented Government Policies for Promoting Electric Vehicle Adoption in the Indian Market. Minn. J. Bus. Law Entrep. 2026, 2026, 863–881. [Google Scholar] [CrossRef] [Scilit]
- Suma, R.; Daniel, R.M. A Study on Fame India (Faster Adoption and Manufacturing of Hybrid & Electric Vehicles in India)—A Big Push towards PM’S Vision towards Sustainable Transportation & Its Impact on Stock Market. J. Inf. Syst. Eng. Manag. 2025, 10, 70–78. [Google Scholar] [CrossRef] [Scilit]
- Sreekanth, S.; Siva, K.; Lasya, S.; Reddy, P.M. Electric Vehicle Adoption in India: Growth Trends, Policy Support and Challenges. J. Econ. Trade 2026, 11, 394–404. [Google Scholar] [CrossRef] [Scilit]
- Jain, P.; Maitra, D.; Kang, S.H. Oil Price and the Automobile Industry: Dynamic Connectedness and Portfolio Implications with Downside Risk. Energy Econ. 2023, 119, 106537. [Google Scholar] [CrossRef] [Scilit]
- Periwal, A. The Impact of Crude Oil Price Fluctuations on Indian Economy. Int. J. Res. Appl. Sci. Eng. Technol. 2023, 11, 3173–3202. [Google Scholar] [CrossRef] [Scilit]
- Singh, R.R.; Gupta, N.; Yadav, G.R.; Kushwaha, R.; Mishra, M. A Dataset on Consumers’ Knowledge, Attitude, and Practice: Investigating Electric Two-Wheeler Vehicle Adoption in the Indian Automobile Sector. Data Brief 2024, 55, 110605. [Google Scholar] [CrossRef] [Scilit] [PubMed]
- Ghosh, S.; Sarkar, B. Examining the Cost-Effectiveness of Electric Vehicle Policy in India. Transp. Plan. Technol. 2022, 45, 629–642. [Google Scholar] [CrossRef] [Scilit]
- Goel, S.; Sharma, R.; Rathore, A.K. A Review on Barrier and Challenges of Electric Vehicle in India and Vehicle to Grid Optimisation. Transp. Eng. 2021, 4, 100057. [Google Scholar] [CrossRef] [Scilit]
- He, C.; Li, Q. Research on Clean Energy and New Energy Vehicle by Multidimensional Preference Analysis. IOP Conf. Ser. Earth Environ. Sci. 2021, 804, 032044. [Google Scholar] [CrossRef] [Scilit]
- Hossain, M.S.; Kumar, L.; Islam, M.M.; Selvaraj, J. A Comprehensive Review on the Integration of Electric Vehicles for Sustainable Development. J. Adv. Transp. 2022, 2022, 3868388. [Google Scholar] [CrossRef] [Scilit]
- Lasya, S.; Sreekanth, S.; Siva, K.; Reddy, P.M. Driving India’s Green Future: Challenges in Electric Vehicle Adoption. J. Econ. Trade 2026, 11, 405–414. [Google Scholar] [CrossRef] [Scilit]
- Khode, K.T.; Raut, P.N. A comparative study of conventional and electric vehicle industries in india: Policy, environmental and economic perspectives. Res. Hub 2026, 7, 556–559. [Google Scholar] [CrossRef] [Scilit]
- Mondal, S.; Suman, N.K. Challenges in Embracing Electric Vehicles: Exploring the Policy Landscape and Way Forward. Transp. Dev. Econ. 2025, 11, 27. [Google Scholar] [CrossRef] [Scilit]
- Paul, R. Economic Impact of Electric Vehicles in India. Int. J. Multidiscip. Res. 2025, 7, 64730. [Google Scholar] [CrossRef]
- Venugopal, G.; Amulya, R.H.; Shashidhar, R. Electric Vehicles (EV) Sales Analysis and Market Trends: A Comparison between India and Global Market (2020–2024). Int. J. Sci. Res. Eng. Manag. 2025, 9, 84–90. [Google Scholar] [CrossRef] [Scilit]
- Ali, I.; Naushad, M. A Study to Investigate What Tempts Consumers to Adopt Electric Vehicles. World Electr. Veh. J. 2022, 13, 26. [Google Scholar] [CrossRef] [Scilit]
- Hathaway, Z.; Polis, H.; Loomis, J.; Boroski, J.; Milano, A.; Ouyang, J. A Utility Roadmap for Expanding Customer Adoption of Electric Vehicles. World Electr. Veh. J. 2021, 12, 81. [Google Scholar] [CrossRef] [Scilit]
- Ligen, Y.; Vrubel, H.; Girault, H.H. Mobility from Renewable Electricity: Infrastructure Comparison for Battery and Hydrogen Fuel Cell Vehicles. World Electr. Veh. J. 2018, 9, 3. [Google Scholar] [CrossRef] [Scilit]
- Maroufmashat, A.; Fowler, M. Policy Considerations for Zero-Emission Vehicle Infrastructure Incentives: Case Study in Canada. World Electr. Veh. J. 2018, 9, 38. [Google Scholar] [CrossRef] [Scilit]
- Guo, X.; Hao, C.; Niu, S. Analysis of Oil Import Risk and Strategic Petroleum Reserve: The Case of China. Sustainability 2020, 12, 3723. [Google Scholar] [CrossRef] [Scilit]
- Solaymani, S.; Botero, J. Reducing Carbon Emissions from Transport Sector: Experience and Policy Design Considerations. Sustainability 2025, 17, 3762. [Google Scholar] [CrossRef] [Scilit]
- Van Mierlo, J. The World Electric Vehicle Journal, The Open Access Journal for the e-Mobility Scene. World Electr. Veh. J. 2018, 9, 1. [Google Scholar] [CrossRef] [Scilit]
- Manggala Putra, R.P.; Csereklyei, Z.; Meegahapola, L. Cost-Competitiveness of Battery Electric Vehicles and Two-Wheelers: Evidence from Indonesia. Transp. Res. Part Transp. Environ. 2026, 157, 105382. [Google Scholar] [CrossRef] [Scilit]
- Rieck, F.; Machielse, K.; van Duin, R. Will Automotive Be the Future of Mobility? Striving for Six Zeros. World Electr. Veh. J. 2020, 11, 10. [Google Scholar] [CrossRef] [Scilit]

Disclaimer/Publisher’s Note: The statements, opinions and data contained in all publications are solely those of the individual author(s) and contributor(s) and not of MDPI and/or the editor(s). MDPI and/or the editor(s) disclaim responsibility for any injury to people or property resulting from any ideas, methods, instructions or products referred to in the content. |
© 2026 by the authors. Published by MDPI on behalf of the World Electric Vehicle Association. Licensee MDPI, Basel, Switzerland. This article is an open access article distributed under the terms and conditions of the Creative Commons Attribution (CC BY) license.