1. Introduction
As the number of new energy vehicles continues to grow, charging infrastructure in Vehicle-to-Grid (V2G) scenarios has become a critical link between transportation and power grids. Against this backdrop, charging stations must not only provide efficient and stable energy supply but also possess capabilities for intelligent monitoring, condition assessment, and anomaly detection [
1]. However, faced with massive amounts of heterogeneous data and complex operating environments, traditional operation and maintenance methods struggle to meet the demands for enhancing grid resilience and accurately predicting equipment status [
2]. Consequently, technologies for anomaly detection based on multi-source data and data-driven intelligent decision-making have become a hot research topic in both academia and industry.
A regional operation dataset from Quzhou in July 2025 further illustrates the practical need for anomaly detection in charging infrastructure. Among 1180 confirmed charging orders, 26 orders delivered 0 kWh and were therefore identified as start-up failures, corresponding to a start-up failure rate of 2.20%. In addition, 44 orders were marked with abnormal stop reasons, accounting for 3.73% of all orders. The associated fault-query records contained 71 charger fault events across nine chargers, including six severe faults and 14 events with maintenance work orders. Using an approximate comprehensive operation-and-maintenance cost of RMB 200 per work order, including labor, travel, and material costs, these work-order events correspond to an estimated direct O&M cost of RMB 2800 in the one-month regional sample.
Power-limitation events were more frequent than explicit failures. Power-satisfaction aggregation over 236 charger-day records and 27,897 charging records showed a weighted average power-satisfaction rate of 88.88%, while the weighted proportion of power-limited records reached 54.09%. For example, charger No. 361 recorded concentrated communication-fault events from the evening of 8 July to the morning of 10 July. During this period, the order table shows only one 0-kWh order on 9 July and no charging order on 10 July, while the power-satisfaction aggregation contains no valid records for these days. Using the average daily charging energy and revenue of this charger from 1 July to 8 July as a baseline, the two-day service interruption corresponds to an estimated lost charging energy of 596.59 kWh, approximately RMB 890.85 in gross charging revenue, or RMB 524.68 if only the service-fee component is considered. These statistics indicate that charging anomalies include not only explicit start-up failures and abnormal terminations, but also widespread soft power-limitation and service-interruption patterns that may not be fully captured by conventional stop-reason records.
In the context of charging behavior analysis and facility planning, multi-source data fusion strategies have been widely proven to be an effective approach for addressing the challenge of aligning macro-level layout with micro-level demand. Yao Ming et al. [
1] and Sheng Yujie et al. [
3] innovatively integrated multi-source heterogeneous information, including operational vehicle trajectories, traffic conditions, and POI searches, to accurately reveal the “travel-charging” correlation characteristics of different user groups from a spatiotemporal perspective. Building on this foundation, Lou Jingfeng [
4] and Wang et al. [
5] utilized big data mining techniques to further refine the dynamic behavioral patterns of users of intelligent connected vehicles, providing behavioral support for accurate charging load forecasting. Feng et al. [
6] pointed out through a systematic review that a single data source is no longer sufficient to meet current demands, and that a multi-source fusion framework integrating meteorological, road network, and power grid operational information is key to improving prediction accuracy. Furthermore, addressing the challenges of data privacy and feature extraction, Hao et al. [
7] introduced homomorphic encryption and clustering algorithms to extract user charging patterns, while Stenstadvolden et al. [
8] conducted an in-depth analysis of the dynamic coupling mechanism between power demand and traffic flow, laying a solid theoretical foundation for understanding facility operational characteristics in complex scenarios. At the same time, high-quality data is a prerequisite for achieving accurate state determination. In response to the challenges of data missingness and sample imbalance commonly encountered in real-world operations, data augmentation and generation techniques have emerged. Sun et al. [
9] utilized Generative Adversarial Networks (GANs) to augment sparse and outlier samples, significantly improving the robustness of detection models; the SeqGAN-LSTM framework proposed by Ge et al. [
10] effectively addressed the issue of data missingness in charging load forecasting.
In the core fields of state identification and fault diagnosis, artificial intelligence algorithms are gradually replacing traditional threshold-based methods and becoming the mainstream technological approach. Domestic researchers have fully leveraged the advantages of deep learning in feature extraction: Zhao Yuqi [
11] developed an automatic prediction model to address charging station failures; Gu et al. [
12] investigated data anomaly detection under the constraints of dynamic power grid behavior; Guo et al. [
13] and Yang et al. [
14] utilized support vector machines (SVMs) and GRU neural networks, respectively, to optimize the accuracy of power system state estimation and the efficiency of auxiliary decision-making. Advanced technologies from related fields have also been cross-applied; for instance, Gong et al. [
15]’s multi-scale fully convolutional neural network (FCN) and Wen et al. [
16]’s ICA-FNN model achieved breakthroughs in anomaly early warning for nuclear power plant main pumps and high-voltage network protection equipment, respectively. To optimize the interpretability of diagnostic logic, Niu [
17] proposed a strategy based on fuzzy decision trees and back-propagation, which infers internal fault parameters from system outputs, offering a new approach to black-box diagnosis for complex systems. Overseas research has similarly focused on the development and evaluation of high-precision algorithms. The A-LSTM algorithm proposed by Diao et al. [
18] enhanced charging safety early warning capabilities; Bao et al. [
19] utilized a backpropagation (BP) neural network to achieve deep mining of fault features; and Feng et al. [
20] systematically reviewed the current status of deep learning applications in anomaly detection. Jin et al. [
21] innovatively combined blockchain technology with the XGBoost algorithm to achieve efficient assessment of State of Health (SOH) while ensuring data integrity. Although existing research has made significant progress in the utilization of multi-source data and intelligent diagnosis, there remain shortcomings in the deep coupled analysis of multi-dimensional features involving vehicles, charging stations, and the grid, as well as in the automated tracing of anomaly-associated operating conditions, necessitating further research.
Recent studies in transportation and mobility systems further show that multi-source fusion and explainable data-driven diagnosis are not limited to charging infrastructure. Min et al. [
22] combined dedicated short-range communication data and vehicle-detection-system data for traffic-speed estimation, demonstrating that multimodal sensor fusion can improve the robustness of mobility-state estimation. Tian et al. [
23] integrated aerial imagery, building-footprint information, and traffic-flow context for traffic-risk prediction, showing the value of combining visual and contextual data for condition assessment in transportation systems. However, these studies mainly focus on traffic state or risk prediction, whereas the present work further maps abnormal charging waveforms to high-risk vehicle–charger operating combinations for maintenance-oriented traceability.
From an engineering perspective, the difficulty of this problem lies not only in detecting outliers, but also in explaining why abnormal current waveforms recur under specific operating contexts. Vehicle-to-charger interaction is a closed-loop control process involving the BMS and the charger controller. Many interoperability risks do not appear as a single threshold violation; instead, they are reflected by waveform distortion, sustained supply-demand deviation, or power limitation over the charging process. In addition, charging data are collected from multiple operators, charger brands, vehicle platforms, and communication protocols, creating heterogeneous sampling frequencies and inconsistent field definitions. These factors make it difficult to build a fully supervised diagnostic model when reliable fault labels and maintenance records are not available.
In summary, although existing research has made significant progress in utilizing multi-source data for macro-level planning and employing AI models for single-point fault diagnosis, the following limitations remain: 1. Insufficient data fusion depth, with a lack of internal data exchange between vehicles and charging stations leading to “data silos”. 2. Anomaly detection relies on labeled data, making it difficult to detect “soft faults” characterized by gradual changes in curve patterns. 3. The lack of a systematic traceability mechanism makes it difficult to identify priority inspection targets and recurring defects across a group.
Accordingly, the objective of this study is to develop a data-driven diagnostic method that can identify latent degradation patterns in charging-current waveforms and trace them to high-risk vehicle–charger operating combinations. The study addresses three research questions: (1) whether shape-based time-series clustering can distinguish normal, oscillatory, and power-limited charging processes without manual fault labels; (2) whether conditional-probability statistics can localize the associated vehicle model group, charger, and station; and (3) how the resulting diagnosis can support charger maintenance, upgrade prioritization, and user-facing charging guidance. The explanatory hypothesis tested in the case study is stated at the outset: recurring severe power-limitation patterns are statistically associated with protocol-compatibility mismatch or charger output-capacity derating, rather than random disturbances alone. This hypothesis is evaluated as a case-study interpretation and does not constitute final physical fault confirmation without charger logs, protocol records, or maintenance work orders.
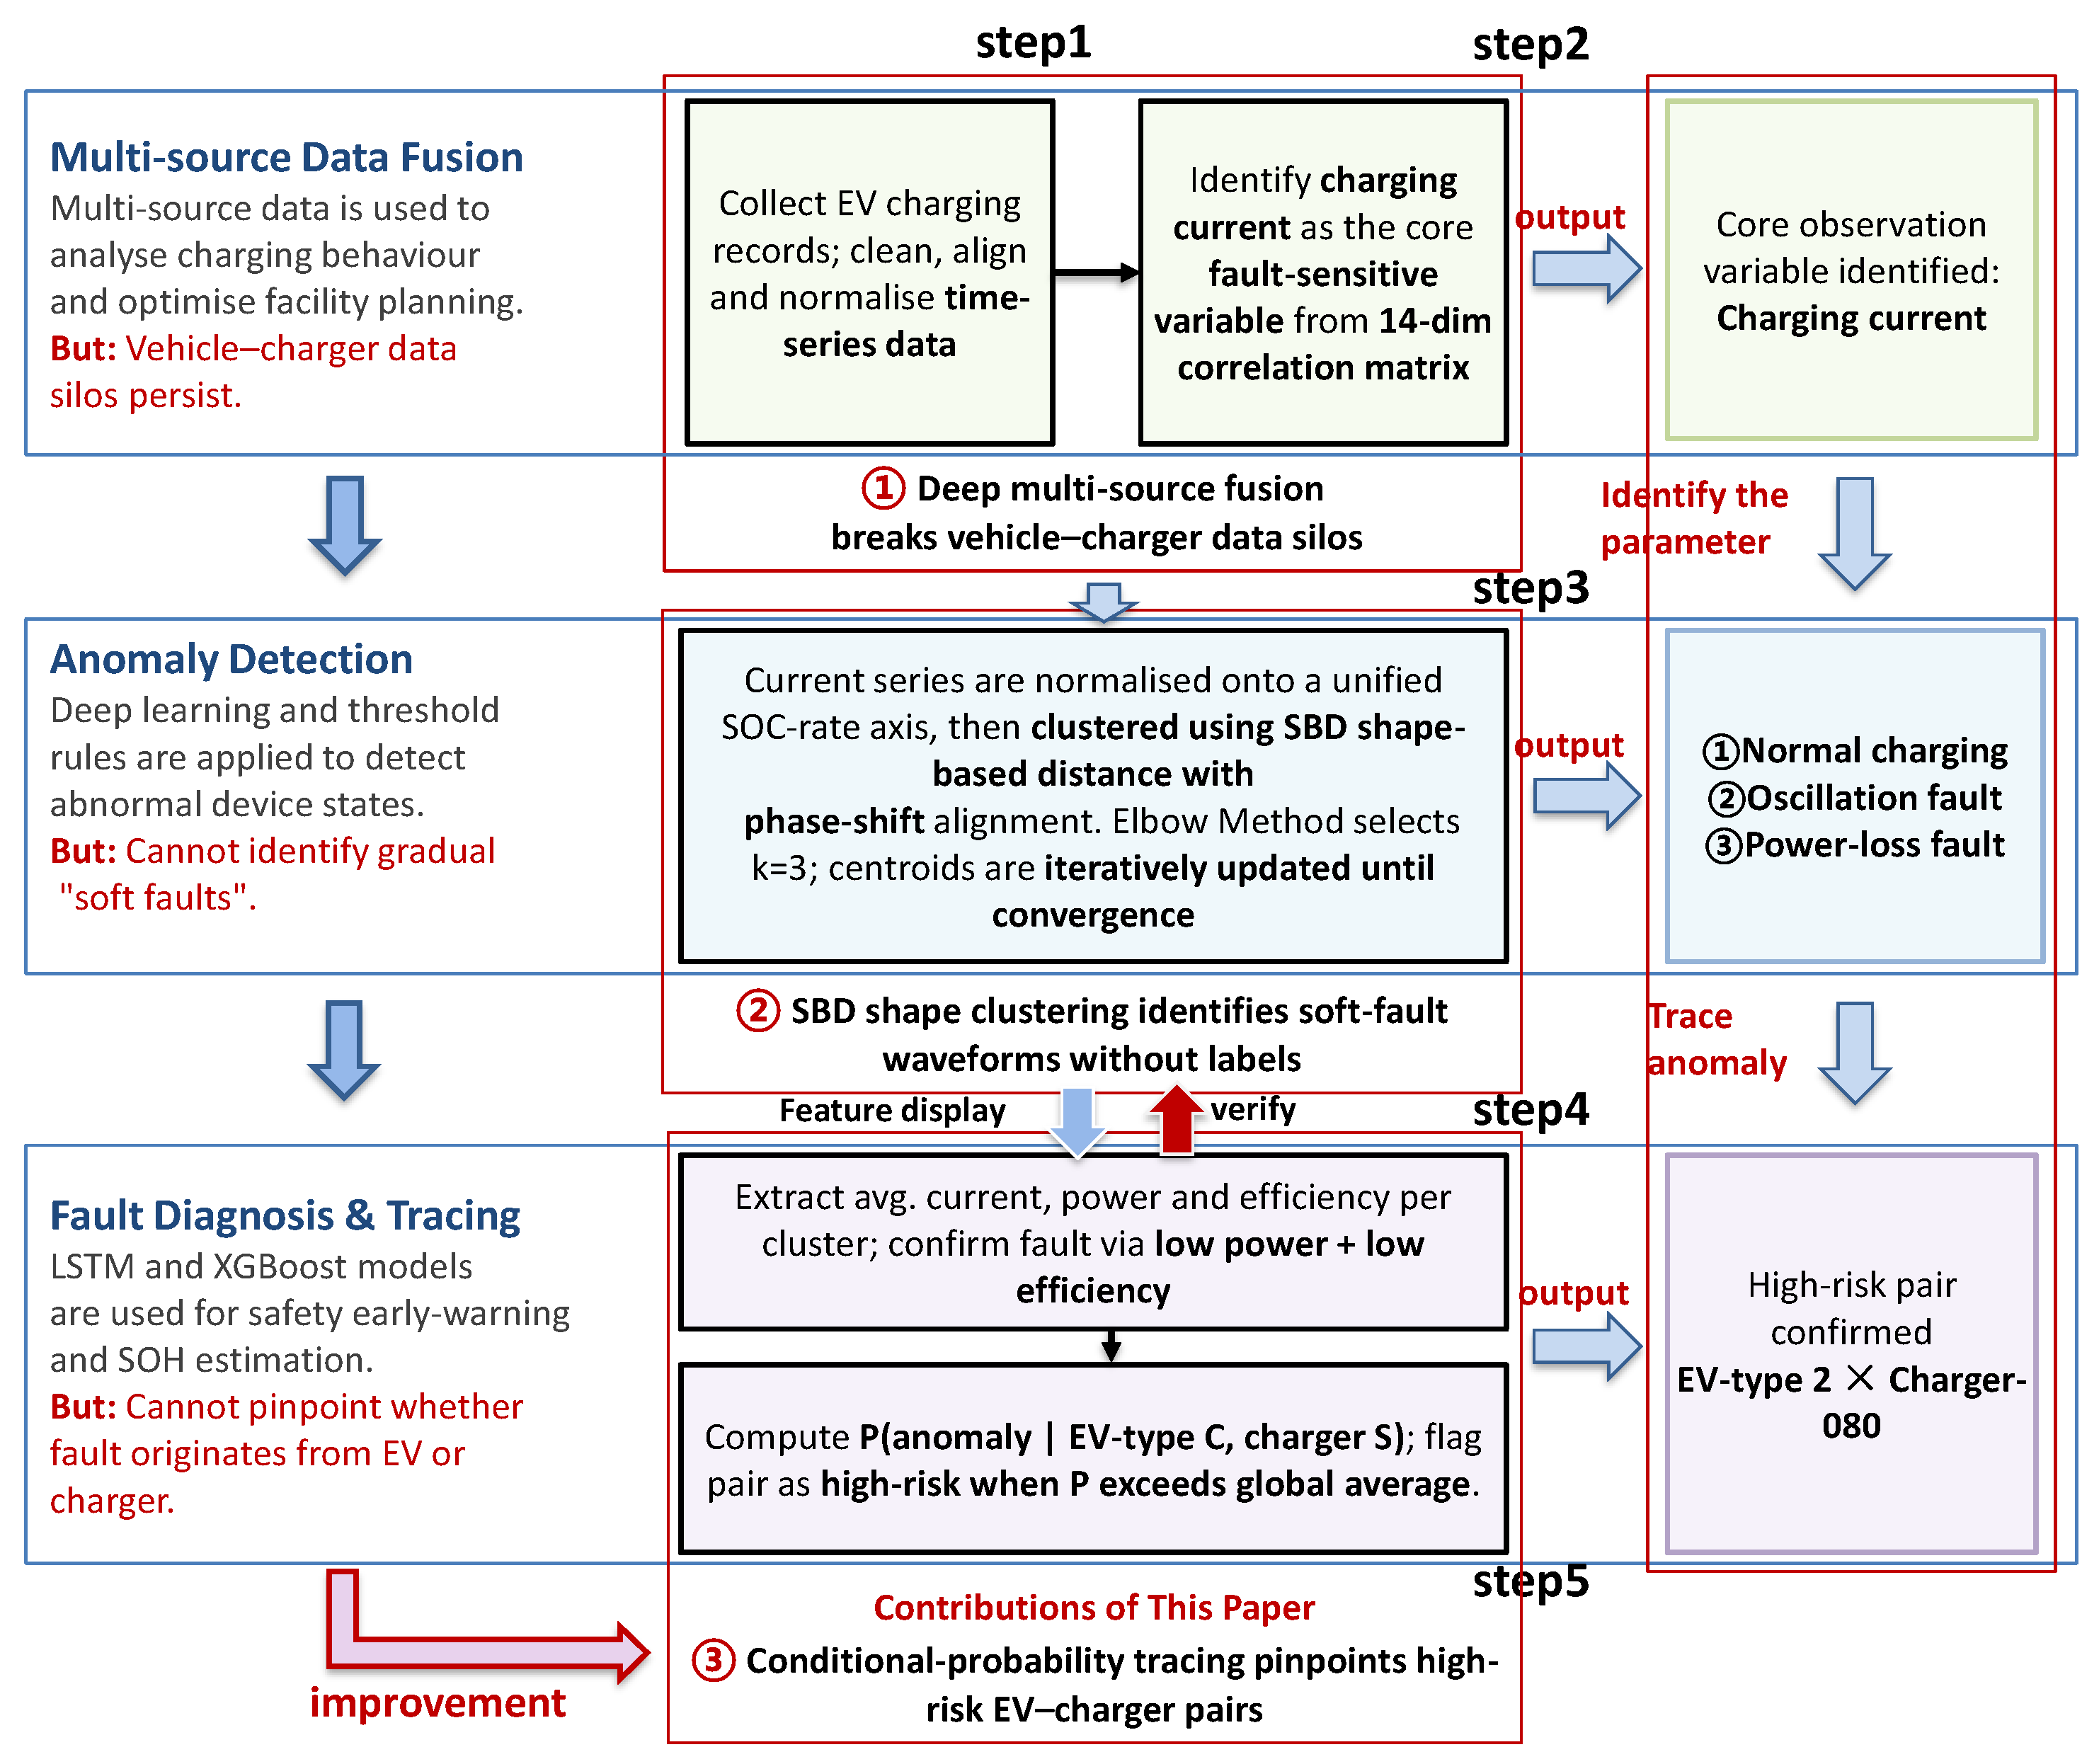
In light of this, this paper proposes a method for identifying and tracing the parameters of charging infrastructure based on multi-source data fusion and clustering. Its core advantages are primarily reflected in the following four aspects:
1. High-level data integration: Build multi-source integration models that correlate static asset data with dynamic time-series data, breaking down data silos to support comprehensive status assessments.
2. High-precision anomaly detection: By incorporating a shape-similarity-based temporal clustering algorithm, the system identifies curve-shape anomalies that are missed by threshold-based methods, thereby improving the accuracy of latent fault detection.
3. Robust troubleshooting capabilities: We have developed a three-step troubleshooting method comprising “cluster analysis, feature profiling, and combination correlation.” By using conditional probability models to systematically narrow down the scope of troubleshooting, we can quickly pinpoint whether the anomaly is associated with a specific vehicle model group, a specific charging station, or compatibility issues between the two, thereby reducing costs and improving efficiency.
4. Ability to identify recurring issues: Automatically identify anomalous “clusters” in historical data to detect common defects in specific batches of piles or vehicles, enabling bulk troubleshooting and preventive maintenance.
3. Process for Identifying and Tracing Charging Characteristics
3.1. Key Feature Recognition Based on Correlation Analysis
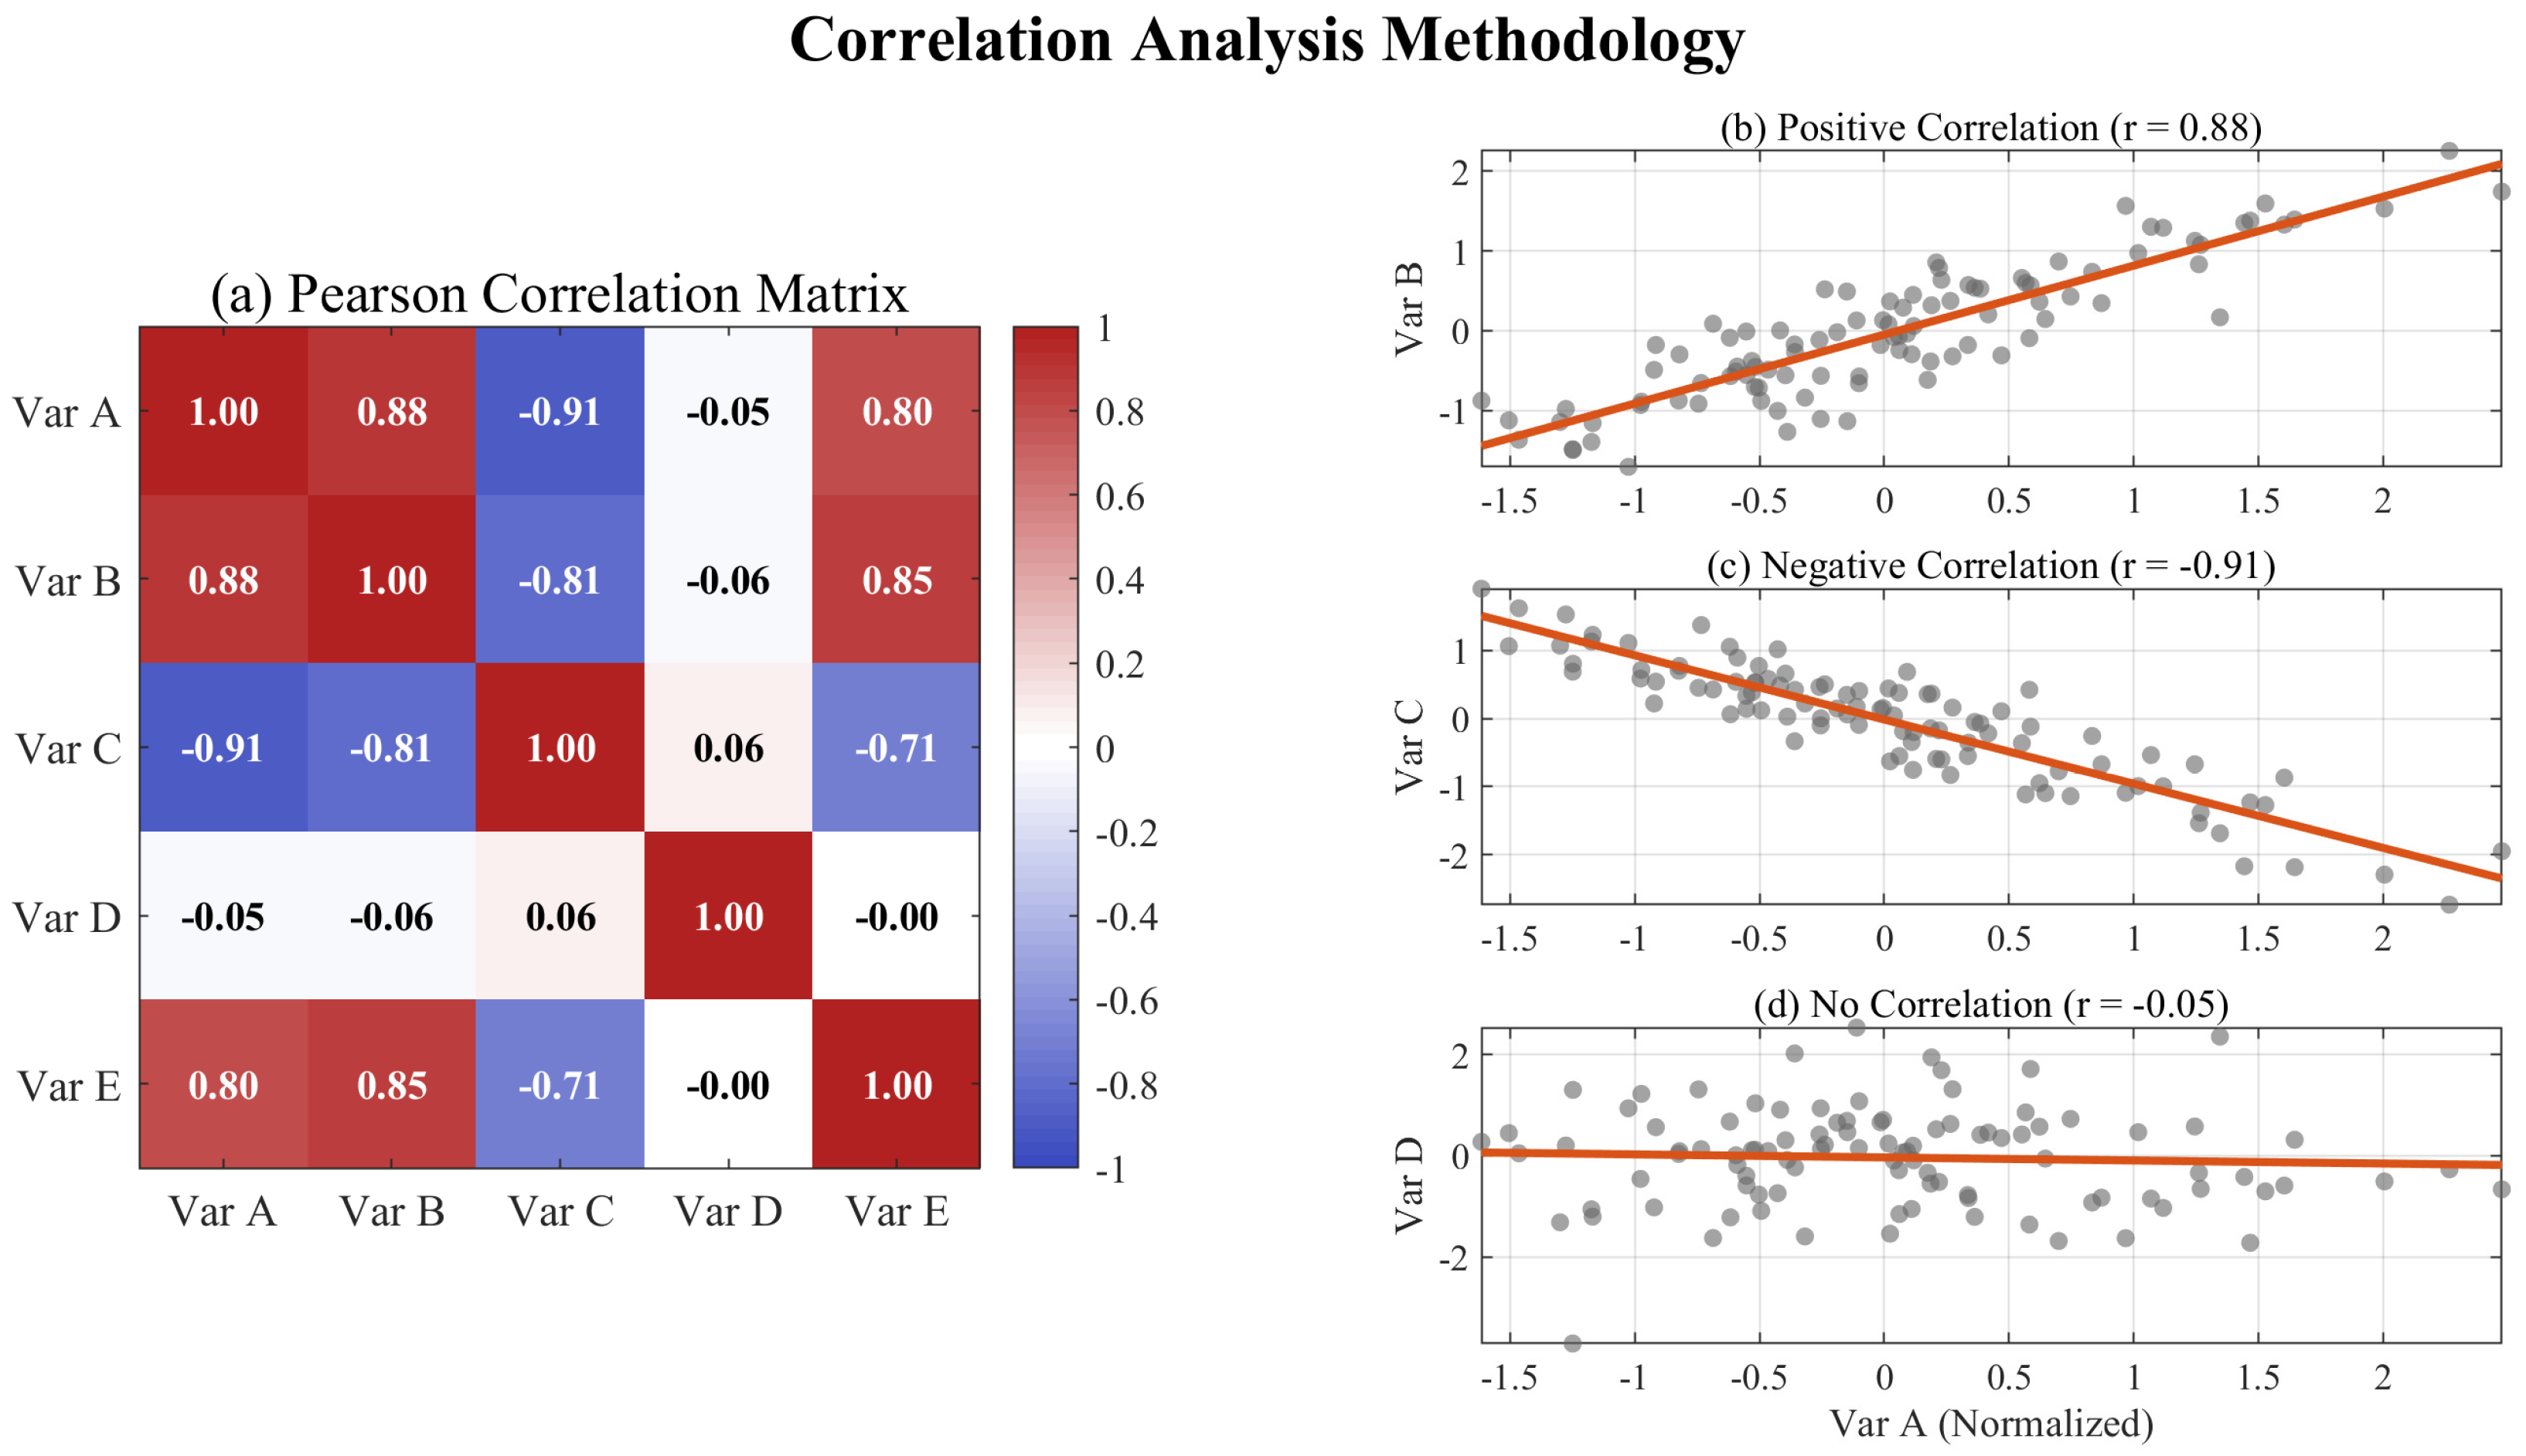
During the charging process, some parameters exhibit limited variation due to physical constraints (“rigid variables”), while others respond strongly to equipment failures and environmental disturbances (“elastic variables”). To reduce the computational dimension and identify core observable variables, this study employs a Pearson correlation matrix to test the correlations among the 14-dimensional parameters, as shown in
Figure 2.
In
Figure 2, Var A–Var E are illustrative placeholders used only to show the structure of a correlation matrix; they do not denote five fixed variables in the case study. In the actual implementation, these placeholders are replaced by the 14 standardized charging features described below. The formula for the Pearson correlation coefficient is as follows: For two feature vectors
X and
Y, their correlation coefficient
r is:
Here,
n represents the sample size, and
and
denote the means of
X and
Y, respectively.
and
represent the
i-th observations of the two compared features. When raw features are used, current is measured in A, voltage in V, power in kW, battery capacity in kWh, and SOC in %; after standardization the variables are dimensionless. The correlation coefficients between all pairs of features are calculated to form a correlation matrix. Fourteen key features were selected from the preprocessed charging order data, including: demand current, demand voltage, and demand power; output current, output voltage, and output power; battery capacity, SOC, and vehicle model group identifier. Continuous features are Z-score standardized to eliminate the influence of units:
Here,
represents the mean and
represents the standard deviation.
X is the raw value of a feature, and
is its Z-score standardized value; because
is dimensionless, features with different physical units can be compared in the same correlation matrix. Based on the standardized data, the Pearson correlation matrix
R is calculated using the formula above, where
denotes the correlation coefficient between the
i-th and
j-th features.
3.2. Classification and Identification of Individual Charging Curves Using the k-Shape Clustering Algorithm
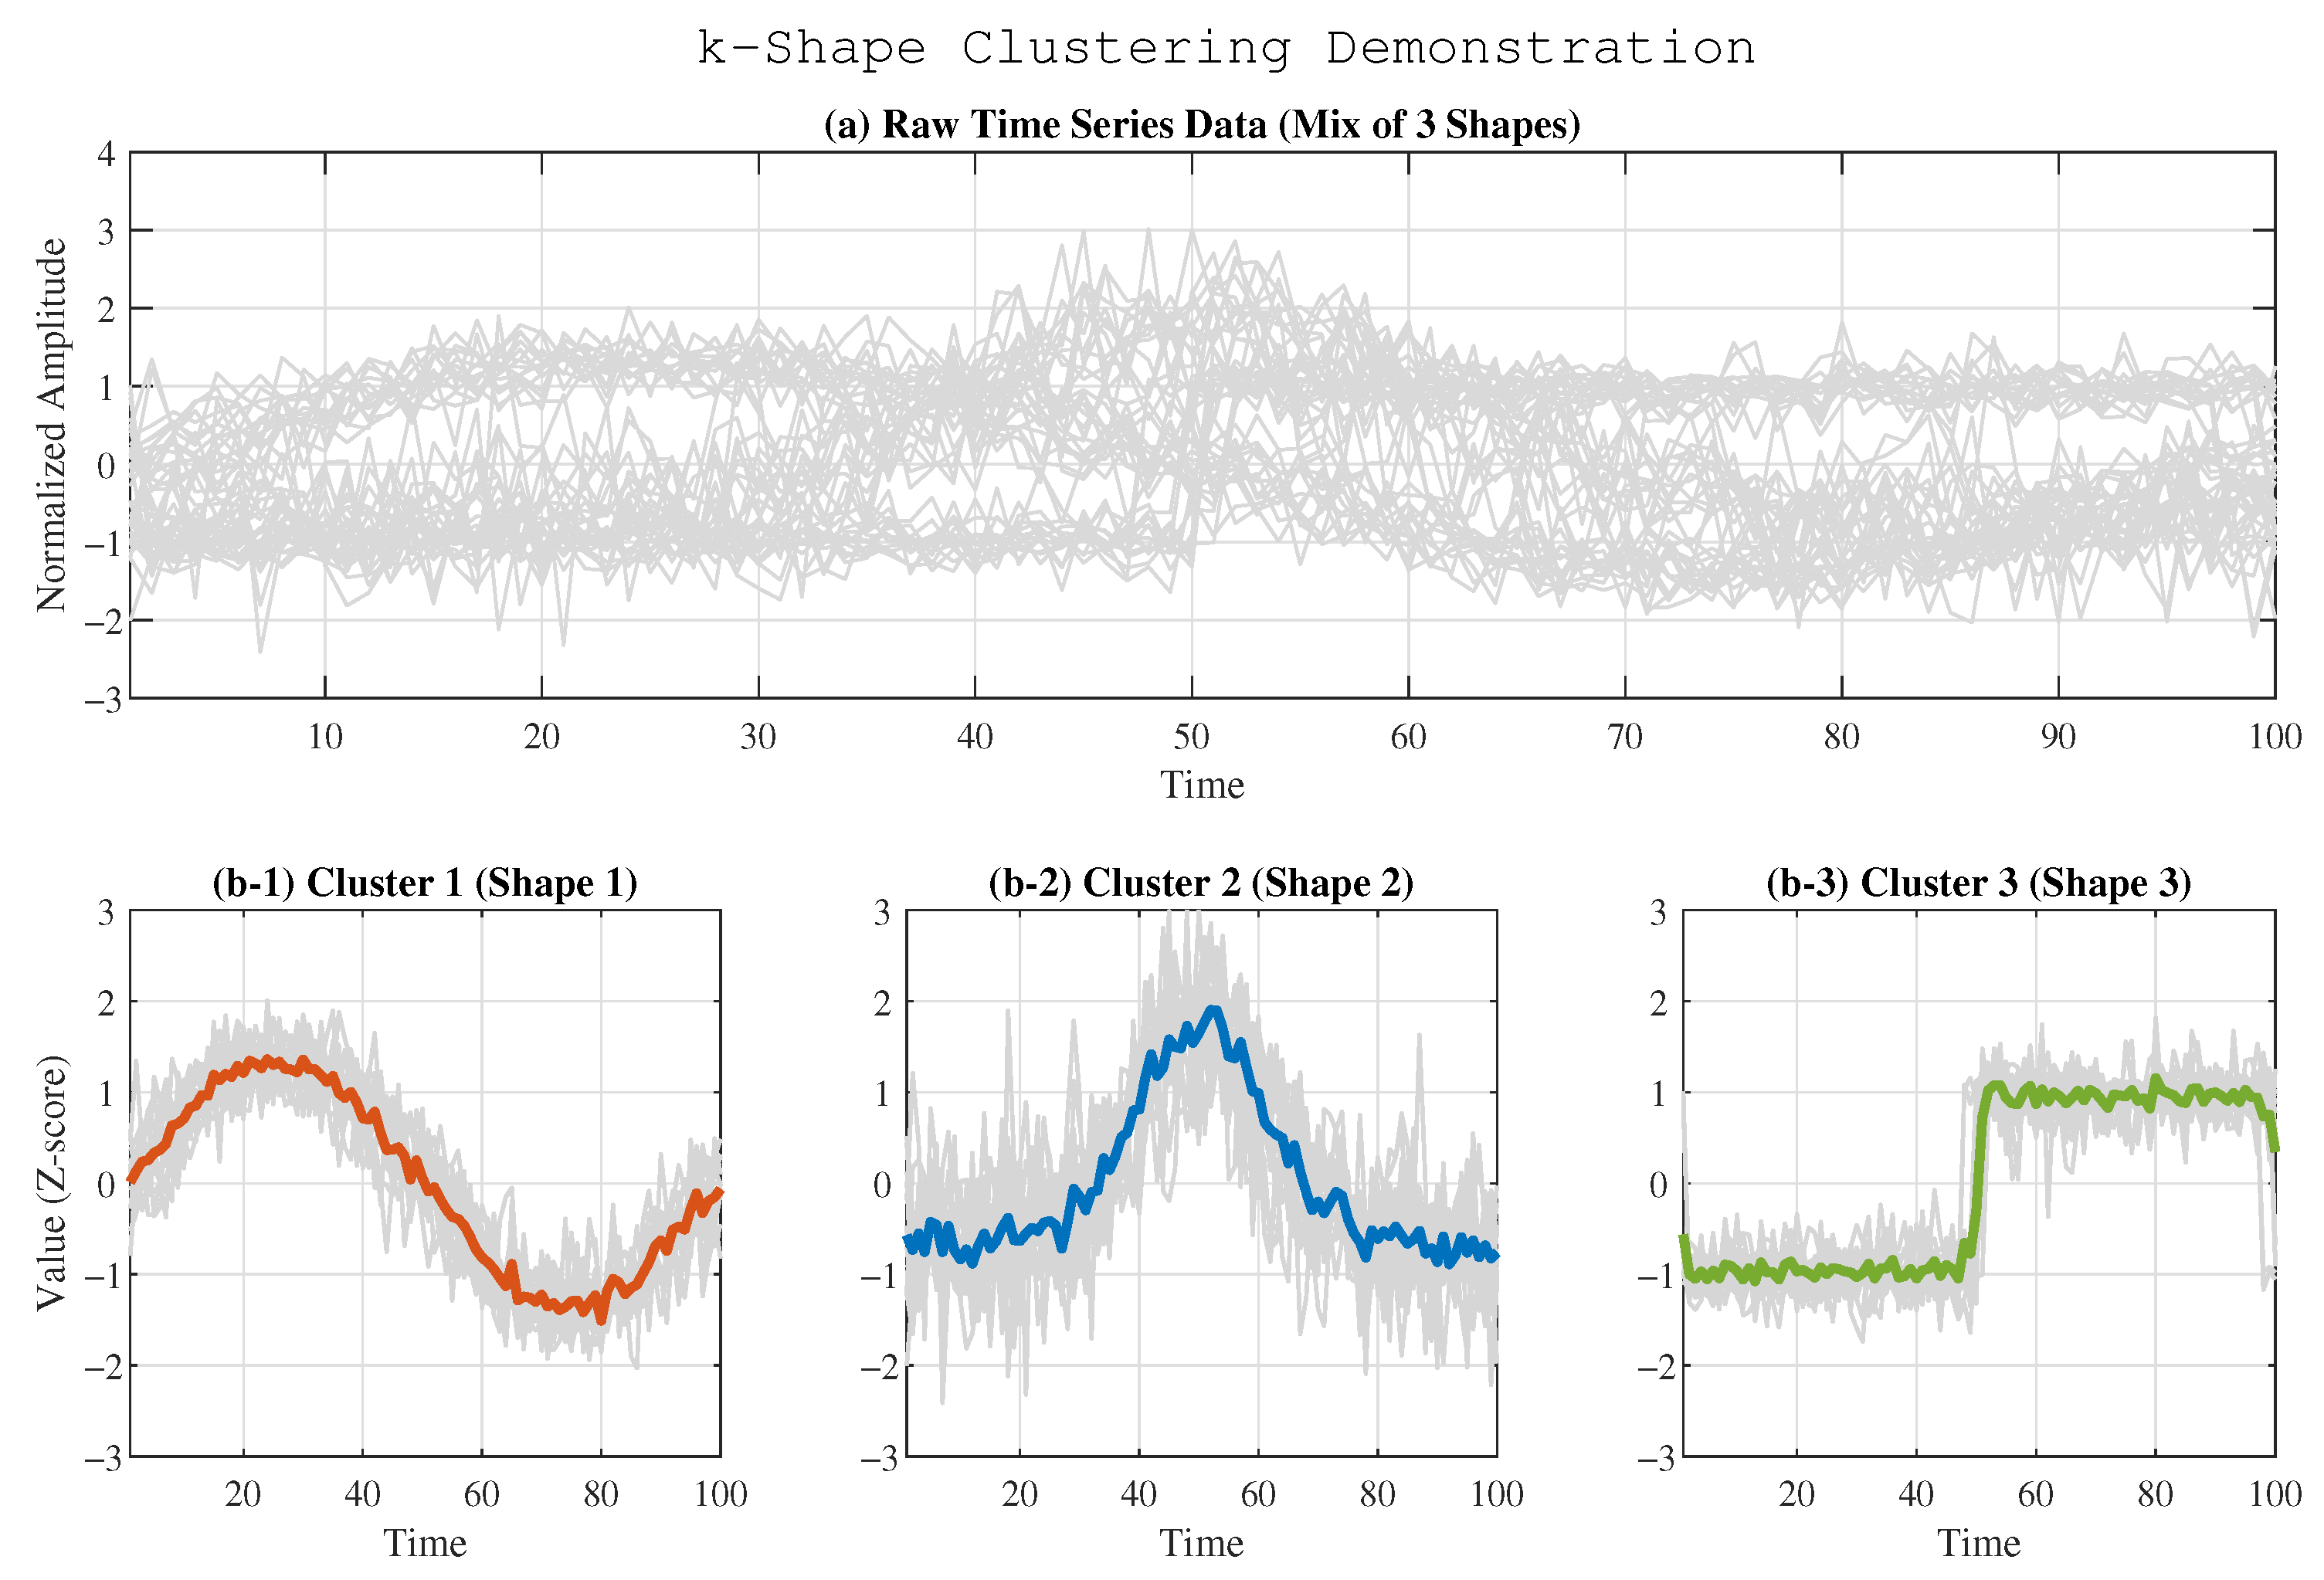
Correlation analysis confirms that current is the most sensitive “elastic variable” reflecting the vehicle-charger interaction control logic, reducing the multidimensional system to the core observation of current time series. For current time series, this study introduces the k-shape clustering algorithm. This algorithm employs shape-based distance (SBD) and measures sequence similarity through normalized cross-correlation, enabling it to adaptively eliminate phase shifts caused by BMS response delays across different vehicle model groups.
The algorithm employs the normalized cross-correlation coefficient as a similarity metric and updates the cluster centers through iterative optimization. For shape-based similarity, given two time series
X and
Y, their normalized cross-correlation coefficient is defined as:
where:
is the time shift,
and
are the mean values of the sequences, and
and
are the standard deviations of the sequences.
and
denote the normalized current values at aligned sequence positions; the current unit is A before Z-score normalization and dimensionless after normalization. Based on the NCC, the shape distance is defined as follows:
is a dimensionless shape distance. The smaller this distance is, the more similar the shapes of the two sequences are. k-shape updates the cluster centers by solving the following optimization problem:
This problem can be solved using the eigenvalue problem to obtain a closed-form solution, specifically by calculating the principal eigenvector of the cross-correlation matrix of all sequences within the cluster. In this expression, denotes the k-th cluster, denotes its centroid curve, is a candidate centroid sequence during optimization, and is the normalized cross-correlation between sequence X and candidate centroid . All sequences are Z-score normalized, so the optimized centroid is dimensionless.
Let
denote the set of current time-series samples, where
m is the number of charging sequences and
is the
i-th sequence. Procedure: For each charging order, the current-time sequence data is extracted as an equidistant sequence with the SOC change rate as the
x-axis, and then Z-score normalized; the optimal number of clusters is determined using the elbow rule; cluster centers are iteratively updated until convergence, yielding the centroid curves for each cluster, as shown in
Figure 3.
Here,
is the raw current sequence of the
i-th charging order in A,
is its normalized dimensionless sequence, and
and
denote the mean and standard deviation of the sequence, respectively.
Using the elbow rule, calculate the clustering error for different values of
k:
Here,
is the within-cluster shape-distance sum for
k clusters,
denotes the
i-th cluster,
X denotes a normalized current sequence assigned to that cluster, and
is the centroid sequence of
.
is dimensionless because it is calculated from SBD values.
Select the point where the downward trend of
shows a clear inflection as the optimal number of clusters. Randomly select
k sequences as the initial cluster centers
. Assign each sequence to the nearest cluster center:
By solving the above eigenvalue problem, recalculate the cluster center
for each cluster, and repeat the assignment and update process until the cluster centers no longer change or the maximum number of iterations is reached. In the assignment rule,
is the
i-th cluster,
is the full set of normalized current sequences,
X is a candidate sequence,
and
are centroid sequences, and the condition
means that
X is assigned to
only when its distance to
is no larger than its distance to any other centroid
. This yields
k clusters
and their corresponding cluster center curves, as shown in
Figure 3.
To reduce the risk that the clustering result is an artifact of a particular initialization, the cluster number is not determined by the elbow curve alone. The final interpretation is accepted only when three conditions are simultaneously satisfied: the elbow rule gives a stable inflection point, the resulting centroid curves have clearly distinguishable physical morphologies, and the box-plot verification in
Section 3.3 shows consistent differences in average current, average power, and charging efficiency. If a cluster shows high internal dispersion or lacks a corresponding physical operating-condition profile, it is treated as a low-confidence pattern rather than a confirmed anomaly type.
The specific implementation steps are as follows:
Step 1: To eliminate differences in charging duration across orders, all current time-series data is mapped to a unified coordinate system based on the rate of change in SOC.
Step 2: The Elbow Method is applied to calculate the Within-Cluster Sum of Squared Errors (WCSS) for different numbers of clusters k. Determine the optimal number of clusters n based on the coordinates where the rate of decrease in WCSS shows a distinct inflection point after multiple iterations.
Step 3: Use the normalized cross-correlation coefficient as a similarity metric and update the cluster centers through iterative optimization to obtain n cluster center curves, thereby classifying orders into n categories of curves.
3.3. Quantitative Validation of Operating Conditions Based on Box Plots of Key Features
The Z-score preprocessing in k-shape clustering masks information about absolute magnitude. To give the clustering results clear physical meaning, this paper extracts the average current demand, average charging power, and charging efficiency for each cluster, and uses box plots to validate anomaly detection from three dimensions:
1. Restoration of absolute physical quantities: Quantitative detection thresholds are established based on the interquartile range (IQR) and median distributions of key features for each cluster, addressing the limitation of the k-shape method’s insensitivity to magnitude.
2. Intra-cluster consistency test: For abnormal operating conditions with clear operating-condition signatures, the characteristics of samples within the cluster should be highly consistent (box plots should be flat and convergent); Extreme divergence in the distribution indicates the presence of random noise, necessitating the exclusion of low-confidence results.
3. Multidimensional joint diagnosis: Low power + high efficiency is classified as normal terminal charging; low power + low efficiency is flagged as a possible interoperability-related anomaly, eliminating logical ambiguity associated with single metrics.
3.4. Parameter Traceback for Vehicle-Pole Matching Anomalies Based on Conditional Probability
After completing the pattern clustering, a traceability model based on conditional probability is constructed for clusters of orders exhibiting abnormal patterns: the source-side association is assessed by calculating the deviation between the posterior probability of a “vehicle-charging station” combination within an abnormal cluster and the prior probability based on the full dataset. Its validity is based on the assumption that fault distributions are non-random. If anomalies are associated with random disturbances such as grid fluctuations, the distribution should be relatively dispersed; if they are associated with hardware derating or protocol mismatches, anomalies will tend to cluster around specific “vehicle-charger” combinations. When the probability of anomalies for a specific combination is significantly higher than the global average, this probability deviation is interpreted as statistical traceability evidence rather than final physical proof. Maintenance logs, charger controller records, and protocol-level inspection are still required to confirm the final cause. This mechanism maps macro-level waveform anomalies to priority physical inspection targets and provides prioritized clues for subsequent troubleshooting.
By analyzing the frequency of different vehicle model groups, charging stations, and charging sites within anomaly clusters, conditional probability is used to identify and locate high-risk “vehicle-station-site” combinations associated with the anomalies. The formula for calculating the anomaly probability
P is:
Here, C denotes a vehicle model group, S denotes a charging pile or charging station identifier, represents the number of times vehicle model group C experienced an anomaly at charging station S, and represents the total number of charging sessions for that combination. Both terms are counts with no physical unit, so is a dimensionless probability. When this probability is significantly higher than that of other combinations, the combination is classified as high-risk. Because conditional probabilities calculated from very small counts can be unstable, the probability is interpreted together with the absolute frequency of abnormal orders, the recurrence count of the same vehicle–charger combination, and curve-level evidence from the original time series. In this study, such results are used to rank inspection priorities rather than to assign final fault responsibility. To further compare the curves of normal and abnormal orders at this station and calculate the power output capacity assessment, the actual maximum output power value is first calculated using the following formula:
For the case-study analysis, the minimum reporting criterion was calibrated using the background abnormal-trigger level observed in the July 2025 operation data. In the regional order table, 48 of 1180 confirmed orders were either 0-kWh start-up failures or were marked with abnormal stop reasons, giving an order-level abnormal-trigger rate of 4.07%. A more conservative background reference can be obtained from the 71 charger fault events recorded in the same month, corresponding to 6.02% of the 1180 orders. Under this conservative 6.02% background rate, the probability that a random vehicle–charger combination with five observations would contain three or more abnormal observations is approximately 0.20% under a binomial model. Therefore, a vehicle–charger combination is reported as a high-risk candidate only when it satisfies both a minimum total-observation threshold and a minimum recurrence threshold, namely
and
. When
, the abnormal rate is reported together with the absolute count and is interpreted only as a priority inspection clue. This data-calibrated criterion is intended to prevent small-denominator probabilities from being overinterpreted.
In this equation,
T denotes the observed charging time window,
is the charger output voltage at time
t in V,
is the output current at time
t in A, and
is the maximum observed output power, reported in kW after unit conversion.
Output capacity is denoted by
, and the calculation formula is:
For the high-risk charging station, the value is significantly lower than that of a normal charging station, indicating possible insufficient power output capacity. is the rated charger power in kW, and is a dimensionless percentage used to compare observed output capacity with nominal capacity.
4. Case Study Analysis
4.1. Dataset Construction and Decomposition of Parameter Correlations
This study utilized operational data on charging infrastructure from July to August 2025 in the Quzhou region of Zhejiang Province. The high summer temperatures pose extreme operational challenges to battery thermal management systems and the heat dissipation capabilities of charging stations, making this period the optimal timeframe for identifying potential faults.
Data preprocessing included: removing invalid records with zero duration, zero energy consumption, or missing key fields, resulting in over 80,000 valid static orders; performing time-series alignment and outlier filtering on high-frequency time-series data, and parsing over 100,000 dynamic time-series data points. All feature variables were directly derived from real-time samples of the actual operational system.
The data layers used in the case study are summarized in
Table 1.
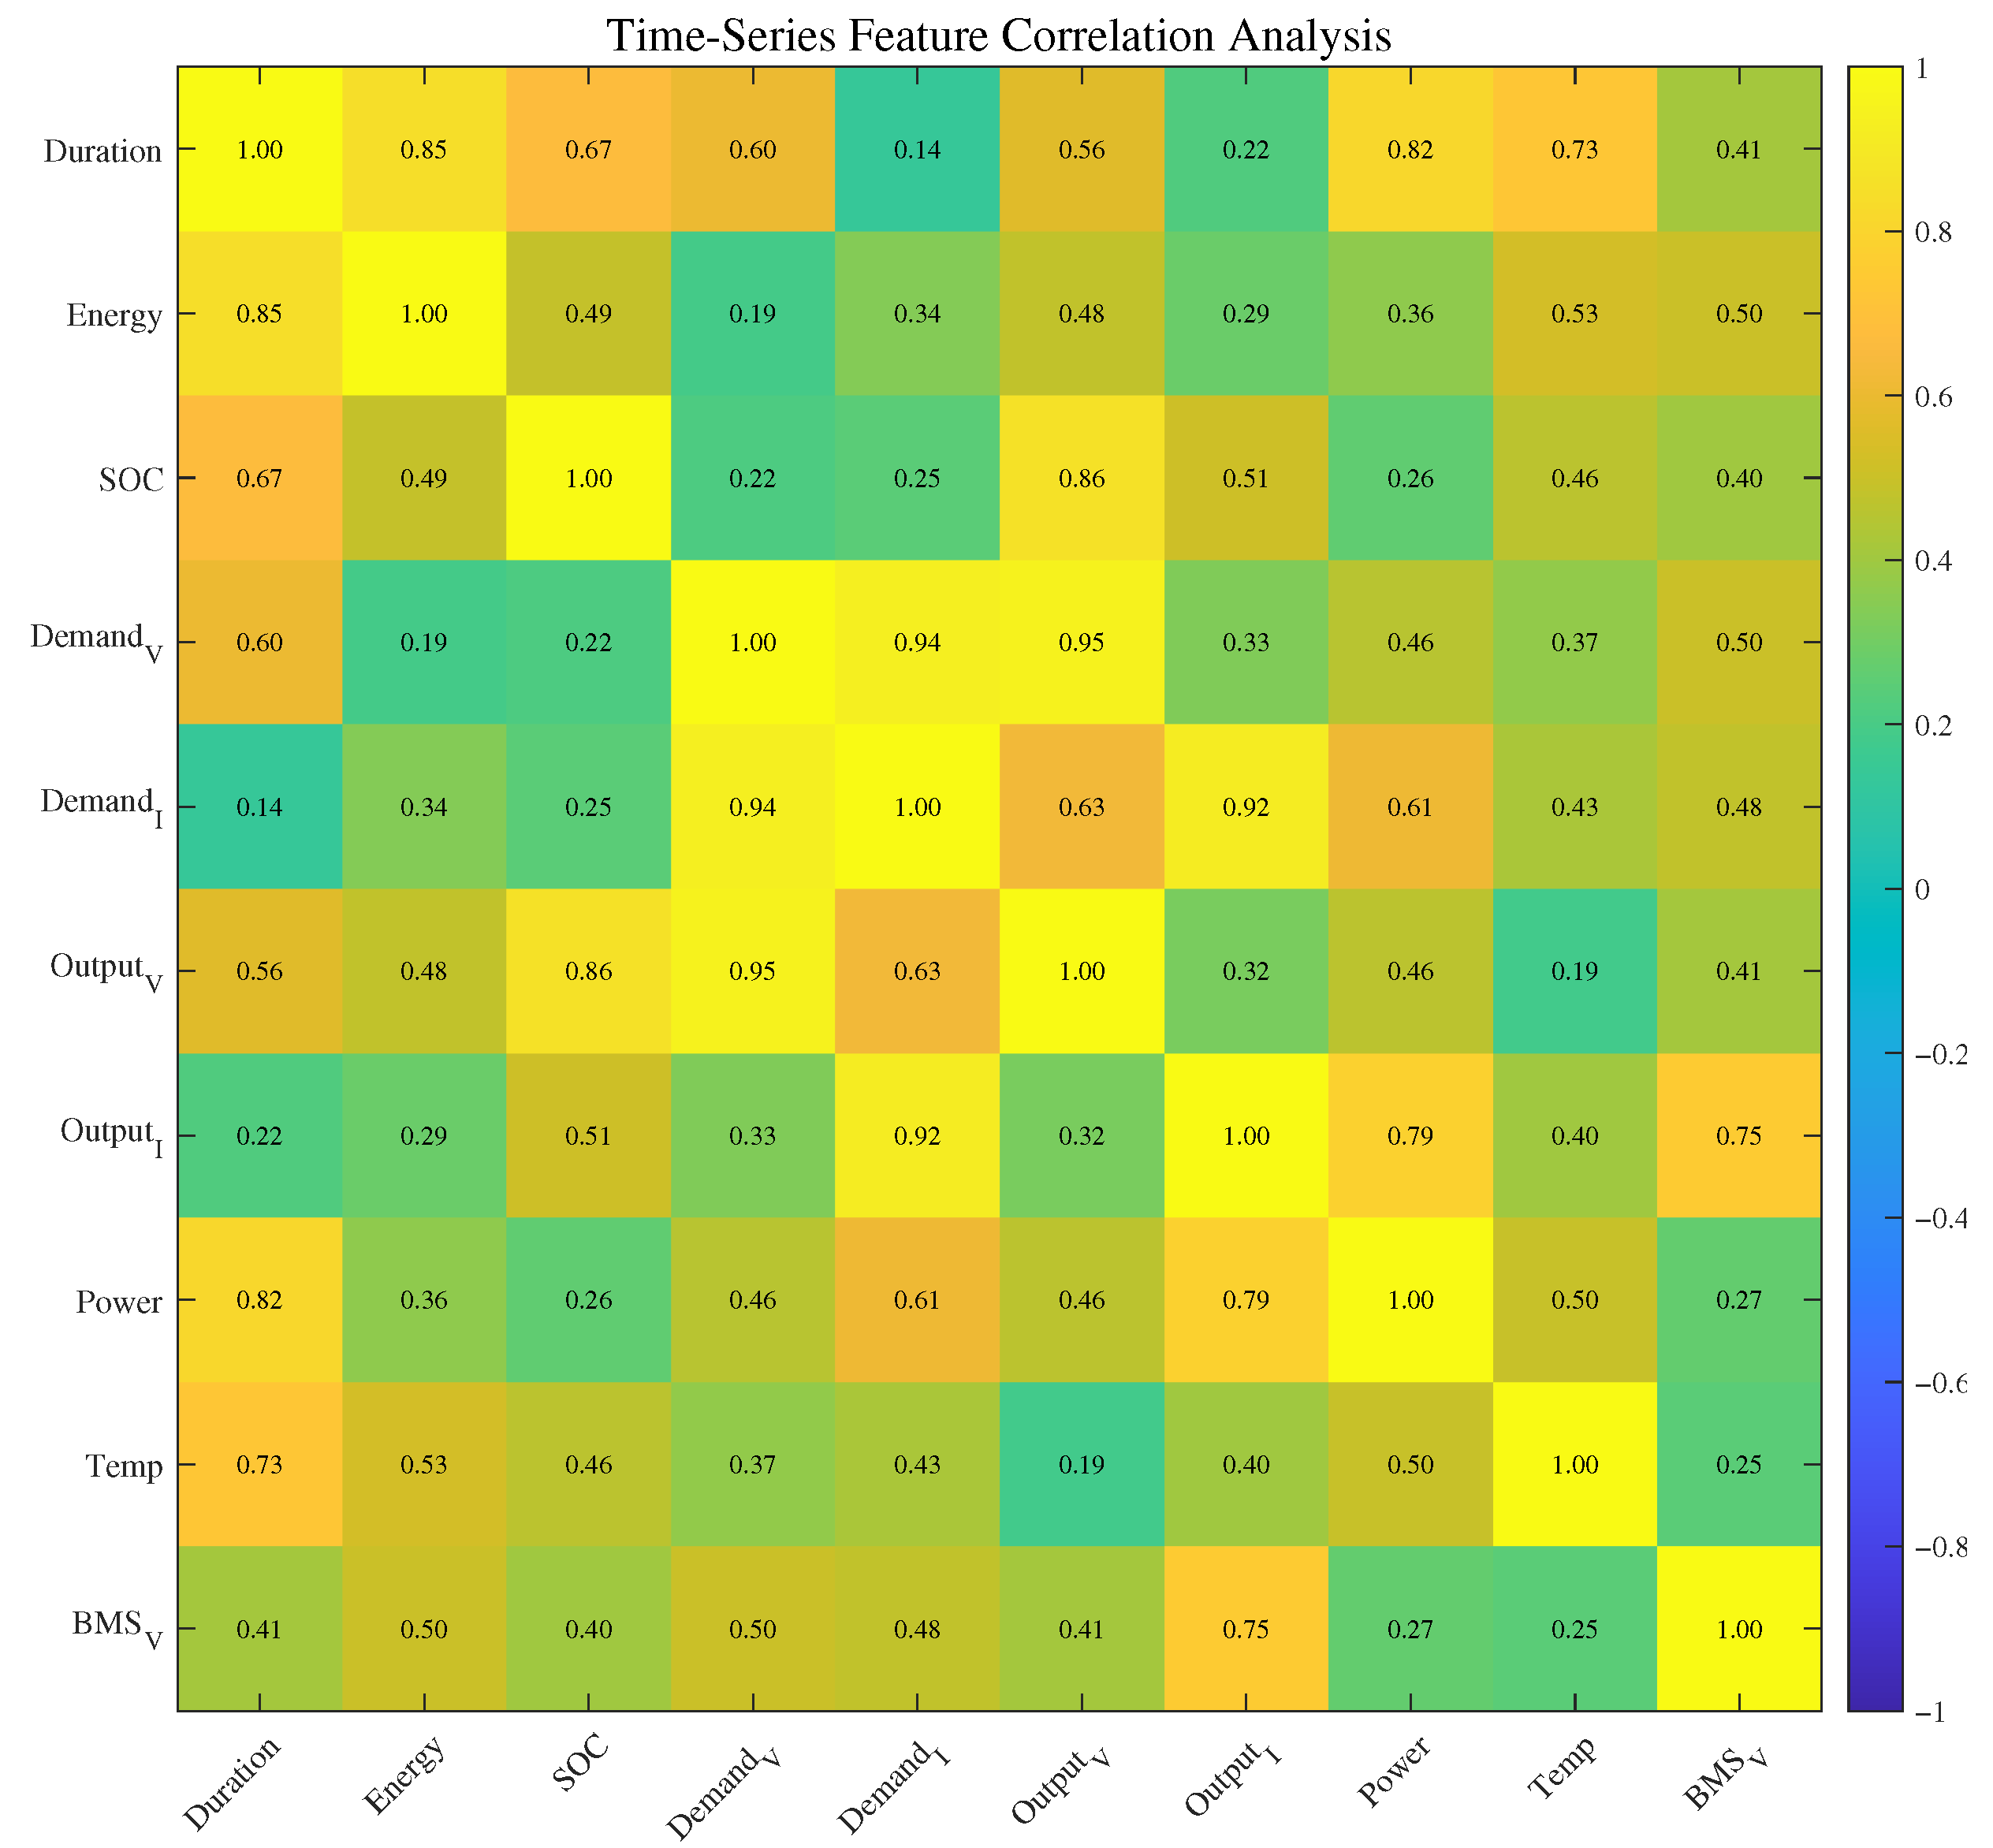
A Pearson correlation test was performed on 14 key features (
Figure 4). The results indicate that demand current and demand power exhibit a strong positive correlation; the output side strictly follows demand-side instructions, and the system demonstrates a “vehicle-centric” control characteristic; battery capacity is significantly positively correlated with both demand voltage and demand current, making it a key endogenous variable determining the benchmark characteristics of charging behavior. Given the decisive influence of vehicle model group differences on the distribution of electrical parameters, this study adopts a “vehicle model group” strategy to eliminate misclassifications of “pseudo outliers.”
4.2. Statistical Characterization of Charging Profiles for Heterogeneous Vehicle Model Groups
This paper analyzes the full charging data for a specific vehicle brand, comprising a total of 2335 orders and 88 labelled complete charging cycles, which were categorized into three vehicle model groups based on the first eight characters of the VIN. The purpose of this grouping is not to label commercial vehicle types, but to control the heterogeneity of BMS charging strategies before clustering. It helps distinguish true abnormal vehicle–charger interaction patterns from normal differences among VIN-prefix vehicle model groups.
4.2.1. Vehicle Model Group 1: High-Efficiency Stable Type
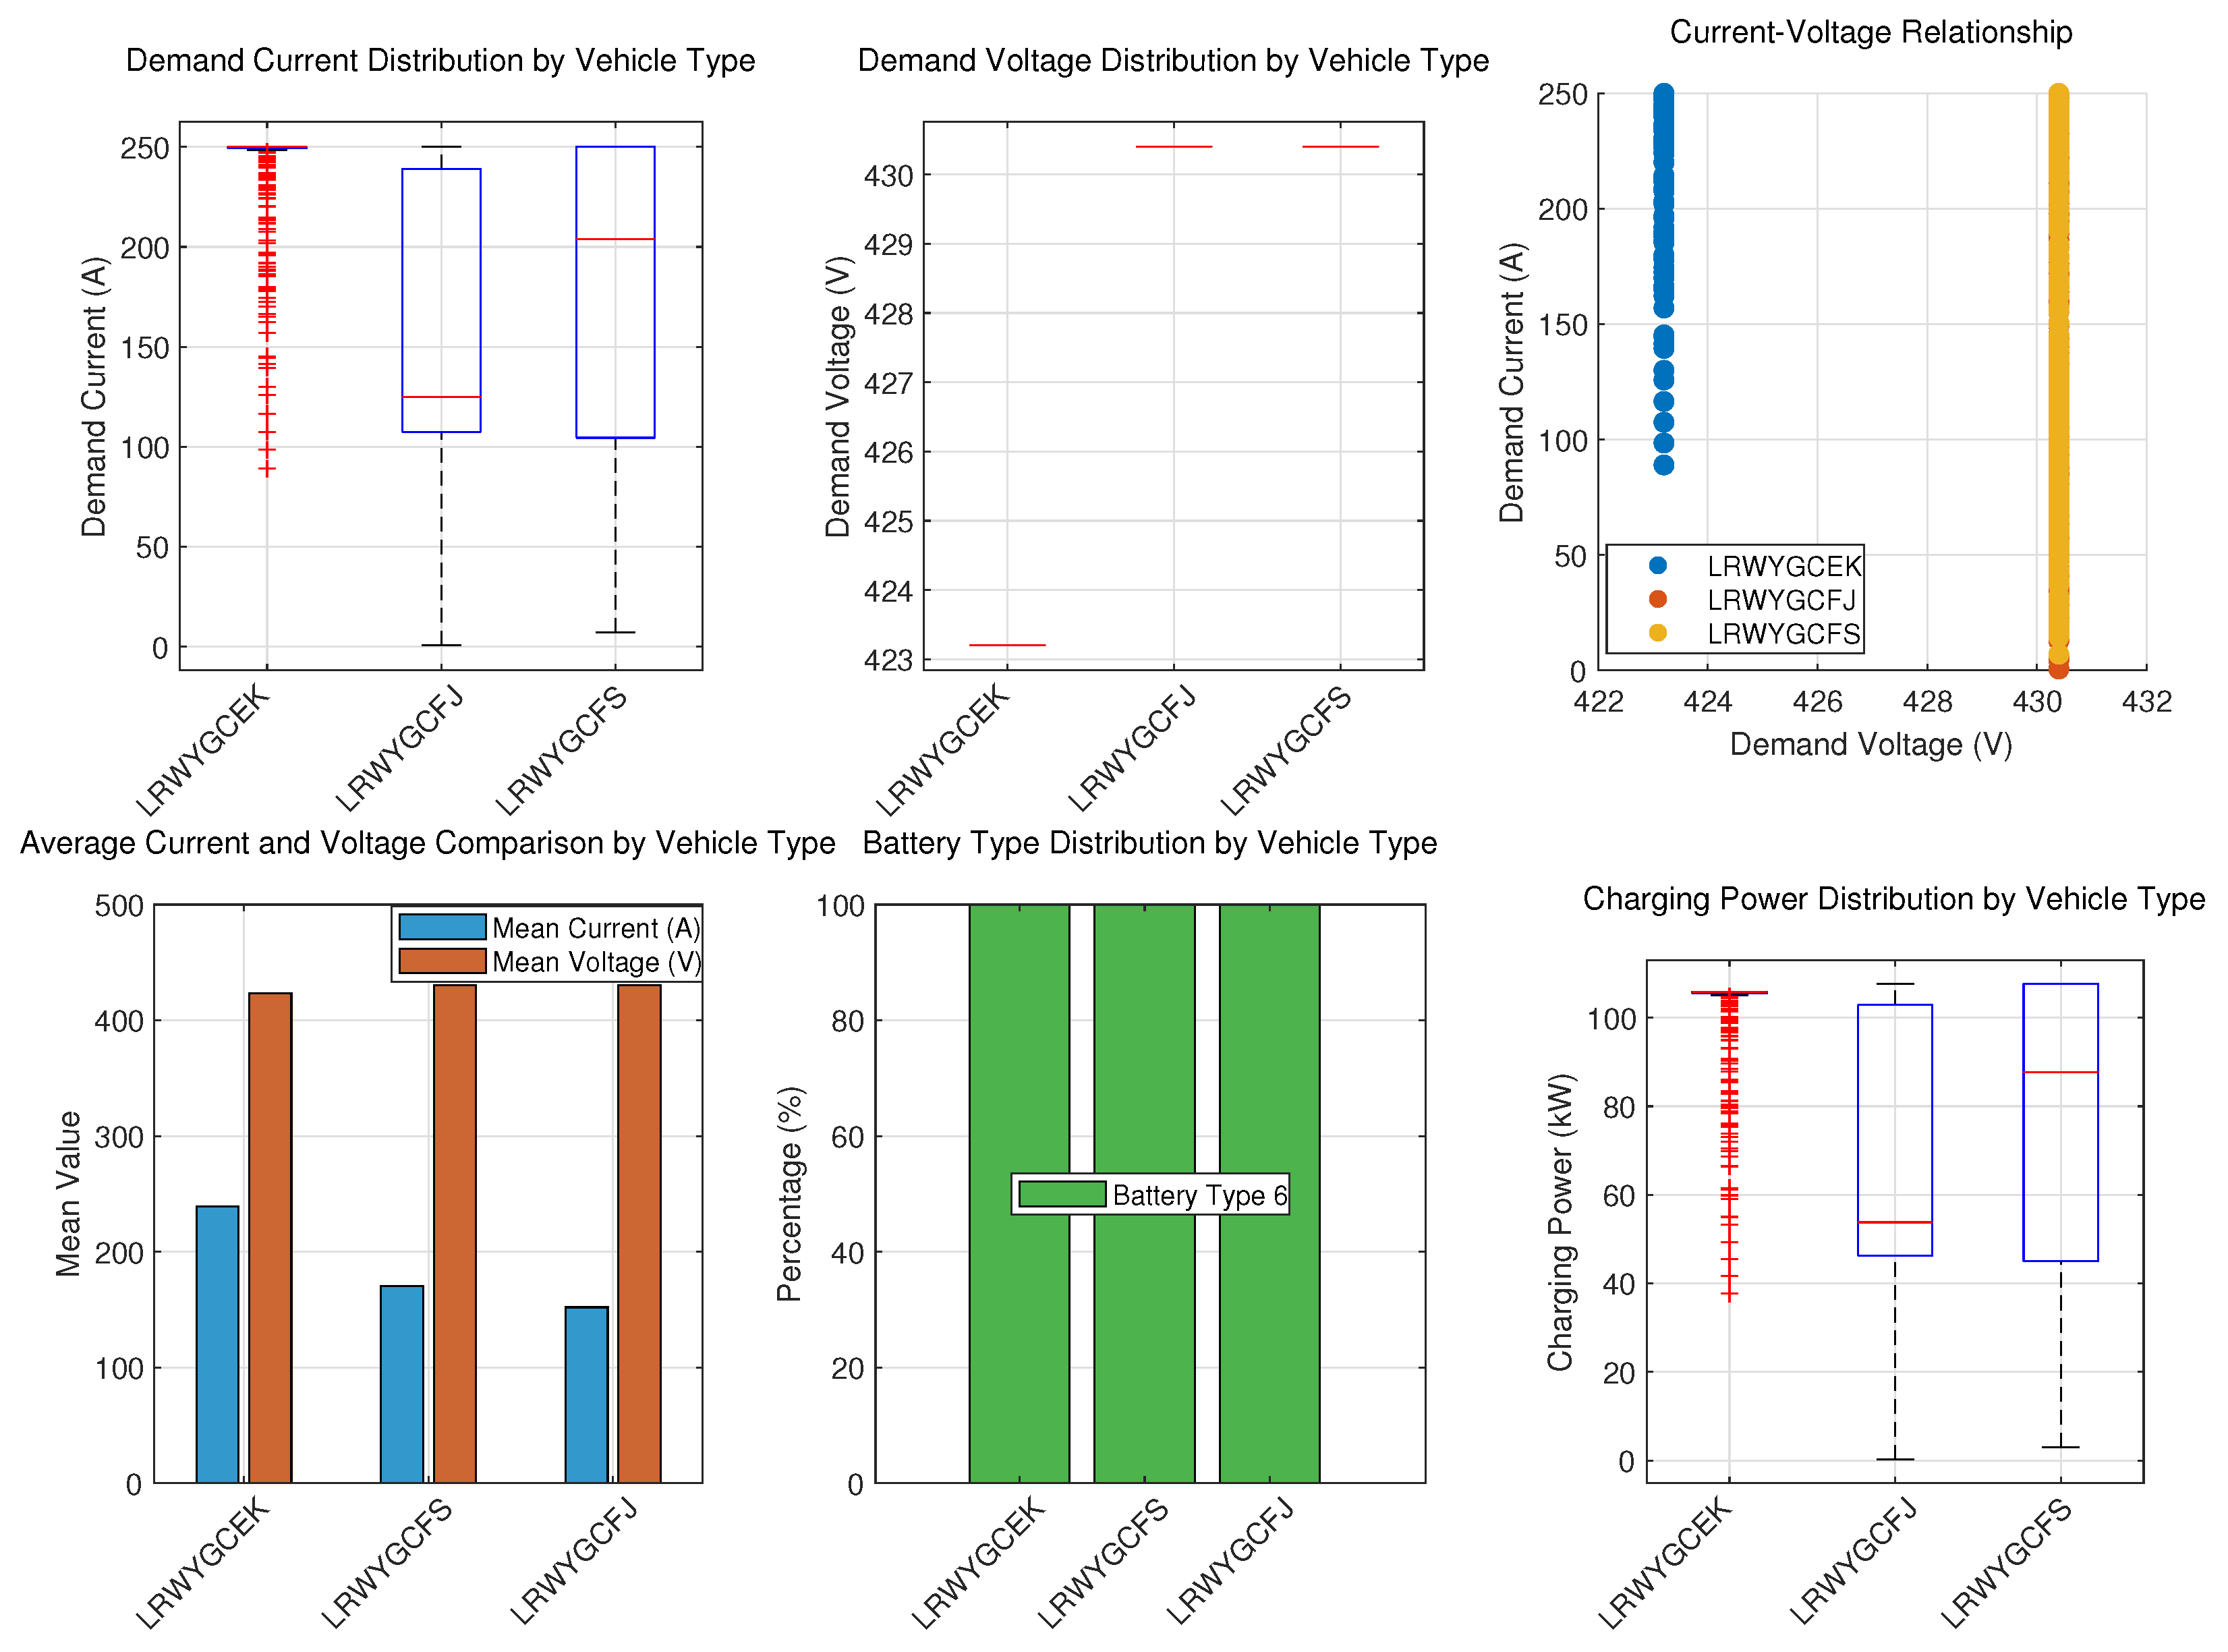
Vehicle model group 1 (High-Efficiency Stable Type): Requires 79–250 A of input current; the average output current remains stable at a high level of 250 A with minimal fluctuation; the BMS employs an aggressive and highly efficient fast-charging strategy.
4.2.2. Vehicle Model Groups 2 and 3: High-Voltage-Limited Type
Vehicle model groups 2 and 3 (High-Voltage-Limited Type): The rated required voltage is approximately 433 V, but the average output current is significantly below 200 A. The current distribution is highly variable, and frequent triggering of protective mechanisms results in dynamic current limiting.
4.2.3. Voltage Rigidity and Feature Dimension Reduction
The required voltage for these three vehicle model groups remains highly stable throughout the entire charging process, and dynamic anomalies are primarily manifested through current, a high-frequency, time-varying parameter. Based on this, the anomaly detection dimension is narrowed down to the single dimension of “charging current.” The statistical distributions of these vehicle model groups and key operating features are shown in
Figure 5. This current-only clustering design does not imply that voltage, SOC, output power, charging duration, or temperature are irrelevant. In the present workflow, SOC is used as the process-normalization coordinate, charging-duration differences are reduced through SOC-based alignment, and output power is jointly examined in the post-clustering physical validation. Voltage is retained in the correlation and power-capability analysis, but its limited variation in the selected vehicle model groups makes it less informative as the primary shape variable.
4.3. Time-Series Pattern Clustering and Anomaly Detection Based on the k-Shape Algorithm
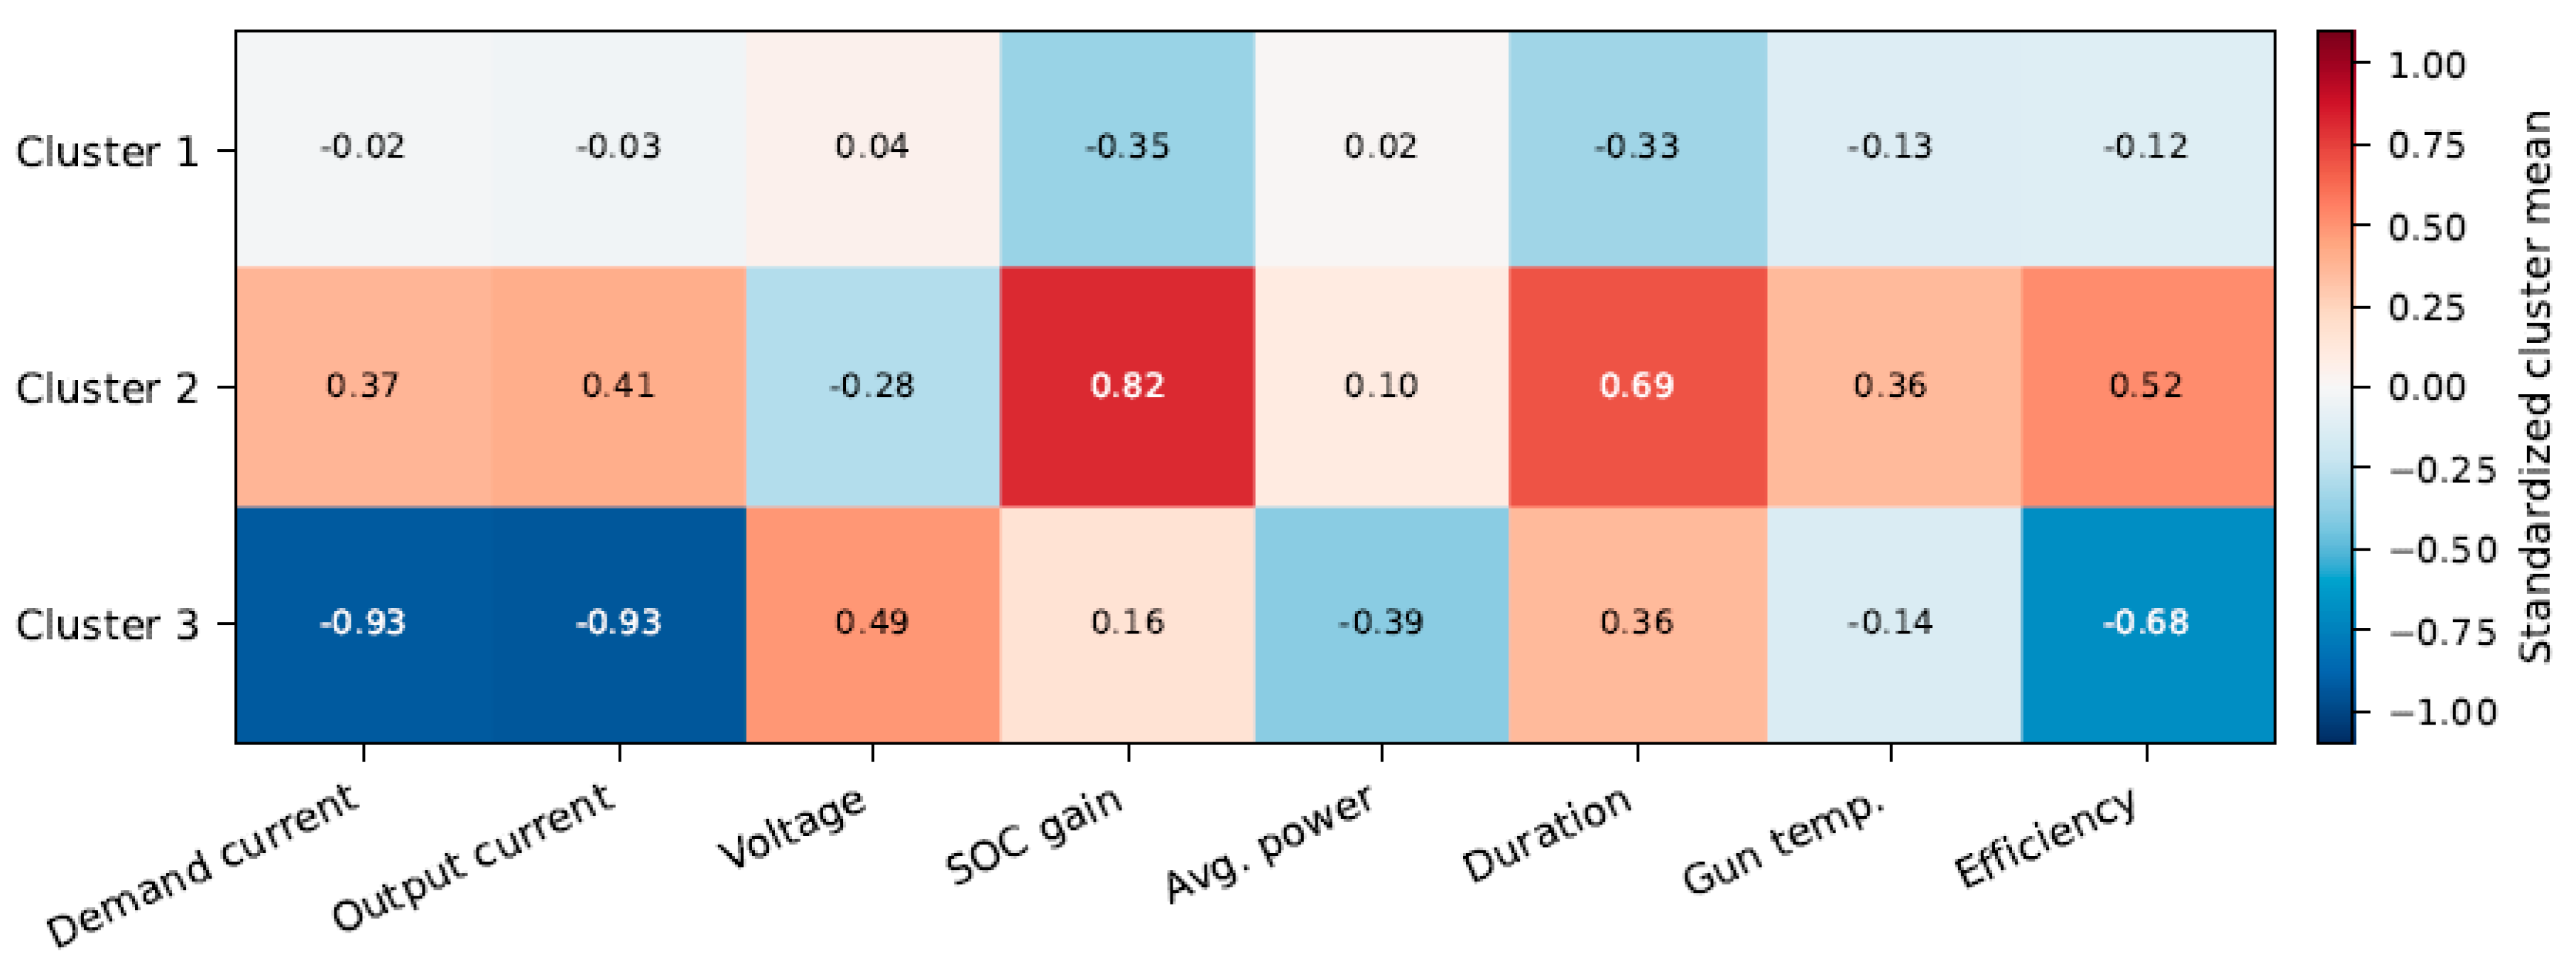
To support the selection of charging current as the core shape variable, a label-consistent multivariate validation was conducted after the original k-shape labels were obtained. The standardized cluster means of demand current, output current, voltage, SOC gain, average charging power, charging duration, gun temperature, and charging efficiency were compared. As shown in
Figure 6, Cluster 3 exhibits substantially lower demand current, output current, average charging power, and charging efficiency, supporting its interpretation as a degraded power-limited operating condition. Cluster 2 shows higher SOC gain, charging duration, energy transfer, and efficiency, indicating a long-duration high-energy charging condition rather than a severe power-limited fault. This validation is placed before the detailed clustering procedure to clarify that the current-only k-shape model is accompanied by multivariate post-validation rather than excluding non-current variables from the analysis.
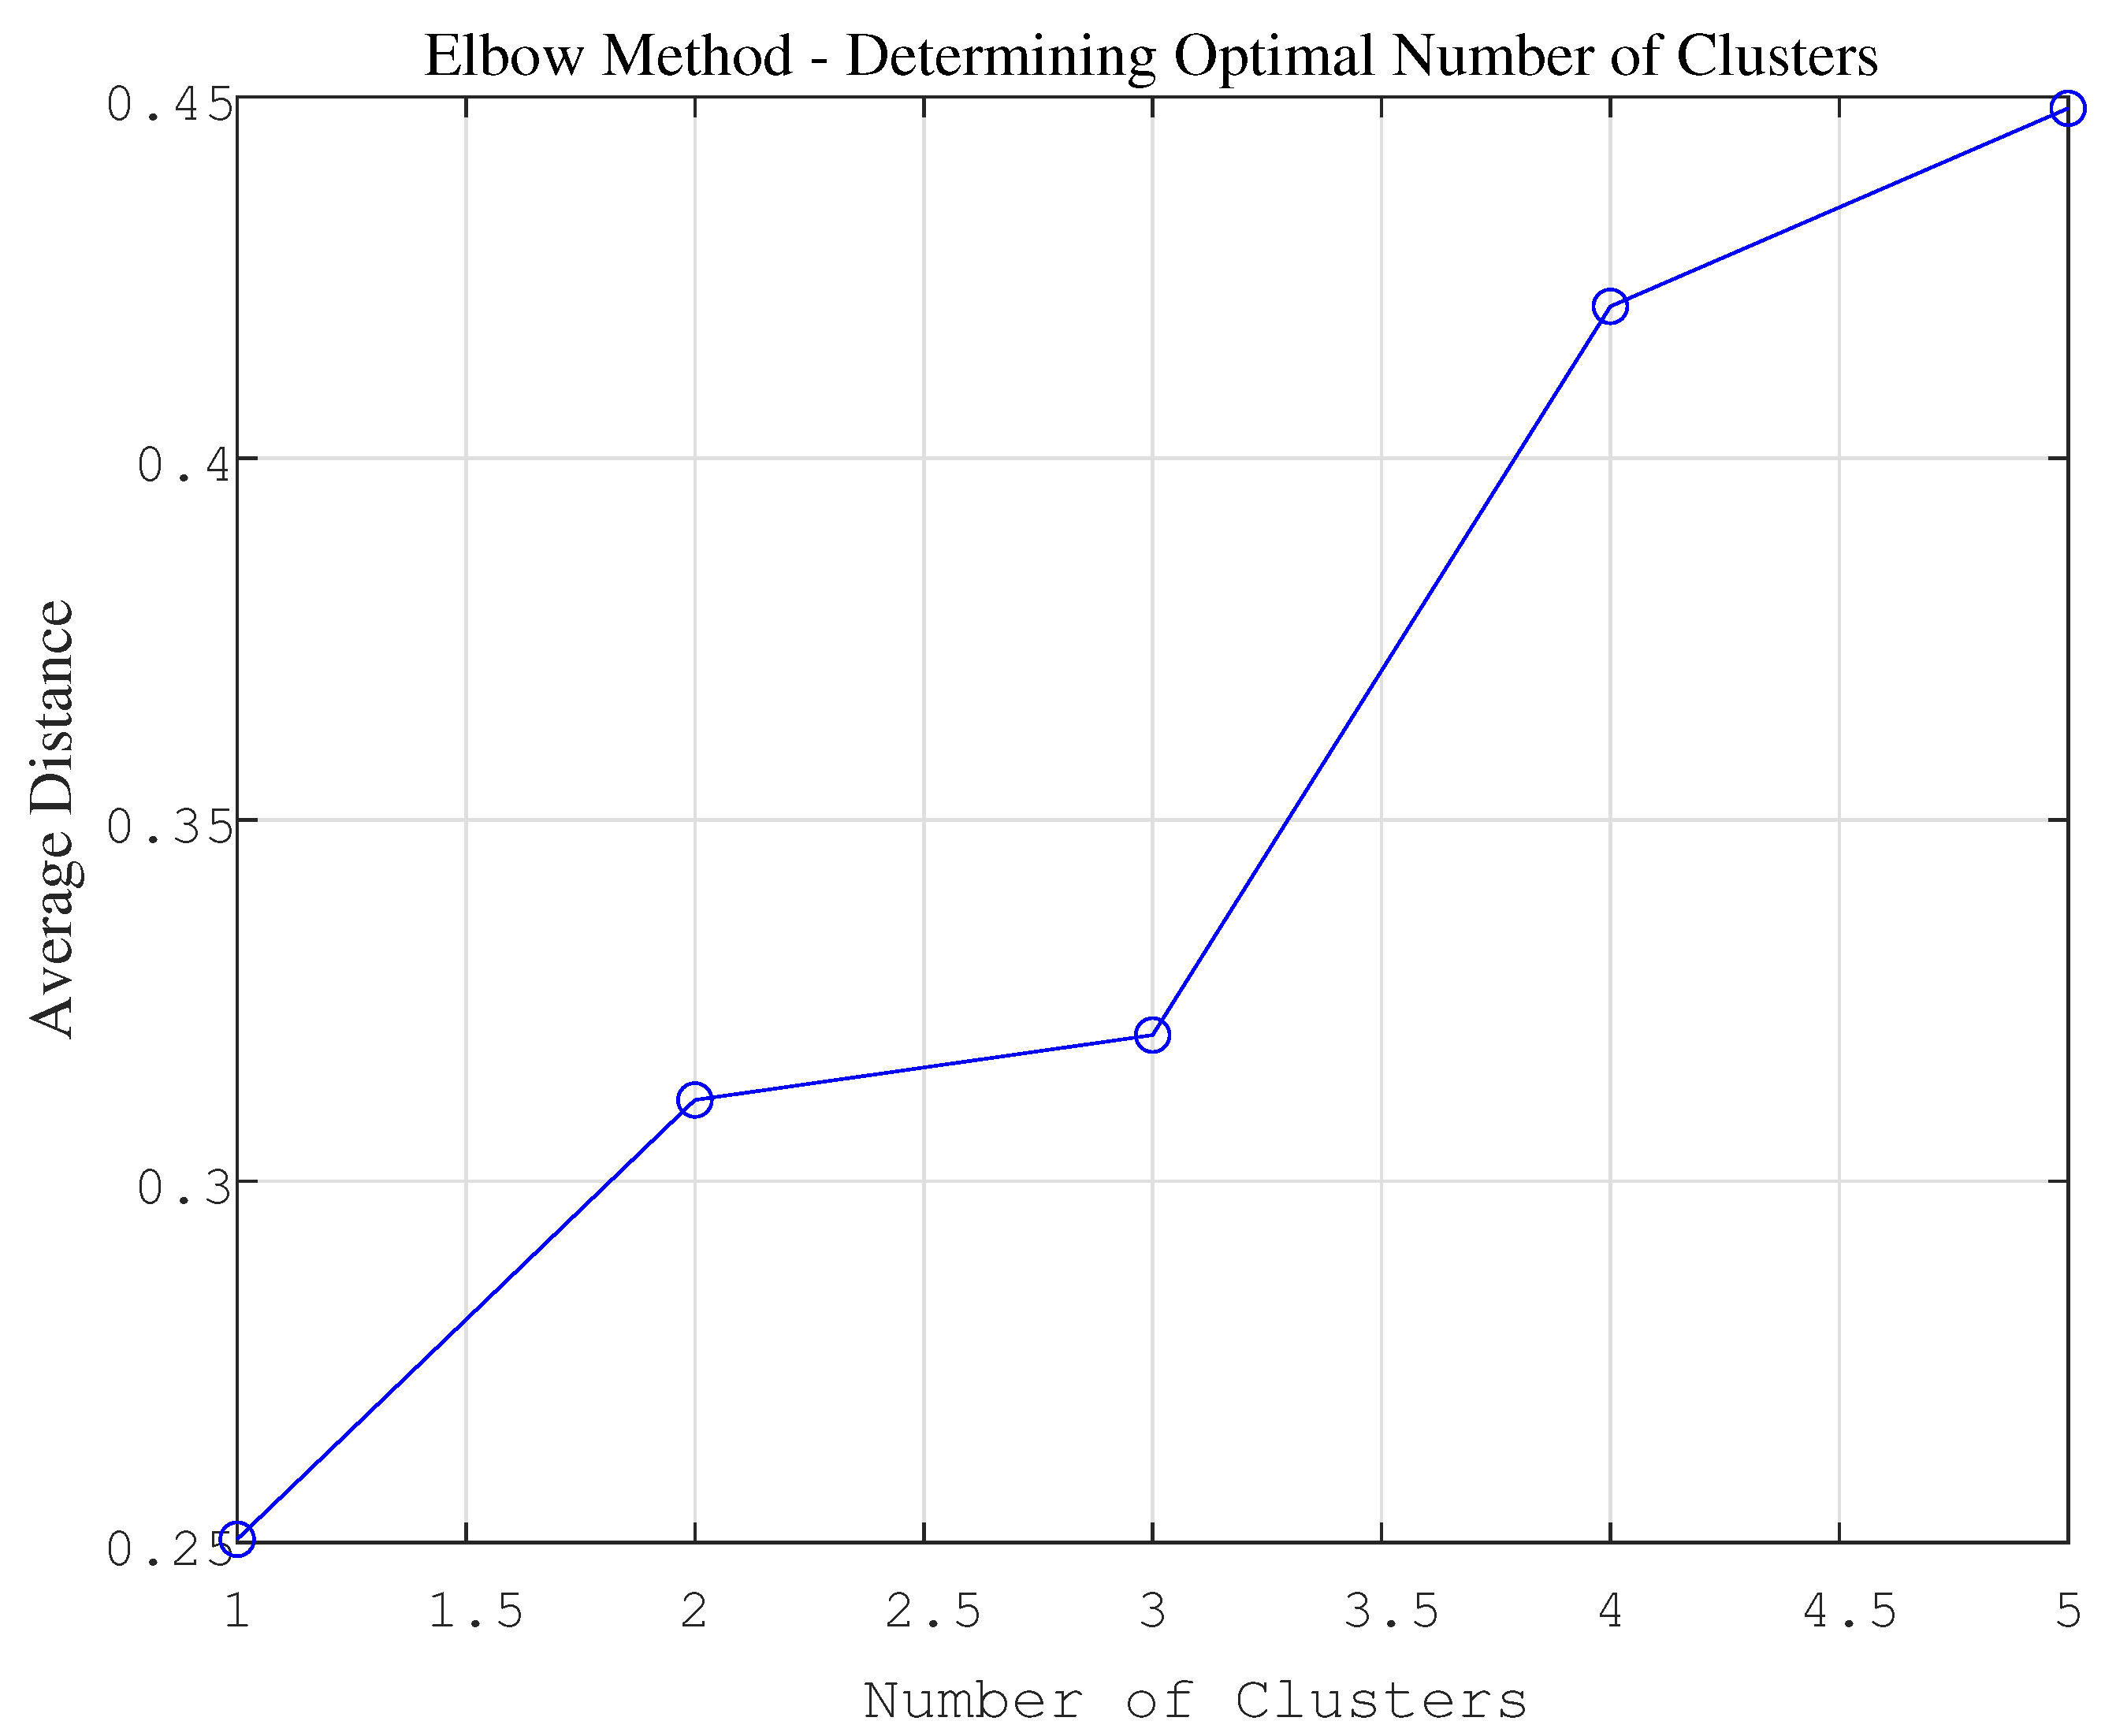
After identifying “charging current” as the core observation variable, the Elbow Rule was applied to determine the optimal number of clusters based on “charging current” as the clustering feature. As shown in
Figure 7, the optimal number of clusters is 3.
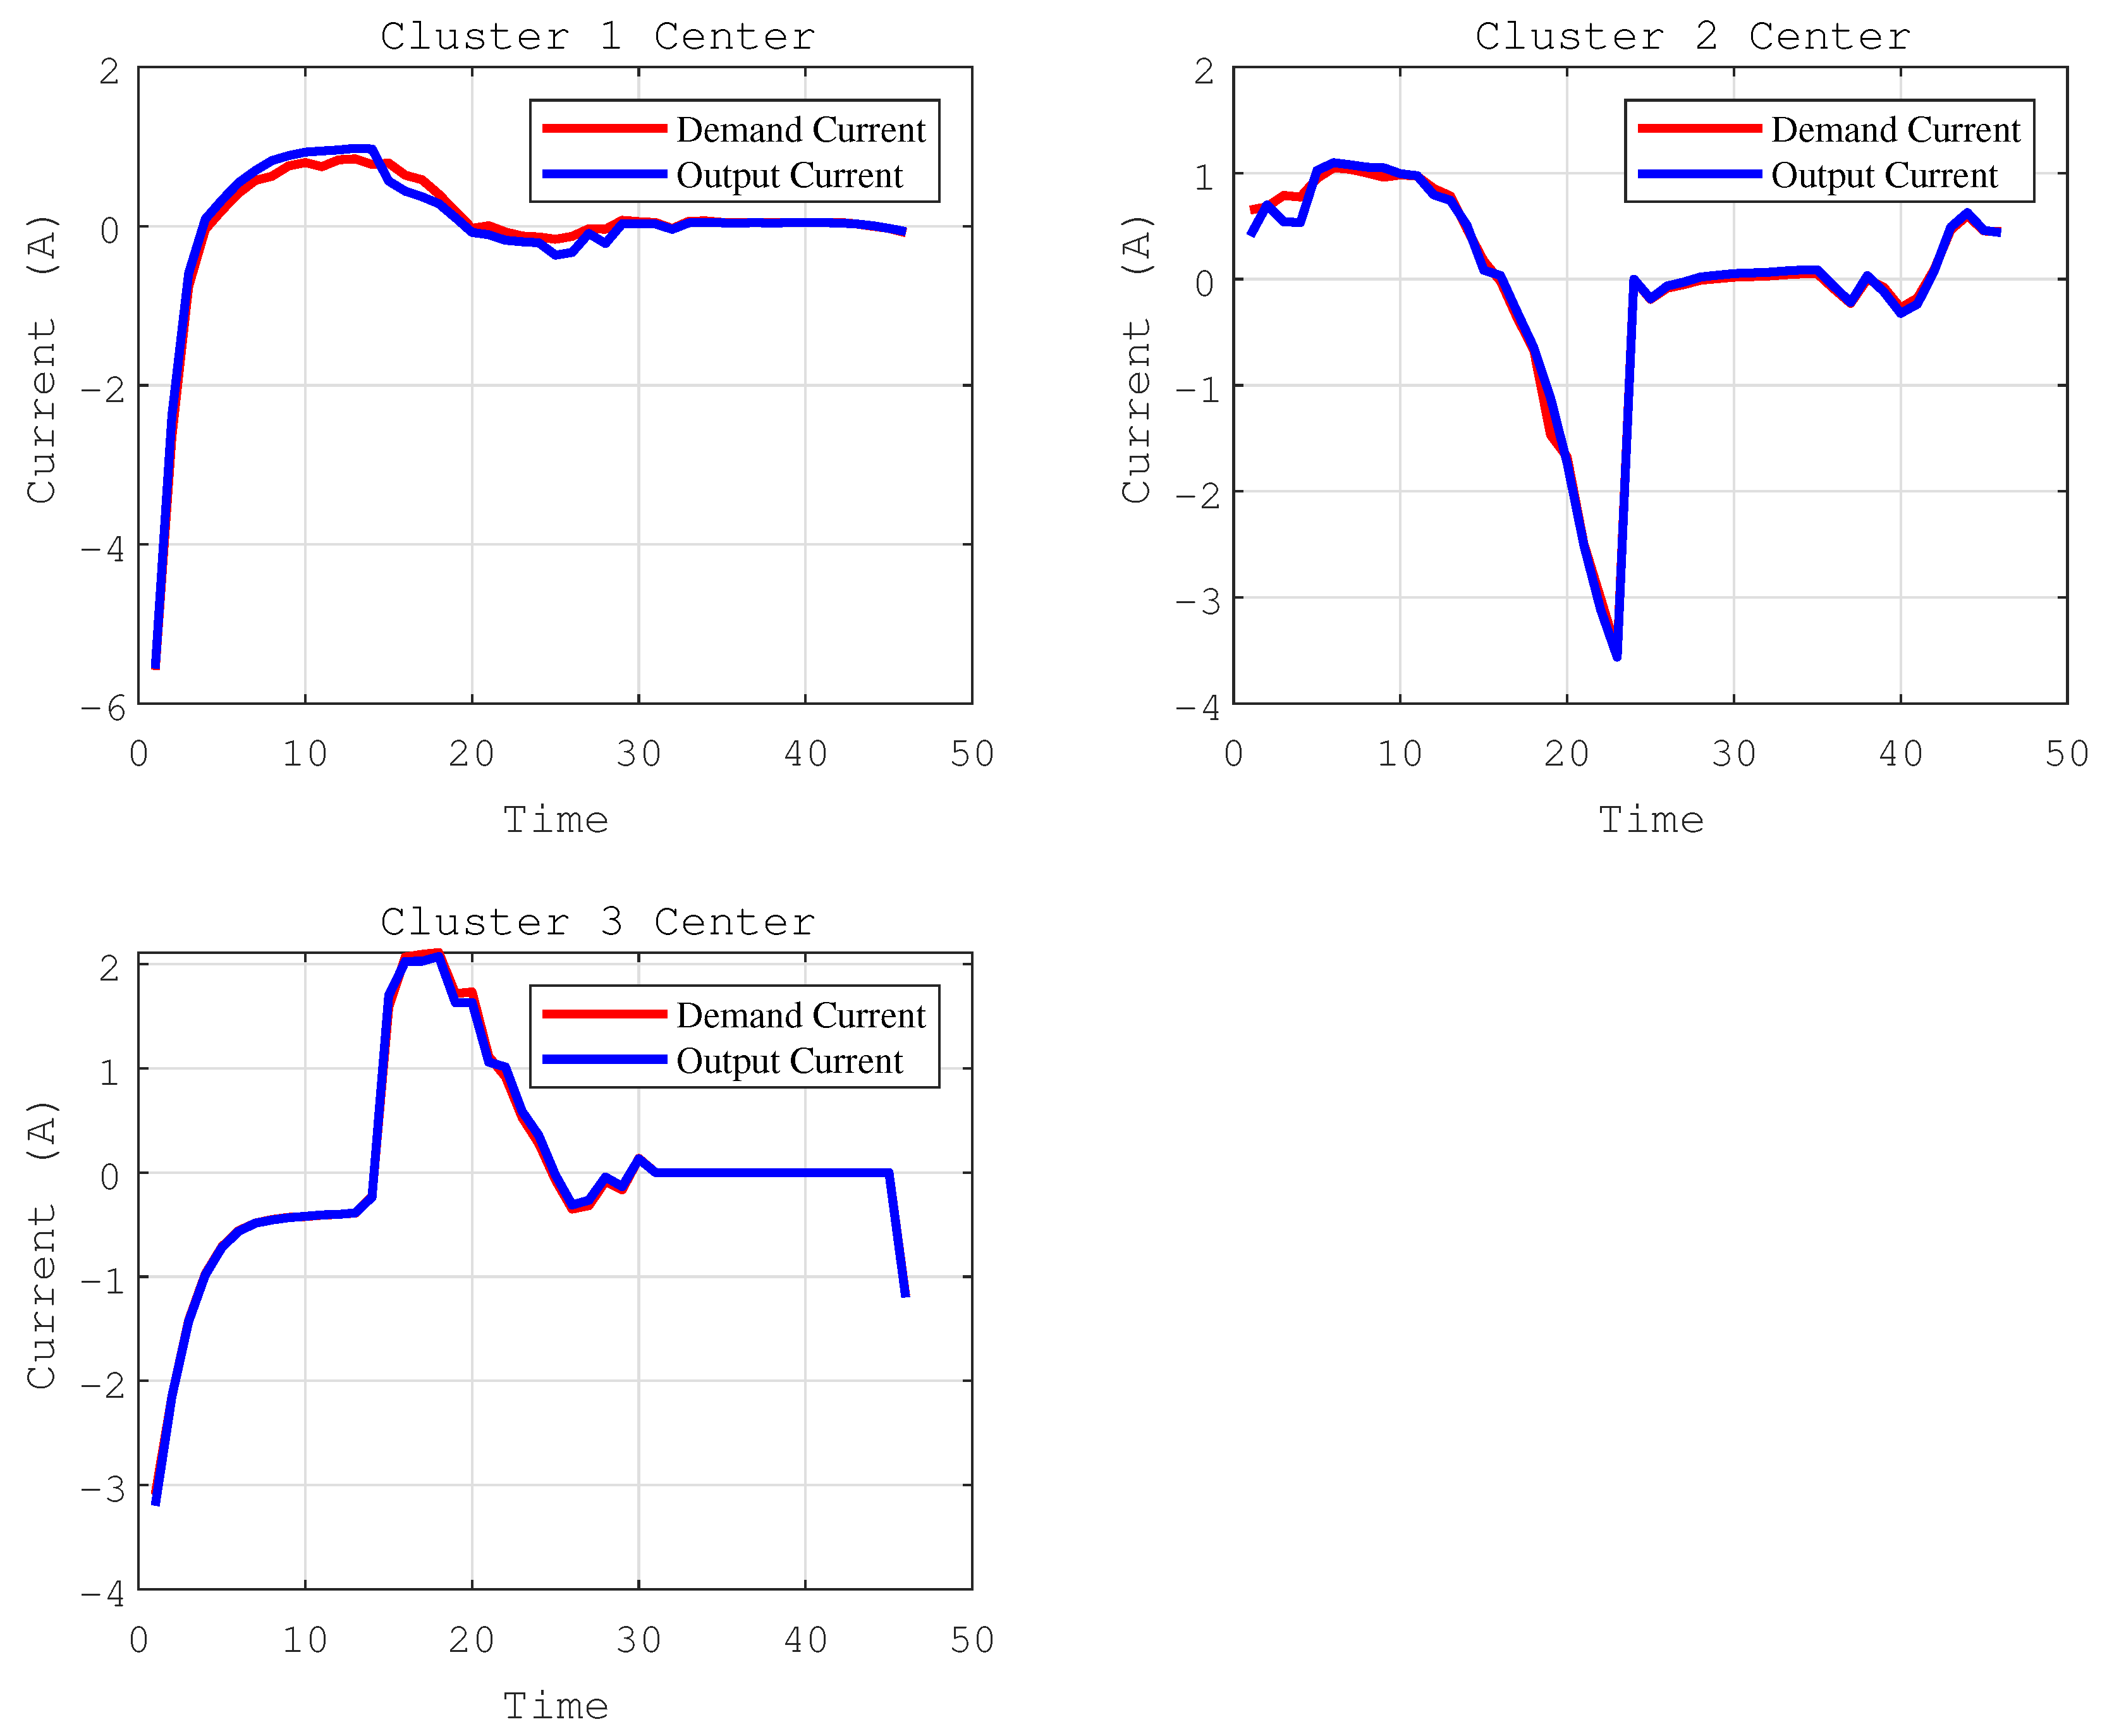
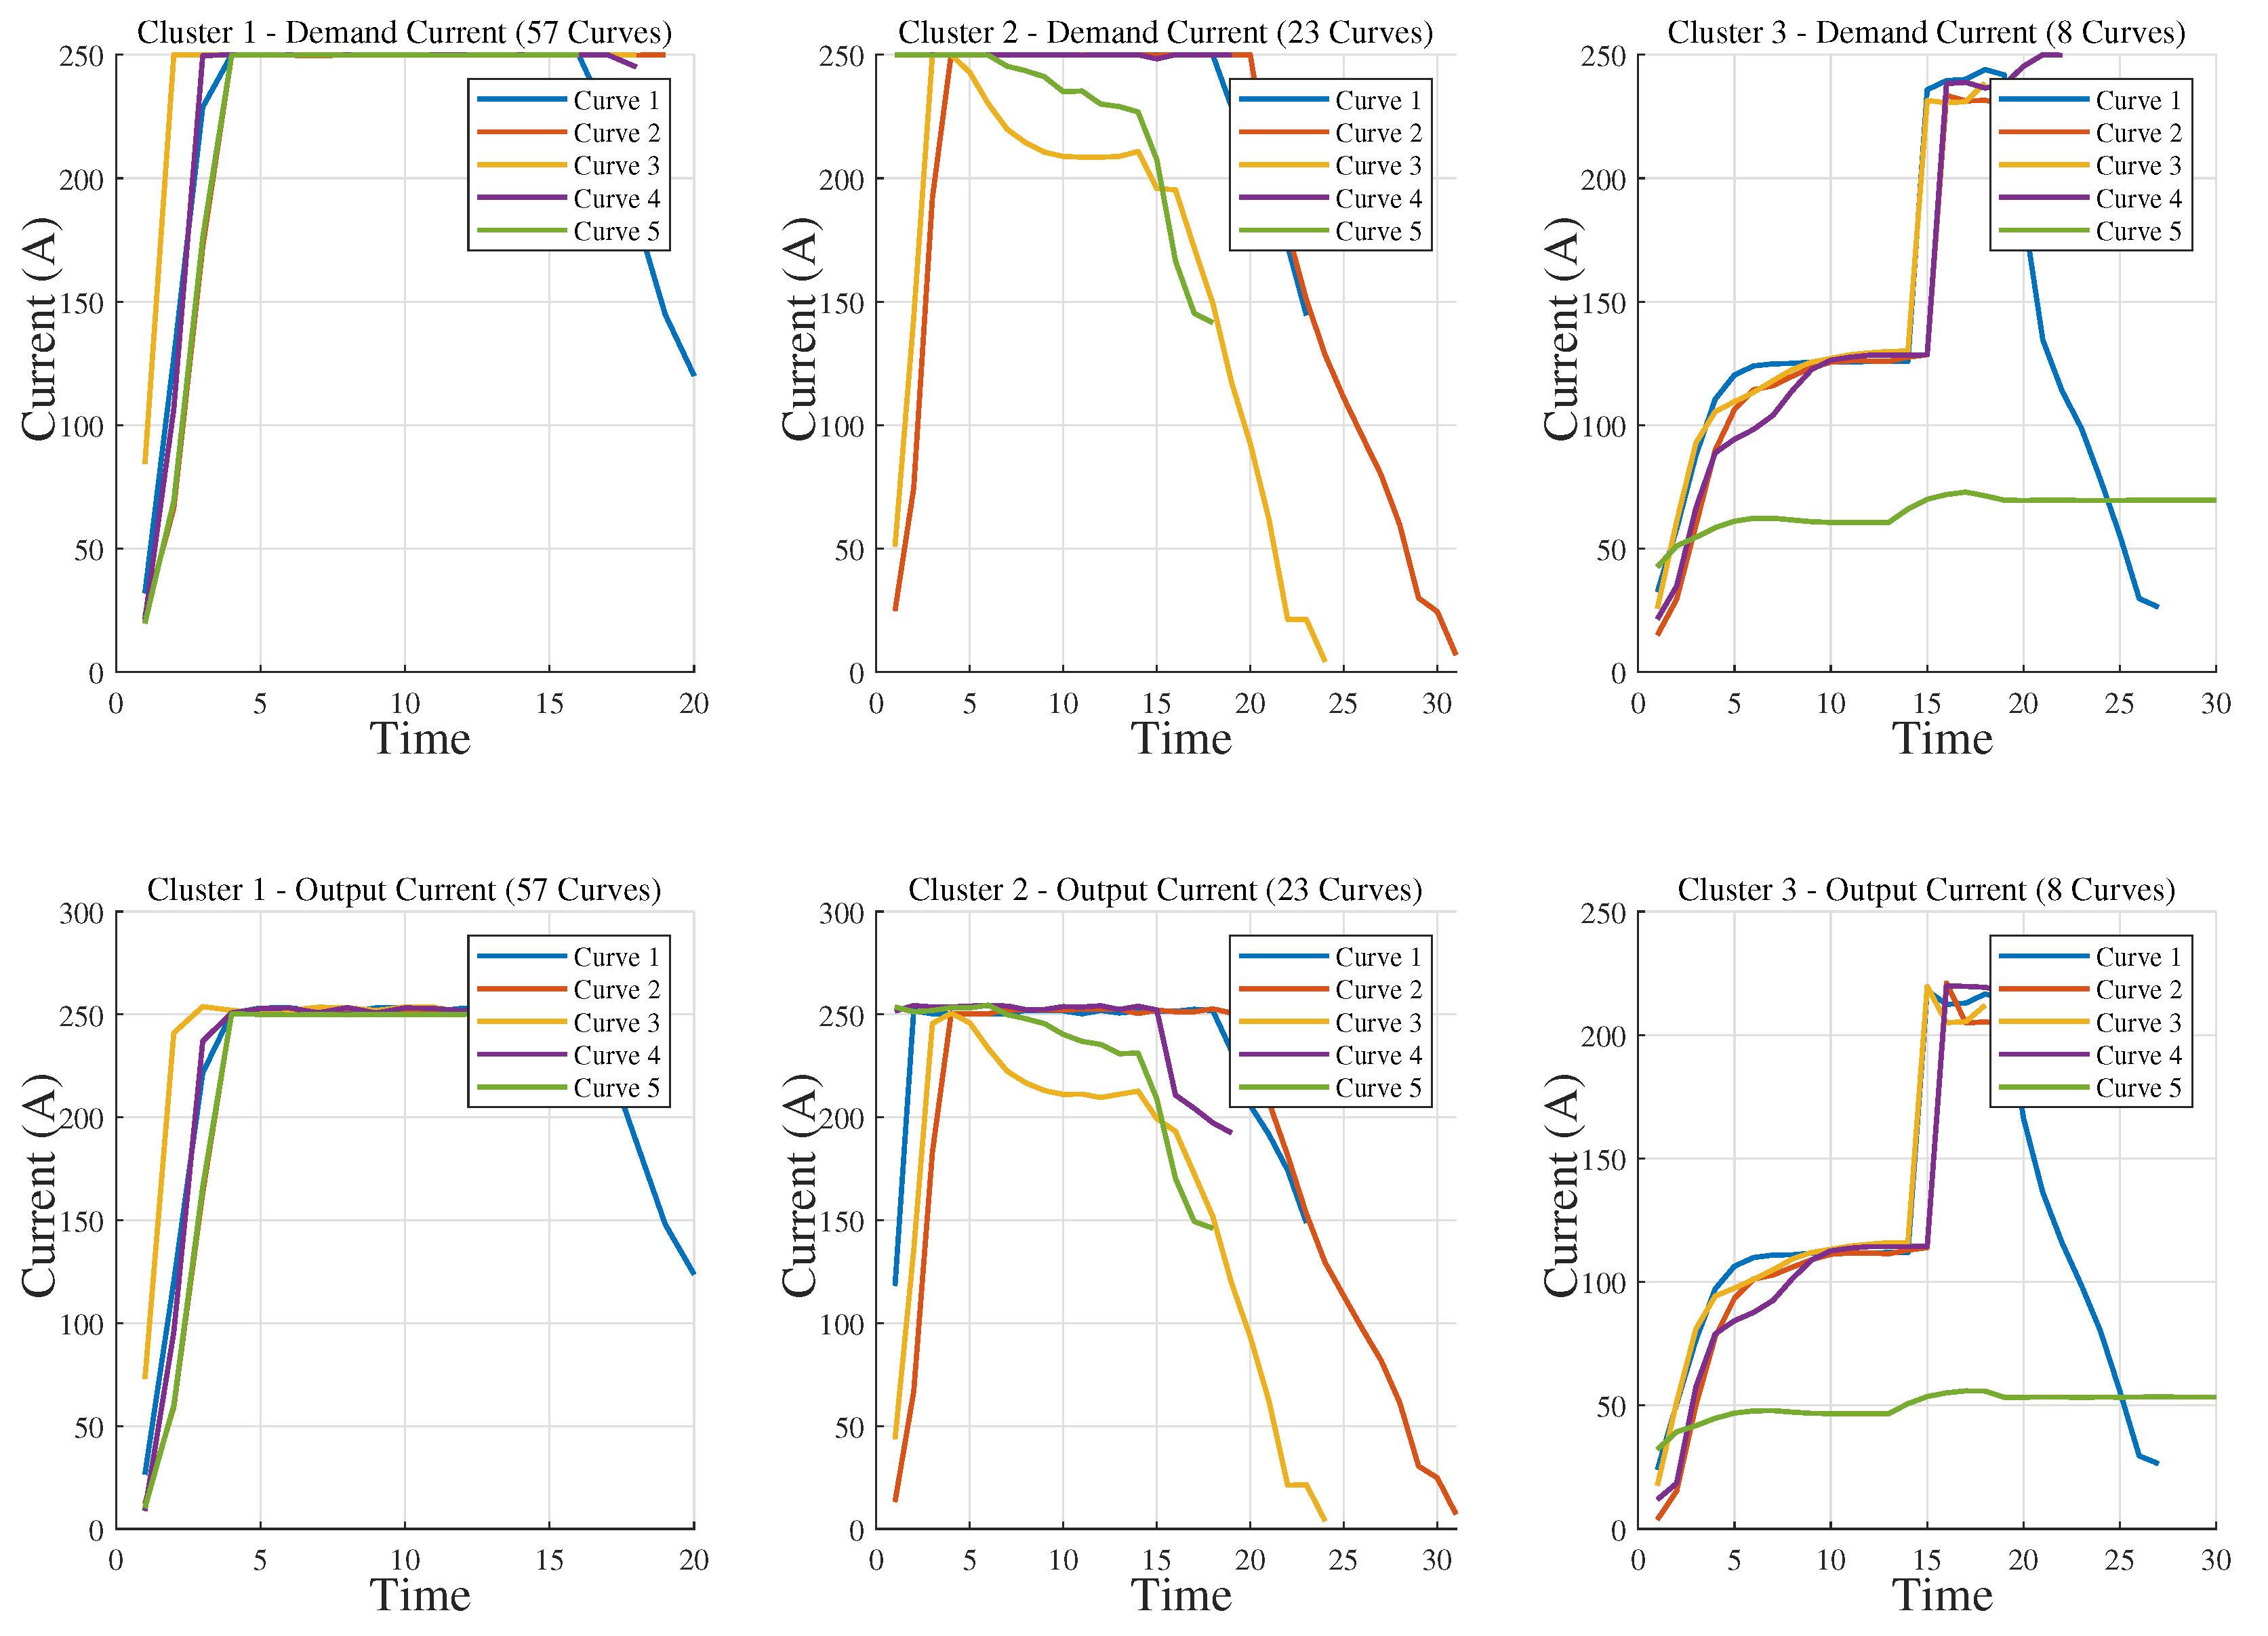
Using the k-shape algorithm based on three clustering levels, the 88 labelled charging processes were classified into three categories. The morphological characteristics of each category are shown in
Figure 8 and
Figure 9. In
Figure 9, the number in parentheses in each panel title indicates the total number of curves belonging to that cluster, whereas only five representative curves are plotted in each panel to keep the figure readable. The displayed curves were selected to show the dominant morphology of each cluster together with its centroid.
Cluster 1: Reference Operating Conditions. Contains 57 samples, accounting for 64.8%. The curves follow the standard CC-CV (constant current-constant voltage) charging pattern of “rapid rise—stable at high constant current—stepped decline at the end.” The red curve (demand current) and the blue curve (output current) at the cluster center highly overlap, indicating that the charging station can accurately respond to the vehicle BMS’s power requests, and the system is in an ideal state of “vehicle-station coordination.”
Cluster 2 (Oscillatory Conditions, 23 cases, 26.1%): The constant-current plateau phase exhibits high-frequency nonlinear oscillations, which may be associated with unstable regulation or thermal protection of the power modules; this constitutes a “suboptimal” operating state.
Cluster 3 (Degraded operating conditions, 8 cases, 9.1%): The output current remains significantly below the required current for an extended period, resulting in a severe “supply-demand gap.” The system is forced to enter a derated operating mode, causing a significant reduction in charging efficiency.
The fixed-label validation metrics in
Table 2 provide additional, but not uniformly stronger, support for the original clustering structure. A higher SBD silhouette and a lower Davies–Bouldin index indicate better separation and compactness; under the multivariate feature space, these two metrics improve slightly from 0.059 to 0.073 and from 2.854 to 2.686, respectively. However, the Calinski–Harabasz score, for which a higher value is preferable, decreases from 15.00 to 11.07. Therefore, the multivariate results should be interpreted as post-clustering validation of the physical meaning of the original labels rather than evidence that multivariate clustering is globally superior. The current waveform is retained as the primary clustering variable, while the additional variables are used to validate and interpret the cluster characteristics.
4.4. Anomaly Attribution: Quantitative Root Cause Analysis Based on Key Features
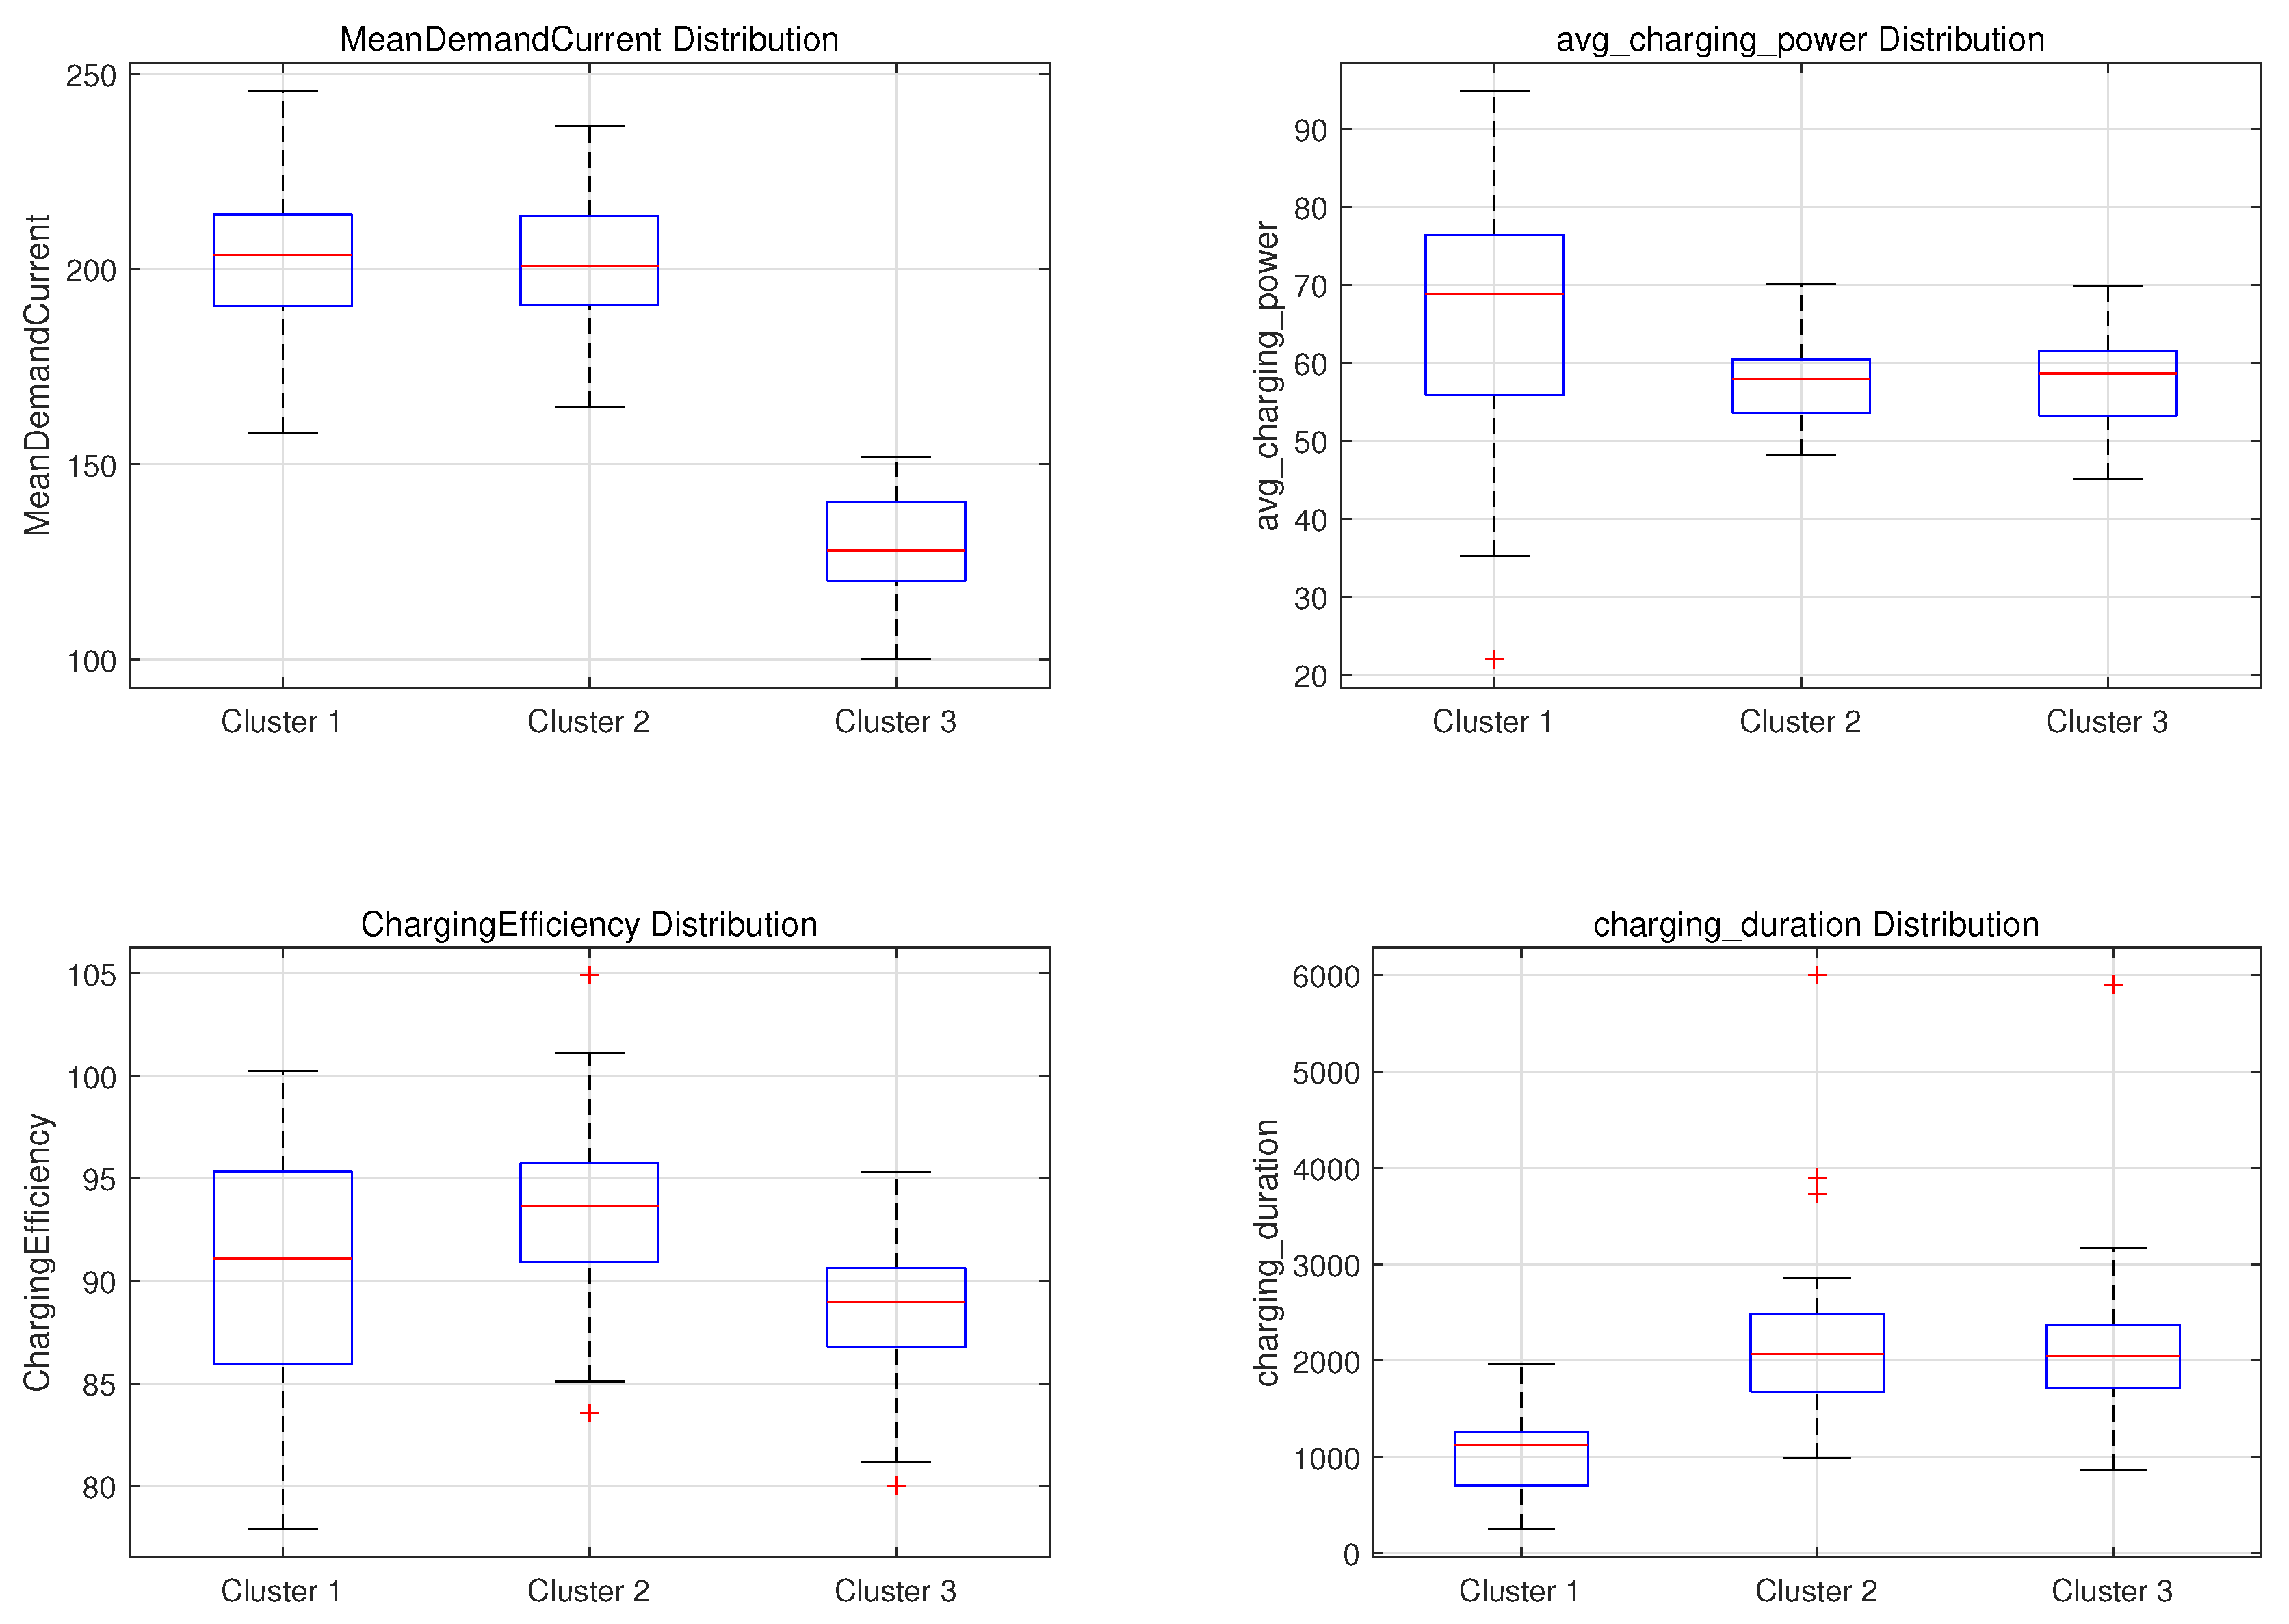
: These metrics represent the average demand current (A), maximum demand current (A), average charging power (kW), and charging efficiency (%) for each order. A box-and-whisker plot was used to analyze the distribution differences among the three clustering results (
Figure 10):
Reference Group: Average current of approximately 220 A, charging efficiency of 85–100%, average power of 32–85 kW, and extremely high energy transfer efficiency, consistent with the typical characteristics of high-power DC fast charging.
Oscillation Group: Current 170–250 A, power 40–80 kW; charging efficiency remains at 92–100%. This is classified as a “regulatory disturbance,” and no obvious energy transfer failure is observed.
Fault Group: Current drops to 100–150 A, with power output of only 32–60 kW, which is substantially below the rated 80 kW level of the chargers in the latest dataset and below the contemporaneous demand in many sessions. Charging efficiency generally falls below 90%, showing a precipitous decline.
Based on the characteristics of the fault group—“low power, low efficiency, and high supply-demand deviation”—and given that the same vehicle performed normally at other charging stations and that other vehicles at the same station were functioning properly, this study ruled out the possibilities of battery degradation and overall grid fluctuations. Logical deduction pointed to the “vehicle-charger interoperability” aspect. This inference is reported as a traceability result of the proposed diagnostic method; it identifies the most likely operational disruption mechanism and the priority object for inspection, but it should be confirmed by detailed charger logs before being treated as a final maintenance diagnosis.
This result is consistent with the explanatory hypothesis stated in the Introduction: insufficient compatibility between the communication protocols of specific vehicle model groups and specific charging stations, or limitations in hardware output capacity, may be associated with the third category of severe power anomalies. A possible mechanism is that the system fails to correctly identify the maximum power capacity during the handshaking phase, or cannot fully respond to commands during operation because of module derating or protection; under such conditions, the charger may enter a fail-safe derating mode.
4.5. Reproduction of Typical Failure Scenarios and Identification of High-Risk Combinations
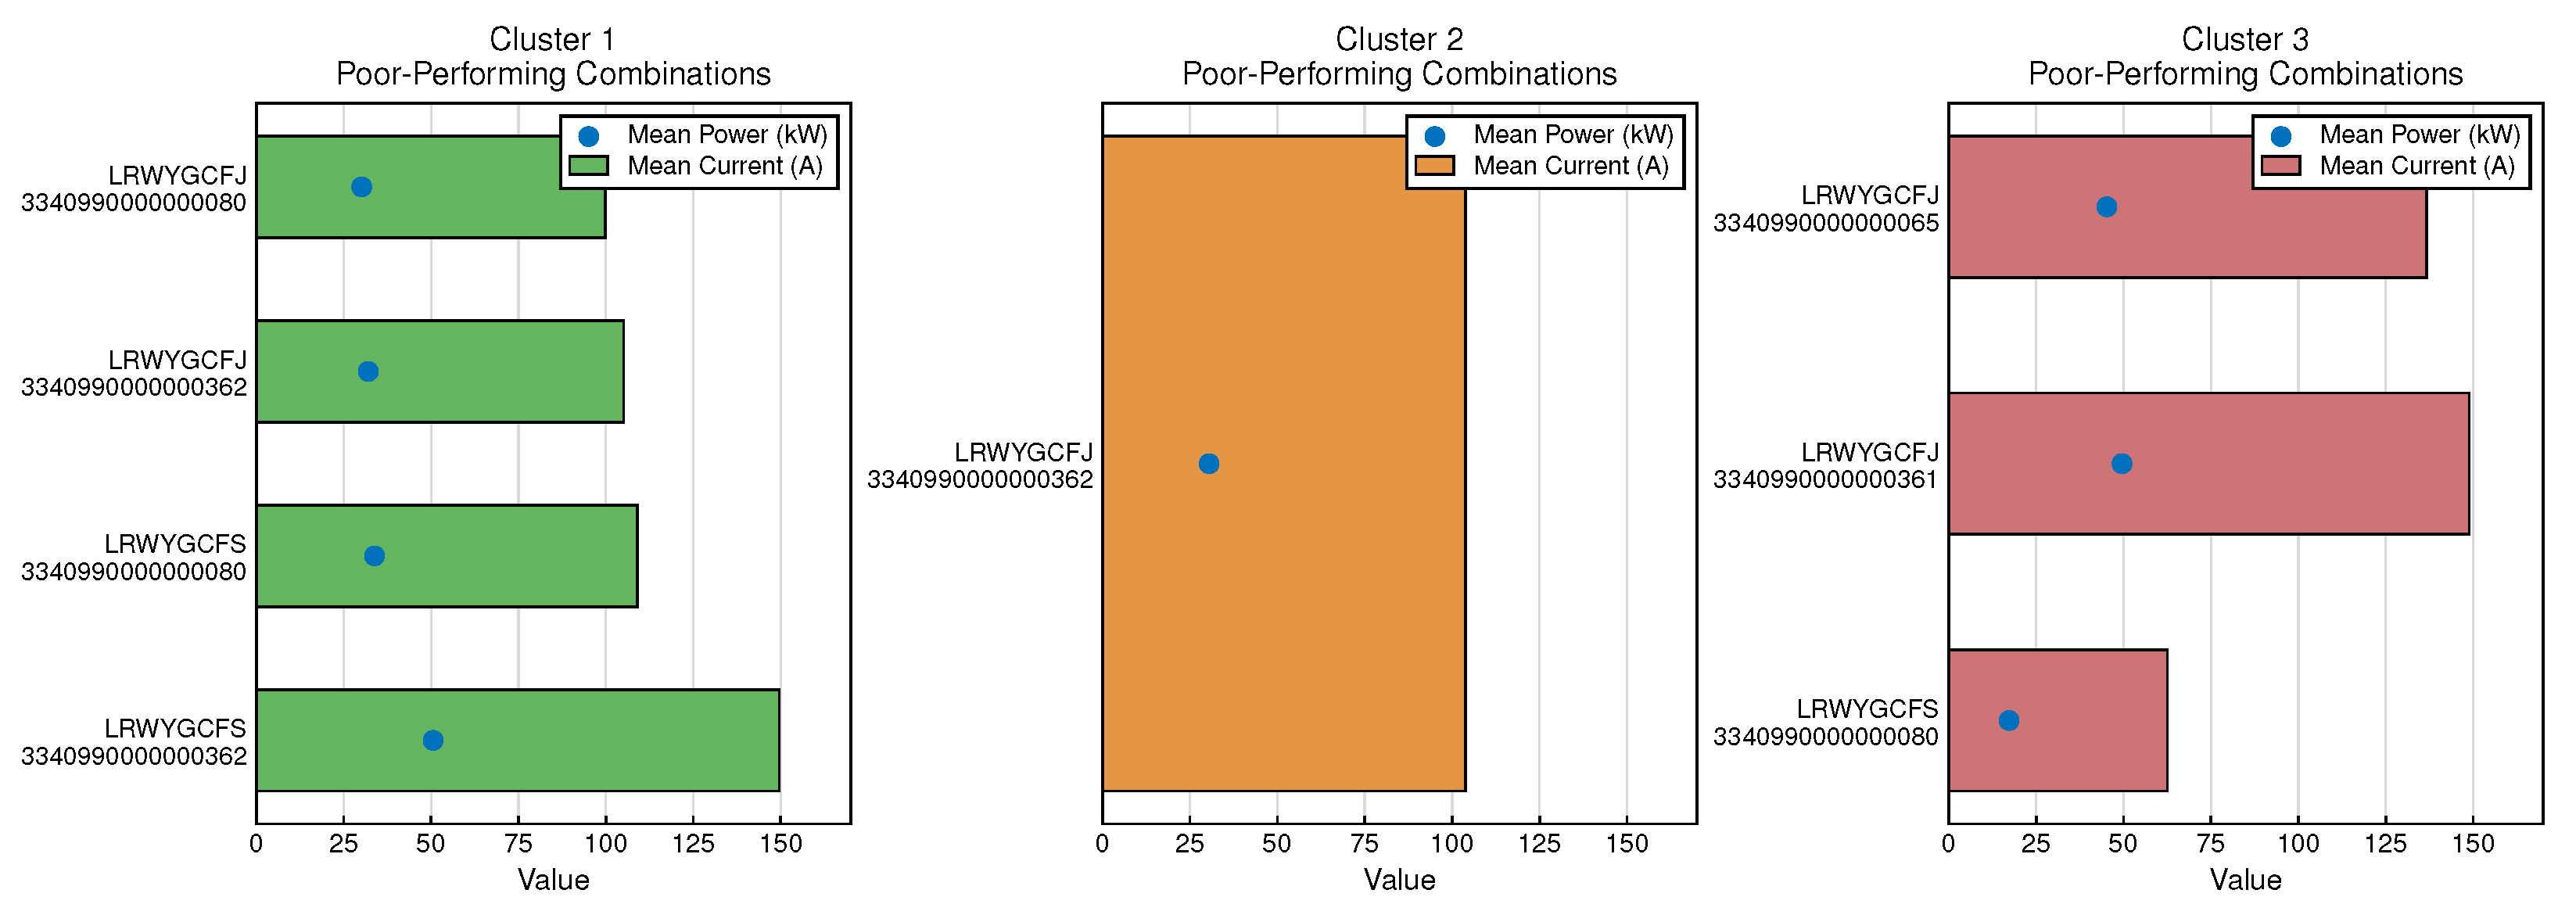
By constructing a three-dimensional tensor comprising “VIN-prefix vehicle model group–charging station ID–geolocation” to trace the trajectory of abnormal orders (
Figure 11), we identified high-risk scenarios involving specific VIN-prefix vehicle model groups and charging stations. In the latest dataset, the frequency statistics are reported using the first eight characters of the VIN field, such as VIN prefix LRWYGCFJ, to avoid treating each individual vehicle as an independent model group.
In the latest dataset, all chargers have a rated power of 80 kW. At charging station No. 080 at the Lingxi Service Area (Wenzhou-bound) on the Longliwen Expressway, 14 of 15 sessions showed a batch-level maximum output power below 50 kW. Within VIN-prefix group LRWYGCFJ, all 11 sessions at this charger met this low-power criterion, corresponding to an observed recurrence rate of 100%. Because this percentage is still calculated from a limited number of sessions, it is reported together with the absolute count and is used as high-priority traceability evidence rather than conclusive proof of fault responsibility.
Table 3 reports the frequency statistics by VIN-prefix vehicle-model group, charger ID, and charging station. VIN-prefix group LRWYGCFJ meets the minimum reporting criterion, whereas LRWYGCFS and LRWYGCEK are retained only as supplementary descriptive rows because their total observations are below the threshold. Therefore, the result is used to prioritize equipment inspection rather than to assign final fault responsibility. The station-level summary shows that low-power operation recurred frequently at charger No. 080, while one session reached high output power, supporting an intermittent or operating-context-related limitation rather than a permanently fixed capacity loss.
Upon reviewing the latest historical records for Charging Station No. 080, the rated charger power is 80 kW. Among the low-power sessions at this charger, the largest batch-level maximum output power was 42.41 kW, corresponding to 53.0% of the rated power, and the median batch-level maximum output power was 40.42 kW, corresponding to 50.5% of the rated power. One session reached 86.40 kW, indicating that the low-power phenomenon should be interpreted as intermittent or operating-context-related derating rather than permanent station-wide capacity loss. Therefore, this charger should be prioritized for inspection of power-module derating, cooling-system protection, and controller response records.
To further examine whether this low-power pattern was reflected in operation records, charger No. 080 was cross-checked with the full order table, the stop-reason dictionary, and the charger fault-query records. The full order table contains 117 orders for this charger, among which 115 were associated with normal stop reasons and only two were abnormal; both abnormal stop reasons were related to vehicle/BMS-side events rather than charger-side maintenance or repair. For the 15 dynamic charging sessions analyzed in this case study, all orders were matched in the full order table: 14 had normal stop reasons and one had a vehicle-side BMS abnormal termination.
The charger fault-query records further show two communication-related entries for charger No. 080 in July 2025: one general communication fault from 8 July 09:57:01 to 13:00:00 that generated a maintenance work order, and one severe charger-controller communication-timeout event from 28 July 14:04:32 to 14:05:09. These records indicate that charger-side communication abnormalities did occur during the same operating month. However, they do not provide complete cooling-system status, power-module error codes, protocol-negotiation traces, or maintenance conclusions directly tied to the analyzed low-power sessions. No explicit cooling-system, power-module, over-temperature, or maintenance-confirmed derating record was directly linked to these low-power sessions.
Accordingly, the observed low-power pattern is not claimed as a physically confirmed charger fault. Instead, it is interpreted as operational traceability evidence for a latent power-limitation pattern that is not fully captured by conventional stop-reason records. The fault-query evidence strengthens the need to prioritize communication/controller-log inspection together with power-module and cooling-system checks, while final physical confirmation should still be made after detailed charger-side controller logs, protocol-level records, and maintenance conclusions are linked with the identified sessions.
Here,
is the observed low-power-session capacity ratio,
is the largest batch-level maximum output power among the low-power sessions in kW, and
is the rated charger power in kW.
4.6. Comparison of Typical Operating Conditions and Interoperability Validation
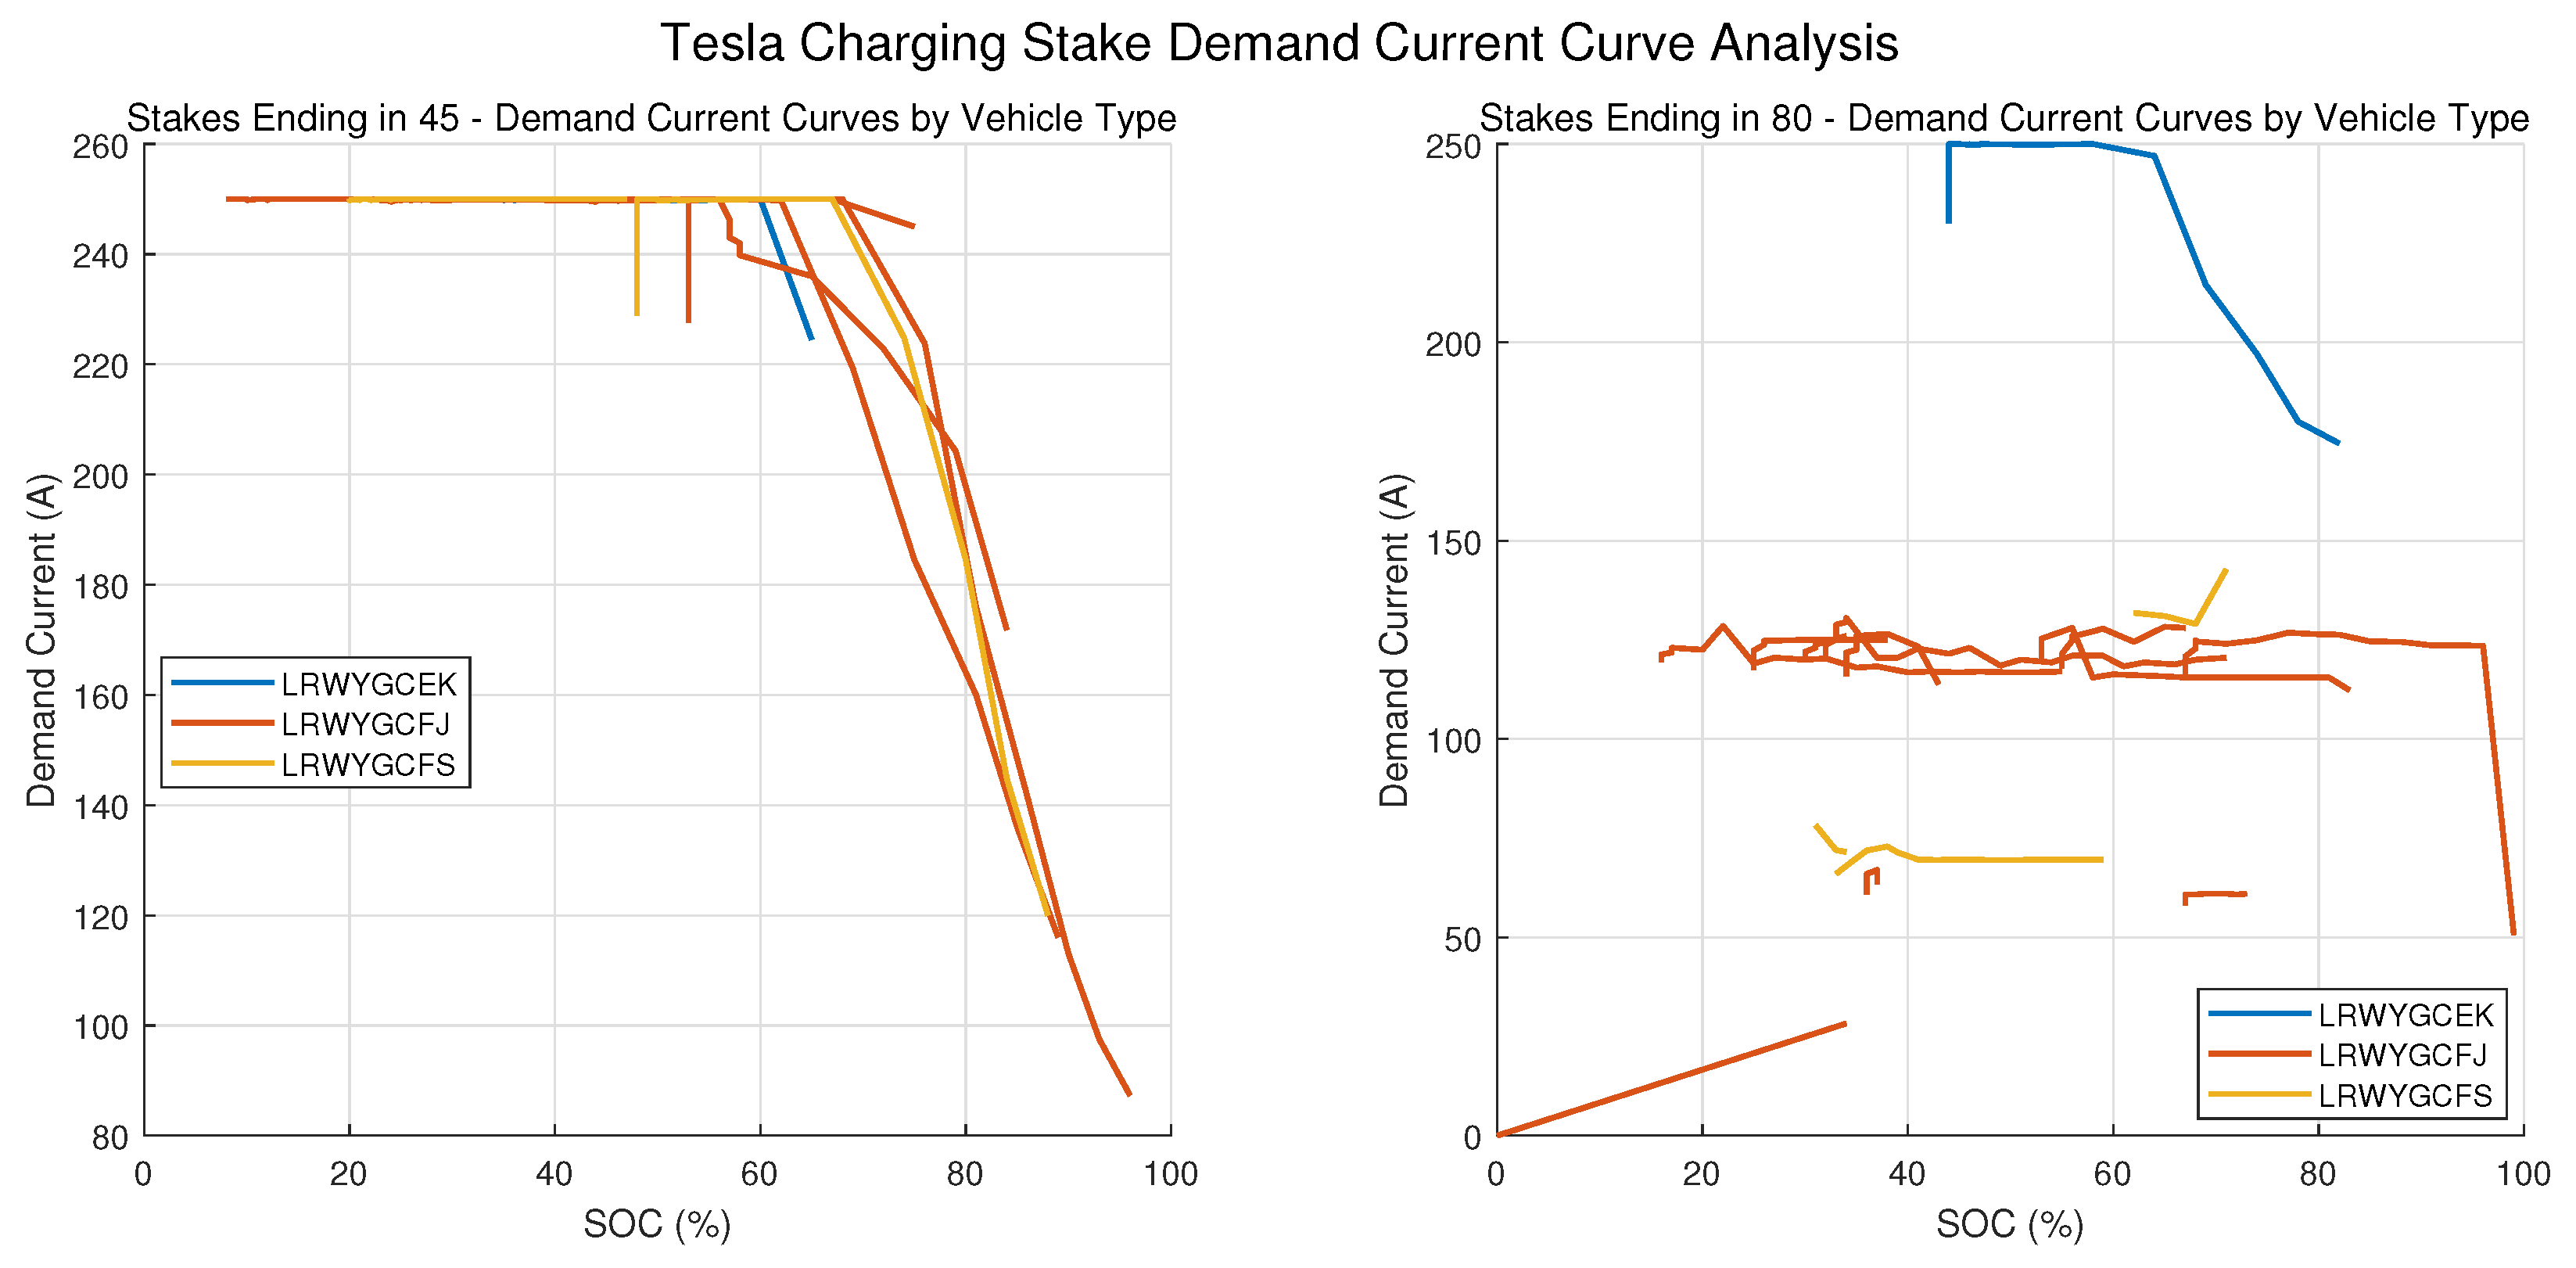
A comparison of the charging curves for the representative high-risk VIN-prefix vehicle model group at the normal charging station (No. 045) and the abnormal charging station (No. 080) (
Figure 12): The curve for the normal charging station is full and stable, closely following the demand curve; the curve for the abnormal charging station exhibits distinct “clipping” and “sagging” characteristics, accompanied by significant supply-demand discrepancies, which provides curve-level evidence for a possible interoperability or output-capacity limitation.
5. Conclusions
This study developed and validated a multi-source data-fusion and k-shape clustering method for identifying latent degradation and tracing high-risk interaction patterns in EV charging infrastructure. The intended objective was achieved in three respects. First, the correlation analysis reduced the observation object from multi-dimensional operating records to the current time series, which preserved the dynamic vehicle–charger interaction process while reducing redundant feature interference. Second, the k-shape clustering procedure separated 88 labelled complete charging cycles into three interpretable operating patterns: reference operation, oscillatory operation, and degraded power-limited operation. Third, conditional-probability tracing localized a high-risk charger scenario: at charger No. 080, 14 of 15 sessions showed batch-level maximum output power below 50 kW, and all 11 sessions for VIN-prefix group LRWYGCFJ met this low-power criterion.
The results indicate that identifying improper vehicle–charger interaction can provide practical guidance beyond diagnosis. For charging-network operators, the method can prioritize chargers for capacity testing, cooling-system inspection, power-module replacement, protocol-handshake verification, and firmware or control-parameter upgrades. For charging-service platforms, the same output can be converted into operational rules, such as avoiding known high-risk vehicle–charger combinations, recommending alternative nearby chargers, or issuing early warnings before a driver selects a station during highway travel. Thus, the proposed method is not limited to fault labeling; it also supports maintenance scheduling, charger-upgrade prioritization, and user-facing charging guidance.
The present case study was conducted within a regional charging network for which both order-level records and dynamic time-series measurements were available. Therefore, the method can be transferred to other chargers or networks only when equivalent data access is provided by the operator, charging-service platform, or asset owner. In addition, the inferred causes should be regarded as statistical traceability clues rather than final physical confirmation. Future work will connect the diagnostic results with charger controller logs, cooling-system status, power-module alarms, protocol negotiation records, and maintenance work orders, and will evaluate whether vehicle-model-specific operating modes can further reduce repeated power-limitation events.