1. Introduction
Decarbonization of urban transport is essential to reduce greenhouse gas (GHG) emissions and mitigate the effects of climate change. Diesel-based public transportation systems are among the primary sources of emissions in urban areas. In Brazil, for example, the transport sector emitted a record 224 million tons of CO
2 in 2023, driven primarily by diesel consumption [
1]. In this context, electrification of public fleets through battery electric buses (BEBs) has emerged as a strategic alternative to improve air quality and reduce dependence on fossil fuels.
While hydropower remains the main source of electricity in Brazil, the system is not entirely renewable in practice. During recurring droughts, when reservoirs reach critical levels, thermal plants running on oil, coal, and natural gas are called upon to keep the supply stable, increasing both costs and emissions. For this reason, photovoltaic (PV) generation plays an important complementary role, since it is not tied to hydrological conditions and can provide additional security to the system. Another advantage is that photovoltaic installations can be placed directly in urban areas, for example, bus depots or terminals, very close to the charging points of battery electric buses (BEBs). Locating generation near the demand reduces transmission losses, postpones the need for network reinforcements, and allows local energy management strategies that large hydro plants, concentrated in distant regions, cannot provide. Brazil’s regulatory framework also encourages distributed generation, with policies such as ANEEL’s normative Resolution 482/2012 and its subsequent updates, which have made photovoltaics financially attractive in urban projects. Together, these factors explain why photovoltaics should be considered alongside BEBs, even in a system still dominated by hydropower: they add diversity, increase resilience, and strengthen long-term sustainability.
Several international studies have demonstrated the technical feasibility and environmental benefits of this transition. The authors in [
2] conducted a life cycle analysis of BEBs, indicating significant reductions in emissions and energy consumption compared to diesel vehicles. In [
3], the operation of BEBs in Madrid has been analyzed, highlighting the importance of charging strategies for energy efficiency and battery life. The integration of photovoltaic generation into the terminals was investigated in [
4], noting that although solar energy can reduce peak demand in the grid, it can also cause reverse flows and overvoltages during periods of low load.
To mitigate these effects, vehicle-to-grid (V2G) projects in Europe, China, India, and the United States are already exploring the use of fleets as a source of grid energy [
5]. Recent studies have proposed intelligent charging algorithms and operating strategies [
6,
7,
8]. Ref. [
9] presents a comprehensive review of the integration of electric vehicles (EVs) into power grids, with a particular focus on V2G operation. A comparison of three different innovative change strategies, considering non-coordinated, bottom-up coordinated, and top-down coordinated control categories, has been presented in [
7]. The study demonstrates that power quality issues on the grid side can be mitigated by selecting the appropriate smart charging strategy. Ref. [
8] discusses the limitations of technical requirements related to battery degradation, communication protocols, and cybersecurity associated with grid connectivity and V2G technologies. Previous V2G cases have been analyzed considering the application of recent technologies.
The authors in [
10] presented an optimization model based on dynamic pricing to minimize the impacts of charging on the distribution grid. In [
11], a feasibility study considering the Manchester Science Park electric fleet with 50 vehicles for V2G as a case study concludes that the V2G strategies can lead to economic savings of GBP 400,000 in ten years.
In [
12], the technical and economic feasibility of using V2G buses for ancillary services, such as frequency regulation and reduction of peak demand, was analyzed, but warned about the risks of instability if the operation is not properly coordinated. Similarly, the authors in [
13] demonstrated that coordinated control of BEB fleets can increase grid reliability when real-time constraints are considered.
Despite these advances, many studies still rely on theoretical models or simplified representations of the power grid. Reference [
14] points out that the use of real-world data, including power consumption and feeder constraints, is essential to understand the actual operational limits of the integration of the electric fleet, particularly in urban areas with weak infrastructure.
Feeder-level studies also highlight technical challenges that are often overlooked in higher-level planning. For example, ref. [
15] has developed a feeder reconfiguration strategy to reduce losses in distribution systems with a high penetration of electric vehicles, considering the real topology of the grid.
Other researchers explore policy, economic, and spatial planning perspectives, but often neglect the physical constraints of actual distribution feeders [
16]. For example, ref. [
17] reviewed regulation and market integration strategies for electric vehicles but did not take into account the behavior of the real-time network.
As reported in [
18,
19,
20,
21], recent studies in the Latin American context remain limited. Although some initiatives model urban electrification in specific Brazilian cities [
22,
23,
24,
25], comprehensive technical analyses based on GIS-integrated feeder data are still lacking, particularly in scenarios involving large BEB fleets and bidirectional energy flows through V2G technology. To address these limitations, this study presents a novel comprehensive technical analysis based on GIS-integrated feed data from the real world in a Brazilian urban centre, evaluating large BEB fleets and bidirectional energy flows using V2G technology.
Given these gaps, in this paper, a detailed technical analysis of BEB charging and distributed generation integration is presented based on real data from a medium voltage feeder serving a medium-sized city in an emerging economy.
Using real GIS data from an urban feeder in Cuiabá, Brazil, OpenDSS simulations were conducted to evaluate the network’s performance in various electrification scenarios, including those with and without photovoltaic generation and with the vehicle-to-grid (V2G) application.
This study makes the following key contributions to the existing body of knowledge:
The simulations performed revealed that reverse flows can induce voltage violations and thermal overloads even in grid segments located far from the generation source, particularly in areas with ageing infrastructure and undersized conductors. Such spatial effects can only be identified through detailed real-network modeling, which has not been thoroughly investigated in previous works.
The combined presence of BEB charging and photovoltaic generation creates complex load–generation interactions that vary over time and between locations, requiring fine-grained coordination to prevent unbalanced voltage profiles and power quality issues. Our results demonstrate how these dynamics manifest themselves in a realistic urban feeder.
We evaluated reinforcement schemes considering different rated sections of the conductors, showing how strategic upgrades can mitigate voltage violations and thermal overloads while extending the feeder hosting capacity. This provides a practical pathway for distribution utilities to plan targeted investments in ageing networks.
The integration of V2G strategies under coordinated dispatch is shown to stabilise voltage levels and reduce peak loads without exceeding conductor ampacity. This highlights the potential of electric bus fleets to provide adequate grid support when operational and network constraints are explicitly considered.
Although this study focusses on Cuiabá, its contributions are broadly applicable. It offers a scalable roadmap that can be adopted by cities around the world to accelerate low-cost, zero-emission urban mobility. More than a case study, this work provides a disruptive redprint for policymakers, transportation agencies, and stakeholders in the energy sector to accelerate electrification.
In addition, the findings are of special significance for regions like Mato Grosso, where electricity transmission and distribution systems face growing constraints due to increasing demand. By modeling real-world feeder behavior under electrification and distributed generation scenarios, this study provides a tool to identify localized reinforcement needs, promote the strategic use of local energy resources, and ultimately reduce the stress on the broader transmission infrastructure.
The remainder of this paper is structured as follows.
Section 2 describes the proposed methodology for converting GIS-integrated distribution data into simulation models using {OpenDSS (Version 9.6.1.1, Electric Power Research Institute—EPRI, Palo Alto, CA, USA).
Section 3 introduces the case study based on a real distribution feeder in Cuiabá, Brazil, detailing the modeling of electric bus charging, photovoltaic generation, and vehicle-to-grid operation.
Section 4 presents the mathematical formulation adopted for the power flow simulations.
Section 5 discusses the results obtained under different electrification scenarios, including sensitivity analyses of feeder capacity and reinforcement strategies. Finally,
Section 6 summarizes the main findings and outlines directions for future research.
2. Methodology
The proposed methodology for feeder simulation is based on the conversion of the Geographic Database of the Distribution Company (BDGD,
i.e., Banco de Dados Geográfico da Distribuidora in Portuguese) data using dataset “Energisa_MT_405_2023-12-31_V11_20250210-1825” (Version 11) provided by National Electric Energy Agency (ANEEL) [
26], enabling the extraction of technical characteristics for various entities of the electrical system. Initially, these data are extracted using QGIS 3.34.16 Prizren software and exported to Excel spreadsheets, which must then be interpreted following the guidelines established in the BDGD manual. Subsequently, these spreadsheets are imported into the Google Colab environment, where relevant data are filtered and structured to generate the DSS files used for simulation in OpenDSS.
Figure 1 presents the flow chart of the methodological process, which highlights the main steps from data extraction to the final simulation in OpenDSS.
Converting BDGD Data to OpenDSS
The BDGD is a georeferenced model that consolidates information provided by distributors to the ANEEL of Brazil, representing the electrical system’s configuration in a structured and standardized manner. Its structure organizes data into entities, each corresponding to a specific piece of equipment or structure within the electrical grid. The organization and standardization of this information follow the guidelines established in Module 10 of the Brazilian Procedures for Energy Distribution Standard (PRODIST).
The information contained in the BDGD is classified into two main groups:
Geographic entities: represent the spatial location of electrical grid elements, such as feeders, transformers, and poles;
Non-geographic entities: contain technical and operational attributes of equipment, such as electrical characteristics and identification codes.
The current version of the BDGD data model (V1.0) comprises 23 Geographic Entities and 20 Non-Geographic Entities, whose specifications are detailed in the ANEEL Data Dictionary (DDA) [
27]. Geospatial data are publicly available on ANEEL’s open data portal and are provided in Geodatabase (.gdb) format, organized by distributor and reference year. For this study, the ENERGISA MT-2022-12-31 database was used.
After downloading, the files must be unzipped and loaded into the QGIS software as vector layers. QGIS is a free and open source tool widely used for the visualization, analysis, and manipulation of geospatial data [
28].
Once the layers have been imported into the QGIS, it is possible to view the elements of the electrical grid operating within the distributor’s area, specifically in the state of Mato Grosso. To facilitate spatial interpretation, the QuickMapServices plugin was used, which allows the overlay of base maps, such as Google Maps.
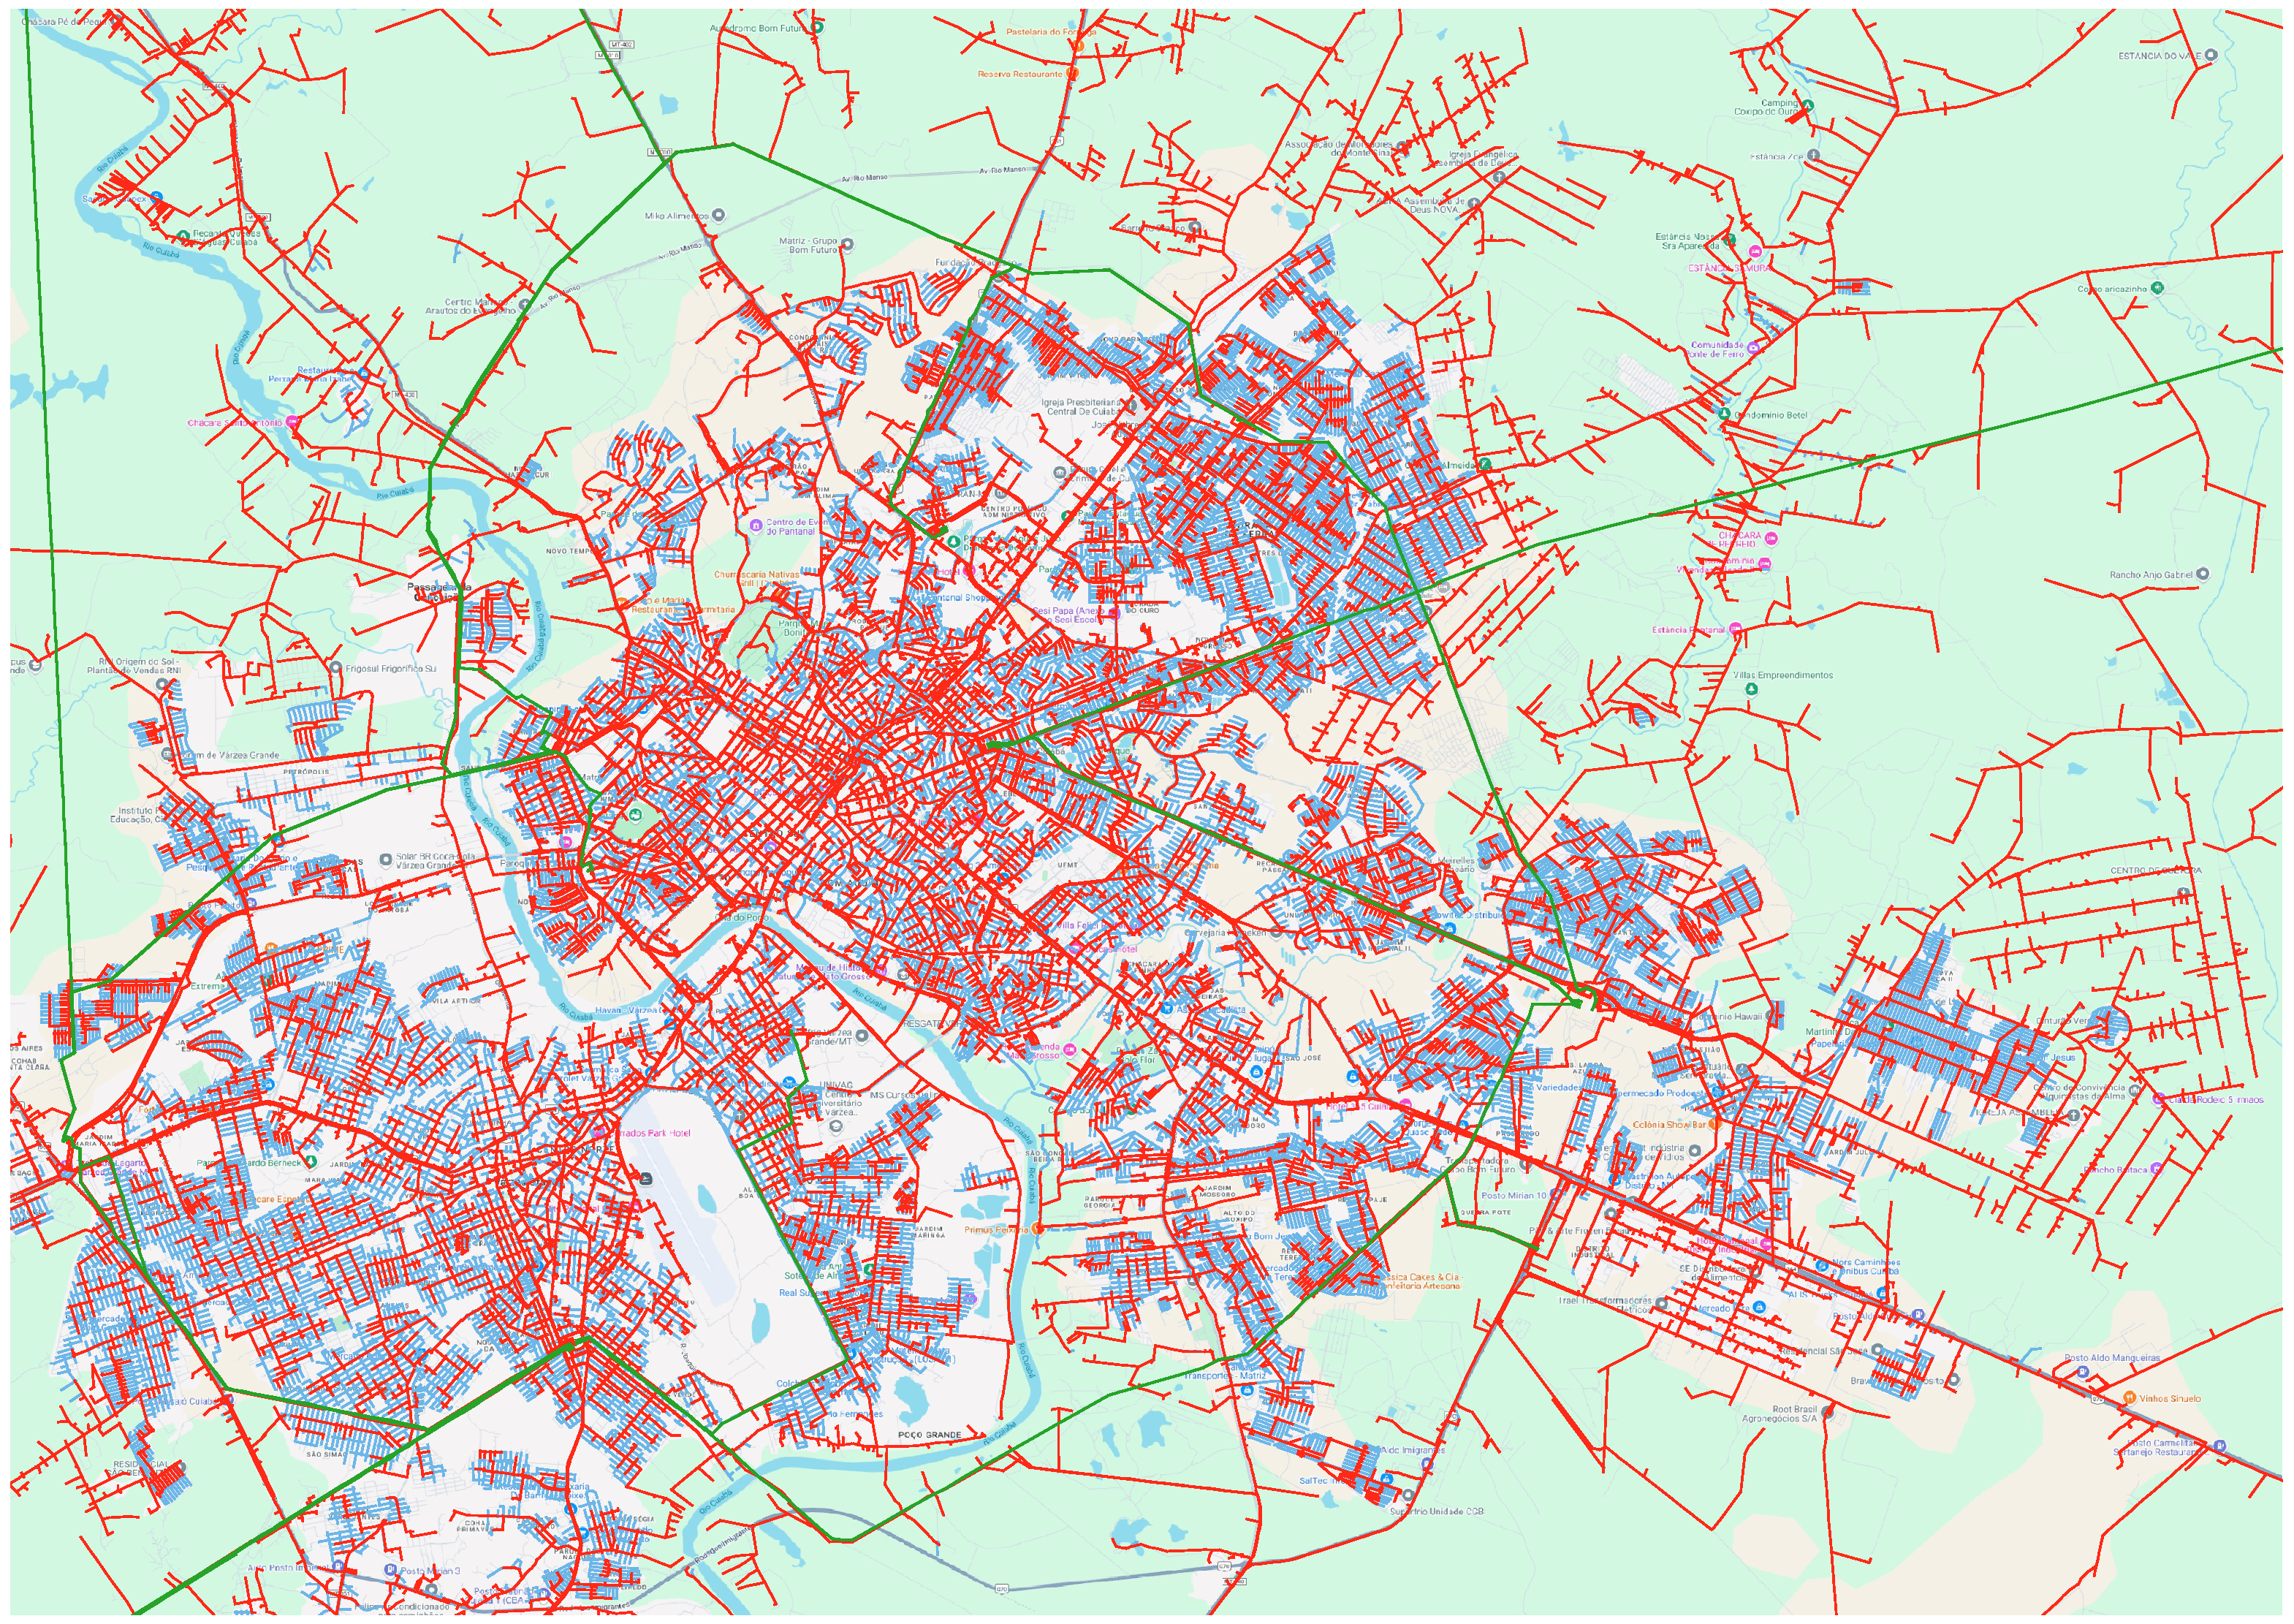
Figure 2 illustrates the spatial visualization of the segments of the high, medium, and low voltage distribution system in the municipality of Cuiabá.
Geographic entities are stored in Shapefile format, a standard for representing spatial data. This format is composed of multiple files, two of the primary ones being:
shp: contains the geometric characteristics of the elements (points, lines, or polygons).
dbf: stores the attribute tables associated with each geographic element.
Attribute tables can be exported and accessed using spreadsheet software, such as Excel, facilitating data analysis and manipulation. To select the feeder of interest, its location can be identified on the map, and then the CTMT field, representing the medium voltage circuit, can be located in the attribute table. This parameter is essential for filtering other geographic entities, ensuring that only relevant data for the study is processed.
To carry out the simulations, it is necessary to previously export the geographic and non-geographic entities described in
Table 1.
After exporting the data, the next step is to transfer this information to the Google Colab environment. Google Colab is a platform based on Jupyter Notebooks, which does not require prior configuration for its use. In addition, it offers free access to computing resources, including GPUs and TPUs, making it a highly suitable tool for applications in machine learning, data science, and educational activities [
29].
A Python code was developed to automate the process of exporting data from BDGD spreadsheets. The code prompts the user for the feeder code (COD-ID), loads the necessary spreadsheets, and filters the information based on this identifier. For each spreadsheet, data is analyzed line by line; if the feeder matches the one specified, the relevant information is extracted, formatted, and written to text files in .dss format. At the end of the process, files are generated that are ready for use in OpenDSS simulations.
The implemented code is capable of generating the electrical circuit corresponding to any feeder in the BDGD database from 2022 onwards. However, any data entry errors or inconsistencies present in the database itself are not automatically identified by the code, requiring subsequent analysis of the generated files to ensure the integrity of the modeled circuit.
Figure 3 shows the flowchart of this export process, highlighting the main steps from data entry to the final generation of the files. In this study, OpenDSS was selected as the simulation tool due to its flexibility and suitability for distribution system analysis. OpenDSS is an open-source software widely used in both academia and industry for feeder-level studies, with native support for unbalanced three-phase systems, distributed generation, storage, and electric vehicle modeling [
30]. Its scripting interface enables direct integration with Python 3.13.5, which was essential in this work for automating the conversion of BDGD data and running large-scale simulations in Google Colab. Compared to commercial alternatives such as DIgSILENT PowerFactory or CYME, OpenDSS offers full transparency of the modeling process and reproducibility of results, while avoiding licensing restrictions that could limit scalability and accessibility. These features make it particularly suitable for research applications in emerging economies, where open-source and flexible tools are critical for replicability and knowledge transfer.
3. Case Study
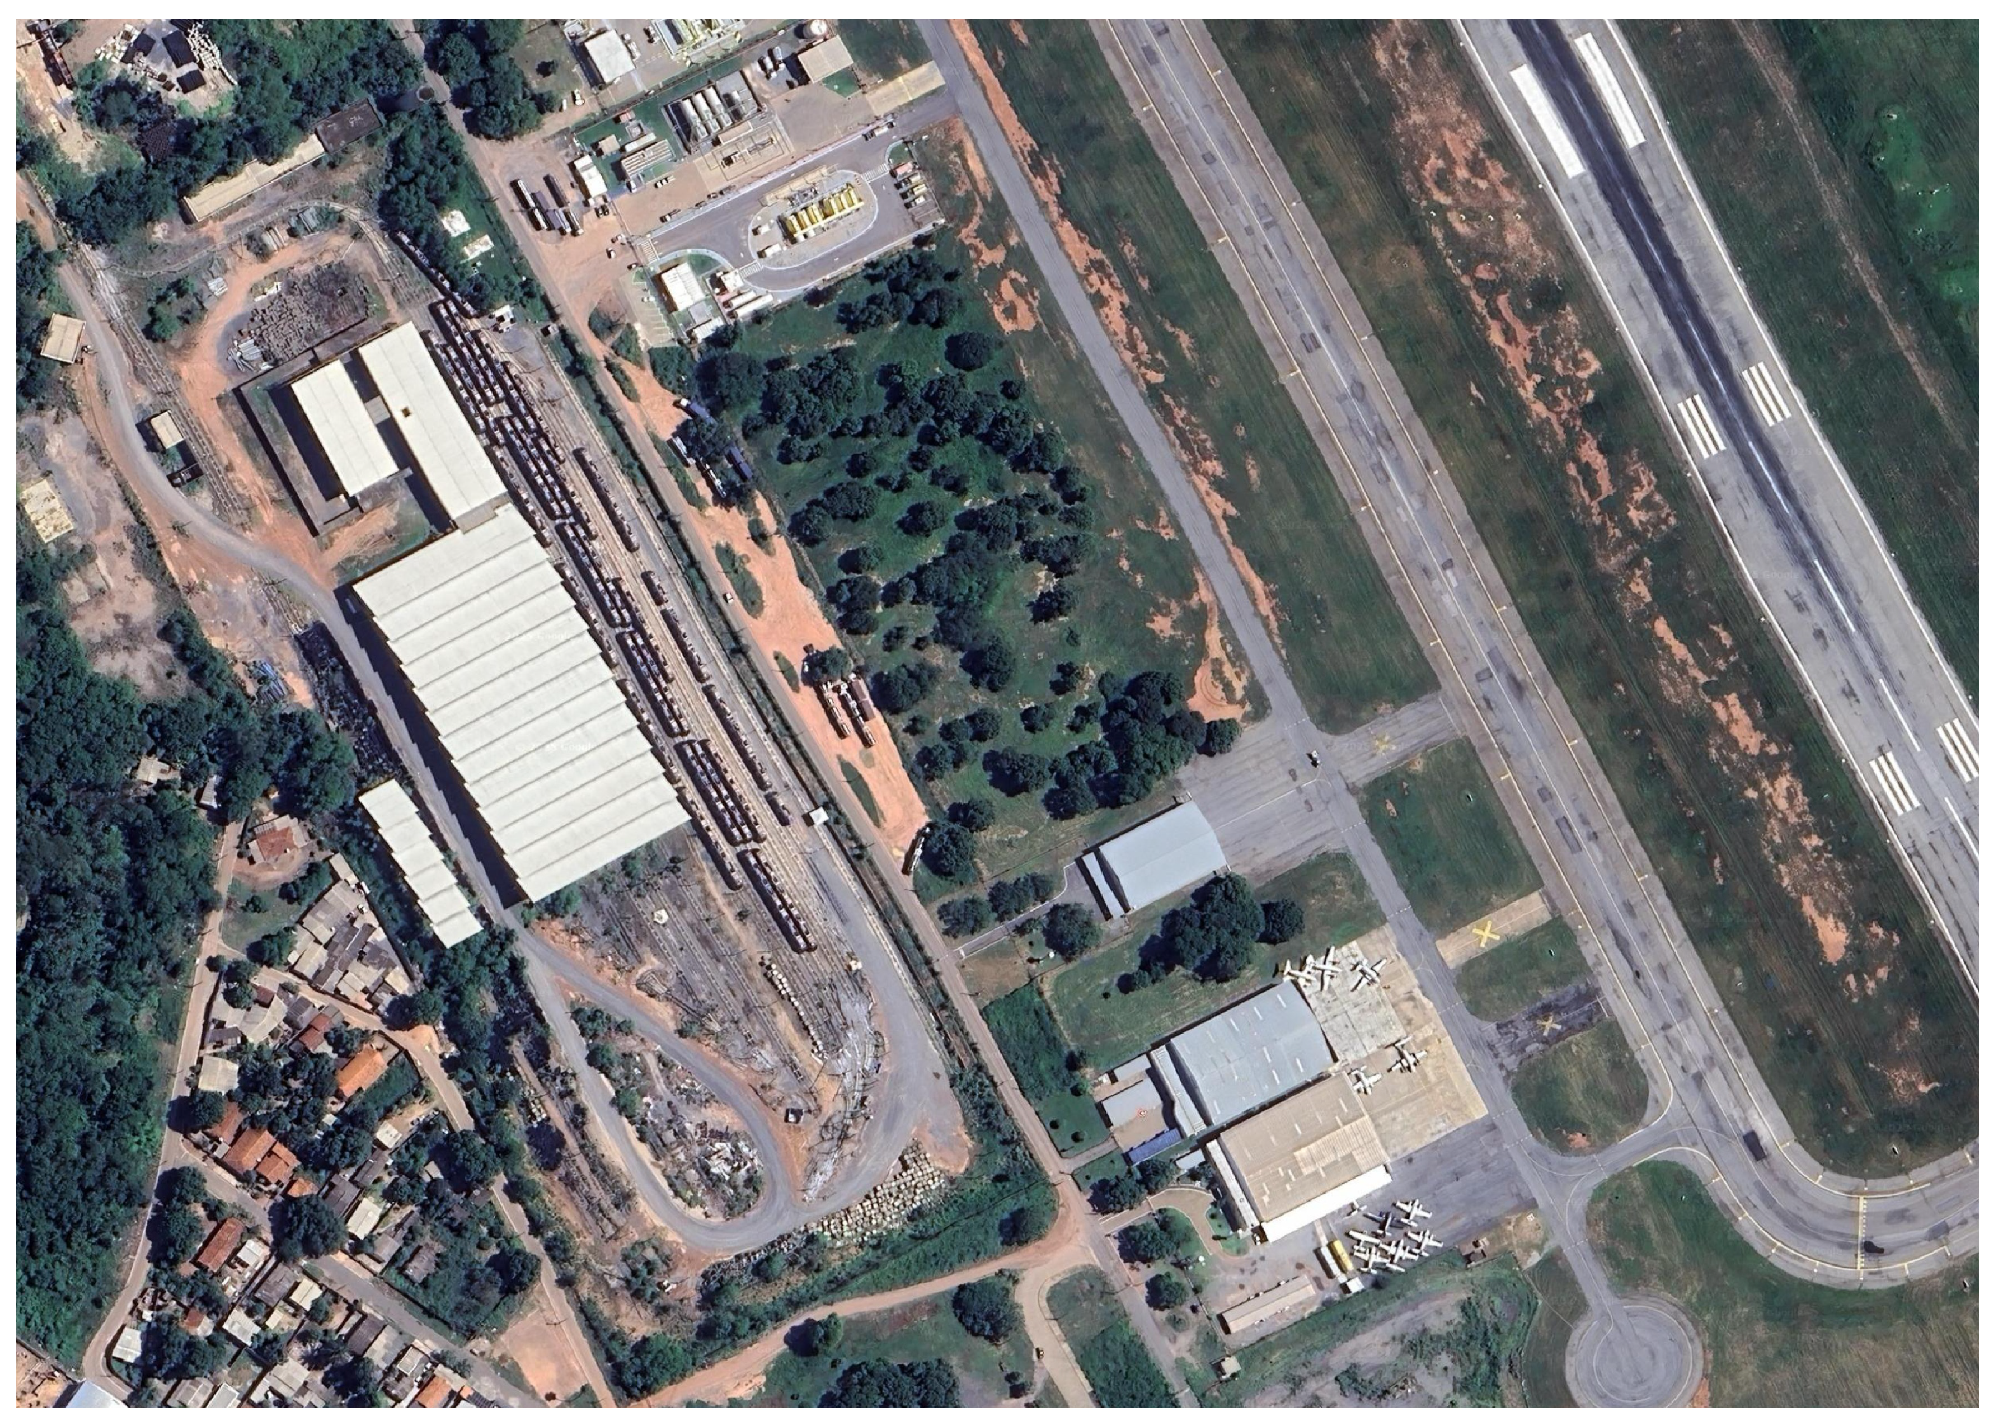
To carry out the simulations, it was necessary to define the location for the BEBs fleet garage initially. The chosen location was the former Light Rail Vehicle (VLT) yard, located near the Cuiabá-Marechal Rondon International Airport, in Várzea Grande-MT. This location was chosen because of its proximity to the routes of the operated line, favoring the logistics of operating and recharging the vehicles.
Figure 4 shows a satellite image of the region in question.
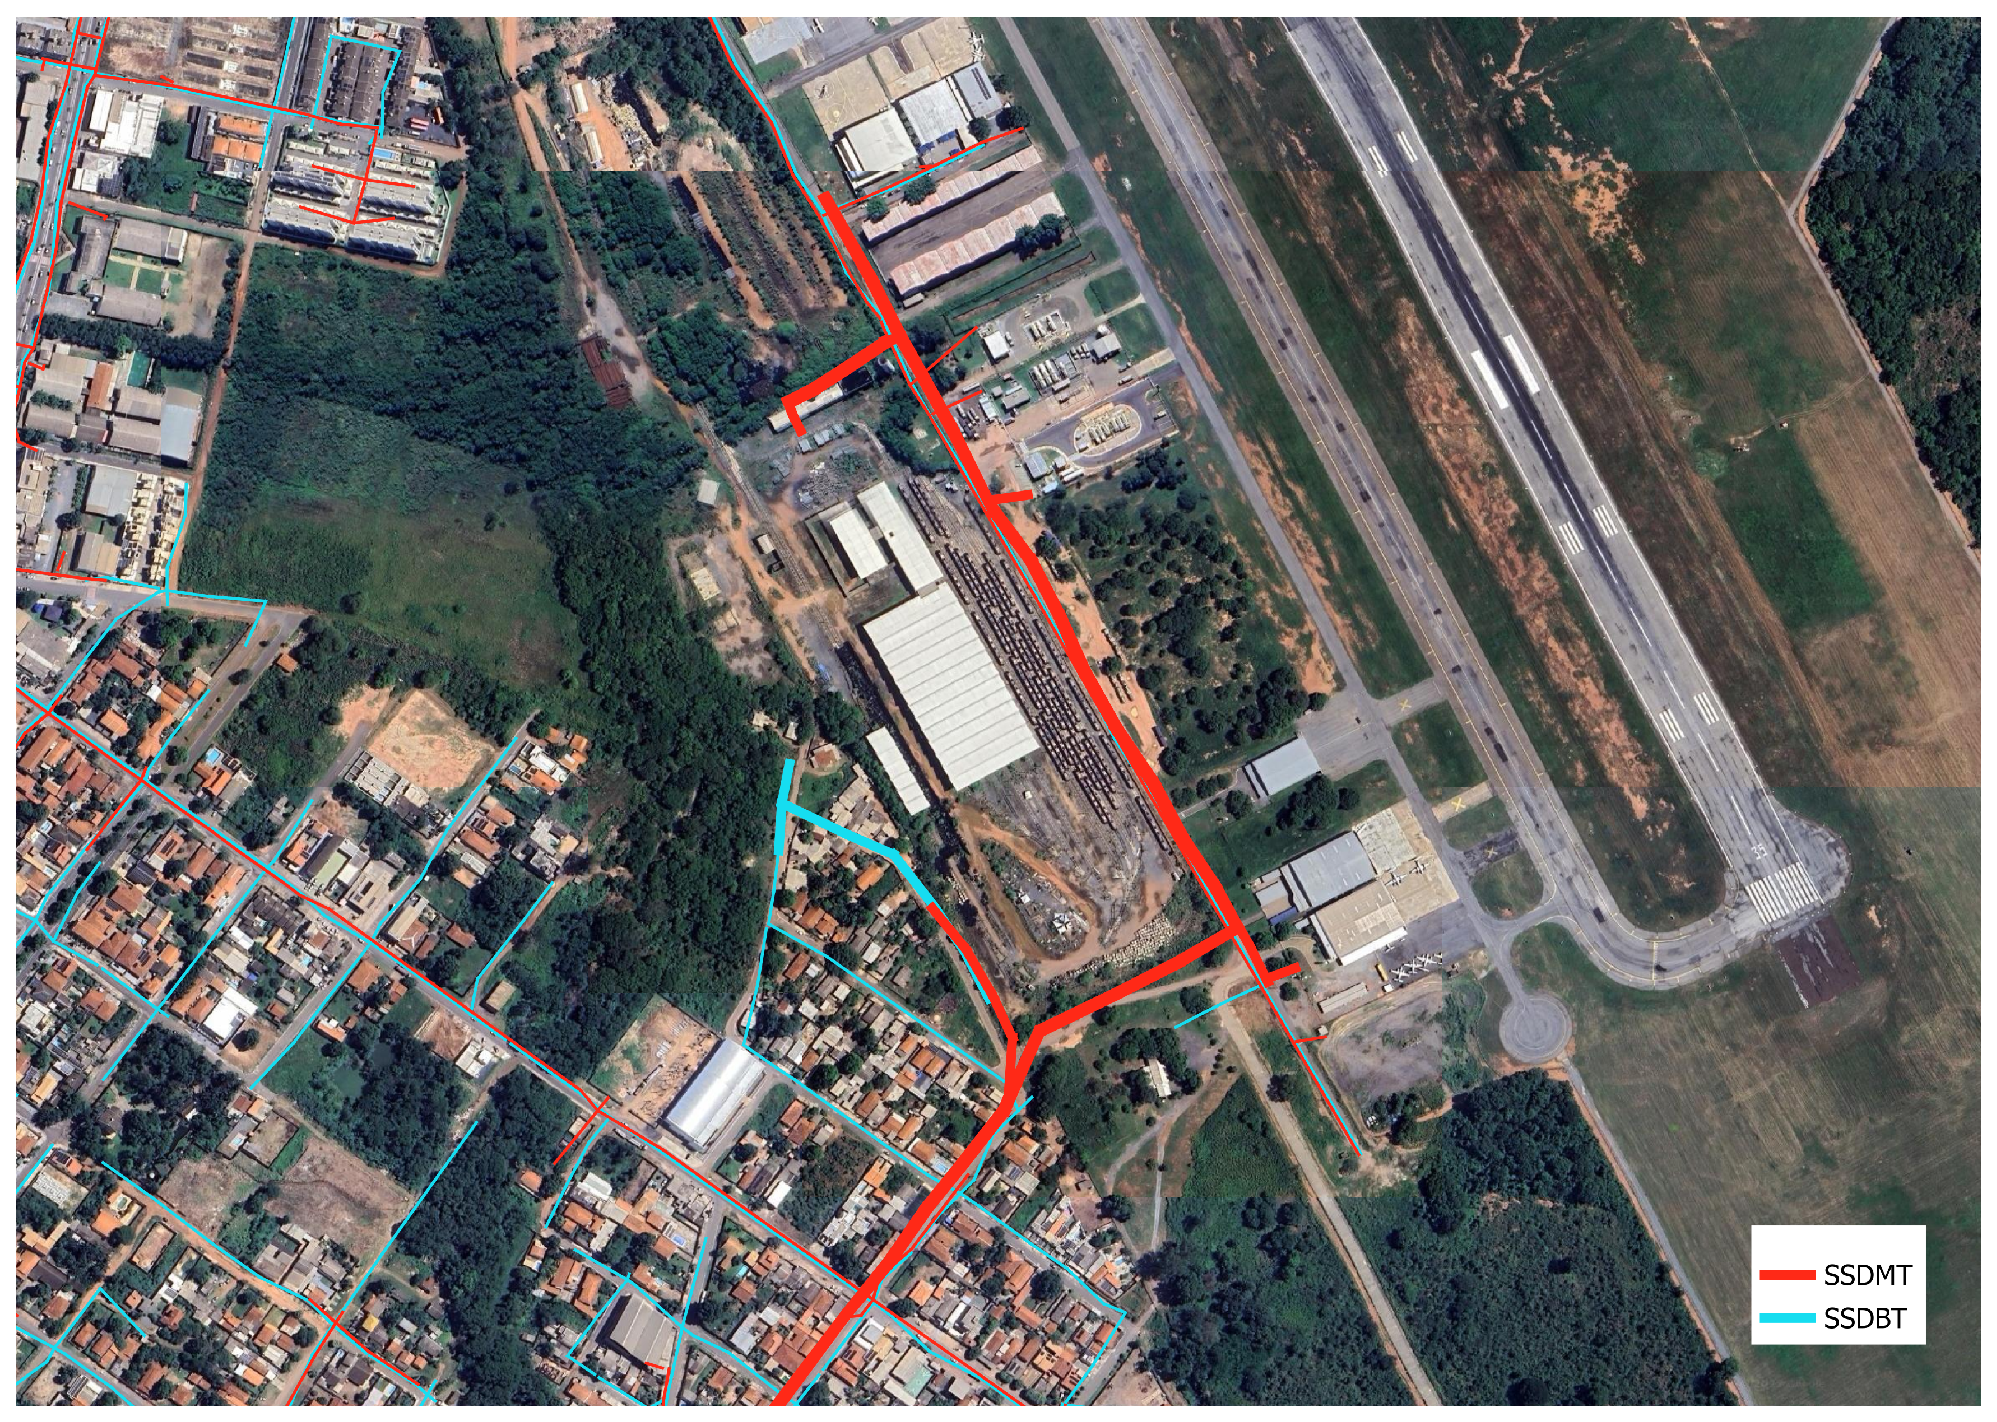
Figure 5 illustrates the electrical distribution network around the VLT yard, where it is possible to observe the arrival of a feeder in the area. This feeder, identified as 069083, will be the subject of study in this work.
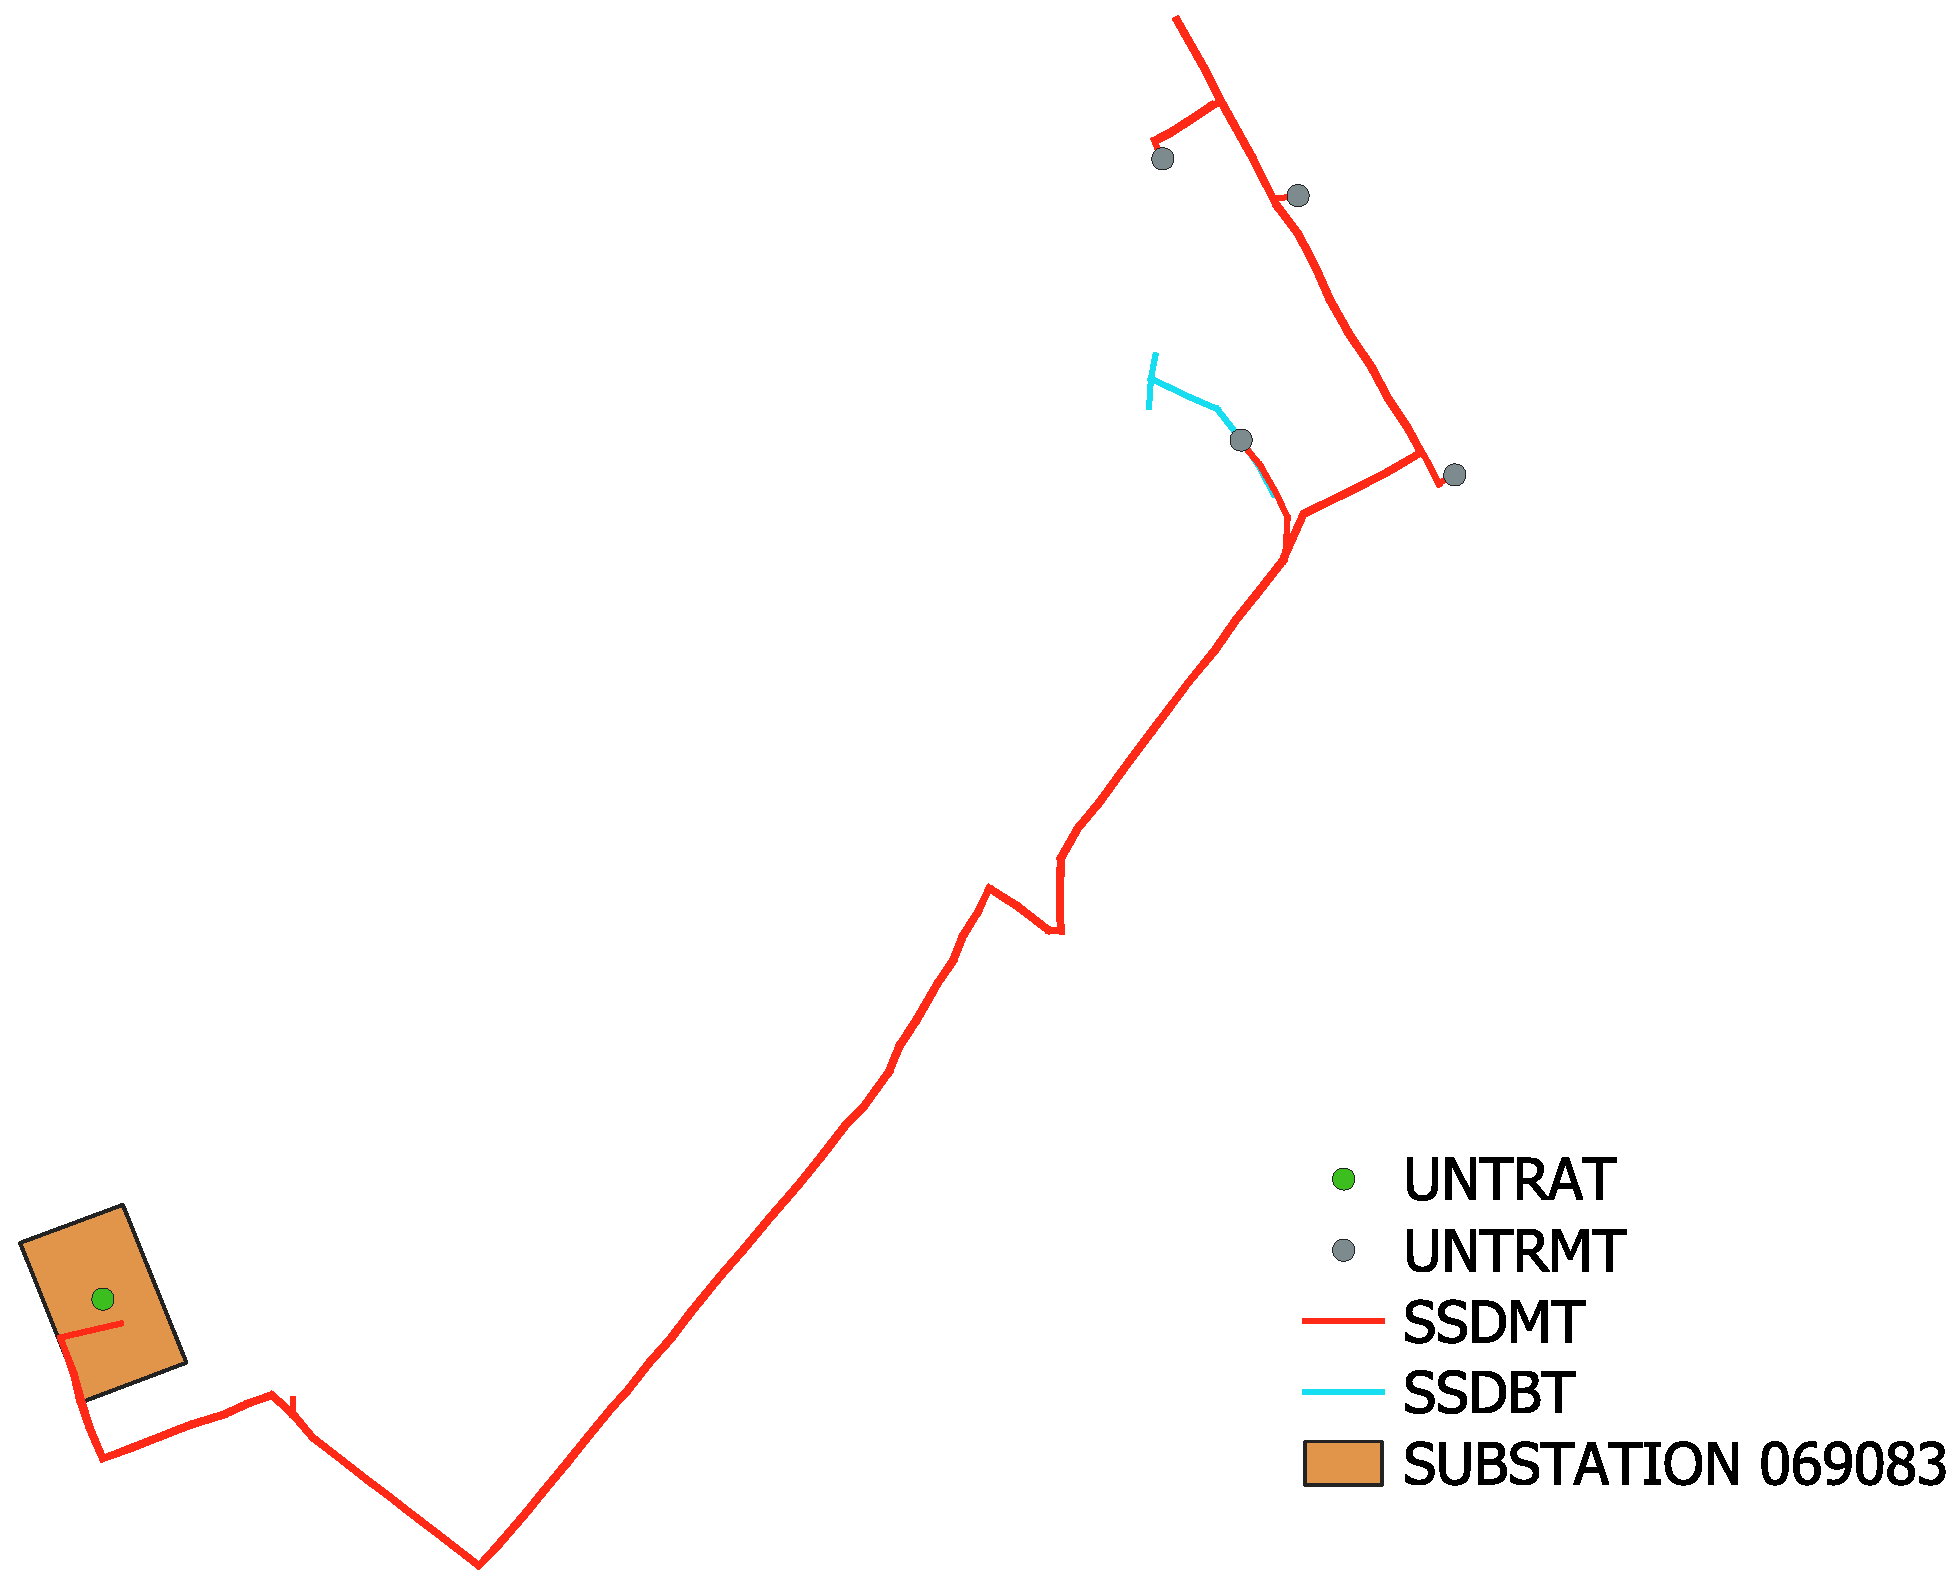
Taking into account the medium voltage circuit of the selected feeder, the network to be analyzed was delimited, as illustrated in
Figure 6. This is the feeder of the Várzea Grande 138 kV substation, situated in the Vila Pirineu neighbourhood, in the municipality of Várzea Grande, MT. For simulation purposes, the entire circuit upstream of the substation was represented by a Thévenin equivalent, modeling the downstream elements based on data extracted from the BDGD. The main characteristics of the feeder and the elements that make up the system are summarized in
Table 2.
The feeder in question primarily serves low-consumption residential loads, resulting in reduced demand for active power. As it is a small urban feeder, there are no voltage regulators or capacitor banks along the route. However, losses in the conductors remain insignificant, because of the short length of the lines and the moderate load profile.
3.1. Electric Bus Charging Modeling
In this work, in addition to the typical elements of a distribution system, the Storage element of OpenDSS was used to model the BRT charging points. This component represents a versatile electrical energy storage system, being treated as an energy conversion element.
The storage element can operate in two distinct modes: as a constant power load, when configured in charging mode, or as a generator, in discharge mode, supplying energy to the grid.
In this study, plug-in charging at night was considered, with only one daily charge for 50 articulated BEBs. The charging was modeled as uncoordinated, as it is a reality in Brazil that the power distribution infrastructure still lacks the advanced automation required for smart charging, and allows analysis of the worst-case scenario in terms of impact on the grid. For this study, simultaneous charging of all BEBs will be considered between 00:00 and 03:00. The bus selected for analysis is the articulated model D11A, developed by BYD for urban applications, especially for BRT projects [
31].
Table 3 presents the main electrical characteristics of these vehicles. In China, it is often seen that 30-kW or 60-kW wireless are charged. However, in this pilot project, a 3-h charging time was defined as a requirement. Thus, a 160 kW charging power was considered for a 516 kWh battery capacity.
Although wireless charging is not in the scope of this study, it is well-known that the advantages of wireless over conventional (i.e., it eliminates mid-day downtime and supports smaller batteries). This technology is an emerging alternative for future Brazilian BEBs integration. Although wireless charging presents challenges, such as the detection of foreign objects, advanced solutions are already applicable in real-time [
32].
3.2. Photovoltaic System Power Calculation Methodology
To assess the feasibility of meeting the energy demand to charge the BEB fleet through distributed generation, the calculations proposed in the study in [
33] were used as a basis. This study presents a methodology for sizing photovoltaic systems for electric mobility applications.
The total daily energy consumption of the fleet, in kilowatt-hours (kWh), is determined by multiplying the power of the charger (
, in kW) by the number of charging hours (
) and the quantity of available chargers (
), as represented in Equation (
1).
The power output of the photovoltaic system (in kW) is determined by dividing the daily energy production of the system (
) by the number of hours of full sun (
), as shown in Equation (
2).
Based on the total daily consumption, the required power of the photovoltaic system (
) in kWp is calculated considering the system efficiency (
) and
, as indicated in Equation (
3). Solar panel efficiency, also known as yield, represents the ratio between the incident solar energy on the panels and the electricity they generate, typically expressed as a percentage.
To characterize the solar resource in the case study, official data were obtained using the Sundata software version 3.0, Instituto Nacional de Meteorologia—INMET, Brasília, Brazil [
34]. For the city of Cuiabá, the Direct Normal Irradiance (DNI) corresponds to an average of 5.13 h of peak sun per day. Given the daily energy consumption of the fleet of up to 24,000 kWh, and assuming an average system efficiency of 75%, the required photovoltaic capacity was estimated at 6237 kWp using the Equation (
3).
Based on this model and with the aim of complying with the legal limits for micro and mini distributed generation established by Brazilian Law No. 14,300/2022, a distributed generation (DG) installed capacity of 3 MW was adopted [
35]. This limit applies to intermittent sources such as photovoltaic solar energy and follows ANEEL regulations for nondispatchable systems. The complete technical specifications of the PV system are provided in
Appendix A.
According to the referenced study, a photovoltaic plant with an installed capacity of 3 MW requires the installation of a system with a total power of 4000 kWp, resulting in an estimated daily energy production of 15,390 kWh, considering performance factors and local solar irradiation. This size allows for the supply of approximately 64.12% of the daily energy required to charge a fleet of 50 articulated BEBs fully [
33].
To enable the system’s operation, the three-phase WEG inverter model SIW500G T100 W0 was considered. These inverters, with a unit power of 100 kW, are suitable for commercial and industrial applications and offer features such as intelligent string monitoring, natural convection cooling, and protection against surges and grounding faults [
36]. The system requires the installation of 40 photovoltaic inverters to meet the proposed generation capacity, taking into account modularity, efficiency, and compatibility with the vehicle battery charging voltage. In the plant modeling in OpenDSS, each inverter was represented as a PVSystem element, allowing for individualized simulation of solar generation throughout the day.
A cost analysis was also conducted based on the sizing of the plant using the reference cost parameters for solar photovoltaics published by EPE in the Decennial Energy Expansion Plan 2034 [
37], which establishes a CAPEX of USD 728/kWp. Considering the average exchange rate of BRL 5.22/USD from the base date, the total investment for the 4000 kWp system would be on the order of approximately USD 2.91 million. Although additional expenses related to controllers and power quality mitigation are expected, these costs can be offset by long-term benefits, such as reducing purchased energy from the grid, lower dependence on thermoelectric power plants during drought periods, and alignment with the national regulatory framework for distributed generation. Thus, the integration of PV within the current legal limits demonstrates not only technical feasibility but also an economic perspective that strengthens its adoption in the electrification of urban transportation.
4. Mathematical Description of the Problem
The system was simulated using a three-phase power flow formulation for unbalanced networks, since distribution lines are generally untransposed. This condition requires solving the complete set of equations directly, avoiding the use of symmetrical components [
38]. Given the three-phase power injections
and
for
, an initial guess
, and the admittance elements
and
, the problem of evaluating node voltages
, branch currents
, and power flows
is formulated as follows:
The loads are modeled as constant power and follow a 24-h daily profile discretized into time intervals of
. At each sampling instant
k, the active and reactive powers are specified and allocated among the three phases as follows:
where
represents the fraction of the total demand at bus
i assigned to phase
.
where
denotes the constant power factor of phase
at bus
i. For the load, the complex power is considered negative in the power flow solution.
A similar approach was used for PV generation, which follows a daily production curve. As the generation is equally distributed among the phases, the model can be written as:
where
denotes the fraction of the total photovoltaic generation at bus
i assigned to phase
.
where the power factor of PV generation depends on the selected inverter control strategy.
In addition to the loads and generation, electric buses are modeled as storage elements corresponding to batteries characterized by rated charging/discharging power, maximum energy storage capacity, and dynamic state of charge (SOC). These devices can operate in both charging and discharging modes following a specific curve. Mathematically, the model is given by:
where
is the maximum energy storage capacity (kWh),
and
are the rated charging and discharging powers (kW),
and
are the charging and discharging efficiencies, and
is the simulation time step (here,
).
In the power flow formulation, positive power injection at the bus is considered. Thus, at discrete time
k and bus
i, the net active power is given by:
Therefore, the presented formulation can be fully described as follows:
If and , then , meaning the storage injects power into the network (generator behavior).
If and , then , meaning the storage absorbs power from the network (load behavior).
If , then , meaning no power exchange with the network.
Thus, a single variable
can represent both charging and discharging modes, and the corresponding complex power injection is written as:
5. Results
This section presents and analyzes the results obtained from simulations carried out using the OpenDSS software. Different scenarios of electric fleet charging and distributed generation integration were considered in order to assess the impact on the electrical behavior of the feeder studied. For all scenarios, power flow simulations were performed over a one-day horizon at 15-min intervals, totaling 96 simulations.
5.1. Base Case: Real Primary Feeder
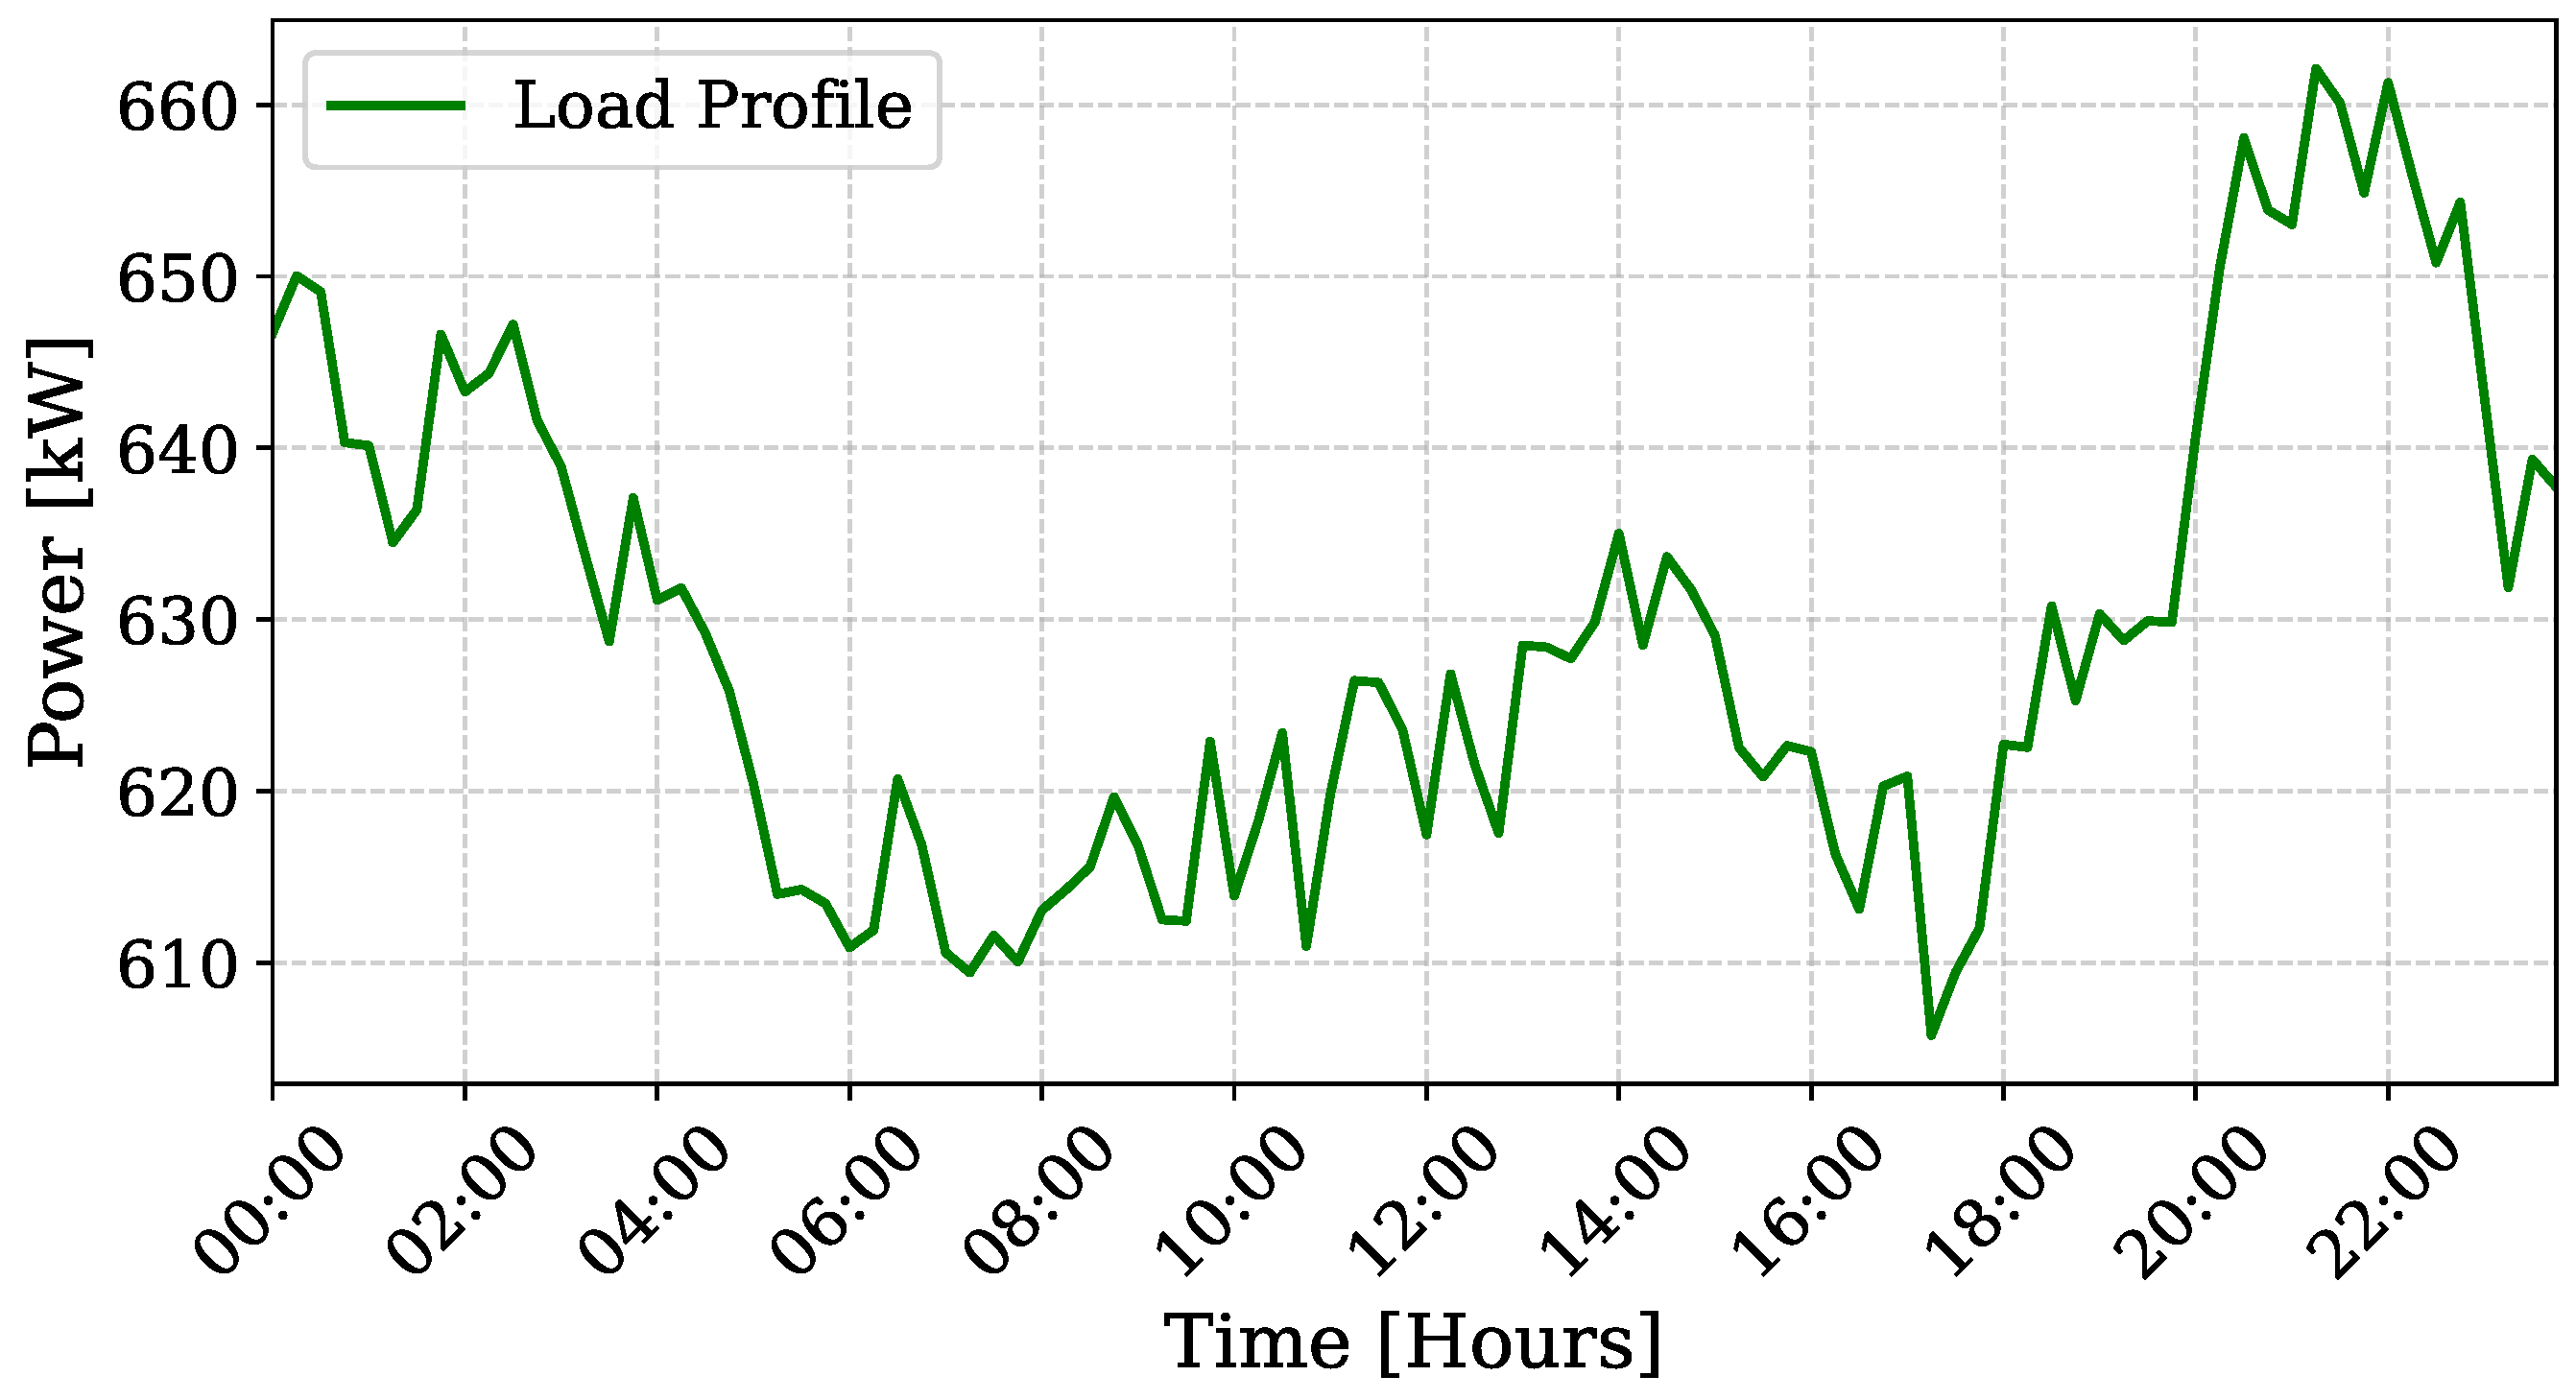
Figure 7 shows the three-phase active power demand curve in a real primary feeder, i.e., without the presence of BEBs or distributed generation. The active power of the transformer reaches 662.11 kW at 9 p.m. at the time of highest demand, and 605.78 kW at the time of lowest demand.
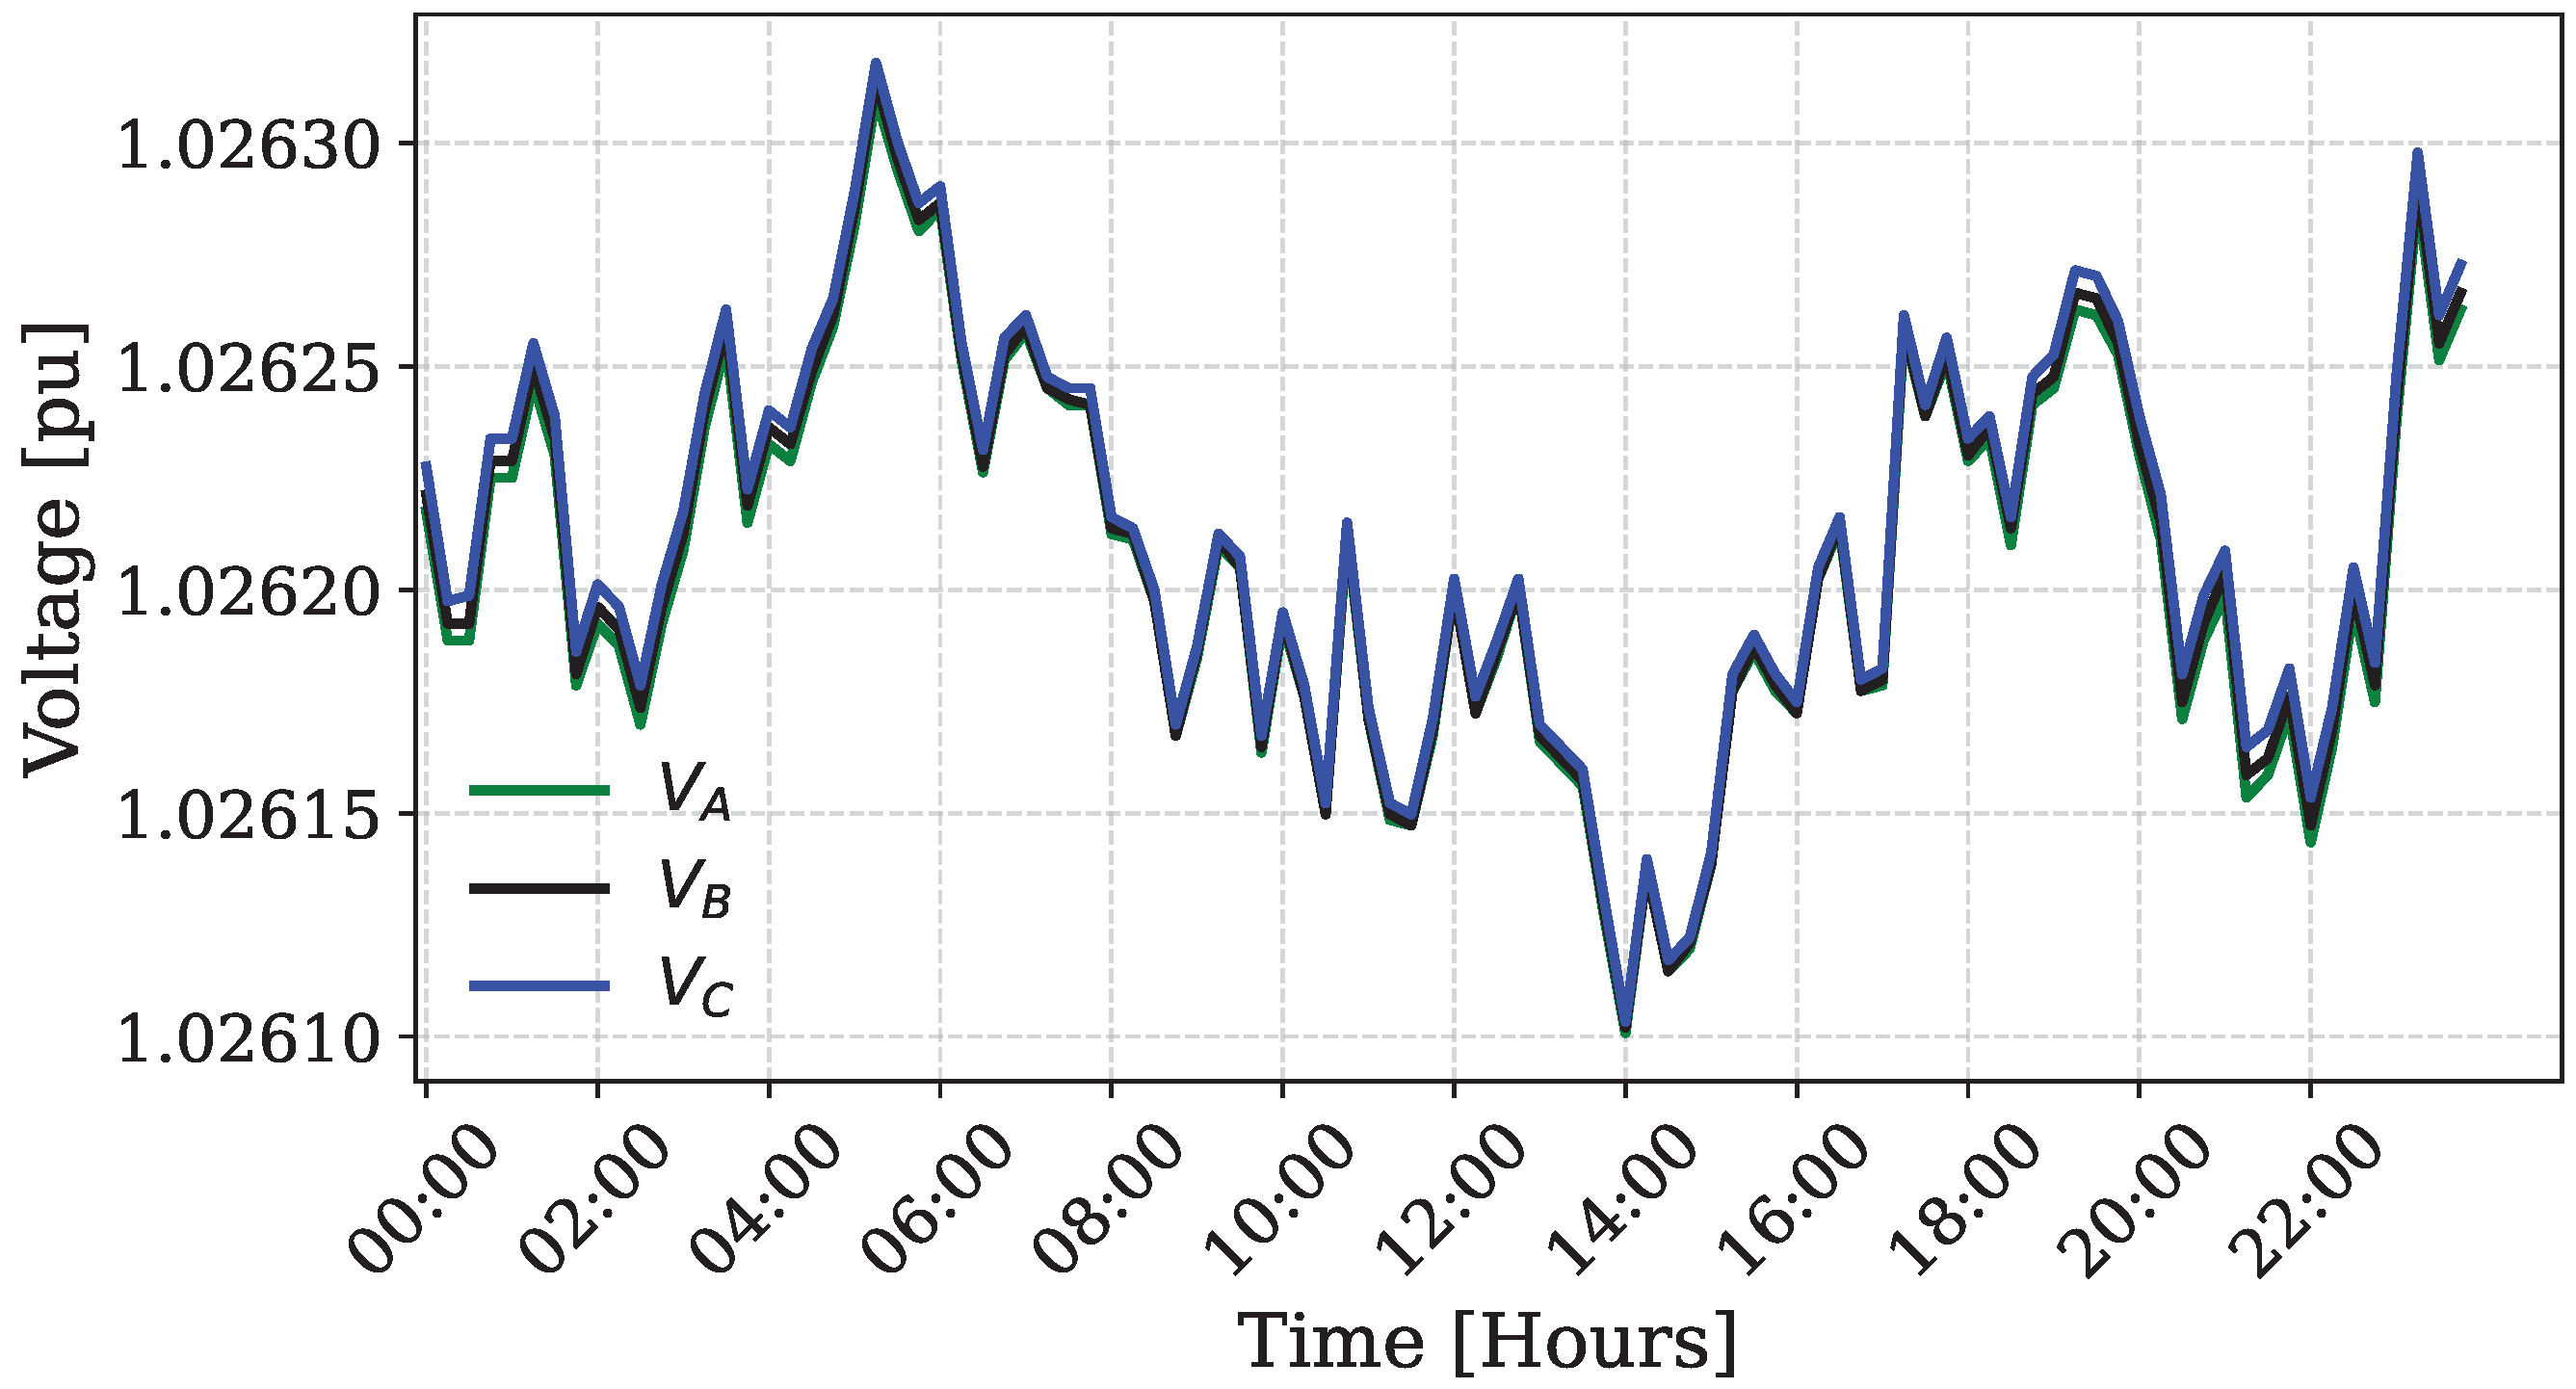
The behavior of the voltage at the bus station where the future bus charging station will be installed can be seen in
Figure 8. The voltage at the bus station assumes its lowest value, 1.0261 pu at 2:00 p.m, still presenting stable voltage levels within the limits established in the Brazilian grid code PRODIST Module 8 [
39].
5.2. Insertion of 50 Electric Buses with Distributed Generation
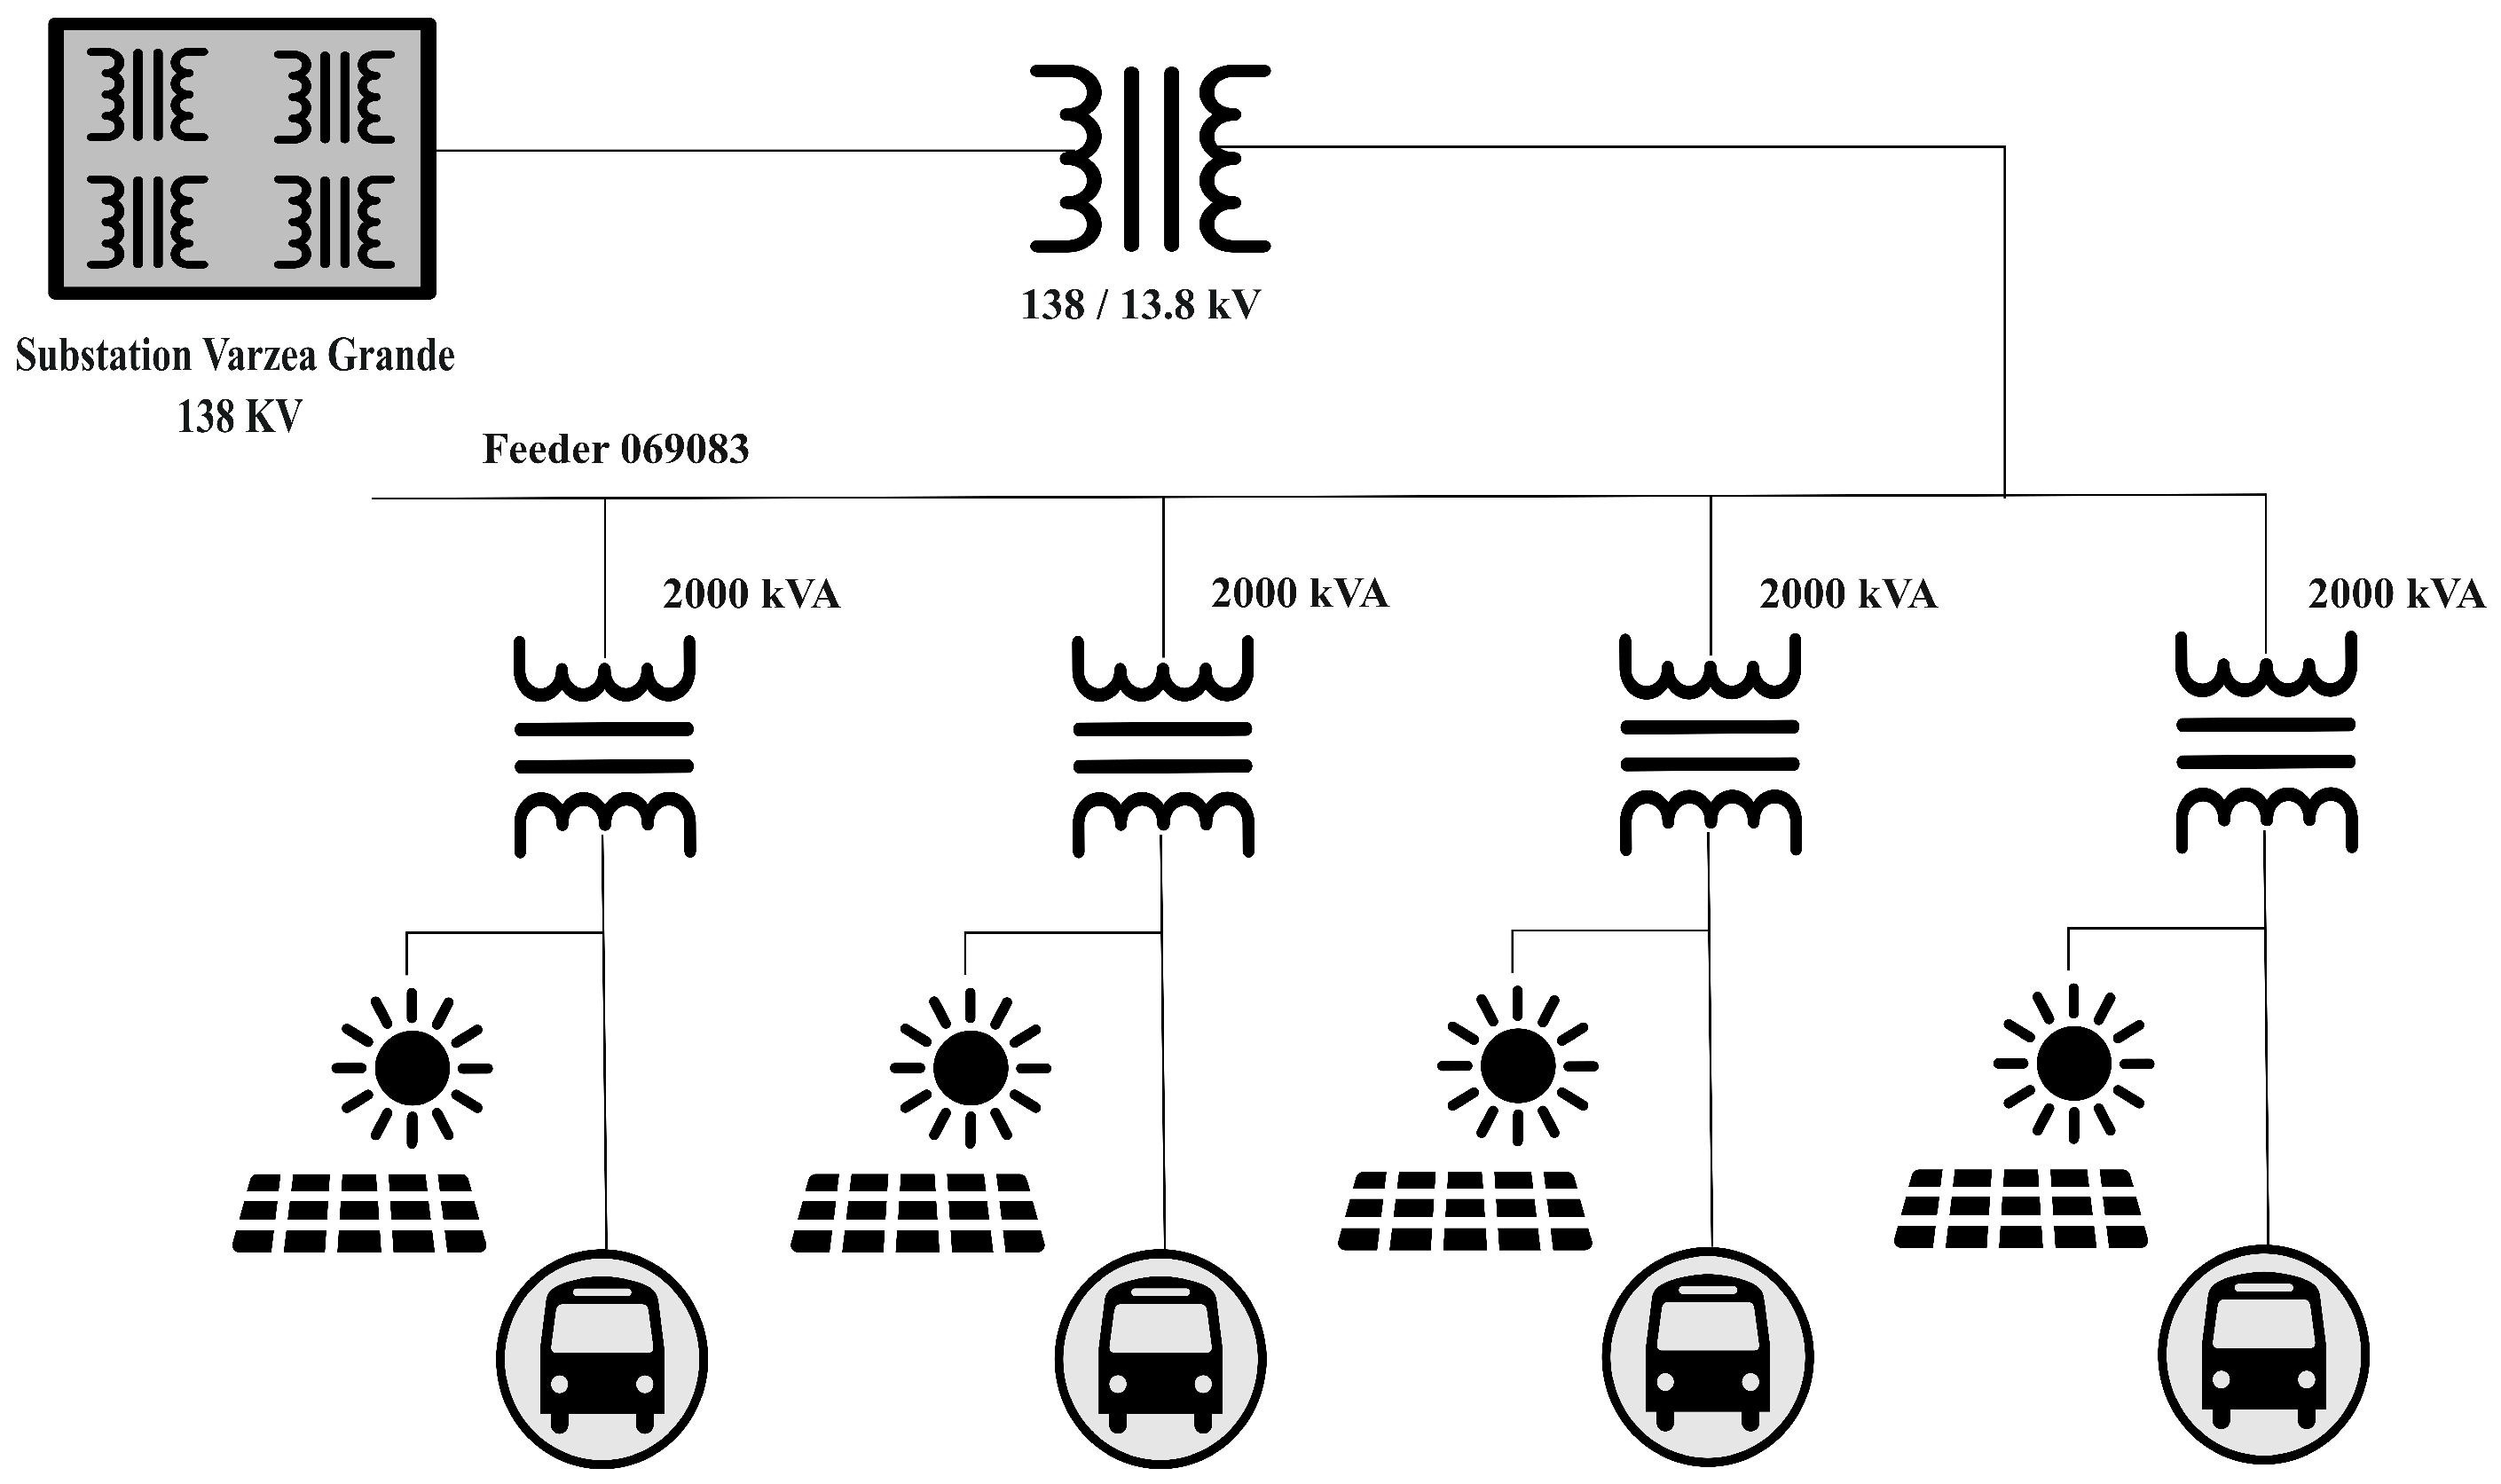
In this scenario, simultaneous overnight charging of 50 articulated BEBs is considered, scheduled between 12:00 a.m. and 3:00 a.m., using four dedicated 2000 kVA transformers, as shown in
Figure 9.
The charging stations were modeled in OpenDSS using the storage element configured as a constant power load during the charging mode. Distributed photovoltaic generation with a total installed capacity of 3 MW was modelled using 40 WEG SIW500G three-phase inverters (100 kW each), represented in the simulation by PVSystem elements operating at a unity power factor.
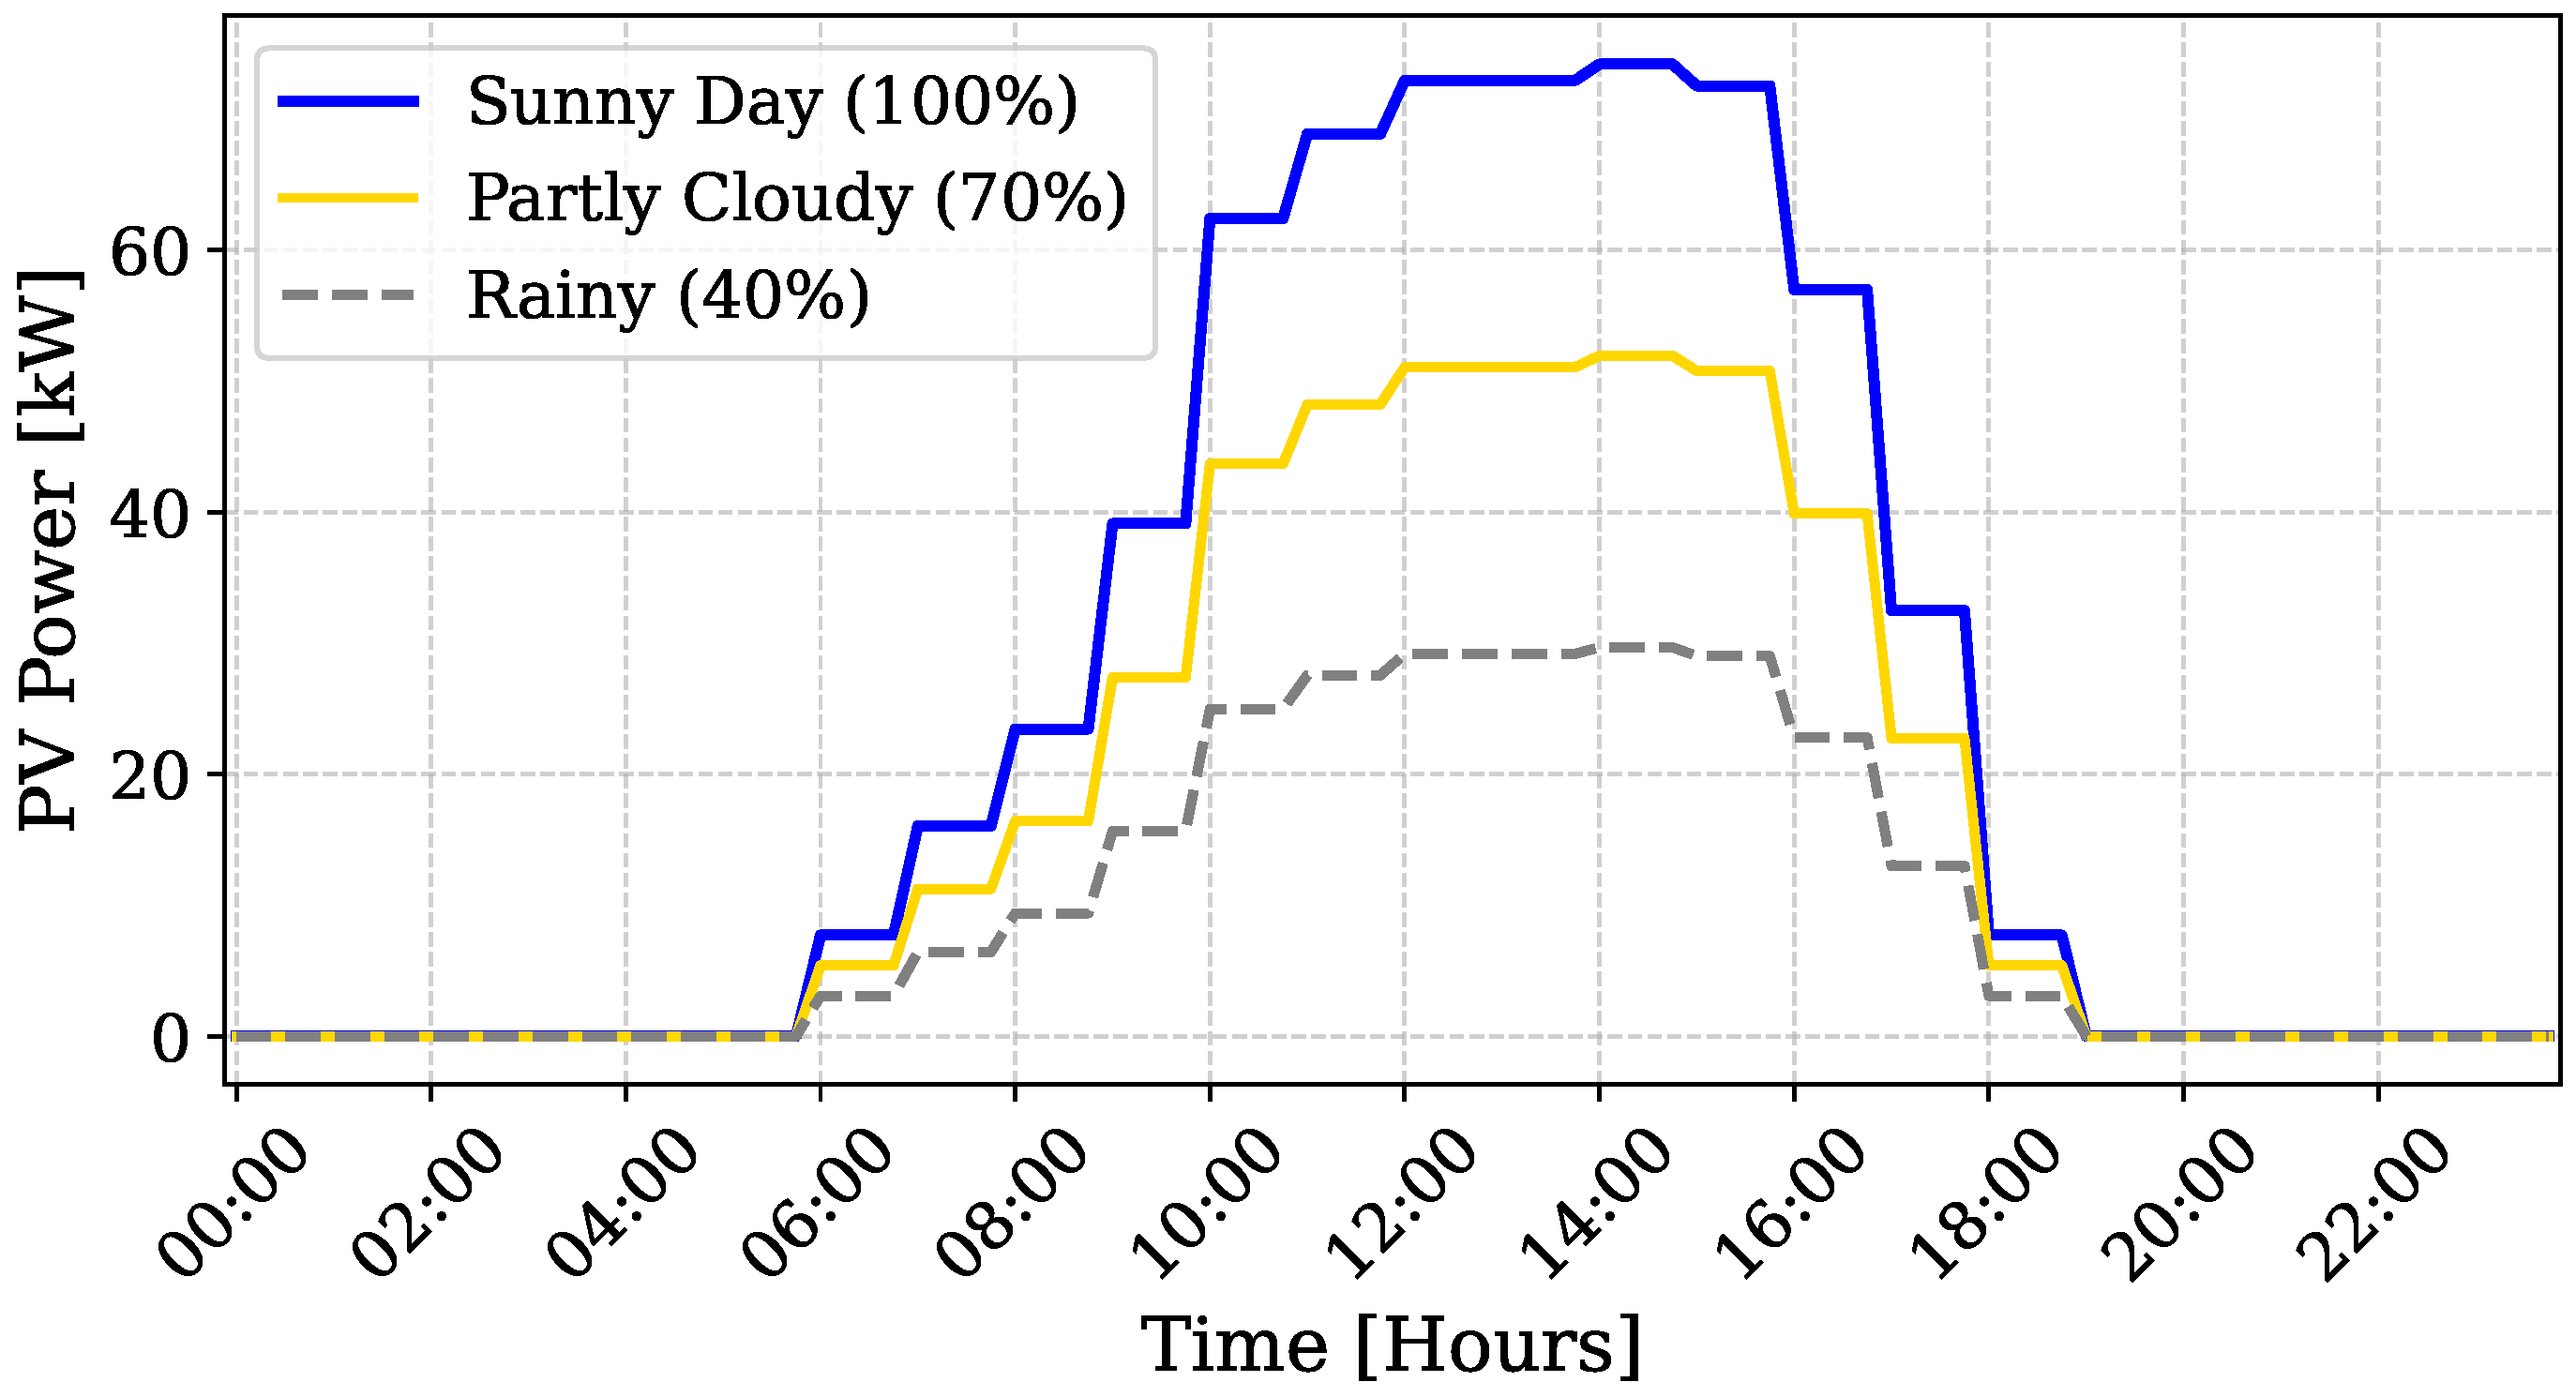
To account for variability in solar resource availability, three characteristic irradiance profiles were simulated: sunny, partly cloudy, and rainy, corresponding to high, moderate, and low solar generation days, respectively. These profiles were developed from typical meteorological patterns for Cuiabá, representing the range of daily PV output conditions that can occur throughout the year.
Figure 10 shows the generation curves for a single inverter under each condition, highlighting the substantial differences in total daily energy production and the mid-day peak output. While the sunny profile achieves full rated power between 11:00 a.m. and 2:00 p.m., the partly cloudy and rainy days exhibit a significant reduction in generation, reaching approximately 70% and 40% of the clear-sky peak, respectively.
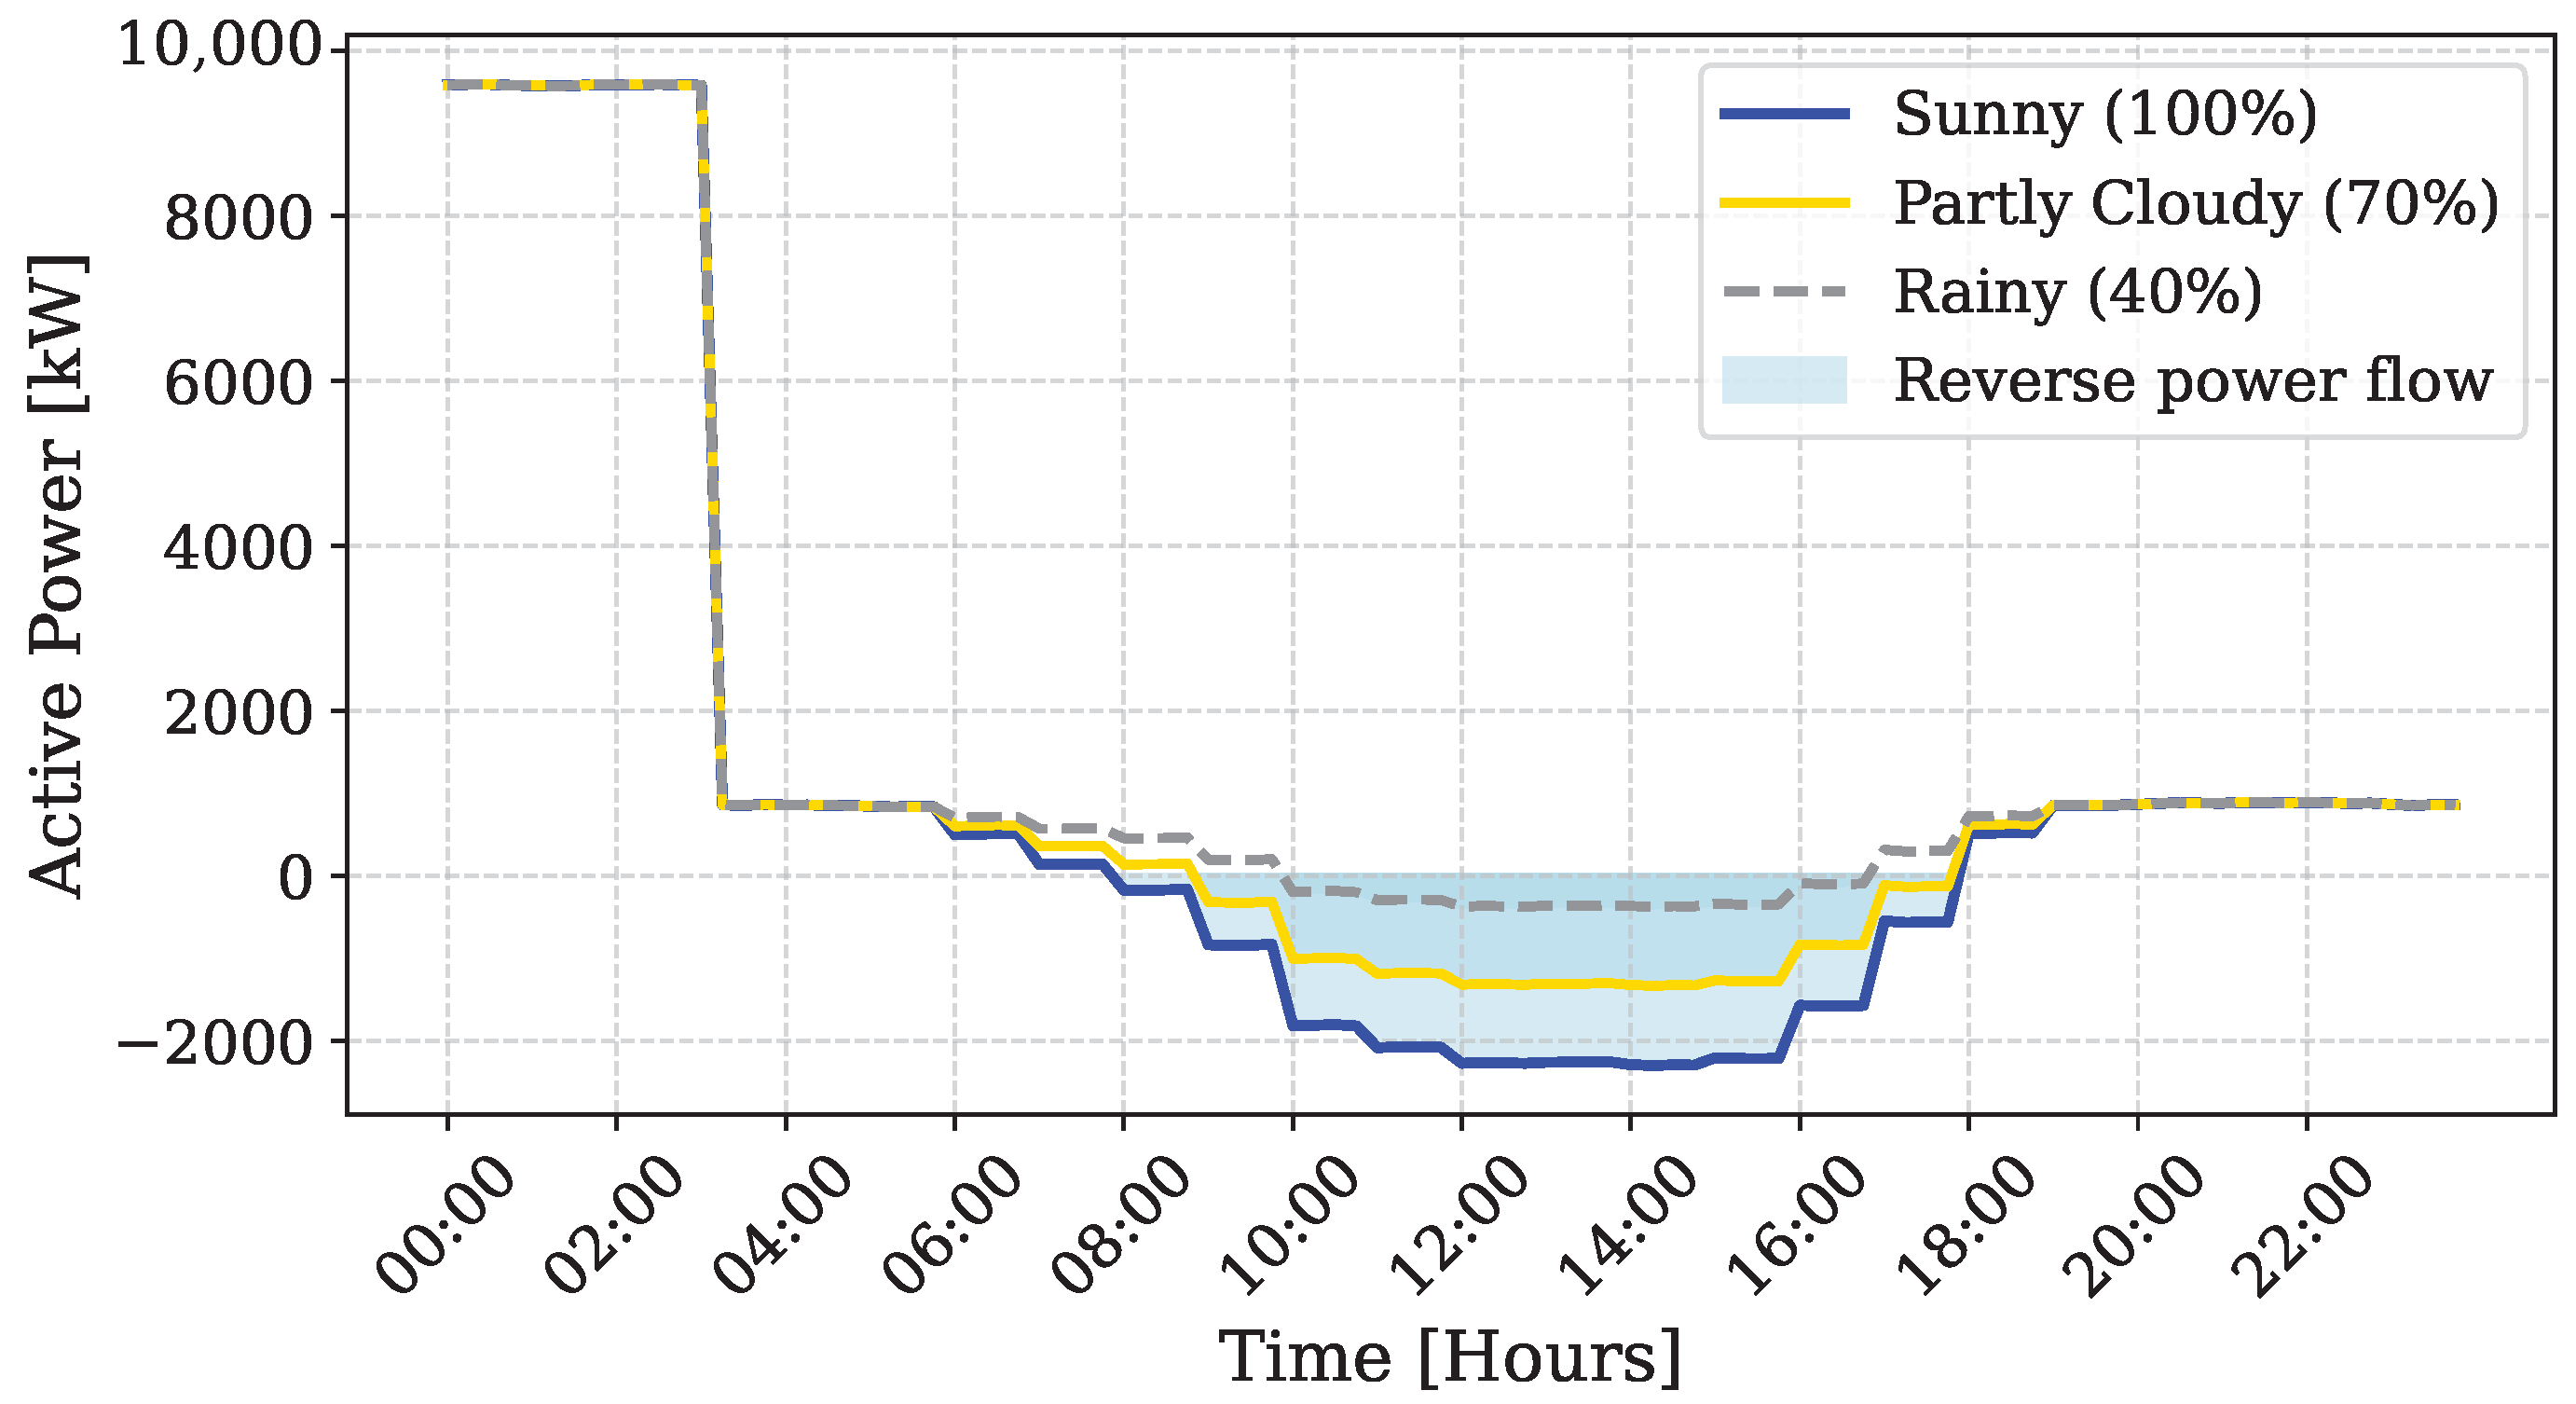
Figure 11 shows the three-phase active power profile required in the feeder for the three cases. During daylight hours, distributed generation is dominant, resulting in reverse power flow between 7:00 a.m. and 6:00 p.m. in the sunny case, as local PV output exceeds feeder demand. Under partly cloudy and rainy conditions, the magnitude and duration of reverse flow are substantially reduced, mitigating potential issues such as transformer overloading and voltage rise at the feeder ends. During the night-time charging period, the active power in the feeder’s main bus reaches a peak of 8855.1 kW, representing a 1331.6% increase compared to the base case.
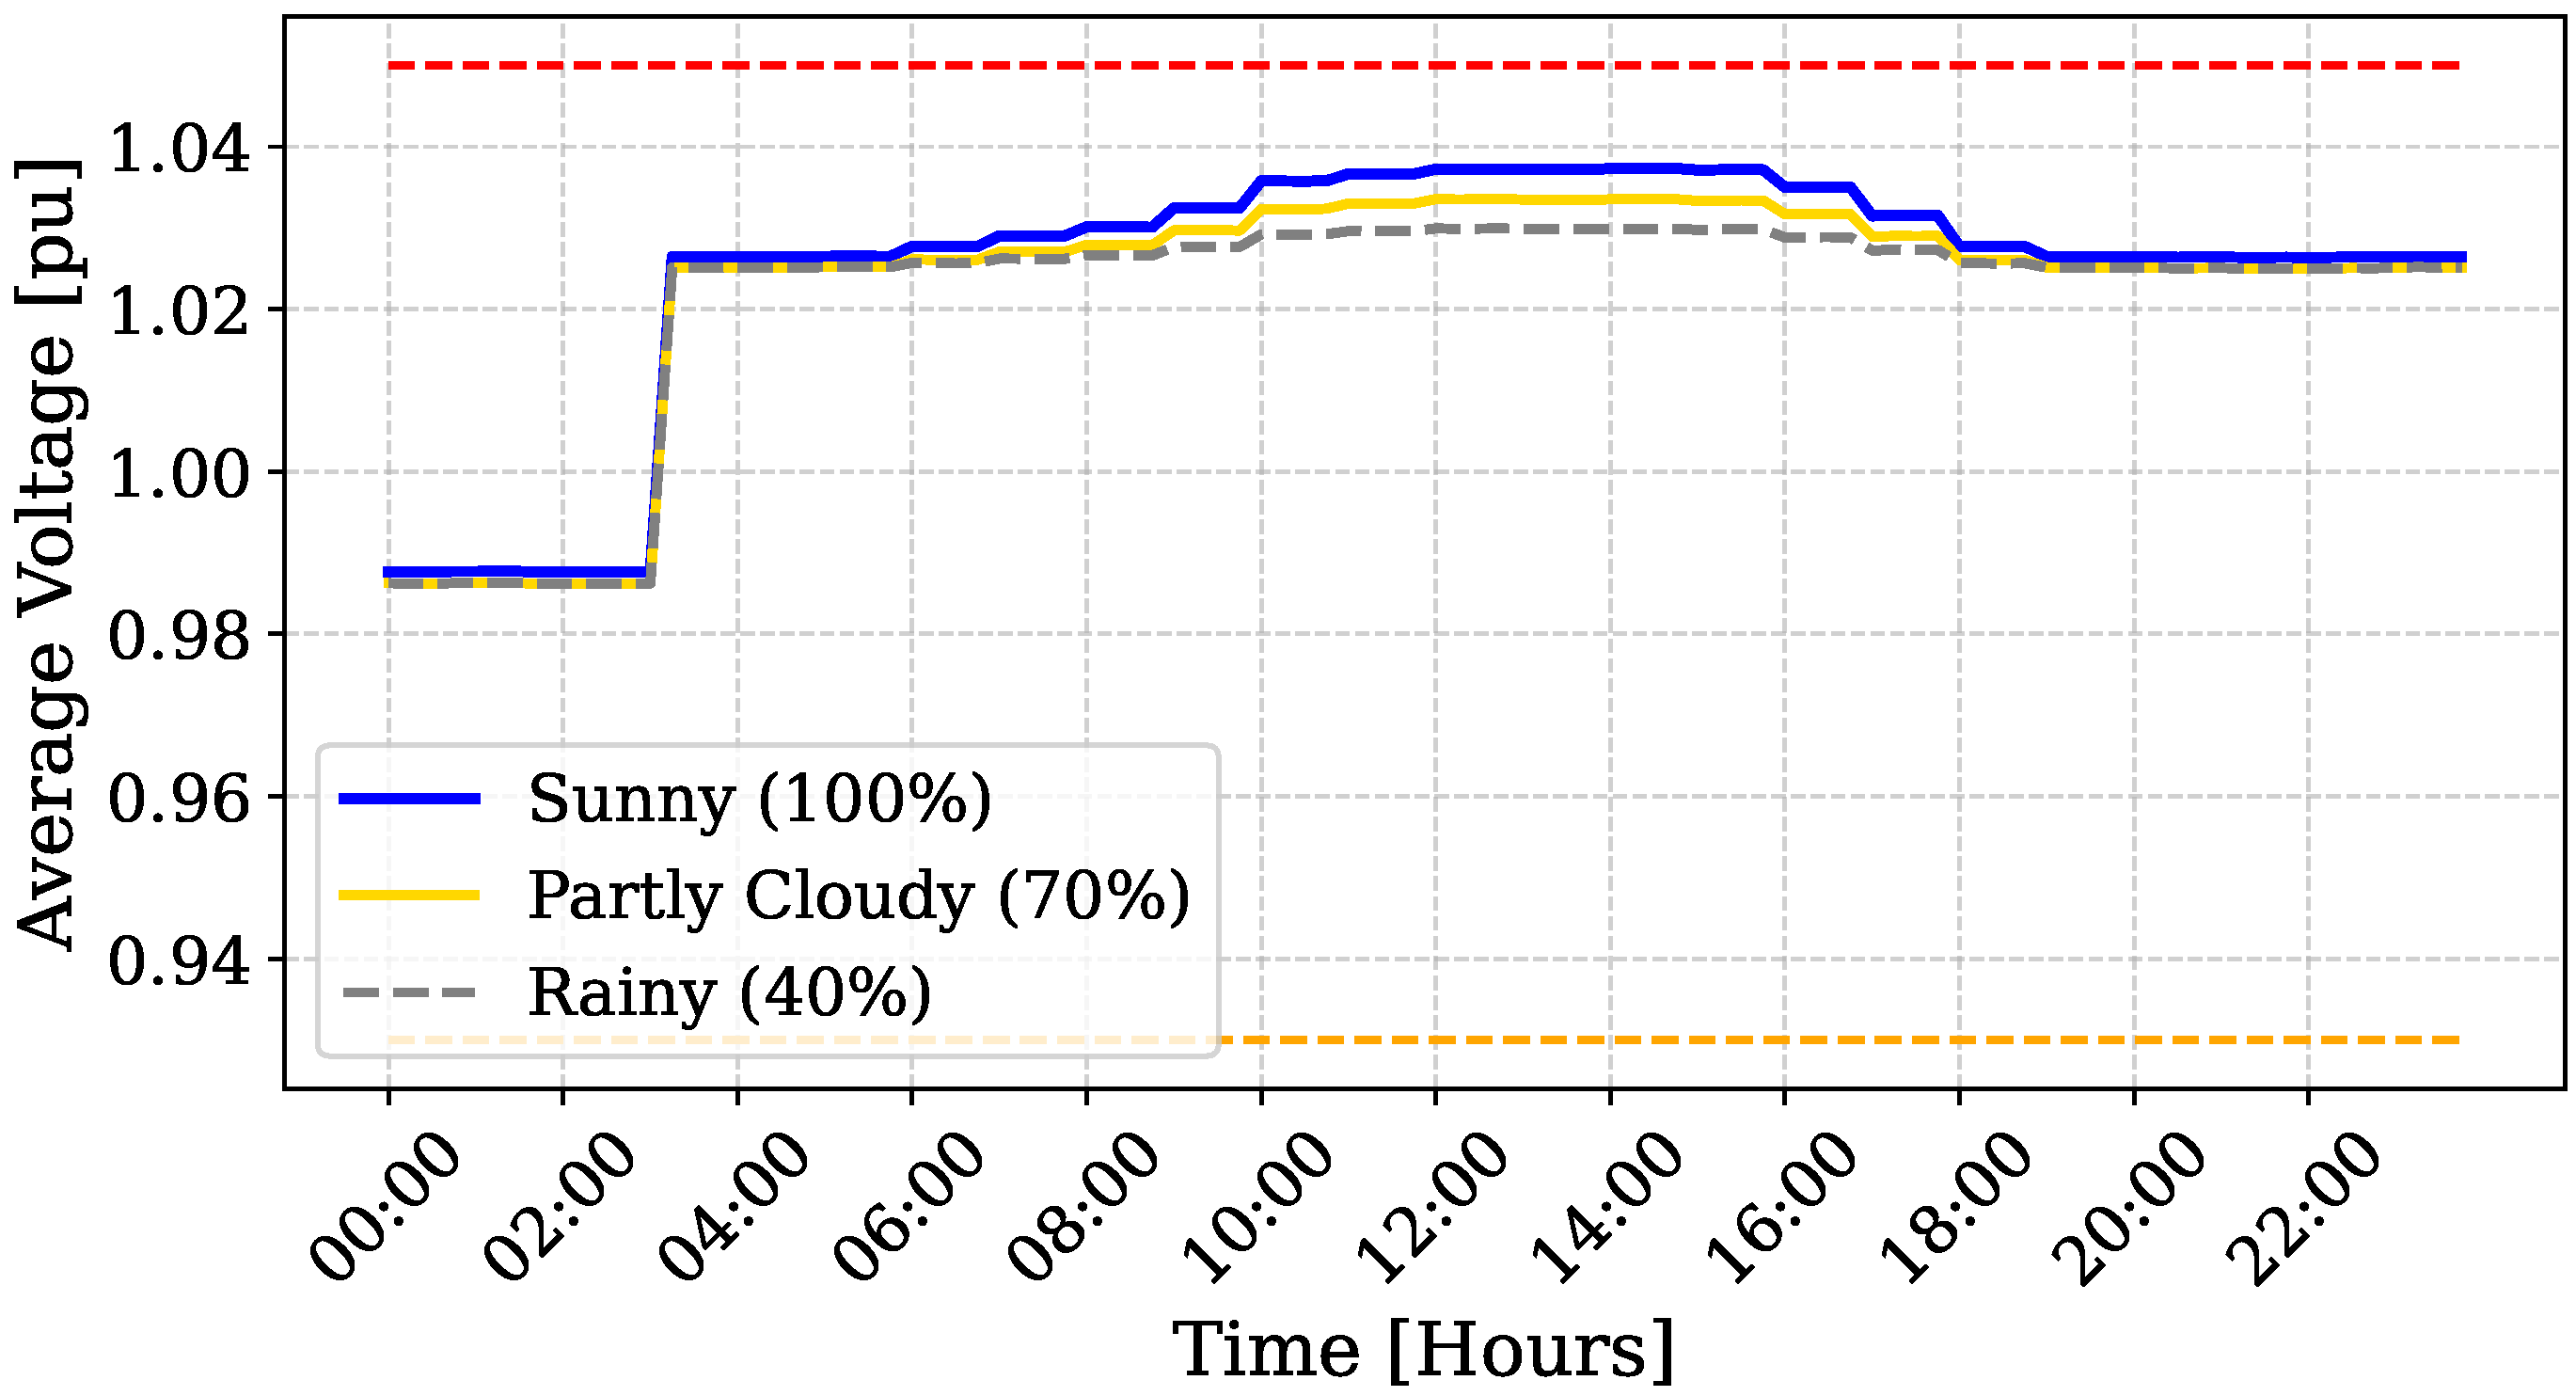
Figure 12 illustrates the voltage profile on the busbar connected to the chargers. During peak charging, the observed minimum voltage was 0.987 pu, reflecting a 3.8% drop compared to the nominal operating point (1.026 pu). At solar generation peak, the voltage increased to 1.037 pu in the sunny case and remained below 1.02 pu in the rainy case, all within the operational limits established by PRODIST Module 8 (0.93–1.05 pu) [
39]. These results demonstrate that even under high irradiance conditions, the feeder remains within acceptable voltage and thermal limits, though reverse power flow is more pronounced during clear-sky days.
It is important to emphasize that, although modern inverters are already equipped with voltage regulation algorithms and the capability to absorb reactive power to mitigate overvoltage, these functionalities are not yet widely adopted in Brazil due to existing regulatory and market constraints. Since end-consumers are primarily incentivized to maximize active energy production (kWh), operating in kVAR control mode typically offers no direct financial benefit and, in some cases, may reduce active energy output when inverters operate near their apparent power limit. For this reason, in this study, PV systems were modeled at unity power factor, reflecting the prevailing operational reality. Nonetheless, future research should investigate scenarios where advanced inverter functionalities are both actively implemented and adequately incentivized, as these could play a decisive role in improving feeder voltage stability and mitigating operational challenges. For instance, inverter-based reactive power control strategies, such as Q–V mode, could be applied to alleviate reverse power flow effects. In addition, daytime Battery Energy Storage Systems (BESS) could be deployed to absorb surplus solar generation and shift it to the nighttime charging window, further enhancing system flexibility and reliability.
5.3. Assessment of the Load Limit on the Feeder in Relation to the Voltage
Figure 13 shows the voltage curve on the charging cable for different scenarios of expansion of the electric fleet: 100, 250, and 500 buses charging simultaneously over 3 h. The objective is to investigate the feasibility of electrifying the entire municipal fleet, which currently comprises approximately 500 vehicles [
40]. The simulation shows that the maximum number of buses that can be charged simultaneously without affecting the voltage profile of the feeder is 118. From this value, violations of the minimum voltage limits begin to occur, characterizing undervoltage during the charging period. This shows that total electrification of the fleet would not be feasible through a single feeder, therefore, requiring a multifeeder or a distributed charging infrastructure.
5.4. Evaluation of the Use of V2G Technology
This section analyzes the technical implications of implementing V2G technology, whereby BEBs discharge stored energy back into the distribution network during peak demand hours from 5:30 p.m. to 8:30 p.m. Note that the timing of this peak demand is a characteristic of the Brazilian sector and may vary depending on the industrial and economic configurations of other regions around the world. Several charging station scenarios were simulated, changing the number of buses that inject power into the grid. Each vehicle was allowed a maximum depth of discharge of 70% of its nominal battery capacity, with at least 30% for operational mobility and battery longevity. These limits follow current best practices to minimize battery degradation over time [
41].
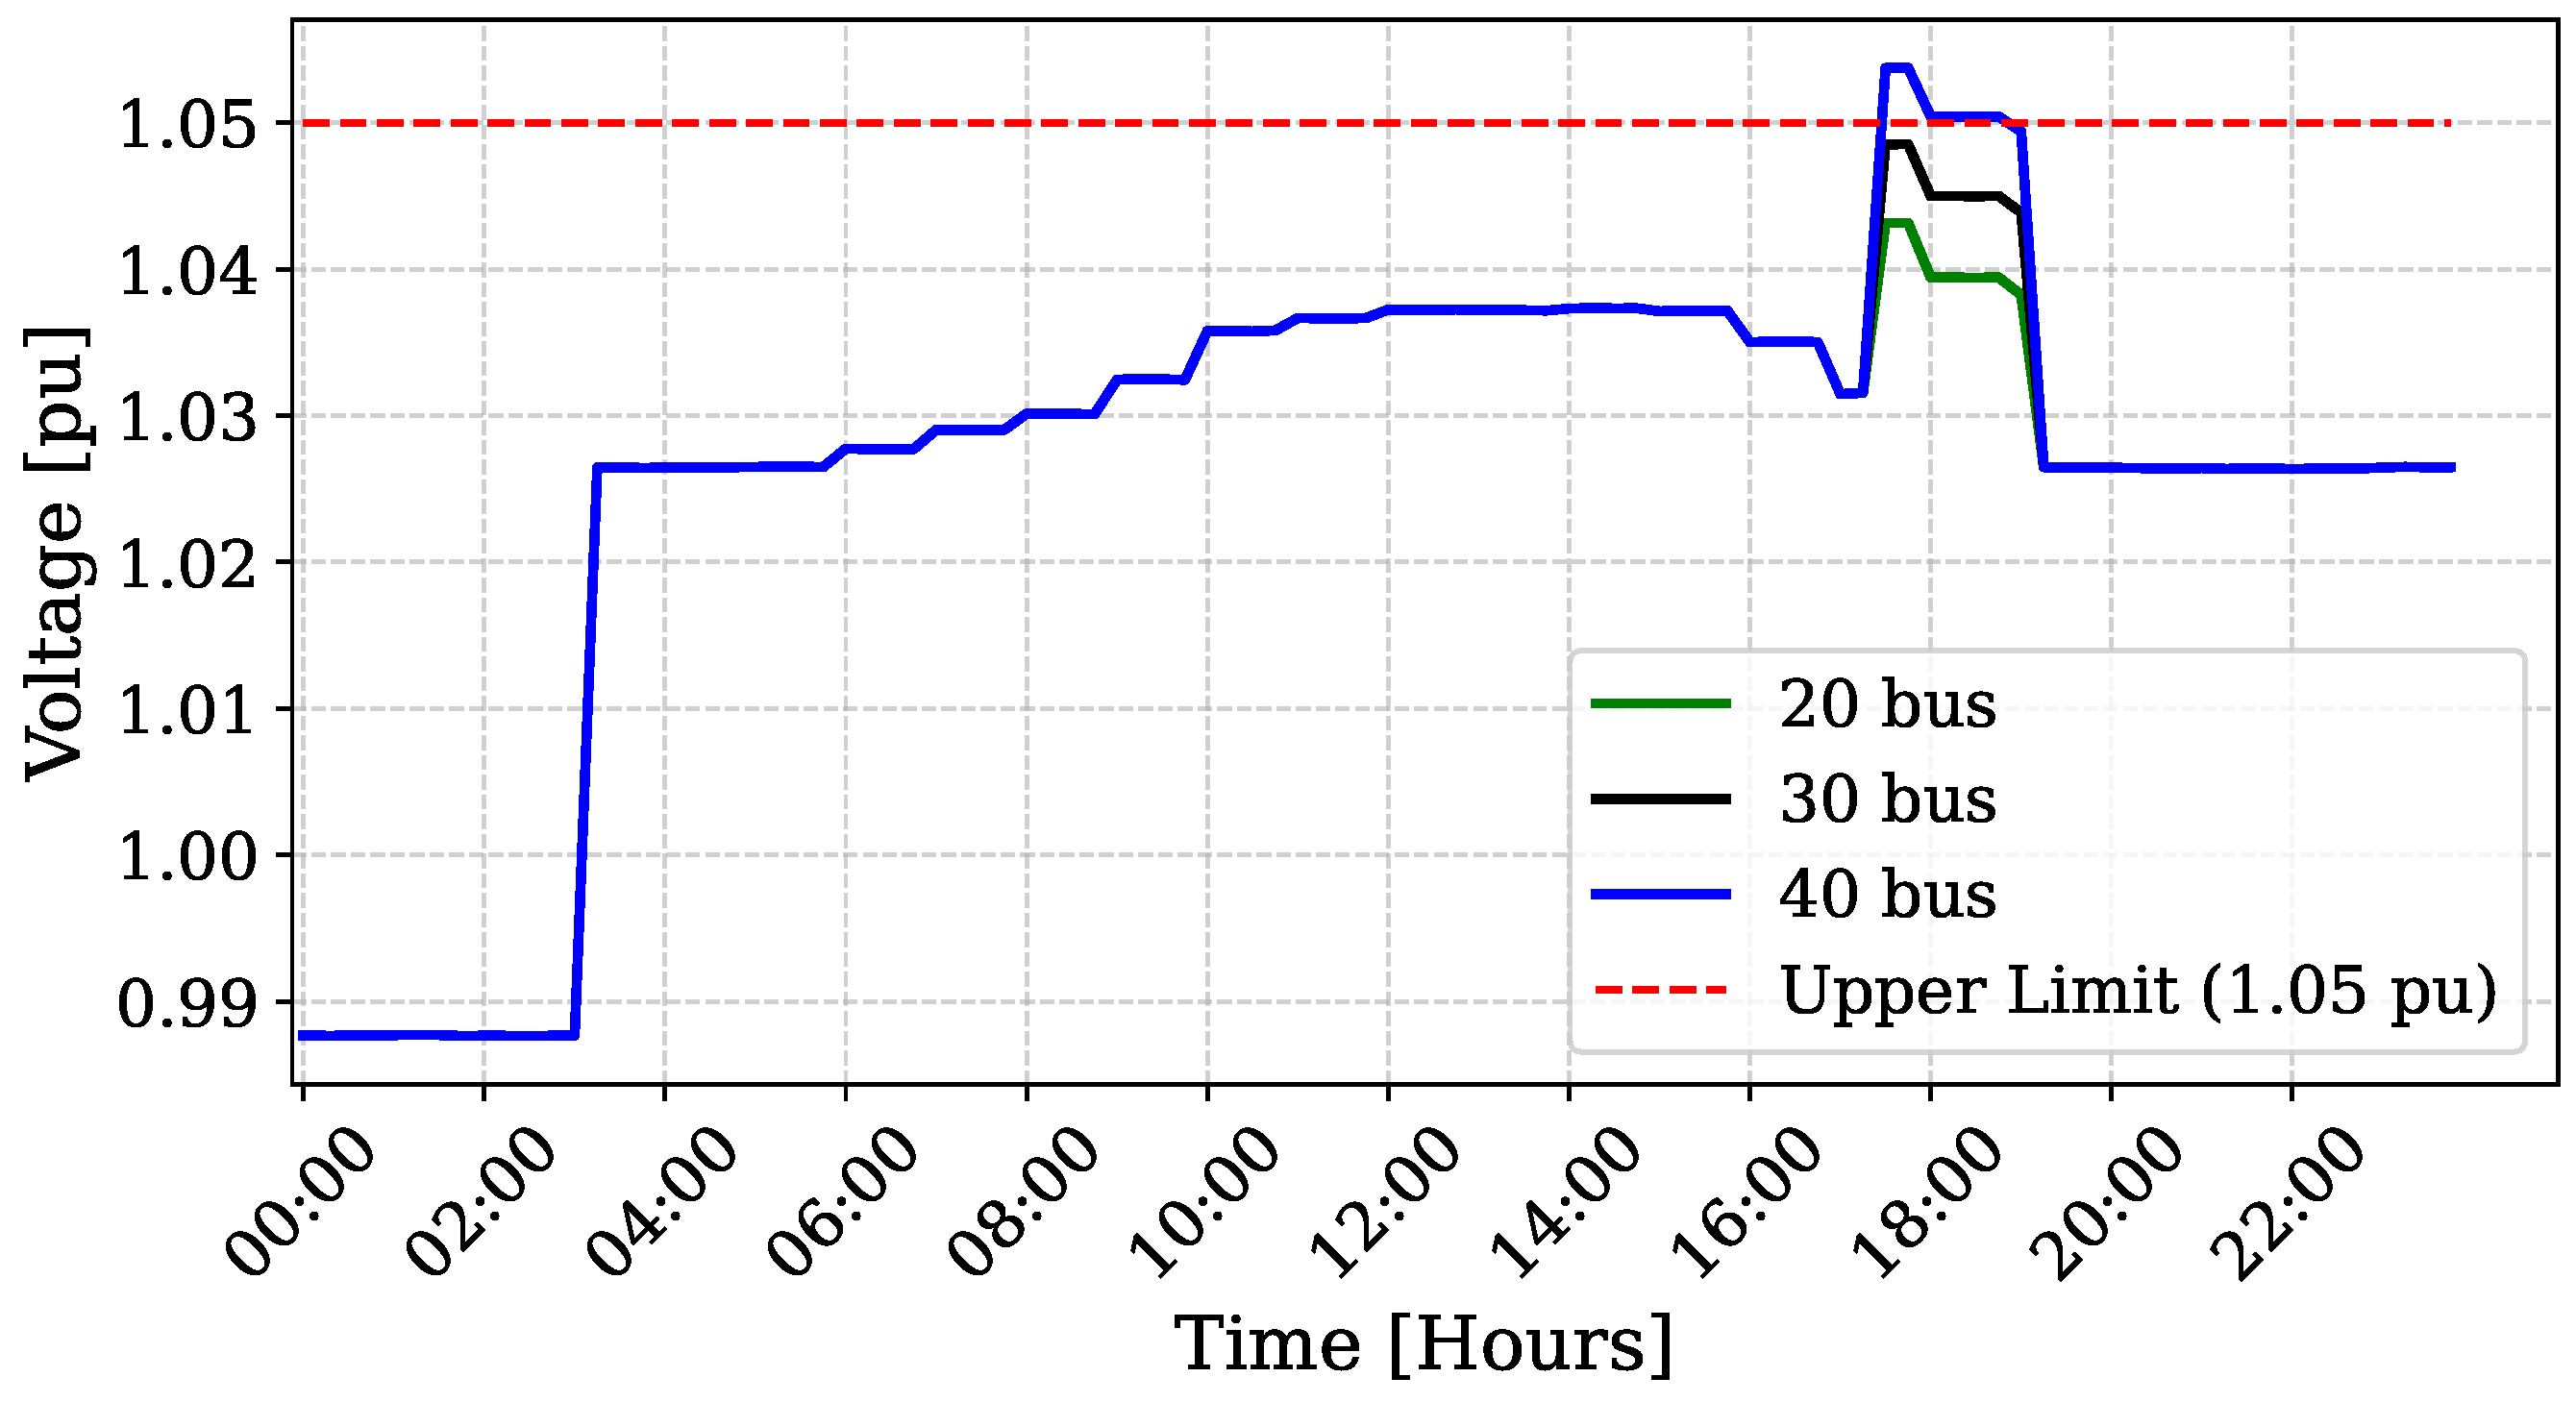
Figure 14 illustrates the voltage profile on the busbar where the chargers are connected. It is observed that when more than 33 buses simultaneously inject energy into the system, voltage levels exceed the regulatory upper limit of 1.05 pu, resulting in overvoltage conditions. This phenomenon is especially prominent during the overlap between residual solar generation in the late afternoon and V2G activity, which reinforces the upward pressure on the local voltage.
These results confirm that while V2G presents a promising solution for grid support during peak hours—potentially contributing to demand response strategies and ancillary services—its deployment must be carefully controlled. To avoid voltage violations and ensure grid stability, it is recommended to implement local voltage-dependent reactive power controls, such as volt-var or volt-watt functions, integrated into the vehicle inverter interface.
In addition, real-time coordination between V2G assets and the distribution system operator is crucial. Time-based injection windows, load-following algorithms, and communication protocols should be established to adjust discharge profiles according to grid conditions dynamically. V2G operation should ideally be restricted or curtailed when combined with significant local distributed generation, as demonstrated in the simulations.
The effective deployment of the proposed smart charging and V2G strategies depends on a supporting infrastructure of sensors and communication systems. A robust automatic control system would require the installation of measurement sensors (e.g., Phasor Measurement Units (PMUs) or advanced smart meters) at strategic points in the feeder to provide real-time voltage and current data. Furthermore, a reliable low-latency communication network (e.g., fibre optic, cellular, or power line communication) is essential to transmit these sensor data to a centralized Energy Management System (EMS) and to issue control actions back to the inverters (both PV and V2G) to adjust active and reactive power setpoints. Although this represents an additional investment, the benefits of avoided infrastructure upgrades and improved grid stability can provide a strong economic justification for this necessary enabling infrastructure. The design and cost-benefit analysis of this sensor and communication network, although beyond the scope of this study, are critical next steps for practical implementation.
In a broader planning context, EMS and Advanced Metering Infrastructure (AMI) can enhance V2G feasibility by enabling dynamic tariffs and flexible dispatch of stored energy. Further research should investigate optimized scheduling algorithms and the integration of V2G within innovative grid architectures to maximize technical benefits while maintaining regulatory compliance.
Although the use of V2G in the system can play a relevant role in meeting energy demand, its implementation should be carefully considered due to practical barriers. First and foremost, the primary function of BEBs is to transport people in the city. Therefore, any V2G strategy should only be implemented during non-operational periods, such as overnight parking or extended stops, to ensure optimal performance. This approach must also ensure that vehicles are fully recharged for the following scheduled route, guaranteeing operational energy availability. V2G participation should never prevent buses from reaching the required charge levels by morning, which imposes strict limits on the volume and timing of discharge. Our simulations assume that exported energy originates only from excess capacity within safe operational margins.
Second, the implementation of V2G requires bidirectional inverters and associated upgrades to switchgear and communication systems. These adjustments imply additional costs, making the solution more viable in newly built charging depots rather than in existing infrastructure, thus, highlighting the need for policy incentives and innovative business models to justify investment.
Third, lithium-ion battery degradation is a significant concern. Deep discharges and frequent cycling can accelerate aging and reduce the useful life of the equipment. Advanced Battery Management Systems (BMS) and warranty frameworks for V2G use are essential to mitigate these effects, for example, through optimized SoC windows and thermal management. This issue has been emphasized in recent studies such as [
25], which demonstrated that coordinated charging strategies considering battery degradation are key to enabling sustainable V2G applications. Similarly, ref. [
42] highlighted the importance of optimizing bus operations together with V2G integration to balance technical feasibility with service reliability in urban transit.
Beyond technical aspects, regulatory, market, and social barriers also constrain V2G adoption. Tariff structures, interconnection standards, and compensation mechanisms remain under development in Brazil and elsewhere. Likewise, public perception of using buses as grid assets requires transparent communication to build trust among operators, regulators, and passengers.
In summary, while the simulations highlight the technical potential of V2G in supporting the distribution grid, practical deployment will depend on addressing operational, economic, and regulatory challenges. Further research should combine grid impact analysis with techno-economic feasibility, battery degradation modeling, and policy frameworks to assess the true scalability of V2G for electric bus fleets.
5.5. Feeder’s Current Carrying Capacity During Charging
This section evaluates the current-carrying capacity of the main feeder under different scenarios involving bus fleet charging and energy injection into the grid. The analysed conductor segment corresponds to a compact overhead aluminium cable with a cross-sectional area of 150 mm
2 and PVC insulation, as described in
Table 4. According to technical specifications, this conductor has a continuous current rating of 291 A and a maximum allowable current of 415 A.
For this evaluation, the following cases were simulated:
Case 1: Original feeder, without connecting BEBs.
Case 2: Nighttime charging of 50 BEBs simultaneously, with insertion of distributed generation at day.
Case 3: Nighttime charging of 118 BEBs, which has been shown as a threshold for adequate voltage levels according to the methodology discussed in
Section 5.3.
Case 4: Power injection through V2G by 32 BEBs, during peak hours.
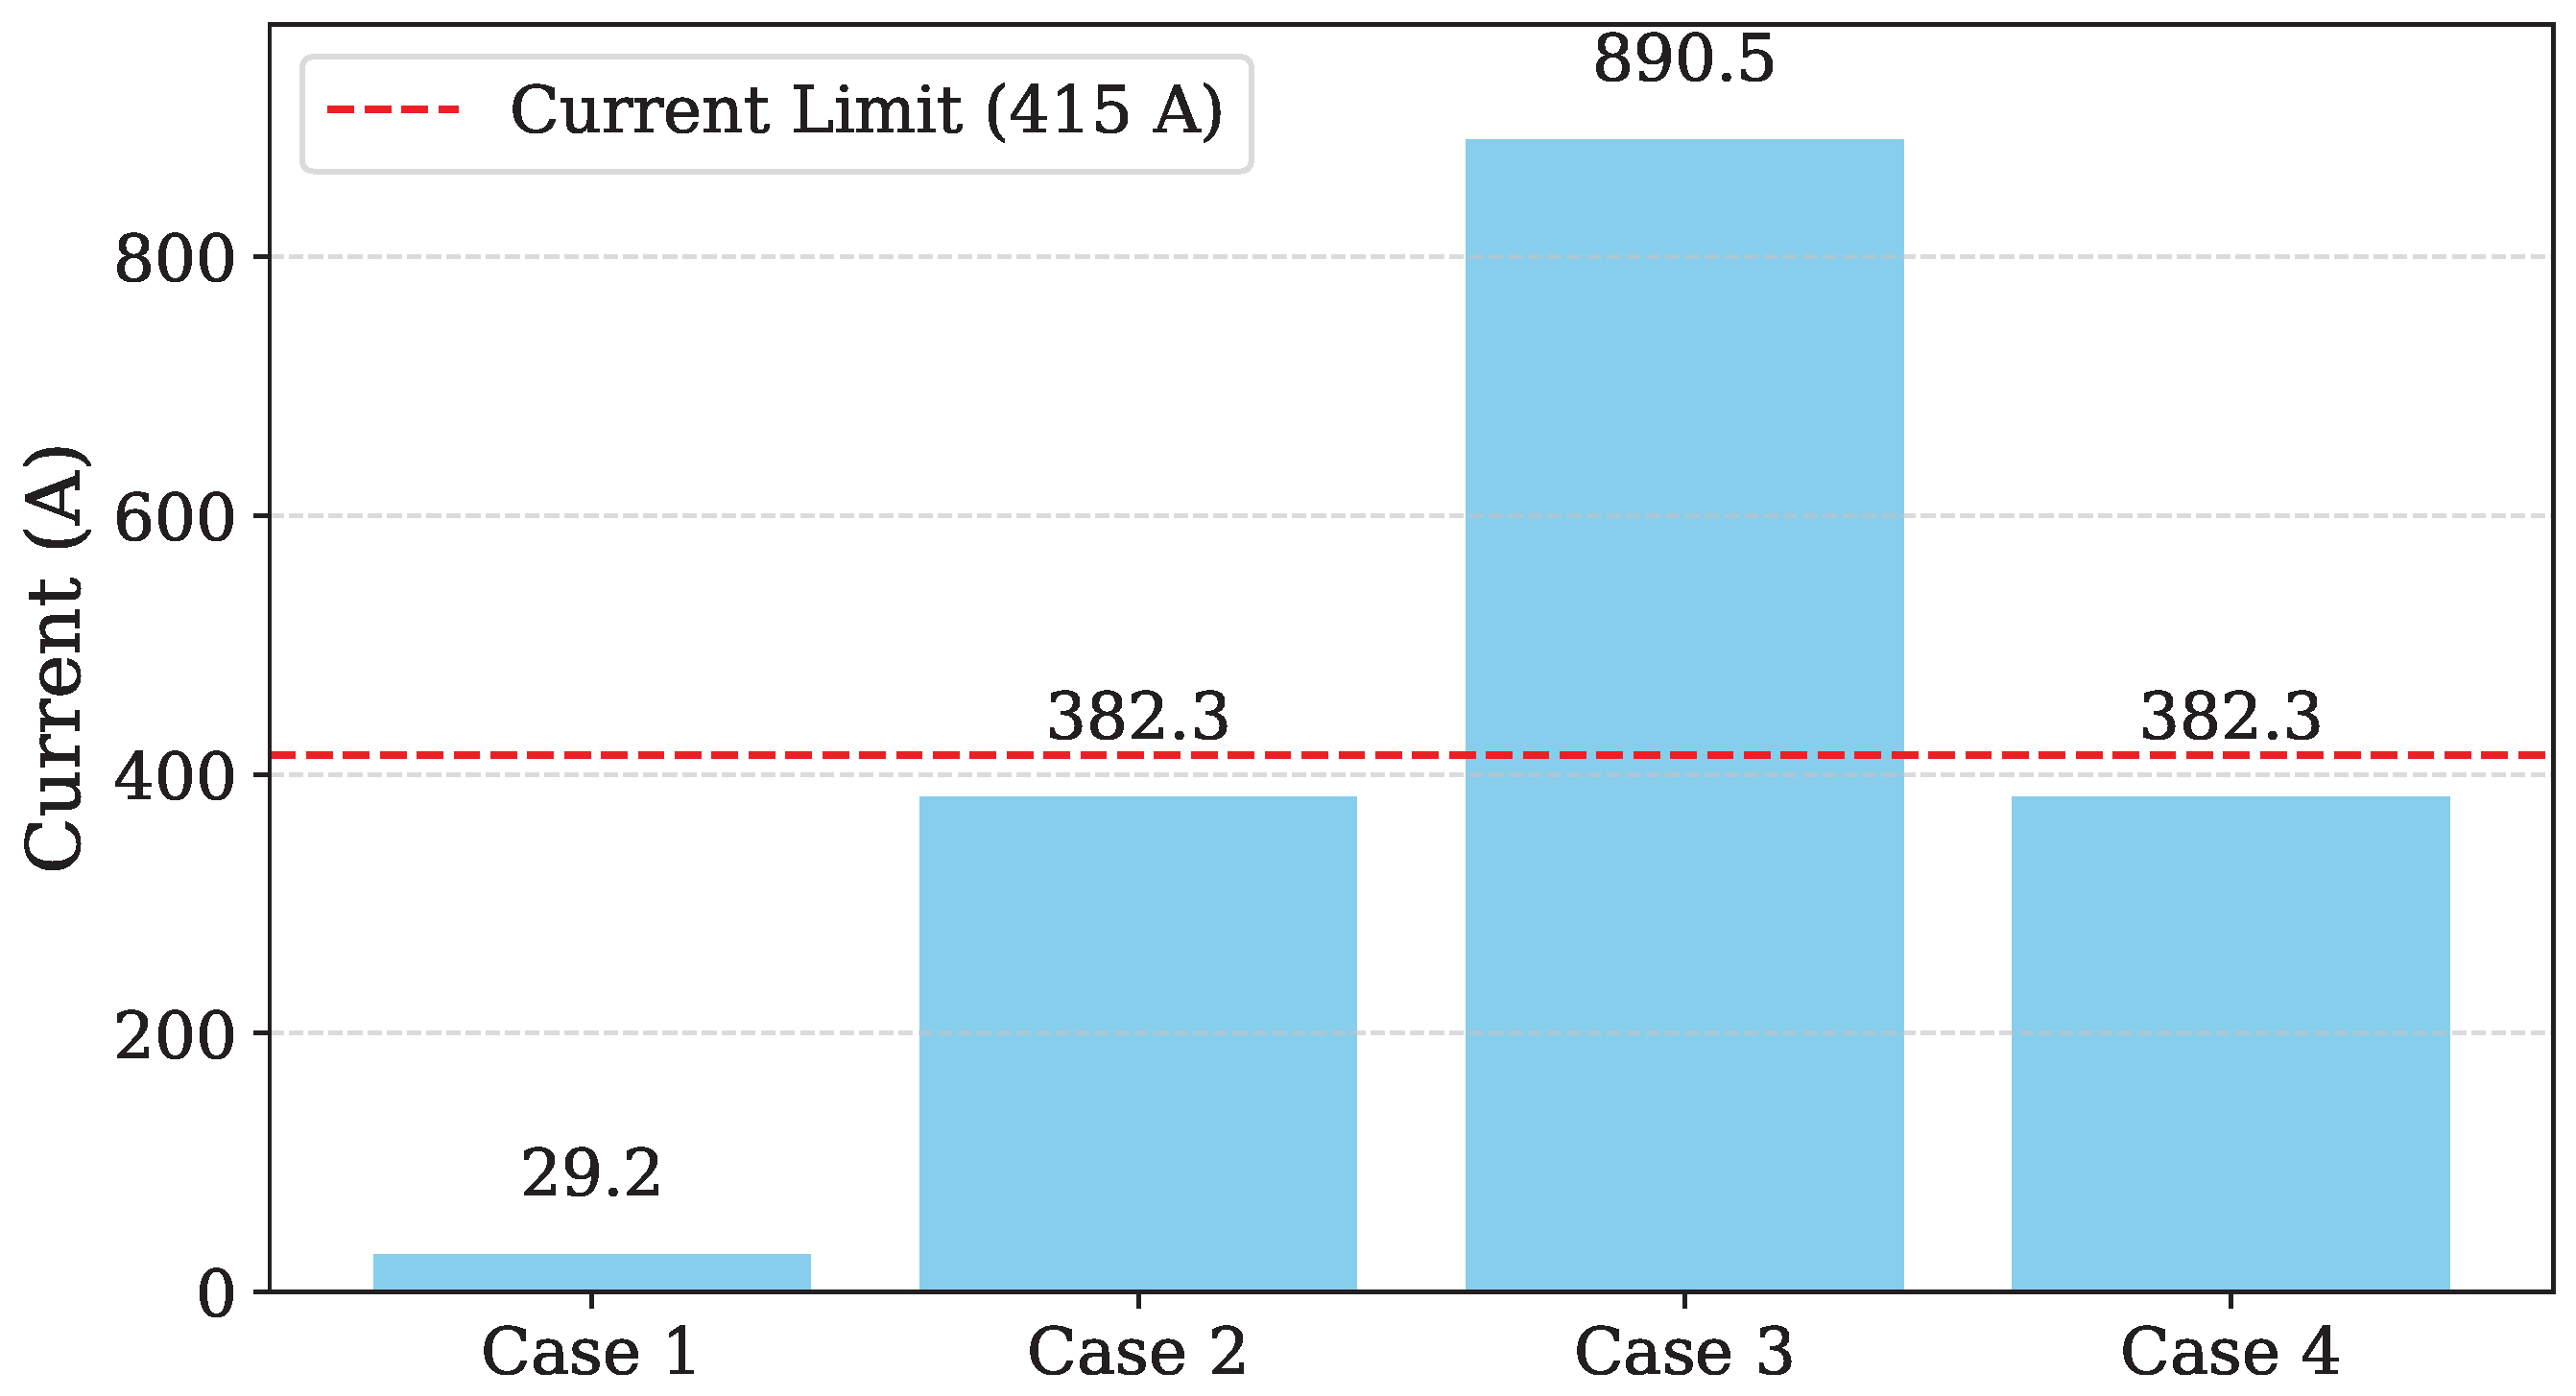
Figure 15 presents the peak current values recorded in the main feeder segment for each scenario. Case 1 showed a current well below the thermal limit, peaks at 29.2 A, reflecting only local residential and commercial loads. In Case 2, the maximum current rose to 382.3 A, still within the absolute limit but close enough to warrant attention under real operating conditions.
Furthermore, our analysis revealed a critical thermal overload threshold at 56 simultaneously charged buses, where the current exceeded the 415 A limit. This finding indicates that, while 118 buses might be feasible from a voltage perspective, the thermal capacity of the feeder is saturated much earlier, with only 56 buses. This result was not shown in the figure because of its similar behavior to Case 2.
In Case 3, with 118 buses charging simultaneously, the maximum current reached 890 A, exceeding the permissible limit by more than twice. This result characterizes a severe thermal overload condition, exposing the conductor to accelerated degradation or failure. In a real system, this condition would trigger protection devices and would not be operationally viable without the reinforcement of the infrastructure.
Case 4, referring to V2G injection, showed the same maximum current as Case 2 (382.3 A), confirming that controlled discharge during peak hours does not compromise the thermal capacity of the conductor under the simulated conditions. However, it is essential to note that prolonged injection or exposure to high ambient temperatures can reduce the effective current-carrying capacity.
To evaluate the sensitivity of feeder performance to conductor sizing, alternative cross-sections of 185 mm
2, 240 mm
2, and 300 mm
2 aluminium conductors (multifilar, class 2, IEC 60228/EN 60228) were considered in addition to the existing 150 mm
2 cables. The nominal current ratings were obtained from IEC 60364-5-52 [
43].
Table 5 summarizes the maximum current supported and the corresponding number of BEBs that could be simultaneously charged without exceeding thermal limits.
The sensitivity analysis confirms that increasing the size of the conductor can significantly expand the feeder hosting capacity, reducing both voltage deviations and thermal overloads. Specifically, replacing the 150 mm2 conductors with 240 mm2 or 300 mm2 alternatives increases the feasible number of buses. These findings highlight the urgent need for infrastructure reinforcement in large-scale electrification scenarios. Some viable strategies include:
Although this study provides a static view of current peaks, future work should consider conductor thermal time constants and ambient temperature effects for a more accurate assessment of ageing and allowable operation time under overload conditions and staggered charging algorithms.
5.6. Discussion
The simulation results presented in this study provide important insights into the technical challenges and opportunities associated with the large-scale integration of the BEBs related with distributed photovoltaic generation in a medium-voltage distribution feeder. In the initial case, the system operates within the voltage limits, and the presented infrastructure can deal with the thermal stress caused by the operative current. However, as the number of buses increases, the feeder becomes more loaded and presents operational constraints, especially considering the ampacity, requiring a reinforcement scheme.
Numerically, without the presence of the buses, the lowest registered voltage level was 1.0261 pu, whereas after the insertion of 50 buses, the minimum observed voltage dropped to 0.987 pu. It is also relevant to emphasize that the peak load was shifted from the afternoon to the evening. However, simulation of photovoltaic generation revealed the occurrence of reverse power flow during certain hours of the day, highlighting the importance of inverter-based voltage regulation strategies. When considering the electrification of the entire fleet, the results indicated that while voltage limits were respected up to 118 buses, the current carrying capacity of the feeder was already exceeded with only 56 buses, exposing the system to critical thermal overload. Therefore, considering the primary role of buses, that is, transporting people along predefined routes, these results reveal the necessity of a dedicated charging scheme for BEVs. This approach would enable scheduling the charging process according to the minimum energy required for daily operation on each route, aligning technical feasibility with the operational goals of the fleet.
The evaluation of V2G technology confirmed that this strategy can provide adequate support through power injection during peak hours, thereby enhancing the system’s robustness in meeting energy demand. Nevertheless, several concerns arise when this process is considered in practice. The simulations revealed overvoltage conditions when V2G coincided with PV generation, underscoring the need for real-time monitoring, inverter-based functionalities such as volt-var or volt-watt control, and reliable communication between operators and charging infrastructure. Although the analysis demonstrated the potential of V2G as an auxiliary support mechanism for the distribution network, further studies are required to consolidate it as a viable solution, particularly under contingency scenarios where system resilience is critical.
It should be noted that the V2G strategy evaluated in this study represents a technical feasibility assessment rather than an operational implementation. In practice, BEBs must prioritize their primary function of passenger transportation and, thus, cannot regularly discharge energy to the grid without affecting service availability. Nevertheless, as electric bus fleets expand, it is foreseeable that some vehicles will remain idle or off-duty for extended periods, such as during maintenance or non-peak hours. In such cases, these buses could be strategically deployed to provide grid support services (e.g., voltage regulation or emergency backup) in specific or contingency scenarios, offering additional flexibility to the distribution network.
The performed studies demonstrated the technical feasibility of integrating BEBs into the system, including the potential reinforcement of conductors to address ampacity constraints, which proved to be more critical than voltage limitations. However, since the analysis was carried out in a computational environment, additional challenges are expected in practical field implementation. Furthermore, the loads were modeled deterministically, without explicitly capturing stochastic variability or operational uncertainties. In this context, future work could include experimental validation, non-linear stochastic loads, and optimization techniques to define charging load shapes that take into account route requirements and state-of-charge conditions.
6. Conclusions
The new proposal evaluated the technical impacts of BEB implementation in a real medium-voltage distribution feeder in Cuiabá, Brazil. This study considered PV generation, V2G operation, and the potential for conductor reinforcement. The findings provided clear insights into the system’s limitations, especially in the context of bus fleet electrification.
Considering only voltage constraints, up to 118 BEBs can be charged without violating the regulatory minimum voltage requirement. The system registered a minimum of 0.987 pu, compared to 1.026 pu in the base case. Nevertheless, the thermal limits related to cable ampacity proved to be more restrictive, since only 56 buses can be charged without exceeding the conductor’s capacity. This confirms a common observation in power systems: ampacity is usually more critical than voltage stability.
PV generation covered about 64.12% of the fleet’s daily energy demand; however, reverse power flow and rising voltage levels were observed, confirming the need for inverter-based voltage regulation. This analysis introduced a quantitative contribution by establishing a relationship between PV penetration levels, voltage deviations, and reverse flow in the feeder in Cuiabá. Regarding V2G operation, although its development in field applications raises some concerns, the study showed that BEB operation under such conditions can support the grid during peak hours.
Moreover, the sensitivity analysis of conductor reinforcement showed that increasing the nominal cross-section from 150 mm2 to 300 mm2 increased the number of buses that can be charged simultaneously from 56 to 114, nearly doubling the initial value. This result demonstrates that such infrastructure modification provides an immediate engineering solution to allow more BEBs to be integrated into the charging process at the same time.
Finally, it is important to highlight that a thorough economic feasibility study must precede any decision on large-scale implementation. This study should consider not only initial investment costs, but also operational costs, revenue potential from V2G services, infrastructure reinforcement costs, and investments in monitoring and control systems.

