


Abstract
Background/Objectives: Gallic acid (GA) is a natural phenolic acid with reported antioxidant, anti-inflammatory, and antibacterial properties, but its limited skin permeation restricts its topical application. Although previous studies have demonstrated the potential of transethosomal formulations to enhance dermal GA delivery, their liquid dispersion form hinders practical topical use. Methods: The aim of this study was to investigate the effects of chitosan molecular weight, chitosan concentration, and transethosome proportion on the GA release, pH, and spreadability of GA-loaded transethosomal chitosan gel using a Design of Experiments (DoE)-guided approach. First, transethosomes were synthesized using the cold method and assessed for physicochemical properties, in vitro permeability, and physical stability. Next, transethosomal gels were prepared based on a three-level full factorial DoE model. The results were analyzed using polynomial regression modeling and sweet spot analysis. The model-predicted exploratory sweet-spot region was experimentally verified, followed by additional assessments of drug content and content uniformity, rheological properties, and short-term physical stability. Results: GA-loaded transethosomes had a diameter of 167.3 ± 9.9 nm, an encapsulation efficiency of 71.6 ± 5.7%, and substantially higher in vitro permeability across Strat-M® synthetic membranes (2520.77 ± 66.93 µg/cm2 within 24 h) compared to aqueous GA solution. After incorporation into chitosan gel, GA release at 6 h ranged from 65.5% to 93.2%. Formulations showed pH values of 3.93–4.46 and spreadability of 12.6–122.7 cm2. Increased chitosan concentration reduced GA release and increased pH toward the target range, while higher chitosan concentration and molecular weight restricted spreading. Rheological characterization revealed shear-thinning behavior. Conclusions: The DoE-guided approach supported exploratory screening of GA-loaded transethosomal chitosan gels and provided insights into the relationships between formulation composition, GA release, pH, and spreadability.
1. Introduction
Gallic acid (GA), also known as 3,4,5-trihydroxybenzoic acid, is a naturally occurring phenolic acid and secondary plant metabolite commonly found in botanical sources such as tea leaves and oak bark, as well as in various dietary sources, particularly in fruits and nuts [1,2]. Based on its antioxidant, anti-inflammatory, and antibacterial properties reported in the literature, GA is considered a promising candidate for the topical management of dermatological conditions associated with barrier dysfunction, where oxidative stress, prolonged inflammation, and bacterial infections contribute to disease progression [3,4,5].
However, the topical application of GA is limited by its biopharmaceutical properties. In the Biopharmaceutics Classification System (BCS), GA is classified as a Class III compound, meaning that it has high aqueous solubility but low membrane permeability [6]. This can lead to poor absorption and limited tissue penetration, which is particularly important for topical delivery, where the active compound must cross the skin barrier to reach the target site [7]. Therefore, advanced dermal drug-delivery systems are being investigated to improve local GA delivery and support further evaluation of its potential topical applications.
To address these limitations, various nanocarrier-based systems have been investigated to improve GA delivery. These include lipid-based carriers, such as solid lipid nanoparticles, liposomes, transfersomes, niosomes, and ethosomes, as well as polymeric and colloidal systems, including nanocapsules, micelles, dendrimers, and nanogels [6]. Previous studies suggest that these systems may enhance GA delivery by improving formulation stability, modulating drug release, and, in some cases, promoting drug deposition at the intended site [6,8].
Among the lipid nanocarriers, transethosomes, consisting of phospholipids, ethanol, and edge activators, have been described as promising systems for dermal drug delivery due to their reported flexible vesicular structure and permeation-enhancing composition [9,10]. Previous studies suggest that ethanol can influence stratum corneum lipid organization and vesicle membrane flexibility, while edge activators may reduce bilayer rigidity, potentially contributing to enhanced drug permeation [11]. To the best of our knowledge, only one study has reported developing GA-loaded transethosomes [12]. However, the composition of the final gel matrix has not been systematically studied as a separate set of formulation factors, even though it is a crucial step toward a practically applicable drug delivery system.
In nanoparticle-based topical formulations, development strategies often focus on optimizing particle engineering aspects such as particle size, polydispersity index (PDI), and encapsulation efficiency (EE%). However, nanoparticle dispersions alone typically have low viscosity, which can limit their practical application, skin retention, and patient adherence, making their incorporation into a gel matrix an important step toward a usable final dosage form [13]. Therefore, selecting and optimizing the gel matrix is as important as developing the transethosomal carrier, because the matrix can critically influence the physicochemical, mechanical, and biopharmaceutical properties of the final dosage form.
Consequently, the choice of gel-forming polymer becomes a key formulation decision. In this context, chitosan is a particularly relevant candidate because it is a biocompatible, biodegradable polysaccharide derived from chitin, the second most abundant polysaccharide in nature [14]. It has also been reported to exhibit antibacterial, anti-inflammatory, and wound-healing properties [15,16].
The Food and Drug Administration (FDA) has recognized chitosan as generally safe for use in the dietary industry, supporting its use as a natural preservative, while accepted chitosan-based wound dressings further demonstrate its regulatory acceptability and biomedical relevance [17]. Altogether, these properties make chitosan a promising gel matrix for nanoparticle-based topical delivery.
The aim of this study was to investigate the effects of chitosan molecular weight, chitosan concentration, and transethosome proportion on GA release, pH, and spreadability of GA-loaded transethosomal chitosan gel using a Design of Experiments (DoE)-guided approach. Polynomial regression modeling was applied to identify and experimentally verify a multi-response region in which controlled GA release could be balanced with the physicochemical and practical requirements of a suitable topical gel. Previous research indicates that chitosan molecular weight, concentration, and transethosome incorporation can significantly influence the structural integrity, drug release properties, and practical applicability of a gel matrix [13,18]. However, to the best of our knowledge, this is the first study to apply DoE-based modeling to optimize the chitosan gel matrix containing transethosomes.
2. Materials and Methods
2.1. Materials
GA was purchased from Fluorochem Ltd. (Hadfield, UK). Phospholipon® 90 G, granulated soy phosphatidylcholine containing >94% phosphatidylcholine, was obtained from Lipoid GmbH (Ludwigshafen, Germany). Tween 80 (polysorbate 80), low molecular weight chitosan (LMW; 50–190 kDa), medium molecular weight chitosan (MMW; 190–310 kDa), high molecular weight chitosan (HMW; 310–375 kDa), and potassium dihydrogen phosphate were purchased from Sigma-Aldrich (St. Louis, MO, USA). Acetic acid was obtained from Honeywell Fluka (Seelze, Germany), and disodium hydrogen phosphate dodecahydrate was obtained from Carl Roth GmbH + Co. KG (Karlsruhe, Germany). All other chemicals and solvents used were of analytical grade. Four commercially available topical gels containing carbomer-type polymers as the primary gelling agents were used as reference products for spreadability assessment and coded as RG1–RG4.
2.2. Preparation of Transethosomes
Transethosomes were prepared using a slightly modified cold synthesis method developed by Ferrara et al. [19]. The lipophilic phase was prepared by dissolving Tween 80 and Phospholipon® 90 G in ethanol (96.2%, v/v) at concentrations of 0.4% (w/v) and 3.0% (w/w), respectively. For each 5 mL batch, 3.5 mL of the aqueous phase was added dropwise to 1.5 mL of the lipophilic phase under continuous magnetic stirring at 2000 rpm using an MS-3000 magnetic stirrer (Biosan SIA, Riga, Latvia) at room temperature (22 ± 2 °C). The aqueous phase was added manually using a 100–1000 µL pipette (Sartorius, Göttingen, Germany) at a rate of 30 drops/min. For blank transethosomes, distilled water was used as the aqueous phase, whereas for GA-loaded transethosomes, GA was dissolved in water. The GA content in transethosomes was 5 mg/mL. After adding the aqueous phase, the tube was closed and sealed with Parafilm® to minimize ethanol evaporation, followed by 30 min of continued stirring. The formulation remained sealed during refrigerated storage at 4 ± 2 °C until further analysis.
2.3. Characterization of Transethosomes
2.3.1. Particle Size, Polydispersity Index and Zeta Potential
Size as hydrodynamic diameter, polydispersity index, and zeta potential were measured by dynamic light scattering (DLS) using a Litesizer™ DLS 700 (Anton Paar GmbH, Graz, Austria). Before analysis, samples were diluted 20-fold (1:20, v/v) with distilled water and measured immediately after dilution. Measurements were performed at 25 °C using three independently prepared batches of each transethosome formulation, and the results were expressed as mean ± standard deviation (SD).
2.3.2. Encapsulation Efficiency
Encapsulation efficiency (EE%) was determined using an indirect centrifugal ultrafiltration method [20]. GA-loaded transethosomes were centrifuged at 14,000 rpm for 20 min using a Sigma 1-14K centrifuge (Sigma Laborzentrifugen GmbH, Osterode am Harz, Germany) and a centrifugal filter with a molecular weight cut-off (MWCO) of 10 kDa (Amicon® Ultra-10K, Millipore, Billerica, MA, USA) to separate free, non-encapsulated GA. The filtrate was collected, and free GA concentration was determined by ultraviolet–visible (UV–Vis) spectrophotometry at 260 nm on a Mettler-Toledo UV7 spectrophotometer (Mettler-Toledo International Inc., Greifensee, Switzerland). Quantification was performed using a calibration curve of GA dissolved in water (R2 = 0.9996); distilled water was used as the blank. The analytical method was further evaluated for the limit of detection (LOD), limit of quantification (LOQ), accuracy, and precision according to the principles outlined in the ICH Q2(R2) guideline [21]. The LOD and LOQ were 0.50 and 1.52 µg/mL, respectively. The method demonstrated an accuracy of 97.8 ± 1.6% (mean recovery), with intra- and inter-day precision, expressed as relative standard deviation (RSD), of 1.2% and 1.8%, respectively. Encapsulation efficiency was calculated according to Equation (1):
2.3.3. Fourier Transform Infrared Spectroscopy
Attenuated total reflectance Fourier transform infrared spectroscopy (ATR-FTIR) was used to identify characteristic GA and transethosomal absorption bands. Before analysis, blank and GA-loaded transethosomes were lyophilized at −80 °C and 0.05 mbar for 24 h using a Zirbus Technologies VaCo 2.0 freeze dryer (Zirbus Technologies GmbH, Bad Grund, Germany) to obtain dry powder samples. Pure GA, lyophilized blank transethosomes, and lyophilized GA-loaded transethosomes were analyzed using an iS5 FTIR spectrometer equipped with an iD7 ATR accessory (Thermo Fisher Scientific, Waltham, MA, USA). Spectra were recorded using OMNIC software (version 9.11.706) over 4000–400 cm−1, with 16 scans per sample and a resolution of 4 cm−1. The obtained spectra were normalized using the peak normalization function in SpectraGryph 1.2.17 software (Friedrich Menges, Oberstdorf, Germany) [22], setting the highest peak intensity in each spectrum to 1. Subsequently, the spectra were compared to identify characteristic absorption bands associated with GA and the transethosomal matrix.
2.3.4. Physical Stability of GA-Loaded Transethosomes
GA-loaded transethosomes were evaluated for physical stability over 6 months. Samples were aliquoted and stored in triplicate under three conditions—room temperature under ambient light (22 ± 2 °C), room temperature in the dark (22 ± 2 °C), and in a refrigerator at 4 ± 2 °C. At predetermined time points, the hydrodynamic diameter, PDI, and zeta potential were measured by DLS as described in Section 2.3.1.
2.3.5. In Vitro Permeation Testing
A proof-of-concept in vitro permeation study evaluated the permeability-enhancing potential of GA-loaded transethosomes across Strat-M® synthetic membranes compared with an aqueous GA solution. The experiment was performed using a method adapted from Santamaria et al. [23]. Clear glass, jacketed Franz diffusion cells (PermeGear Inc., Allentown, PA, USA) with an effective diffusion area of 1.00 cm2 and an 8 mL receptor volume were used. The receptor compartment was filled with a 50:50 (v/v) mixture of phosphate-buffered saline (PBS, pH 5.5) and ethanol (96.3%), maintained at 37 °C, and continuously stirred at 600 rpm.
After a 30 min equilibration period, 1.0 mL of either GA-loaded transethosomes or aqueous GA solution (5 mg/mL GA) was introduced into the donor compartment, which was then sealed with Parafilm® M to minimize evaporation. Samples (0.5 mL) were withdrawn from the receptor compartment at hourly intervals up to 13 h and after 24 h, with immediate replacement by an equal volume of fresh receptor medium.
The concentration of permeated GA in the collected samples was determined by UV-Vis spectrophotometry at 260 nm. Quantification was performed using a GA calibration curve prepared in a 50:50 (v/v) mixture of PBS (pH 5.5) and ethanol (96.3%) (R2 = 0.9998), using the same medium as the blank. Following the approach described in Section 2.3.2, the LOD and LOQ values were 0.24 and 0.73 µg/mL, respectively. Accuracy assessment yielded a mean recovery of 98.2 ± 1.3%, while the RSDs for intra- and inter-day precision were 1.7% and 2.1%, respectively. The cumulative amount of GA permeated per effective diffusion area (1.00 cm2), expressed as µg/cm2, was plotted against time. The percentage of permeated GA was calculated relative to the GA amount in the donor compartment (5 mg). Experiments were performed in triplicate, and results were expressed as mean ± standard deviation (SD).
2.4. Experimental Design
A three-level full factorial design was generated and evaluated using MODDE Pro 13.1 software (Sartorius Stedim Data Analytics AB, Umeå, Sweden). Three formulation variables were investigated: the chitosan molecular weight grade (X1: LMW, MMW, and HMW), the initial chitosan concentration in the gel base before transethosome incorporation (X2: 2.0%, 3.0%, and 4.0%, w/v), and the transethosome proportion in the final formulation (X3: 25%, 50%, and 75%, v/w). The evaluated responses were GA release after 6 h (Y1, %), formulation pH (Y2), and spreadability (Y3, cm2). The X1–X3 and Y1–Y3 numbering was used only for MODDE coding and does not indicate a hierarchy among the variables and responses. A total of 30 formulations were prepared, comprising 27 factorial combinations and three center-point replicates. Each experimental run involved a single determination of each response, while the replicated center-point runs were included to estimate experimental variability and support model adequacy assessment. The complete experimental matrix is presented in Section 3.2.
2.5. Preparation of Transethosome-Loaded Chitosan Gels
Firstly, 2.0%, 3.0%, and 4.0% chitosan gels (w/v) were prepared for each chitosan molecular weight grade (LMW, MMW, and HMW) by dissolving chitosan in 2.0% (v/v) acetic acid [24,25]. The mixtures were continuously stirred for 3–6 h using an overhead stirrer (VELP Scientifica, Usmate Velate, Italy) until uniform gels were obtained. Following dissolution, the prepared gel bases were transferred to sealed containers and stored overnight at 4 ± 2 °C to allow any entrapped air bubbles to dissipate.
Transethosome-loaded chitosan gels were prepared by incorporating GA-loaded transethosomes into chitosan gels according to the DoE-defined formulation matrix (see Section 3.2). For each formulation, the required amount of chitosan gel (1.5, 1.0, or 0.5 g) was weighed, the corresponding volume of GA-loaded transethosomes (0.5, 1.0, or 1.5 mL) was added, and the components were manually mixed using a metal spatula until macroscopically homogeneous, resulting in final formulations containing 25%, 50%, or 75% transethosomes (v/w), respectively.
2.6. Characterization of Transethosome-Loaded Chitosan Gels
2.6.1. Visual Appearance
The visual characteristics of the transethosome-loaded chitosan gels were assessed by organoleptic examination. Each formulation was inspected for color, homogeneity, and consistency, as well as for any visible signs of lumps or phase separation [26,27].
2.6.2. pH Measurement
One gram of each sample was dispersed in 20 mL of deionized water under magnetic stirring, and pH was measured using a Mettler-Toledo pH meter (Mettler-Toledo International Inc., Greifensee, Switzerland) at room temperature (22 ± 2 °C). For comparative evaluation of the developed gel formulations under standardized experimental conditions, a target pH range of 4–6 was established based on the physiological skin pH values reported by Lukić et al. [28].
2.6.3. Spreadability
Spreadability was determined using the parallel-plate method, a simple, low-cost, practical approach for routine formulation screening [29]. Briefly, a circle 4 cm in diameter was drawn on a 20 × 20 cm glass plate, and 1.0 g of transethosome-loaded chitosan gel was placed within the marked area. A second glass plate was positioned on top of the sample, and a 100 g weight was placed centrally for 1 min to allow spreading. The final spread diameter was measured, and the spreadability was calculated using Equation (2)
where Y3 represents the spreadability (cm2), corresponding to the third response in the experimental design, and d is the measured spreading diameter (cm) [30].
To define a practically relevant spreadability target range, four commercially available topical gels (RG1–RG4) were evaluated in triplicate using the same parallel-plate method, with measurements performed on samples from different product batches for each reference gel.
2.6.4. Drug Release and Kinetics
Comparative in vitro drug release profiles from GA solution, GA-loaded transethosomes, and chitosan gels incorporating either GA-loaded transethosomes or aqueous GA solution were evaluated using a dialysis membrane diffusion method adapted from Hassan et al. [27]. Drug release experiments for the reference formulations (GA solution, GA-loaded transethosomes, and the two chitosan gels containing aqueous GA solution corresponding to the fastest and slowest-releasing DoE formulations, N10 and N4 equivalents, respectively; Section 3.2) were performed in triplicate, whereas each DoE gel formulation was evaluated in a single experimental run, with three independent center-point runs included in the experimental design, as described in Section 2.4. Free GA solution and GA-loaded transethosomes were prepared at a GA concentration of 5 mg/mL. The N10 and N4 equivalent gels were prepared using the corresponding chitosan gel bases and mixing ratios, replacing GA-loaded transethosomes with an equivalent volume of aqueous GA solution (5 mg/mL). Briefly, cellulose dialysis tubing (Membra-Cel®, MWCO 14 kDa, Carl Roth GmbH + Co. KG, Karlsruhe, Germany) was pre-soaked in PBS pH 5.5, the same buffer used as the release medium, to provide skin-relevant mildly acidic conditions. One gram of each gel formulation was placed into hydrated dialysis tubing, securely sealed, and immersed in 100 mL of PBS. For comparison, 1.00 mL samples of GA solution and GA-loaded transethosomal dispersion were used. The system was maintained at 37 °C under continuous stirring at 100 rpm for 24 h using a multi-position magnetic hotplate stirrer (MULTI-HS 6 Digital, VELP Scientifica, Usmate Velate, Italy). At predetermined time points (5, 15, 30, 45, 60, and 120 min, followed by hourly intervals up to 10 h, and at 24 h), 2.0 mL samples were withdrawn from the release medium and immediately replaced with an equal volume of fresh PBS to maintain constant volume and sink conditions. The amount of released GA was determined by UV–Vis spectrophotometry by measuring absorbance at 260 nm. Quantification was performed using a calibration curve of GA prepared in PBS pH 5.5 (R2 = 0.9997), with PBS pH 5.5 also used as the blank. The LOD and LOQ, determined using the approach outlined in Section 2.3.2, were 0.32 and 0.97 µg/mL, respectively. The mean recovery was 98.6 ± 1.1%, with intra- and inter-day precision (RSD) of 1.5% and 1.9%, respectively. As the initial GA content varied depending on the proportion of transethosomes incorporated, cumulative release was calculated relative to the specific theoretical GA content of each formulation, allowing comparison of release behavior across formulations with different initial GA loadings.
To determine the drug release pattern, the release profiles were fitted to zero-order, first-order, Higuchi, Korsmeyer–Peppas, and Hixson–Crowell kinetic models [31]. The goodness of fit for each model was evaluated using the coefficient of determination (R2). For the Korsmeyer–Peppas model, the initial release phase up to approximately 60% cumulative release was used, and the release exponent (n) was additionally calculated to assess the release mechanism. The n values were used to classify the release behavior as Fickian diffusion (n ≤ 0.45), non-Fickian transport (0.45 < n < 0.89), or relaxation-controlled release (n ≥ 0.89) [32].
2.7. Statistical Analysis
2.7.1. Model Fitting and Selection
Model fitting was performed using MODDE Pro 13.1 software. For each response, different polynomial regression models were evaluated, including linear, interaction, and quadratic models. Model selection was based on overall model adequacy, considering goodness of fit (R2 and adjusted R2), cross-validated model performance (Q2), the difference between R2 and Q2, model validity, reproducibility, and ANOVA-based F-tests for regression significance and lack of fit. Q2 values above 0.5, R2–Q2 differences below 0.3, and model validity values above 0.25 were used as predefined criteria for exploratory model evaluation. Non-significant lack-of-fit tests (p > 0.05) indicated that no statistically significant lack of fit was detected. The selected models were subsequently used to generate regression equations with unscaled coefficients, while scaled and centered coefficients were used to compare the relative magnitude of factor effects [33,34].
2.7.2. Sweet Spot Analysis
Exploratory sweet-spot analysis was performed in MODDE Pro 13.1 using the selected regression models for GA release after 6 h, formulation pH, and spreadability. The analysis aimed to identify model-predicted regions within the studied design space where GA release after 6 h was minimized, while pH remained within 4–6 and spreadability within 15–45 cm2. Regions predicted to satisfy all three criteria simultaneously were defined as sweet-spot regions and were used to guide formulation selection for subsequent experimental verification.
2.7.3. Experimental Verification of the Exploratory Sweet Spot
To experimentally verify the predictive ability of the selected models and evaluate the proposed sweet spot regions, 15 additional formulations were prepared and characterized according to the methodology described in Section 2.6. The experimental verification set included formulations located within the predicted sweet spot region for each chitosan molecular weight grade, coded as L1 for low, M1–M3 for medium, and H1–H4 for high molecular-weight chitosan. Additional formulations outside the sweet spot regions were selected as challenge points and coded as C1–C7 (see Table 1). For each formulation, the experimentally obtained values for GA release, pH, and spreadability were compared with the corresponding model-predicted values. Prediction accuracy was assessed using relative error for GA release and absolute error for pH and spreading diameter.
Table 1.
Composition of formulations used for experimental verification of sweet spot regions.
2.8. Rheological Characterization of Selected Experimentally Verified Formulations
Six formulations from the experimental verification set were selected for rheological characterization, with triplicate measurements performed using separate samples from the same prepared gel batch for each formulation. This enabled the differences observed using the parallel-plate method to be further assessed through instrumental evaluation of their flow and viscoelastic behavior. The selected formulations were C1 and C2 (LMW chitosan), M1 and M2 (MMW chitosan), and H1 and C7 (HMW chitosan), as listed in Table 1. These formulations represented two comparable composition sets, with one containing 3.5% chitosan and 30% transethosomes and the other 3.0% chitosan and 35% transethosomes. This allowed comparison primarily according to chitosan molecular weight. Together, the selected formulations covered all three investigated chitosan molecular weight grades and included formulations located both within and outside the predicted sweet spot regions.
2.8.1. Steady-Shear Viscosity Measurements
Steady-shear viscosity measurements were performed using a rotational rheometer (MCR 102e, Anton Paar GmbH, Graz, Austria) equipped with a 25 mm serrated parallel plate. Samples were equilibrated at 25 °C for 3 min before measurement, and the measuring gap was set to 0.5 mm. An ascending logarithmic shear-rate ramp from 0.1 to 100 s−1 was applied over 25 measurement points. Measurements were performed in triplicate, and viscosity was recorded as a function of shear rate. For each formulation, the mean viscosity at each shear-rate point obtained from three measurements was plotted. Shear-thinning behavior was further characterized using the Ostwald–de Waele power-law model described by Equation (3):
where τ is the shear stress (Pa), K is the consistency index, is the shear rate (s−1), and n is the flow behavior index, with n < 1 indicating shear-thinning behavior and lower n values corresponding to a more pronounced degree of shear thinning. To further compare resistance to flow, shear stress at 10 s−1 was calculated from the apparent viscosity according to Equation (4):
where τ is the shear stress (Pa), ηapp is the apparent viscosity (Pa·s) at 10 s−1, and is the shear rate (s−1).
2.8.2. Oscillatory Amplitude-Sweep Measurements
Oscillatory amplitude-sweep measurements were performed using the same rheometer, plate, temperature, measuring gap, and equilibration period described in Section 2.8.1. A logarithmic shear-strain sweep from 0.01 to 100% was applied at a constant angular frequency of 10 rad/s. The storage modulus (G′) and loss modulus (G″) were recorded as functions of shear strain. Measurements were performed in triplicate, and the mean G′ and G″ values obtained at each shear-strain point were plotted for each formulation.
2.9. Drug Content and Uniformity in GA-Loaded Transethosomal Chitosan Gels
To compare the theoretical GA loading with the experimentally determined drug content and assess GA distribution within the gel matrix, the same six GA-loaded transethosomal chitosan formulations (C1, C2, M1, M2, H1, and C7 as listed in Table 1) previously selected for rheological characterization (Section 2.8) were evaluated for drug content and content uniformity.
For drug content determination, three independently prepared batches of each formulation were analyzed. From each batch, 1.0 g of gel was dispersed in distilled water to a final volume of 100 mL, following a procedure adapted from Aldawsari et al. [35]. The dispersions were magnetically stirred at room temperature for 30 min, filtered through a 0.45 µm membrane filter, and analyzed by UV–Vis spectrophotometry as described in Section 2.3.2. The corresponding gel containing blank transethosomes was used as the blank. The experimentally determined GA content was expressed as a percentage of the theoretical GA loading.
To assess content uniformity, three independent samples of 100 mg were collected from each of three locations (top, middle, and bottom) within a batch of each gel formulation, following a sampling approach adapted from previously published studies [36,37,38]. Each sample was individually dispersed in distilled water to a final volume of 25 mL, filtered through a 0.45 µm membrane filter, and analyzed using the same spectrophotometric method as for drug content determination. To compare GA content across the sampling locations, the RSD was calculated from the three location-specific mean values.
2.10. Short-Term Physical Stability of GA-Loaded Transethosomal Chitosan Gels
The short-term physical stability of six selected GA-loaded transethosomal chitosan gels (C1, C2, M1, M2, H1, and C7), previously selected for rheological characterization (Section 2.8), was evaluated after two months of refrigerated storage at 4 ± 2 °C. The formulations were visually examined for changes in appearance, homogeneity, and signs of phase separation, as described in Section 2.6.1. Additionally, pH and spreadability were reassessed after storage according to the methods described in Section 2.6.2 and Section 2.6.3, respectively, and compared with the initial measurements to evaluate potential changes in the physical properties of the gels.
3. Results and Discussion
3.1. Characterization of Gallic Acid-Loaded Transethosomes
3.1.1. Particle Size, Polydispersity Index, and Zeta Potential
The physicochemical characteristics of blank and GA-loaded transethosomes are summarized in Table 2.
Table 2.
Physicochemical characteristics of blank and gallic acid-loaded transethosomes.
Both formulations exhibited vesicle sizes below 200 nm, consistent with particle-size ranges previously reported for lipid-based nanocarriers investigated for cutaneous drug delivery [39,40,41].
In both cases, the PDI remained low, confirming a uniform population, since values below 0.3 are generally considered acceptable for monodisperse nanovesicular systems [41].
The negative zeta potential of blank transethosomes is consistent with literature reports on ethanol-containing phospholipid vesicles, where the negative charge is mainly attributed to ionized phosphate groups of phosphatidylcholine and may be enhanced by ethanol-induced changes in membrane fluidity and lipid packing [42]. Upon GA encapsulation, the zeta potential shifted to a positive value. Similar shifts toward less negative zeta potential have been reported after incorporating other phenolic acids, such as caffeic acid, ferulic acid, and chlorogenic acid, into lipid-based vesicular systems [43,44,45]. This pronounced shift may partly reflect changes in dispersion pH following GA incorporation, as GA is a weak acid and the zeta potential of phosphatidylcholine vesicles is pH-dependent [46]. Although the zeta potential of GA-loaded transethosomes was close to zero (+4.8 mV), suggesting limited electrostatic repulsion, Tween 80 may also have contributed to vesicle stability through steric stabilization [47]. To evaluate if nanocarriers are stable, a 6-month stability study was performed (see Section 3.1.4).
3.1.2. Encapsulation Efficiency
The GA-loaded transethosomes showed satisfactory drug incorporation, with an EE% of 71.6 ± 5.7%, consistent with previously reported values for optimized GA-loaded transethosomes (72.55 ± 4.8%) and considered relatively high for such a small, hydrophilic phenolic acid [12]. Previous studies have shown that GA encapsulation into vesicular and polymeric nanocarrier systems can be challenging. For example, GA-loaded neutral niosomes showed an EE% of 4.48 ± 2.10%, while cationic niosomes reached 10.94 ± 0.78% [48]. GA-loaded poly(lactic-co-glycolic) nanoparticles showed an EE% of around 25%, and GA-loaded liposomes showed an EE% of 25.4 ± 0.9% [19,49]. These differences are likely related to carrier composition and structure. Transethosomes are advantageous as drug delivery systems because their aqueous core can accommodate hydrophilic compounds, while the phospholipid bilayer can incorporate lipophilic compounds [11,40].
3.1.3. FTIR Analysis of Gallic Acid-Loaded Transethosomes
The FTIR spectra (Figure 1) were analyzed to identify characteristic GA and transethosomal absorption bands. The blank transethosome spectrum showed peaks at approximately 2924 and 2854 cm−1, corresponding to asymmetric and symmetric CH2 stretching vibrations of alkyl chains from phospholipid and surfactant components of the transethosome matrix [50,51]. Pure GA showed characteristic peaks at approximately 1608 and 1541 cm−1, corresponding to aromatic C–C stretching vibrations, and a band at 1309 cm−1 associated with GA fingerprint vibrations [52,53]. In the GA-loaded transethosome spectrum, both the alkyl-chain peaks and the GA fingerprint peaks were retained, supporting the presence of GA in the formulation.
Figure 1.
Comparative FTIR spectra of gallic acid, blank transethosomes, and gallic acid-loaded transethosomes.
3.1.4. Physical Stability of GA-Loaded Transethosomes
The physical stability assessment was performed to evaluate the influence of temperature and light exposure on GA-loaded transethosomes, as the stability of GA and other phenolic compounds may depend on storage conditions, particularly light exposure. At the same time, phospholipid-based vesicular systems may be affected by lipid oxidation, hydrolysis, and structural rearrangement during storage [54,55]. Storage results are shown in Table 3.
Table 3.
Six-month physical stability of gallic acid-loaded transethosomes under different storage conditions.
Refrigerated storage (4 ± 2 °C) was the most favorable condition for maintaining the physical stability of GA-loaded transethosomes over 6 months. Under refrigerated conditions, the mean vesicle diameter remained close to the initial value, showing only a minor change of −3.6%, which fell within experimental variability and therefore indicated no meaningful size change during refrigerated storage. In contrast, room-temperature storage resulted in a more pronounced increase in vesicle size, with changes of +17.6% and +18.4% under dark and light conditions, respectively. Zeta potential was also better preserved under refrigerated storage, with a change of only −1.8 mV, whereas room temperature storage caused larger shifts toward negative values, particularly under light exposure, with changes of −13.4 and −20.1 mV. Organoleptic inspection further showed that samples stored at room temperature under light gradually changed from a white, milky dispersion to a more yellowish appearance. Although changes in PDI were observed, all formulations remained below the commonly accepted threshold of 0.3, indicating that the vesicle size distribution remained acceptable after 6 months of storage.
Taken together, these findings suggest that refrigerated storage limited physical destabilization, such as vesicle fusion, aggregation, or bilayer rearrangement, which can contribute to changes in vesicle size and surface properties. In addition, Tween 80 may also have contributed to formulation stability through steric rather than purely electrostatic stabilization [42].
3.1.5. In Vitro Permeation Testing
During preliminary formulation screening, where the primary objective is to establish the proof of concept, synthetic membranes offer a practical alternative to biological skin for permeation studies, reducing ethical concerns, costs, and biological variability [56]. Among these, Strat-M® membranes have a multilayered structure with smaller pores and greater resistance to diffusion in the upper layers and progressively larger pores in the underlying layers, thereby mimicking the physical barrier characteristics of human skin, particularly the stratum corneum [57]. Additionally, these membranes contain a mixture of synthetic lipids, including ceramides, cholesterol, and free fatty acids, which further contribute to their skin-mimicking properties [57]. Previous studies have also reported comparable formulation-dependent permeation trends across Strat-M® membranes and excised human skin [19,58].
Therefore, a proof-of-concept permeation study was conducted to compare GA transport from the transethosomes and aqueous GA solution across Strat-M® synthetic membranes (Figure 2).
Figure 2.
In vitro permeation profiles of gallic acid-loaded transethosomes and aqueous gallic acid solution across Strat-M® membranes using Franz diffusion cells.
Overall, GA-loaded transethosomes demonstrated substantially greater GA permeation across Strat-M® synthetic membranes than the aqueous solution. A detectable increase in GA concentration from transethosomes started at approximately 6 h, with a steady increase up to 12 h, followed by a more gradual permeation up to 24 h. The lag time may be explained by the physicochemical properties of GA, including its hydrophilic nature and multiple polar functional groups, which could prolong the permeation through the lipids of the Strat-M® membrane. After 24 h, the cumulative amount of permeated GA reached 2520.77 ± 66.93 µg/cm2, corresponding to approximately 50.4% of the initial GA dose. In contrast, GA permeation from the aqueous solution was below the quantifiable level throughout the study.
Taken together, these findings suggest that transethosomes may facilitate GA transport across the synthetic membrane, supporting their incorporation into chitosan-based gels.
3.2. DoE Matrix of GA-Loaded Transethosomal Chitosan Gels and Their Visual Appearance
Table 4 summarizes the experimental design matrix used for exploratory formulation screening and the corresponding measured responses for the GA-loaded transethosomal chitosan gels.
Visual inspection showed that all formulations were macroscopically homogeneous, with no visible phase separation or undispersed lumps. Gels prepared with lower chitosan concentration and lower molecular weight appeared more fluid, whereas those containing high-molecular-weight chitosan showed a denser consistency and a slightly more yellowish, less transparent appearance.
Within the investigated design space, GA release after 6 h varied from 65.53% to 93.17%, formulation pH from 3.93 to 4.46, and spreadability from 12.6 to 122.7 cm2. The observed variations indicate that changes in chitosan molecular weight, chitosan concentration, and transethosome proportion were associated with measurable differences in GA release, pH, and spreadability, justifying further evaluation of factor effects using regression modeling.
Table 4.
Experimental design matrix and measured responses of gallic acid-loaded transethosomal chitosan gels.
3.3. Model Fitting and Selection
Based on the predefined model evaluation criteria described in Section 2.7.1, linear models were selected for all three responses. The selected models described the observed variation in the experimental responses with R2 values ranging from 0.777 to 0.892, adjusted R2 from 0.741 to 0.875, and Q2 from 0.686 to 0.847 (Table 5). All Q2 values were above 0.5, and the differences between R2 and Q2 were below 0.3, ranging from 0.045 to 0.091, consistent with the predefined criteria. Model validity values ranged from 0.49 to 0.74, while reproducibility values, estimated using the replicated center-point runs, ranged from 0.89 to 0.97.
Table 5.
Summary of fit parameters for the selected linear regression models.
ANOVA indicated statistically significant regression for GA release after 6 h (F = 21.72, p < 0.001), formulation pH (F = 51.73, p < 0.001), and spreadability (F = 48.80, p < 0.001). In addition, the lack-of-fit tests were not significant for GA release (p = 0.248), formulation pH (p = 0.357), or spreadability (p = 0.131).
Overall, these findings supported the exploratory evaluation of formulation effects within the investigated design space and provided an initial understanding of the relationships between formulation variables and measured responses.
3.4. Effect of Formulation Variables on Drug Release
Free GA was released very rapidly, reaching near-complete release within 60 min as shown in Figure 3, consistent with its physicochemical characteristics as a small, hydrophilic molecule [48]. Such rapid release highlights the importance of formulation strategies aimed at achieving greater control over GA release kinetics. Incorporation into transethosomes delayed GA release compared with the aqueous solution, although complete release still occurred within the first 2 h (Figure 3). The GA-loaded transethosomes were therefore further incorporated into a chitosan gel, not only to achieve greater control over release, but also to convert the dispersion into a structured semisolid formulation better suited for patient-friendly topical administration [59]. Among the GA-loaded transethosomal chitosan gels, GA release after 6 h varied markedly, ranging from 65.53% to 93.17% (Table 4). The fastest and slowest releasing gels are shown in Figure 3 (N10 and N4, respectively), while the model-predicted contour plots in Figure 4 illustrate the effects of formulation variables.
Figure 3.
In vitro cumulative GA release profiles of GA solution, GA-loaded transethosomes, and selected GA-loaded transethosomal chitosan gels: N10 (2.0% LMW Chi + 50% TE; fastest release) and N4 (3.0% LMW Chi + 25% TE; slowest release), together with their corresponding equivalent gels. The N10 and N4 equivalent gels were prepared using the same chitosan gel bases and mixing ratios, replacing GA-loaded transethosomes with an equivalent volume of aqueous GA solution (5 mg/mL). LMW, low molecular weight; Chi, chitosan; TE, transethosomes. Chitosan concentrations refer to the initial gel bases and are expressed as % (w/v), while transethosome proportions are expressed as % (v/w).
Figure 4.
Contour plots showing the predicted GA release after 6 h according to chitosan concentration, transethosome proportion, and chitosan molecular weight level.
This variation suggests that the final release behavior was influenced not only by the chitosan gel matrix but also by the specific formulation composition. To examine the effects of formulation variables on GA release, the selected linear regression model was applied to GA release after 6 h (Y1), as expressed in Equation (5):
where bX1 corresponds to the coefficient of chitosan molecular weight (+0.50 for LMW, +3.02 for MMW, and −3.52 for HMW), X2 is the chitosan concentration (% w/v), and X3 is the transethosome proportion in the final formulation (% v/w).
In the selected linear model, chitosan concentration (X2) had the strongest negative effect on drug release, indicating that higher polymer concentrations were associated with slower GA release. This finding is consistent with previous studies showing that increasing chitosan concentration enhances interchain interactions and viscoelastic behavior in chitosan systems, while also reducing drug release from chitosan gels, likely due to greater diffusional resistance within the polymer matrix [60,61]. The N10 and N4 equivalent gels containing aqueous GA solution also exhibited slower release than the free GA solution (Figure 3), consistent with a contribution of the chitosan matrix to release retardation. Their corresponding transethosomal gels showed an additional reduction in GA release, particularly for N4, suggesting that transethosomal incorporation also modulated release.
Chitosan molecular weight (X1) negatively influenced GA release, mainly at high molecular weight level, which may be attributed to greater chain length and viscosity, resulting in a more diffusion-resistant semisolid matrix [62,63]. In addition to increased viscosity and diffusional resistance, possible non-covalent interactions between GA and chitosan may also have contributed to the slower release. The phenolic hydroxyl and carboxyl groups of GA can participate in hydrogen bonding with the hydroxyl and amino groups of chitosan, which may reduce GA mobility within the hydrated gel network [64].
By contrast, the proportion of transethosomes (X3) exerted a positive effect on GA release. Because transethosomes were incorporated as a liquid dispersed phase, increasing their proportion likely diluted the chitosan-rich continuous phase, reducing polymer packing and weakening its barrier effect. However, this does not imply that transethosome proportion should be minimized. Taken together, the positive coefficient of X3 should be interpreted as a relative acceleration of release within the gel matrix rather than a complete loss of controlled release behavior.
Although each formulation variable was associated with different changes in GA release, the model-derived contour plots (Figure 4) illustrate how combinations of these variables may influence release behavior within the investigated design space. For example, the model suggested that a lower transethosome proportion could be combined with a lower chitosan concentration to achieve comparable GA release, while higher transethosome proportions could potentially be balanced by adjusting chitosan concentration and molecular weight.
To gain further insight into the release mechanism, the release profiles were fitted to conventional models (Supplementary Table S1). Among the full-profile models, the Higuchi and first-order models best described the release profiles, with only minor differences in R2 between the two models for several formulations. Differences of ≤ 0.01 were considered too small to distinguish between the models given the experimental variability. The Higuchi fit suggested diffusion through the matrix, while the first-order fit suggested a contribution of concentration-dependent release [65,66]. Korsmeyer–Peppas analysis of the initial release phase showed high R2 values (0.977–0.999) and n values ranging from 0.573 to 0.856, indicating non-Fickian transport. This suggests that, in addition to diffusion, GA release may also have been influenced by swelling or relaxation of the chitosan polymer matrix during the initial release phase [32].
3.5. Effect of Formulation Variables on pH
The pH (Y2) of the developed GA-loaded transethosomal chitosan gels, measured after dilution with deionized water, ranged from 3.93 to 4.46 (Table 4). The lowest measured pH corresponded to the N20 formulation containing 2% medium-molecular-weight chitosan and 75% transethosomes, falling below the lower limit of the targeted pH range, as shown by the MMW chitosan contour plot in Figure 5.
Figure 5.
Contour plots showing the predicted formulation pH according to chitosan concentration, transethosome proportion, and chitosan molecular weight level.
Because not all measured pH values fell within the target range of 4–6, it was important to evaluate which formulation variables most influenced pH. Following the same modeling approach, the effects of the formulation variables on pH (Y2) were evaluated using the selected linear regression model, as expressed in Equation (6):
where bX1 corresponds to the coefficient of chitosan molecular weight (+0.02 for LMW, −0.04 for MMW, and +0.02 for HMW), X2 is chitosan concentration, and X3 is transethosome proportion in the final formulation.
The acidic pH values observed for the gels can be partly attributed to the acidic medium used to dissolve chitosan, which is required to protonate the amino groups of chitosan and enable polymer solubilization. Within this acidic formulation environment, the selected linear model indicated that chitosan concentration (X2) had the strongest positive effect on pH, with higher polymer concentrations associated with higher pH values, bringing them closer to the target pH range of 4–6. A possible explanation is that increasing chitosan concentration increased the buffering contribution of amino groups and reduced the relative acid-to-polymer ratio, resulting in a modest shift toward higher pH [17,67].
Chitosan molecular weight (X1) had a much smaller influence on pH than chitosan concentration, as also reflected by the similar pH gradients across the contour plots shown in Figure 5. Although the lowest pH was observed for the gel containing 2% medium molecular weight chitosan and 75% transethosome proportion, falling below the predefined pH criterion of 4.0, this result is most likely explained by the simultaneous contribution of low chitosan concentration and high transethosome proportion, rather than by molecular weight alone.
Transethosome proportion (X3) showed a slight negative association with pH, suggesting that higher transethosome proportions were associated with lower pH values. This may be explained by the higher amount of GA, since it is a weak acid with a pKa of about 4.2–4.4 [68]. By comparison, Tween 80 is a nonionic surfactant, whereas phosphatidylcholine remains predominantly zwitterionic in this pH range; therefore, these excipients are less likely to explain the observed decrease in pH as strongly as GA [69].
3.6. Effect of Formulation Variables on Spreadability
Spreadability of the developed topical gels was evaluated, as it affects ease of application, uniform distribution on the skin, and patient acceptability. The parallel-plate method was selected for this study because it is simple, low-cost, and suitable for comparative screening of semisolid formulations [29]. Similar manual plate compression approaches have been used for chitosan-containing semisolid systems; however, because spreadability testing via the parallel-plate method is not fully standardized, differences in sample mass, plate setup, applied weight, and spreading time limit direct comparison between studies [70,71,72]. Therefore, to define a practically relevant target range for this study, four commercially available gels were measured using the same method described in Section 2.6.3 (Table 6). As their spreadability was within the range of 18.4–36.7 cm2, and the calculated area increases quadratically with spreading diameter, a target interval of 15–45 cm2 was selected to account for the manual nature of the method and to allow a practical margin for experimental variability.
Table 6.
Spreadability of commercial topical reference gels measured using the parallel-plate method.
The spreadability of the developed GA-loaded transethosomal chitosan gels varied widely, ranging from 12.6 to 122.7 cm2 (Table 4). A considerable proportion of the formulations fell outside the predefined target interval, particularly in the low molecular weight chitosan region, as shown in Figure 6.
Figure 6.
Contour plots showing predicted spreadability of GA-loaded transethosomal chitosan gels according to chitosan concentration, transethosome proportion, and chitosan molecular weight level.
Therefore, to further examine the observed differences across the formulation space, the selected linear regression model was applied to evaluate the effects of formulation variables on spreadability (Y3), as expressed in Equation (7):
where bX1 corresponds to the coefficient of chitosan molecular weight (+25.00 for LMW, −1.39 for MMW, and −23.61 for HMW), X2 is the chitosan concentration (% w/v), and X3 is the transethosome proportion in the final formulation (% v/w).
In the selected linear model, transethosome proportion (X3) showed the strongest positive effect on spreadability, likely because increasing the amount of transethosomal dispersion increased the mobile liquid fraction of the formulation and reduced the relative structuring effect of the chitosan network, thereby facilitating flow under compression. In contrast, chitosan concentration (X2) showed a marked negative effect on spreadability, indicating that higher polymer content reduced spreading. This may be explained by the formation of a denser, more entangled chitosan network with greater viscoelastic resistance to flow.
Chitosan molecular weight (X1) also influenced spreadability, with low molecular weight chitosan allowing more spreading and high molecular weight chitosan reducing it, likely due to greater chain entanglement and stronger network formation at higher molecular weight. This effect is reflected in the contour plots shown in Figure 6, where higher spreadability was predicted at higher transethosome proportions and lower chitosan concentrations, particularly for low-molecular-weight chitosan, whereas high-molecular weight-chitosan shifted the response toward lower spreadability.
3.7. Sweet Spot Analysis of Formulation Design Space
Exploratory sweet spot analysis identified candidate regions within the studied design space predicted to meet the predefined optimization criteria: minimized GA release after 6 h, formulation pH within 4–6, and spreadability within 15–45 cm2 (Figure 7). Rather than yielding a single optimum composition, the model identified regions corresponding to multiple combinations of chitosan concentration, chitosan molecular weight, and transethosome proportion that satisfied the predefined criteria. Model-predicted regions were identified for all three chitosan molecular weights, although their shape and location varied across molecular weight levels.
Figure 7.
Model-predicted sweet spot plot of the formulation design space for GA-loaded transethosomal gels, including experimentally verified points.
For low- and medium-molecular-weight chitosan, the sweet spot regions shifted toward higher chitosan concentrations and lower transethosome proportions, with the maximum spreadability limit as the main constraint, particularly for low-molecular-weight chitosan. In medium-molecular-weight chitosan gels, the minimum pH criterion further reduced the feasible space at low chitosan concentrations. In contrast, the model indicated a narrower central sweet-spot region for high-molecular-weight chitosan, bounded by both minimum and maximum spreadability limits, indicating a tighter balance between overly fluid and overly stiff formulations.
Overall, the model-predicted sweet-spot regions were primarily constrained by spreadability, with pH imposing an additional restriction in the medium-molecular-weight system.
3.8. Experimental Evaluation of Model Predictions
To compare model-predicted responses with experimental observations, 15 additional formulations were evaluated within and around the proposed sweet spot regions (Figure 7, Table 7).
Table 7.
Predicted and observed responses of experimentally verified formulations selected from the sweet spot analysis.
The relative error between predicted and observed GA release ranged from 0.37% to 6.31%, while the pH difference was up to 0.10 pH units. Larger differences were observed for spreadability, which may be partly attributed to the manual nature of the parallel-plate method and the nonlinear increase in calculated area with spreading diameter, potentially limiting the precision of the predicted sweet-spot boundaries. Excluding C7, for which the model predicted a value below the method’s technically measurable range, the difference between predicted and observed spreadability was up to 14.0 cm2, corresponding to a spreading diameter difference of up to 1.3 cm. Only C1 showed a different sweet spot classification, likely due to its proximity to the predicted boundary.
3.9. Rheological Characterization of Selected Formulations
Although the parallel-plate method was useful for initial screening of spreadability, it had several practical limitations, including its manual nature and limited sensitivity. To complement these findings and gain a better understanding of formulation behavior during application, rheological characterization was performed as described in Section 2.8.
3.9.1. Steady-Shear Flow Behavior
All six formulations exhibited non-Newtonian shear-thinning behavior, as their viscosity decreased continuously with increasing shear rate from 0.1 to 100 s−1 (Figure 8).
Figure 8.
Viscosity as a function of shear rate for selected GA-loaded transethosomal chitosan gels: HMW Chi, C7 (3.5% Chi + 30% TE) and H1 (3.0% Chi + 35% TE); MMW Chi, M2 (3.5% Chi + 30% TE) and M1 (3.0% Chi + 35% TE); and LMW Chi, C1 (3.5% Chi + 30% TE) and C2 (3.0% Chi + 35% TE). HMW, high molecular weight; MMW, medium molecular weight; LMW, low molecular weight; Chi, chitosan; TE, transethosomes. Chitosan concentrations are expressed as % (w/v), and transethosome proportions as % (v/w).
Formulations C7 and H1 showed the most pronounced shear-thinning behavior (n = 0.55 and 0.62, respectively), followed by M2 (n = 0.68), whereas the remaining formulations showed less pronounced shear thinning (n = 0.75–0.82). However, the degree of shear thinning alone did not directly correspond to the spreadability results obtained using the parallel-plate method. At a shear rate of 10 s−1, H1 (τ = 77 Pa) and M2 (τ = 47 Pa), both located within the predicted sweet spot regions, showed greater resistance to flow than M1, C1, and C2 (τ = 19, 22, and 9 Pa, respectively). These findings indicate that spreadability was influenced not only by the degree of shear thinning but also by chitosan molecular weight and overall formulation composition.
3.9.2. Oscillatory Amplitude-Sweep Behavior
Oscillatory amplitude-sweep measurements showed that G″ remained higher than G′ throughout the investigated shear-strain range, with no crossover between the moduli up to 100% strain (Figure 9). Therefore, under the applied measurement conditions, the formulations showed predominantly viscous-dominant viscoelastic behavior, consistent with the viscoelastic liquid behavior reported by do Amaral Sobral et al. in their frequency-sweep analysis of chitosan at different concentrations [73].
Figure 9.
Storage modulus (G′) and loss modulus (G″) as a function of shear strain for selected GA-loaded transethosomal chitosan gels: (A) HMW Chi, C7 (3.5% Chi + 30% TE) and H1 (3.0% Chi + 35% TE); (B) MMW Chi, M2 (3.5% Chi + 30% TE) and M1 (3.0% Chi + 35% TE); and (C) LMW Chi, C1 (3.5% Chi + 30% TE) and C2 (3.0% Chi + 35% TE). HMW, high molecular weight; MMW, medium molecular weight; LMW, low molecular weight; Chi, chitosan; TE, transethosomes. Chitosan concentrations are expressed as % (w/v), and transethosome proportions as % (v/w).
Nevertheless, clear composition-dependent differences were observed. The HMW formulations exhibited markedly higher G′ and G″ values than the MMW and LMW formulations, indicating greater resistance to oscillatory deformation. Within each molecular-weight grade, the formulation containing a 3.5% chitosan gel base and 30% transethosomes exhibited higher moduli than its 3.0% chitosan gel base and 35% TE.
Because oscillatory moduli do not directly quantify spreadability, the flow curves, together with the parallel-plate results, were used as the primary basis for the preliminary spreadability ranking. Both methods showed the same ranking from lowest to highest spreadability: C7, H1, M2, C1, M1, and C2. The approximately ten-fold difference in G′ between the HMW and LMW formulations should also be noticeable during application.
Although viscosity and oscillatory moduli characterize different rheological properties, both measurements identified the same composition-dependent hierarchy. Formulations outside the sweet spot could either be harder to spread and potentially form a persistent film on the skin (C7) or be more prone to run-off after application (C2, C1). More balanced formulations within the sweet spot (M2, M1, and H1) were comparable with reported commercial topical gels [74]. However, patient preference should still be assessed to determine sensory acceptability during topical application.
3.10. Drug Content and Uniformity in GA-Loaded Transethosomal Chitosan Gels
The experimentally determined GA content of the six selected formulations was in close agreement with the theoretical loading, ranging from 94.8 ± 4.2% (C7) to 97.3 ± 2.8% (M1) (Table 8).
Table 8.
Drug content and content uniformity of selected GA-loaded transethosomal chitosan gels.
These findings indicate successful GA incorporation into the final gel formulations, with only minor deviations from the theoretical drug content. Similar findings regarding GA incorporation were reported by Yağcılar et al., who obtained GA contents of approximately 92–95% in poloxamer/sodium alginate-based gels [75]. In addition, for transethosomal gel formulations, Aldawsari et al. reported a drug content of 92.78 ± 2.01% in gels loaded with another polyphenolic compound, rutin [35].
Furthermore, analysis of samples collected from the top, middle, and bottom of each gel batch revealed low variability in GA content, with RSD values ranging from 1.27% to 2.47% across the investigated formulations. The consistently low variability and absence of a systematic concentration gradient between sampling locations suggest a relatively uniform distribution of GA within the gel matrix, supporting satisfactory within-batch content uniformity across the selected formulations.
3.11. Short-Term Physical Stability of GA-Loaded Transethosomal Chitosan Gels
To assess the short-term physical stability of GA-loaded transethosomal chitosan gels, refrigerated storage (4 ± 2 °C) was selected, as the GA-loaded transethosomal dispersion had previously demonstrated the greatest physical stability under these conditions. Following two months of storage, all six formulations maintained their initial macroscopic appearance and homogeneity, with no visible signs of phase separation. Changes in mean pH values did not exceed 0.12 units, while mean spreadability varied by no more than 5.3% compared with the initial measurements, indicating only minor changes in the evaluated physical properties.
3.12. Study Limitations and Future Perspectives
Despite the promising findings, several limitations of the present study should be acknowledged to guide future research and optimization of GA-loaded transethosomal chitosan gels.
Although transethosome characterization provided information on particle size, polydispersity, and zeta potential, these measurements did not directly confirm vesicular morphology or deformability. Further characterization using transmission electron microscopy (TEM) or scanning electron microscopy (SEM) would therefore complement the existing findings by providing information on vesicular structure. At the same time, direct deformability measurements would offer additional insight into their functional properties, and future investigations could also evaluate vesicle integrity within the gel matrix.
The in vitro permeation experiments provided an initial assessment of GA transport from transethosomal dispersions across Strat-M® synthetic membranes. Although these membranes reproduce selected physical barrier characteristics of human skin, they cannot fully represent its biological complexity, including follicular transport, metabolic activity, and drug deposition within different skin layers. Further studies using selected gel formulations and ex vivo skin models could therefore evaluate GA permeation and skin deposition from the developed semisolid systems.
To support further development, future studies should focus on a narrower selection of formulations within the investigated design space, potentially applying more restrictive response limits to identify compositions suitable for further evaluation.
Additionally, as pH measurements were performed after dilution with water, the obtained values may differ from those of the undiluted gels. Direct pH assessment of selected formulations would therefore provide a more representative evaluation of this parameter in the final dosage form.
The physical stability assessment of the final gels was limited to two months of refrigerated storage and focused on macroscopic appearance, pH, and spreadability. Although these parameters showed only minor changes during the investigated period, they do not provide information on GA chemical stability or the preservation of vesicle integrity within the gel matrix. Once specific formulations have been selected for further development, more comprehensive stability studies should include longer storage periods, stability-indicating analytical methods for GA quantification, and evaluation of potential vesicle destabilization and GA leakage during storage.
Finally, although the reported antioxidant, anti-inflammatory, and antibacterial properties of GA provide a literature-based rationale for its topical application, the present study did not investigate the biological activity of the developed formulations. Further biological evaluation will therefore be necessary to determine whether the physicochemical properties achieved during formulation development translate into relevant biological effects.
4. Conclusions
The three-level full factorial DoE models demonstrated that chitosan concentration had the strongest influence on GA release and pH, whereas transethosome proportion and chitosan molecular weight were mainly associated with changes in spreadability. The selected models showed acceptable predictive performance, and experimental verification supported the DoE approach for identifying formulation regions within restrictive limits. Rheological characterization provided complementary information on practical application behavior beyond the parallel plate spreadability test and helped distinguish formulations with high resistance to spreading from those more prone to flow. Overall, these findings highlight the potential of DoE-guided screening to support the development of GA-loaded transethosomal chitosan gels.
As the present study focused on formulation development and physicochemical characterization, the biological efficacy of the selected formulations remains to be established.
Supplementary Materials
The following supporting information can be downloaded at: https://www.mdpi.com/article/10.3390/pharmaceutics18111463/s1, Table S1: Release kinetic model fitting of gallic acid-loaded transethosomal chitosan gel formulations.
Author Contributions
Conceptualization, D.P.P., R.T. and A.B. (Ance Bārzdiņa); methodology, D.P.P., R.T. and A.B. (Ance Bārzdiņa); validation, D.P.P.; formal analysis, D.P.P., E.O. and R.T.; investigation, D.P.P., E.O. and R.T.; visualization, D.P.P.; writing—original draft preparation, D.P.P.; writing—review and editing, D.P.P., E.O., R.T., A.B. (Agnese Brangule), D.B. and A.B. (Ance Bārzdiņa); supervision, R.T., A.B. (Agnese Brangule), D.B. and A.B. (Ance Bārzdiņa); project administration, A.B. (Ance Bārzdiņa); funding acquisition, A.B. (Agnese Brangule) and D.B. All authors have read and agreed to the published version of the manuscript.
Funding
This project has received funding from the European Union’s Horizon 2020 research and innovation program under grant agreement No 857287 (BBCE—Baltic Biomaterials Centre of Excellence).
Data Availability Statement
The original data presented in this study are included in the article and Supplementary Materials. Additional raw data are available from the corresponding author upon reasonable request.
Acknowledgments
The authors acknowledge the access to the infrastructure and expertise of the BBCE—Baltic Biomaterials Centre of Excellence (European Union’s Horizon 2020 research and innovation program under grant agreement No 857287). The authors also acknowledge the expertise and contribution of researchers involved in the Latvian Council of Science project “Smart injectable nanoparticle-loaded hydrogel for synergic and targeted treatment of osteomyelitis (SinGel)”, project No. lzp-2025/1-0108.
Conflicts of Interest
The authors declare no conflicts of interest.
Abbreviations
The following abbreviations are used in this manuscript:
| ANOVA | Analysis of variance |
| ATR-FTIR | Attenuated total reflectance Fourier transform infrared spectroscopy |
| BCS | Biopharmaceutics Classification System |
| Chi | Chitosan |
| DLS | Dynamic light scattering |
| DoE | Design of Experiments |
| EE | Encapsulation efficiency |
| FDA | Food and Drug Administration |
| GA | Gallic acid |
| GRAS | Generally Recognized as Safe |
| HMW | High molecular weight |
| LMW | Low molecular weight |
| LOD | Limit of detection |
| LOQ | Limit of quantification |
| MMW | Medium molecular weight |
| MWCO | Molecular weight cut-off |
| PBS | Phosphate-buffered saline |
| PDI | Polydispersity index |
| RSD | Relative standard deviation |
| SD | Standard deviation |
| UV–Vis | Ultraviolet–visible |
References
- Park, W.H. The expanding frontiers of gallic acid: From dual chemistry and pharmacology to innovative technological applications. Chem. Biol. Interact. 2026, 425, 111899. [Google Scholar] [CrossRef] [Scilit] [PubMed]
- Hadidi, M.; Liñán-Atero, R.; Tarahi, M.; Christodoulou, M.C.; Aghababaei, F. The Potential Health Benefits of Gallic Acid: Therapeutic and Food Applications. Antioxidants 2024, 13, 1001. [Google Scholar] [CrossRef] [Scilit] [PubMed]
- Kahkeshani, N.; Farzaei, F.; Fotouhi, M.; Alavi, S.S.; Bahramsoltani, R.; Naseri, R.; Momtaz, S.; Abbasabadi, Z.; Rahimi, R.; Farzaei, M.H.; et al. Pharmacological effects of gallic acid in health and diseases: A mechanistic review. Iran. J. Basic Med. Sci. 2019, 22, 225–237. [Google Scholar] [CrossRef] [Scilit] [PubMed]
- Hu, G.; Zhou, X. Gallic Acid Ameliorates Atopic Dermatitis-Like Skin Inflammation Through Immune Regulation in a Mouse Model. Clin. Cosmet. Investig. Dermatol. 2021, 14, 1675–1683. [Google Scholar] [CrossRef] [Scilit] [PubMed]
- Veerichetty, V.; Saravanabavan, I.; Pradeep, A. Formulation and evaluation of ointment for acne treatment. GSC Biol. Pharm. Sci. 2023, 23, 50–60. [Google Scholar] [CrossRef] [Scilit]
- Harwansh, R.K.; Deshmukh, R.; Shukla, V.P.; Khunt, D.; Prajapati, B.G.; Rashid, S.; Ali, N.; Elossaily, G.M.; Suryawanshi, V.K.; Kumar, A. Recent Advancements in Gallic Acid-Based Drug Delivery: Applications, Clinical Trials, and Future Directions. Pharmaceutics 2024, 16, 1202. [Google Scholar] [CrossRef] [Scilit] [PubMed]
- Guy, R.H. Drug delivery to and through the skin. Drug Deliv. Transl. Res. 2024, 14, 2032–2040. [Google Scholar] [CrossRef] [Scilit] [PubMed]
- Hazari, S.A.; Sheikh, A.; Abourehab, M.A.S.; Tulbah, A.S.; Kesharwani, P. Self-assembled Gallic acid loaded lecithin-chitosan hybrid nanostructured gel as a potential tool against imiquimod-induced psoriasis. Environ. Res. 2023, 234, 116562. [Google Scholar] [CrossRef] [Scilit] [PubMed]
- Nayak, B.S.; Mohanty, B.; Mishra, B.; Roy, H.; Nandi, S. Transethosomes: Cutting edge approach for drug permeation enhancement in transdermal drug delivery system. Chem. Biol. Drug Des. 2023, 102, 653–667. [Google Scholar] [CrossRef] [Scilit] [PubMed]
- Raj, A.; Dua, K.; Nair, R.S.; Sarath Chandran, C.; Alex, A.T. Transethosome: An ultra-deformable ethanolic vesicle for enhanced transdermal drug delivery. Chem. Phys. Lipids 2023, 255, 105315. [Google Scholar] [CrossRef] [Scilit] [PubMed]
- Seenivasan, R.; Halagali, P.; Nayak, D.; Tippavajhala, V.K. Transethosomes: A Comprehensive Review of Ultra-Deformable Vesicular Systems for Enhanced Transdermal Drug Delivery. AAPS PharmSciTech 2025, 26, 41. [Google Scholar] [CrossRef] [Scilit] [PubMed]
- Dongsar, T.S.; Dongsar, T.T.; Alsayari, A.; Wahab, S.; Garima, G.; Kesharwani, P. Gallic Acid-Loaded Transethosomal Gel for Enhanced Topical Delivery and Sustained Therapeutic Efficacy in Psoriasis Management: Formulation, Optimization, In Vitro and Ex Vivo Assessment. AAPS PharmSciTech 2025, 26, 183. [Google Scholar] [CrossRef] [Scilit] [PubMed]
- Malang, S.D.; Shambhavi; Sahu, A.N. Transethosomal gel for enhancing transdermal delivery of natural therapeutics. Nanomedicine 2024, 19, 1801–1819. [Google Scholar] [CrossRef] [Scilit] [PubMed]
- Izadi, H.; Asadi, H.; Bemani, M. Chitin: A comparison between its main sources. Front. Mater. 2025, 12, 1537067. [Google Scholar] [CrossRef] [Scilit]
- Wu, K.; Yan, Z.; Wu, Z.; Li, J.; Zhong, W.; Ding, L.; Zhong, T.; Jiang, T. Recent Advances in the Preparation, Antibacterial Mechanisms, and Applications of Chitosan. J. Funct. Biomater. 2024, 15, 318. [Google Scholar] [CrossRef] [Scilit] [PubMed]
- Li, J.; Zhuang, S. Antibacterial activity of chitosan and its derivatives and their interaction mechanism with bacteria: Current state and perspectives. Eur. Polym. J. 2020, 138, 109984. [Google Scholar] [CrossRef] [Scilit]
- Gonciarz, W.; Balcerczak, E.; Brzeziński, M.; Jeleń, A.; Pietrzyk-Brzezińska, A.J.; Narayanan, V.H.B.; Chmiela, M. Chitosan-based formulations for therapeutic applications. A recent overview. J. Biomed. Sci. 2025, 32, 62. [Google Scholar] [CrossRef] [Scilit] [PubMed]
- Vivcharenko, V.; Trzaskowska, M.; Gieroba, B.; Palka, K.; Sroka-Bartnicka, A.; Przekora, A. The effect of chitosan molecular weight and its content on the mechanical, microstructural and biological parameters of biomaterial intended for cartilage tissue regeneration. Int. J. Biol. Macromol. 2025, 331, 148068. [Google Scholar] [CrossRef] [Scilit] [PubMed]
- Ferrara, F.; Benedusi, M.; Sguizzato, M.; Cortesi, R.; Baldisserotto, A.; Buzzi, R.; Valacchi, G.; Esposito, E. Ethosomes and Transethosomes as Cutaneous Delivery Systems for Quercetin: A Preliminary Study on Melanoma Cells. Pharmaceutics 2022, 14, 1038. [Google Scholar] [CrossRef] [Scilit] [PubMed]
- Wongsirojkul, N.; Takagi, M.; Wongngam, Y.; Sattayakhom, A.; Prachongsai, I.; Chunglok, W.; Opaprakasit, P.; Polpanich, D. Enhancing transdermal delivery of retinyl acetate via transethosomes with emphasis on the impact of edge activators on penetration, safety, and efficacy. Sci. Rep. 2025, 15, 35172. [Google Scholar] [CrossRef] [Scilit] [PubMed]
- International Council for Harmonisation of Technical Requirements for Pharmaceuticals for Human. U. 2023/12/14. ICH Q2(R2) Guideline on Validation of Analytical Procedures. Available online: https://www.ema.europa.eu/en/scientific-guidelines/ich-q2r2-validation-analytical-procedures (accessed on 3 November 2026).
- Menges, F. SpectraGryph—Optical Spectroscopy Software, Version 1.2.17. 2024. Available online: https://www.effemm2.de/spectragryph/about.html (accessed on 22 July 2026).
- Santamaria, F.; Gugel, I.; Dzyhovskyi, V.; Moretti, P.; Mariani, P.; Pepe, A.; Ortore, M.G.; Rawski, M.; Baldisserotto, A.; Manfredini, S.; et al. Design and Characterization of a Transethosome-Based Gel for Cutaneous Administration of Genistein. J. Nanotechnol. 2026, 2026, 3911170. [Google Scholar] [CrossRef] [Scilit]
- Radwan, I.T.; El-Sherbiny, I.M.; Selim, A.M.; Metwally, N.H. Design, synthesis of some novel coumarins and their nanoformulations into lipid-chitosan nanocapsule as unique antimicrobial agents. Sci. Rep. 2024, 14, 30598. [Google Scholar] [CrossRef] [Scilit] [PubMed]
- Ng, S.W.; Selvarajah, G.T.; Hussein, M.Z.; Yeap, S.K.; Omar, A.R. In Vitro Evaluation of Curcumin-Encapsulated Chitosan Nanoparticles against Feline Infectious Peritonitis Virus and Pharmacokinetics Study in Cats. BioMed Res. Int. 2020, 2020, 3012198. [Google Scholar] [CrossRef] [Scilit] [PubMed]
- Abdellatif, A.A.H.; Aldosari, B.N.; Al-Subaiyel, A.; Alhaddad, A.; Samman, W.A.; Eleraky, N.E.; Elnaggar, M.G.; Barakat, H.; Tawfeek, H.M. Transethosomal Gel for the Topical Delivery of Celecoxib: Formulation and Estimation of Skin Cancer Progression. Pharmaceutics 2023, 15, 22. [Google Scholar] [CrossRef] [Scilit] [PubMed]
- Hassan, A.S.; Hofni, A.; Abourehab, M.A.S.; Abdel-Rahman, I.A.M. Ginger Extract-Loaded Transethosomes for Effective Transdermal Permeation and Anti-Inflammation in Rat Model. Int. J. Nanomed. 2023, 18, 1259–1280. [Google Scholar] [CrossRef] [Scilit] [PubMed]
- Lukić, M.; Pantelić, I.; Savić, S.D. Towards Optimal pH of the Skin and Topical Formulations: From the Current State of the Art to Tailored Products. Cosmetics 2021, 8, 69. [Google Scholar] [CrossRef] [Scilit]
- Al-Barghouthy, E.Y.; Hamed, S.; Mehyar, G.F.; AlKhatib, H.S. Comparative Evaluation of Spreadability Measurement Methods for Topical Semisolid Formulations/A Scoping Review. Gels 2025, 11, 1006. [Google Scholar] [CrossRef] [Scilit] [PubMed]
- Kola-Mustapha, A.T.; Raji, M.A.; Alzahrani, Y.A.; Binsaeed, N.H.; Adam, D.R.; Shameh, R.A.; Garaween, N.M.; Garaween, G. Formulation, Optimization, and Comprehensive Characterization of Topical Essential Oil-Loaded Anti-Acne Microemulgels. Gels 2025, 11, 612. [Google Scholar] [CrossRef] [Scilit] [PubMed]
- Costa, P.; Sousa Lobo, J.M. Modeling and comparison of dissolution profiles. Eur. J. Pharm. Sci. 2001, 13, 123–133. [Google Scholar] [CrossRef] [Scilit] [PubMed]
- Asghar, Z.; Jamshaid, T.; Sajid-ur-Rehman, M.; Jamshaid, U.; Gad, H.A. Novel Transethosomal Gel Containing Miconazole Nitrate; Development, Characterization, and Enhanced Antifungal Activity. Pharmaceutics 2023, 15, 2537. [Google Scholar] [CrossRef] [Scilit] [PubMed]
- Rajabi, A.; Iyire, A.; Wyatt, D.; Koner, J.; Mohammed, A.R. Quality by design optimisation of isothermal dry particle coating for enhanced buccal permeation of vancomycin. Sci. Rep. 2025, 15, 45299. [Google Scholar] [CrossRef] [Scilit] [PubMed]
- Gieszinger, P.; Tomuta, I.; Casian, T.; Bartos, C.; Szabó-Révész, P.; Ambrus, R. Definition and validation of the Design Space for co-milled nasal powder containing nanosized lamotrigine. Drug Dev. Ind. Pharm. 2018, 44, 1622–1630. [Google Scholar] [CrossRef] [Scilit] [PubMed]
- Aldawsari, M.F.; Alam, A.; Imran, M. Rutin-Loaded Transethosomal Gel for Topical Application: A Comprehensive Analysis of Skin Permeation and Antimicrobial Efficacy. ACS Omega 2024, 9, 27300–27311. [Google Scholar] [CrossRef] [Scilit] [PubMed]
- Afreen, U.; Fahelelbom, K.M.; Shah, S.N.H.; Ashames, A.; Almas, U.; Khan, S.A.; Yameen, M.A.; Nisar, N.; Asad, M.H.H.B.; Murtaza, G. Formulation and evaluation of niosomes-based chlorpheniramine gel for the treatment of mild to moderate skin allergy. J. Exp. Nanosci. 2022, 17, 467–495. [Google Scholar] [CrossRef] [Scilit]
- Boisseillier, C.; Demange-Labriet, L.; Kariyawasam, D.; Marchadour, P.; Fauqueur, A.-S.; Annereau, M.; Denis, L.; Cotteret, C.; Cisternino, S.; Schweitzer-Chaput, A. Development of a Hydrocortisone Orodispersible Thin Film Containing Its Succinate Prodrug. Pharmaceuticals 2025, 18, 86. [Google Scholar] [CrossRef] [Scilit] [PubMed]
- Boonlai, W.; Sawatdee, S.; Kraisit, P.; Arce, F.; Lee See, G.; Sakdiset, P.; Hirun, N. Xanthan Gum–Cellulose Nanocrystal Composite Gels as Potential Oral Delivery Platforms for Dysphagia. Adv. Pharmacol. Pharm. Sci. 2026, 2026, 1994435. [Google Scholar] [CrossRef] [Scilit]
- Hua, S. Lipid-based nano-delivery systems for skin delivery of drugs and bioactives. Front. Pharmacol. 2015, 6, 219. [Google Scholar] [CrossRef] [Scilit] [PubMed]
- Chowdary, P.; Padmakumar, A.; Rengan, A.K. Exploring the potential of transethosomes in therapeutic delivery: A comprehensive review. MedComm Biomater. Appl. 2023, 2, e59. [Google Scholar] [CrossRef] [Scilit]
- Guillot, A.J.; Martínez-Navarrete, M.; Garrigues, T.M.; Melero, A. Skin drug delivery using lipid vesicles: A starting guideline for their development. J. Control. Release 2023, 355, 624–654. [Google Scholar] [CrossRef] [Scilit] [PubMed]
- Chudzińska-Skorupinska, J.; Wawrzyńczak, A.; Feliczak-Guzik, A. Ethosome-Based Colloidal Systems for Transdermal Delivery: The Role of Biosurfactant in Enhancing Stability and Efficacy. Materials 2025, 18, 5355. [Google Scholar] [CrossRef] [Scilit] [PubMed]
- Hallan, S.S.; Sguizzato, M.; Drechsler, M.; Mariani, P.; Montesi, L.; Cortesi, R.; Björklund, S.; Ruzgas, T.; Esposito, E. The Potential of Caffeic Acid Lipid Nanoparticulate Systems for Skin Application: In Vitro Assays to Assess Delivery and Antioxidant Effect. Nanomaterials 2021, 11, 171. [Google Scholar] [CrossRef] [Scilit] [PubMed]
- Miatmoko, A.; Christy, P.K.; Isnaini, A.; Hariawan, B.S.; Cahyani, D.M.; Ahmad, M.; Diyah, N.W.; Adrianto, M.F.; Deevi, R.K.; Hamid, I.S.; et al. Characterization and in vitro anticancer study of PEGylated liposome dually loaded with ferulic acid and doxorubicin. Sci. Rep. 2025, 15, 1236. [Google Scholar] [CrossRef] [Scilit] [PubMed]
- Cejas, J.D.P.; Disalvo, E.A.; Frias, M.D.L.A. Effect of cholesterol on the antioxidant action of chlorogenic acid in lipid membranes. Arch. Biochem. Biophys. 2025, 767, 110346. [Google Scholar] [CrossRef] [Scilit] [PubMed]
- Zhou, Y.; Raphael, R.M. Solution pH alters mechanical and electrical properties of phosphatidylcholine membranes: Relation between interfacial electrostatics, intramembrane potential, and bending elasticity. Biophys. J. 2007, 92, 2451–2462. [Google Scholar] [CrossRef] [Scilit] [PubMed]
- Rezigue, M.; Mashaqbeh, H.; Aljabali, A.A.A.; Mansour, R.S.; Hamzeh, I. Development and Evaluation of Azithromycin-Loaded Transethosomes for Enhanced Dermal Delivery and Antibacterial Efficacy. Pharmaceutics 2025, 17, 400. [Google Scholar] [CrossRef] [Scilit] [PubMed]
- Chaikul, P.; Khat-udomkiri, N.; Iangthanarat, K.; Manosroi, J.; Manosroi, A. Characteristics and in vitro anti-skin aging activity of gallic acid loaded in cationic CTAB niosome. Eur. J. Pharm. Sci. 2019, 131, 39–49. [Google Scholar] [CrossRef] [Scilit] [PubMed]
- de Cristo Soares Alves, A.; Mainardes, R.M.; Khalil, N.M. Nanoencapsulation of gallic acid and evaluation of its cytotoxicity and antioxidant activity. Mater. Sci. Eng. C 2016, 60, 126–134. [Google Scholar] [CrossRef] [Scilit] [PubMed]
- Mankan, E.; Sagdic, O.; Karadag, A. Development and Characterization of Spray-Dried Curcumin–Lecithin Complexes with Improved Solubility and In Vitro Digestive and Thermal Stability. Foods 2025, 14, 3157. [Google Scholar] [CrossRef] [Scilit] [PubMed]
- Zaid Alkilani, A.; Abo-Zour, H.; Basheer, H.A.; Abu-Zour, H.; Donnelly, R.F. Development and Evaluation of an Innovative Approach Using Niosomes Based Polymeric Microneedles to Deliver Dual Antioxidant Drugs. Polymers 2023, 15, 1962. [Google Scholar] [CrossRef] [Scilit] [PubMed]
- Espina, A.; Sanchez-Cortes, S.; Jurašeková, Z. Vibrational Study (Raman, SERS, and IR) of Plant Gallnut Polyphenols Related to the Fabrication of Iron Gall Inks. Molecules 2022, 27, 279. [Google Scholar] [CrossRef] [Scilit] [PubMed]
- Yılmazer Keskin, S.; Avcı, A.; Arif Ali Ali, L.; Keskin, C.S. Analysis of Polyphenols from Polygala major Jacq. Antioxidants 2025, 14, 153. [Google Scholar] [CrossRef] [Scilit] [PubMed]
- Mrázková, M.; Sumczynski, D.; Orsavová, J. Influence of Storage Conditions on Stability of Phenolic Compounds and Antioxidant Activity Values in Nutraceutical Mixtures with Edible Flowers as New Dietary Supplements. Antioxidants 2023, 12, 962. [Google Scholar] [CrossRef] [Scilit] [PubMed]
- Wang, C.; Gamage, P.L.; Jiang, W.; Mudalige, T. Excipient-related impurities in liposome drug products. Int. J. Pharm. 2024, 657, 124164. [Google Scholar] [CrossRef] [Scilit] [PubMed]
- Neupane, R.; Boddu, S.H.S.; Renukuntla, J.; Babu, R.J.; Tiwari, A.K. Alternatives to Biological Skin in Permeation Studies: Current Trends and Possibilities. Pharmaceutics 2020, 12, 152. [Google Scholar] [CrossRef] [Scilit] [PubMed]
- Haq, A.; Goodyear, B.; Ameen, D.; Joshi, V.; Michniak-Kohn, B. Strat-M® synthetic membrane: Permeability comparison to human cadaver skin. Int. J. Pharm. 2018, 547, 432–437. [Google Scholar] [CrossRef] [Scilit] [PubMed]
- Sreedharan Nair, R.; Billa, N.; Morris, A.P. In vitro skin permeation and rheological evaluation of a transethosomal formulation containing curcumin-tocotrienol combinations for enhanced topical applications. J. Dispers. Sci. Technol. 2025, 1–11. [Google Scholar] [CrossRef] [Scilit]
- Peers, S.; Montembault, A.; Ladavière, C. Chitosan hydrogels for sustained drug delivery. J. Control. Release 2020, 326, 150–163. [Google Scholar] [CrossRef] [Scilit] [PubMed]
- Cho, J.; Heuzey, M.-C.; Bégin, A.; Carreau, P.J. Viscoelastic properties of chitosan solutions: Effect of concentration and ionic strength. J. Food Eng. 2006, 74, 500–515. [Google Scholar] [CrossRef] [Scilit]
- El-Badry, M.; Fetih, G. Preparation, charactarization and anti-inflammatory activity of celecoxib chitosan gel formulations. J. Drug Deliv. Sci. Technol. 2011, 21, 201–206. [Google Scholar] [CrossRef] [Scilit]
- Gieroba, B.; Vivcharenko, V.; Kalisz, G.; Kazimierczak, P.; Mozgova, O.; Khalavka, M.; Nosach, L.; Pięta, I.S.; Nowakowski, R.; Przekora, A.; et al. Molecular and physicochemical arrangement of chitosan–ibuprofen matrices for topical drug delivery on skin: Preparation impact. RSC Adv. 2026, 16, 15591–15608. [Google Scholar] [CrossRef] [Scilit] [PubMed]
- Blebea, N.-M.; Pușcașu, C.; Vlad, R.-A.; Hancu, G. Chitosan-Based Gel Development: Extraction, Gelation Mechanisms, and Biomedical Applications. Gels 2025, 11, 275. [Google Scholar] [CrossRef] [Scilit] [PubMed]
- Kaczmarek-Szczepańska, B.; Polkowska, I.; Paździor-Czapula, K.; Nowicka, B.; Gierszewska, M.; Michalska-Sionkowska, M.; Otrocka-Domagała, I. Chitosan/Phenolic Compounds Scaffolds for Connective Tissue Regeneration. J. Funct. Biomater. 2023, 14, 69. [Google Scholar] [CrossRef] [Scilit] [PubMed]
- Mohamed, S.A.-A.; Ahmad, A.A.; Mustafa, F.E.-Z.A.; Negm, E.A.; Hassan, D.; Mohammed, A.; Hassan, A.K.; Sabra, M.S.; Abdel-Aleem, J.A.; Abdelfattah, A.; et al. Integrated in vitro and in vivo evaluation of ivermectin hydrogel formulation for management of scabies with pharmacological assessment. Sci. Rep. 2026, 16, 17327. [Google Scholar] [CrossRef] [Scilit] [PubMed]
- Shafiei, F.; Ghavami-Lahiji, M.; Jafarzadeh Kashi, T.S.; Najafi, F. Drug release kinetics and biological properties of a novel local drug carrier system. Dent. Res. J. 2021, 18, 94. [Google Scholar] [CrossRef] [Scilit] [PubMed]
- Aranaz, I.; Alcántara, A.R.; Civera, M.C.; Arias, C.; Elorza, B.; Heras Caballero, A.; Acosta, N. Chitosan: An Overview of Its Properties and Applications. Polymers 2021, 13, 3256. [Google Scholar] [CrossRef] [Scilit] [PubMed]
- National Center for Biotechnology Information. PubChem Compound Summary for CID 370, Gallic Acid. Available online: https://pubchem.ncbi.nlm.nih.gov/compound/Gallic-Acid (accessed on 26 June 2026).
- Akimov, S.A.; Polynkin, M.A.; Jiménez-Munguía, I.; Pavlov, K.V.; Batishchev, O.V. Phosphatidylcholine Membrane Fusion Is pH-Dependent. Int. J. Mol. Sci. 2018, 19, 1358. [Google Scholar] [CrossRef] [Scilit] [PubMed]
- Ahmed, M.M.; Anwer, M.K.; Fatima, F.; Alali, A.S.; Kalam, M.A.; Zafar, A.; Alshehri, S.; Ghoneim, M.M. Development of Apremilast Nanoemulsion-Loaded Chitosan Gels: In Vitro Evaluations and Anti-Inflammatory and Wound Healing Studies on a Rat Model. Gels 2022, 8, 253. [Google Scholar] [CrossRef] [Scilit] [PubMed]
- Ansari, M.N.; Soliman, G.A.; Rehman, N.U.; Anwer, M.K. Crisaborole Loaded Nanoemulsion Based Chitosan Gel: Formulation, Physicochemical Characterization and Wound Healing Studies. Gels 2022, 8, 318. [Google Scholar] [CrossRef] [Scilit] [PubMed]
- Sim, P.; Song, Y.; Abraham, S.; Garg, S. Harnessing the benefits of utilizing the optimal pH in conjunction with a hydrogel for wound care. J. Drug Deliv. Sci. Technol. 2023, 89, 105027. [Google Scholar] [CrossRef] [Scilit]
- do Amaral Sobral, P.J.; Gebremariam, G.; Drudi, F.; De Aguiar Saldanha Pinheiro, A.C.; Romani, S.; Rocculi, P.; Dalla Rosa, M. Rheological and Viscoelastic Properties of Chitosan Solutions Prepared with Different Chitosan or Acetic Acid Concentrations. Foods 2022, 11, 2692. [Google Scholar] [CrossRef] [Scilit] [PubMed]
- Dabbaghi, M.; Namjoshi, S.; Panchal, B.; Grice, J.E.; Prakash, S.; Roberts, M.S.; Mohammed, Y. Viscoelastic and Deformation Characteristics of Structurally Different Commercial Topical Systems. Pharmaceutics 2021, 13, 1351. [Google Scholar] [CrossRef] [Scilit]
- Yağcılar, A.P.; Okur, M.E.; Ayla, Ş.; Güreşçi, D.; Özhan, Y.; Yoltaş, A.; Sipahi, H.; Üstündağ Okur, N. Preparation and in vitro-in vivo evaluation of new gallic acid loaded poloxamer/sodium alginate based thermoresponsive and bioadhesive in situ gels for wound treatment. J. Drug Deliv. Sci. Technol. 2025, 114, 107443. [Google Scholar] [CrossRef] [Scilit]
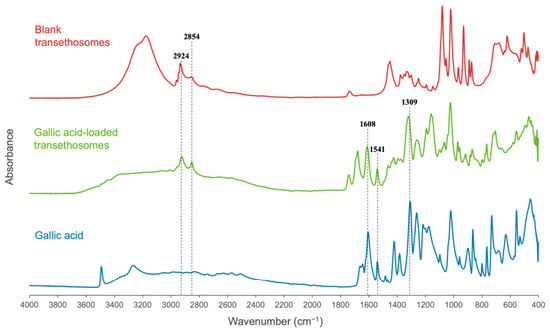
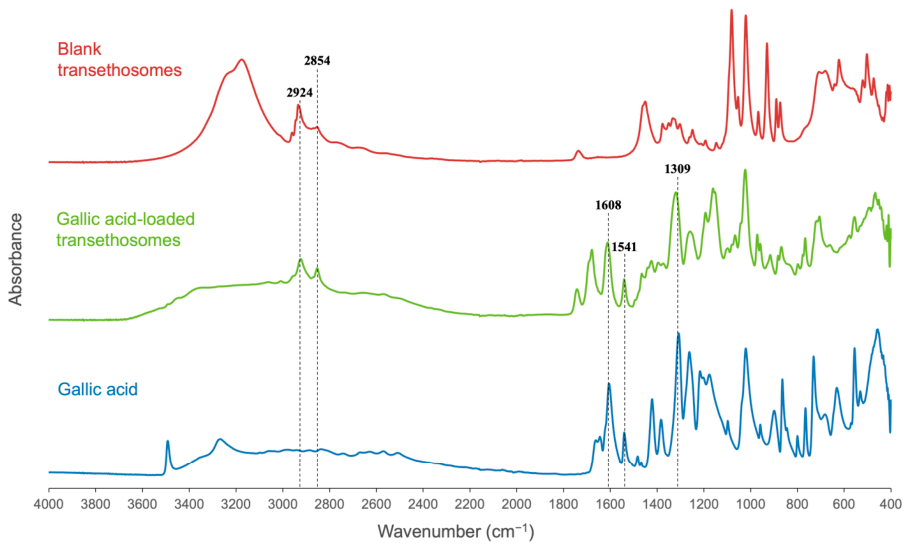
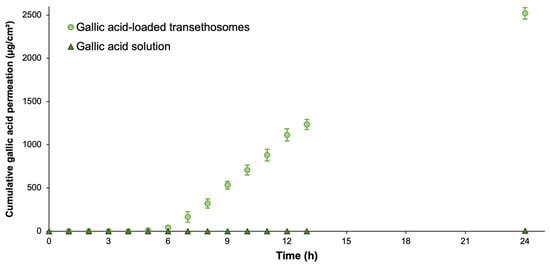
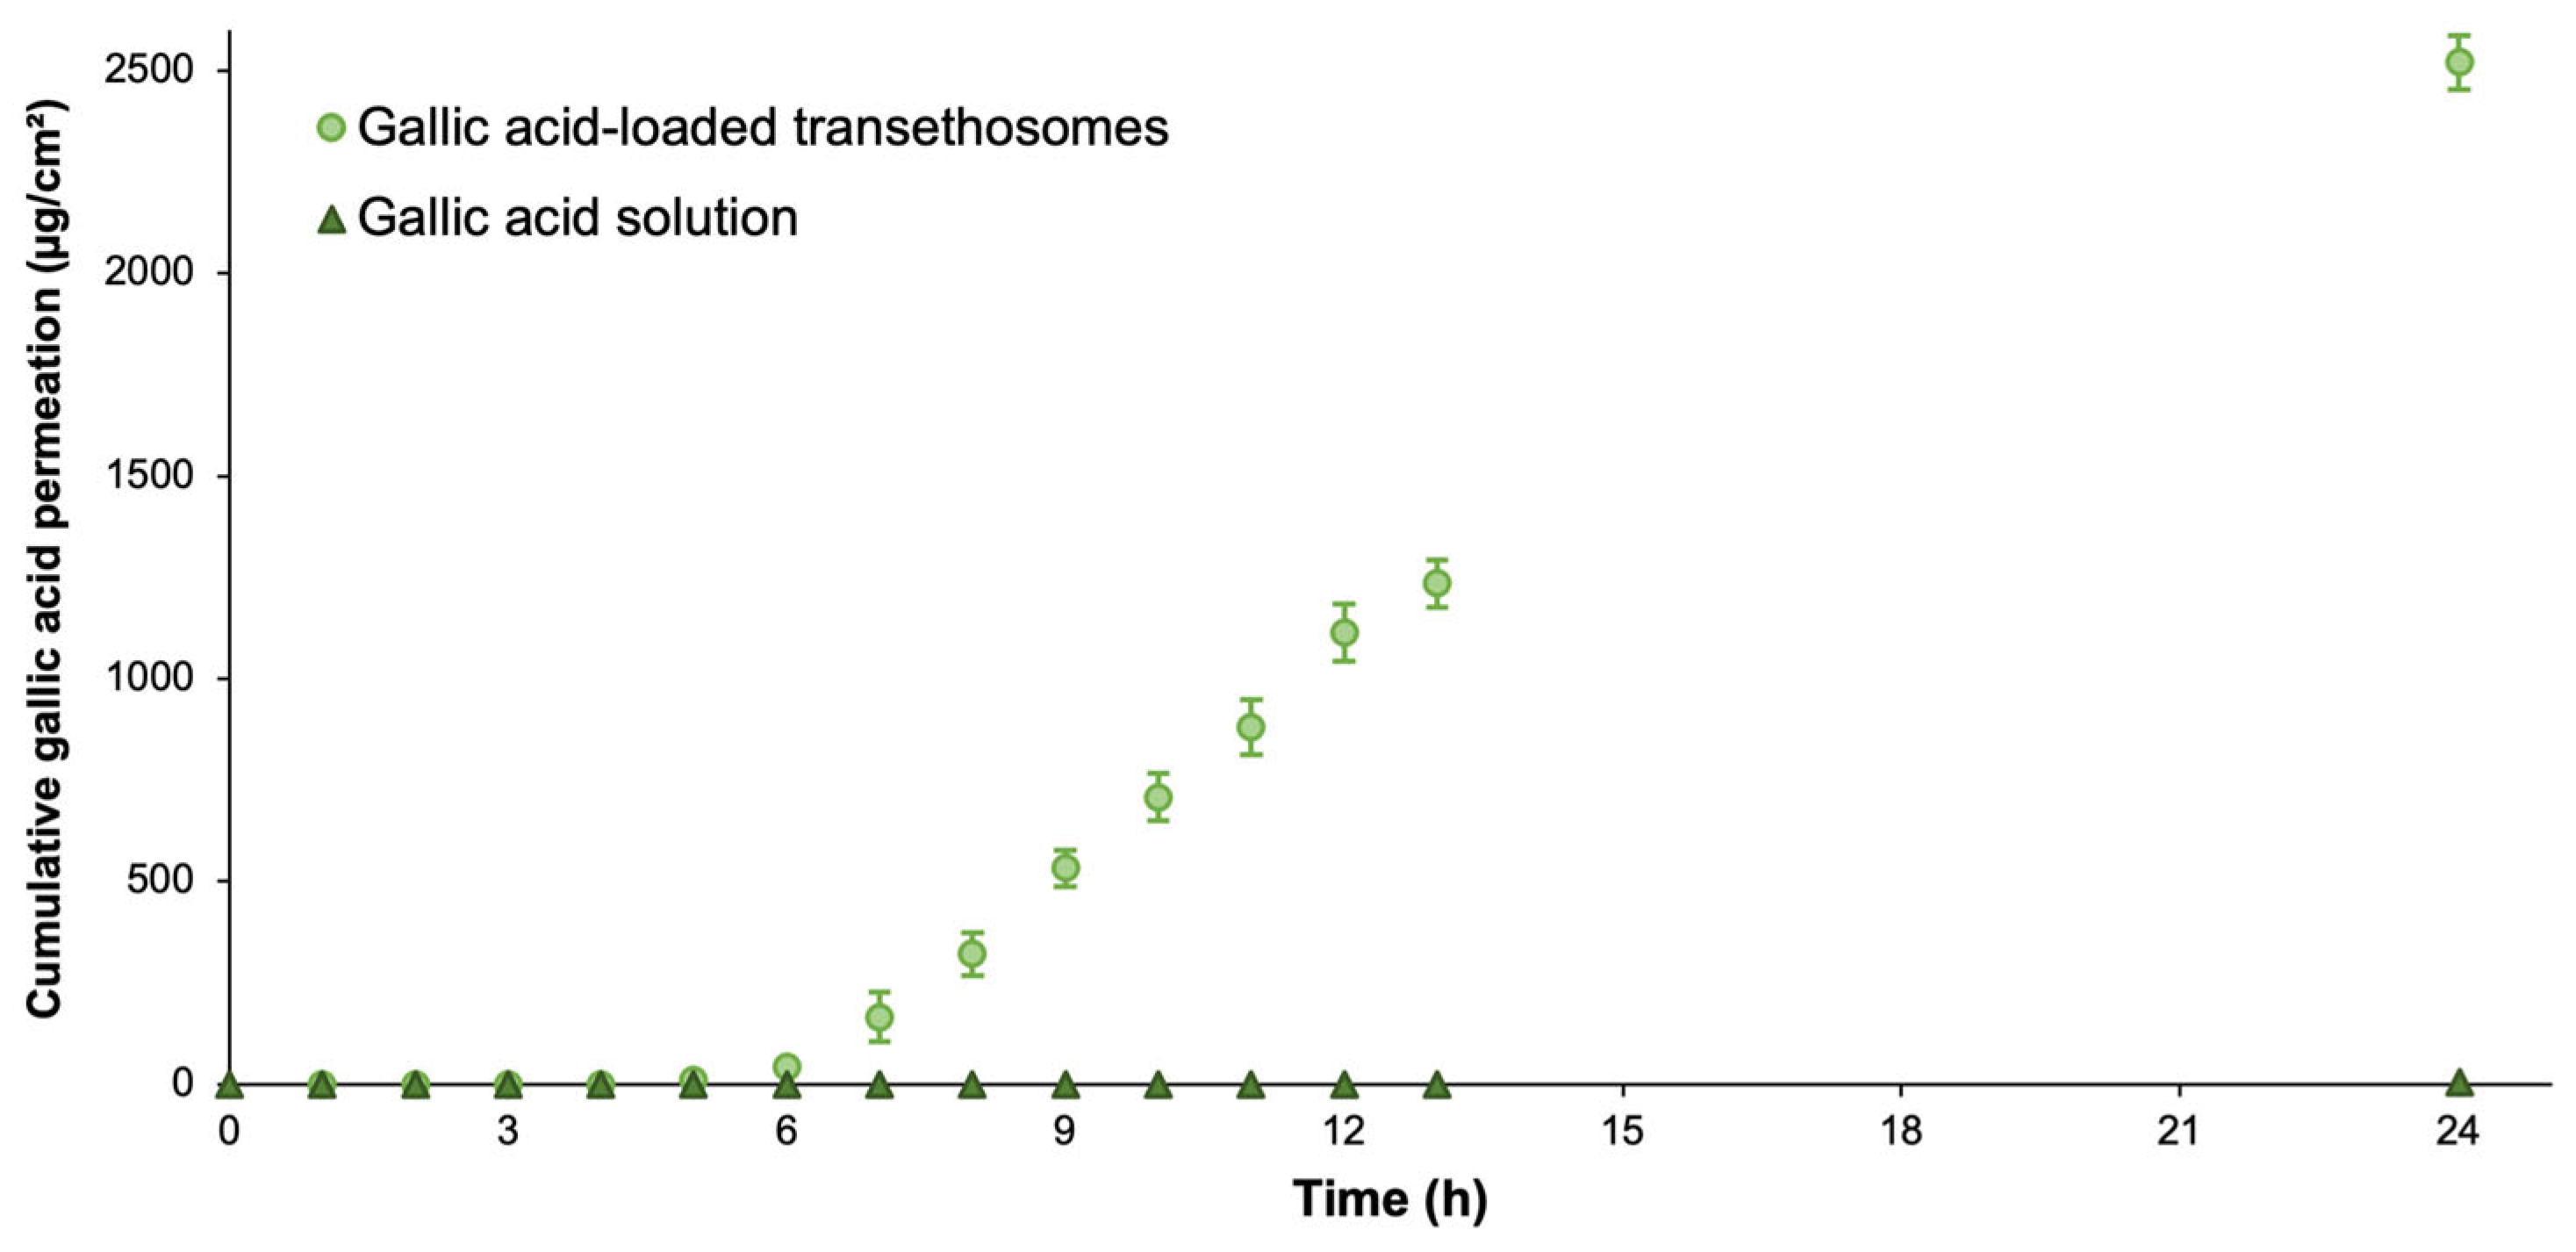
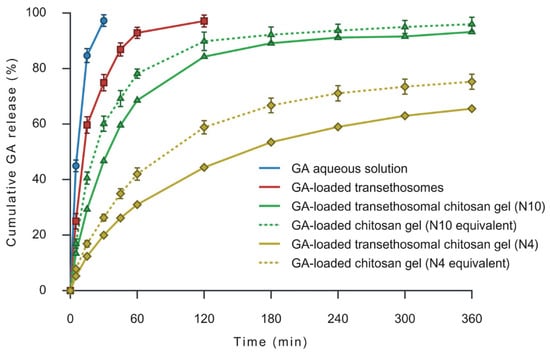
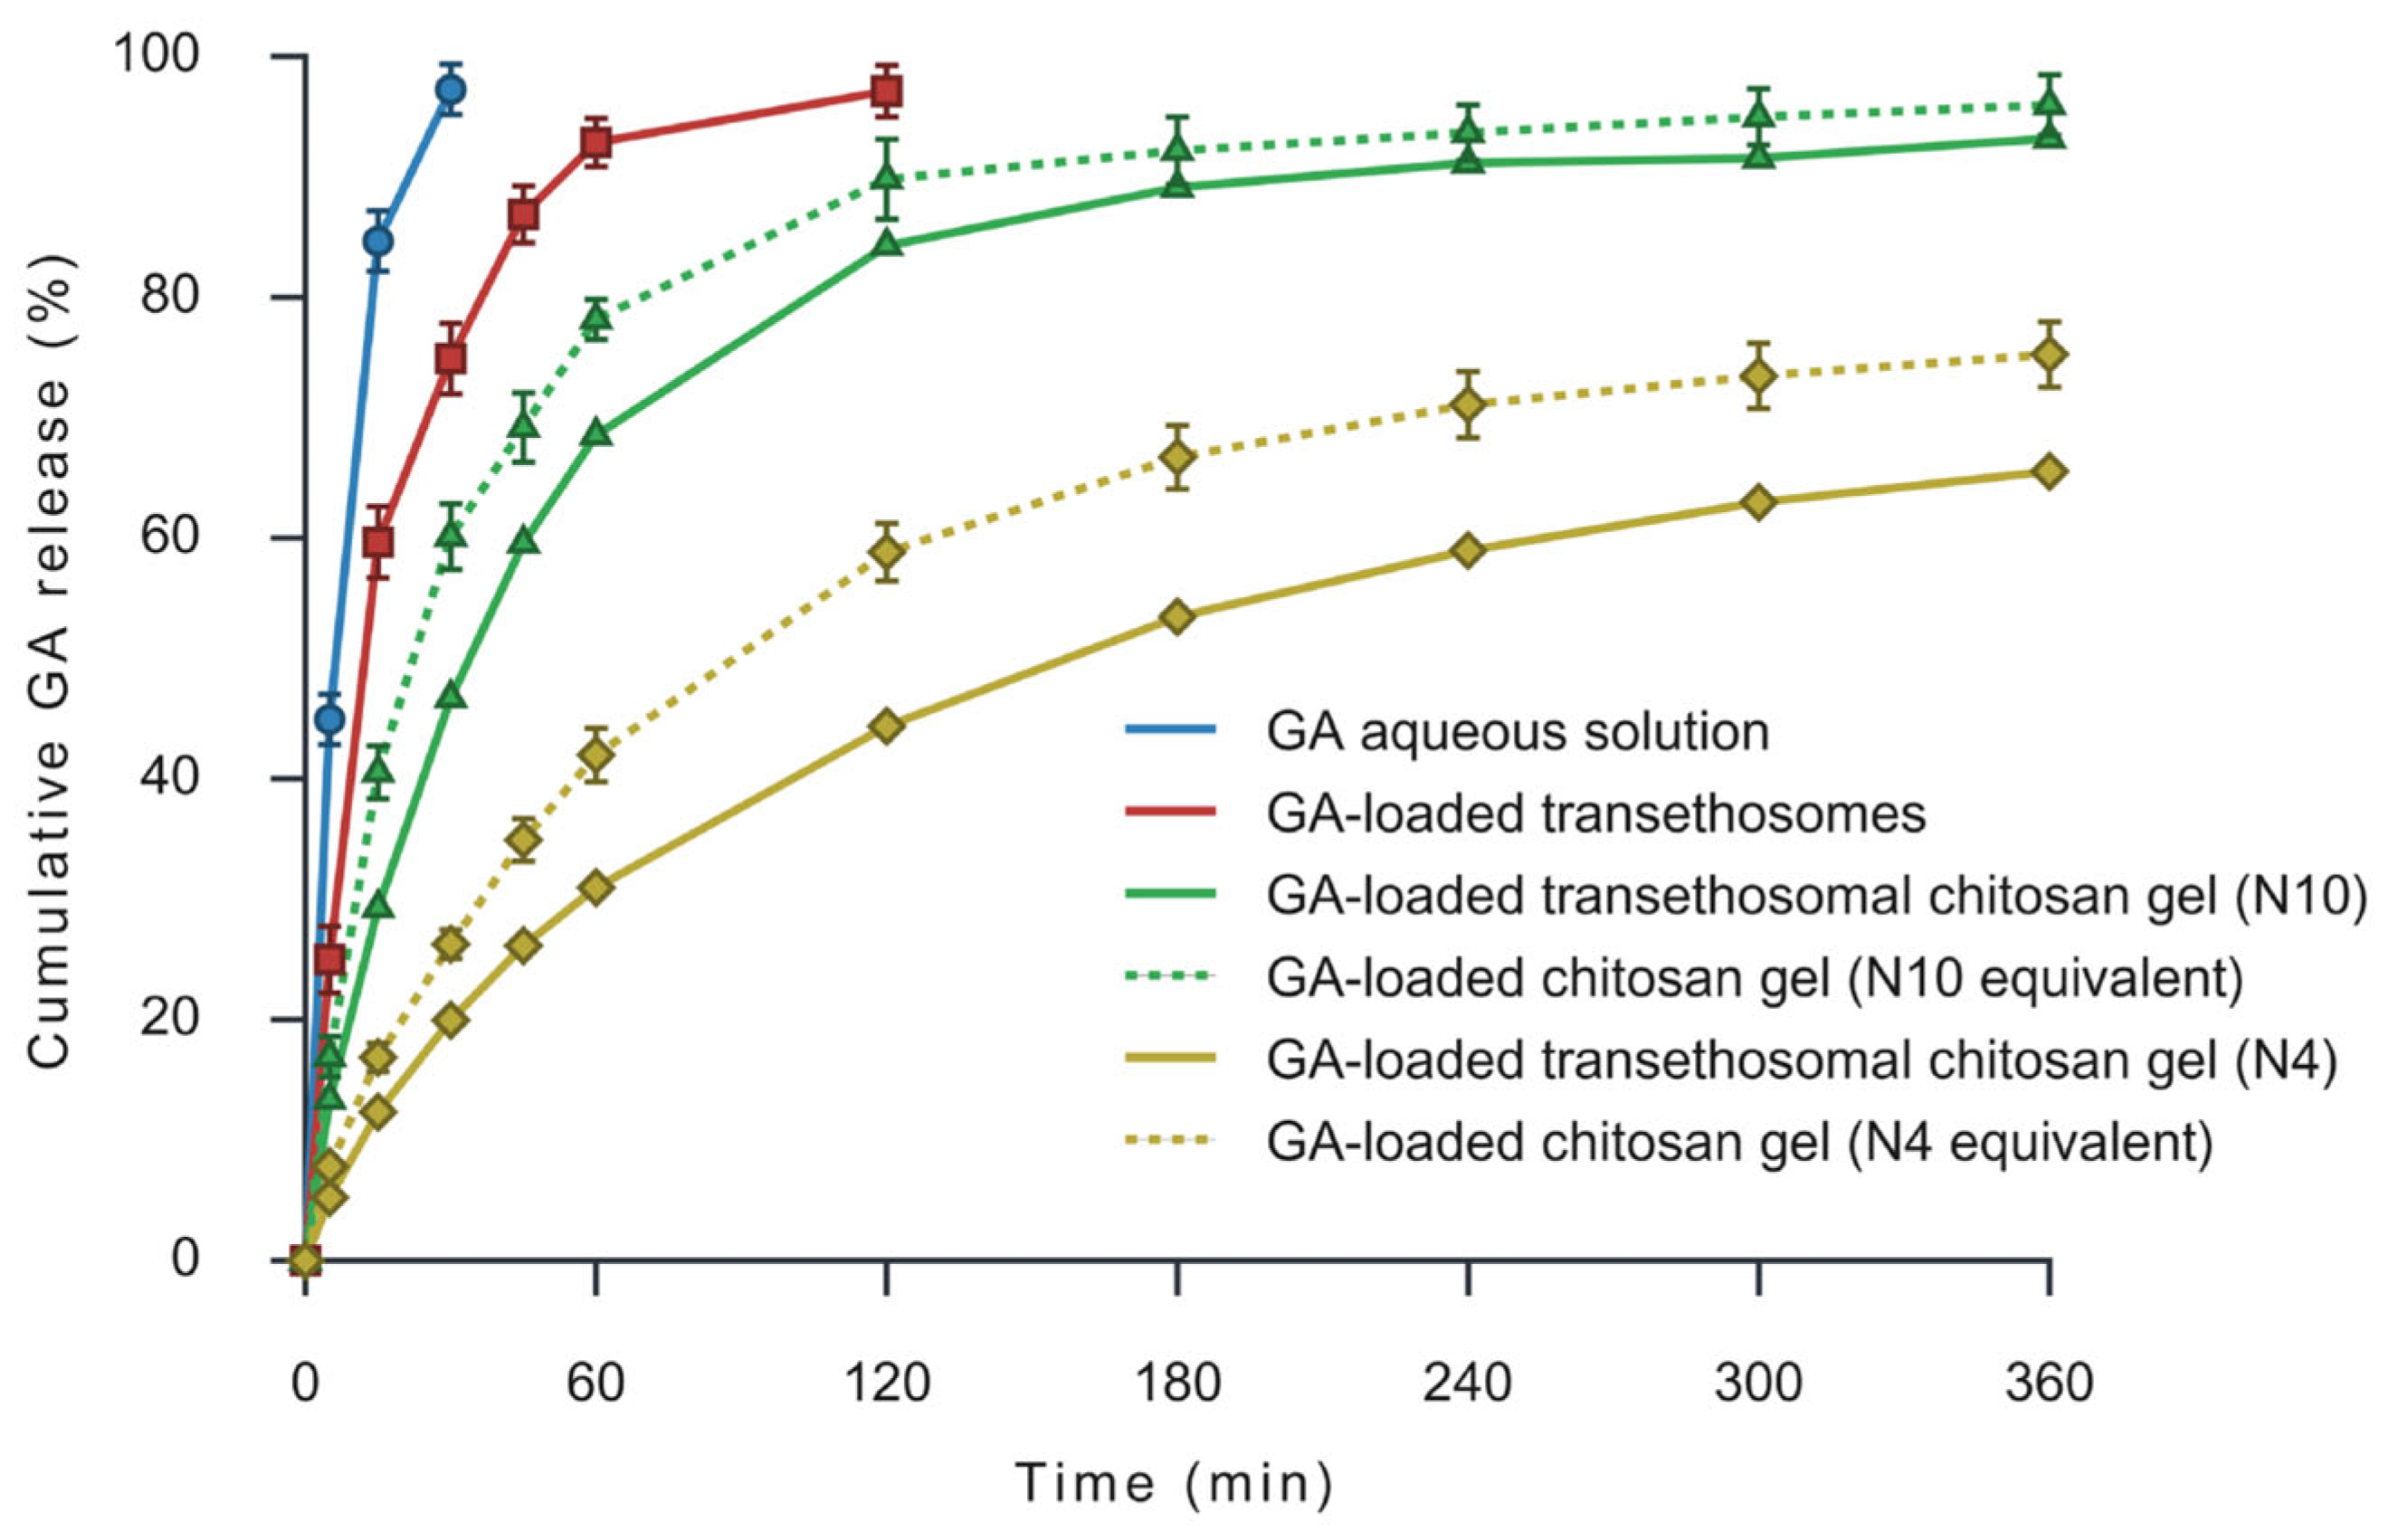
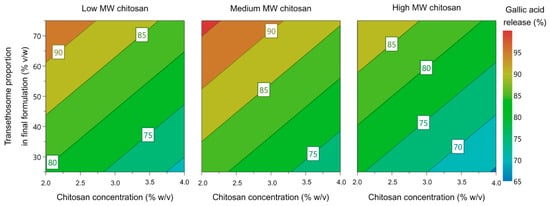
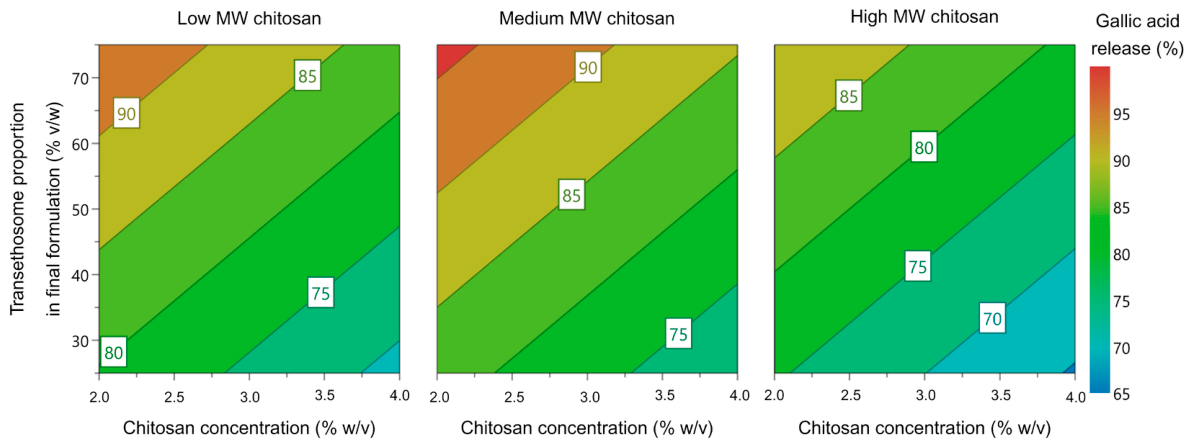
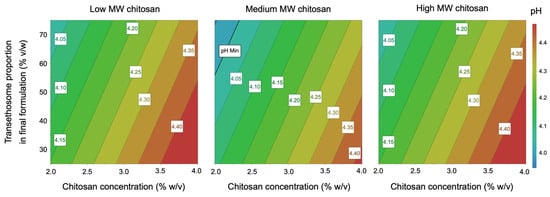
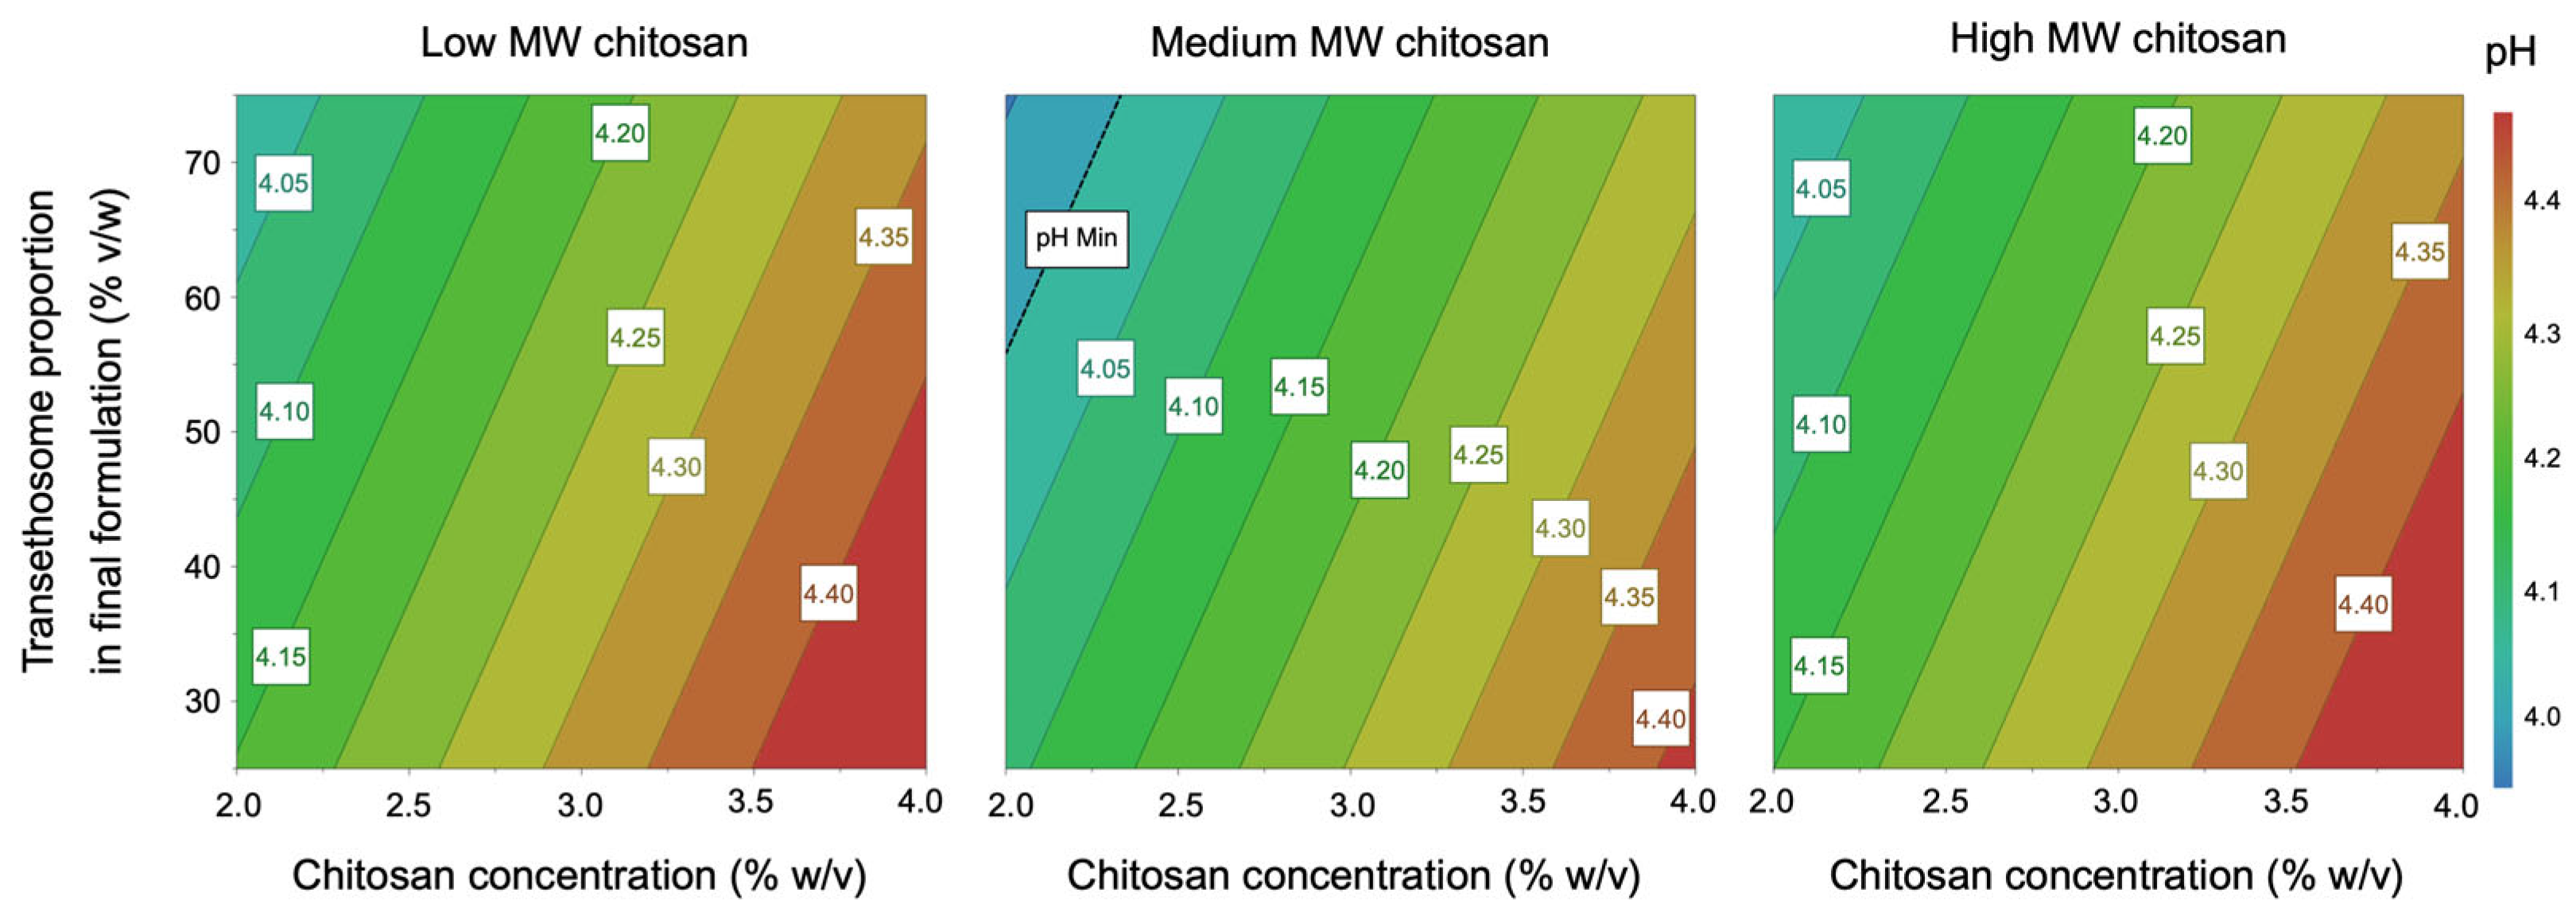
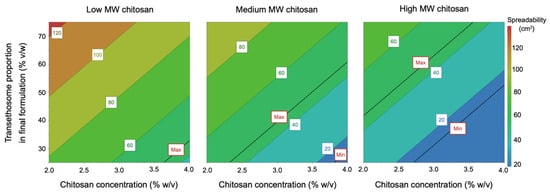
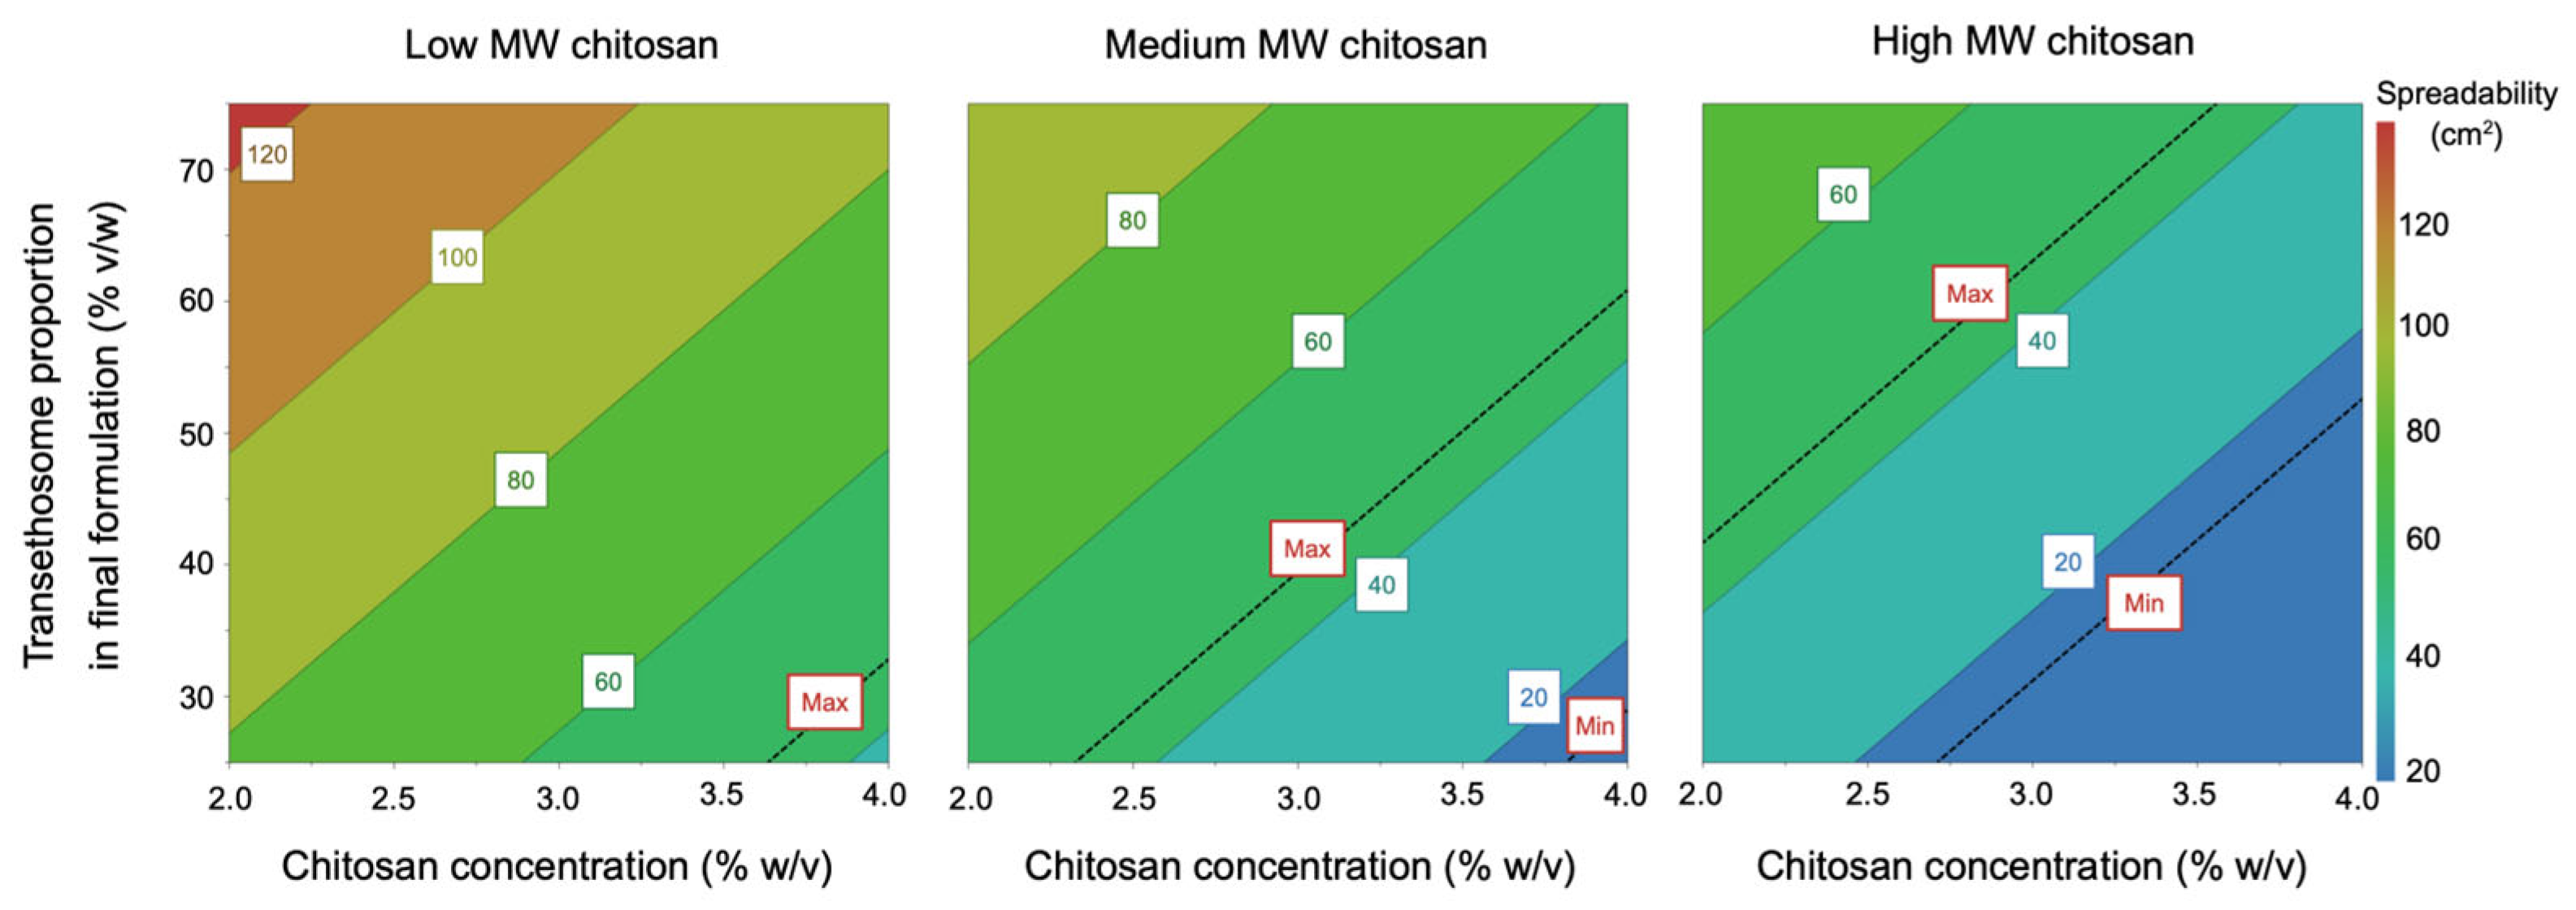
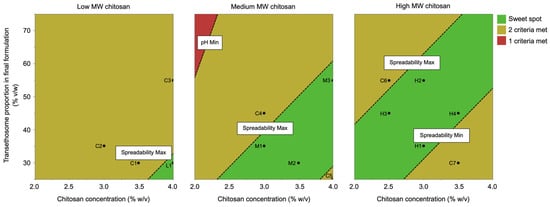
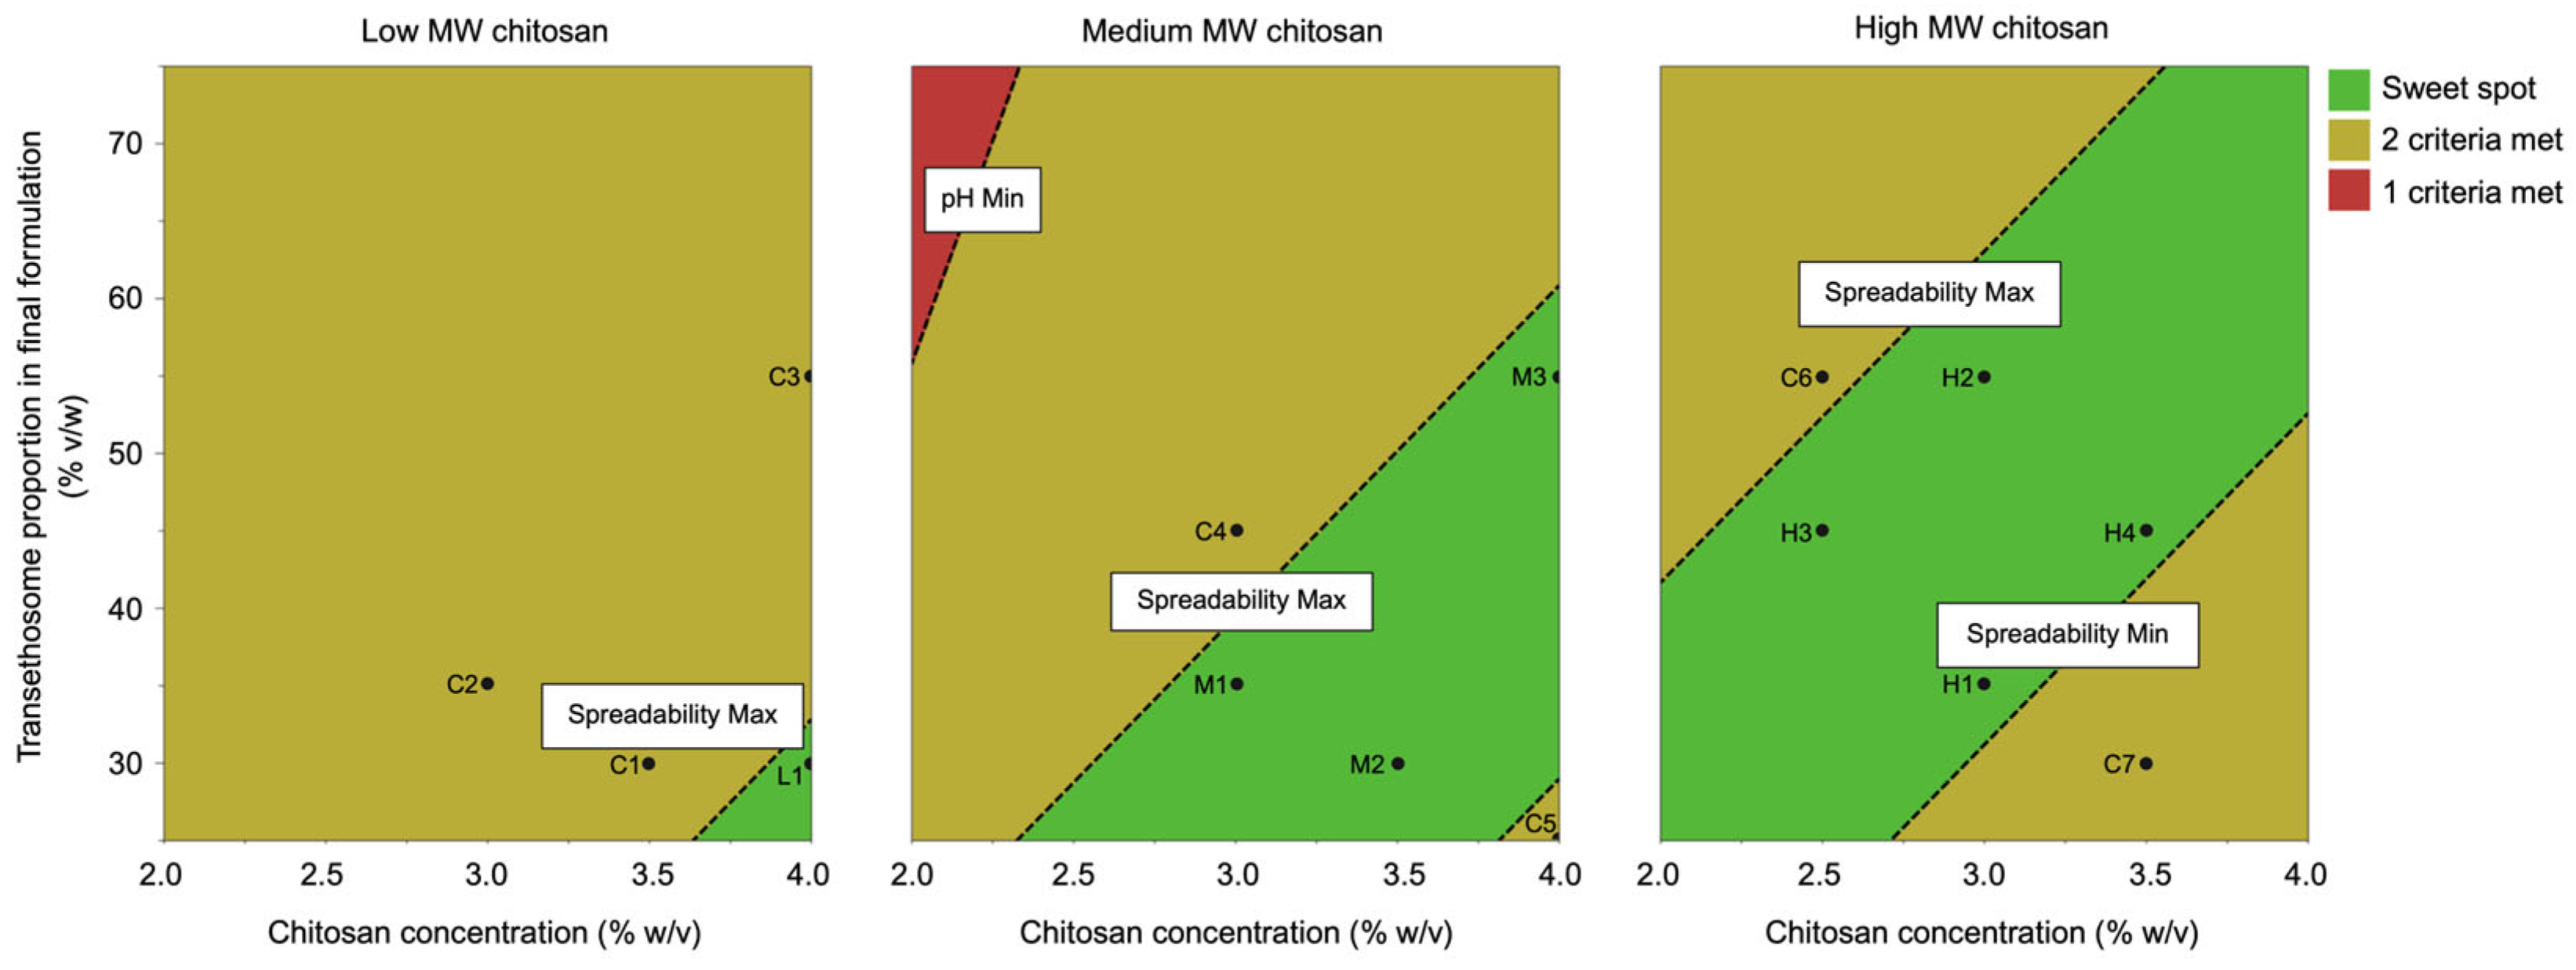
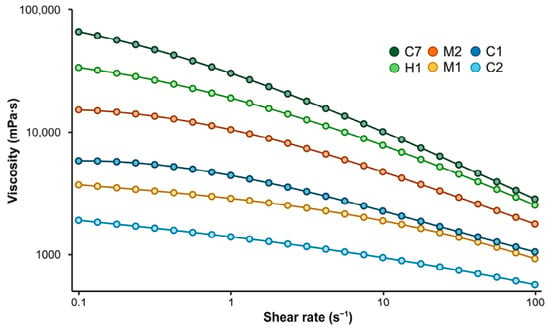
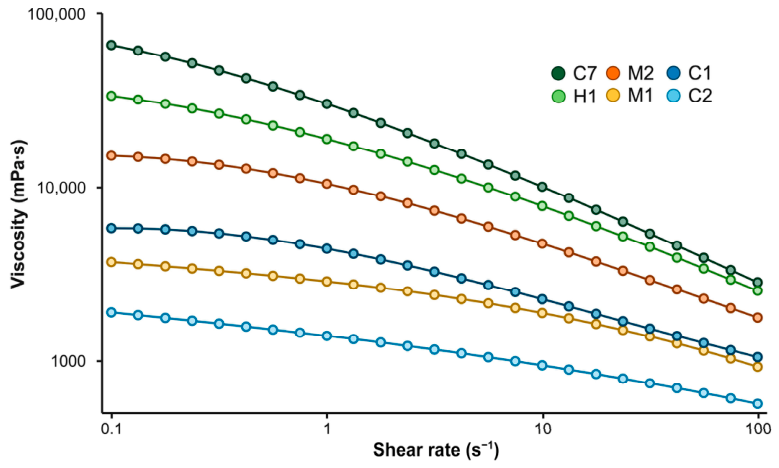
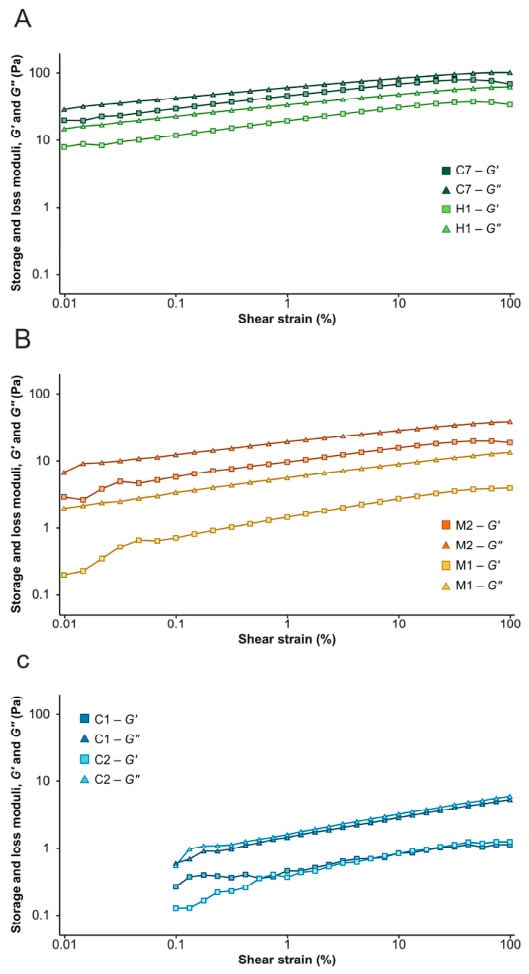
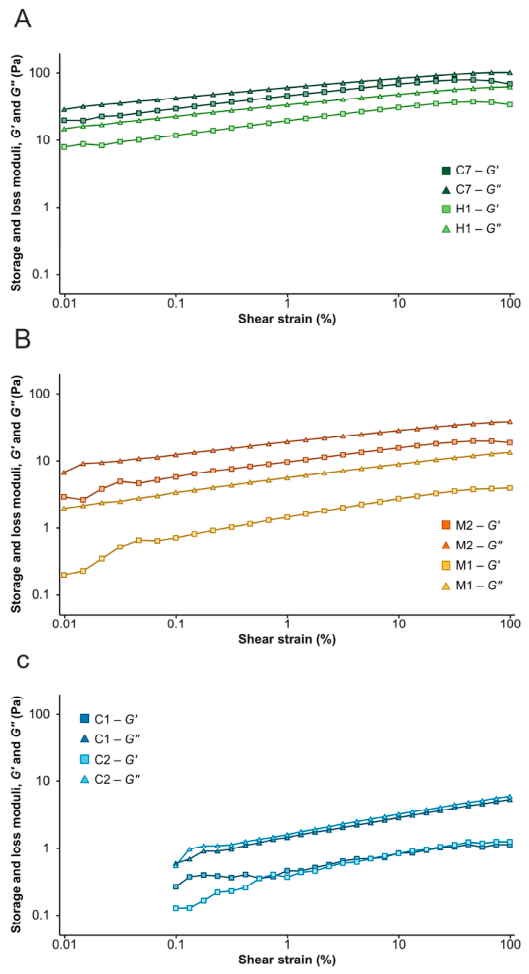

Disclaimer/Publisher’s Note: The statements, opinions and data contained in all publications are solely those of the individual author(s) and contributor(s) and not of MDPI and/or the editor(s). MDPI and/or the editor(s) disclaim responsibility for any injury to people or property resulting from any ideas, methods, instructions or products referred to in the content. |
© 2026 by the authors. Licensee MDPI, Basel, Switzerland. This article is an open access article distributed under the terms and conditions of the Creative Commons Attribution (CC BY) license.