


Abstract
Background/Objectives: Although hydrodynamic heterogeneity in USP Apparatus II has been extensively studied, few experimental studies have examined how it affects the dosage form. This study investigated how paddle rotation speed, radial tablet position, and bottom-surface exposure affect dissolution and post-dissolution erosion patterns of paracetamol model tablets, and whether residual tablet shape provides complementary information on local hydrodynamic heterogeneity. Methods: Two paracetamol model tablet types were used: model tablets (MT) for visualization of post-dissolution shape by micro-computed tomography and photography, and MT with an embedded steel washer (SW-MT) for height measurements. SW-MT dissolution was tested at 25–75 rpm at 0D, 0.5D, and 1D positions, with and without bottom-surface coating, and evaluated using the fraction dissolved after 40 min (Q40), while height changes were quantified using erosion height loss (EH) and height asymmetry (AH). Computational fluid dynamics (CFD) results aided erosion-pattern interpretation. Results: Increasing paddle rotation speed increased dissolution and erosion extent, whereas radial displacement affected erosion distribution. At 0D, residual MT shapes were comparatively symmetrical, while 0.5D and 1D produced pronounced erosion patterns. Greater erosion extent did not correspond to greater asymmetry: for uncoated SW-MT at 75 rpm, EH increased from 36% at 0.5D to 40% at 1D, whereas AH decreased from 19% to 9%. Directional erosion in MT was consistent with spatial differences in velocity and predicted surface erosion rate from CFD. Conclusions: Post-dissolution tablet shape complements dissolution profiles by revealing the spatial distribution of material loss and may serve as a complementary approach to assessing local hydrodynamic heterogeneity in USP Apparatus II.
1. Introduction
Dissolution testing is a critical quality control procedure in the pharmaceutical development of solid oral dosage forms. To achieve the desirable drug efficacy and safety, traditional oral dosage forms, such as tablets or capsules, must disintegrate and dissolve in the gastric and/or intestinal fluids before crossing the intestinal membrane [1]. Therefore, obtaining the dissolution profile of a drug is crucial for the pharmaceutical industry. This can be done by in vitro dissolution tests, and the most widely adopted in vitro dissolution testing system is the United States Pharmacopeia (USP) apparatus II (paddle apparatus). However, its inherent hydrodynamic complexity poses significant challenges for test reproducibility [2].
A key manifestation of this hydrodynamic complexity is the pronounced spatial variation in vessel hydrodynamics. Experimental velocity mapping using laser Doppler velocimetry and particle image velocimetry has revealed a characteristic flow structure consisting of a low velocity central region beneath the paddle, surrounded by high velocity recirculation loops. Although the flow is primarily dominated by the tangential component of velocity, axial and radial components are also present and contribute to overall flow behavior [3,4].
Computational fluid dynamics (CFD) has emerged as a powerful tool for characterizing the complex flow fields in the USP II apparatus, providing spatial information on velocity, shear stress, and mass transfer conditions that are difficult to obtain experimentally [5,6]. However, most CFD studies employ simplified geometries in which tablets are represented as non-eroding compacts, limiting their ability to capture the dynamic structural changes occurring during dissolution testing.
The practical implications of hydrodynamic heterogeneity have been demonstrated through studies investigating fixed tablet positioning during dissolution testing. Because non-fixed tablets tend to move within the vessel, they generally exhibit greater variability in dissolution results compared to fixed tablets [2]. Tablets positioned at the center of the vessel’s bottom exhibit consistently lower dissolution rates, whereas off-center tablets dissolve faster [7,8,9,10]. The reduced dissolution rate at the center is attributed to the formation of isolated low-flow zones, commonly referred to as “dead zones” or the “coning effect”, where fluid flow is minimal [2,8,11]. Therefore, the placement of the tablet within the vessel significantly affects the consistency of dissolution results.
While tablet position determines the local hydrodynamic environment, stirring speed primarily modifies the magnitude of the hydrodynamic forces acting on the tablet, causing faster drug release [2,12]. D’Arcy et al. and Lou et al. further demonstrated that tablet position strongly influences erosion patterns [7,13]. Off-center tablets showed pronounced asymmetric shape changes and faster material loss on the side facing higher-velocity flow, reflecting the non-uniform velocity fields predicted by CFD simulations. The relationship between flow asymmetry and erosion asymmetry is mediated by the mass transfer boundary layer. In regions of high velocity and shear, the boundary layer is thinner, leading to steeper concentration gradients and higher mass transfer rates [14].
Although hydrodynamic heterogeneity in the USP apparatus II was already described in the early 1980s by D. C. Cox and W. B. Furman [15] and has been an active area of investigation ever since, limited experimental studies have examined how these flow conditions manifest as measurable three-dimensional changes in tablet morphology during dissolution. Dissolution profiles describe overall drug release over time but they do not show whether the remaining tablet has eroded uniformly or developed spatially heterogeneous shape changes.
Our previous work using the paracetamol model tablets demonstrated that tablet position, fixation, bottom-surface exposure, and paddle rotation speed influence the dissolution response, while high-resolution CFD revealed spatial and temporal heterogeneity in the local flow and concentration fields [16]. However, the CFD model retained a fixed tablet geometry and therefore did not capture changes in tablet shape during dissolution.
Post-dissolution erosion patterns may provide complementary information on hydrodynamic effects that dissolution profiles alone do not reveal. In particular, erosion asymmetry allows the overall extent of material loss to be distinguished from its spatial non-uniformity. Therefore, the aim of this study was to investigate how paddle rotation speed, radial tablet position, and bottom-surface exposure affect dissolution and post-dissolution erosion patterns of two paracetamol model tablet types, and whether residual tablet shape provides complementary experimental information on local hydrodynamic heterogeneity in USP Apparatus II.
Building on previous studies of tablet dissolution and erosion under heterogeneous flow conditions, the present study employs micro-computed tomography (micro-CT) as a complementary approach for three-dimensional visualization of post-dissolution tablet shape, providing additional insight into the spatial distribution of erosion. Full dissolution profiles and the fraction dissolved at 40 min (Q40) were complemented by two height-based descriptors: erosion height loss (EH), describing overall vertical erosion, and height asymmetry (AH), describing post-dissolution height asymmetry. The experimental observations were interpreted together with CFD results to assess whether the observed erosion patterns were consistent with spatial differences in hydrodynamic conditions within the vessel.
2. Materials and Methods
2.1. Design of Paracetamol Model Tablets
2.1.1. Model Tablets (MT)
The MT were made in-house following the procedure described in our previous research [16]. The paracetamol powder (IUPAC: N-(4-hydroxyphenyl)acetamide) was sourced from Sigma-Aldrich [St. Louis, MO, USA, Cat. No. A5000], conforming to USP quality standards (98.0–102.0% purity).
For each tablet, 500 mg of paracetamol powder was weighed and compacted using a Specac Atlas Autotouch hydraulic press (15T model; Specac Ltd., Orpington, UK). A load of 3 tonnes was applied and maintained for 5 min, then gradually reduced to 1.5 tonnes before complete release. The resulting tablets had a height of 3.20 ± 0.05 mm, a diameter of 13.00 ± 0.05 mm, and a mass of 500.0 ± 0.9 mg.
No excipients were used in the model tablets, as slowly dissolving tablets undergoing gradual erosion were required to assess changes in tablet shape.
MT were used for post-dissolution micro-CT analysis to avoid metal-related imaging artifacts.
2.1.2. Model Tablets with an Embedded Steel Washer (SW-MT)
For experiments requiring reproducible tablet positioning within the dissolution vessel, SW-MTs were prepared. The steel washer had a mass of 0.04 g, a diameter of 7.96 mm, and a height of 0.09 mm. It enabled magnetic fixation of the tablet at predefined positions on the bottom of the USP Apparatus II vessel.
Each SW-MT contained a total of 500 ± 0.9 mg of paracetamol, added in two portions of 250 mg each. The first portion of powder was placed in the die and leveled before the steel washer was positioned on top. Ethanol (<100 µL; 96.3%, Aroma Floris, Riga, Latvia) was added onto the washer to promote cohesion between the paracetamol layers. The second portion of paracetamol powder was then added and leveled. The tablets were compacted using the same compression conditions as described in Section 2.1.1.
2.1.3. Bottom-Coated Model Tablets
For selected experiments, MT and SW-MT were prepared with a bottom-surface coating. The coating (nail polish) was manually applied to the bottom surface of the tablets in a layer as thin as possible to minimize its effect on the overall tablet height. Nail polish has previously been used as a coating material intended to prevent dissolution from selected tablet surfaces in dissolution studies involving partially coated tablets [17]. The coating thickness was not measured separately. The coating was allowed to air-dry completely before dissolution testing, to limit the bottom-surface exposure to the dissolution medium, while the upper surface and tablet edge remained exposed. These tablets were referred to throughout the manuscript as bottom-coated tablets, whereas tablets without the coating—uncoated tablets.
2.2. Tablet Positioning and Fixation in the USP II Dissolution Vessel
Two fixation approaches were used depending on the experimental purpose. SW-MT were magnetically fixed at predefined positions on the bottom of the USP Apparatus II dissolution vessel using a magnet placed below the vessel. MT, used for post-dissolution micro-CT analysis, were fixed at the same predefined positions using adhesive, thereby avoiding metal-related imaging artifacts.
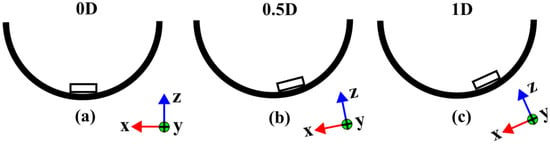
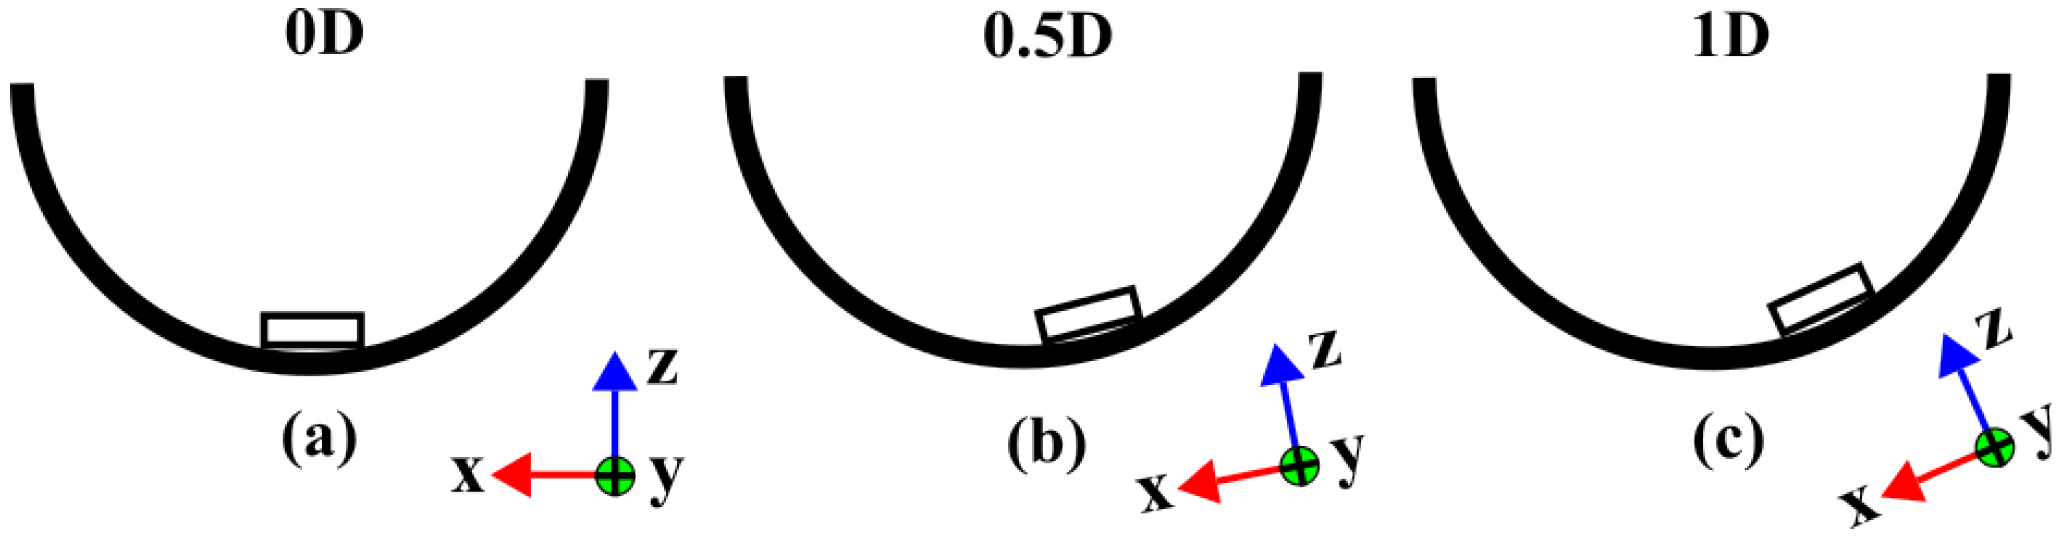
Three fixed tablet positions were investigated: 0D, 0.5D, and 1D, where D corresponds to the initial tablet diameter. The 0D position corresponds to the vessel center, whereas 0.5D and 1D correspond to radial displacements of one-half and one full tablet diameter from the vessel center, respectively (Figure 1). The displacement was defined along the Y axis. The tablet configurations, fixation methods, investigated positions, and corresponding data obtained are summarized in Table 1.
Figure 1.
Schematic representation of fixed tablet positions in the USP Apparatus II dissolution vessel: (a) 0D, centered at the vessel bottom; (b) 0.5D, tablet displaced by one-half of its initial diameter from the vessel center; (c) 1D, tablet displaced by one full of its initial diameter from the vessel center. D represents the initial tablet diameter. Radial displacement from the vessel center was defined along the Y axis.
Table 1.
Experimental configurations of model tablet types.
2.3. Dissolution Testing and Sample Analysis
Dissolution testing was performed using the procedure described in our previous study [16], with modifications related to tablet fixation and stirring speed. Experiments were carried out using a USP Apparatus II system equipped with a Pharma Test PTWS 610 dissolution tester (Pharma Test Apparatebau AG, Hainburg, Germany). Purified water (900 mL) was used as the dissolution medium, degassed and heated to 36 ± 1 °C using a Media Preparation Station (Sotax, Aesch, Switzerland) because paracetamol exhibits adequate aqueous solubility and water has been employed in previous investigations involving model tablets. The temperature was maintained at 36 ± 1 °C throughout the experiment.
Experiments were performed at paddle rotation speeds of 25, 35, 50, 60, and 75 rpm. For SW-MT, dissolution profiles were obtained by manually collecting 2 mL samples at 16 time points between 0.5 and 40 min, with sampling intervals increasing over time. The amount of paracetamol removed in previous samples was included in the calculations, but the decrease in dissolution medium volume was not taken into account. All dissolution experiments were performed with at least three independent replicates for each experimental condition (n ≥ 3), with each replicate consisting of a separate tablet subjected to an individual dissolution experiment. Paracetamol concentration was determined from absorbance at 243 nm using a UV/VIS spectrophotometer (Mettler-Toledo UV7, LabX™, Greifensee, Switzerland). Quantification was performed using a six-point calibration curve prepared from standard solutions over a concentration range of 1–20 µg/mL. The fraction of paracetamol dissolved at 40 min (Q40) was used as a common endpoint for comparison between experimental conditions. The 40 min time point was selected because tablet erosion was sufficiently developed for erosion pattern assessment, whereas at longer times the steel washer could become increasingly exposed and affect the dissolution process.
Dissolution profiles were used to compare tablet radial position, surface condition, and paddle rotation speed.
2.4. Measurement of Tablet Dimensional Changes
Tablet height was measured at room temperature 22 ± 1 °C before and after dissolution. Following dissolution, the tablets were removed from the vessel, dried overnight at room temperature, and subsequently measured.
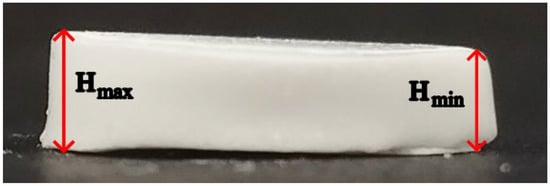
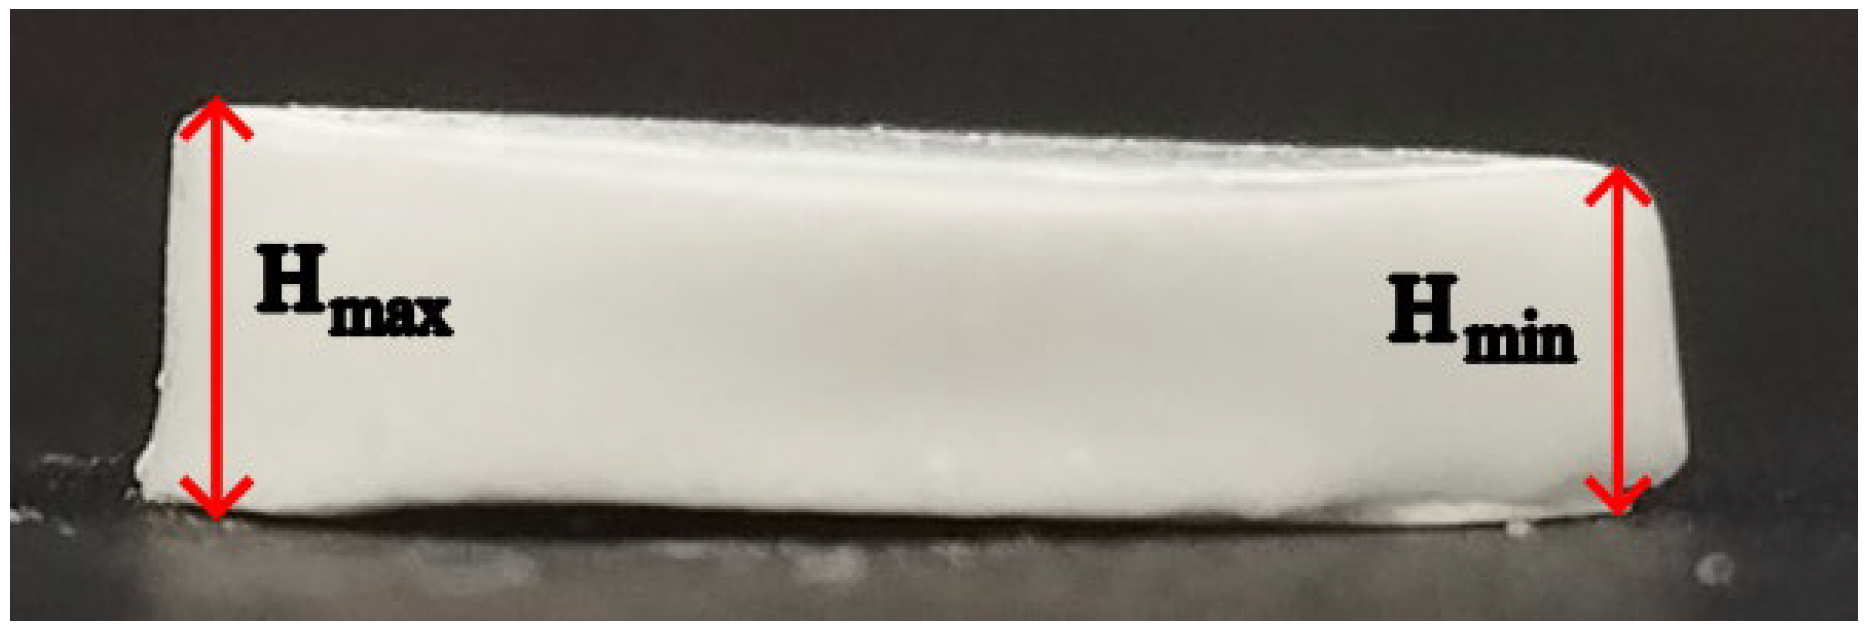
For erosion pattern analysis, tablet thickness in the axial direction is referred to as tablet height (H). Before dissolution, the initial tablet mass (m) and height (H0) were recorded. After dissolution, the maximum (Hmax) and minimum (Hmin) residual tablet heights were determined manually using a caliper with a resolution of 0.01 mm. The highest and lowest regions were initially identified visually, followed by measurements at multiple locations to determine the maximum and minimum heights. The same measurement procedure was applied to all samples. Measurements were performed by two operators, with the majority conducted by one operator. Tablet height measurements were performed for at least three tablets under each experimental condition. Hmax and Hmin values were recorded because the residual tablets were frequently asymmetric and could no longer be described by a single height measurement. The mean residual height (Hmean) was calculated as the arithmetic mean of Hmax and Hmin.
Based on these measurements, two height-based descriptors were calculated to characterize post-dissolution tablet erosion patterns: erosion height loss (EH) and height asymmetry (AH). Erosion height loss (EH) was calculated from the mean residual height and represents the percentage reduction in tablet height relative to the initial geometry:
Height asymmetry (AH) was calculated as
and used to describe the non-uniformity of the residual tablet height, expressed as a percentage of the initial tablet height.
2.5. Tablet Imaging and Micro-CT Analysis
Micro-CT was used to visualize post-dissolution tablet erosion patterns and morphology in three dimensions. Whole MT were scanned using a 3D Micro X-Ray CT Scanner (CT Lab; Rigaku Corp., Tokyo, Japan) at 80 kV and 100 µA, with the focus set on S and a 0.1 mm Cu filter. Scan acquisition settings included a 25 mm field of view (FOV), short geometry, high-resolution scan mode, and high image resolution (4 min scan time). Before reconstruction, manual center adjustment was performed, and a ring-reduction filter was applied. The reconstructed micro-CT images were exported as DCM files for further processing.
Photographic imaging was used to document post-dissolution tablet morphology and to provide a visual record of erosion patterns across the investigated experimental conditions. Photographs were acquired for all fixed tablet positions (0D, 0.5D, 1D) at paddle rotation speeds of 25, 50, and 75 rpm. Representative photographs are included in the main text and Supplementary Materials, while the complete image series are available in the accompanying public dataset [18]. The photographs were acquired using a smartphone camera and were intended for qualitative documentation only; therefore, no standardized imaging distance or pixel-based calibration was applied.
The 3D reconstructions were used to assess tablet shape, height distribution, edge rounding, bottom-surface changes, and asymmetry between tablet sides. The reconstructions were oriented and compared according to the local coordinate system and visualization conventions described in Section 2.6.
2.6. Local Coordinate System and Visualization Conventions for Micro-CT Analysis
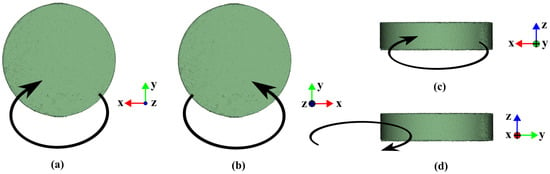
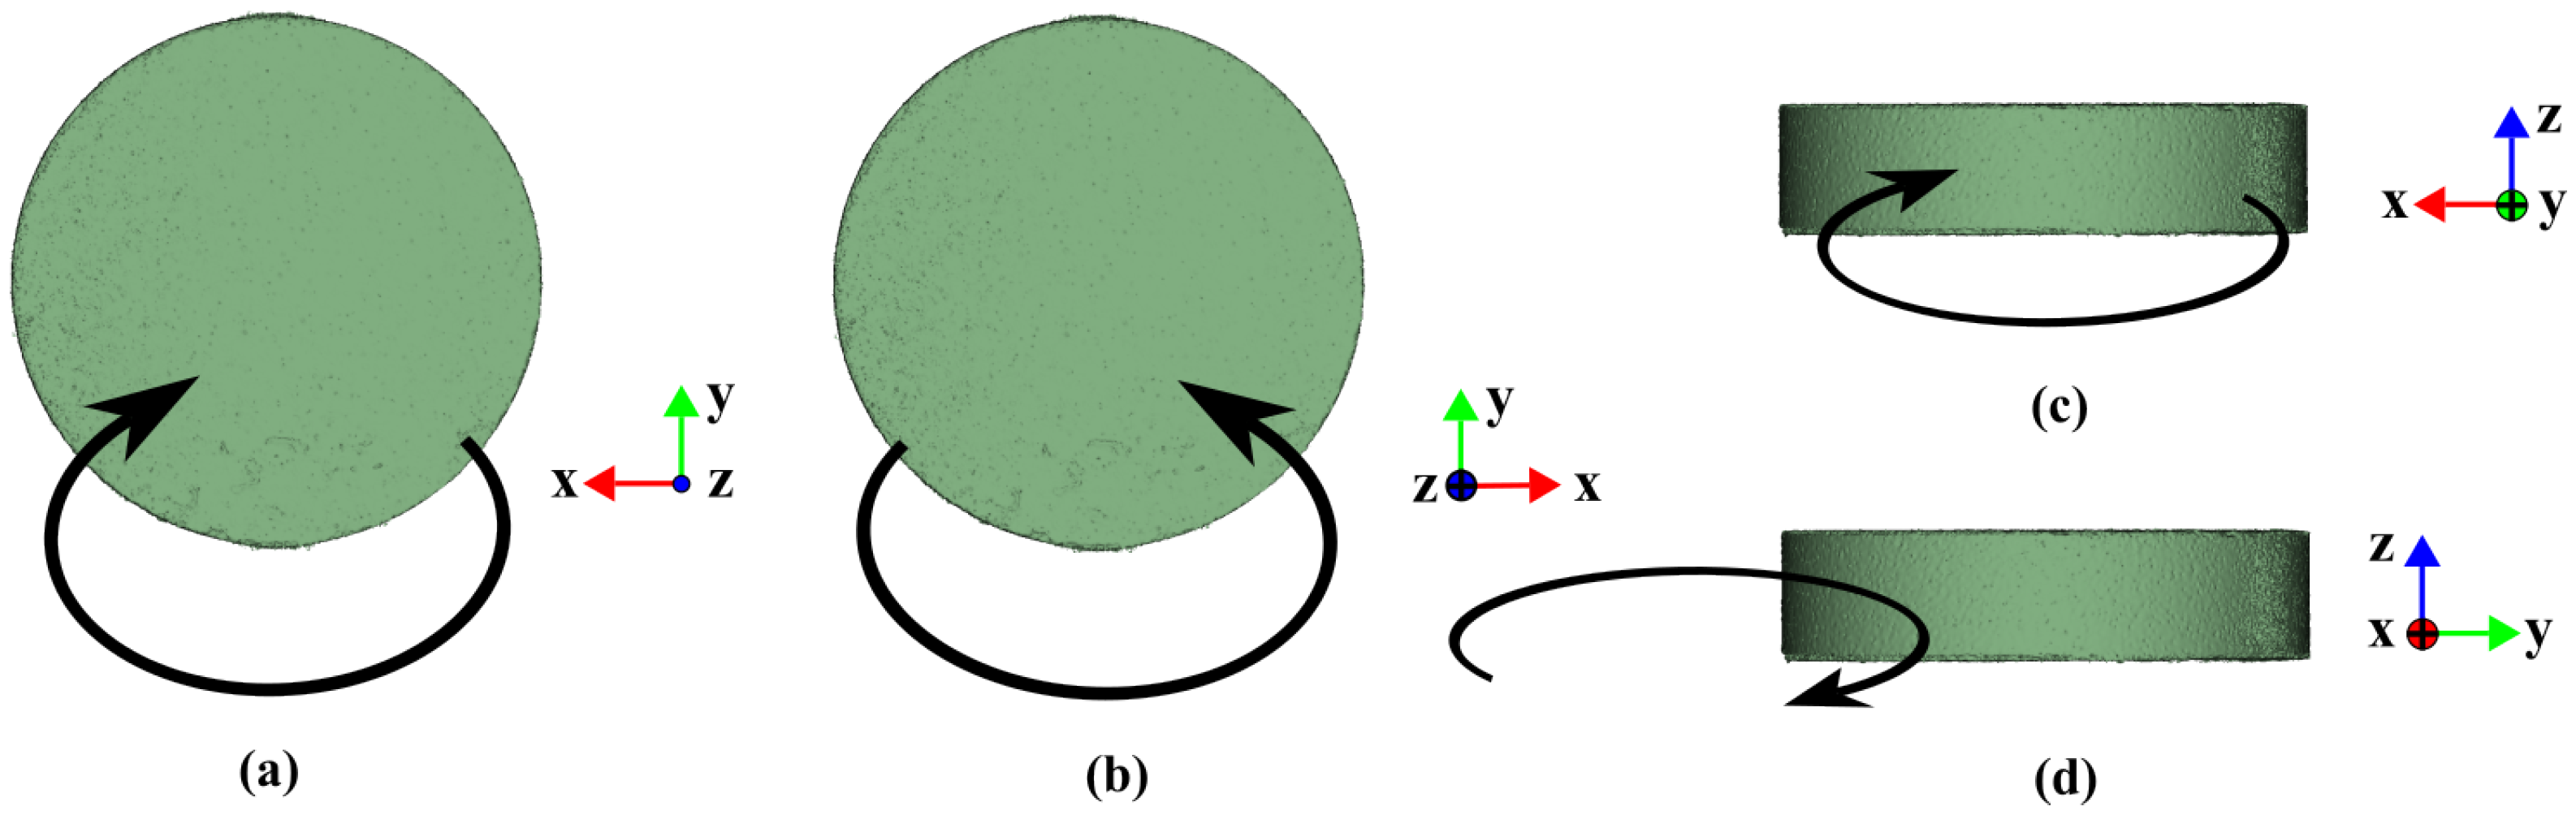
Post-dissolution tablet geometry was described using a local coordinate system defined for image orientation and comparison between samples (Figure 2). Figure 2 defines the local tablet coordinate system, with its orientation relative to the vessel shown in Figure 1. The X axis is shown in red, the Y axis in green, and the Z axis in blue. The X and Y axes define directions parallel to the vessel’s bottom, whereas the Z axis indicates the tablet height direction. When an axis points toward the viewer, it is represented by a dot in the corresponding axis color (Figure 2a). When an axis points away from the viewer, it is represented by a circle with a cross in the corresponding axis color (Figure 2b).
Figure 2.
Schematic representation of paddle-induced flow direction relative to the tablet in the local coordinate system: (a) top view; (b) bottom view; (c) front view; (d) side view. Black arrows schematically indicate the paddle-induced flow direction relative to the tablet. The X, Y, and Z axes define the orientation used consistently throughout the micro-CT analysis.
Four visualization views were used: top view, bottom view, front view, and side view. The top and bottom views were used to describe changes in the tablet outline and erosion pattern. The front and side views were used to describe height reduction, edge rounding, and profile asymmetry.
The arrows in Figure 2 indicate the local paddle-induced flow direction relative to the tablet. For positioned tablets at 0.5D and 1D, the front view corresponds to the side of the tablet facing the vessel center. This convention was used throughout the manuscript to describe the directionality of tablet erosion. For tablets at 0D, the same visualization directions were retained, although no center-facing side was defined.
2.7. Hydrodynamic Characterization of the Dissolution Process of MT in USP Apparatus II Vessel
A detailed description of the CFD methodology used in this work can be found in our previous publication [16]. The simulations were carried out using OpenFOAM (foam-extend 3.2), an open-source CFD toolbox, with a custom, in-house solver developed to capture the coupled hydrodynamics and mass transfer relevant to the dissolution process. Two types of CFD results relevant to tablet erosion were used: time-averaged flow velocity fields (m/s) and surface erosion rates (mm/h). In this study, the flow velocity is evaluated only in the region surrounding the tablet at the center of the surface-adjacent mesh cell near the surface. The thickness of that layer of “first cells” is chosen so that the cell is inside both laminar sublayers—hydrodynamic and concentration. The surface erosion rate is determined from the calculated flux of paracetamol concentration released from the tablet surface according to Fick’s law. It should be noted that the tablet geometry is kept unchanged throughout the CFD simulations and is not updated as dissolution proceeds; thus, the results are valid only at the beginning.
2.8. Data Processing and Analysis
Dissolution profiles and Q40, as well as EH and AH, were calculated and processed using Microsoft Excel (Microsoft 365; Microsoft Corporation, Redmond, WA, USA). Results are presented as mean ± standard deviation (SD). All calculations, data processing, and graphical representations were performed using Microsoft Excel. The analysis was descriptive, focusing on observed trends and differences in mean values between experimental conditions. No inferential statistical tests were performed. The graphical abstract was created using BioRender.com (BioRender, Toronto, ON, Canada), while the other images were prepared using Inkscape (version 1.4.3; Inkscape Project).
3. Results and Discussion
3.1. Dissolution Outcomes of SW-MT Under Controlled Tablet Positioning
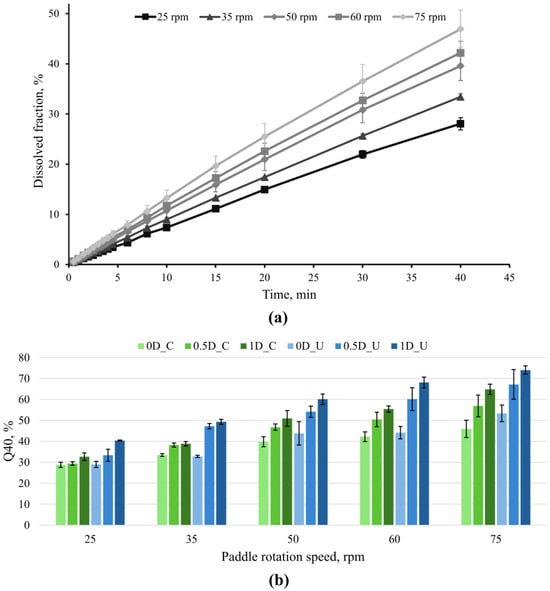
The Q40 was used as the primary endpoint for comparing dissolution under paddle rotation speeds (25, 35, 50, 60, 75 rpm), radial tablet positions (0D, 0.5D and 1D), and bottom-surface conditions (bottom-coated and uncoated). Figure 3a shows representative dissolution profiles of bottom-coated SW-MT at 0D, illustrating the 40 min endpoint. Additional dissolution profiles are provided in Figures S1 and S2.
Figure 3.
Dissolution behavior under controlled tablet positioning. (a) Representative dissolution profiles of bottom-coated SW-MT positioned at 0D at paddle rotation speeds of 25, 35, 50, 60, and 75 rpm. (b) Mean Q40 ± SD values as a function of paddle rotation speed and radial position for bottom-coated and uncoated SW-MT. In the legend, C denotes bottom-coated, and U denotes uncoated SW-MT.
For bottom-coated SW-MT at 0D, the Q40 increased gradually with paddle rotation speed from 25 to 75 rpm; it increased from 28.8% at 25 rpm to 45.9% at 75 rpm (a difference of 17.1 percentage points (pp)), demonstrating the increase in overall dissolution with increasing paddle rotation speed. Sensitivity to paddle rotation speed is consistent with literature reports that paddle rotation speed is an important variable in the USP Apparatus II and influences the hydrodynamic conditions relevant to drug release [16].
The radial tablet position also affected the Q40 (Figure 3b). When Q40 was compared across radial tablet positions from 0D to 1D, dissolution generally increased as the SW-MT was displaced from the vessel center toward the 1D position, and these differences became more noticeable at higher paddle rotation speeds. For bottom-coated SW-MT, the Q40 increased modestly from 0D to 1D at 25 rpm (28.8% → 32.6%, +3.8 pp) but became more pronounced at 75 rpm (45.9% → 64.8%, +18.9 pp). The same overall position-dependent increase was observed for uncoated SW-MT, from 29.0% to 40.3% at 25 rpm (+11.3 pp) and from 53.3% to 74.0% at 75 rpm (+20.7 pp). This pattern is consistent with previous reports showing that tablet location within USP II can influence dissolution outcomes [14,19].
Bottom-surface exposure also influenced dissolution outcomes. Uncoated SW-MT generally showed equal or higher Q40 values than bottom-coated SW-MT, although the difference depended on paddle rotation speed and radial tablet position. At 25 rpm, Q40 values at 0D were similar (29.0% for uncoated vs 28.8% for bottom-coated SW-MT), whereas at 1D the difference increased to 7.7 pp (40.3% vs. 32.6%). At 75 rpm, the corresponding differences were 7.4 pp at 0D (53.3% vs 45.9%) and 9.2 pp at 1D (74.0% vs 64.8%). Thus, bottom-surface exposure had little influence under the lowest-speed 0D position, while differences between bottom-coated and uncoated SW-MT became more apparent at higher paddle speeds and/or displaced positions. This is consistent with the effect of bottom-surface exposure previously observed for the same model tablet type [16].
Taken together (Table 2), the results show that Q40 increased with paddle rotation speed, while radial displacement generally produced a further increase, particularly at higher paddle rotation speeds. The effect of bottom-surface exposure was more condition-dependent: it was minimal for SW-MT at 0D at 25 rpm but became more evident at displaced positions and higher paddle rotation speeds. However, Q40 represents the cumulative amount released and does not indicate how material loss is spatially distributed across the tablet. Therefore, the following sections evaluate post-dissolution tablet shape to determine whether erosion descriptors provide additional information beyond the overall dissolution endpoint.
Table 2.
Summary of paddle speed, radial position, and surface exposure on Q40 for SW-MT.
3.2. Visual Evidence of Spatial Heterogeneity in Tablet Erosion in MT
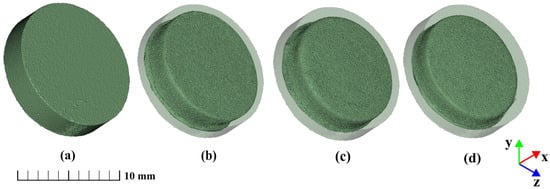
Micro-CT analysis of MT revealed distinct three-dimensional erosion patterns that were not apparent from the dissolution response alone. To facilitate comparison between the initial and residual tablet geometries, each post-dissolution reconstruction was displayed within a semi-transparent reference cylinder corresponding to the initial tablet dimensions. The reference cylinder therefore served only as a visual representation of the tablet geometry before dissolution.
The paracetamol MT were initially symmetrical, cylindrical compacts with sharp, well-defined edges (Figure 4a). This shape was chosen to enable clear observation of appearance changes during dissolution testing. For bottom-coated MT positioned at 0D, increasing paddle rotation speed progressively reduced both tablet height and diameter (Figure 4b–d). Despite the greater extent of erosion at higher rotation speeds, the MT positioned at 0D retained a comparatively symmetrical residual morphology.
Figure 4.
Representative 3D micro-CT reconstructions of MT: (a) MT before the dissolution test and bottom-coated MT positioned at 0D after 40 min at (b) 25 rpm; (c) 50 rpm; (d) 75 rpm. The semi-transparent cylinder represents the initial tablet shape. Scale bar: 10 mm.
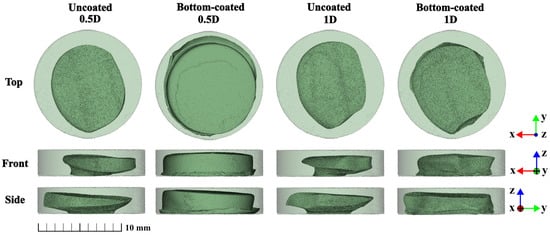
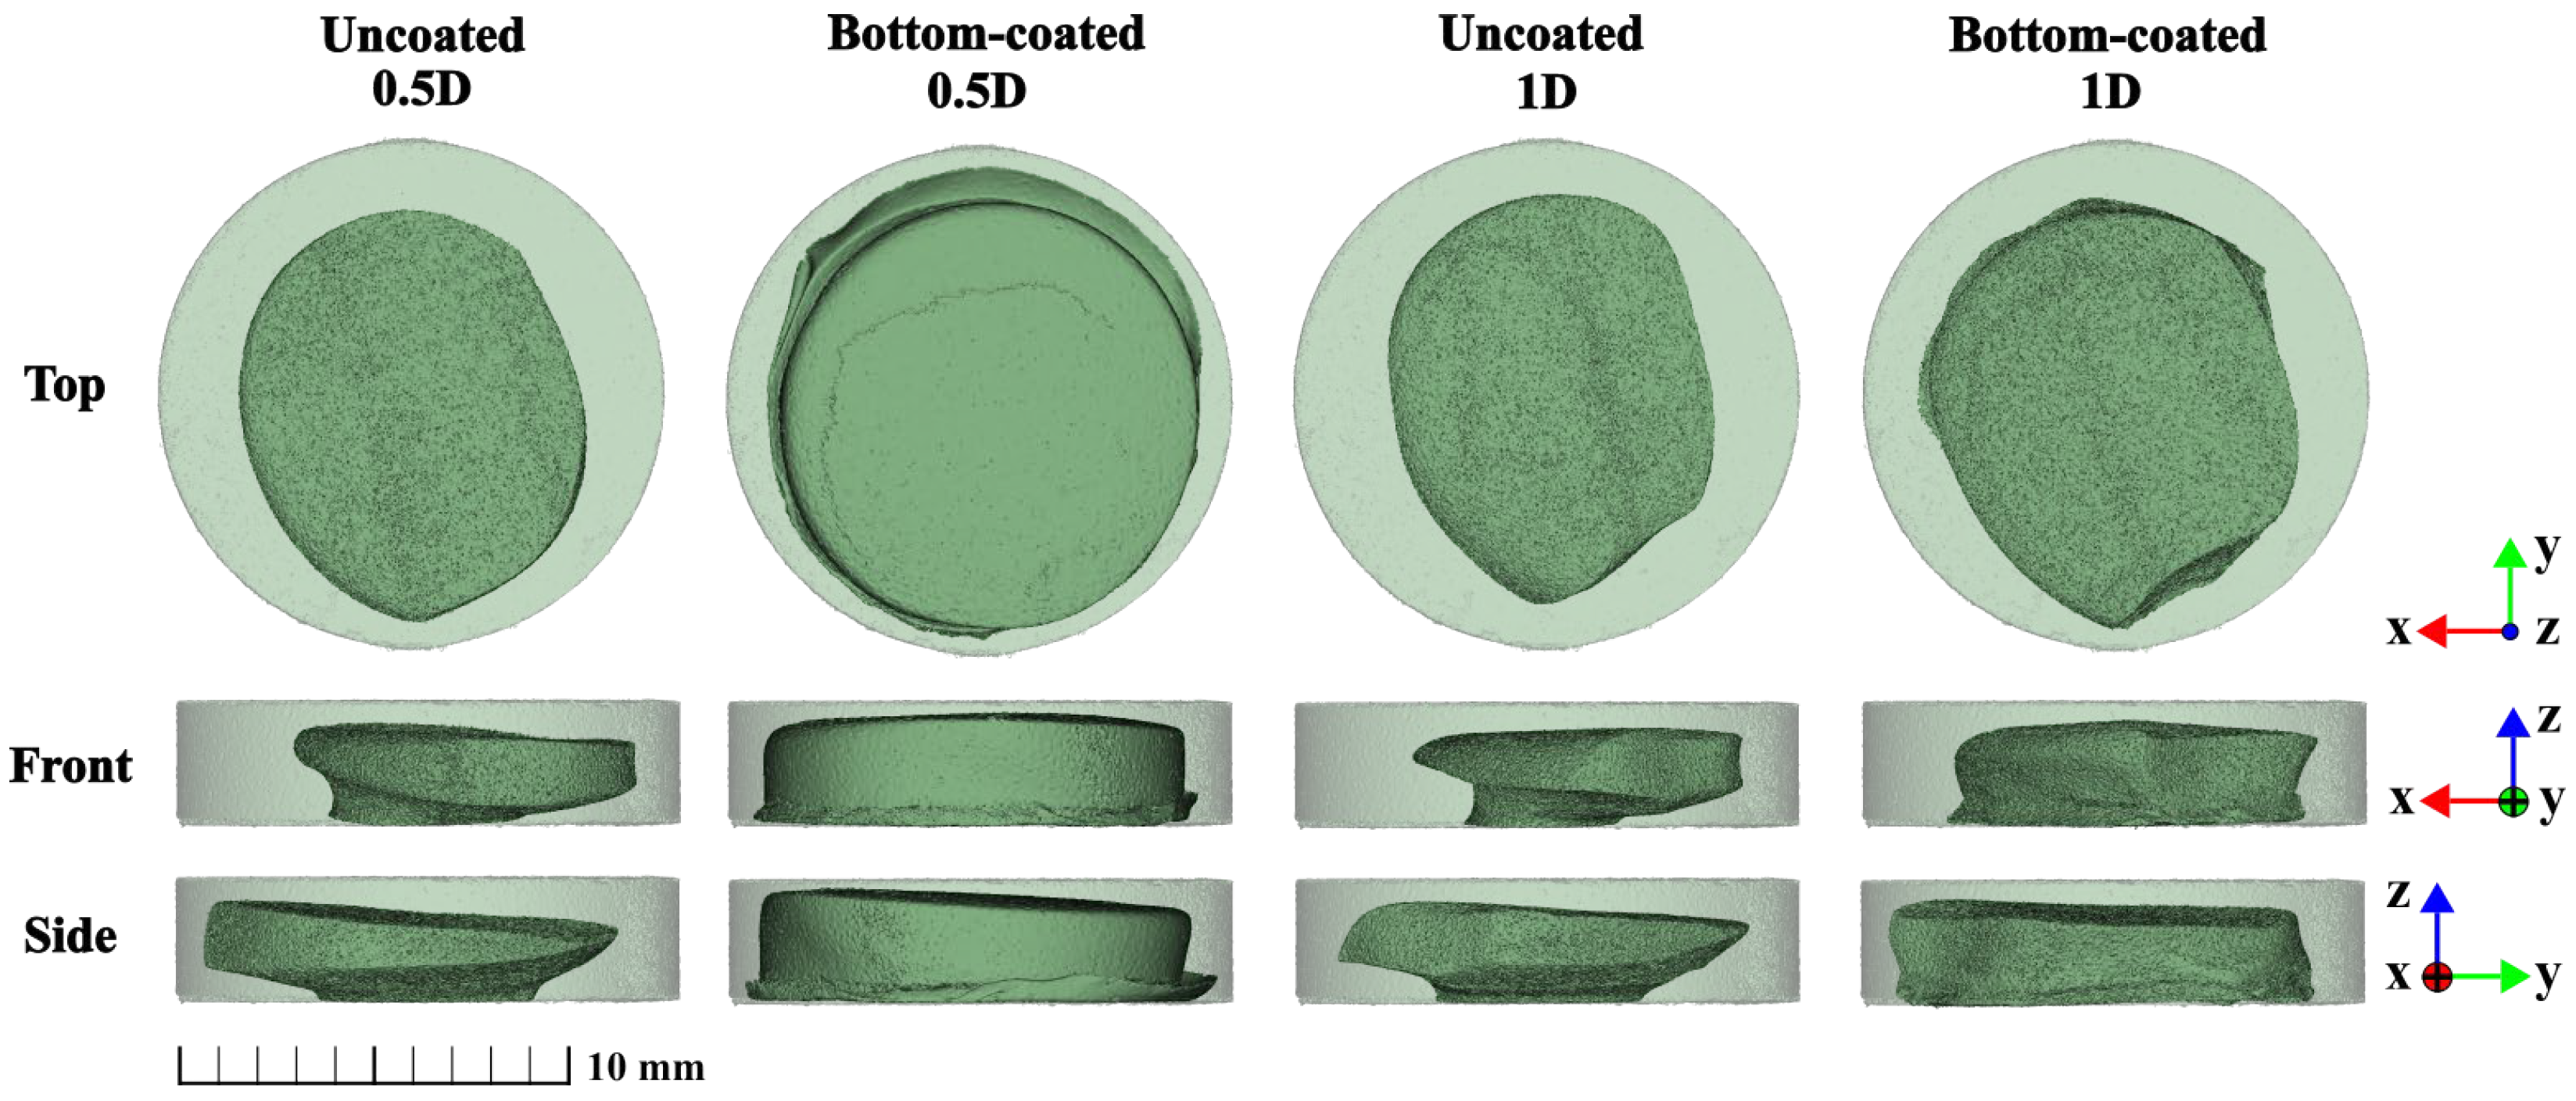
Radial displacement produced a qualitatively different response. While increasing paddle rotation speed primarily increased the extent of erosion, displacement from the vessel center resulted in pronounced spatial asymmetry (Figure 5).
Figure 5.
Representative 3D micro-CT reconstructions of MT showing the effect of radial tablet position and bottom-surface coating on post-dissolution erosion patterns after 40 min at 75 rpm. Columns show uncoated and bottom-coated MT at 0.5D and 1D positions; rows show top, front, and side views. Tablets were displaced from the vessel center along the +Y axis; −Y indicates the direction toward the vessel center. The semi-transparent cylinder represents the initial tablet shape. Scale bar: 10 mm.
At 0.5D, differences were observed between uncoated and bottom-coated MT. From the top view, the uncoated MT exhibited an oval shape with a pointed end oriented toward the center. In contrast, the bottom-coated MT showed less overall erosion. Its top-view geometry was more rounded and lacked the noticeable pointed region observed for the uncoated MT. In the side view, the uncoated MT showed a sloped profile, with the highest point toward the vessel center and the lowest point away from it. The slope was less apparent in the bottom-coated MT.
At 1D, the asymmetry was more pronounced, and the residual shape differed from that observed at 0.5D. The most distinctive erosion pattern was observed in MT positioned at 1D. In the top view, the MT had an oval outline with a distinct pointed region extending toward the vessel center. This region also corresponded to the highest part of the residual tablet. The tablet outline was straighter on one side and more rounded on the opposite side. Thus, radial displacement affected not only the extent of erosion but also the spatial pattern of material loss.
Previous work has shown that tablet position in USP Apparatus II vessel can influence tablet deformation even when the corresponding dissolution profiles remain comparatively similar [13]. This suggests that post-dissolution tablet erosion patterns may provide complementary information on spatially non-uniform erosion that is not fully apparent from the dissolution profile alone.
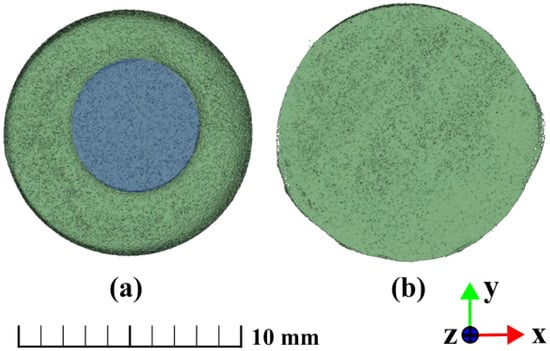
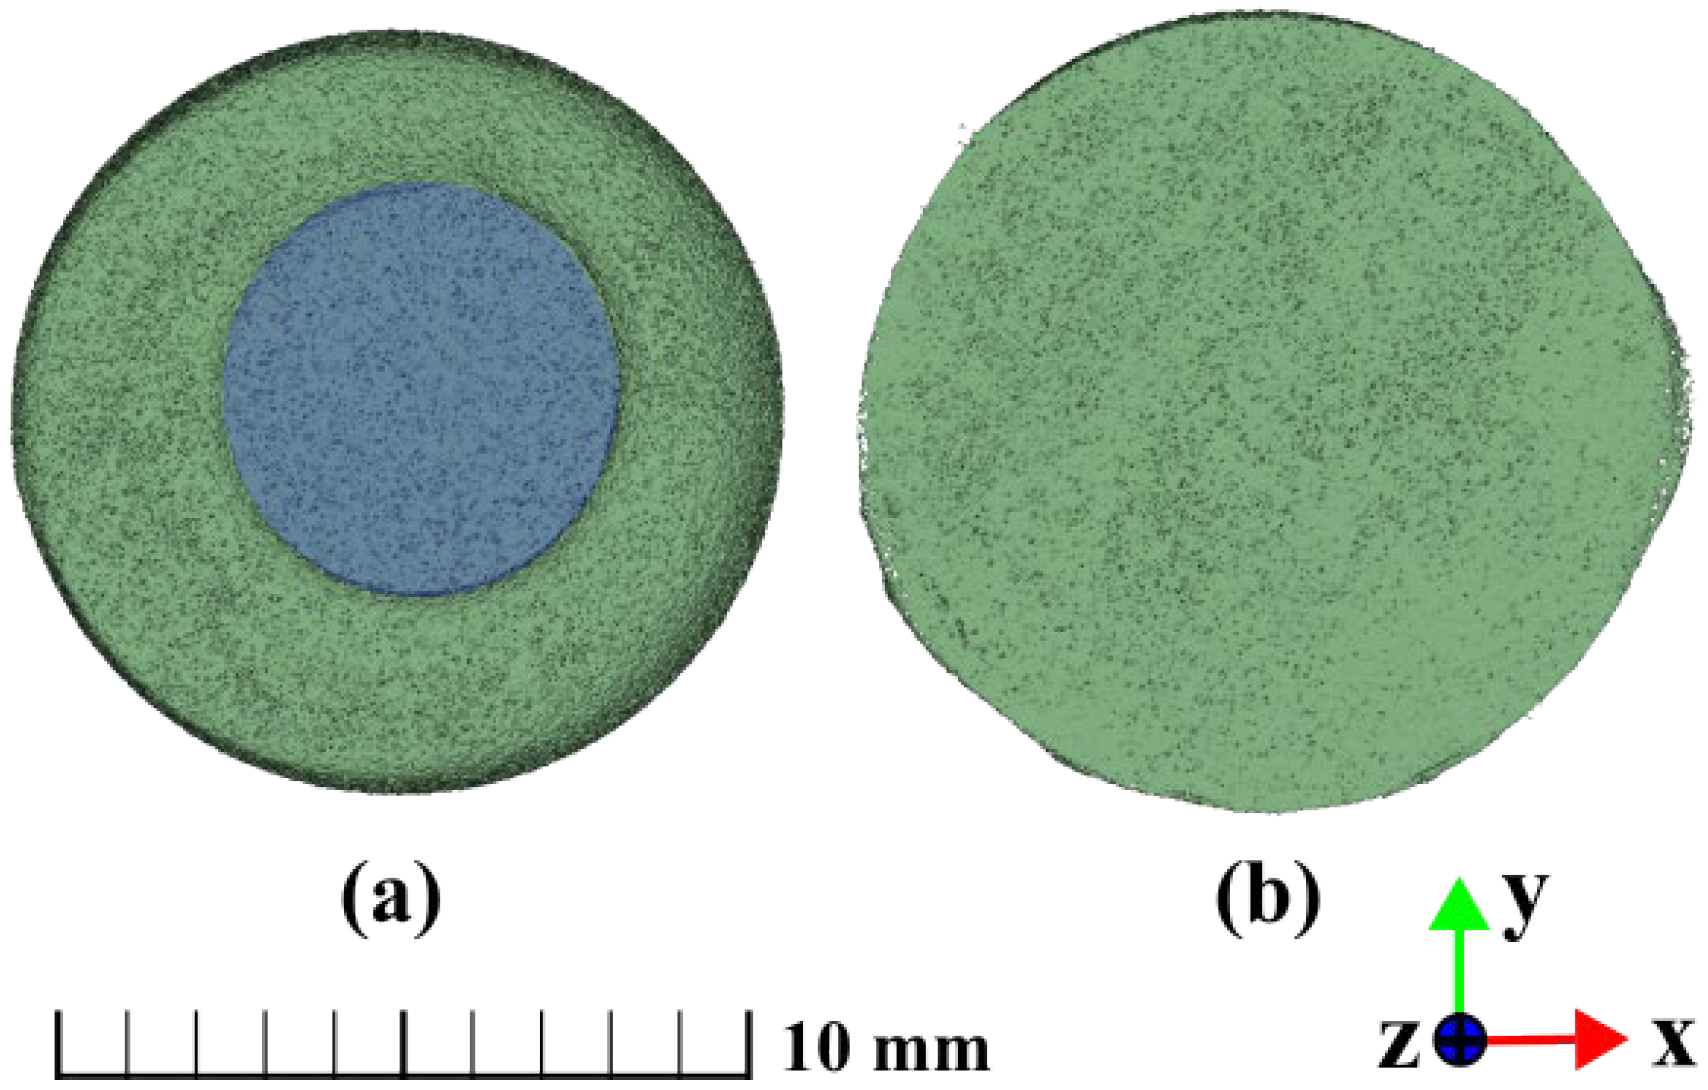
Bottom-surface exposure produced an additional and clearly distinguishable erosion pattern. Erosion of the lower tablet surface was observed in uncoated MT but was absent in bottom-coated MT (Figure 6). In the uncoated MT, the small circular region protected by the fixation remained uneroded, whereas the surrounding exposed surface underwent dissolution. Additional front, bottom, and side views of uncoated MT at the investigated radial positions and paddle rotation speeds are provided in the Supplementary Materials (Figures S3–S5), illustrating the spatial development of bottom-surface erosion from multiple viewing directions.
Figure 6.
Bottom-surface erosion of MT positioned at 0D after 40 min at 50 rpm: (a) uncoated and (b) bottom-coated. The blue region in (a) indicates the area protected by fixation. Scale bar: 10 mm.
Overall, the micro-CT reconstructions indicate that paddle rotation speed, radial position, and bottom-surface exposure affected different aspects of the residual shape. Increasing paddle rotation speed primarily increased the extent of erosion, whereas radial displacement strongly influenced its spatial distribution and directionality. These qualitative MT observations were completed by height-based measurements of SW-MT, presented in Section 3.3.
3.3. Quantitative Assessment of Post-Dissolution Height Loss and Asymmetry
To complement the qualitative micro-CT observations of MT, erosion height loss (EH) and height asymmetry (AH) were evaluated for fixed-position SW-MT. EH describes the reduction in mean tablet height, whereas AH describes the difference between the maximum and minimum post-dissolution heights; both are expressed relative to the initial tablet height (H0). Figure 7 shows a representative side-view photograph of a SW-MT after dissolution, illustrating the locations of the maximum (Hmax) and minimum (Hmin) post-dissolution heights.
Figure 7.
Representative side-view photograph of fixed SW-MT after 40 min of dissolution, illustrating post-dissolution height asymmetry and the locations of Hmin and Hmax.
It should be noted that the micro-CT observations were obtained from MT, whereas the quantitative erosion parameters (EH and AH) were determined using SW-MT. Although these tablet systems differed in their fixation methods and the presence of a steel washer, the results provide complementary information on post-dissolution erosion patterns.
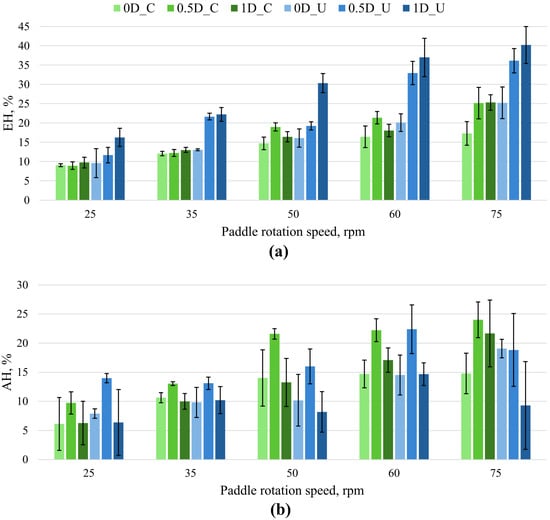
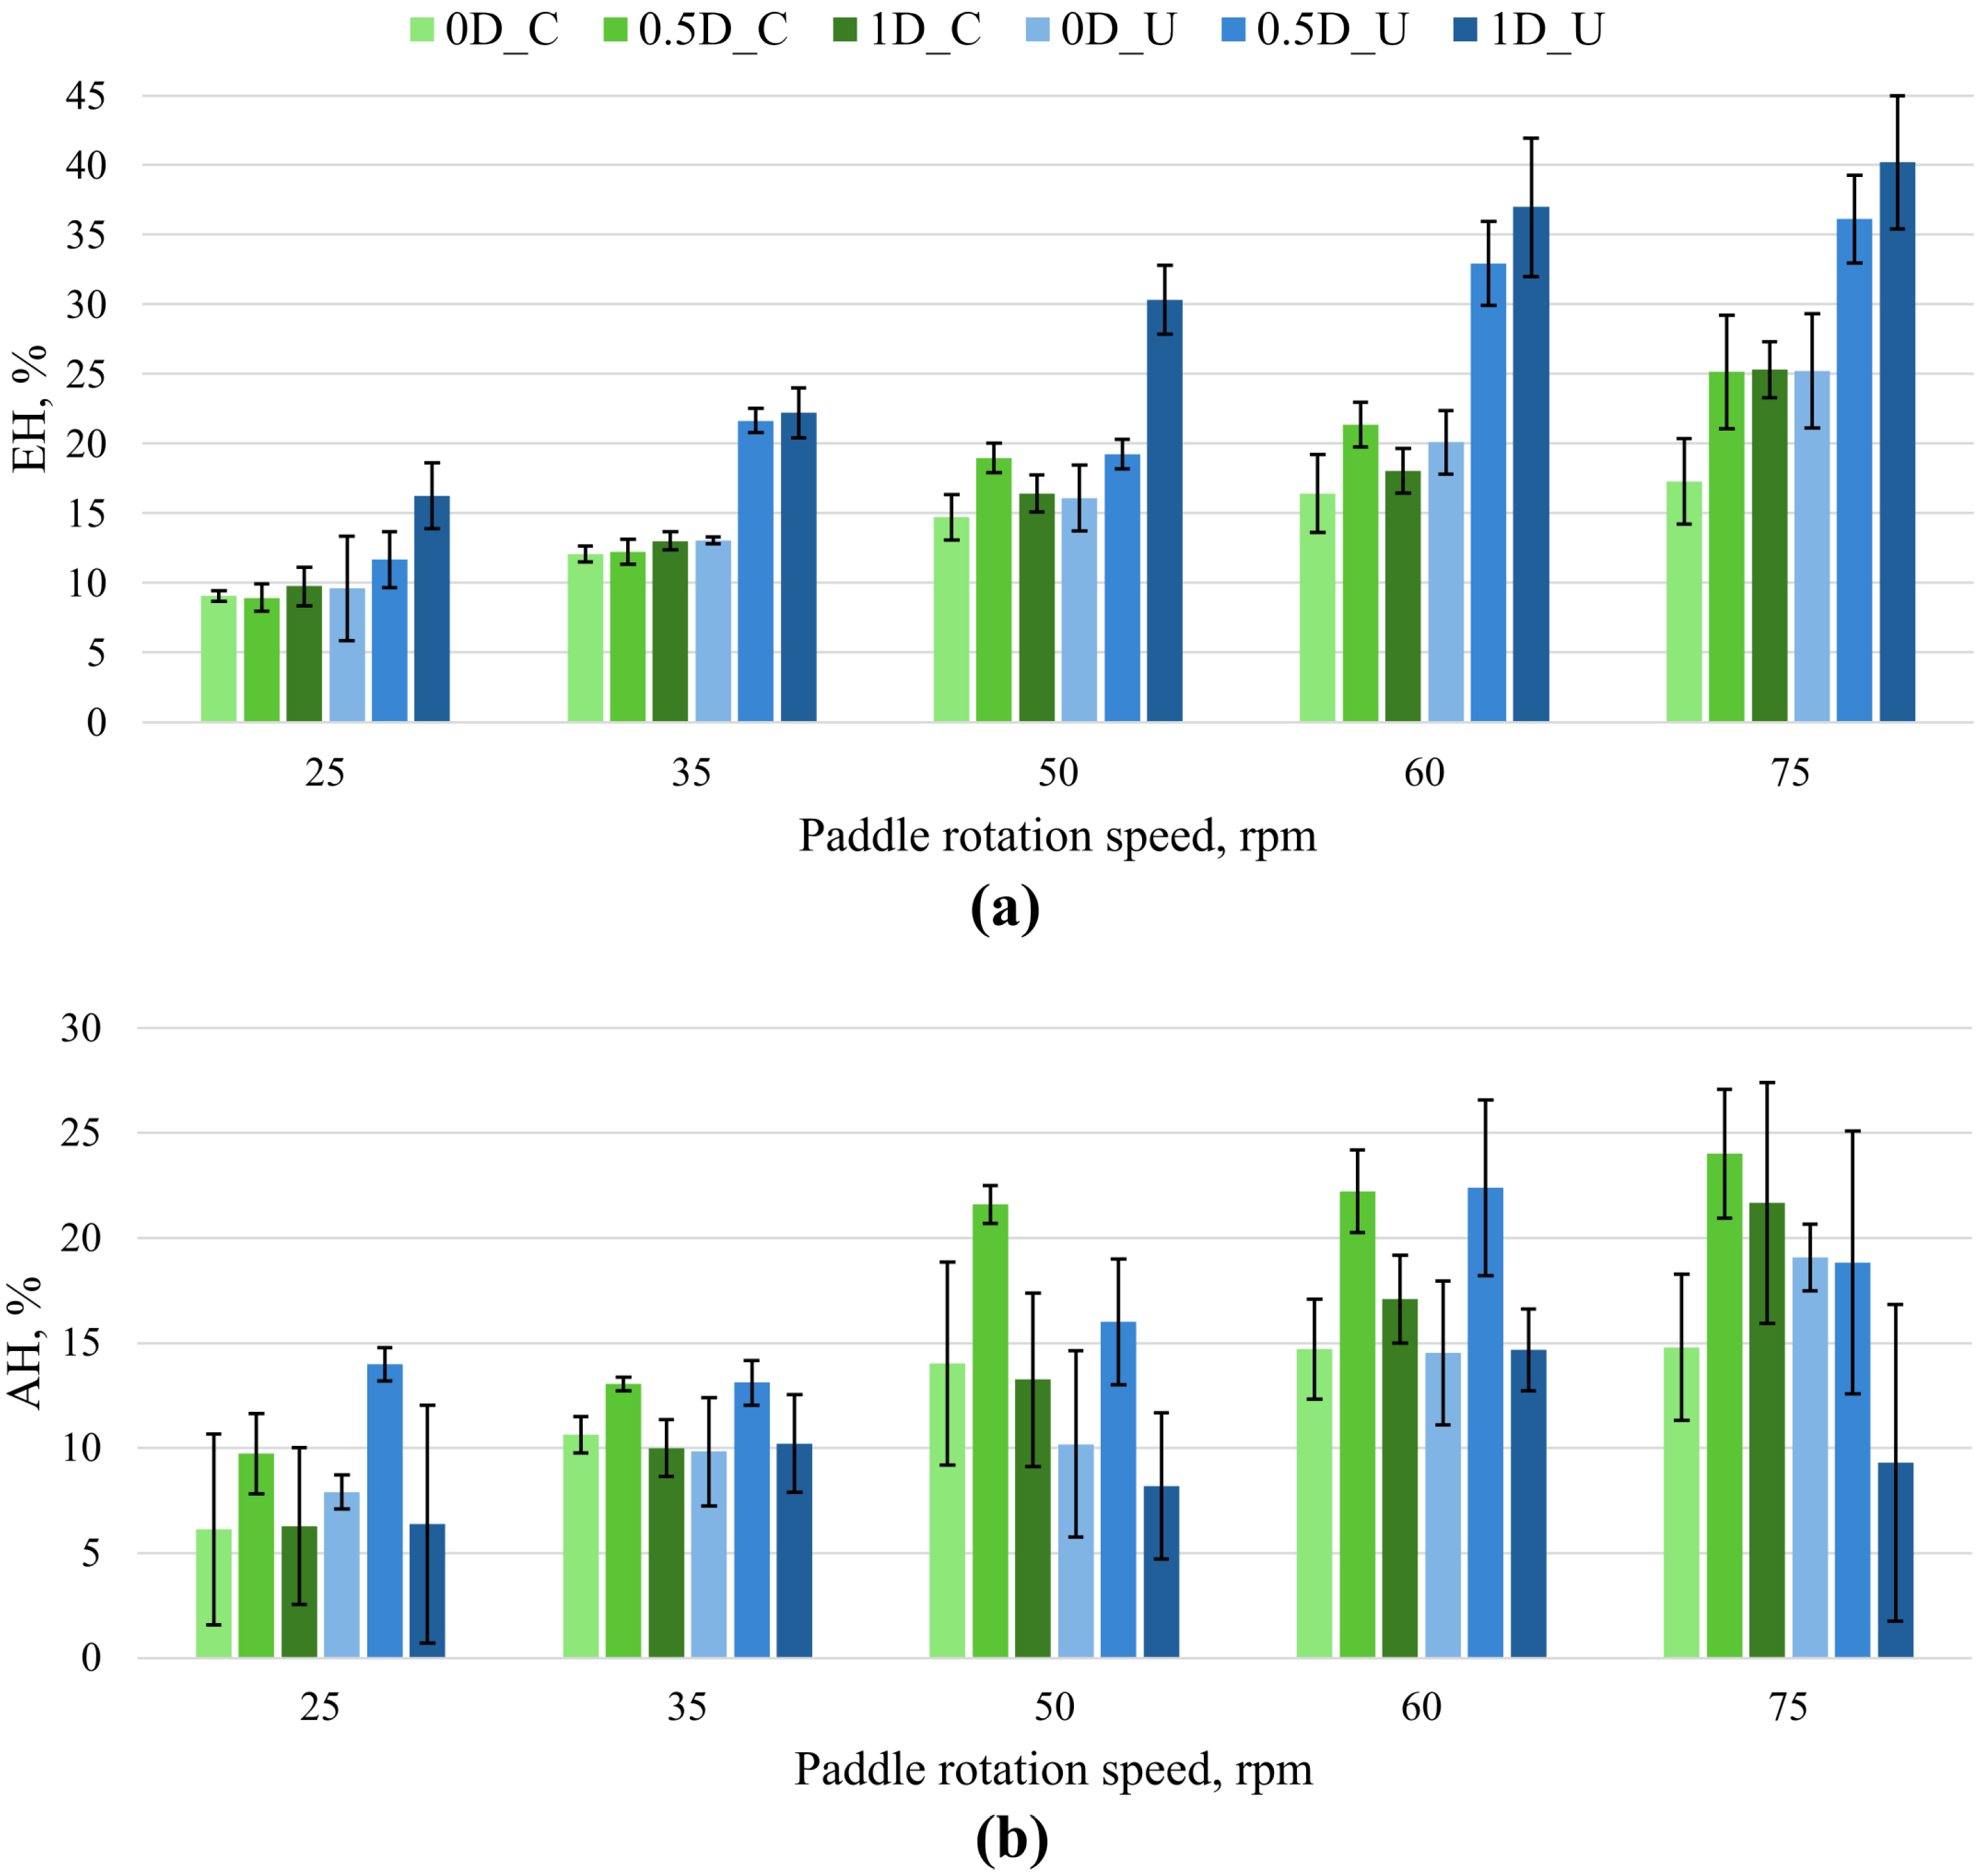
EH increased overall with paddle rotation speed for both bottom-coated and uncoated SW-MT (Figure 8a). For bottom-coated SW-MT, radial displacement did not produce a monotonic increase in EH: at 60 rpm EH was approximately 21% at 0.5D and 18% at 1D, while at 75 rpm both off-center positions gave approximately 25%. In contrast, for uncoated SW-MT EH increased consistently toward 1D, reaching approximately 25%, 36%, and 40% at 0D, 0.5D, and 1D, respectively, at 75 rpm.
Figure 8.
Post-dissolution height descriptors as a function of paddle rotation speed and radial tablet position for SW-MT. (a) EH for bottom-coated and uncoated SW-MT; (b) AH for bottom-coated and uncoated SW-MT. EH and AH are expressed relative to the initial tablet height (H0). Bars show mean ± SD (n ≥ 3). In the legend, C denotes bottom-coated, and U denotes uncoated SW-MT.
AH showed a different positional response (Figure 8b). For bottom-coated SW-MT, the highest AH was consistently observed at 0.5D across the paddle speeds investigated. For uncoated SW-MT, the difference between EH and AH was particularly clear at 75 rpm; EH increased from approximately 36% at 0.5D to 40% at 1D, whereas AH decreased from approximately 19% to 9%. Overall, EH and AH described different aspects of post-dissolution tablet erosion patterns. EH generally increased with paddle rotation speed and quantified mean height reduction, whereas AH showed a different positional dependence and did not increase in parallel with EH. Thus, the SW-MT exhibiting the greatest height loss was not necessarily the SW-MT exhibiting the greatest height asymmetry.
These differences between EH and AH therefore suggest that the amount and spatial distribution of erosion are governed by different aspects of the local hydrodynamic environment. These experimental patterns are considered alongside selected CFD results in Section 3.4.
3.4. CFD-Guided Interpretation of Experimentally Observed Erosion Patterns
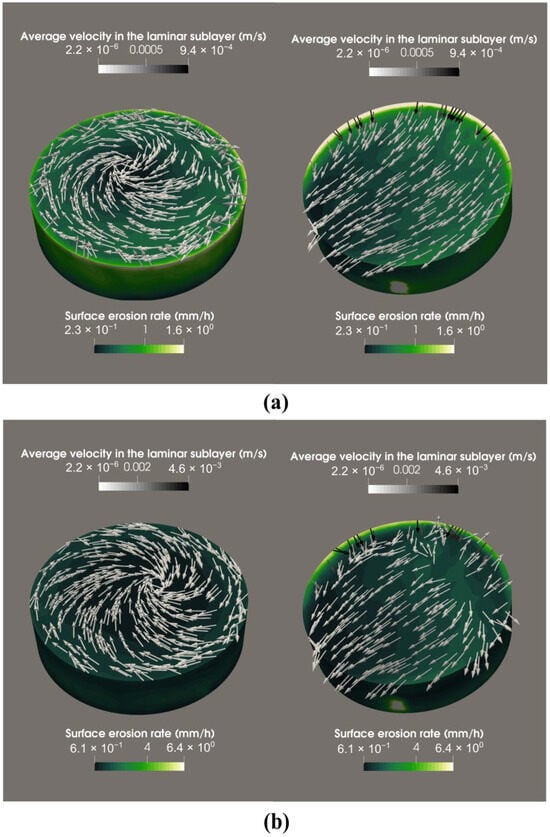
To support the interpretation of the experimentally observed erosion patterns, CFD results regarding tablet erosion are presented for 0D and 1D tablets at 25 and 75 rpm, representing the lowest and highest investigated paddle rotation speeds and the two radial positions used to compare contrasting experimental responses, focusing on time-averaged velocity in the laminar sublayer and the predicted surface erosion rate.
At 25 rpm, the 0D tablet exhibited a predominantly rotational flow pattern, with higher predicted erosion rates near the tablet edges than in the central region (Figure 9a). In contrast, the 1D off-center tablet experienced a strongly non-uniform velocity field and asymmetric surface erosion (Figure 9a).
Figure 9.
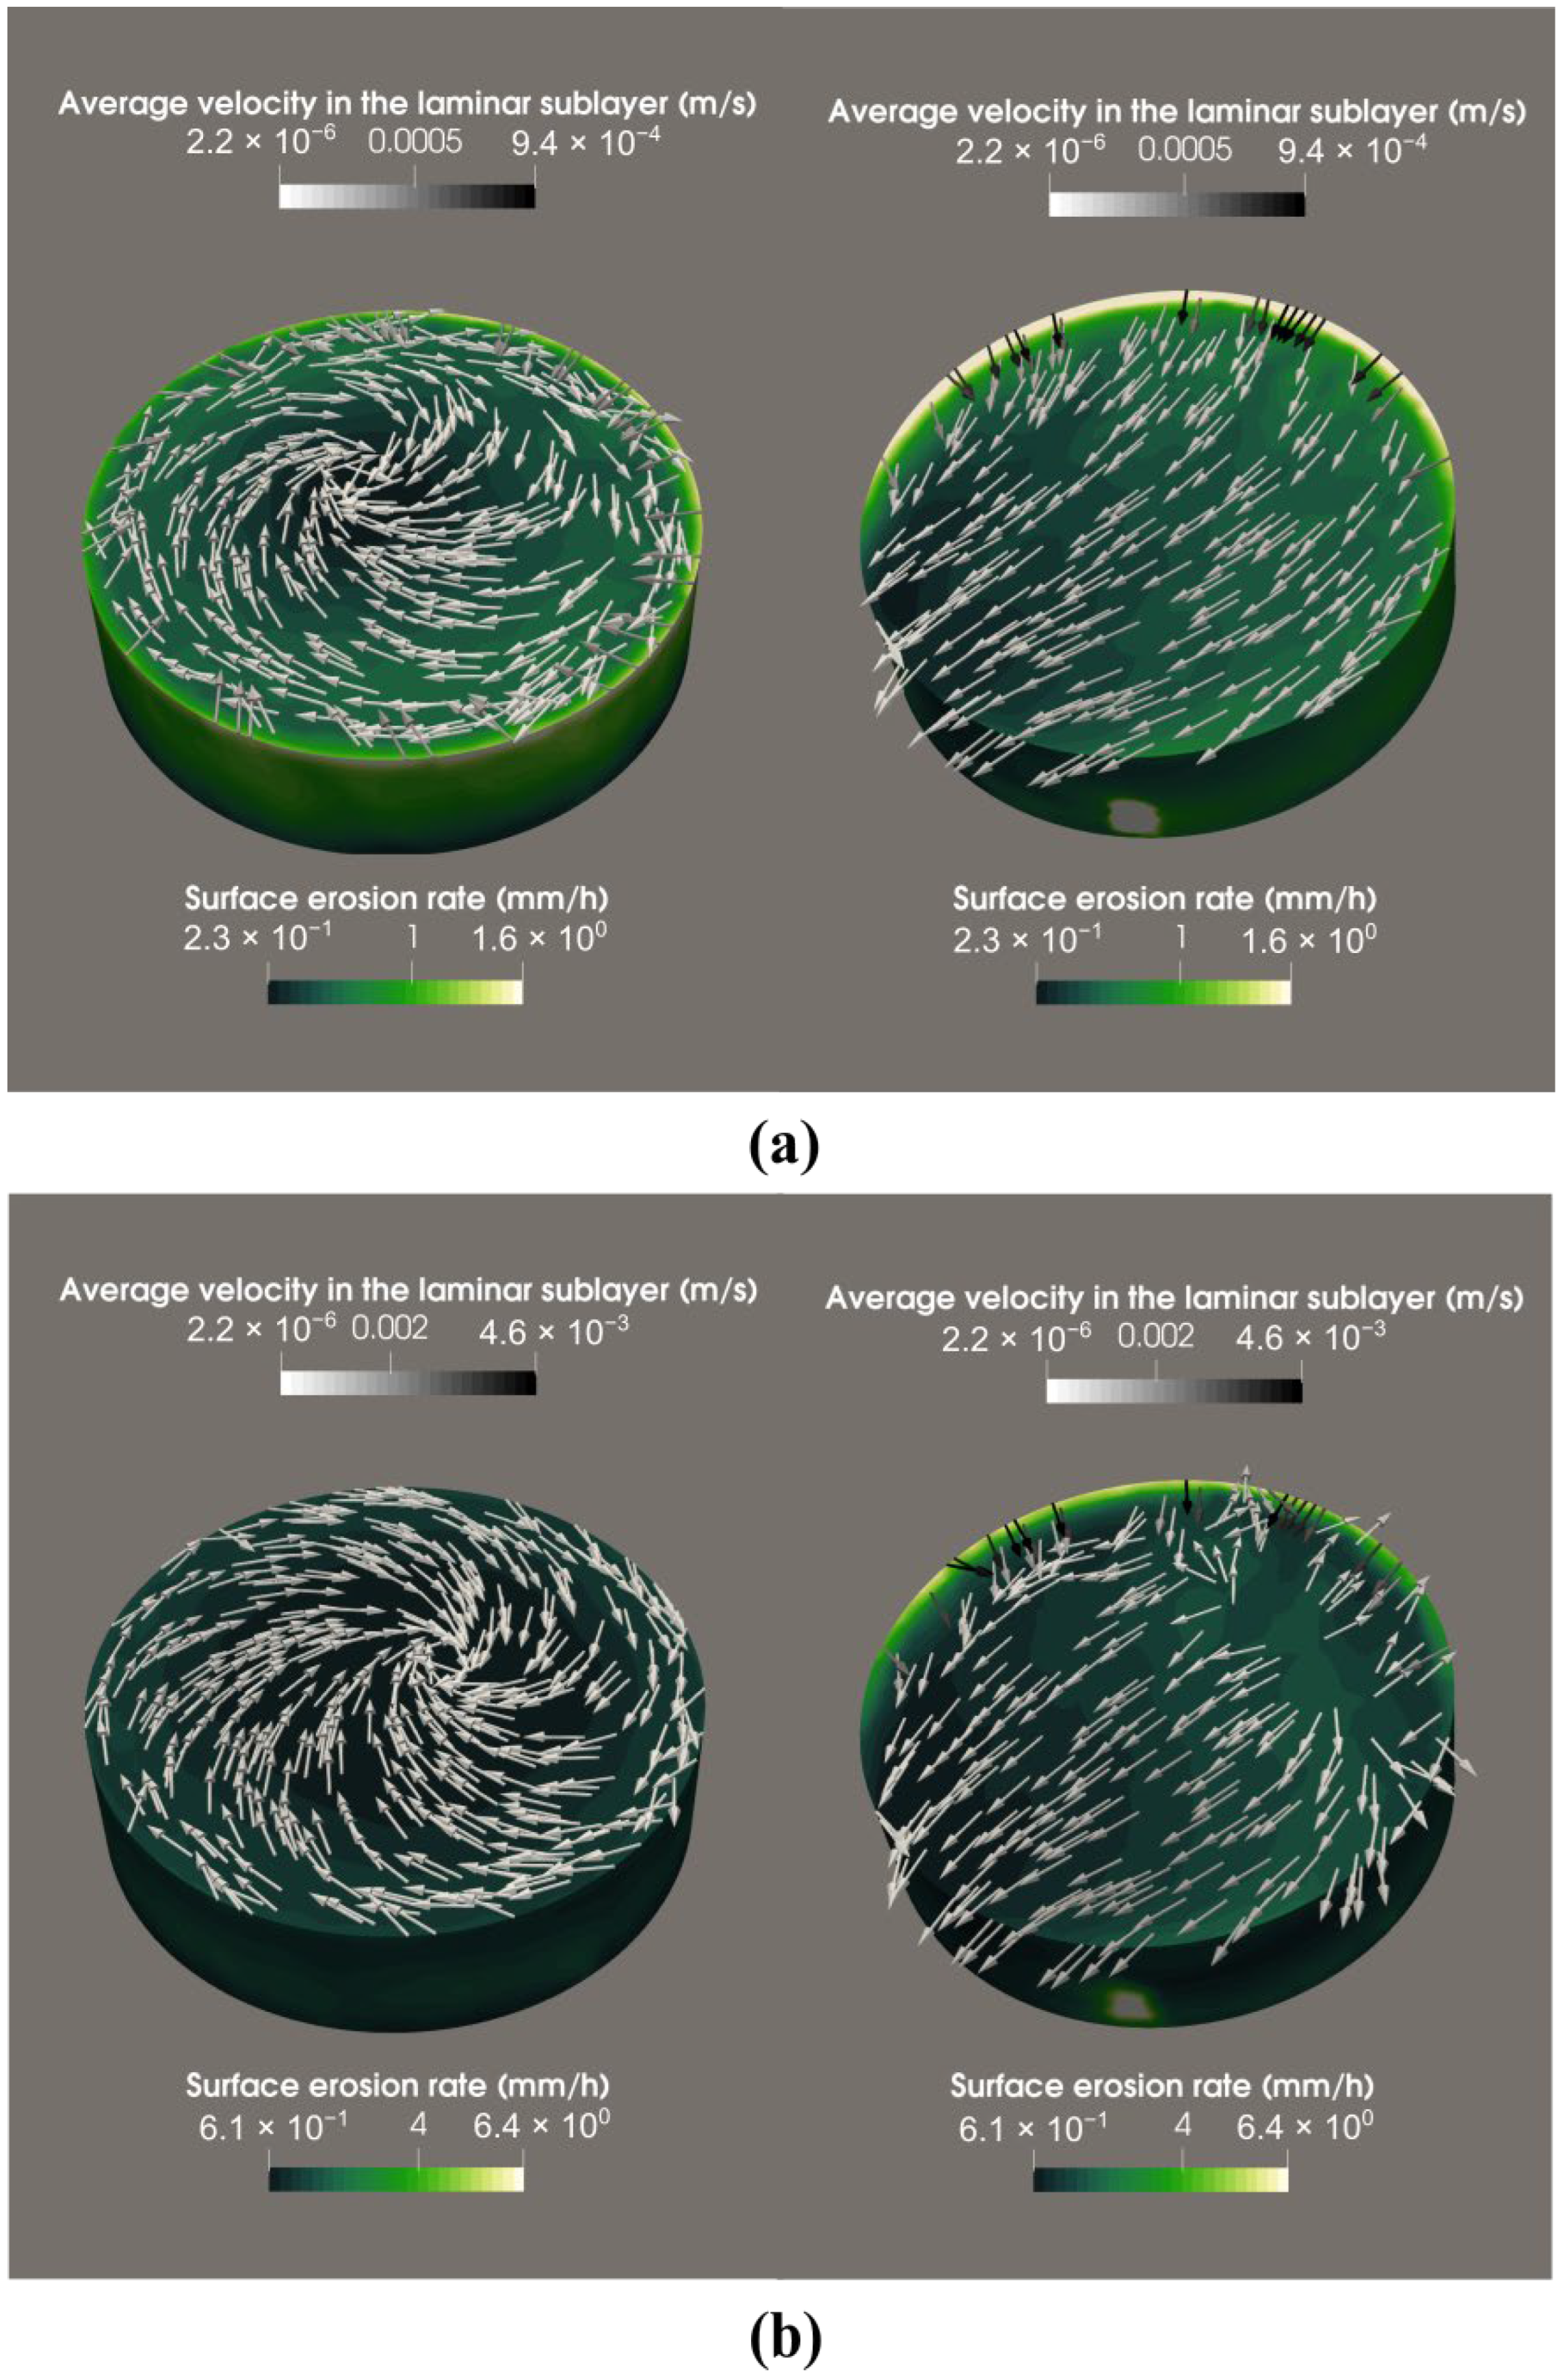
CFD simulation results for a tablet in USP II dissolution apparatus at (a) 0D and 1D at 25 rpm and (b) 0D and 1D at 75 rpm: surface erosion rate (mm/h) and time-averaged velocity in the laminar sublayer (m/s). The green color scale indicates the surface erosion rate, while the grayscale arrows represent the time-averaged flow velocity, calculated from 4 complete paddle revolutions. The CFD visualization for the 1D off-center position was rotated by 90° to clearly display the region of higher surface erosion rate (white area).
At 75 rpm, the same general spatial patterns were retained, but both local velocities and predicted erosion rates increased substantially (Figure 9b). For the 0D tablet, erosion remained greater near the tablet edges than in the central region. For the 1D off-center tablet, the velocity and erosion-rate distributions remained strongly asymmetric, with the highest values concentrated toward one side of the tablet. The higher predicted erosion rates at 75 rpm were consistent with the experimentally observed increase in Q40 and the overall increase in EH with paddle rotation speed.
The experimentally observed erosion pattern at the 1D position was qualitatively consistent with the asymmetric flow conditions predicted by CFD. Greater rounding was observed on the side of the tablet encountering the paddle-induced flow first, where the simulations indicated higher local flow velocities and surface erosion rates. Although these observations suggest a possible relationship between local hydrodynamic conditions and directional erosion, no quantitative correlation between the CFD results and experimentally measured erosion was established. Overall, the CFD results are qualitatively consistent with the combined experimental observations: increasing paddle rotation speed was associated with higher dissolution and greater erosion extent, whereas radial displacement affected both dissolution and the spatial distribution of material loss [20]. The residual tablet shape may therefore provide complementary qualitative indications of the heterogeneous hydrodynamic conditions experienced during dissolution.
Nevertheless, the CFD results should be interpreted as a mechanistic explanation of the observed trends rather than as a direct prediction of the final 40 min tablet shape. The tablet geometry was kept unchanged throughout the simulations and therefore represents the initial dissolution conditions rather than the continuously evolving geometry of an eroding tablet.
3.5. Limitations
The present study has several limitations. Although the cumulative amount of paracetamol removed during sampling was accounted for, the progressive reduction in dissolution medium volume (up to 3.6%) was not considered. This may have led to a slight overestimation of the calculated dissolution values. However, its influence on the comparative trends is expected to be limited, as the same sampling procedure was applied across all experimental conditions.
MT prepared for micro-CT analysis required alternative fixation methods to avoid imaging artefacts associated with the embedded steel washer. Consequently, adhesive fixation altered the degree of bottom-surface exposure and slightly elevated the tablets relative to magnetically fixed samples. These differences should be considered when interpreting bottom-surface erosion patterns. And because the micro-CT and quantitative height measurements were obtained using different fixation configurations, their agreement was interpreted qualitatively rather than as a direct sample-level correlation.
The thickness, adhesion, and impermeability of the manually applied bottom coating were not independently verified, which may have introduced additional uncertainty into the assessment of tablet erosion. The presence of the embedded steel washer may have influenced the local tablet structure and erosion behavior. This potential effect should be considered when interpreting the quantitative results obtained from SW-MT.
Furthermore, the CFD interpretation relied on simulations employing non-eroding tablet geometries and therefore could not account for dynamic changes in tablet shape during dissolution. The behavior of both paracetamol model tablet types in the dissolution medium differs from that of conventional pharmaceutical tablets because they contain no excipients and therefore do not undergo swelling or disintegration.
4. Conclusions
This study indicates that post-dissolution tablet shape can provide complementary experimental information on spatial erosion patterns in a USP Apparatus II vessel that is not captured by dissolution profiles alone. Increasing paddle rotation speed generally increased the overall extent of dissolution and erosion, whereas radial tablet position had a pronounced effect on the spatial distribution and directionality of erosion. MT positioned at 0D retained comparatively symmetrical residual shapes, while off-center MT developed distinct asymmetric erosion patterns. Bottom-surface exposure further modified both dissolution and residual tablet shape, with uncoated tablets generally exhibiting greater dissolution and more extensive erosion than bottom-coated ones.
SW-MT quantitative analysis further showed that erosion extent and erosion asymmetry represent distinct responses to the local hydrodynamic environment. In particular, the condition producing the greatest height loss did not necessarily produce the greatest height asymmetry, demonstrating that dissolution or erosion measurements alone cannot fully characterize spatially heterogeneous material loss.
The experimentally observed directional erosion patterns were qualitatively consistent with the spatial asymmetry of the CFD-simulated flow field, suggesting that post-dissolution tablet shape may provide complementary information on local hydrodynamic conditions. However, as residual tablet shape can also be influenced by tablet composition and structure, fixation methods, and other experimental factors, further studies using conventional pharmaceutical formulations are needed to evaluate its potential application as a diagnostic tool during dissolution-method development and robustness assessment. Future work incorporating experimentally observed changes in tablet shape into dynamic CFD models may further improve mechanistic interpretation and prediction of dissolution behavior.
Supplementary Materials
The following supporting information can be downloaded at: https://www.mdpi.com/article/10.3390/pharmaceutics18111356/s1, Figure S1. Effect of tablet position on dissolution profile of bottom-coated SW-MT at 75 rpm. Figure S2. Comparison of dissolution profiles of uncoated and bottom-coated SW-MT at different tablet positions: (a) 0D, (b) 0.5D, and (c) 1D evaluated at 25, 50, and 75 rpm. Figure S3. Erosion from the bottom of the uncoated MT, front view after 40 min. Images are shown for 0D, 0.5D, and 1D positions at paddle rotation speeds of 25, 50, and 75 rpm. The figure illustrates the influence of tablet position and stirring speed on the extent and symmetry of bottom-surface erosion. The semi-transparent cylinder represents the initial tablet geometry. Scale bar: 10 mm. Figure S4. Erosion from the bottom of the uncoated MT, bottom view after 40 min. Images are shown for 0D, 0.5D, and 1D positions at paddle rotation speeds of 25, 50, and 75 rpm. The semi-transparent cylinder represents the initial tablet geometry. Scale bar: 10 mm. Figure S5. Erosion from the bottom of the uncoated MT, side view after 40 min. Images are shown for 0D, 0.5D, and 1D positions at paddle rotation speeds of 25, 50, and 75 rpm. The semi-transparent cylinder represents the initial tablet geometry. Scale bar: 10 mm.
Author Contributions
Conceptualization, A.B. (Agnese Brangule); methodology, A.B. (Agnese Brangule); formal analysis, S.U., N.J.; investigation, U.L.V., D.B., O.R. and A.L.; resources, B.M.; writing—original draft preparation, U.L.V.; writing—review and editing, A.B. (Ance Bārzdiņa), A.B. (Agnese Brangule), S.U., N.J.; visualization, U.L.V. and A.B. (Ance Bārzdiņa); supervision, B.M., A.B. (Agnese Brangule); project administration, A.B. (Agnese Brangule); funding acquisition, A.B. (Agnese Brangule). All authors have read and agreed to the published version of the manuscript.
Funding
This research is funded by the Latvian Council of Science, project “Hierarchial model approach and experimental validation for typical drug discovery system dissolution profile predictions (ModelDrug)”, project No lzp-2023/1–0078.
Data Availability Statement
The complete dissolution profile data and post-dissolution tablet images generated during this study are publicly available in the Rīga Stradiņš University Institutional Repository Dataverse at https://doi.org/10.48510/FK2/GLSXM9.
Acknowledgments
The authors acknowledge the access to the infrastructure and expertise of the BBCE–Baltic Biomaterials Centre of Excellence (European Union’s Horizon 2020 research and innovation programme under the grant agreement No 857287). During the preparation of this manuscript, the authors used ChatGPT (OpenAI, GPT-5.5) to improve language quality, including grammar, readability, and overall fluency of the text. The authors have reviewed and edited the output and take full responsibility for the content of this publication.
Conflicts of Interest
The authors declare no conflicts of interest.
Abbreviations
The following abbreviations are used in this manuscript:
| AH | Height asymmetry |
| D | Diameter |
| EH | Erosion height loss |
| CFD | Computational fluid dynamics |
| Micro-CT | Micro-computed tomography |
| MT | Model tablets |
| pp | Percentage points |
| Q40 | Fraction of paracetamol dissolved after 40 min of dissolution test |
| SW-MT | Model tablets with an embedded steel washer |
| USP | United States Pharmacopeia |
References
- Wang, W.; Ye, Z.; Gao, H.; Ouyang, D. Computational Pharmaceutics—A New Paradigm of Drug Delivery. J. Control. Release 2021, 338, 119–136. [Google Scholar] [CrossRef] [Scilit] [PubMed]
- Baxter, J.L.; Kukura, J.; Muzzio, F.J. Hydrodynamics-Induced Variability in the USP Apparatus II Dissolution Test. Int. J. Pharm. 2005, 292, 17–28. [Google Scholar] [CrossRef] [Scilit] [PubMed]
- Bai, G.; Armenante, P.M. Velocity Distribution and Shear Rate Variability Resulting from Changes in the Impeller Location in the USP Dissolution Testing Apparatus II. Pharm. Res. 2008, 25, 320–336. [Google Scholar] [CrossRef] [Scilit] [PubMed]
- Bai, G.; Armenante, P.M.; Plank, R.V.; Gentzler, M.; Ford, K.; Harmon, P. Hydrodynamic Investigation of USP Dissolution Test Apparatus II. J. Pharm. Sci. 2007, 96, 2327–2349. [Google Scholar] [CrossRef] [Scilit] [PubMed]
- McCarthy, L.G.; Kosiol, C.; Healy, A.M.; Bradley, G.; Sexton, J.C.; Corrigan, O.I. Simulating the Hydrodynamic Conditions in the United States Pharmacopeia Paddle Dissolution Apparatus. AAPS PharmSciTech 2003, 4, 22. [Google Scholar] [CrossRef] [Scilit] [PubMed]
- McCarthy, L.G.; Bradley, G.; Sexton, J.C.; Corrigan, O.I.; Healy, A.M. Computational Fluid Dynamics Modeling of the Paddle Dissolution Apparatus: Agitation Rate, Mixing Patterns, and Fluid Velocities. AAPS PharmSciTech 2004, 5, 31. [Google Scholar] [CrossRef] [Scilit] [PubMed]
- D’Arcy, D.M.; Corrigan, O.I.; Healy, A.M. Hydrodynamic Simulation (Computational Fluid Dynamics) of Asymmetrically Positioned Tablets in the Paddle Dissolution Apparatus: Impact on Dissolution Rate and Variability. J. Pharm. Pharmacol. 2005, 57, 1243–1250. [Google Scholar] [CrossRef] [Scilit] [PubMed]
- Kukura, J.; Baxter, J.L.; Muzzio, F.J. Shear Distribution and Variability in the USP Apparatus 2 under Turbulent Conditions. Int. J. Pharm. 2004, 279, 9–17. [Google Scholar] [CrossRef] [Scilit] [PubMed]
- Gao, Z.; Moore, T.W.; Smith, A.P.; Doub, W.H.; Westenberger, B.J. Studies of Variability in Dissolution Testing with USP Apparatus 2. J. Pharm. Sci. 2007, 96, 1794–1801. [Google Scholar] [CrossRef] [Scilit] [PubMed]
- Qureshi, S.A.; Shabnam, J. Cause of High Variability in Drug Dissolution Testing and Its Impact on Setting Tolerances. Eur. J. Pharm. Sci. 2001, 12, 271–276. [Google Scholar] [CrossRef] [Scilit] [PubMed]
- Ameur, H.; Bouzit, M. 3D Hydrodynamics and Shear Rates’ Variability in the United States Pharmacopeia Paddle Dissolution Apparatus. Int. J. Pharm. 2013, 452, 42–51. [Google Scholar] [CrossRef] [Scilit] [PubMed]
- Costa, P.; Lobo, J.M.S. Influence of Dissolution Medium Agitation on Release Profiles of Sustained-Release Tablets. Drug Dev. Ind. Pharm. 2001, 27, 811–817. [Google Scholar] [CrossRef] [Scilit] [PubMed]
- Lou, H.; Hageman, M.J. Investigating the Influence of Tablet Location Inside Dissolution Test Apparatus on Polymer Erosion and Drug Release of a Surface-Erodible Sustained-Release Tablet Using Computational Simulation Methods. AAPS PharmSciTech 2021, 22, 99. [Google Scholar] [CrossRef] [Scilit] [PubMed]
- Bai, G.; Armenante, P.M. Hydrodynamic, Mass Transfer, and Dissolution Effects Induced by Tablet Location during Dissolution Testing. J. Pharm. Sci. 2009, 98, 1511–1531. [Google Scholar] [CrossRef] [Scilit] [PubMed]
- Cox, D.C.; Furman, W.B. Collaborative Study of the USP Dissolution Test for Prednisone Tablets with Apparatus 2. J. Pharm. Sci. 1984, 73, 670–676. [Google Scholar] [CrossRef] [Scilit] [PubMed]
- Jekabsons, N.; Upnere, S.; Lācis, A.; Bārzdiņa, A.; Prudņikova, D.P.; Vītoliņa, U.L.; Mauriņa, B.; Brangule, A. Uncertainties in Drug Dissolution Tests—Identification and CFD Evaluation of Factors Limiting the Accuracy of the USP2 Test. Eur. J. Pharm. Sci. 2026, 217, 107387. [Google Scholar] [CrossRef] [Scilit] [PubMed]
- De Piano, R.; Caccavo, D.; Cascone, S.; Festa, C.; Lamberti, G.; Barba, A.A. Drug Release from Hydrogel-Based Matrix Systems Partially Coated: Experiments and Modeling. J. Drug Deliv. Sci. Technol. 2021, 61, 102146. [Google Scholar] [CrossRef] [Scilit]
- Brangule, A.; Vītoliņa, U.L.; Bārzdiņa, A.; Prudņikova, D.P.; Stankova, A.; Brūvere, D.; Jēkabsons, N.; Lācis, A.; Upnere, S.; Mauriņa, B. Dataset of Dissolution Profiles and Post-Dissolution Images of Paracetamol Model Tablets in USP Apparatus II; RSU Dataverse: Riga, Letland, 2026; V1. [Google Scholar] [CrossRef]
- Wang, Y.; Armenante, P.M. A Novel Off-Center Paddle Impeller (OPI) Dissolution Testing System for Reproducible Dissolution Testing of Solid Dosage Forms. J. Pharm. Sci. 2012, 101, 746–760. [Google Scholar] [CrossRef] [Scilit] [PubMed]
- Upnere, S.; Jēkabsons, N.; Bārzdiņa, A.; Vītoliņa, U.L.; Prudņikova, D.P.; Lācis, A.; Mauriņa, B.; Brangule, A. Low-Order Polynomial Models for Accurate Prediction of Paracetamol Release Kinetics. In Proceedings of the 5th International Conference and Summer School Numerical Computations: Theory and Algorithms, Curinga, Italy, 21–27 June 2026. [Google Scholar]

Disclaimer/Publisher’s Note: The statements, opinions and data contained in all publications are solely those of the individual author(s) and contributor(s) and not of MDPI and/or the editor(s). MDPI and/or the editor(s) disclaim responsibility for any injury to people or property resulting from any ideas, methods, instructions or products referred to in the content. |
© 2026 by the authors. Licensee MDPI, Basel, Switzerland. This article is an open access article distributed under the terms and conditions of the Creative Commons Attribution (CC BY) license.