


Abstract
Objectives: To develop a physiologically based pharmacokinetic (PBPK) model of voriconazole for pediatric patients with hepatic impairment, evaluate the effects of varying degrees of hepatic impairment on voriconazole pharmacokinetics, and provide a rational basis for dose optimization. Methods: PBPK models of voriconazole were developed using GastroPlus™ version 9.9. An adult model was first developed and extrapolated to children. Physiological parameters of different hepatic impairment (Child–Pugh class A, B, and C) were then integrated to develop models for both pediatric and adult patients with hepatic impairment. The models were further adjusted and verified using data from pediatric patients with or without hepatic impairment at our hospital, followed by population simulations and pharmacodynamic evaluation. Results: The models demonstrated satisfactory predictive performance. For the literature datasets, the fold error (FE) ranged from 0.6 to 2.0 and the geometric mean fold error (GMFE) < 2.0; for in-hospital datasets, the mean absolute prediction error (MAPE) was 15.13% (normal hepatic function) and 17.27% (hepatic impairment). Simulations showed that area under the concentration-time curve (AUC) increased progressively with worsening hepatic impairment, with increases of 49–83% in Child–Pugh class A and 74–86% in class B compared with normal hepatic function. Pharmacodynamic evaluation showed that at minimum inhibitory concentration (MIC) ≤ 2 mg/L, optimized regimens and the Child-Pugh class C regimen achieved target trough concentrations with probability of target attainment (PTA) ≥ 90% and ≥ 80%, respectively. Conclusions: A PBPK model of voriconazole was successfully developed for pediatric patients with hepatic impairment, which may be useful for providing guidance for individualized dosing.
1. Introduction
Voriconazole is a broad-spectrum triazole antifungal agent used clinically to treat or prevent invasive fungal infections, including those caused by Aspergillus and Candida species [1]. It has a narrow therapeutic window with a recommended target trough concentration of 0.5–5.5 mg/L, exhibits marked interindividual pharmacokinetic (PK) variability, and can be administered either orally or intravenously [2]. The complex pharmacokinetics of voriconazole are influenced by nonlinear saturable metabolism, cytochrome P450 2C19 (CYP2C19) genetic polymorphisms, and time-dependent inhibition (TDI) of CYP3A4, all of which contribute to significant interindividual variability in plasma concentrations [3].
Voriconazole is extensively metabolized in the liver by CYP2C19 (accounting for approximately 70–80% of its metabolism), with minor contributions from cytochrome P450 3A4 (CYP3A4) (10–20%) and cytochrome P450 2C9 (CYP2C9) (5–10%) [4]. CYP2C19 genetic polymorphisms are another important factor influencing voriconazole pharmacokinetics, and enzyme activity differs significantly among different metabolic phenotypes (ultra-rapid metabolizers (UM), rapid metabolizers (RM), normal metabolizers (NM), intermediate metabolizers (IM), and poor metabolizers (PM)) can lead to significant interindividual variations in voriconazole exposure [5]. Voriconazole exposure is highly dependent on hepatic function. Clinical studies have shown that its clearance of voriconazole decreases and half-life increases with worsening hepatic function, resulting in elevated drug exposure [6]. However, pharmacokinetic data in pediatric patients with hepatic impairment remain scarce, and current dosing recommendations rely largely on empirical extrapolation from adult data.
Relevant physiologically based pharmacokinetic (PBPK) models for voriconazole in adults have been developed. Saleh et al. constructed a parent–metabolite PBPK model incorporating autoinhibition, metabolite-mediated CYP inhibition, and CYP2C19 polymorphisms, which accurately described voriconazole pharmacokinetics in healthy adults [7]. For patients with hepatic impairment, Mu et al. applied a whole-body PBPK approach to predict the pharmacokinetics of CYP2C19 and CYP3A4 substrates in cirrhosis, and Yun et al. developed a population pharmacokinetic model for voriconazole in a cirrhosis cohort, identifying serum retinol-binding protein as a novel marker for clearance and dose optimization [8,9]. In children, Cleary et al. emphasized that ontogeny data are essential for reliable PBPK predictions, while Zhang et al. extrapolated an adult voriconazole PBPK model to children to support dose optimization [10,11]. However, no PBPK model has yet been established specifically for pediatric patients with hepatic impairment, in whom the overlapping effects of ontogeny and hepatic dysfunction are particularly important. This highlights the need for a dedicated PBPK model to guide individualized voriconazole dosing in this special population.
The total body clearance of voriconazole in children is approximately 2 to 3 times higher than that in adults. Oral bioavailability in children is also significantly lower (44–65%) than in adults (approximately 96%), suggesting stronger intestinal metabolic function in children [11]. In addition, metabolic enzyme activity in children shows significant age-related differences, particularly in those aged 2–6 years, and the pathophysiological mechanisms of different hepatic impairment in children may also lead to different drug disposition patterns in the body [12].
PBPK models integrate drug-specific properties, physiological parameters, and enzyme/transporter characteristics to quantitatively describe the absorption, distribution, metabolism, and excretion (ADME) of drugs in vivo. By modifying relevant physiological or pathological parameters, such as hepatic blood flow, metabolic enzyme abundance, and plasma protein levels, PBPK models can simulate pharmacokinetic changes in different disease states. They are particularly valuable for predicting pharmacokinetics in special populations, such as patients with hepatic impairment and pediatric patients, in whom large-scale clinical trials are often difficult to conduct [13,14]. Previous researchers have successfully constructed a systemic pharmacokinetic model by integrating time-dependent CYP3A4 inhibition and CYP2C19 genetic polymorphisms, which effectively predicted adult pharmacokinetic characteristics [15].
Therefore, the objectives of this study are: (1) to develop and validate a PBPK model for voriconazole in healthy adults and children with normal hepatic function; (2) to establish an adult PBPK model for varying degrees of hepatic impairment and extrapolate it to children using an age-related scaling method; and (3) to construct and validate a PBPK model for hospitalized pediatric patients with hepatic impairment based on the simulation results, thereby providing guidance for clinical dosing in this specific population.
2. Methods
2.1. Modeling Workflow and Software
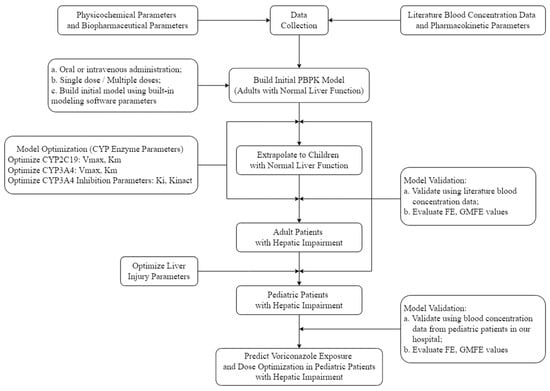
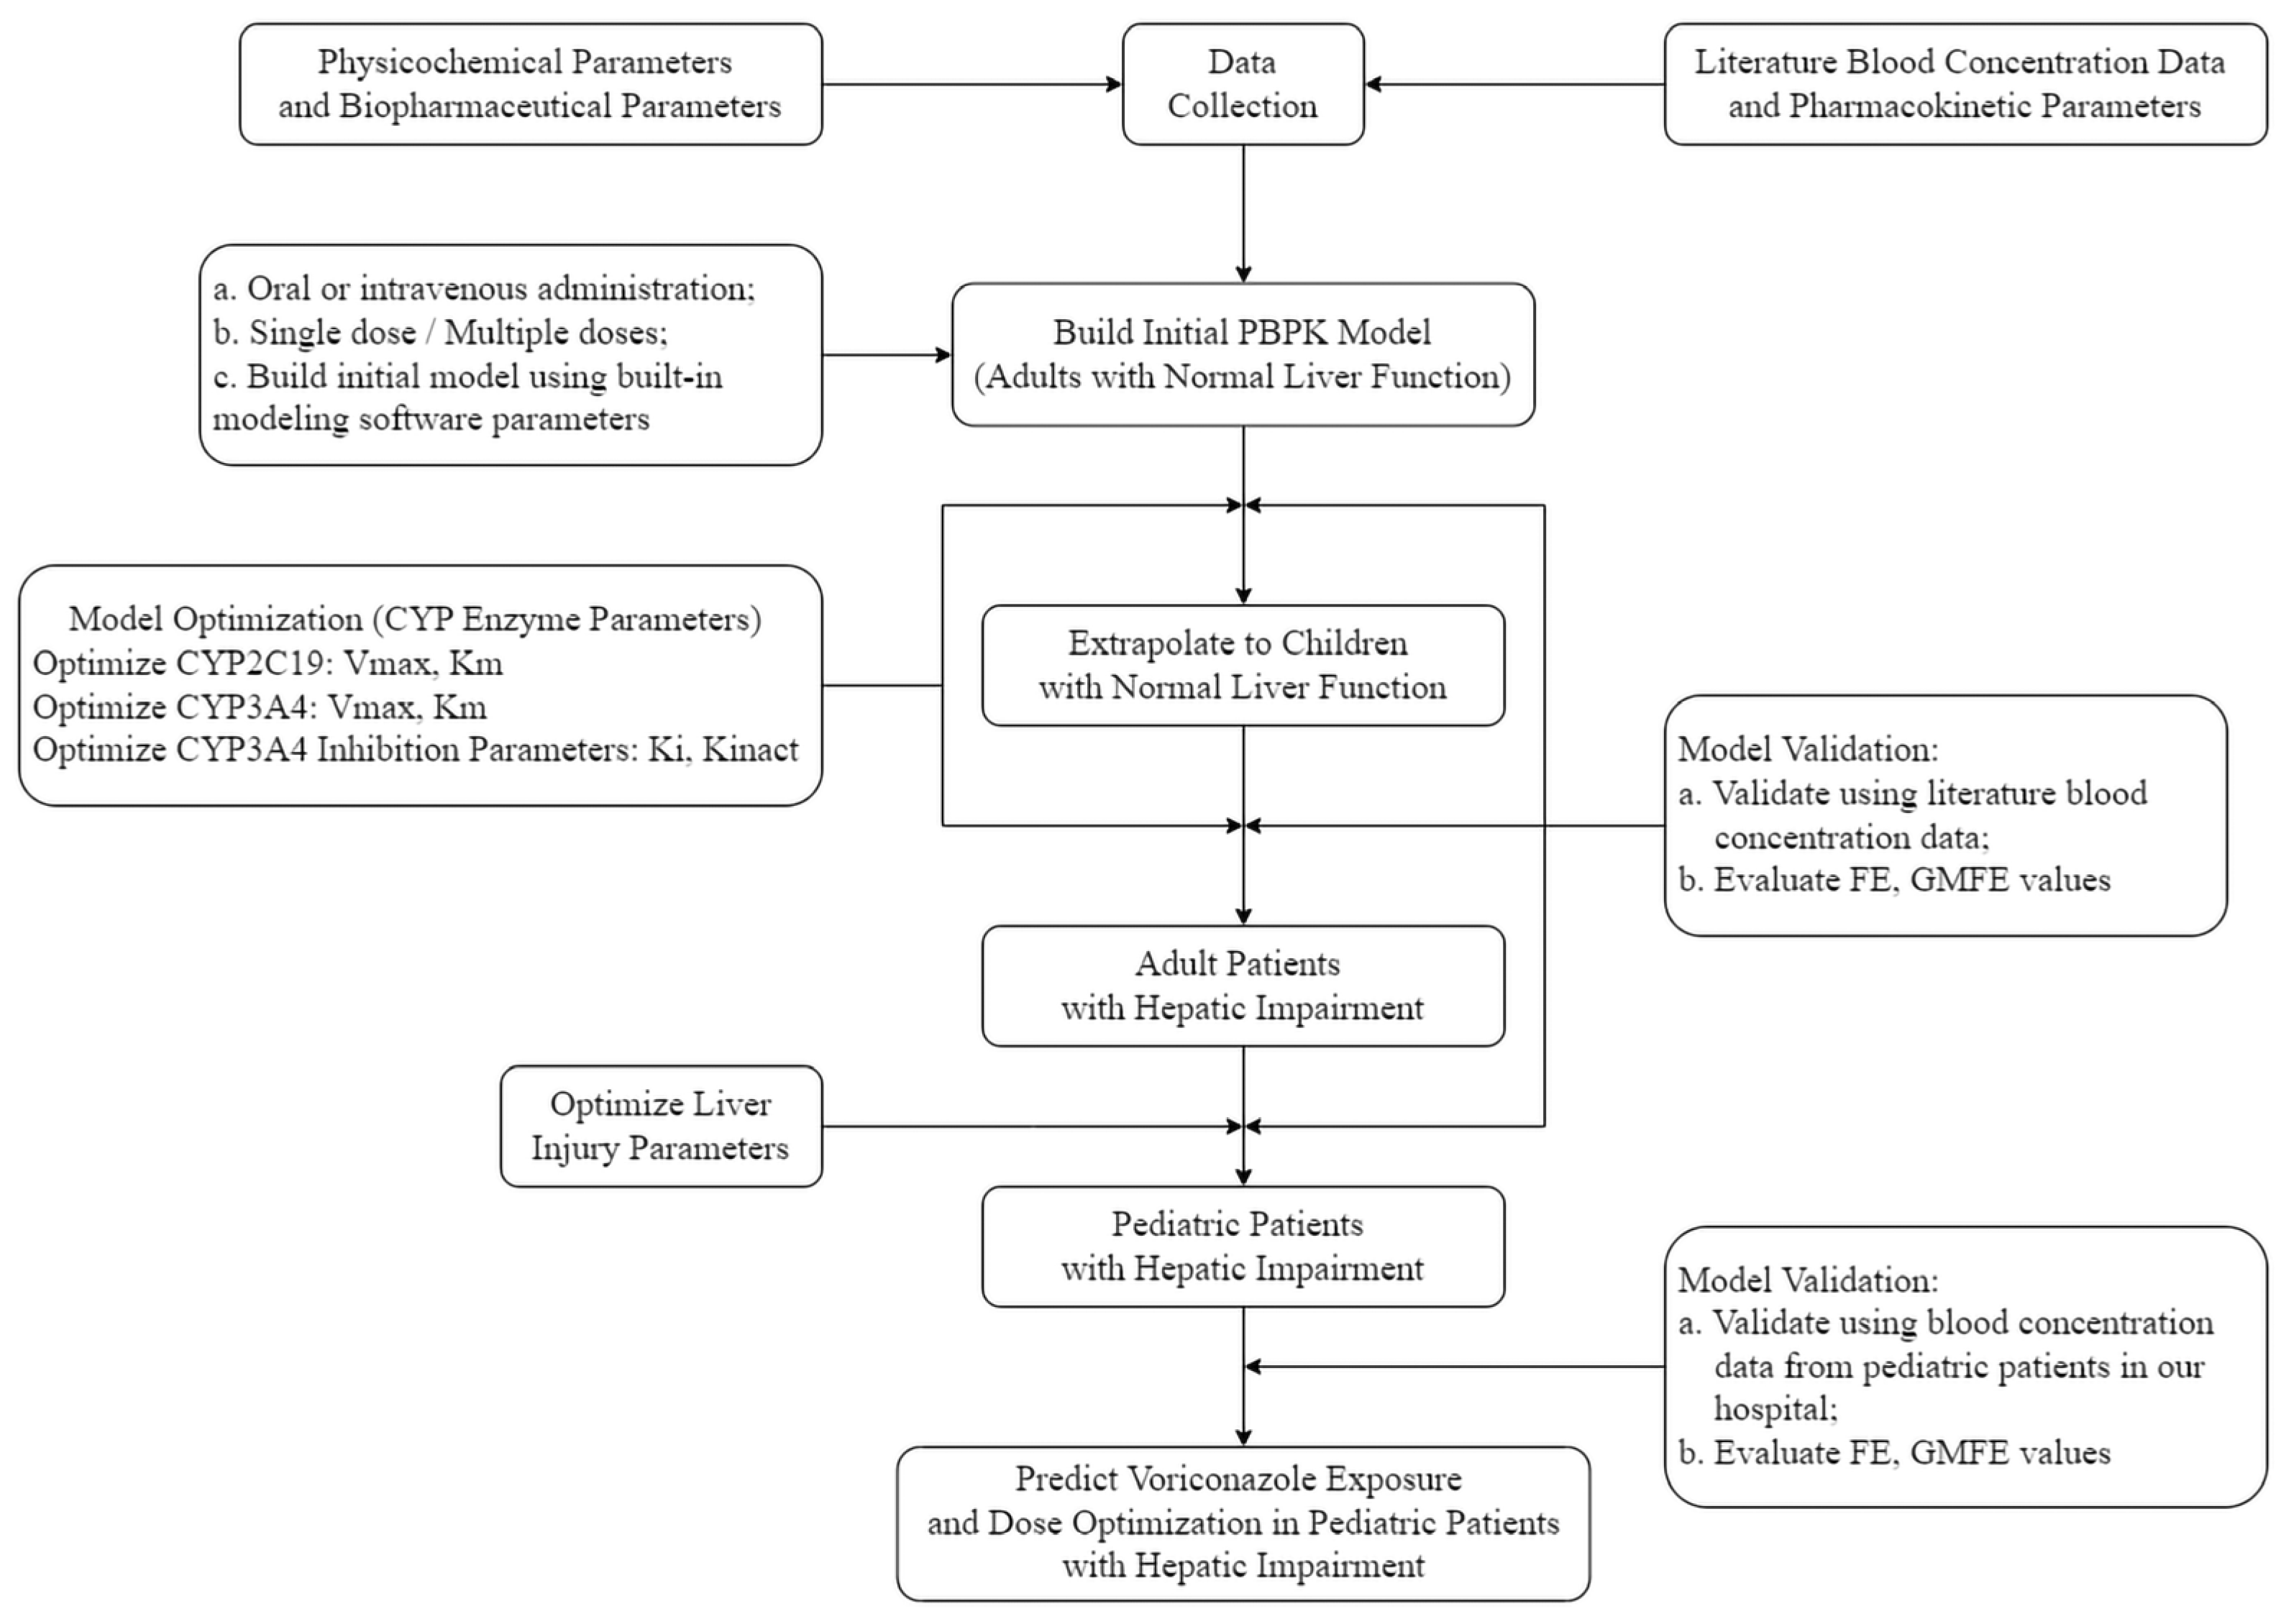
The PBPK models for voriconazole were developed using GastroPlus™ version 9.9 (Simulations Plus Inc., Lancaster, CA, USA). The models were developed with the processes shown in Figure 1. Considering that voriconazole is characterized by a low molecular weight, high lipophilicity, and good tissue penetration [1], a perfusion-limited tissue distribution model was employed to describe voriconazole’s pharmacokinetic processes in adults, children, and patients with hepatic impairment. An adult PBPK model was first established and validated against published clinical pharmacokinetic data. This model was then extrapolated to the pediatric population by incorporating age-dependent anatomical and physiological parameters. Individualized PBPK models were further developed using clinical data collected from pediatric patients receiving voriconazole at our hospital. Population simulations were then performed to evaluate the predictive performance of the model in this specific patient population. This retrospective study was approved by the institutional ethics committee. The requirement for written informed consent was waived, as the study used anonymized clinical data and did not involve any intervention or collection of new samples.
Figure 1.
Workflow of the physiologically based pharmacokinetic (PBPK) model development and validation for voriconazole in adult and pediatric patients with hepatic impairment.
2.2. Modeling Parameters and Pharmacokinetic Data
Drug-specific parameters governing the absorption, distribution, metabolism, and excretion (ADME) of voriconazole—including its physicochemical properties, pharmacokinetic characteristics, and the Michaelis–Menten constants (Km) and maximum reaction rates (Vmax) of the principal metabolizing enzymes CYP2C19, CYP3A4, and CYP2C9—were obtained from the published literature, predicted by GastroPlus™ version 9.9, or optimized during model construction. The reference values, final values, and sources of all parameters are summarized in Table S1 [11,15,16]. Tissue-to-plasma partition coefficients were estimated using the Rodgers, Leahy, and Rowland approach. The enzyme-mediated clearance process was described using Michaelis–Menten kinetics. The Ki and kinact values used for TDI are listed in Table S1. TDI of CYP3A4 was incorporated into the healthy adult model and the literature-based pediatric model but not into the in-hospital pediatric models (children with normal hepatic function and children with hepatic impairment) or the adult hepatic impairment model. The rationale for this decision is provided in the Discussion. A separate quantitative sensitivity analysis for the inclusion or exclusion of CYP3A4 TDI was not performed; this is acknowledged as a limitation. Plasma concentration-time profiles were digitized from published figures using GetData Graph Digitizer software (version 2.26). Published pharmacokinetic data for voriconazole encompassing healthy adults, pediatric patients, and adults with hepatic impairment, were retrospectively collected and compiled [6,17,18,19,20,21,22]. For each model, the datasets used for model development and parameter optimization were strictly separated from those used for independent validation. The source, population, dosing regimen, sampling scheme, and role of each dataset are summarized in Table S2. The physiological changes incorporated into the hepatic impairment model are quantitatively summarized in Table S3 [23,24,25], with scaling factors for Child–Pugh class A, B, and C. The clinical sampling design for the hospitalized pediatric patients is summarized in Table S4 and Table S5, and the sampling protocols of the literature datasets are summarized in Table S6. For the hospitalized pediatric patients, area under the concentration-time curve (AUC) values are model-predicted only, as the sparse trough sampling did not allow for direct calculation of observed AUC. CYP2C19 genotype data were unavailable for all hospitalized pediatric patients; therefore, CYP2C19 polymorphisms were not incorporated into the pediatric or hepatic impairment models. FMO3 was also not included because reliable evidence for its clinical relevance in voriconazole oxidative metabolism is lacking.
2.3. Healthy Adults’ Voriconazole PBPK Model
PBPK models were developed for both oral and intravenous administration in healthy adults. Simulations of single-dose and multiple-dose regimens in healthy adult subjects were conducted using available PK data. The PBPK model for voriconazole in healthy adults was validated against clinical PK data derived from previously published investigations. The datasets used for model development and independent validation are summarized in Table S2. The dosing regimens used for model development and validation included: single-dose intravenous administration of 3 mg/kg, 6 mg/kg, and 400 mg; single-dose oral administration of 3 mg/kg, 4 mg/kg, 400 mg; multiple-dose intravenous regimens of 3 mg/kg; multiple-dose oral regimens of 3 mg/kg and 4 mg/kg; and multiple-dose intravenous regimens consisting of a 6 mg/kg loading dose with subsequent maintenance dosing at 3 mg/kg and 4 mg/kg, respectively. The model was validated against both single- and multiple-dose regimens to confirm its ability to reproduce the nonlinear pharmacokinetics of voriconazole.
2.4. Pediatric Patients with Normal Hepatic Function—Independent Validation
Data from 6 pediatric inpatients with normal liver function who received voriconazole treatment were retrospectively extracted from our hospital’s electronic medical record database. These 6 patients were used only as an independent validation dataset and were not used for model development or parameter optimization. Inclusion criteria were: (1) age 2–17 years; (2) confirmed normal liver function (alanine aminotransferase and aspartate aminotransferase ≤1.5 times the upper limit of normal, and total bilirubin within the normal range); and (3) received intravenous or oral voriconazole treatment, with at least one measurable trough plasma concentration (Cmin) during routine therapeutic drug monitoring (TDM). Exclusion criteria were: (1) concomitant use of medications known to interact significantly with voriconazole and (2) incomplete medical records or missing plasma concentration data. Blood samples were collected in routine clinical practice, and plasma voriconazole concentrations were determined using high-performance liquid chromatography–tandem mass spectrometry (HPLC-MS/MS). The model was subsequently validated by comparing the predicted concentrations with the measured plasma concentrations. The clinical sampling details for all normal hepatic function hospitalized pediatric patients are summarized in Table S4.
Published pediatric PK data were used for model development and validation, as summarized in Table S2. The dosing regimens used for model development and validation included single intravenous doses of 3–6 mg/kg across pediatric age subgroups (2–5, 6–11, and 12–17 years), and multiple-dose regimens of 4–8 mg/kg q12 h with or without sequential oral therapy, as described in published studies. Patient-specific PBPK models were developed by integrating demographic covariates (age, sex, and body mass index), clinical parameters (hepatic function), and pharmacotherapy information (dosage frequency, dose, and route of administration). Published evidence indicates that voriconazole exhibits nonlinear pharmacokinetics in children at higher dose levels; therefore, Michaelis–Menten kinetics were used to describe enzyme-mediated clearance in the pediatric model [11].
2.5. Hepatically Insufficient Adults’ Voriconazole PBPK Model
Pharmacokinetic data on intravenous voriconazole in adults with hepatic impairment were obtained through a systematic literature review. The adult hepatic impairment model was developed and optimized using the literature dataset, and the same dataset was used for internal validation; therefore, this validation is not independent. A PBPK model for intravenous voriconazole in this population was constructed and validated against the published data. GastroPlus™ version 9.9 employs the Child–Pugh classification to characterize different degrees of hepatic impairment. The systemic physiological changes incorporated into the model—including functional liver volume, CYP enzyme activity in the liver and intestines, plasma protein levels, hematocrit, hepatic and arterial blood flow, cardiac output, and glomerular filtration rate—were derived from previously published research studies [24,26]. Patients with hepatic impairment were classified into three categories according to the Child–Pugh criteria based on FDA guidance: Child-Pugh class A (mild), Child-Pugh class B (moderate), and Child-Pugh class C (severe) hepatic impairment [27]. The quantitative scaling factors for all physiological parameters incorporated into the hepatic impairment model are summarized in Table S3. Notably, relative CYP2C19 abundance was kept constant across Child-Pugh classes, consistent with published proteomic data showing stable protein levels, while the overall reduction in hepatic metabolic capacity is captured by the scaling of functional liver volume. TDI of CYP3A4 was not incorporated into this model, and no separate quantitative sensitivity analysis for TDI was performed. CYP2C19 genotype data were unavailable; therefore, CYP2C19 polymorphisms were not incorporated into this model.
2.6. Pediatric Patients with Hepatic Impairment—Independent Validation
A total of 14 pediatric inpatients with hepatic impairment who received voriconazole therapy were identified retrospectively through a review of the electronic medical record system at our institution. These 14 patients were used only as an independent validation dataset and were not used for model development or parameter optimization. The inclusion criteria were: (1) age 2–17 years; (2) diagnosed with hepatic impairment classified according to the Child-Pugh criteria based on clinical records at the time of voriconazole administration; and (3) received intravenous or oral voriconazole with at least one measurable Cmin during routine TDM. The exclusion criteria were: (1) concomitant use of drugs known to significantly interact with voriconazole and (2) incomplete medical records or missing plasma concentration data. Blood samples were collected during routine clinical practice, and plasma voriconazole concentrations were quantified using HPLC-MS/MS. This study was approved by the Ethics Committee of Children’s Hospital of Chongqing Medical University (Approval No. (2026) Ethical Review (Clinical Research) No. 23)). The requirement for written informed consent was waived by the ethics committee because the study used de-identified retrospective data and did not involve any intervention or collection of new samples. The clinical sampling details for all hepatic impairment hospitalized pediatric patients are summarized in Table S5.
2.7. Population Simulation
To evaluate interindividual variability and model applicability, population simulations were conducted using the validated model. Population simulations were performed with 40 virtual subjects per group based on the literature-derived datasets, and with 25 subjects per group across 20 groups based on the hospital datasets, to evaluate interindividual variability and model applicability. The population characteristics included in the simulations were as follows: virtual adult individuals aged 18 to 65 years, and pediatric individuals in the age groups of 2–6 years, 6–12 years, and 12–17 years, with an equal gender distribution (50% male) [28].
2.8. Pharmacodynamic Evaluation Methods
Previous studies have suggested that a ratio of the steady-state 24 h free drug area under the concentration-time curve to the minimum inhibitory concentration of 25 or greater (fAUC0–24 h/MIC ≥ 25) serves as the pharmacokinetic/pharmacodynamic (PK/PD) target for predicting the efficacy of voriconazole [29]. The steady-state free AUC over 24 h was calculated as the steady-state total AUC0–24 h multiplied by the unbound fraction (fup). For healthy individuals, a fixed fup value of 42% was used. For patients with hepatic impairment, disease-specific fup values were applied according to the degree of hepatic dysfunction (Child-Pugh class A: 45%; Child–Pugh class B: 55%; Child-Pugh class C: 80%), as summarized in Table S3. The population simulation module of GastroPlus™ version 9.9 was used, in combination with human physiological parameters and the minimum inhibitory concentration (MIC) range of voriconazole at our hospital, to evaluate its pharmacodynamic characteristics. The probability of target attainment (PTA) was simulated at MIC values of 0.5, 1, 2, 4, and 8 mg/L. A total of 500 simulations were performed for each dosing regimen, and the corresponding pharmacokinetic parameters were obtained. Subsequently, pharmacokinetic parameters corresponding to different voriconazole dosing regimens were examined, and the regimens used in pediatric patients with Child-Pugh class A and B hepatic impairment at our institution were assessed. The model was also used to predict intravenous dosing regimens for Child-Pugh class C pediatric patients.
2.9. Method Validation and Statistical Analysis
2.9.1. Model Validation
The predictive performance of the model was evaluated separately for the literature datasets and the in-hospital pediatric datasets, as these datasets differed in sampling scheme and available pharmacokinetic parameters.
For the literature datasets, which used intensive sampling, the fold error (FE) and geometric mean fold error (GMFE) were calculated from AUC and maximum plasma concentration (Cmax). A prediction was considered acceptable if the FE fell within the 0.5-fold to 2.0-fold range and the GMFE was less than 2.0.
For the in-hospital pediatric datasets, which consisted of Cmin obtained during routine therapeutic drug monitoring, model-predicted Cmin values at the actual sampling times were compared with the observed Cmin values. The FE and percentage error (PE) were calculated to assess bias, and the mean absolute prediction error (MAPE) was calculated to assess precision. The MAPE < 30% was considered acceptable. The number of observed concentrations falling within the 95% prediction interval was also reported. The FE, GMFE, PE and MAPE were calculated using Equations (1)–(4) [30,31,32,33]:
2.9.2. Parameter Sensitivity Analysis
To systematically evaluate the influence of model parameters on the pharmacokinetic predictions of voriconazole, a local sensitivity analysis was conducted using the Parameter Sensitivity Analysis (PSA) module in GastroPlus™ version 9.9. The following key parameters were evaluated: the metabolic enzyme activities (Vmax,2C19, Km,2C19, Vmax,3A4, Km,3A4), liver volume (Vol-Liver), blood-to-plasma concentration ratio (Rbp), fraction unbound in plasma (fup), and effective intestinal permeability (Peff). The pharmacokinetic evaluation endpoints included the area under the plasma concentration-time curve (AUC0-inf, AUC0-t), the maximum plasma concentration (Cmax), the time to reach Cmax (Tmax), and the maximum liver concentration (Liver-Cmax). The parameter range was set to 0.5–2 times the software’s default baseline values to avoid inappropriate parameter settings. The sensitivity coefficient (SC, absolute value) was classified as high, medium, or low sensitivity according to the following criteria: |SC| > 0.5, 0.2 ≤ |SC| ≤ 0.5, and |SC| < 0.2. The calculation method is shown in Equation (5) [27,34,35,36]. This sensitivity analysis evaluated key model parameters but did not specifically evaluate the inclusion or exclusion of CYP3A4 TDI.
2.9.3. Bioanalytical Method Validation
Voriconazole plasma concentrations were determined using a validated high-performance liquid chromatography–tandem mass spectrometry (HPLC-MS/MS) method. The method was validated according to the Guidance on Validation of Bioanalytical Methods (9012) of the Chinese Pharmacopoeia (2015 edition) [37]. The calibration curve was linear over the range of 0.25–12.3 ng/mL (r2 > 0.99). The lower limit of quantification (LLOQ) was 0.25 ng/mL. Intra- and inter-day accuracy (expressed as relative error, RE) were within ±15%, and intra- and inter-day precision (expressed as coefficient of variation, CV) were ≤15%. Plasma samples were processed by protein precipitation, and chromatographic separation was performed on an Aston SC2 column using a two-dimensional HPLC system with a validated mobile phase composition.
3. Results
3.1. Establishment, Validation, and Population Simulation of Healthy Adult Voriconazole PBPK Model
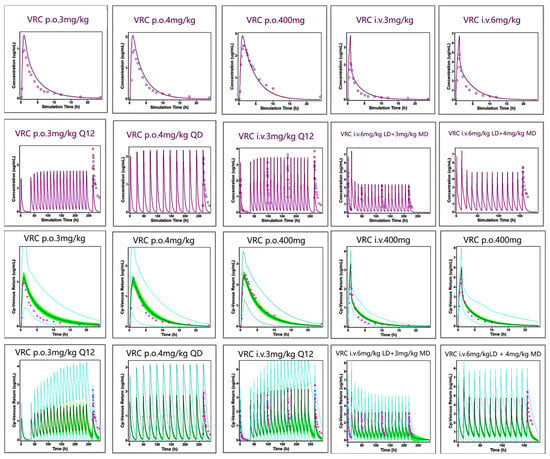
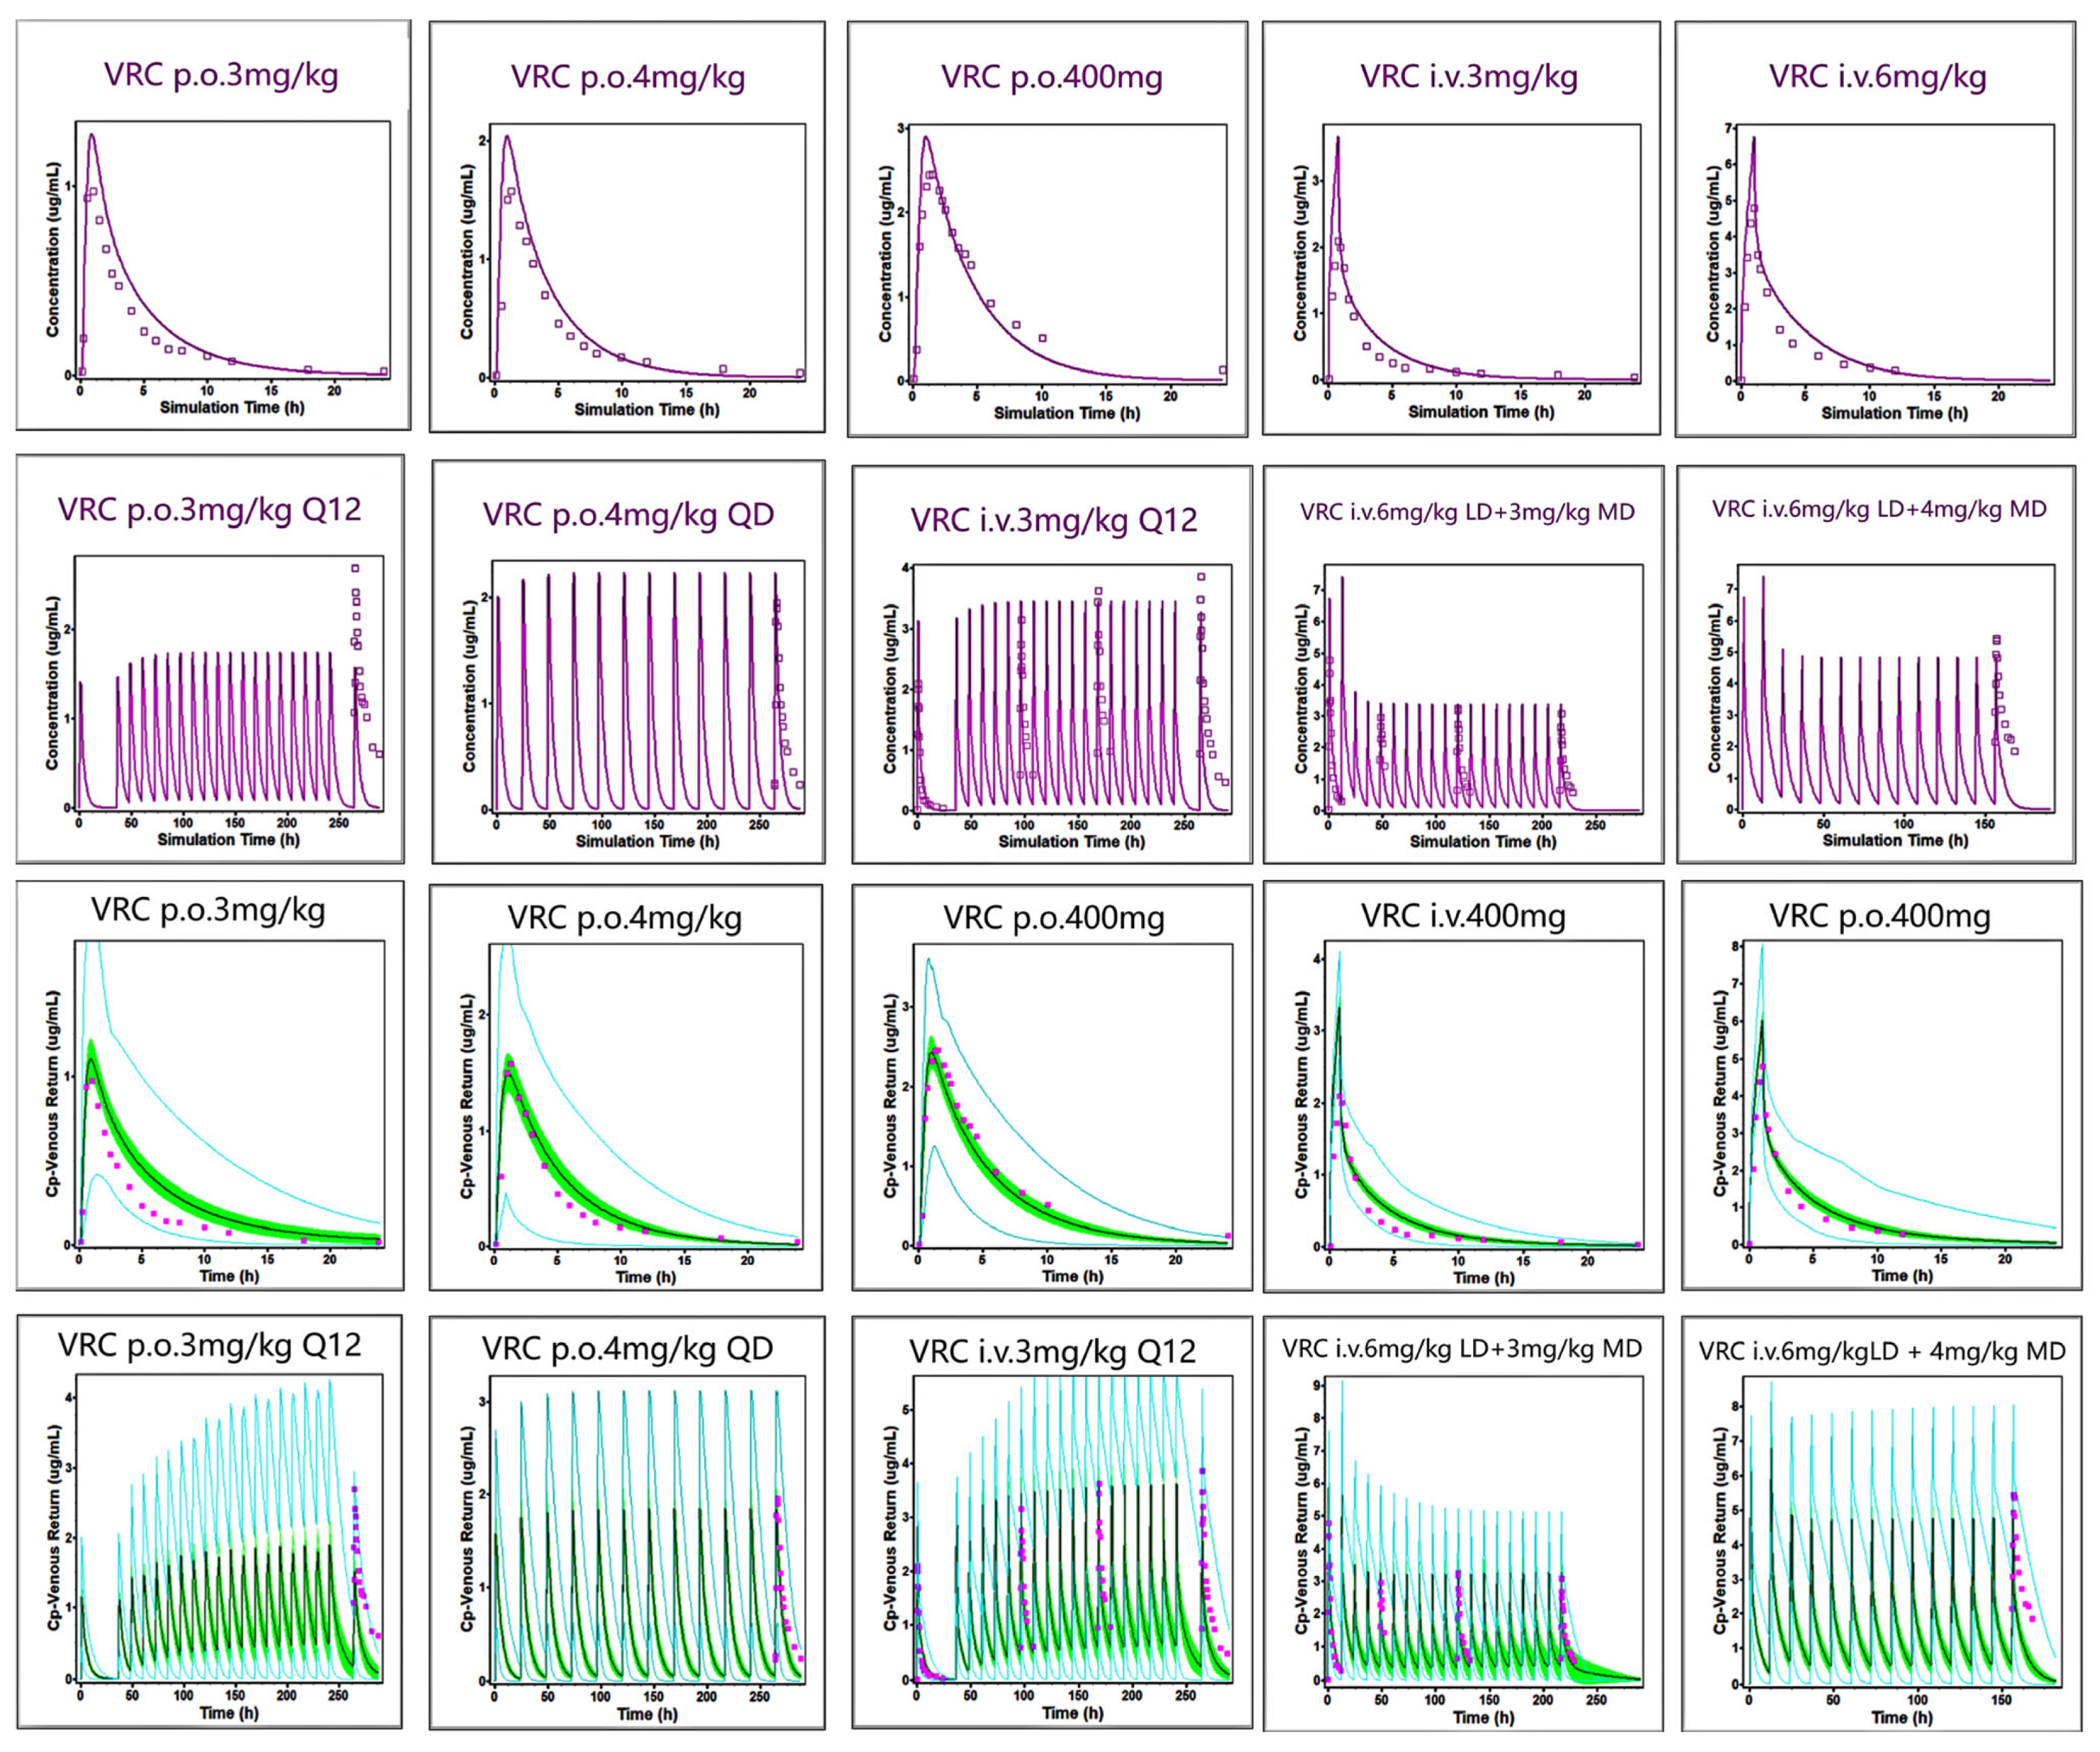
Figure 2 shows the simulated and observed mean plasma concentration-time curves after single-dose and multiple-dose voriconazole administration in healthy adults, and Table S7 summarizes the corresponding PK parameters. The FE values ranged from 0.6 to 1.8, and all GMFE values were <2.0. Population simulations showed that all observed concentrations fell within 95% prediction interval.
Figure 2.
Observed and predicted plasma concentration-time curves and population simulation of voriconazole in healthy adults. The purple curve represents the model-predicted plasma concentration–time profile from the literature-based model incorporating CYP3A4 time-dependent inhibition (TDI); the small squares represent observed plasma concentrations extracted from the literature. The black curve represents the mean predicted plasma concentration (Mean Cp-Venous Return) from the population simulation based on the literature model. In the population simulation, the green shaded area represents the 90% confidence interval (90% C.I. mean Cp-Venous Return); the pink squares represent the observed mean concentrations (Observed Mean); the blue upper and lower curves represent the 95% probability interval (Probability 95%).
3.2. Establishment, Validation, and Population Simulation of the Literature-Based Pediatric Voriconazole PBPK Model for Patients with Normal Hepatic Function
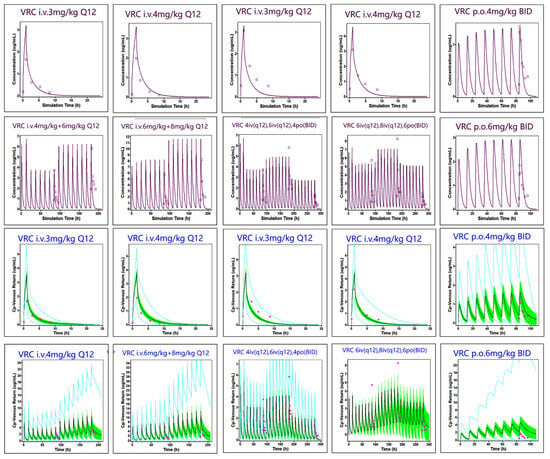
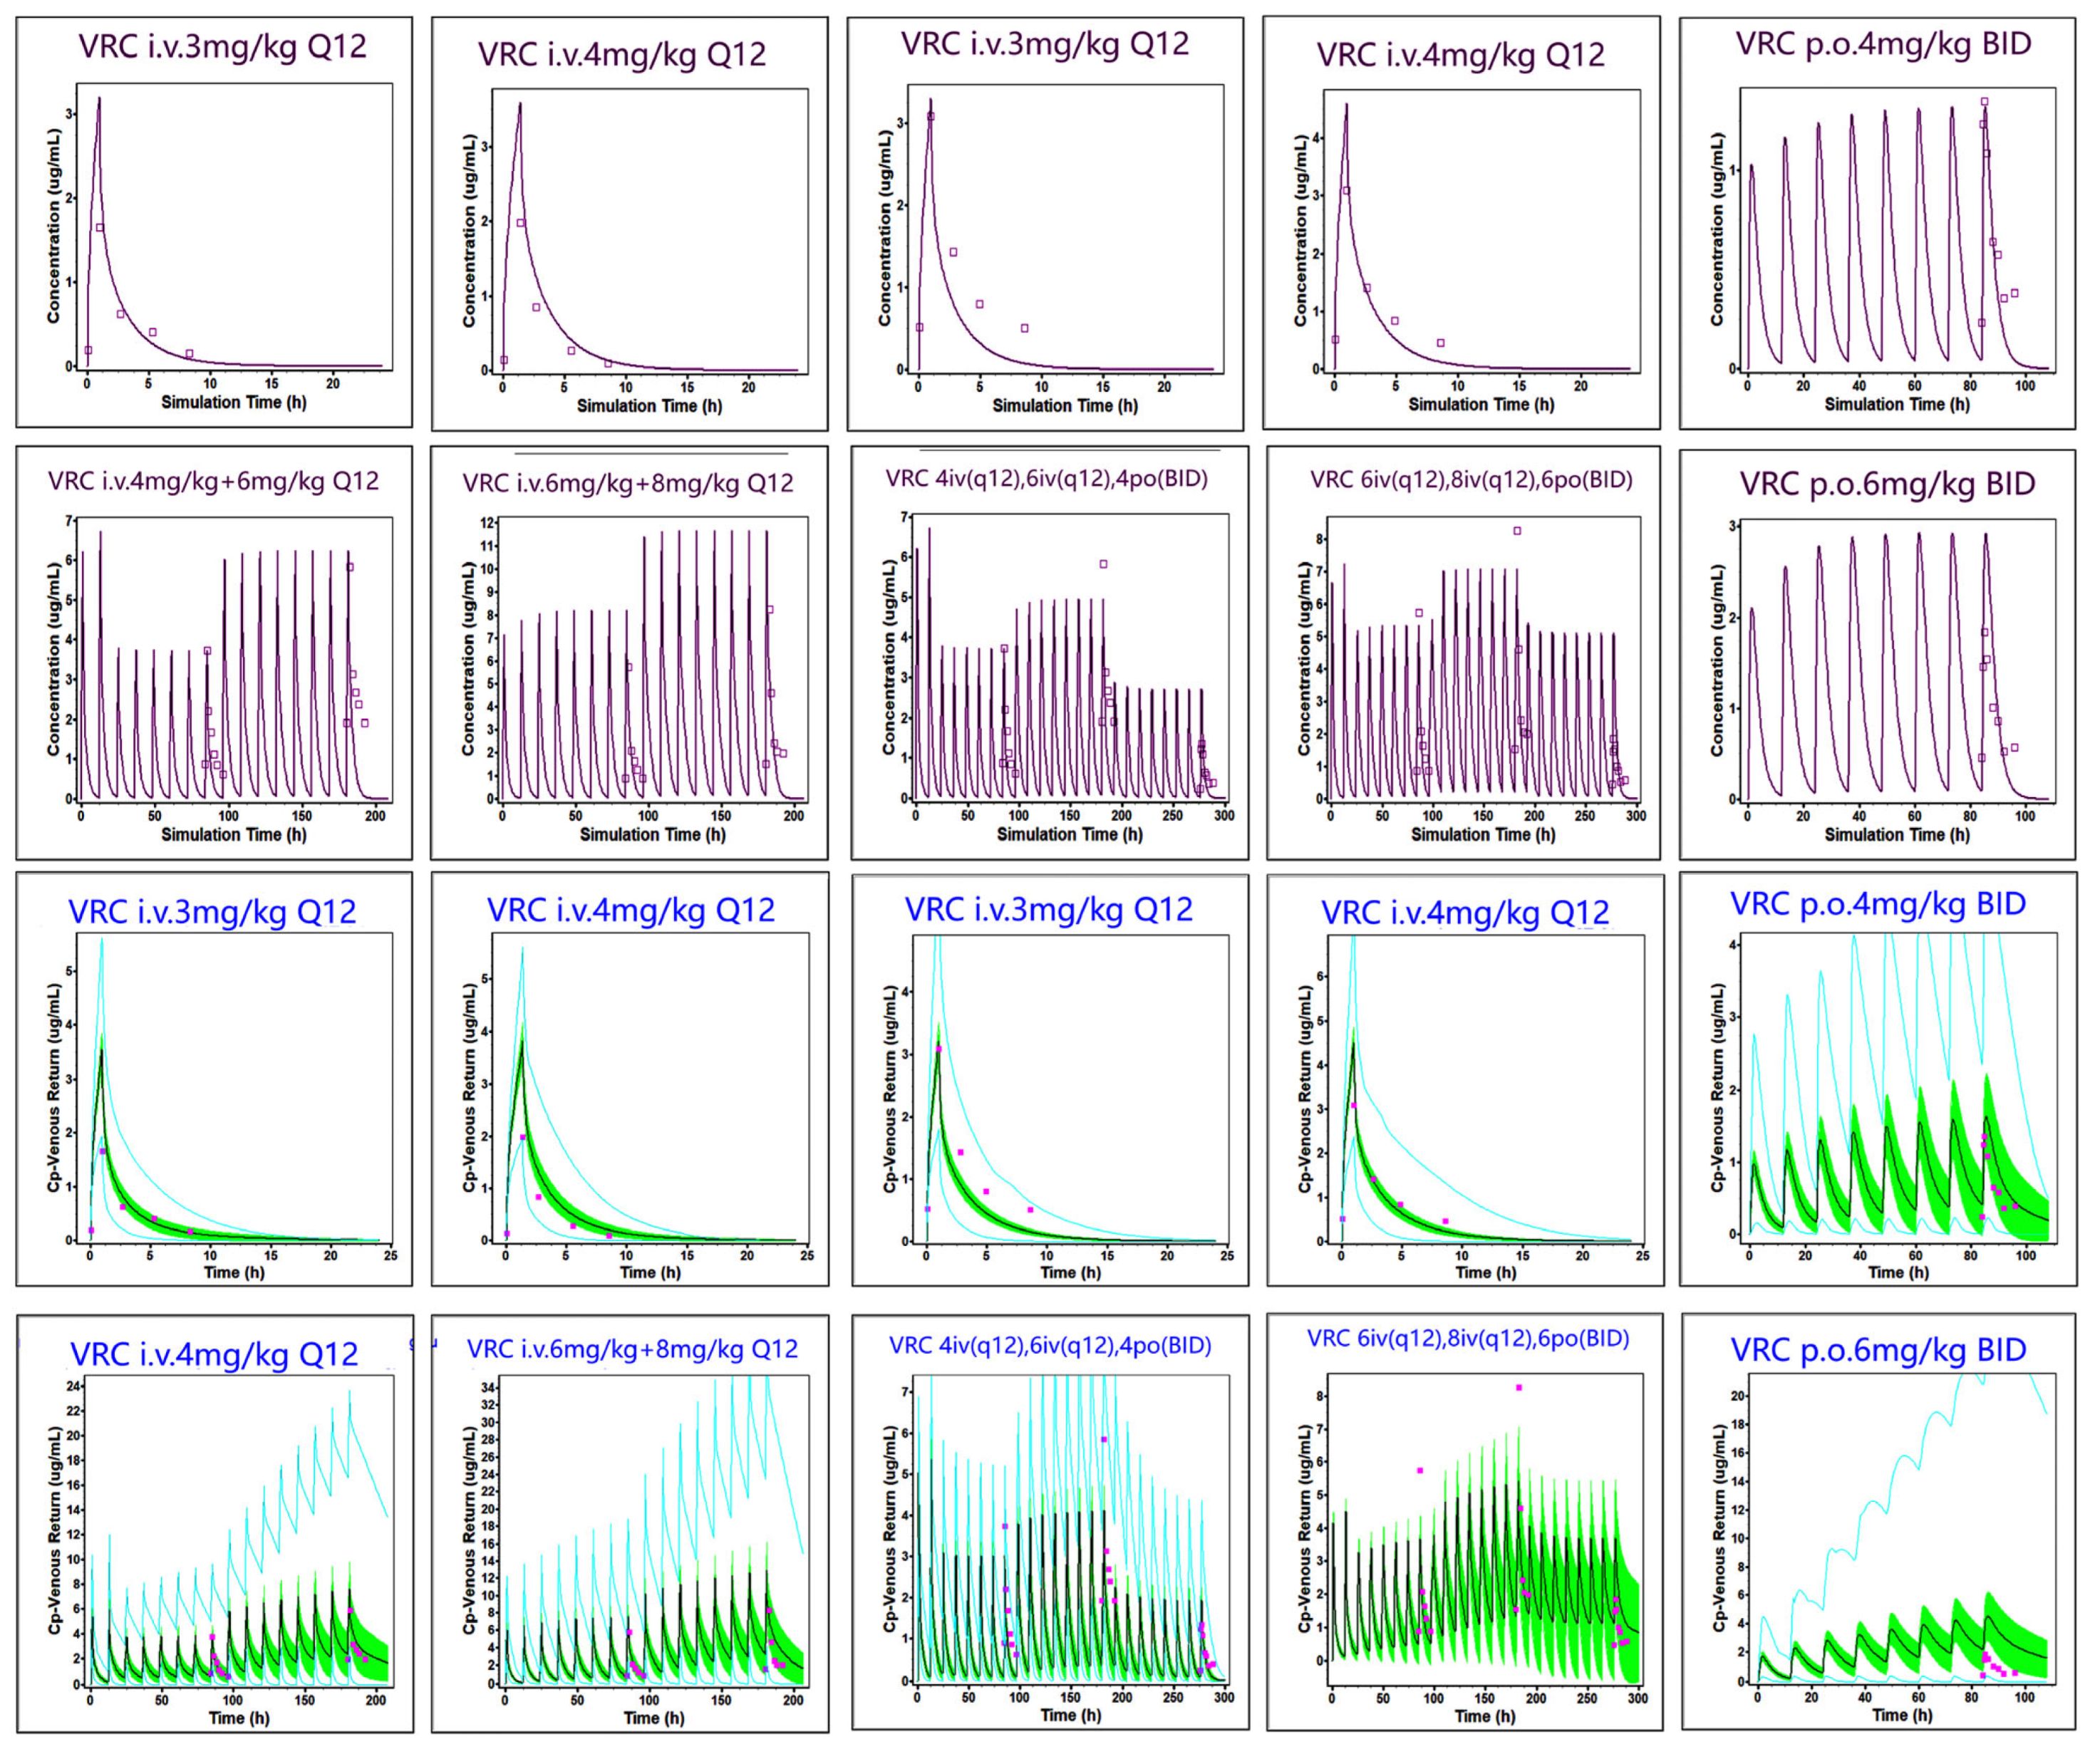
Figure 3 presents the simulated and observed mean plasma concentration-time curves for pediatric patients with normal hepatic function after single- and multiple- dose voriconazole administration. As presented in Table S8, for the different dosing regimens in pediatric patients, after incorporating CYP3A4 TDI into the literature-based pediatric model, most FE values ranged from 0.6 to 2.0, and all GMFE values were <2.0. The model was validated against both single- and multiple-dose regimens, and it reproduced the nonlinear pharmacokinetics of voriconazole in children, with FE values within the acceptance range. The population simulation results showed that all observed concentrations fell within the 95% prediction interval. Minor discrepancies were observed in a limited subset of dosing regimens. In the 6 mg/kg followed by 8 mg/kg multiple-dose intravenous administration, the FE for AUC (2.054) exceeded the 2.0-fold acceptance criterion. In the single 3 mg/kg intravenous dose scenario, the FE for Cmax (1.941) approached but did not exceed the 2.0-fold acceptance criterion, while the FE for AUC remained within the acceptable range.
Figure 3.
Observed and predicted plasma concentration-time curves and population simulation of voriconazole in pediatric patients from the published literature. The purple curve represents the model-predicted plasma concentration–time profile from the literature-based model incorporating CYP3A4 time-dependent inhibition (TDI); the small squares represent observed plasma concentrations extracted from the literature. The black curve represents the mean predicted plasma concentration (Mean Cp-Venous Return) from the population simulation based on the literature model. In the population simulation, the green shaded area represents the 90% confidence interval (90% C.I. mean Cp-Venous Return); the pink squares represent the observed mean concentrations (Observed Mean); the blue upper and lower curves represent the 95% probability interval (Probability 95%).
3.3. Independent Validation of the Hospitalized Pediatric Voriconazole PBPK Model for Patients with Normal Hepatic Function
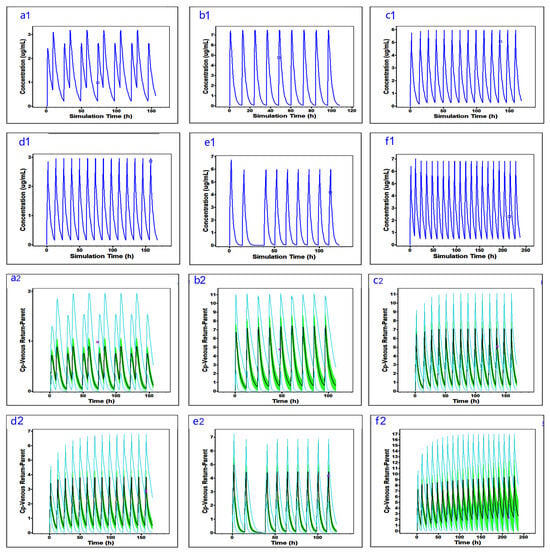
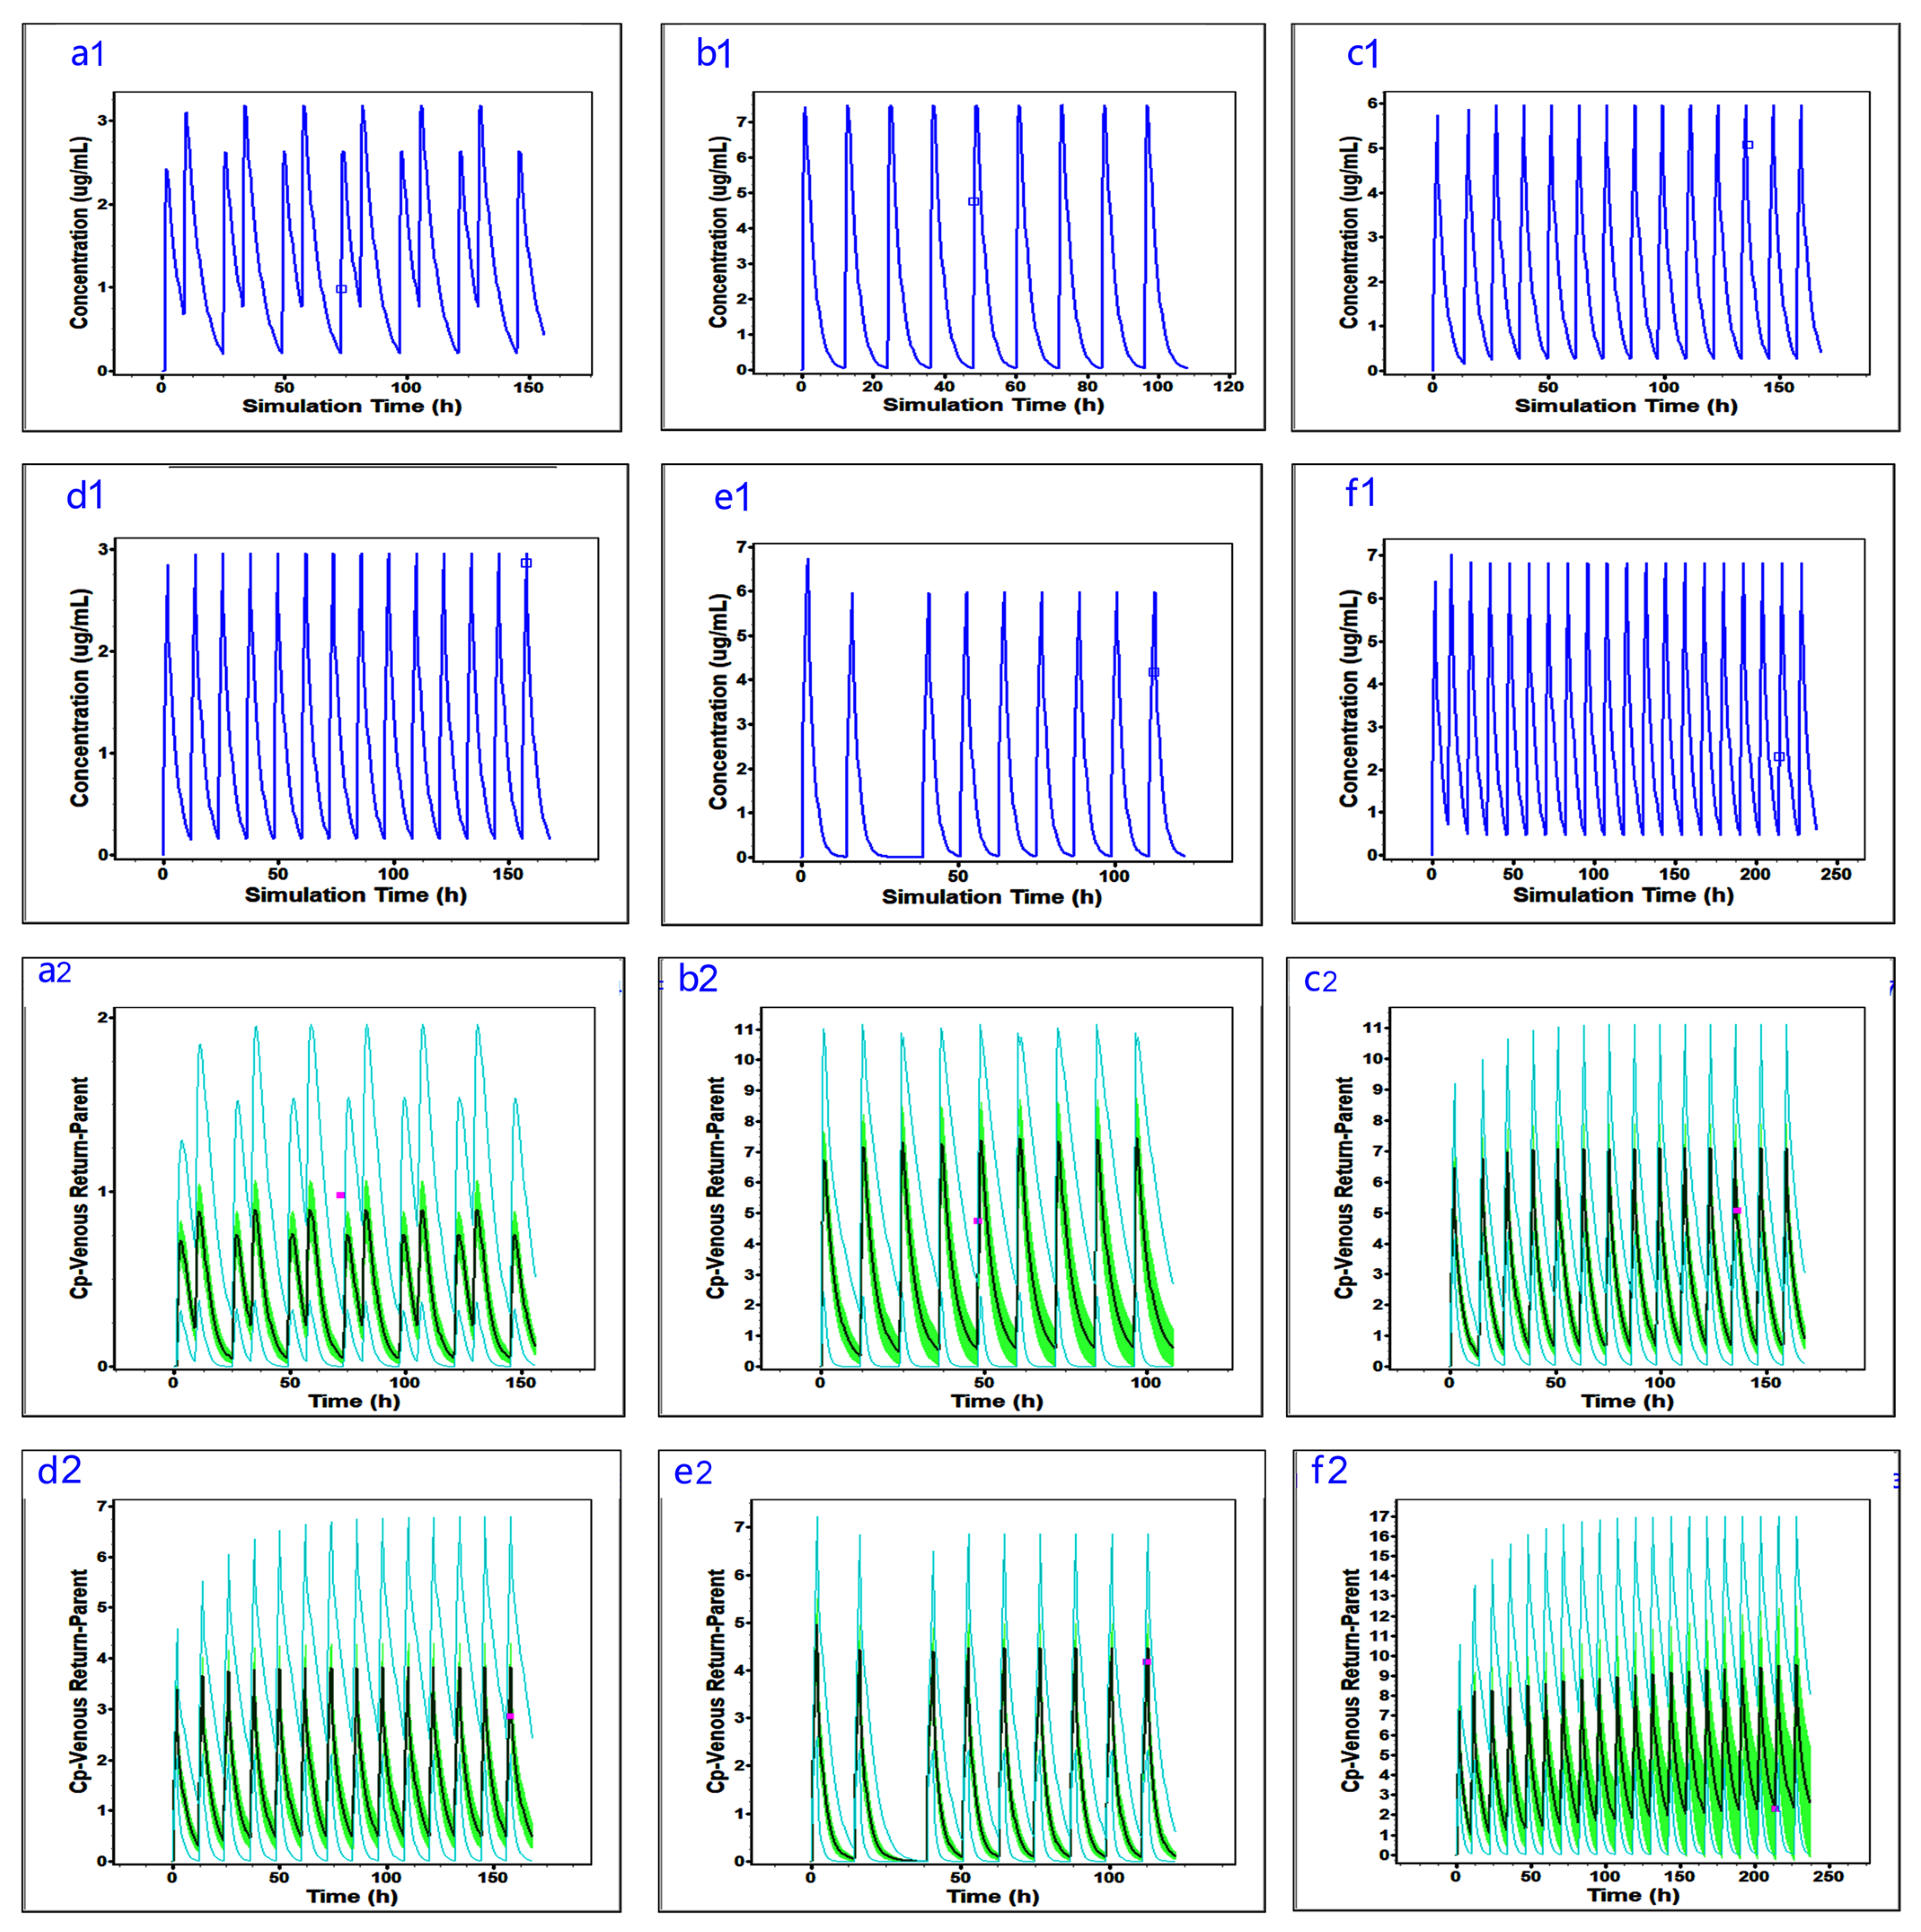
Figure 4 shows the mean plasma concentration-time curves and population simulation results for the six hospitalized pediatric patients with normal hepatic function after multiple voriconazole doses, including both simulated and measured data. As presented in Table S9, for the different dosing regimens in these pediatric patients, the FE values ranged from 0.8 to 1.4 and the MAPE was 15.13%. Five of the six observed Cmin values fell within the 95% prediction interval. For the remaining patient, the measured Cmin fell near the upper boundary of the simulated probability range. Notably, this patient’s blood sample was collected before steady state was reached, whereas all other samples were obtained at steady state.
Figure 4.
Observed and predicted plasma concentration–time curves and population simulations of voriconazole in hospitalized pediatric patients with normal hepatic function. Subfigures (a1–f1) represent the individual model predictions for Patients a–f, respectively; subfigures (a2–f2) represent the corresponding population simulations. (a1) Patient a (individual prediction): The blue curve represents the individual model-predicted plasma concentration–time profile, and the small squares represent the observed plasma concentrations from that patient. (a2) Patient a (population simulation): The black curve represents the mean predicted plasma concentration (Mean Cp-Venous Return) from the population simulation based on the individual patient model. The green shaded area represents the 90% confidence interval (90% C.I. mean Cp-Venous Return); the pink squares represent the observed mean concentrations (Observed Mean); and the blue upper and lower curves represent the 95% probability interval (Probability 95%). (b1,b2) Patient b: Same as (a1,a2), but for Patient b. (c1,c2) Patient c: Same as (a1,a2), but for Patient c. (d1,d2) Patient d: Same as (a1,a2), but for Patient d. (e1,e2) Patient e: Same as (a1,a2), but for Patient e. (f1,f2) Patient f: Same as (a1,a2), but for Patient f.
3.4. Establishment and Validation of the PBPK Model of Voriconazole in Adult Patients with Hepatic Impairment
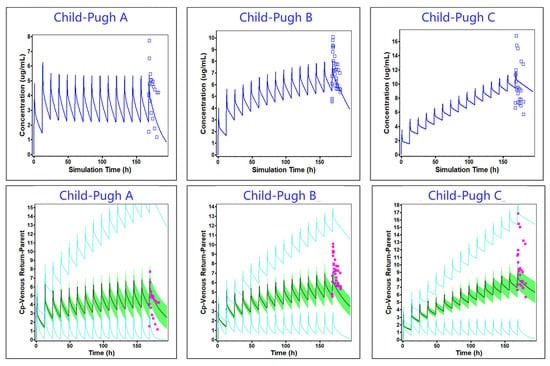
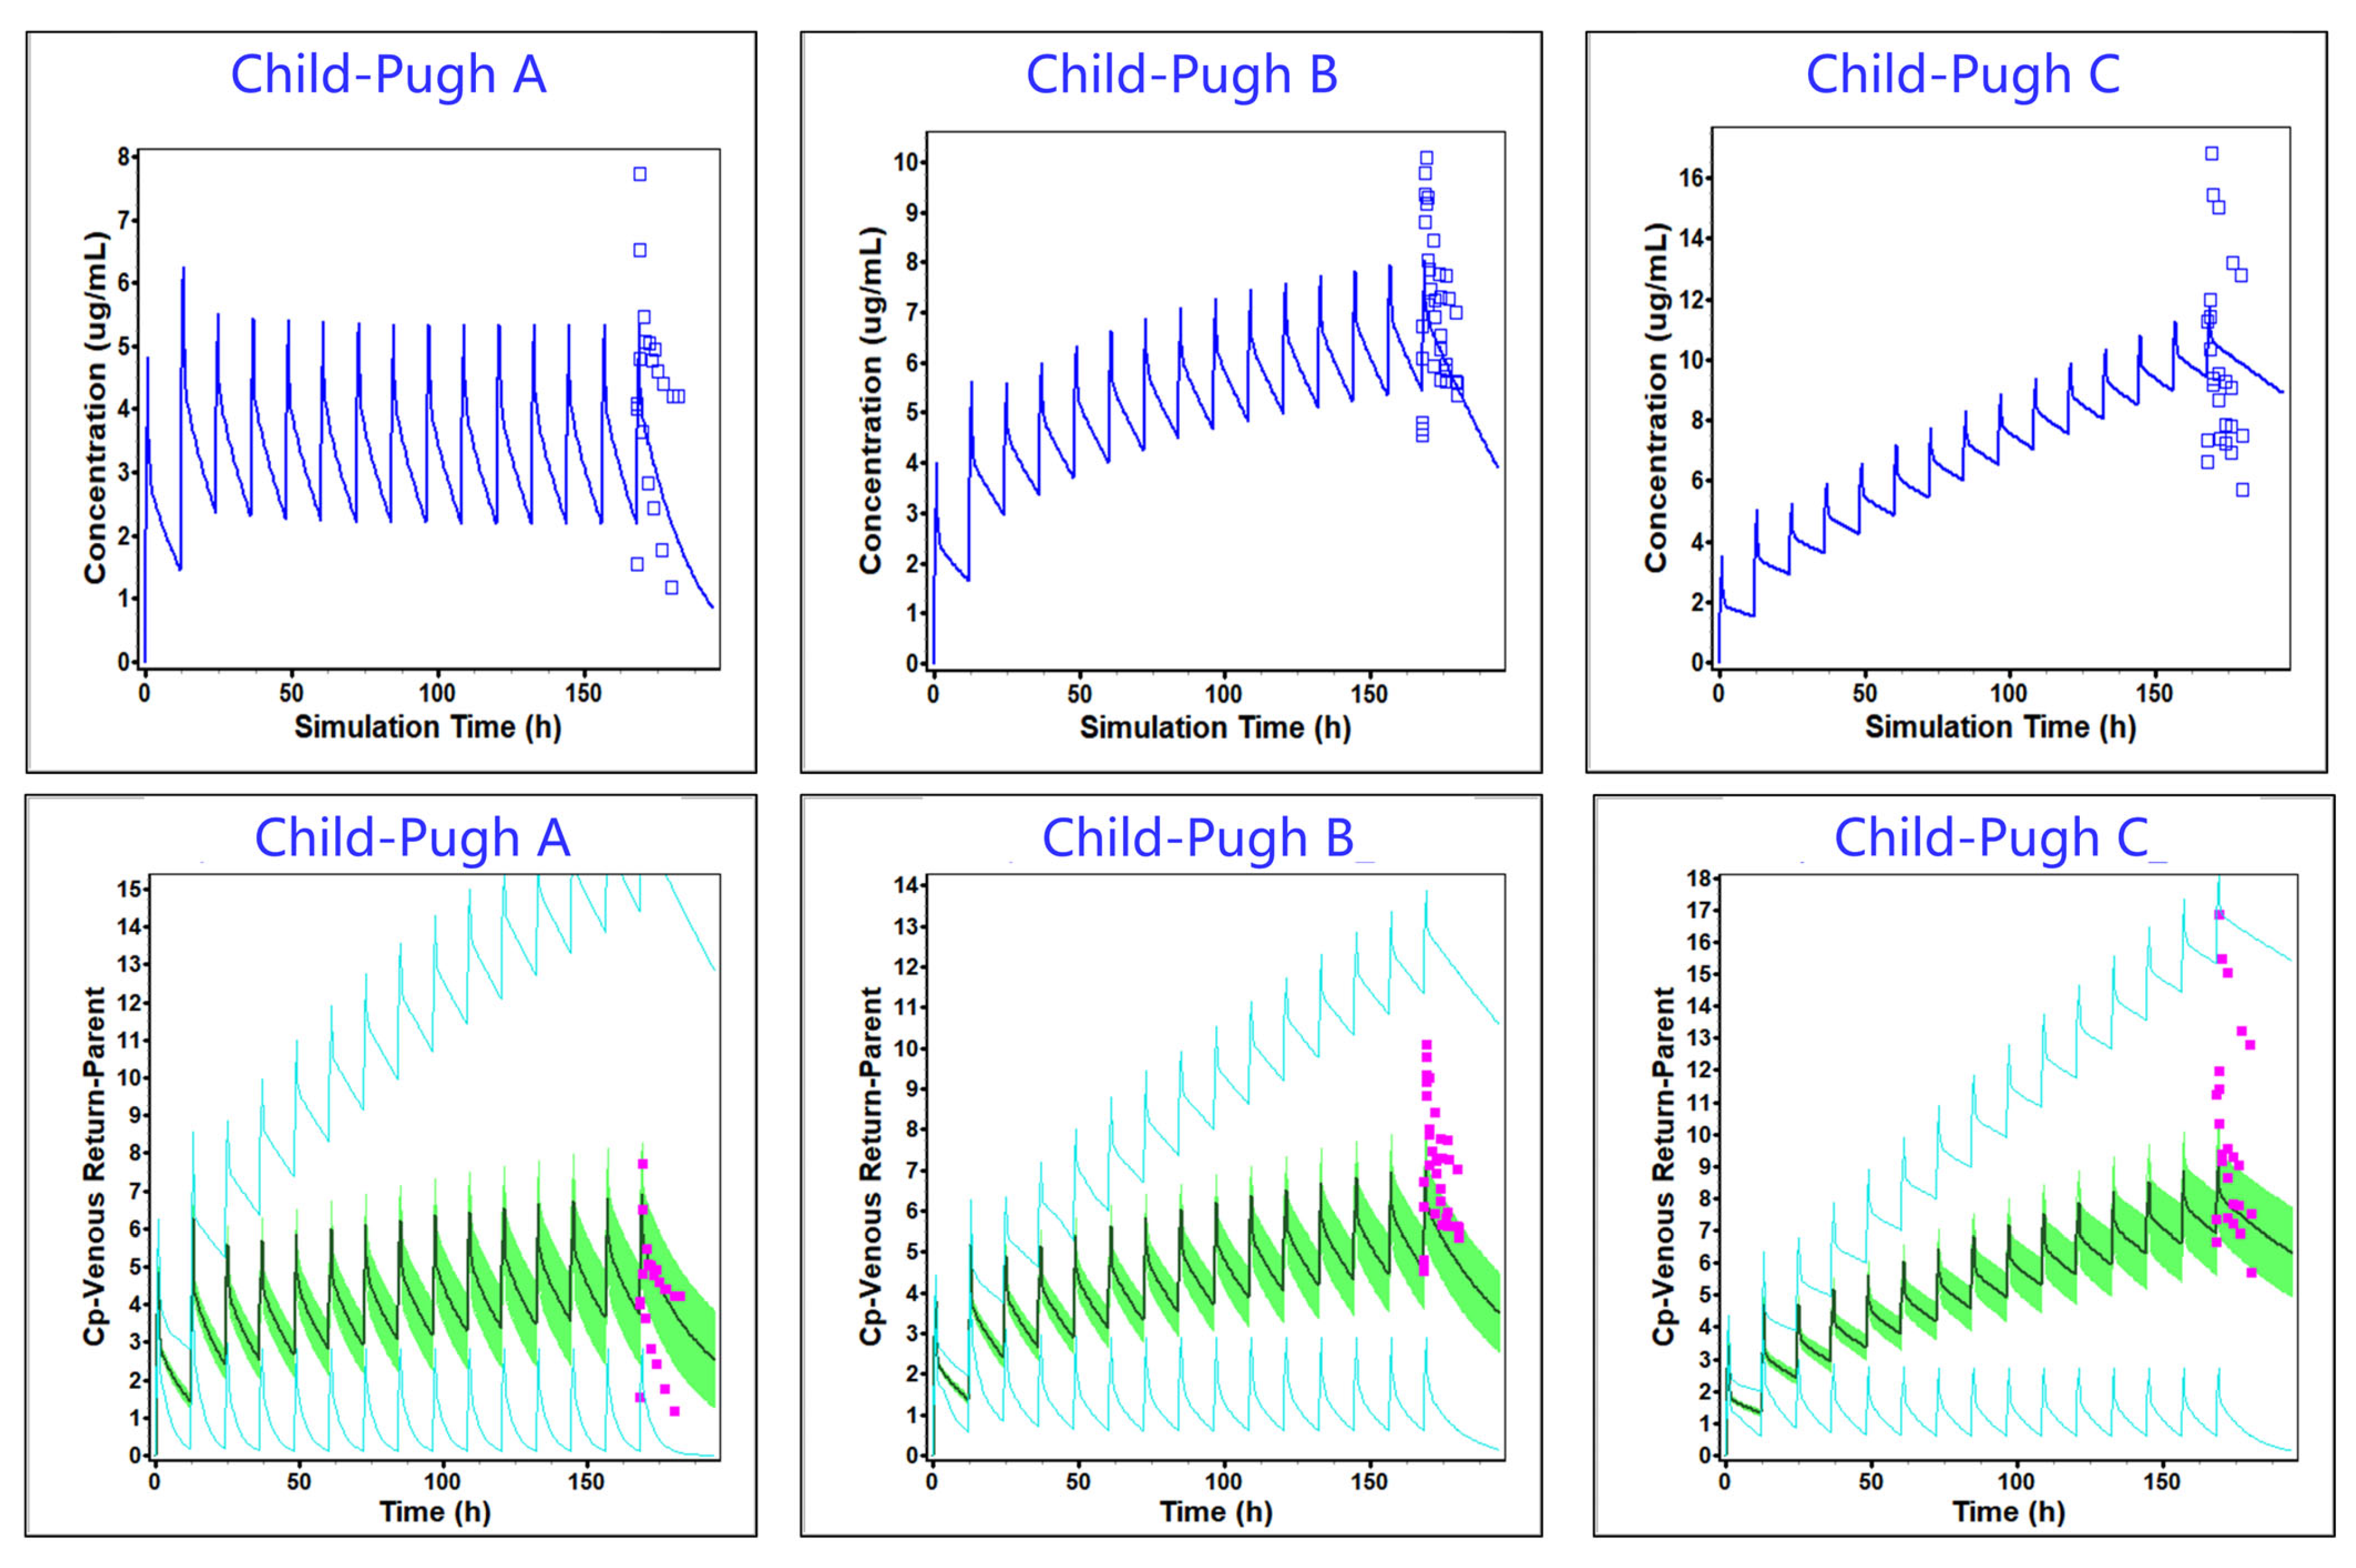
Figure 5 presents the mean plasma concentration-time curves and population simulation results following multiple intravenous doses of voriconazole in adults with hepatic impairment. Table 1 summarizes the FE and the GMFE values for multiple intravenous voriconazole doses in adults with hepatic impairment. The FE values ranged from 0.8 to 1.9 and all GMFE values were below 2.0. All observed voriconazole concentrations after intravenous dosing fell within the 95% prediction interval of the model, indicating acceptable predictive performance. Specifically, compared with healthy adults, under the same dosing regimen, the AUC values were 1.79-fold, 3.41-fold, and 6.97-fold higher in patients with Child-Pugh class A, Child–Pugh class B, and Child-Pugh class C hepatic impairment, respectively.
Figure 5.
Observed and predicted plasma concentration-time curves of intravenous voriconazole in adults with hepatic impairment from the published literature. For each Child-Pugh type of patient, the blue curve represents the individual model-predicted plasma concentration–time profile, and the small squares represent the observed plasma concentrations from that patient. The black curve represents the mean predicted plasma concentration (Mean Cp-Venous Return) from the population simulation based on the literature model. In the population simulation, the green shaded area represents the 90% confidence interval (90% C.I. mean Cp-Venous Return); the pink squares represent the observed mean concentrations (Observed Mean); the blue upper and lower curves represent the 95% probability interval (Probability 95%).
Table 1.
Observed and predicted plasma concentrations of voriconazole in adult patients with Child–Pugh class A, B and C (development and internal validation).
3.5. Independent Validation of the PBPK Model of Voriconazole in Hospitalized Pediatric Patients with Hepatic Impairment
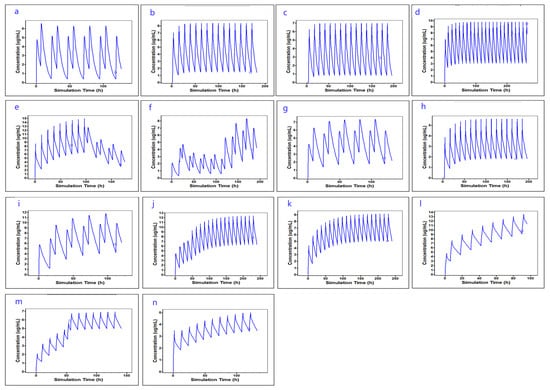
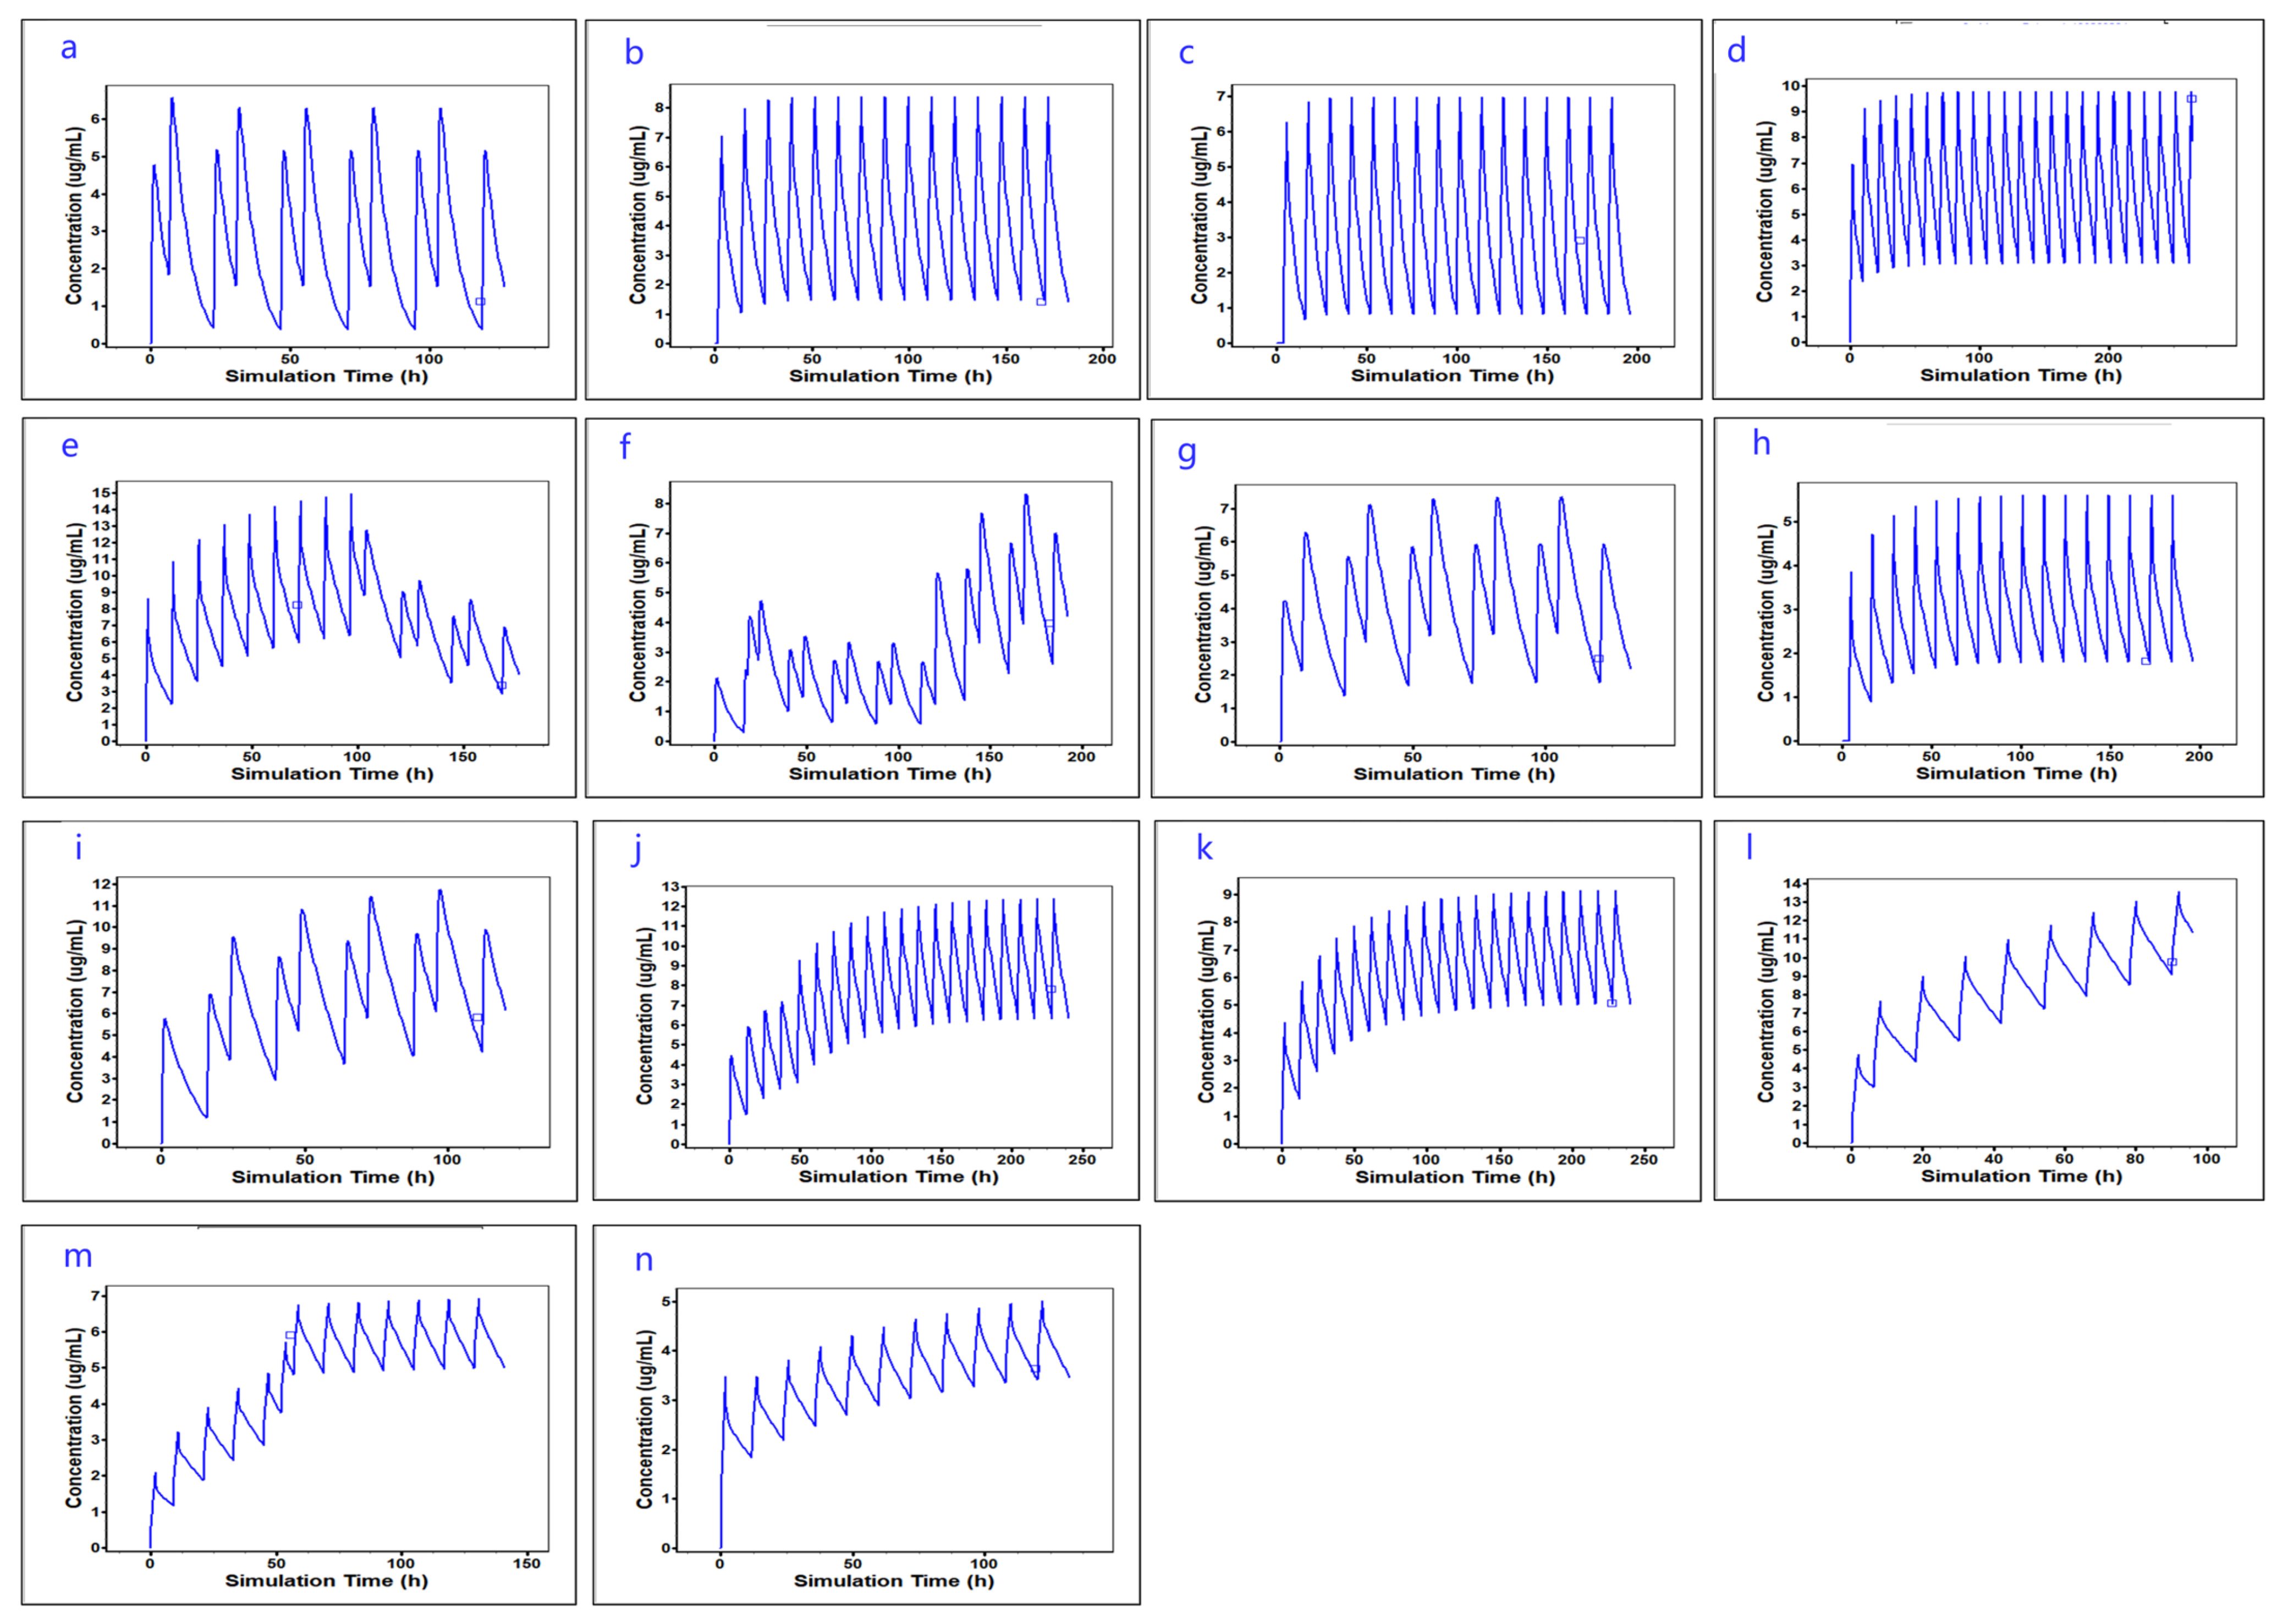
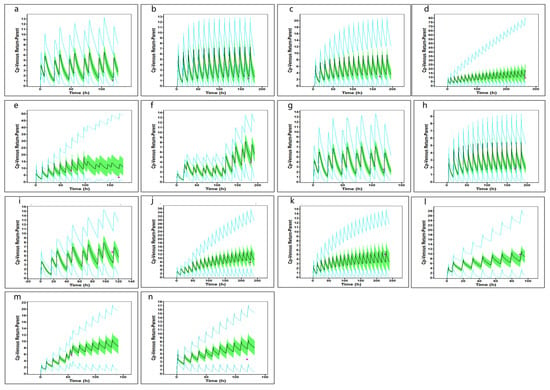
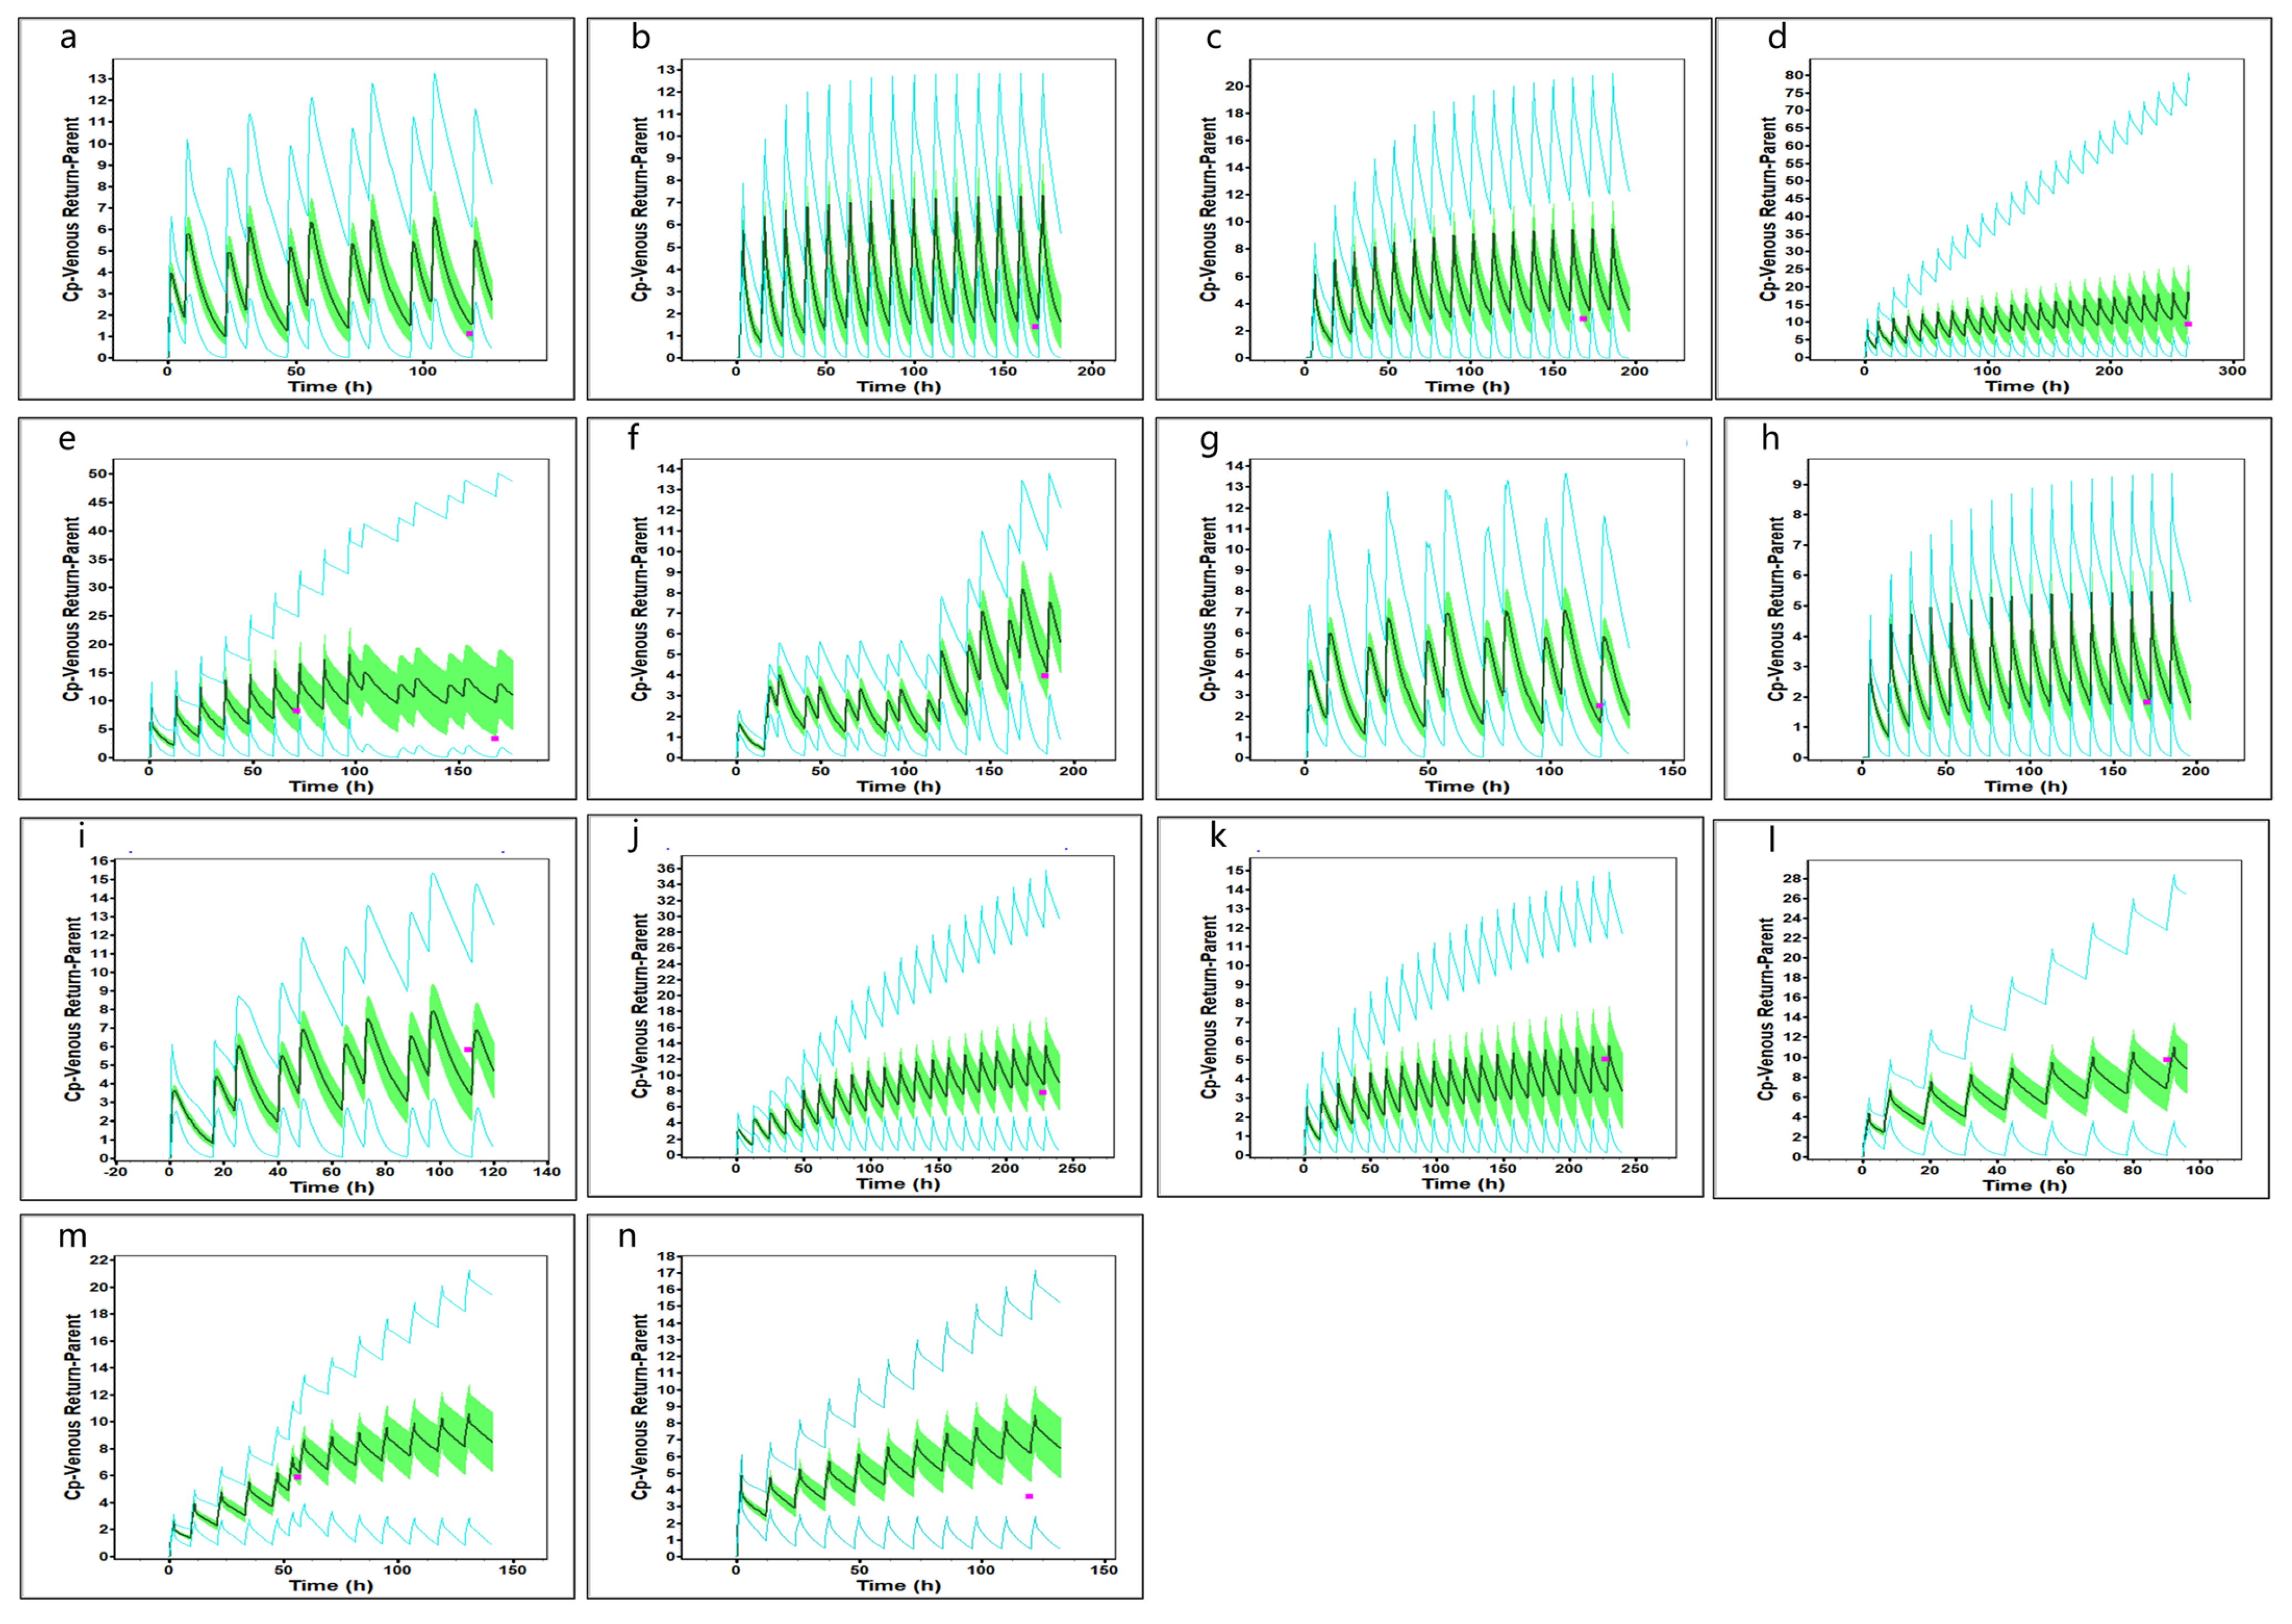
Figure 6 shows the mean plasma concentration-time curves after multiple voriconazole doses in the 14 hospitalized pediatric patients with Child-Pugh class A or B hepatic impairment. Table 2 summarizes the FE and MAPE for this population across different dosing regimens: FE values ranged from 0.6 to 1.4, and MAPE was 6.5%, indicating that the model performed well in this group. The population simulation results are presented in Figure 7. After voriconazole dosing, all observed Cmin concentrations in hospitalized pediatric patients with hepatic impairment fell within the 95% prediction interval of the model, indicating acceptable predictive performance. Based on model-predicted AUC values, the AUC increased by 49–83% for Child-Pugh class A and by 74–86% for Child-Pugh class B compared with pediatric patients with normal hepatic function.
Figure 6.
Observed and predicted plasma concentration-time curves of voriconazole in hospitalized pediatric patients with hepatic impairment. (a–h) Child–Pugh class A. (i–n) Child–Pugh class B. (a) Patient a: the blue curve represents the individual model-predicted plasma concentration–time profile, and the small squares represent the observed plasma concentrations from that patient. (b) Patient b: Same as (a), but for Patient b. (c) Patient c: Same as (a), but for Patient c. (d) Patient d: Same as (a), but for Patient d. (e) Patient e: Same as (a), but for Patient e. (f) Patient f: Same as (a), but for Patient f. (g) Patient g: Same as (a), but for Patient g. (h) Patient h: Same as (a), but for Patient h. (i) Patient i: Same as (a), but for Patient i. (j) Patient j: Same as (a), but for Patient j. (k) Patient k: Same as (a), but for Patient k. (l) Patient l: Same as (a), but for Patient l. (m) Patient m: Same as (a), but for Patient m. (n) Patient n: Same as (a), but for Patient n.
Table 2.
Observed and predicted plasma concentrations of voriconazole in hospitalized pediatric patients with hepatic impairment (independent validation dataset).
Figure 7.
Population simulation of voriconazole in hospitalized pediatric patients with hepatic impairment. (a–h) Child–Pugh class A. (i–n) Child–Pugh class B. (a) Patient a: The black curve represents the mean pre-dicted plasma concentration (Mean Cp-Venous Return) from the population simulation based on that individual patient model. For each patient, In the population simulation, the green shaded area represents the 90% confidence interval (90% C.I. mean Cp-Venous Return); the pink squares rep-resent the observed mean concentrations (Observed Mean); the black curve represents the mean predicted concentration (Mean Cp-Venous Return); and the blue upper and lower curves represent the 95% probability interval (Probability 95%). (b) Patient b: Same as (a), but for Patient b. (c) Patient c: Same as (a), but for Patient c. (d) Patient d: Same as (a), but for Patient d. (e) Patient e: Same as (a), but for Patient e. (f) Patient f: Same as (a), but for Patient f. (g) Patient g: Same as (a), but for Patient g. (h) Patient h: Same as (a), but for Patient h. (i) Patient i: Same as (a), but for Patient i. (j) Patient j: Same as (a), but for Patient j. (k) Patient k: Same as (a), but for Patient k. (l) Patient l: Same as (a), but for Patient l. (m) Patient m: Same as (a), but for Patient m. (n) Patient n: Same as (a), but for Patient n.
3.6. Pharmacodynamic Evaluation
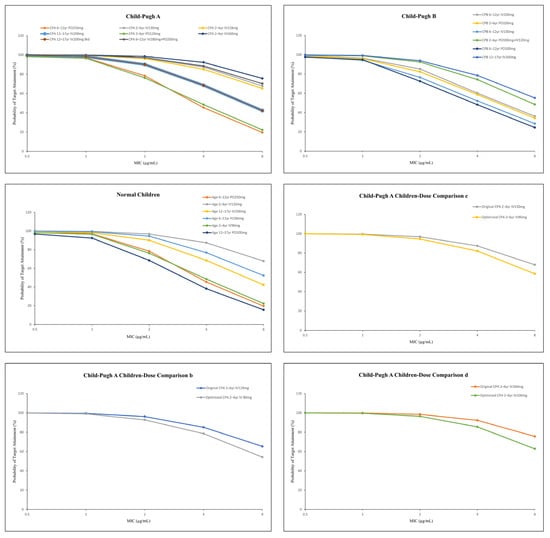
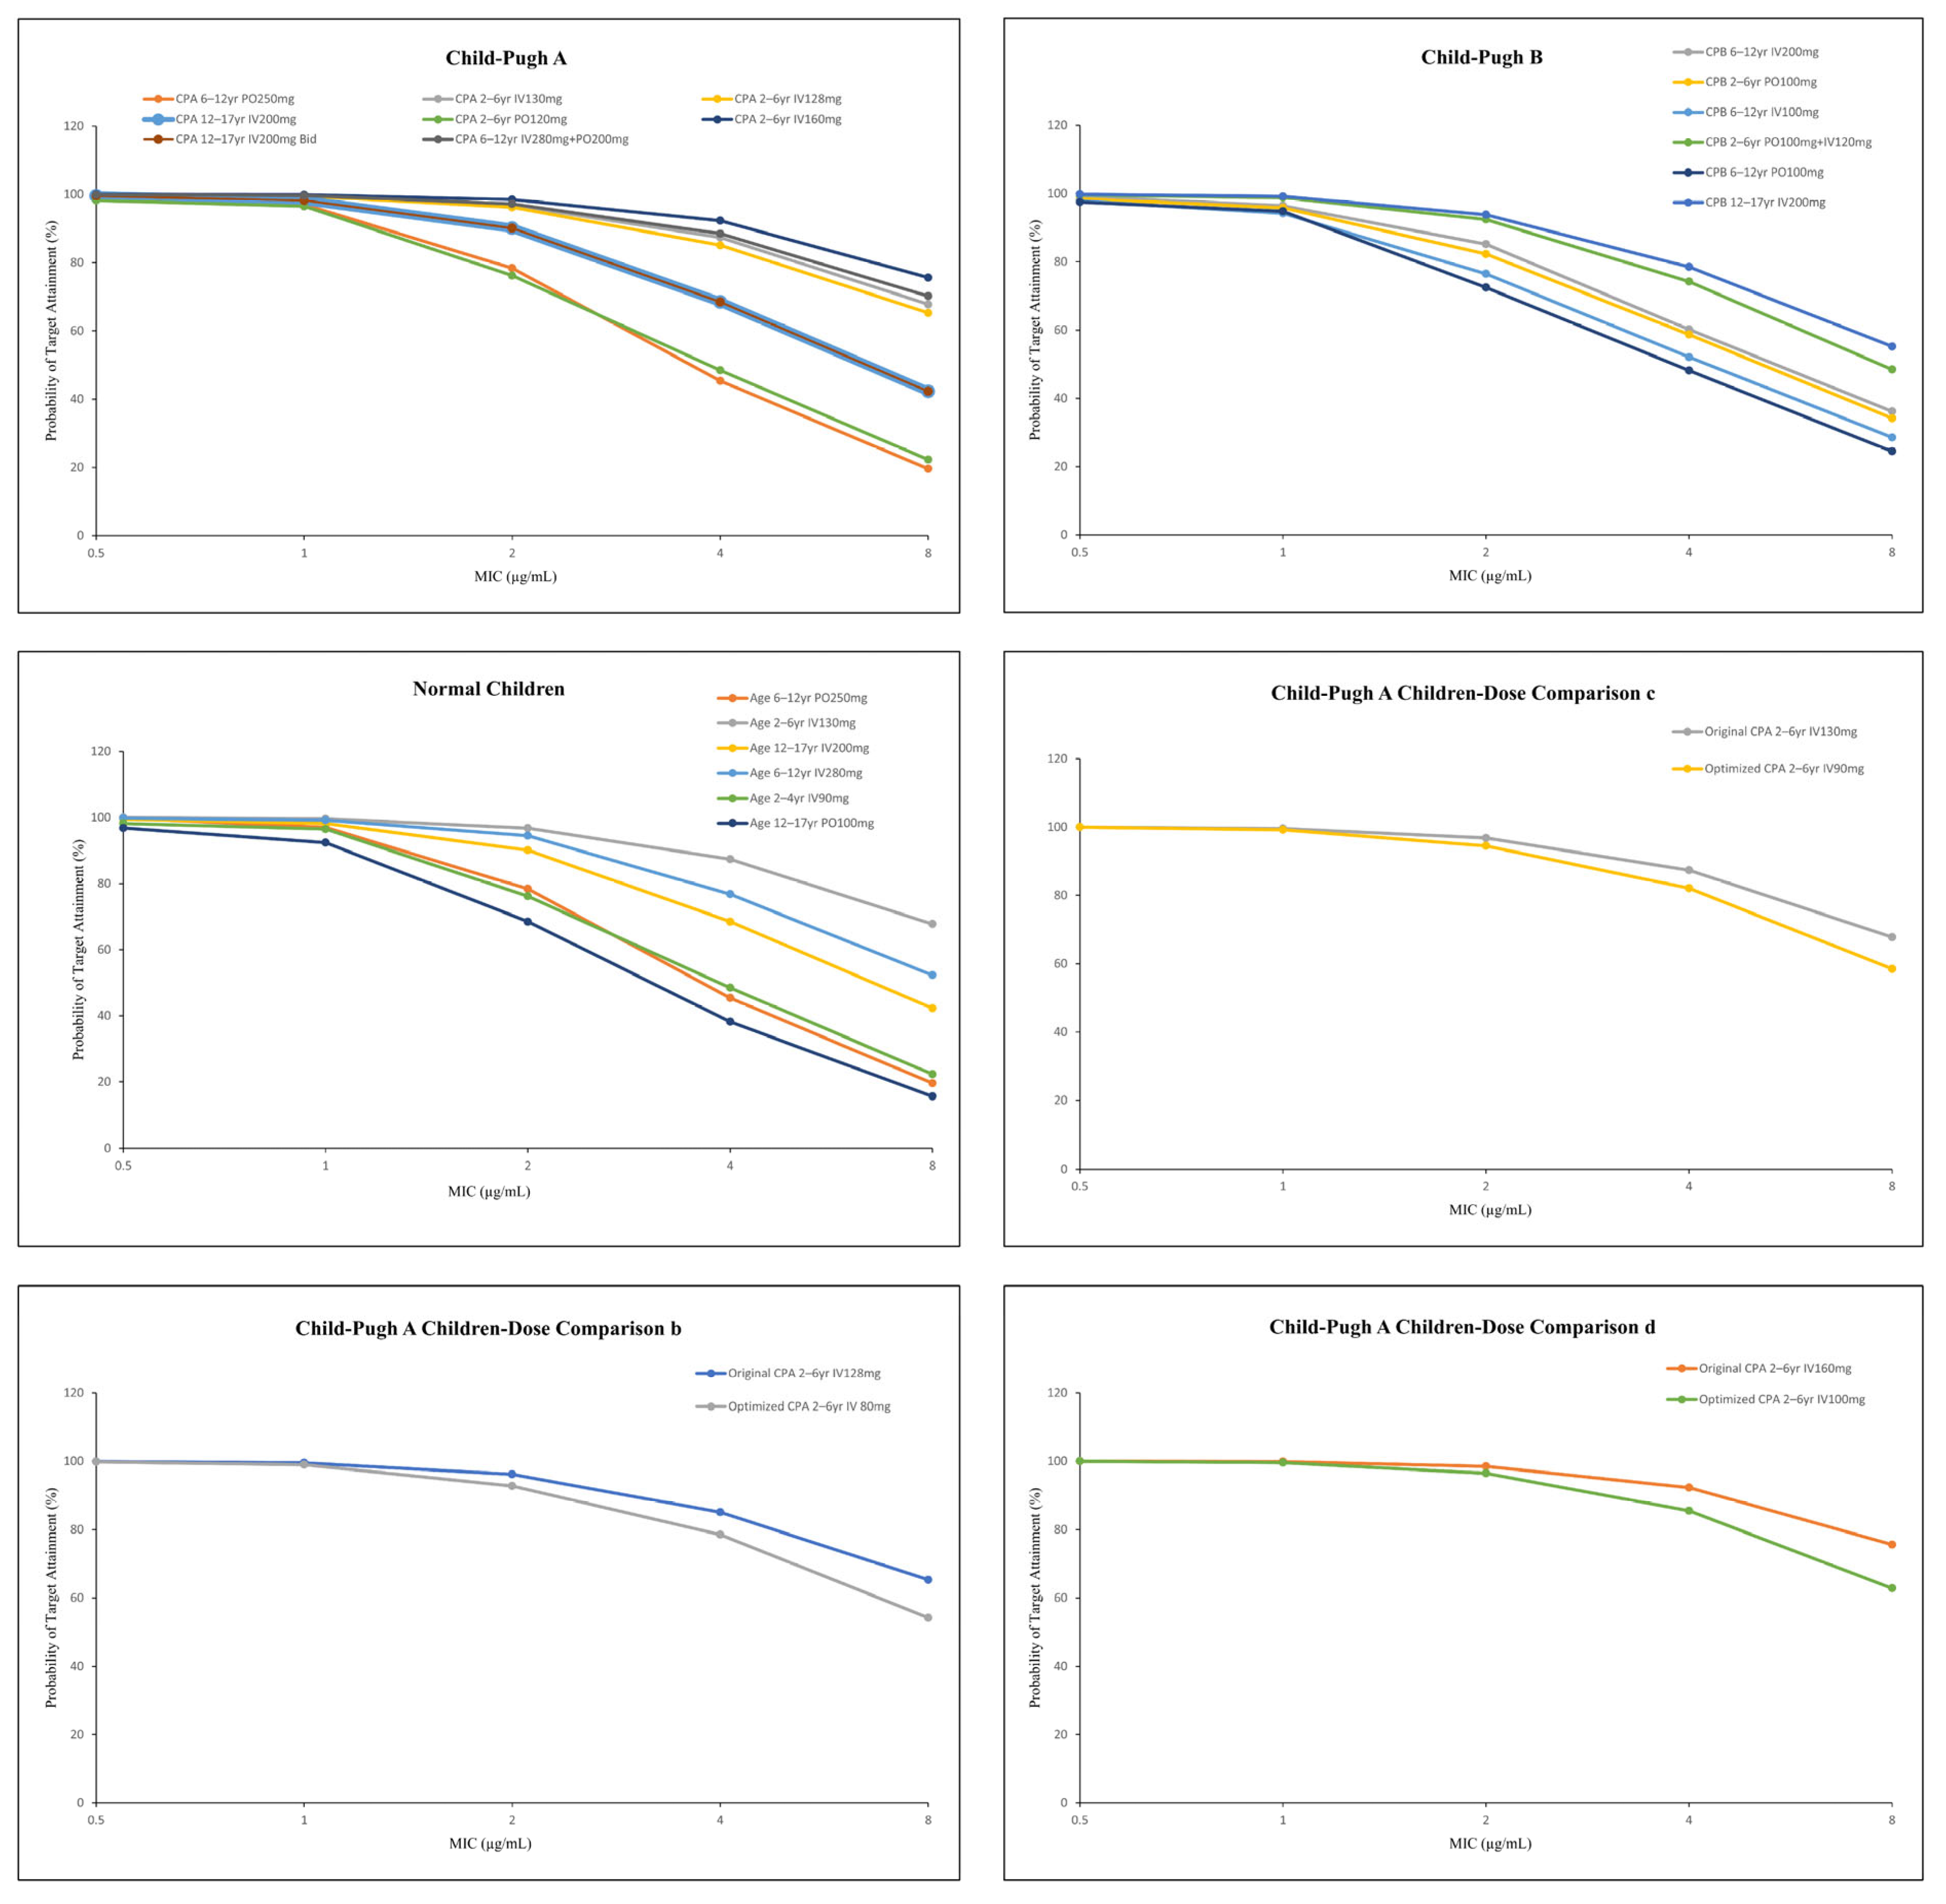
Pharmacodynamic evaluations were performed in pediatric inpatients with normal hepatic function and in those with Child-Pugh class A or B hepatic impairment. Figure 8 shows the pharmacodynamic evaluation results of the PBPK model in hospitalized pediatric patients receiving voriconazole. Based on PBPK model predictions, dosing regimens with higher exposure risk were optimized for patients with Child-Pugh class A. PTA was simulated at MIC values of 0.5, 1, 2, 4, and 8 mg/L (Figure 8). At an MIC of 2 mg/L, the probability of target attainment (PTA, fAUC0−24 h/MIC ≥ 25) was ≥ 90% for the optimized regimens, and the predicted PTA for Child-Pugh class C was ≥ 80%. When MIC decreased below 2 mg/L, PTA further increased. When MIC increased to ≥4 mg/L, PTA decreased substantially for both regimens, suggesting that combination therapy or alternative antifungal agents should be considered for infections caused by pathogens with MIC ≥ 4 mg/L. Overall, at MIC ≤ 2 mg/L, PTA was ≥80% in all groups, indicating that the model can be used to predict voriconazole pharmacokinetics in the studied pediatric patients.
Figure 8.
Pharmacodynamic evaluation of voriconazole dosing regimens in hospitalized pediatric patients. PTA was simulated at MIC values of 0.5, 1, 2, 4, and 8 mg/L.
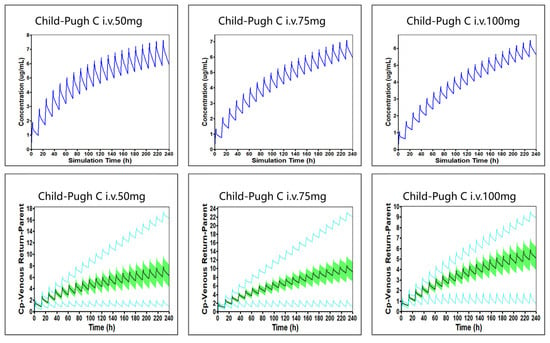
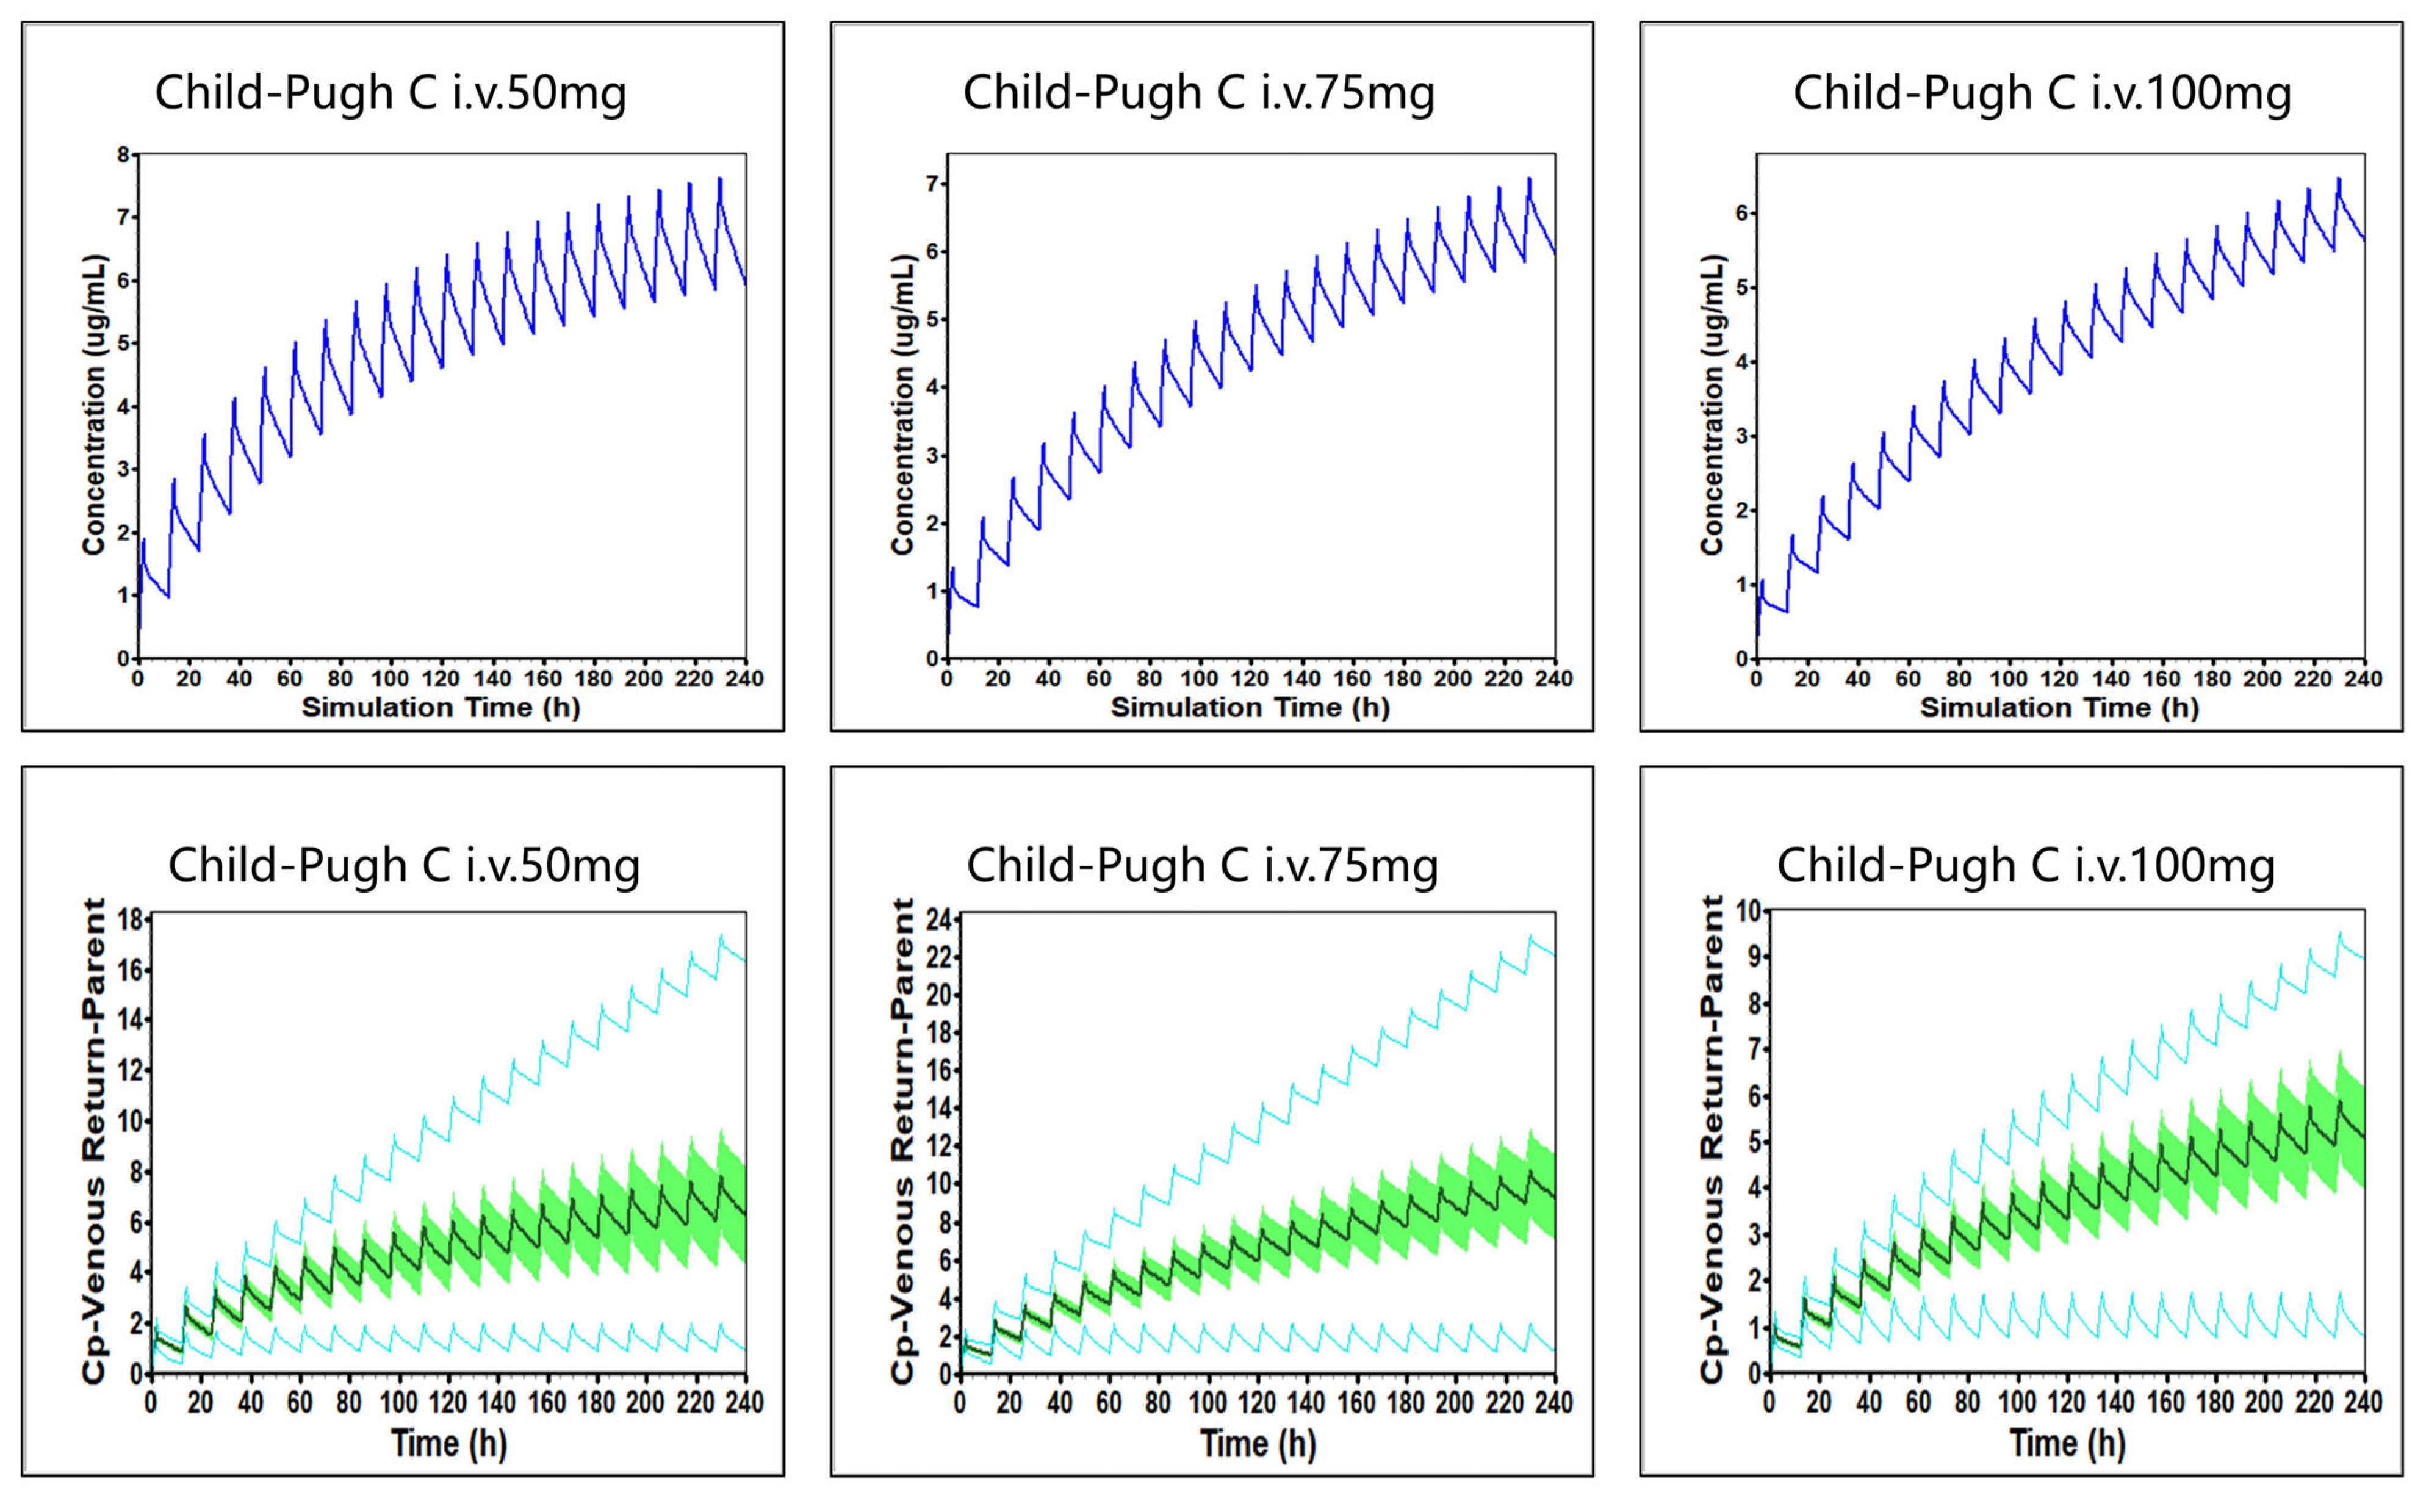
No hospitalized pediatric patients with Child-Pugh class C hepatic impairment were identified in our cohort. Therefore, a PBPK model for intravenous voriconazole was developed for this population by extrapolating from the existing adult and pediatric models. The predicted pharmacokinetic parameters were compared with published studies. In addition, a pharmacodynamic evaluation of the simulation results was conducted. Due to the lack of in-hospital data from pediatric patients with Child-Pugh class C hepatic impairment for model validation, the dose recommendations for this group were derived from adult model extrapolation. The predicted intravenous maintenance doses were: 50 mg q12 h for children aged 2–6 years, 75 mg q12 h for children aged 6–12 years, and 100 mg q12 h for children aged 12–17 years. As presented in Figure 9 and Table S10, at an MIC of 2 mg/L, 91.2%, 95.5%, and 97.8% of simulated pediatric patients receiving the recommended dosing regimens achieved the PK/PD targets, respectively.
Figure 9.
Model-predicted plasma concentration-time curves and population simulation of voriconazole in pediatric patients with Child–Pugh class C hepatic impairment. For different doses of virtual patients, the blue curve represents the individual model-predicted plasma concentration–time profile. The black curve represents the mean predicted plasma concentration (Mean Cp-Venous Return) from the population simulation based on the literature model. In the population simulation, the green shaded area represents the 90% confidence interval (90% C.I. mean Cp-Venous Return); the blue upper and lower curves represent the 95% probability interval (Probability 95%).
3.7. Parameter Sensitivity Analysis Results
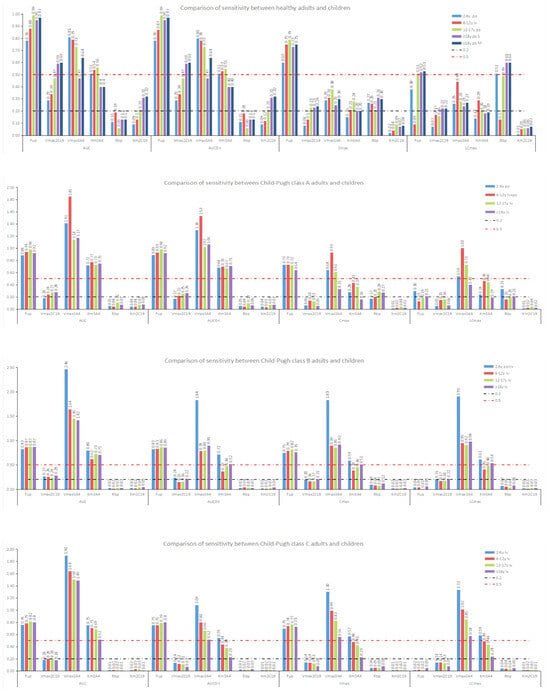
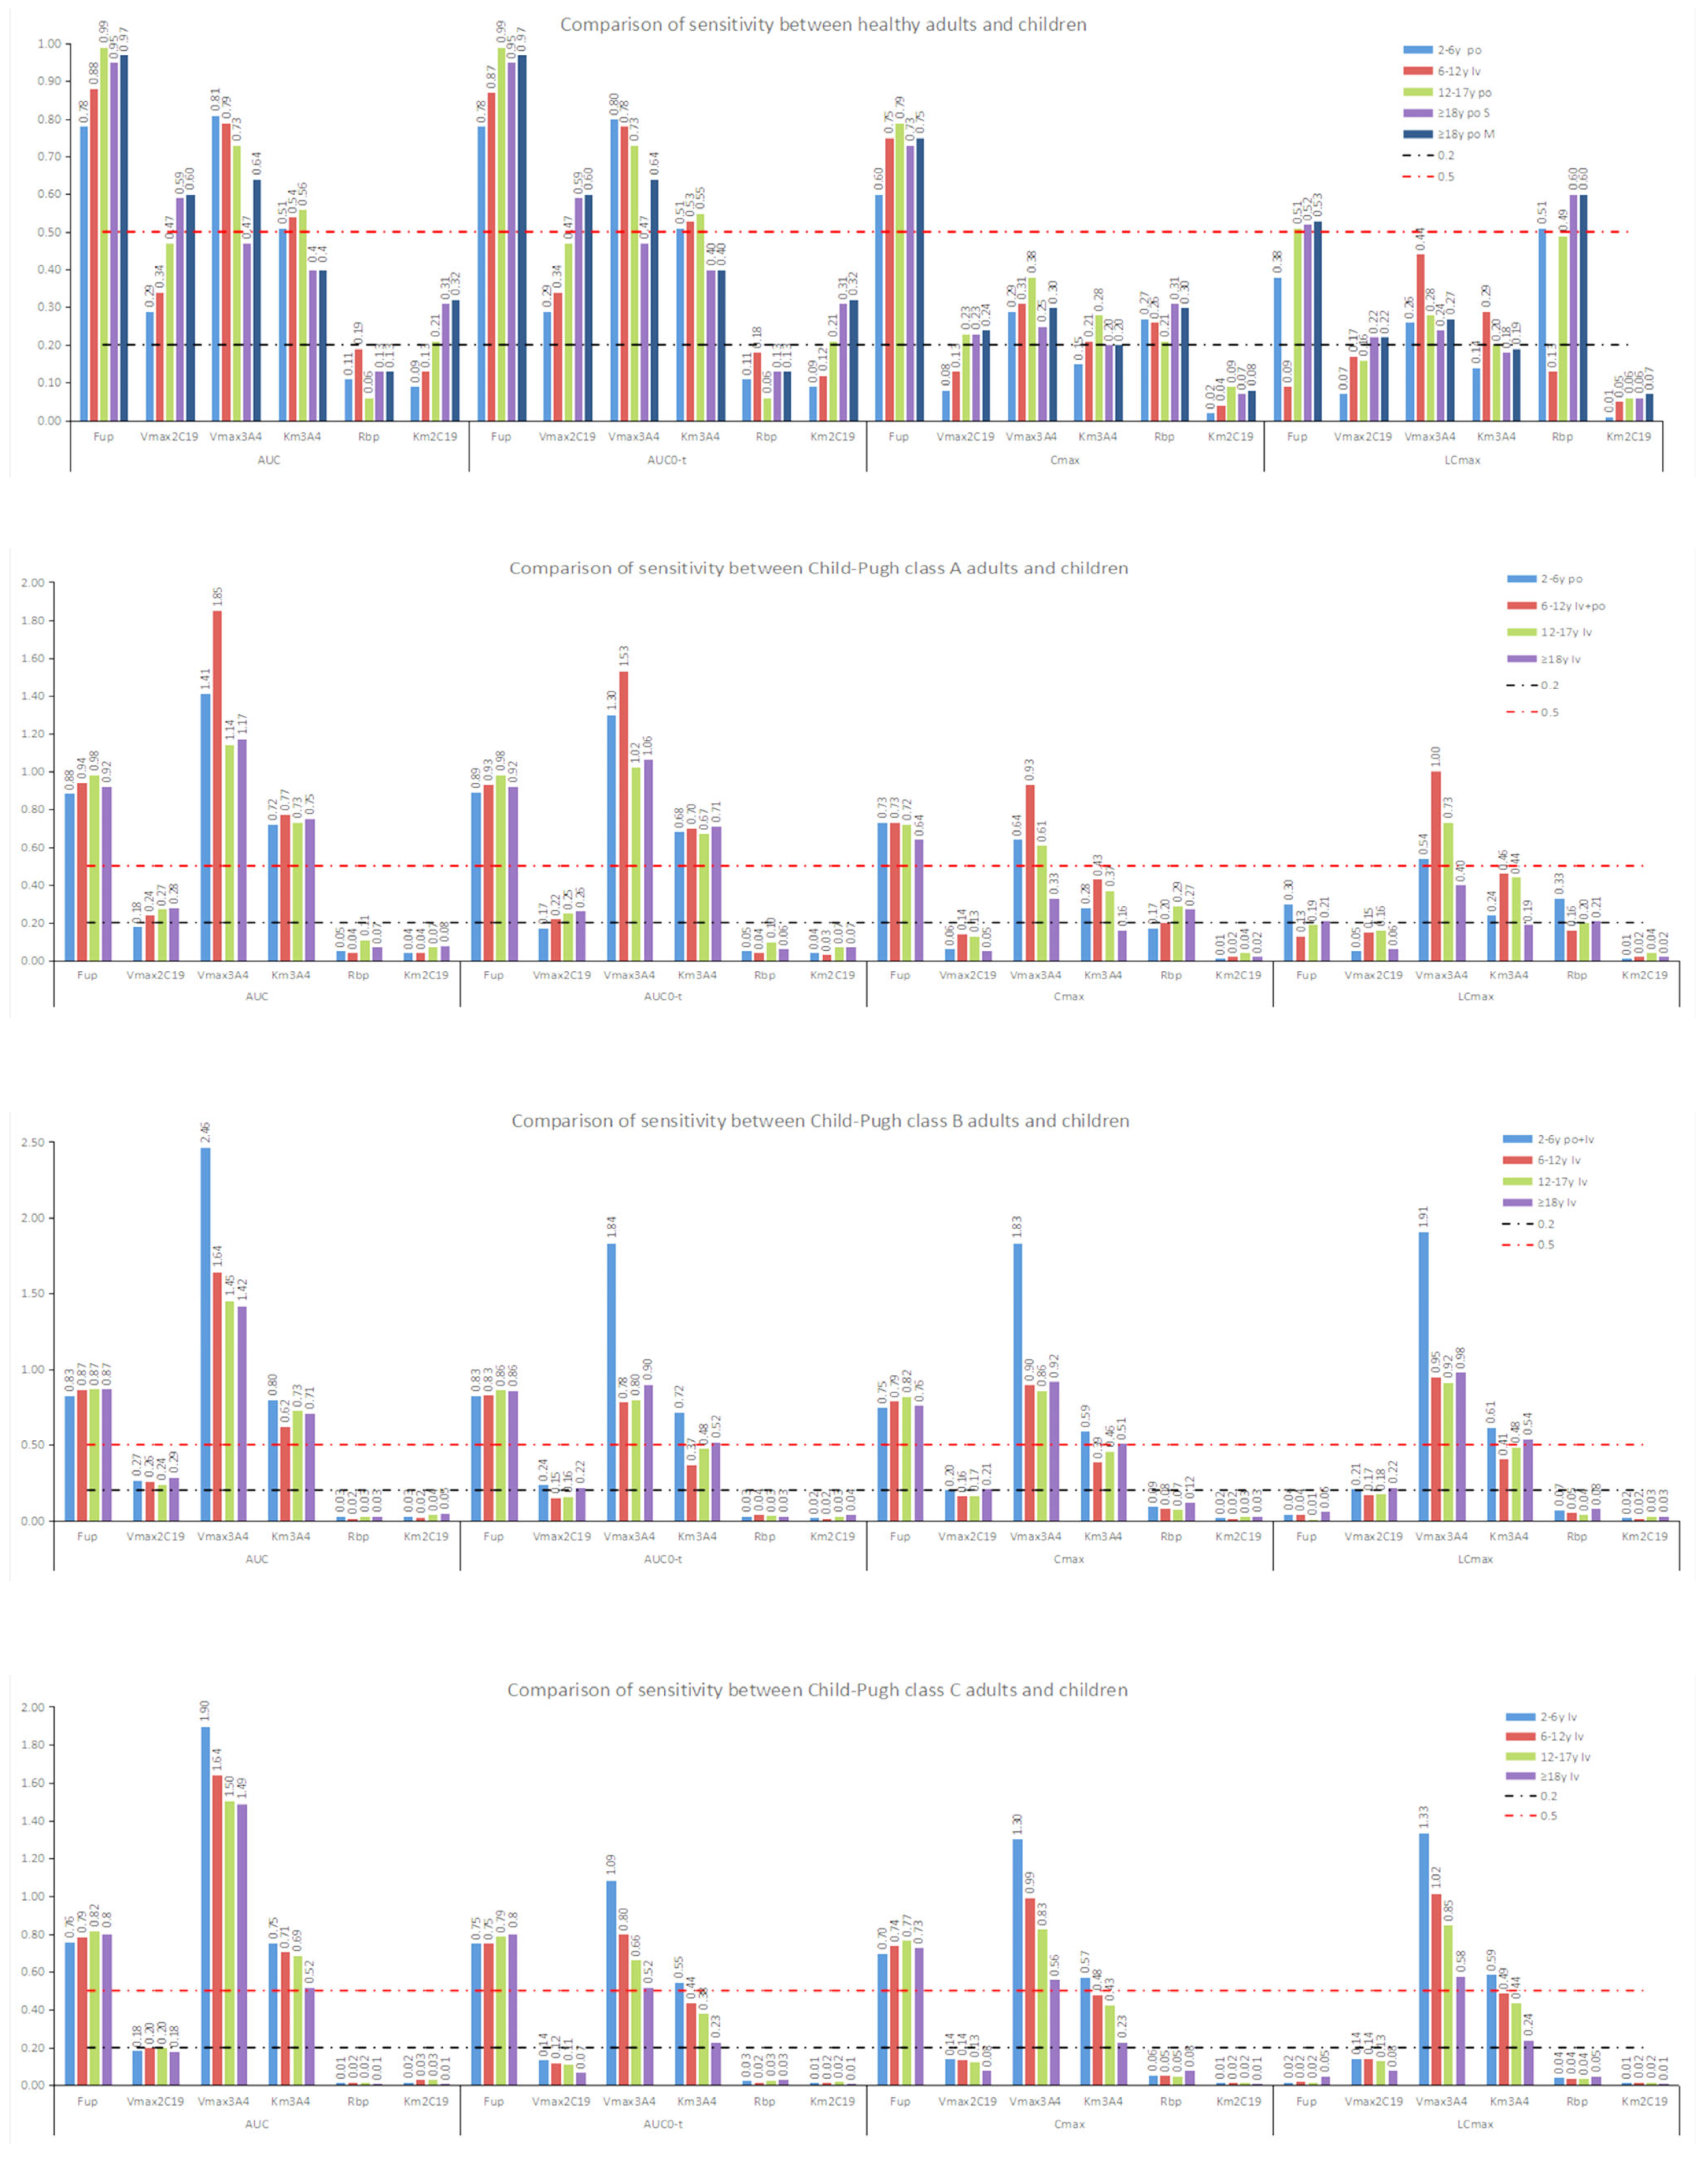
The results of the sensitivity analysis are shown in Figure 10. fup, Vmax,3A4, and Vmax,2C19 were identified as the three key parameters influencing the pharmacokinetic predictions of voriconazole, although their relative importance varied with disease state and age. fup exhibited high sensitivity across all populations and disease states. The sensitivity of Vmax,3A4 shifted from moderate in healthy subjects to high to extremely high in hepatic impairment. For Vmax,2C19, sensitivity dropped from high in the healthy subjects to low in those with hepatic impairment. In pediatric populations, Vmax,3A4 and Km,3A4 remained highly sensitive even in the healthy state, while adults showed this only after hepatic impairment. Rbp was moderately to highly sensitive only under complex dosing conditions; Peff influenced Tmax only after single oral doses; and Km,2C19 exhibited low to moderate sensitivity across all settings.
Figure 10.
Comparison of sensitivity analysis results across healthy individuals and patients with Child–Pugh class A, B, and C hepatic impairment.
4. Discussion
In this study, GastroPlus™ version 9.9 was used to construct PBPK models for voriconazole in healthy adults, adults with hepatic impairment, and children with normal or impaired liver function. Literature-derived data were used for model development and parameter optimization, while hospital TDM data from six children with normal hepatic function and 14 children with Child-Pugh class A or B hepatic impairment served as an independent clinical validation dataset. All hospitalized pediatric samples were TDM trough samples; therefore, model-predicted Cmin were compared with observed Cmin concentrations. The model was further applied to explore dose optimization for regimens associated with increased exposure risk. A pharmacodynamic evaluation based on the fAUC/MIC target provided supportive evidence for target attainment; the free fraction was assumed to be fixed in healthy subjects but disease-specific in patients with hepatic impairment. These findings are consistent with recent PBPK and clinical studies showing reduced voriconazole clearance and increased exposure in patients with hepatic impairment [6]. Overall, this model provides a quantitative framework for evaluating voriconazole exposure and proposing provisional dose adjustments in hepatic impairment, while the pediatric Child–Pugh C recommendation requires prospective validation.
Studies have shown that as hepatic impairment worsens, the AUC of voriconazole increases and its clearance decreases [6]. This is primarily attributed to reduced CYP enzyme abundance and activity, as well as an increase in the free fraction (fu) caused by hypoalbuminemia [38,39]. Child–Pugh-specific changes in liver volume, hepatic blood flow, cardiac output, glomerular filtration rate, and CYP enzyme abundance were incorporated into the hepatic impairment models; the scaling factors are summarized in Table S3 of the Supplementary Materials. CYP3A4 abundance decreases to 55% and 45% of normal in Child–Pugh B and C, respectively, whereas CYP2C19 remains relatively stable [25]. The pediatric PBPK models in this study were developed primarily using data from immunocompromised children, in whom inflammatory factors may reduce baseline CYP enzyme activity [40,41,42,43]. A recent 3D human liver spheroid study showed that IL-1β, IL-6, and TNFα rapidly downregulate CYP3A4 and, to a lesser extent, CYP2C19 [43], supporting the possibility that baseline CYP activity is lower in immunocompromised children. Therefore, CYP3A4 TDI was included in the healthy adult and literature-based pediatric models, but not in the in-hospital pediatric models (normal hepatic function and hepatic impairment) or the adult hepatic impairment model; Table S1 of the Supplementary Materials provides the Ki/Kinact values and literature sources. CYP2C19 genetic polymorphisms were not incorporated into the pediatric or hepatic impairment models. Previous population pharmacokinetic studies suggest that CYP2C19 polymorphisms do not significantly affect voriconazole pharmacokinetics in patients with hepatic impairment, possibly because the reduction in enzyme activity caused by hepatic impairment outweighs the effect of the polymorphisms [44]. Currently, there is no reliable experimental evidence demonstrating the clinical relevance of FMO3 in the oxidative metabolism of voriconazole, and studies have shown only a weak correlation between FMO3 genotype and voriconazole plasma concentrations [45].
During model validation, the limited published pediatric data and the small hospital validation cohort contributed to relatively large discrepancies between predicted and observed data for a limited subset of dosing regimens. For the literature-derived pediatric model, the AUC FE in the 6 mg/kg followed by 8 mg/kg multiple-dose IV group was 2.054, exceeding the 2-fold acceptance criterion. In the single 3 mg/kg IV dose group, the AUC FE remained within the acceptable range, whereas the Cmax FE (1.941) approached but did not reach the 2.0-fold threshold. For the hospitalized pediatric validation dataset (n = 6), all available samples were TDM trough samples; therefore, model-predicted Cmin values at the actual sampling times were compared with observed Cmin values. Five of the six observed concentrations fell within the 95% prediction interval, and one fell near the upper boundary. However, because a wide prediction interval does not rule out bias, quantitative predictive performance was further evaluated (FE = 0.993, PE = −0.71%). Due to sparse clinical sampling, AUC values for these children were model-simulated rather than experimentally observed. Table S4 and Table S5 summarizes the sampling design, including dosing history, dosing intervals, route of administration, and time from dosing to blood collection; because this was a retrospective study, the duration of intravenous infusion was not recorded in the medical records. The pediatric hepatic impairment model may also be subject to bias, as children in clinical settings often have multiple comorbidities. Although patients receiving concomitant CYP inhibitors or inducers were excluded, it remains challenging to isolate the specific effects of hepatic impairment on voriconazole pharmacokinetics. These limitations are consistent with recent pediatric PBPK studies, which highlight the impact of sparse sampling, disease state, and uncertainty in CYP3A4 ontogeny on predictive performance and the need for validation against independent data [46,47].
Based on model predictions, this study proposes dose optimization for regimens associated with a significant increase in voriconazole exposure and, using adult hepatic impairment regimens as a reference, provides provisional intravenous dosing recommendations for pediatric patients with Child-Pugh class C hepatic impairment. The pharmacodynamic endpoint was fAUC0–24 h/MIC ≥ 25. Free AUC was calculated using a fixed fu in healthy subjects and disease-specific fu in patients with hepatic impairment. Because PTA is highly dependent on MIC, the high predicted PTA at MIC = 2 mg/L should be interpreted with caution; future simulations should evaluate clinically relevant MIC values below and above 2 mg/L. However, these recommendations lack direct pediatric pharmacokinetic data for validation, primarily because few pediatric patients with Child-Pugh class C hepatic impairment received voriconazole monotherapy, and most received concomitant CYP inhibitors or inducers and were excluded. A systematic review [48] recommended dose reduction, extended intervals, and TDM for Child-Pugh class C patients, with a typical adult regimen of 200 mg loading followed by 100 mg maintenance. Therefore, the proposed pediatric Child-Pugh class C doses should be considered provisional and require prospective validation with TDM.
There were several limitations to this study. First, this was a retrospective, single-center study with a limited sample size, which may affect the generalizability of the findings. Second, the number of pediatric patients with Child-Pugh class C hepatic impairment who received voriconazole monotherapy was very small, because most received concomitant CYP450 inhibitors or inducers and were excluded. Consequently, the dose recommendations for the pediatric Child-Pugh class C model were derived from theoretical extrapolation of adult hepatic impairment models, which introduced inherent uncertainty; these recommendations should therefore be considered provisional and require prospective validation with TDM. Third, CYP2C19 genotype data were unavailable because this was a retrospective study and no local genotyping platform for pediatric voriconazole was available at that time; all hospitalized pediatric patients lacked CYP2C19 genotype data. A genotyping platform will be established in the future to support prospective genotype-guided dosing studies when conditions permit. FMO3 was also not included in the models. Fourth, the physiological parameters for children with hepatic impairment (e.g., hepatic blood flow, enzyme abundance, and plasma protein) were obtained from software default values or published data rather than direct patient measurements; the Child-Pugh-specific scaling factors are summarized in Table S3. Fifth, clinical sampling was sparse, and all available hospital samples were TDM trough samples; Cmax was not available, AUC values were model-simulated, and the duration of intravenous infusion was not recorded because of the retrospective design. Sixth, the validation dataset was limited, and although the observed concentrations largely fell within the 95% prediction interval, a wide prediction interval cannot completely exclude bias; quantitative predictive performance was evaluated using FE, PE, and MAPE for the hospital dataset, and FE and GMFE for the literature dataset. Seventh, the adult hepatic impairment model was developed and internally validated using the same literature dataset, which may lead to optimistic performance estimates; independent external validation is needed. Eighth, albumin, renal function, and inflammatory status were not fully accounted for, making it difficult to isolate the specific contribution of hepatic impairment to voriconazole pharmacokinetics; these data were incompletely recorded in the medical records, and the PBPK software (GastroPlus™ version 9.9) could not incorporate inflammatory markers or albumin, which would be better addressed by population pharmacokinetic analysis. Ninth, although sensitivity analyses were performed for key model parameters such as CYP2C19 Vmax, a separate quantitative sensitivity analysis for the inclusion or exclusion of CYP3A4 TDI was not performed. CYP3A4 TDI was included in the healthy adult and literature-based pediatric models but not in the in-hospital pediatric models (normal hepatic function and hepatic impairment) or the adult hepatic impairment model, because changes in enzyme abundance and the lack of genotype data made it difficult to accurately assess the impact of TDI. Tenth, PTA was simulated across MIC 0.5–8 mg/L; at MIC ≥ 4 mg/L, PTA decreased substantially, suggesting that combination therapy or alternative antifungal agents should be considered. Future multicenter prospective studies with TDM, CYP2C19 genotyping, inflammatory markers, free drug monitoring, and quantitative sensitivity analyses are needed.
5. Conclusions
PBPK models of voriconazole were established and validated for pediatric and adult patients with hepatic impairment using GastroPlus™ version 9.9. The models demonstrated satisfactory predictive performance. For the literature datasets, the FE values ranged from 0.6 to 2.0, with GMFE < 2.0. For the in-hospital pediatric datasets, the MAPE values were 15.13% and 17.27% for children with normal hepatic function and children with hepatic impairment, respectively. Simulations showed that, compared with children with normal hepatic function, the AUC of voriconazole increased by 49–83% in children with Child-Pugh class A and by 74–86% in children with Child-Pugh class B. Based on the model outputs, a dose optimization strategy was developed, and specific dose recommendations for Child-Pugh class C patients were derived by extrapolation from the adult model (e.g., 50 mg IV q12 h for patients aged 2–6 years, 75 mg IV q12 h for patients aged 6–12 years, and 100 mg IV q12 h for patients aged 12–17 years). Pharmacodynamic evaluation showed that the PTA was ≥ 80% when MIC ≤ 2 mg/L. This study has several limitations, including its single-center design, small sample size, and the lack of CYP2C19 genotyping data. Future research should incorporate CYP2C19 genotyping and inflammatory markers into voriconazole PBPK modeling, conduct multicenter studies, and combine in vitro and in vivo experiments to further refine and enrich voriconazole PBPK research.
Supplementary Materials
The following supporting information can be downloaded at: https://www.mdpi.com/article/10.3390/pharmaceutics18111359/s1, Table S1: Summary of input parameters of the voriconazole PBPK model; Table S2: Summary of datasets used for model development, parameter optimization, and independent validation; Table S3: Quantitative information on physiological changes incorporated into the PBPK models for hepatic impairment; Table S4: Summary of clinical information for hospitalized pediatric patients with normal hepatic function; Table S5: Summary of clinical information for hospitalized pediatric patients with hepatic impairment; Table S6: Summary of clinical information from literature datasets used for model development and validation; Table S7: Observed and predicted pharmacokinetic parameters of voriconazole in healthy adults; Table S8: Observed and Predicted Pharmacokinetic Parameters of Voriconazole in Pediatric Patients from Published Literature; Table S9: Observed and Predicted Plasma Concentrations of Voriconazole in Hospitalized Pediatric Patients with Normal Hepatic Function; Table S10: Model-extrapolation simulation and prediction data for pediatric patients with Child-Pugh Class C hepatic impairment.
Author Contributions
Conceptualization, Y.J. and L.S.; methodology, Y.Y.; software, Y.Y.; validation, Y.Y.; formal analysis, Y.Y.; investigation, Y.Y., J.L., L.Z. and F.Z.; data curation, Y.Y.; writing—original draft preparation, Y.Y.; writing—review and editing, L.S.; supervision, Y.J. and L.S.; project administration, Y.J. All authors have read and agreed to the published version of the manuscript.
Funding
This research received no external funding. The APC was funded by the authors’ institution.
Institutional Review Board Statement
The study was conducted in accordance with the Declaration of Helsinki and approved by the Ethics Committee of Children’s Hospital of Chongqing Medical University (Approval No. [2026] Ethical Review (Clinical Research) No. 23).
Informed Consent Statement
Patient consent was waived due to the retrospective nature of the study using anonymized data.
Data Availability Statement
The data presented in this study are available on request from the corresponding author due to patient privacy restrictions.
Conflicts of Interest
The authors declare no conflicts of interest.
References
- Theuretzbacher, U.; Ihle, F.; Derendorf, H. Pharmacokinetic/pharmacodynamic profile of voriconazole. Clin. Pharmacokinet. 2006, 45, 649–663. [Google Scholar] [CrossRef] [Scilit]
- Schulz, J.; Kluwe, F.; Mikus, G.; Michelet, R.; Kloft, C. Novel insights into the complex pharmacokinetics of voriconazole: A review of its metabolism. Drug Metab. Rev. 2019, 51, 247–265. [Google Scholar] [CrossRef] [Scilit]
- Friberg, L.E.; Ravva, P.; Karlsson, M.O.; Liu, P. Integrated population pharmacokinetic analysis of voriconazole in children, adolescents, and adults. Antimicrob. Agents Chemother. 2012, 56, 3032–3042. [Google Scholar] [CrossRef] [Scilit]
- Schulz, J.; Thomas, A.; Saleh, A.; Mikus, G.; Kloft, C.; Michelet, R. Towards the Elucidation of the Pharmacokinetics of Voriconazole: A Quantitative Characterization of Its Metabolism. Pharmaceutics 2022, 14, 477. [Google Scholar] [CrossRef] [Scilit]
- Zhang, Y.; Hao, X.; Hou, K.; Hu, L.; Shang, J.; He, S.; Yang, C.; Huang, L.; Feng, Y. Impact of cytochrome P450 2C19 polymorphisms on the clinical efficacy and safety of voriconazole: An update systematic review and meta-analysis. Pharmacogenet. Genom. 2022, 32, 257–267. [Google Scholar] [CrossRef] [Scilit]
- Lin, X.B.; Huang, F.; Tong, L.; Xia, Y.Z.; Wu, J.J.; Li, J.; Hu, X.G.; Liang, T.; Liu, X.M.; Zhong, G.P.; et al. Pharmacokinetics of intravenous voriconazole in patients with liver dysfunction: A prospective study in the intensive care unit. Int. J. Infect. Dis. 2020, 93, 345–352. [Google Scholar] [CrossRef] [Scilit]
- Saleh, A.; Schulz, J.; Schlender, J.F.; Aulin, L.B.S.; Konrad, A.P.; Kluwe, F.; Mikus, G.; Huisinga, W.; Kloft, C.; Michelet, R. Understanding Voriconazole Metabolism: A Middle-Out Physiologically-Based Pharmacokinetic Modelling Framework Integrating In Vitro and Clinical Insights. Clin. Pharmacokinet. 2024, 63, 1609–1630. [Google Scholar] [CrossRef] [Scilit]
- Yun, J.; Bai, H.; Wang, Z.; Ma, Y.; Liu, W. Serum retinol binding protein as a novel marker for clearance and dosage optimization: Pharmacokinetics study of voriconazole in a cirrhosis population. Front. Pharmacol. 2025, 16, 1543323. [Google Scholar] [CrossRef] [Scilit]
- Mu, R.; Gao, J.; Wang, X.; Ling, J.; Hu, N.; Yang, H. Pharmacokinetics of CYP2C19- and CYP3A4-Metabolized Drugs in Cirrhosis Using a Whole-Body PBPK Approach. Pharmaceutics 2025, 17, 1582. [Google Scholar] [CrossRef] [Scilit]
- Cleary, Y.; Prasad, B.; Ogungbenro, K.; Gertz, M.; Galetin, A. Population Physiologically-Based Pharmacokinetic Modeling to Determine Ontogeny: A Quantitative Clinical Pharmacology Example in Pediatric Rare Disease. CPT Pharmacomet. Syst. Pharmacol. 2026, 15, e70174. [Google Scholar] [CrossRef] [Scilit]
- Zhang, Y.; Zhao, S.; Wang, C.; Zhou, P.; Zhai, S. Application of a Physiologically Based Pharmacokinetic Model to Characterize Time-dependent Metabolism of Voriconazole in Children and Support Dose Optimization. Front. Pharmacol. 2021, 12, 636097. [Google Scholar] [CrossRef] [Scilit]
- Subash, S.; Prasad, B. Age-Dependent Changes in Cytochrome P450 Abundance and Composition in Human Liver. Drug Metab. Dispos. 2024, 52, 1363–1372. [Google Scholar] [CrossRef] [Scilit]
- Gonnabathula, P.; Li, M.; Nagumalli, S.K.; Mehta, D.; Fairman, K. Applications of PBPK Modeling to Estimate Drug Metabolism and Related ADME Processes in Specific Populations. Pharmaceutics 2025, 17, 1207. [Google Scholar] [CrossRef] [Scilit]
- Freriksen, J.J.M.; van der Heijden, J.E.M.; de Hoop-Sommen, M.A.; Greupink, R.; de Wildt, S.N. Physiologically Based Pharmacokinetic (PBPK) Model-Informed Dosing Guidelines for Pediatric Clinical Care: A Pragmatic Approach for a Special Population. Paediatr. Drugs 2023, 25, 5–11. [Google Scholar] [CrossRef] [Scilit]
- Li, X.; Frechen, S.; Moj, D.; Lehr, T.; Taubert, M.; Hsin, C.H.; Mikus, G.; Neuvonen, P.J.; Olkkola, K.T.; Saari, T.I.; et al. A Physiologically Based Pharmacokinetic Model of Voriconazole Integrating Time-Dependent Inhibition of CYP3A4, Genetic Polymorphisms of CYP2C19 and Predictions of Drug-Drug Interactions. Clin. Pharmacokinet. 2020, 59, 781–808. [Google Scholar] [CrossRef] [Scilit]
- Beran, K.; Abrahamsson, B.; Charoo, N.; Cristofoletti, R.; Holm, R.; Kambayashi, A.; Langguth, P.; Parr, A.; Polli, J.E.; Shah, V.P.; et al. Biowaiver monographs for immediate-release solid oral dosage forms: Voriconazole. J. Pharm. Sci. 2025, 114, 660–680. [Google Scholar] [CrossRef] [Scilit]
- Purkins, L.; Wood, N.; Ghahramani, P.; Greenhalgh, K.; Allen, M.J.; Kleinermans, D. Pharmacokinetics and safety of voriconazole following intravenous- to oral-dose escalation regimens. Antimicrob. Agents Chemother. 2002, 46, 2546–2553. [Google Scholar] [CrossRef] [Scilit]
- Purkins, L.; Wood, N.; Greenhalgh, K.; Eve, M.D.; Oliver, S.D.; Nichols, D. The pharmacokinetics and safety of intravenous voriconazole—A novel wide-spectrum antifungal agent. Br. J. Clin. Pharmacol. 2003, 56, 2–9. [Google Scholar] [CrossRef] [Scilit]
- Purkins, L.; Wood, N.; Greenhalgh, K.; Allen, M.J.; Oliver, S.D. Voriconazole, a novel wide-spectrum triazole: Oral pharmacokinetics and safety. Br. J. Clin. Pharmacol. 2003, 56, 10–16. [Google Scholar] [CrossRef] [Scilit]
- Hohmann, N.; Kocheise, F.; Carls, A.; Burhenne, J.; Weiss, J.; Haefeli, W.E.; Mikus, G. Dose-Dependent Bioavailability and CYP3A Inhibition Contribute to Non-Linear Pharmacokinetics of Voriconazole. Clin. Pharmacokinet. 2016, 55, 1535–1545. [Google Scholar] [CrossRef] [Scilit]
- Walsh, T.J.; Karlsson, M.O.; Driscoll, T.; Arguedas, A.G.; Adamson, P.; Saez-Llorens, X.; Vora, A.J.; Arrieta, A.C.; Blumer, J.; Lutsar, I.; et al. Pharmacokinetics and safety of intravenous voriconazole in children after single- or multiple-dose administration. Antimicrob. Agents Chemother. 2004, 48, 2166–2172. [Google Scholar] [CrossRef] [Scilit]
- Walsh, T.J.; Driscoll, T.; Milligan, P.A.; Wood, N.D.; Schlamm, H.; Groll, A.H.; Jafri, H.; Arrieta, A.C.; Klein, N.J.; Lutsar, I. Pharmacokinetics, safety, and tolerability of voriconazole in immunocompromised children. Antimicrob. Agents Chemother. 2010, 54, 4116–4123. [Google Scholar] [CrossRef] [Scilit]
- Zhang, M.; You, X.; Ke, M.; Jiao, Z.; Wu, H.; Huang, P.; Lin, C. Prediction of Ticagrelor and its Active Metabolite in Liver Cirrhosis Populations Using a Physiologically Based Pharmacokinetic Model Involving Pharmacodynamics. J. Pharm. Sci. 2019, 108, 2781–2790. [Google Scholar] [CrossRef] [Scilit]
- Alsmadi, M.M.; Al-Daoud, N.M.; Jaradat, M.M.; Alzughoul, S.B.; Abu Kwiak, A.D.; Abu Laila, S.S.; Abu Shameh, A.J.; Alhazabreh, M.K.; Jaber, S.A.; Abu Kassab, H.T. Physiologically-based pharmacokinetic model for alectinib, ruxolitinib, and panobinostat in the presence of cancer, renal impairment, and hepatic impairment. Biopharm. Drug Dispos. 2021, 42, 263–284. [Google Scholar] [CrossRef] [Scilit]
- Drozdzik, M.; Lapczuk-Romanska, J.; Wenzel, C.; Szelag-Pieniek, S.; Post, M.; Skalski, Ł.; Kurzawski, M.; Oswald, S. Gene Expression and Protein Abundance of Hepatic Drug Metabolizing Enzymes in Liver Pathology. Pharmaceutics 2021, 13, 1334. [Google Scholar] [CrossRef] [Scilit]
- Johnson, T.N.; Boussery, K.; Rowland-Yeo, K.; Tucker, G.T.; Rostami-Hodjegan, A. A semi-mechanistic model to predict the effects of liver cirrhosis on drug clearance. Clin. Pharmacokinet. 2010, 49, 189–206. [Google Scholar] [CrossRef] [Scilit]
- U.S. Department of Health and Human Services (HHS); Food and Drug Administration (FDA); Center for Drug Evaluation and Research (CDER); Center for Biologics Evaluation and Research (CBER). Guidance for Industry: Pharmacokinetics in Patients with Impaired Hepatic Function: Study Design, Data Analysis, and Impact on Dosing and Labeling; U.S. Food and Drug Administration: Rockville, MD, USA, 2003. Available online: https://www.fda.gov/media/71311/download (accessed on 30 September 2026).
- Upreti, V.V.; Wahlstrom, J.L. Meta-analysis of hepatic cytochrome P450 ontogeny to underwrite the prediction of pediatric pharmacokinetics using physiologically based pharmacokinetic modeling. J. Clin. Pharmacol. 2016, 56, 266–283. [Google Scholar] [CrossRef] [Scilit]
- Xie, M.; Jiang, M.; Qiu, H.; Rong, L.; Kong, L. Optimization of Voriconazole Dosing Regimens Against Aspergillus Species and Candida Species in Pediatric Patients After Hematopoietic Cell Transplantation: A Theoretical Study Based on Pharmacokinetic/Pharmacodynamic Analysis. J. Clin. Pharmacol. 2023, 63, 993–1001. [Google Scholar] [CrossRef] [Scilit]
- Gong, F.; Hu, H.; Ouyang, Y.; Liao, Z.Z.; Kong, Y.; Hu, J.F.; He, H.; Zhou, Y. Physiologically-based pharmacokinetic modeling-guided rational combination of tacrolimus and voriconazole in patients with different CYP3A5 and CYP2C19 alleles. Toxicol. Appl. Pharmacol. 2023, 466, 116475. [Google Scholar] [CrossRef] [Scilit]
- Yang, Y.; Wang, Y.; Zeng, W.; Zhou, J.; Xu, M.; Lan, Y.; Liu, L.; Shen, J.; Zhang, C.; He, Q. Physiologically-based pharmacokinetic/pharmacodynamic modeling of meropenem in critically ill patients. Sci. Rep. 2024, 14, 19269. [Google Scholar] [CrossRef] [Scilit]
- Cai, X.J.; Li, R.D.; Li, J.H.; Tao, Y.F.; Zhang, Q.B.; Shen, C.H.; Zhang, X.F.; Wang, Z.X.; Jiao, Z. Prospective population pharmacokinetic study of tacrolimus in adult recipients early after liver transplantation: A comparison of Michaelis-Menten and theory-based pharmacokinetic models. Front. Pharmacol. 2022, 13, 1031969. [Google Scholar] [CrossRef] [Scilit]
- van Borselen, M.D.; Sluijterman, L.; Greupink, R.; de Wildt, S.N. Towards More Robust Evaluation of the Predictive Performance of Physiologically Based Pharmacokinetic Models: Using Confidence Intervals to Support Use of Model-Informed Dosing in Clinical Care. Clin. Pharmacokinet. 2024, 63, 343–355. [Google Scholar] [CrossRef] [Scilit]
- European Medicines Agency (EMA). Guideline on the Reporting of Physiologically Based Pharmacokinetic (PBPK) Modelling and Simulation; EMA/CHMP/458101/2016; European Medicines Agency: Amsterdam, The Netherlands, 2018. [Google Scholar]
- Jones, H.M.; Chen, Y.; Gibson, C.; Heimbach, T.; Parrott, N.; Peters, S.A.; Snoeys, J.; Upreti, V.V.; Zheng, M.; Hall, S.D. Physiologically Based Pharmacokinetic Modeling in Drug Discovery and Development: A Pharmaceutical Industry Perspective. Clin. Pharmacol. Ther. 2015, 97, 247–262. [Google Scholar] [CrossRef] [Scilit]
- McNally, K.; Cotton, R.; Loizou, G.D. A workflow for global sensitivity analysis of PBPK models. Front. Pharmacol. 2011, 2, 31. [Google Scholar] [CrossRef] [Scilit]
- Chinese Pharmacopoeia Commission. Pharmacopoeia of the People’s Republic of China Volume IV, General Chapter 9012; China Medical Science Press: Beijing, China, 2015. [Google Scholar]
- Tang, D.; Yan, M.; Song, B.L.; Zhao, Y.C.; Xiao, Y.W.; Wang, F.; Liang, W.; Zhang, B.K.; Chen, X.J.; Zou, J.J.; et al. Population pharmacokinetics, safety and dosing optimization of voriconazole in patients with liver dysfunction: A prospective observational study. Br. J. Clin. Pharmacol. 2021, 87, 1890–1902. [Google Scholar] [CrossRef] [Scilit]
- Hafsa, H.; Rasool, M.F.; Alqahtani, F. A Critical Review of Physiologically Based Pharmacokinetic (PBPK) Models in Liver Cirrhosis. Curr. Pharmacol. Rep. 2025, 11, 50. [Google Scholar] [CrossRef] [Scilit]
- Abdallah, Y.E.H.; Chahal, S.; Jamali, F.; Mahmoud, S.H. Drug-disease interaction: Clinical consequences of inflammation on drugs action and disposition. J. Pharm. Pharm. Sci. 2023, 26, 11137. [Google Scholar] [CrossRef] [Scilit]
- Boglione-Kerrien, C.; Zerrouki, S.; Le Bot, A.; Camus, C.; Marchand, T.; Bellissant, E.; Tron, C.; Verdier, M.C.; Gangneux, J.P.; Lemaitre, F. Can we predict the influence of inflammation on voriconazole exposure? An overview. J. Antimicrob. Chemother. 2023, 78, 2630–2636. [Google Scholar] [CrossRef] [Scilit]
- Chen, J.; Wu, Y.; He, Y.; Feng, X.; Ren, Y.; Liu, S. Combined Effect of CYP2C19 Genetic Polymorphisms and C-Reactive Protein on Voriconazole Exposure and Dosing in Immunocompromised Children. Front. Pediatr. 2022, 10, 846411. [Google Scholar] [CrossRef] [Scilit]
- Klöditz, K.; Tewolde, E.; Nordling, Å.; Ingelman-Sundberg, M. Mechanistic, Functional, and Clinical Aspects of Pro-inflammatory Cytokine Mediated Regulation of ADME Gene Expression in 3D Human Liver Spheroids. Clin. Pharmacol. Ther. 2023, 114, 673–685. [Google Scholar] [CrossRef] [Scilit]
- Tang, D.; Song, B.L.; Yan, M.; Zou, J.J.; Zhang, M.; Zhou, H.Y.; Wang, F.; Xiao, Y.W.; Xu, P.; Zhang, B.K.; et al. Identifying factors affecting the pharmacokinetics of voriconazole in patients with liver dysfunction: A population pharmacokinetic approach. Basic Clin. Pharmacol. Toxicol. 2019, 125, 34–43. [Google Scholar] [CrossRef] [Scilit]
- Liu, S.; Yao, X.; Tao, J.; Zhao, S.; Sun, S.; Wang, S.; Tian, X. Impact of CYP2C19, CYP2C9, CYP3A4, and FMO3 Genetic Polymorphisms and Sex on the Pharmacokinetics of Voriconazole after Single and Multiple Doses in Healthy Chinese Subjects. J. Clin. Pharmacol. 2024, 64, 1030–1043. [Google Scholar] [CrossRef] [Scilit]
- Dubinsky, S.; Hamadeh, A.; Imburgia, C.; McKnite, A.; Porter Hunt, J.; Wong, K.; Rice, C.; Rower, J.; Watt, K.; Edginton, A. Physiologically Based Pharmacokinetic Modelling in Critically Ill Children Receiving Anakinra While on Extracorporeal Life Support. Clin. Pharmacokinet. 2024, 63, 1343–1356. [Google Scholar] [CrossRef] [Scilit]
- Codaccioni, M.; Southall, R.L.; Dinh, J.; Johnson, T.N. Prediction of Pediatric Pharmacokinetics for CYP3A4 Metabolized Drugs: Comparison of the Performance of Two Hepatic Ontogeny Within a Physiologically Based Pharmacokinetic Model. J. Clin. Pharmacol. 2024, 64, 1083–1094. [Google Scholar] [CrossRef] [Scilit]
- Li, G.; Li, Q.; Zhang, C.; Yu, Q.; Li, Q.; Zhou, X.; Yang, R.; Yang, X.; Liu, H.; Yang, Y. The impact of gene polymorphism and hepatic insufficiency on voriconazole dose adjustment in invasive fungal infection individuals. Front. Genet. 2023, 14, 1242711. [Google Scholar] [CrossRef] [Scilit]

Disclaimer/Publisher’s Note: The statements, opinions and data contained in all publications are solely those of the individual author(s) and contributor(s) and not of MDPI and/or the editor(s). MDPI and/or the editor(s) disclaim responsibility for any injury to people or property resulting from any ideas, methods, instructions or products referred to in the content. |
© 2026 by the authors. Licensee MDPI, Basel, Switzerland. This article is an open access article distributed under the terms and conditions of the Creative Commons Attribution (CC BY) license.