


Abstract
Background/Objectives: Digoxin is a cardiotonic agent with a narrow therapeutic window and a high risk of toxicity. The current clinical use is based on an empirically FDA-recommended regimen which has wide dosing ranges, introducing the risk of inappropriate dosing and related adverse events. This study aims to develop a physiologically based pharmacokinetic (PBPK) model to characterize digoxin pharmacokinetics in adult and pediatric patients with heart failure, and then to evaluate the FDA-recommended regimen. Methods: The PBPK model was initially developed in healthy adults using PK-Sim®. Then, it was translated to adults with heart failure by incorporating disease factors. Next, it was further translated to pediatrics by scaling age-related parameters. Finally, through two-step translations, the model was used to evaluate current dosing regimens to inform safety and effectiveness based on observing predicted trough concentrations at a steady state. Results: This PBPK model has strong predicting ability, where observed concentrations and key PK metrics (Cmax, AUC0-t) were within 0.5–2.0-fold of predictions in healthy adults, adults with heart failure, neonates, and infants. The model prediction work on the evaluation of recommended dosing regimens from the FDA shows that the current regimen may not achieve the lowest boundary of the therapeutic window (0.5–2 ng/mL) in neonates (0–30 days), whereas infants (1–2 months) and children (<18 years) are generally good within it. Conclusions: This PBPK model explained major physiological and pathological contributors to differences in digoxin pharmacokinetics across populations and showed good performance in pediatric extrapolation. It also pointed out the shortage of empirical dosing regimens for such a drug with a narrow therapeutic window. The model may assist in optimizing the pediatric dosing strategies of digoxin, and suggests that current neonatal dosing regimens need refinement.
1. Introduction
Digoxin is a cardiotonic drug commonly used in heart failure, including in pediatric patients. However, the narrow therapeutic window of digoxin (0.5–2 ng/mL) places patients at high risk of toxicity, potentially resulting in serum potassium disturbances and consequent arrhythmias [1,2,3]. Therefore, therapeutic drug monitoring (TDM) is used in clinical settings [4] to ensure the safe and effective dosing of digoxin with a narrow therapeutic window. In addition, inter-population physiological variability may further impact the safety profile of digoxin, such as renal function, age, complications, etc. Premature infants are especially sensitive to the pharmacological effects and toxicity, necessitating not only dose reduction but also careful individualization based on their developmental maturity.
Currently, pediatric dosing of digoxin is largely based on recommendations for drug labeling, which often provide broad dose ranges without addressing significant individual variability among children [5]. Pharmacokinetic (PK) studies in children are limited by ethical and practical constraints [6], resulting in scarce clinical data and making it difficult to fully characterize pediatric PK. In addition, among pediatric patients, critical individual-specific factors, such as renal function [7], severity of heart failure, hemodynamic changes, Na+/K+-ATPase expression levels, postnatal age, body weight, and height, vary substantially and require individualized dosing strategies.
Physiologically based pharmacokinetic (PBPK) modeling provides a mechanistic approach to overcome these challenges [8,9]. By integrating physiological and biochemical parameters, PBPK models quantitatively simulate drug absorption, distribution, metabolism, and excretion [6]. Patient-specific characteristics, including age, body weight, organ function (e.g., hepatic and renal clearance), and genetic variability in drug-metabolizing enzymes and transporters, can be incorporated to predict drug exposure across populations and capture inter-individual variability. This enables individualized simulation of digoxin pharmacokinetics and supports stepwise extrapolation to populations with limited clinical data, such as pediatric patients [10].
This study aims to develop a stepwise PBPK model bridging healthy adults, adults with heart failure, and pediatric patients with heart failure, to elucidate population-specific differences in digoxin. In addition, the model is used to evaluate the suitability of current clinical dosing regimens across different pediatric age groups.
2. Materials and Methods
2.1. Software
Plasma concentration–time profiles from the published literature were digitized using Engauge Digitizer (version 12.1, Engauge Software, Chicago, IL, USA). Pharmacokinetic modeling and simulation were conducted using the open-source platform PK-Sim® (version 11.0, Open Systems Pharmacology, Leverkusen, Germany). Data visualization and plotting were performed using R (version 4.5.0, The R Foundation for Statistical Computing, Vienna, Austria) in RStudio (version 2025.09.2, RStudio, Inc., Boston, MA, USA).
2.2. Model Development
2.2.1. Model Assumptions
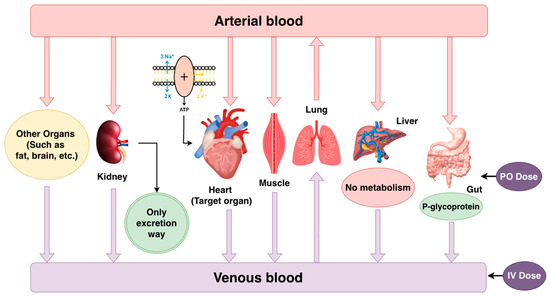
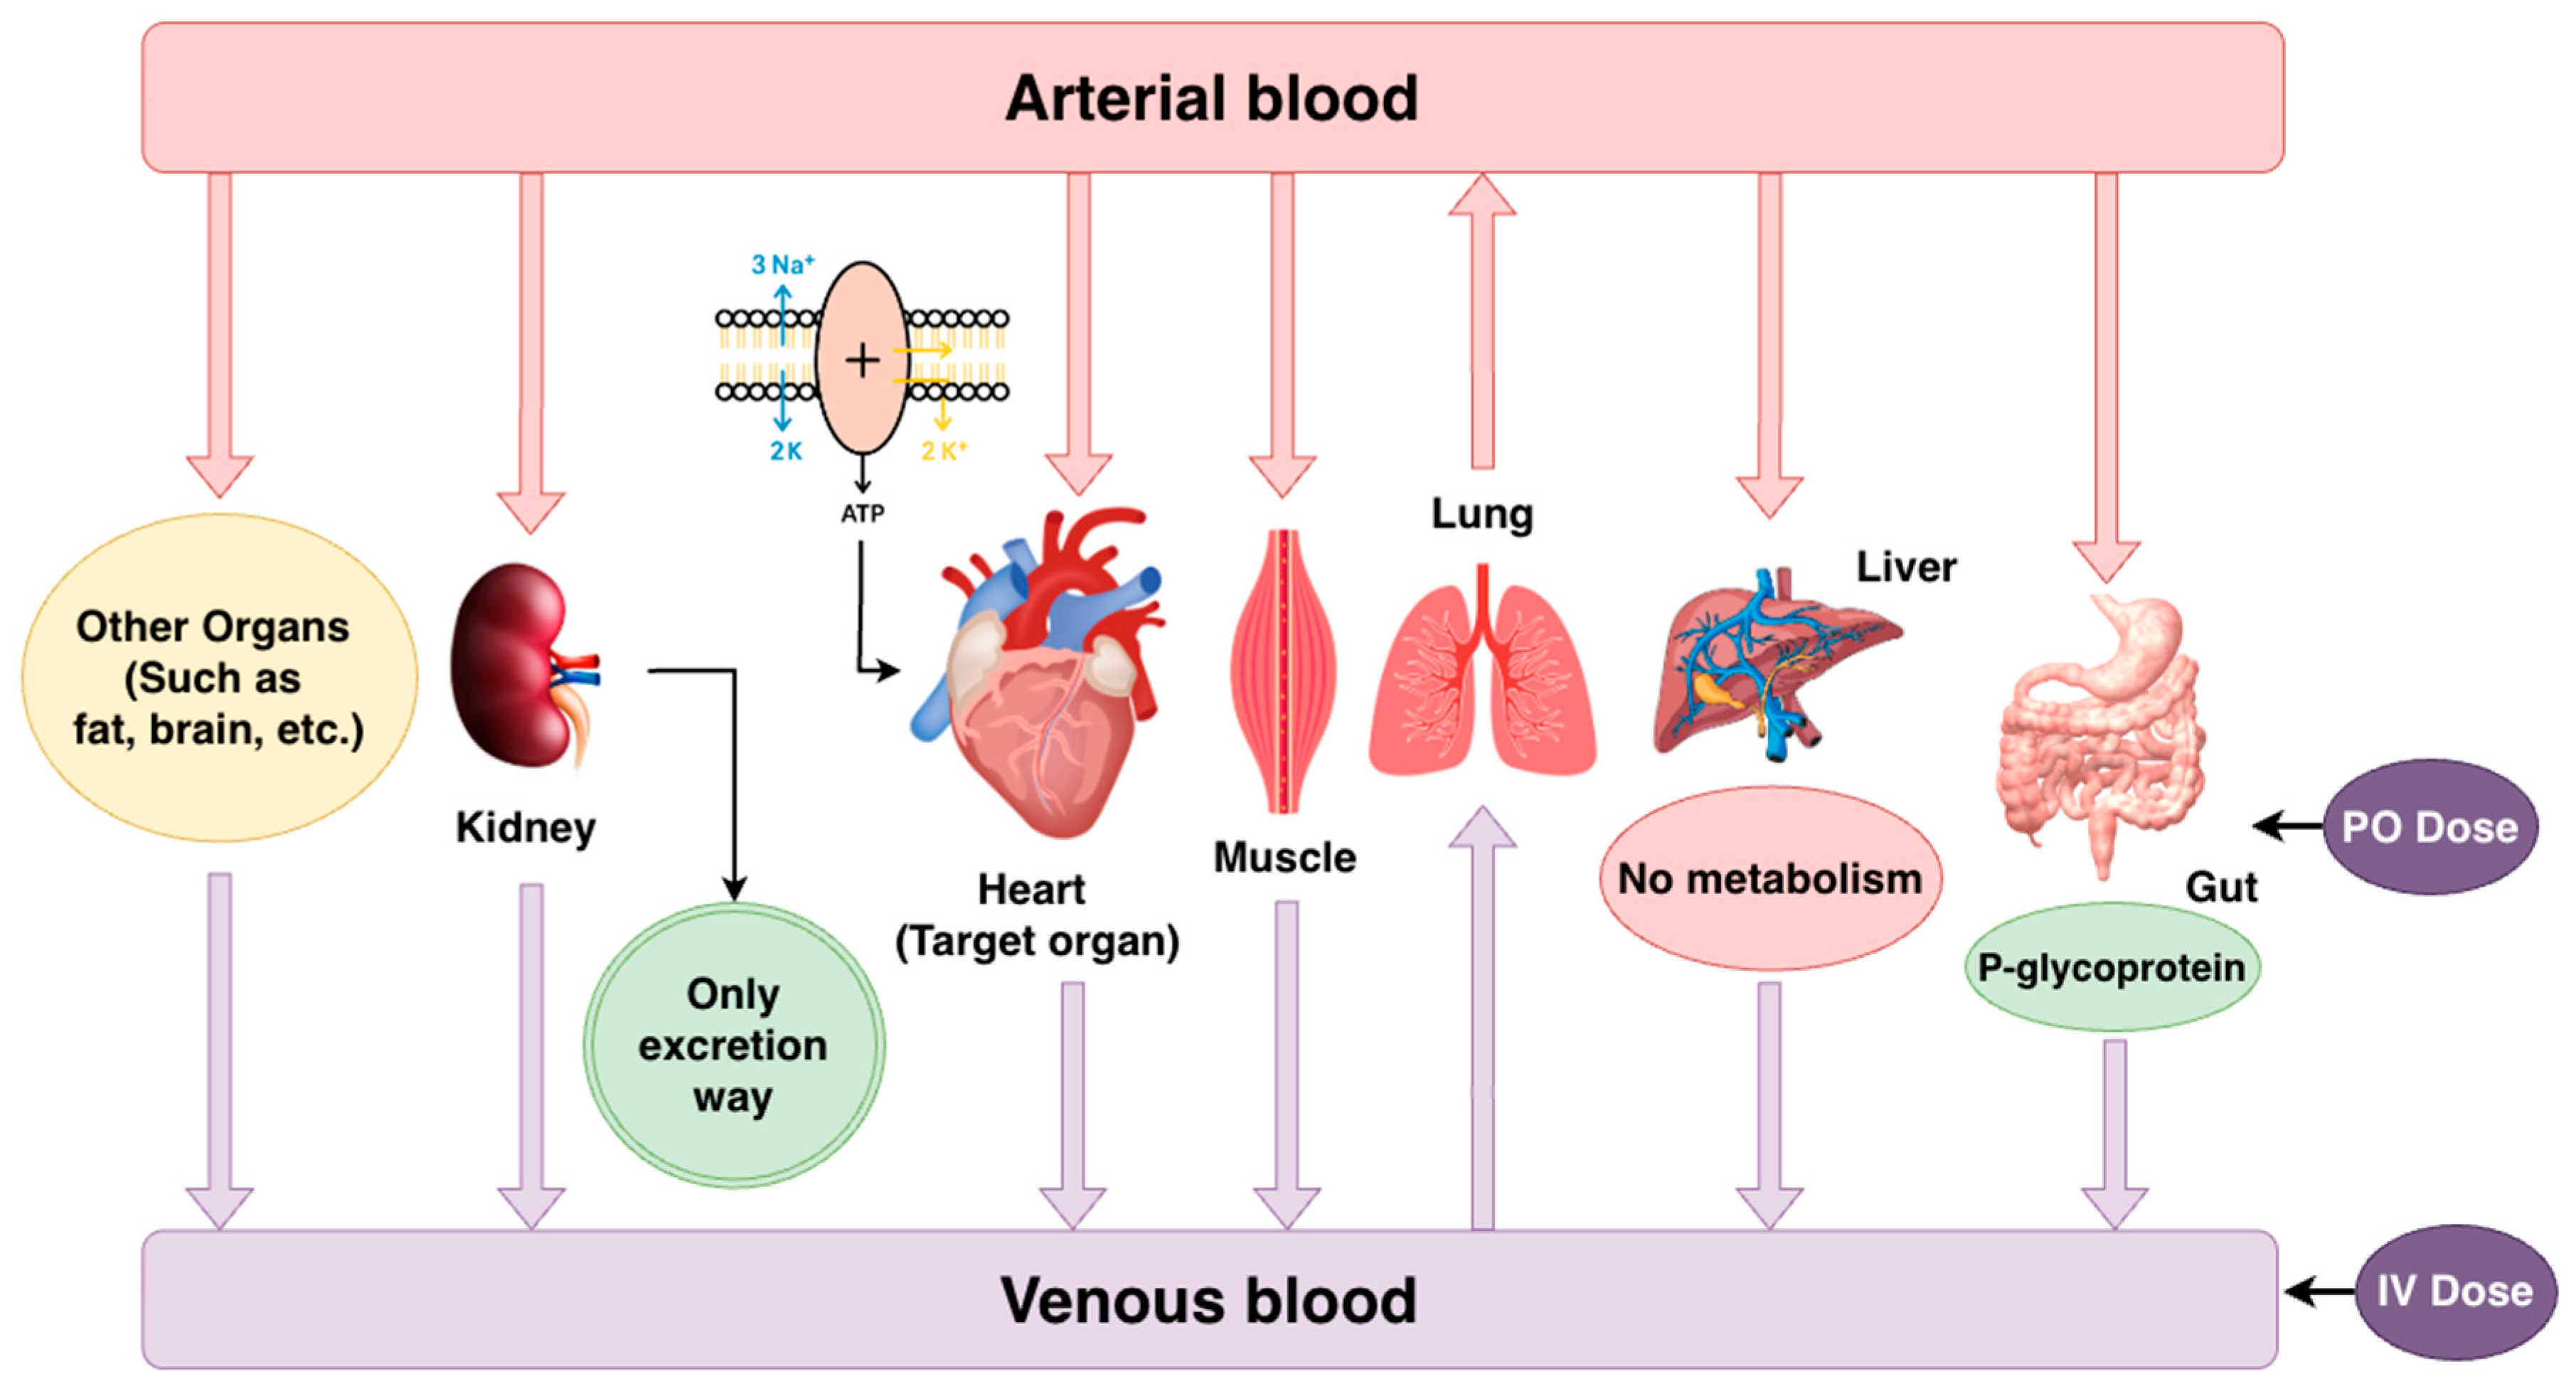
To construct the PBPK model, several assumptions regarding the pharmacokinetics of digoxin were made based on established physiological and biochemical evidence. Figure 1 illustrates the digoxin PBPK model structure based on these assumptions.
Figure 1.
Schematic illustration of the digoxin PBPK model based on the assumptions. (Red arrows indicate arterial blood flow from the central compartment to individual organs, whereas purple arrows represent venous return to the central circulation).
- For absorption, digoxin was modeled as a substrate of P-glycoprotein (P-gp) [11,12], consistent with its known efflux by intestinal epithelial cells [13]. Its absorption was assumed and described using Michaelis–Menten kinetics [14].
- For distribution, it exhibits approximately 25% plasma protein binding [15], primarily to albumin [16], and has a strong tissue binding affinity, particularly to Na+/K+-ATPase in cardiac muscle [17], which is a key pharmacological target located on the membranes of excitable tissues. The binding process was assumed to be linear, non-saturated by the dissociation constant rate (Koff) and dissociation constant (Kd).
- For metabolism, digoxin was assumed not to undergo enzymatic biotransformation, in line with data showing that only approximately 13% of the drug is metabolized in vivo. It was assumed that there is no enzyme participating in digoxin’s metabolism.
- For excretion, renal excretion was assumed as the sole elimination pathway, due to the fact that 50–70% of digoxin is excreted unchanged in urine [18], with negligible biliary elimination. The “Glomerular Filtration Rate (GFR) fraction” chosen for digoxin was fixed to 1, indicating predominantly renal elimination via glomerular filtration [19].
2.2.2. Stepwise Extrapolation Process
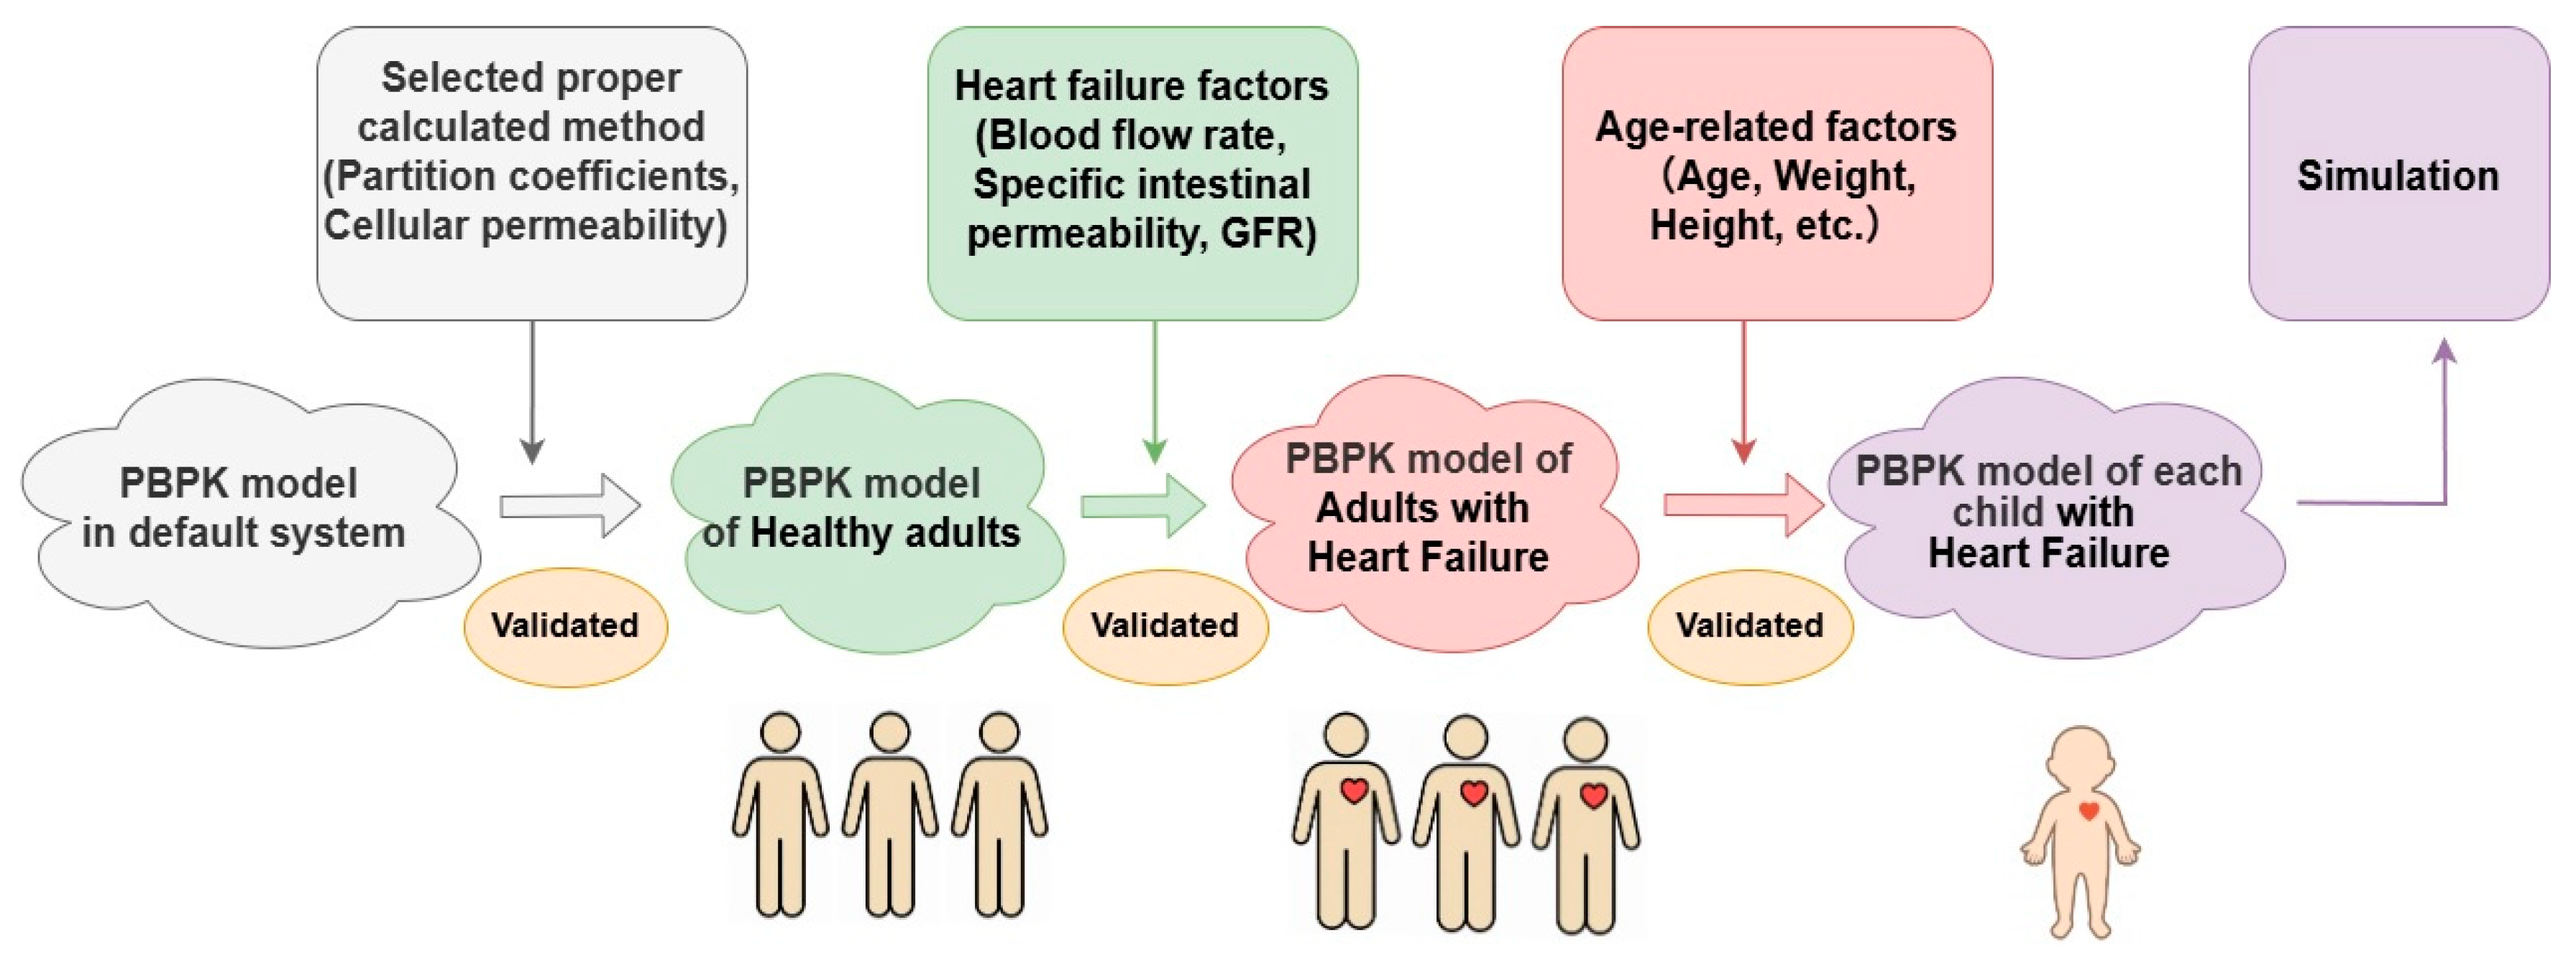
The workflow was conducted from healthy adults to children with disease through to adult patients, rather than healthy children, since clinical data used for validation from healthy children are ethically hard to obtain, whereas diseased adults’ data are more available.
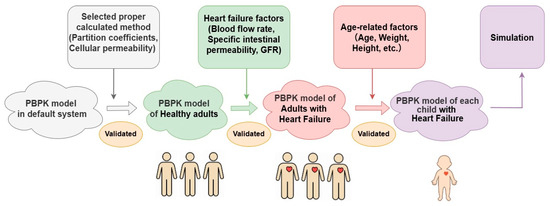
A stepwise extrapolation process was applied (Figure 2). In the first translation, physiological changes associated with heart failure—such as alterations in organ blood flow and intestinal permeability—were incorporated to generate an adult heart failure PBPK model. After validation, the second translation was performed by further extrapolating adult heart failure populations to pediatric populations by adjusting for age-specific physiological differences, including body size, renal function, developmental parameters, etc. The established model can predict drug exposure based on individual pediatric physiological characteristics, thereby facilitating dose adjustment. Parameter fitting was performed either manually or using the built-in parameter identification module in PK-Sim®, which applies a Monte Carlo algorithm to optimize parameters and approximate the observed plasma concentration–time profiles.
Figure 2.
Stepwise extrapolation framework of the PBPK modeling process from healthy adults to pediatric heart failure populations. (Note that adult PBPK models were developed using population-averaged physiological and biochemical parameters, whereas pediatric PBPK models were constructed on an individual basis to account for large inter-individual variability in age, body weight, and growth.).
2.3. Model Validation
Visual inspection: The model should consistently reproduce the general trend of the data [20], which means for each population, the predicted simulation line should be visually aligned well with the observed data.
Then, model accuracy was evaluated by assessing whether the observed data fell within the 0.5- to 2-fold range. In addition, if key pharmacokinetic parameters (AUC0–t and Cmax) also fell within this range, the model was considered to have good predictive performance.
2.4. Sensitivity Analysis
A local sensitivity analysis was performed to evaluate the influence of individual input parameters on selected pharmacokinetic (PK) outputs. The sensitivity of a PK parameter () with respect to an input parameter () was calculated using the following equation:
∆pi represents a small perturbation of the input parameter, and is the resulting change in the PK output following a simulation with the perturbed input, while all other parameters were held constant.
This dimensionless sensitivity coefficient quantifies the relative change in PK output in response to a relative change in an input parameter. For example, a sensitivity of −1.0 indicates that a 10% increase in the input parameter leads to a 10% decrease in the PK output. Conversely, a sensitivity of +0.5 means that a 10% increase in the input results in a 5% increase in the PK output.
2.5. Model Prediction
According to the FDA-approved prescribing information for Lanoxin (digoxin injection) digoxin [3], administration in children typically follows a two-phase regimen, consisting of an initial loading dose (also referred to as digitalization) followed by a maintenance dose. The purpose of the loading dose is to rapidly raise serum digoxin concentrations to a therapeutic level to ensure a prompt pharmacologic effect.
The recommended protocol involves administering a total loading dose equal to the full digitalization amount, delivered in two divided doses over a 6–8 h interval. Maintenance dosing begins 12 h after the loading dose and is administered twice daily, with each dose representing 25% of the total loading dose. Intravenous (IV) administration is used at 75% of the corresponding oral dose.
Pediatric dosing was categorized into three age groups: neonates (0–30 days), infants (1 month–2 years), and children older than 2 years. Since dosing recommendations are generally consistent for children above 2 years of age, and their physiological characteristics are relatively stable with less variability compared with infants and newborns, they were grouped into a single category.
In this study, each pediatric subgroup received two dosing levels: a low dose (at the lower end of the recommended range) and a high dose (at the upper end of the range). For example, in the term neonates, the low-dose group received 0.02 mg/kg orally, while the high-dose group received 0.03 mg/kg. Each group included both oral and intravenous administration simulations. Dosing regimens are shown in Table 1.
Table 1.
Recommended PO and IV loading doses of digoxin in pediatric populations for simulation.
The criteria of evaluation for children’s TDM in clinical practice for digoxin is to observe whether the trough concentration at steady state (Cmin,ss) is in the therapeutic window (0.5–2 ng/mL). If Cmin,ss is within it, we can conclude that this kind of dosing regimen is effective and acceptable for children. If it is outside digoxin’s therapeutic window, the existing regimens should be adjusted for a certain age group.
3. Results
3.1. Model Extrapolation Process
3.1.1. Model Development of Healthy Adults
IV fitting for digoxin mainly focused on the distribution part, since there is no metabolism for digoxin based on our assumptions, and the only excretion method is renal clearance using the ‘GFR fraction’, which is 1, meaning that all digoxin is delivered to the kidney through filtration to be cleared [21].
LogP, fu, solubility, and pKa were initially obtained from ‘Drugbank’ (https://go.drugbank.com/drugs/DB00390, accessed on 1 October 2022). Since those values are from different resources, we optimized these values within a reasonable range for healthy adults. fu was given a range from 0.7 to 0.8, then we used 0.71, which is reasonable. LogP is fitted to 2.36, within a range that is from 1.04, calculated by ALOGPS, to 2.37, calculated by Chemaxon. “Specific organ permeability” represents cellular permeability, which was initially 1.01 × 10⁻⁴ cm/min, calculated by fitted LogP using Rodgers & Rowland’s method, then slightly optimized to 3 × 10⁻⁴ cm/min.
Digoxin is a BCS IV-classified drug with low solubility and low permeability due to P-gp in the intestine. The solubility is 0.0648 mg/mL from experiment, and 0.127 mg/mL calculated by ALOGPS. Even though solubility has a measured value, since the experimental value of 0.0648 mg/mL was measured under a certain condition (25 °C), and its solubility is very low (<0.2 mg/mL), giving it huge variability, it may be not the best option to use directly in a model for a complex physiological environment. Based on that, the values were fitted to 0.1 mg/mL, using the range from 0.0648 to 0.0127 mg/mL. PO fitting focused on P-gp and intestinal permeability. P-gp Km was obtained from Troutman‘s study [22], and Vmax was fitted to 20 µmol/L/min. Intestinal permeability was also optimized based on PO observed data, finally reaching 2.3 × 10⁻⁵ cm/min. All the fitted values are shown in Table 2.
Table 2.
Parameters for the Digoxin PBPK Model.
Then, the physiochemical parameters (LogP, fu, solubility, pKa, and MW) are kept the same among the three populations, and the cellular permeability as well. The final parameter set is summarized in Table 2.
3.1.2. From Healthy Adults to Adults with Heart Failure
The model of adults with heart failure was constructed based on a digoxin healthy adult model incorporating physiological changes in heart failure. There are several considerations in the first translation from healthy adults to adults with heart failure.
In patients with heart failure, systemic blood flow rate is reduced in proportion to the severity of heart failure. In this model, systemic blood flow was reduced by half, as Sullivan and coworkers reported around 50% reduction in systemic blood flow in patients with moderate chronic heart failure [24]. The blood flow rate of healthy adults was set using the default value in PK-Sim, then manually halved to adapt to adults with heart failure. For example, the blood flow rate of healthy adults is 1.46 L/min in the kidney, which was then adjusted to 0.73 L/min in adult patients.
“Specific intestinal permeability” was increased in those with heart failure, since evidence shows that intestinal mucosal ischemia in heart failure can increase intestinal permeability and bacterial translocation [25]. Then, the value is converted to 2.7 × 10⁻⁵ cm/min from 2.3 × 10⁻⁵ cm/min.
GFR tends to decline accordingly during the progression of heart failure. Gilbert’s study [25] suggests that for digoxin, GFR may decrease by approximately 50–60% in patients with moderate to severe heart failure. Accordingly, GFR was adjusted from 116.45 to 43.85 mL/min in the patients’ group.
During the onset of heart failure, both rodents and humans exhibit reduced expression [26,27] of sodium pump affinity (Na+/K+-ATPase) and receptor isoforms in cardiac tissues. There are several α-subunit isoforms (α1, α2, α3, and α4) [28], which are tissue-specific and species-dependent. Among them, isoforms α2 and α3 are associated with high affinity for digoxin [29]. A reduction in their expression would significantly reduce digoxin binding and uptake into cardiac cells. In patients with heart failure, this could result in up to a 40% decrease in intracellular digoxin concentrations [30]. Therefore, in PBPK modeling, the dissociation constant (Kd) of digoxin should be fitted from 0.01 to 0.5 accordingly to reflect decreased affinity. The final parameter set is summarized in Table 2.
3.1.3. From Adults with Heart Failure to Pediatric Patients
The model of pediatrics with heart failure was translated from adult patients. During the second translation, age-dependent physiological parameters were mainly considered in pediatrics.
Blood flow rate for each organ should be decreased due to the smaller organ size in children. This step was scaled automatically by the ‘scaling’ function of PK-Sim® for each child. For example, the blood flow rate of the kidney is 0.07 L/min after scaling.
Renal function differs significantly from that of adults, due to the reduced blood flow rate and GFR [31]. These values were also scaled from heart failure adults to pediatric subjects using ‘scaling’ in PK-Sim®. Now, GFR is 4.2 L/min.
For Na+/K+-ATPase activity, young animals have higher myocardial Na+/K+-ATPase activity [32]. This is because the inhibition of Na+/K+-ATPase is an action of the mechanism of digoxin, which may underlie its increased tolerance to digitalis glycosides, and explain why neonates and infants may require higher doses of digoxin to achieve comparable pharmacodynamic and toxicodynamic effects. For tissue binding, evidence [32] also shows that, despite similar plasma concentrations, infants and young children exhibit substantially higher myocardial accumulation of digoxin compared with adults. Therefore, the Kd value was reduced by fitting from 0.5 to 0.005 to reflect the changes in digoxin in children compared to adults.
Since only IV observed data were obtained from neonates and infants, P-gp-related parameters kept the same and will not influence pediatric IV model. Intestinal permeability kept the same as well. The final parameter set is summarized in Table 2.
3.2. Model Validation
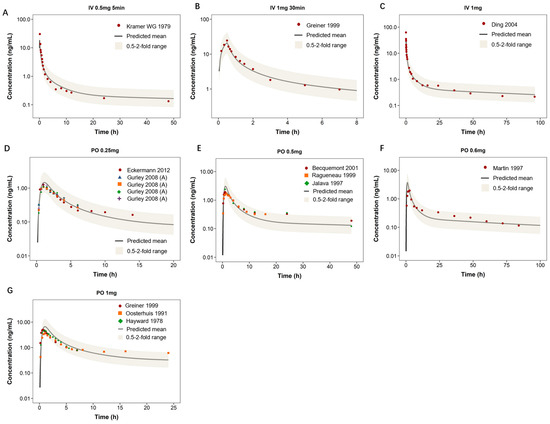
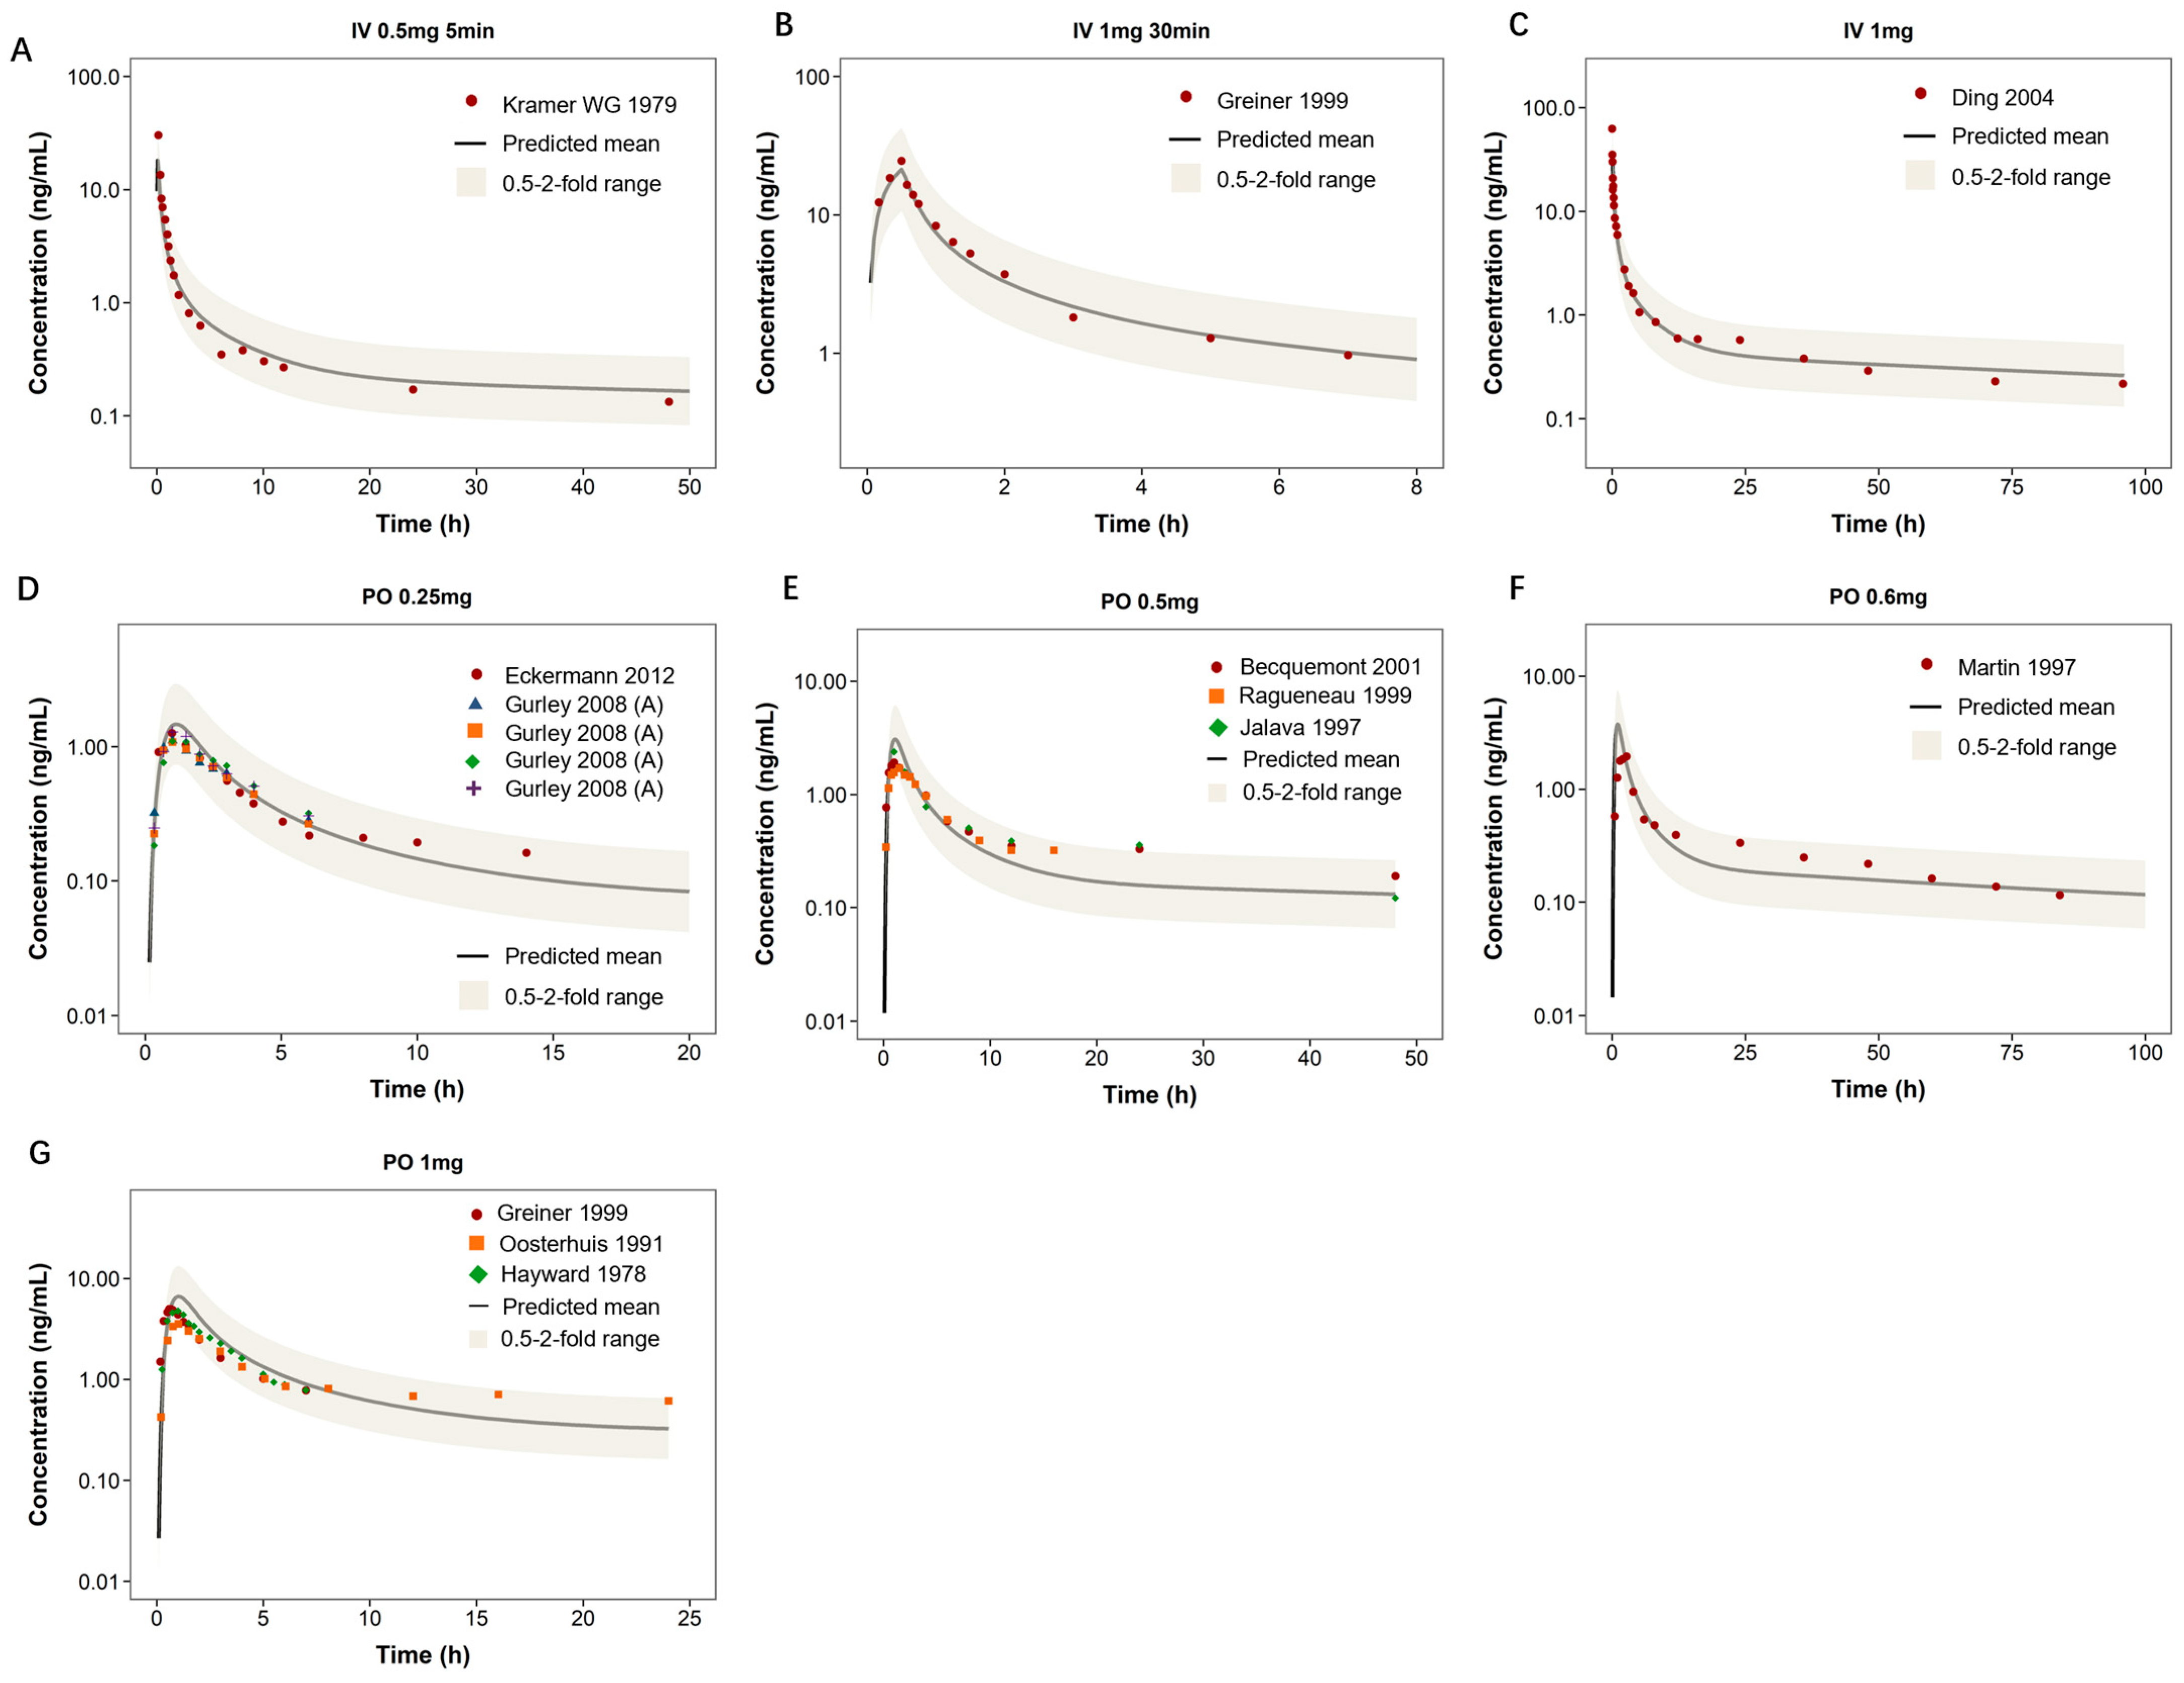
As shown in Figure 3, the PBPK model predicted digoxin plasma concentration–time profiles across a range of intravenous (IV) and oral (PO) regimens in healthy adults. For IV dosing (Figure 3A–C), the model captured the rapid distribution and biexponential decline, with observed data falling within the 0.5- to 2-fold prediction range. For oral regimens (Figure 3D–G), the model adequately described absorption and distribution patterns, with good agreement between predicted and observed concentrations across doses ranging from 0.25 to 1 mg. The predicted AUC 0–t and C max values were generally within two-fold of observed values (Table 3). Most predicted AUC 0–t values were within 0.9–1.0 times the observed values, indicating good model performance in capturing systemic exposure.
Figure 3.
Predicted and observed plasma concentration–time profiles of digoxin in healthy adults. This figure presents a comparison between predicted and observed plasma concentration–time profiles of digoxin in healthy adult subjects under different dosing regimens. Panels (A–C) illustrate intravenous (IV) administration at various doses and infusion durations, while panels (D–G) depict oral (PO) dosing. The solid black line indicates the model-predicted mean concentration, and the shaded area shows the 0.5- to 2-fold prediction range. Red dots represent observed clinical data from literature.
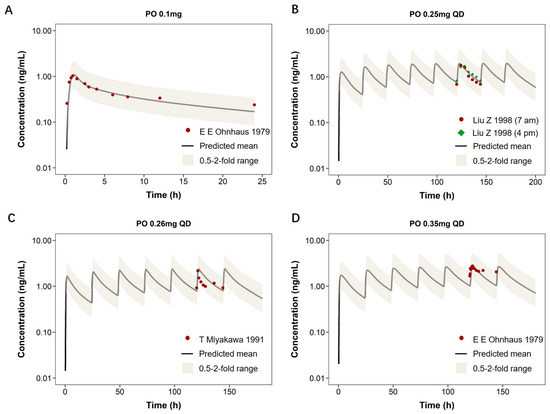
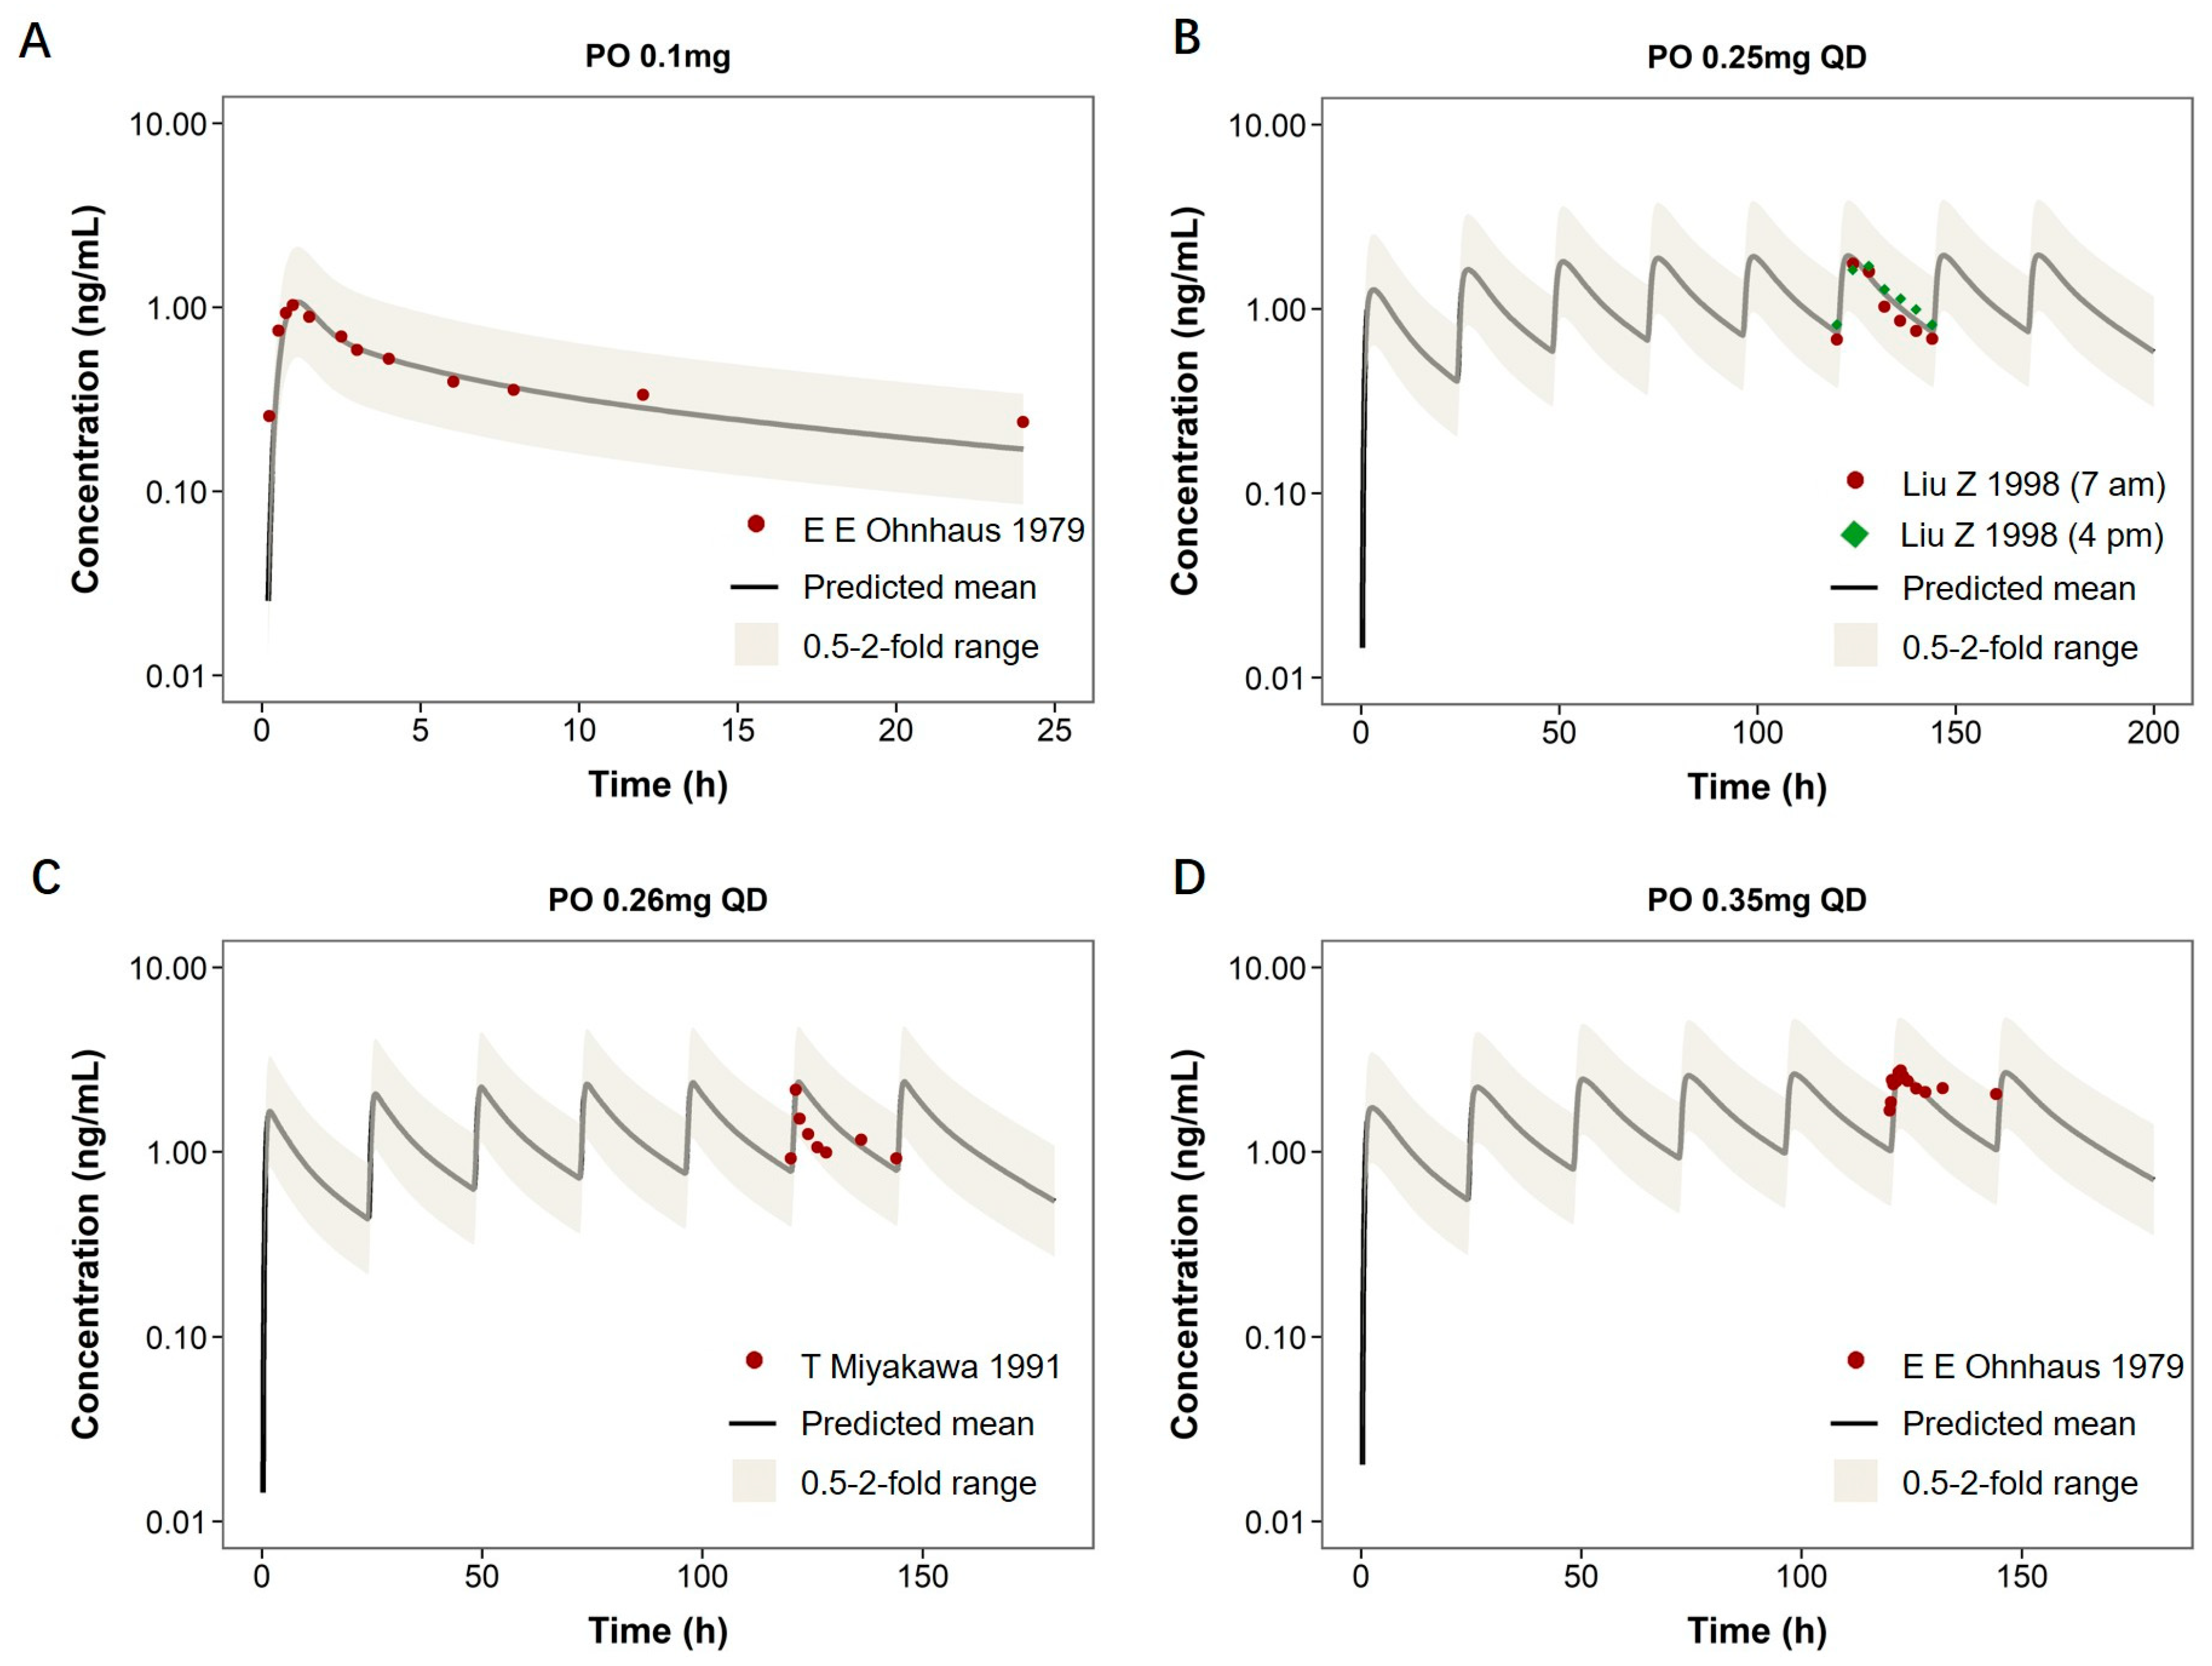
The model was further extrapolated to adults with heart failure by incorporating pathophysiological changes such as altered renal function and tissue perfusion. As shown in Figure 4, the predicted concentration–time curves for both single and multiple oral doses (0.1–0.35 mg) closely matched the observed data. The predicted AUC 0–t values were generally consistent with observed data, with prediction-to-observation ratios ranging from 0.84 to 1.30. For Cmax, the predicted values also demonstrated reasonable accuracy, with most ratios ranging from 0.88 to 1.03, supporting the model’s applicability in diseased adults.
Figure 4.
Predicted and observed plasma concentration–time profiles of digoxin in adults with heart failure. Plasma concentration–time profiles of digoxin in adults with heart failure are shown under different dosing regimens. Panel (A) illustrates a single oral dose (0.1 mg), while panels (B–D) depict multiple-dose regimens (0.25–0.35 mg, QD). The solid black line represents model-predicted mean concentration, and the shaded area indicates the 0.5- to 2-fold prediction range. Red and green markers correspond to observed clinical data from published studies.
Pediatric model extrapolation incorporated age-dependent physiological changes. Figure 5 shows model predictions for neonates and infants (2–81 days old) receiving IV digoxin at doses of 0.014–0.022 mg/kg. The model successfully captured the observed plasma concentration–time profiles across all subjects. For AUC0–t, the observed-to-predicted ratios ranged from 0.59 to 1.23, with most values falling between 0.6 and 0.9. For Cmax, the ratios ranged from 0.54 to 0.87 across individuals. The variability in predictions may be attributed to age-related physiological differences and model assumptions in this sensitive population. As summarized in Table 3, the predicted AUC0–t and Cmax values were within the two-fold range, indicating satisfactory predictive performance in this vulnerable population.
Figure 5.
Predicted and observed plasma concentration–time profiles of digoxin in pediatric heart failure patients. This figure displays the plasma concentration–time profiles of digoxin in individual pediatric patients with heart failure following intravenous administration. All panels (A–G) represent different patients aged 2 to 81 days, with doses ranging from 0.014 to 0.022 mg/kg. The solid black line shows the model-predicted mean concentration, and the shaded area indicates the 0.5- to 2-fold prediction range. Red dots denote observed clinical data digitized from published literature [33].
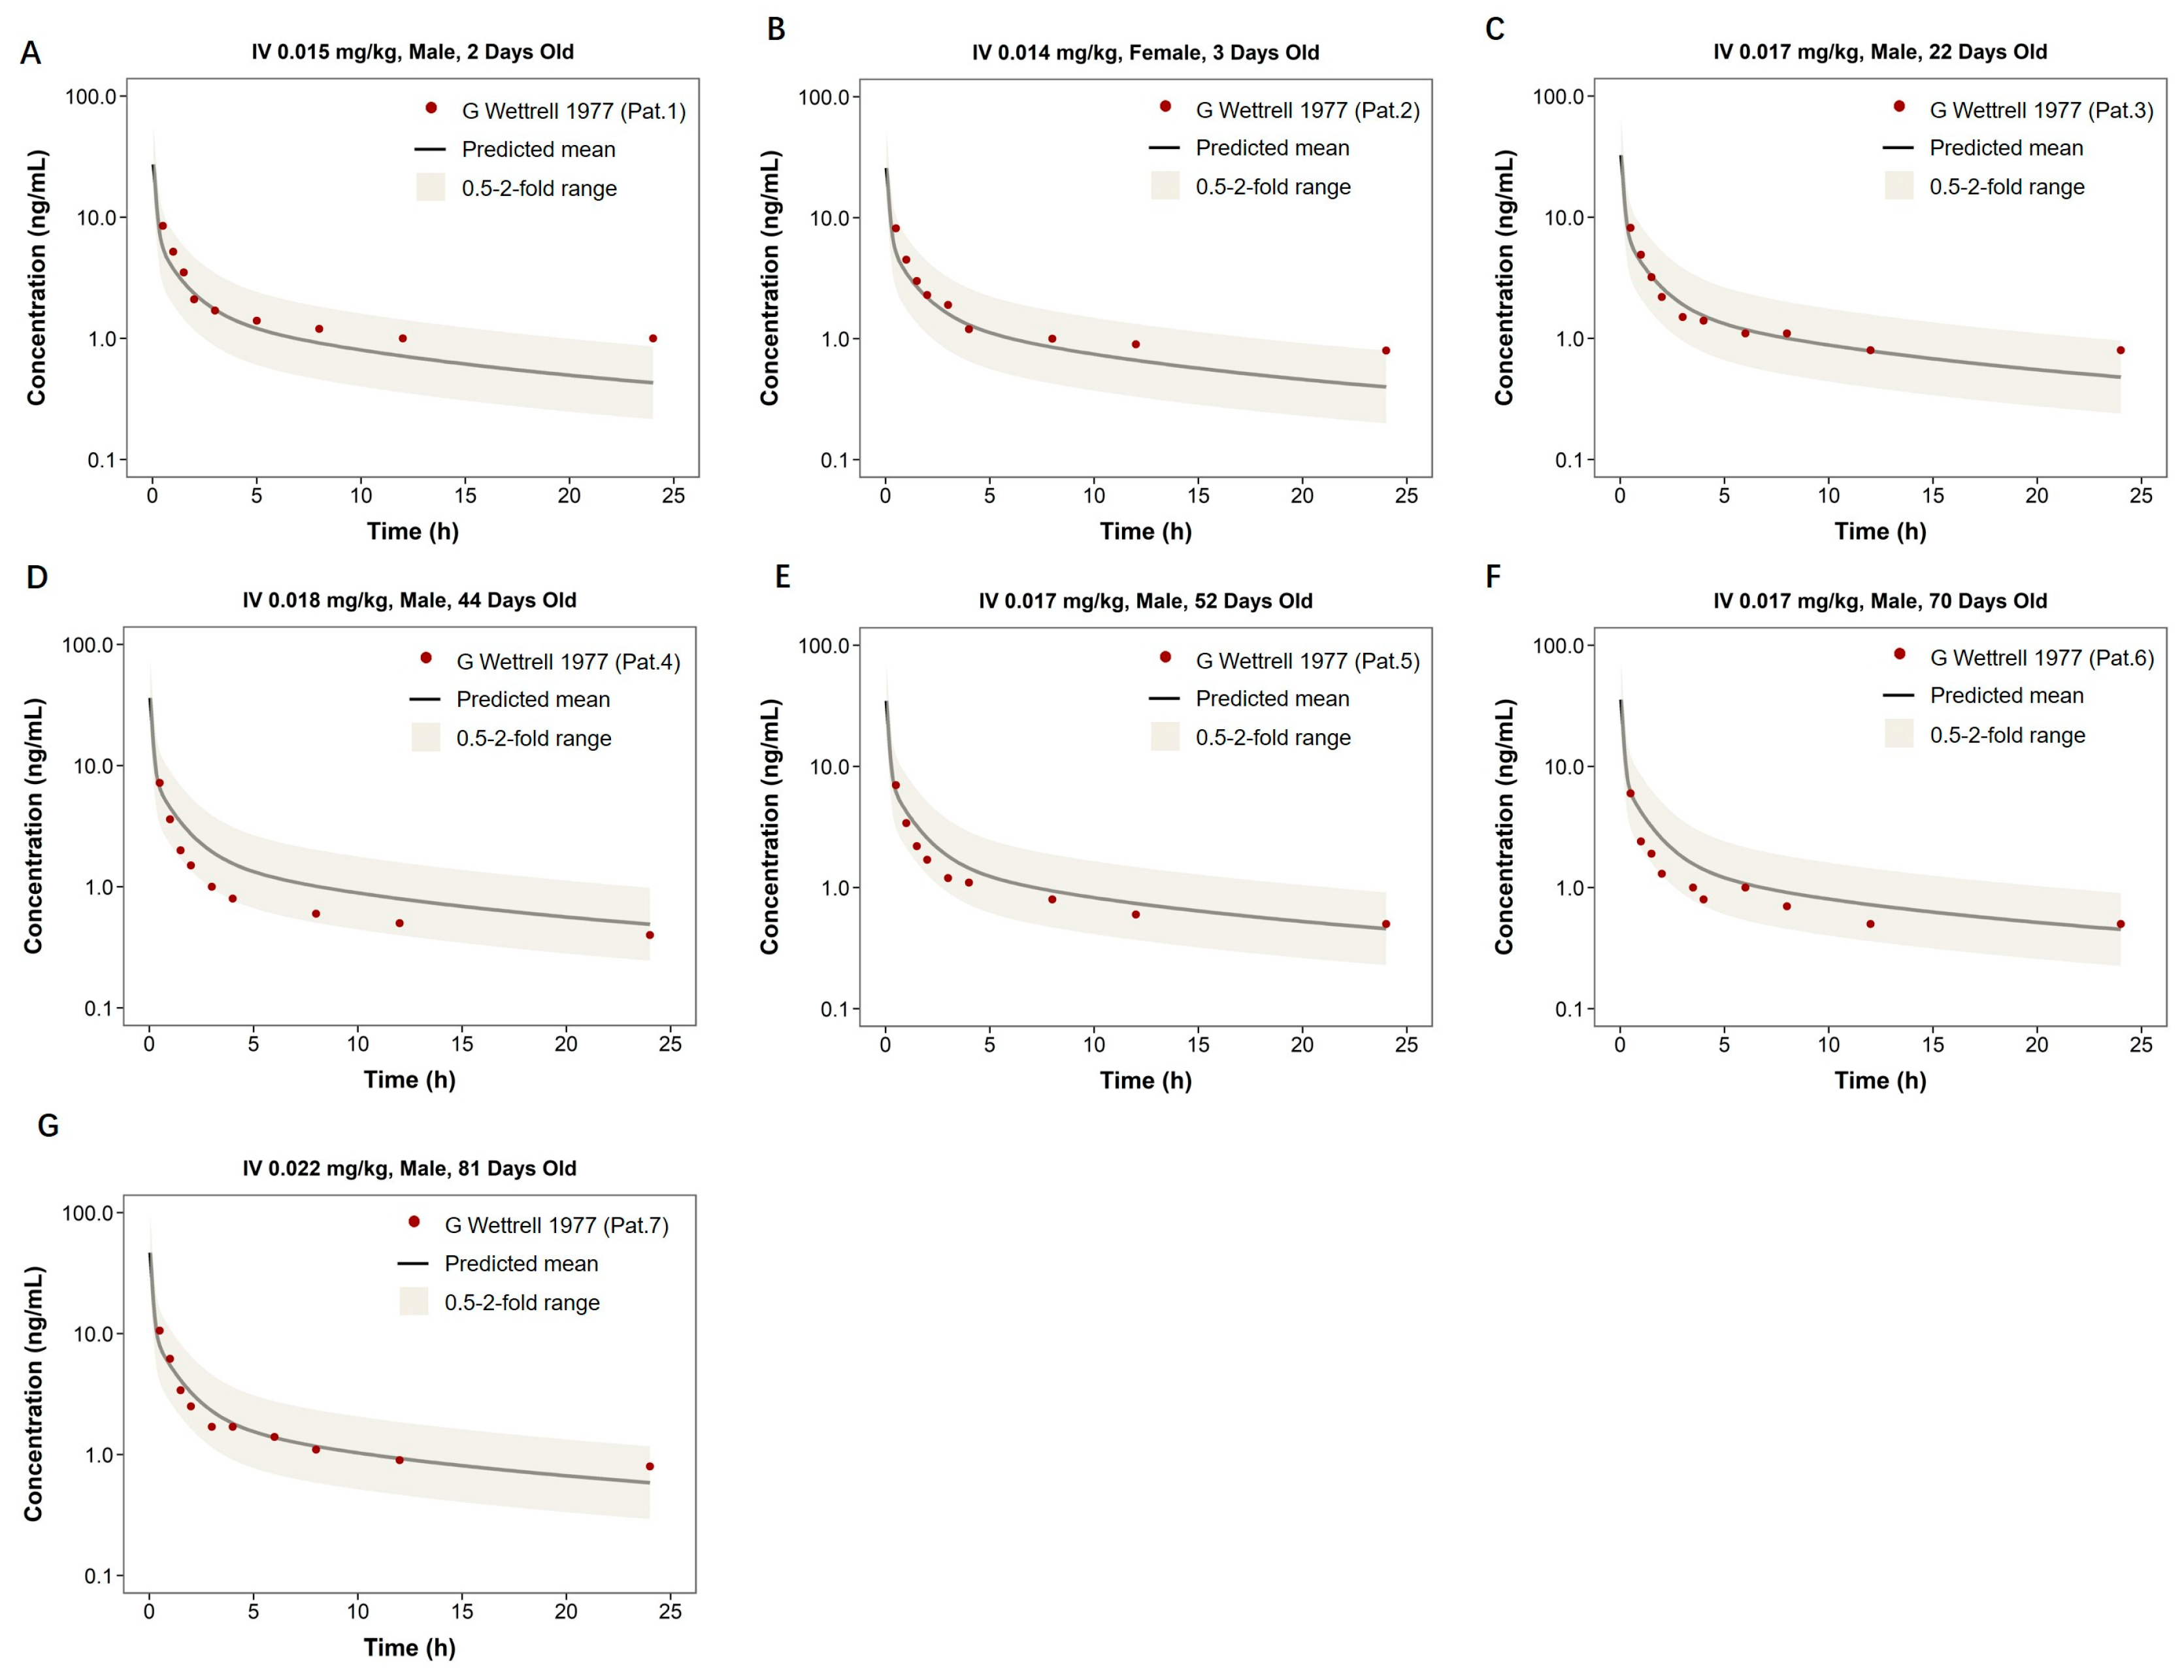
Table 3.
Observed and predicted AUC 0–t and Cmax of digoxin in different populations.
3.3. Sensitivity Analysis
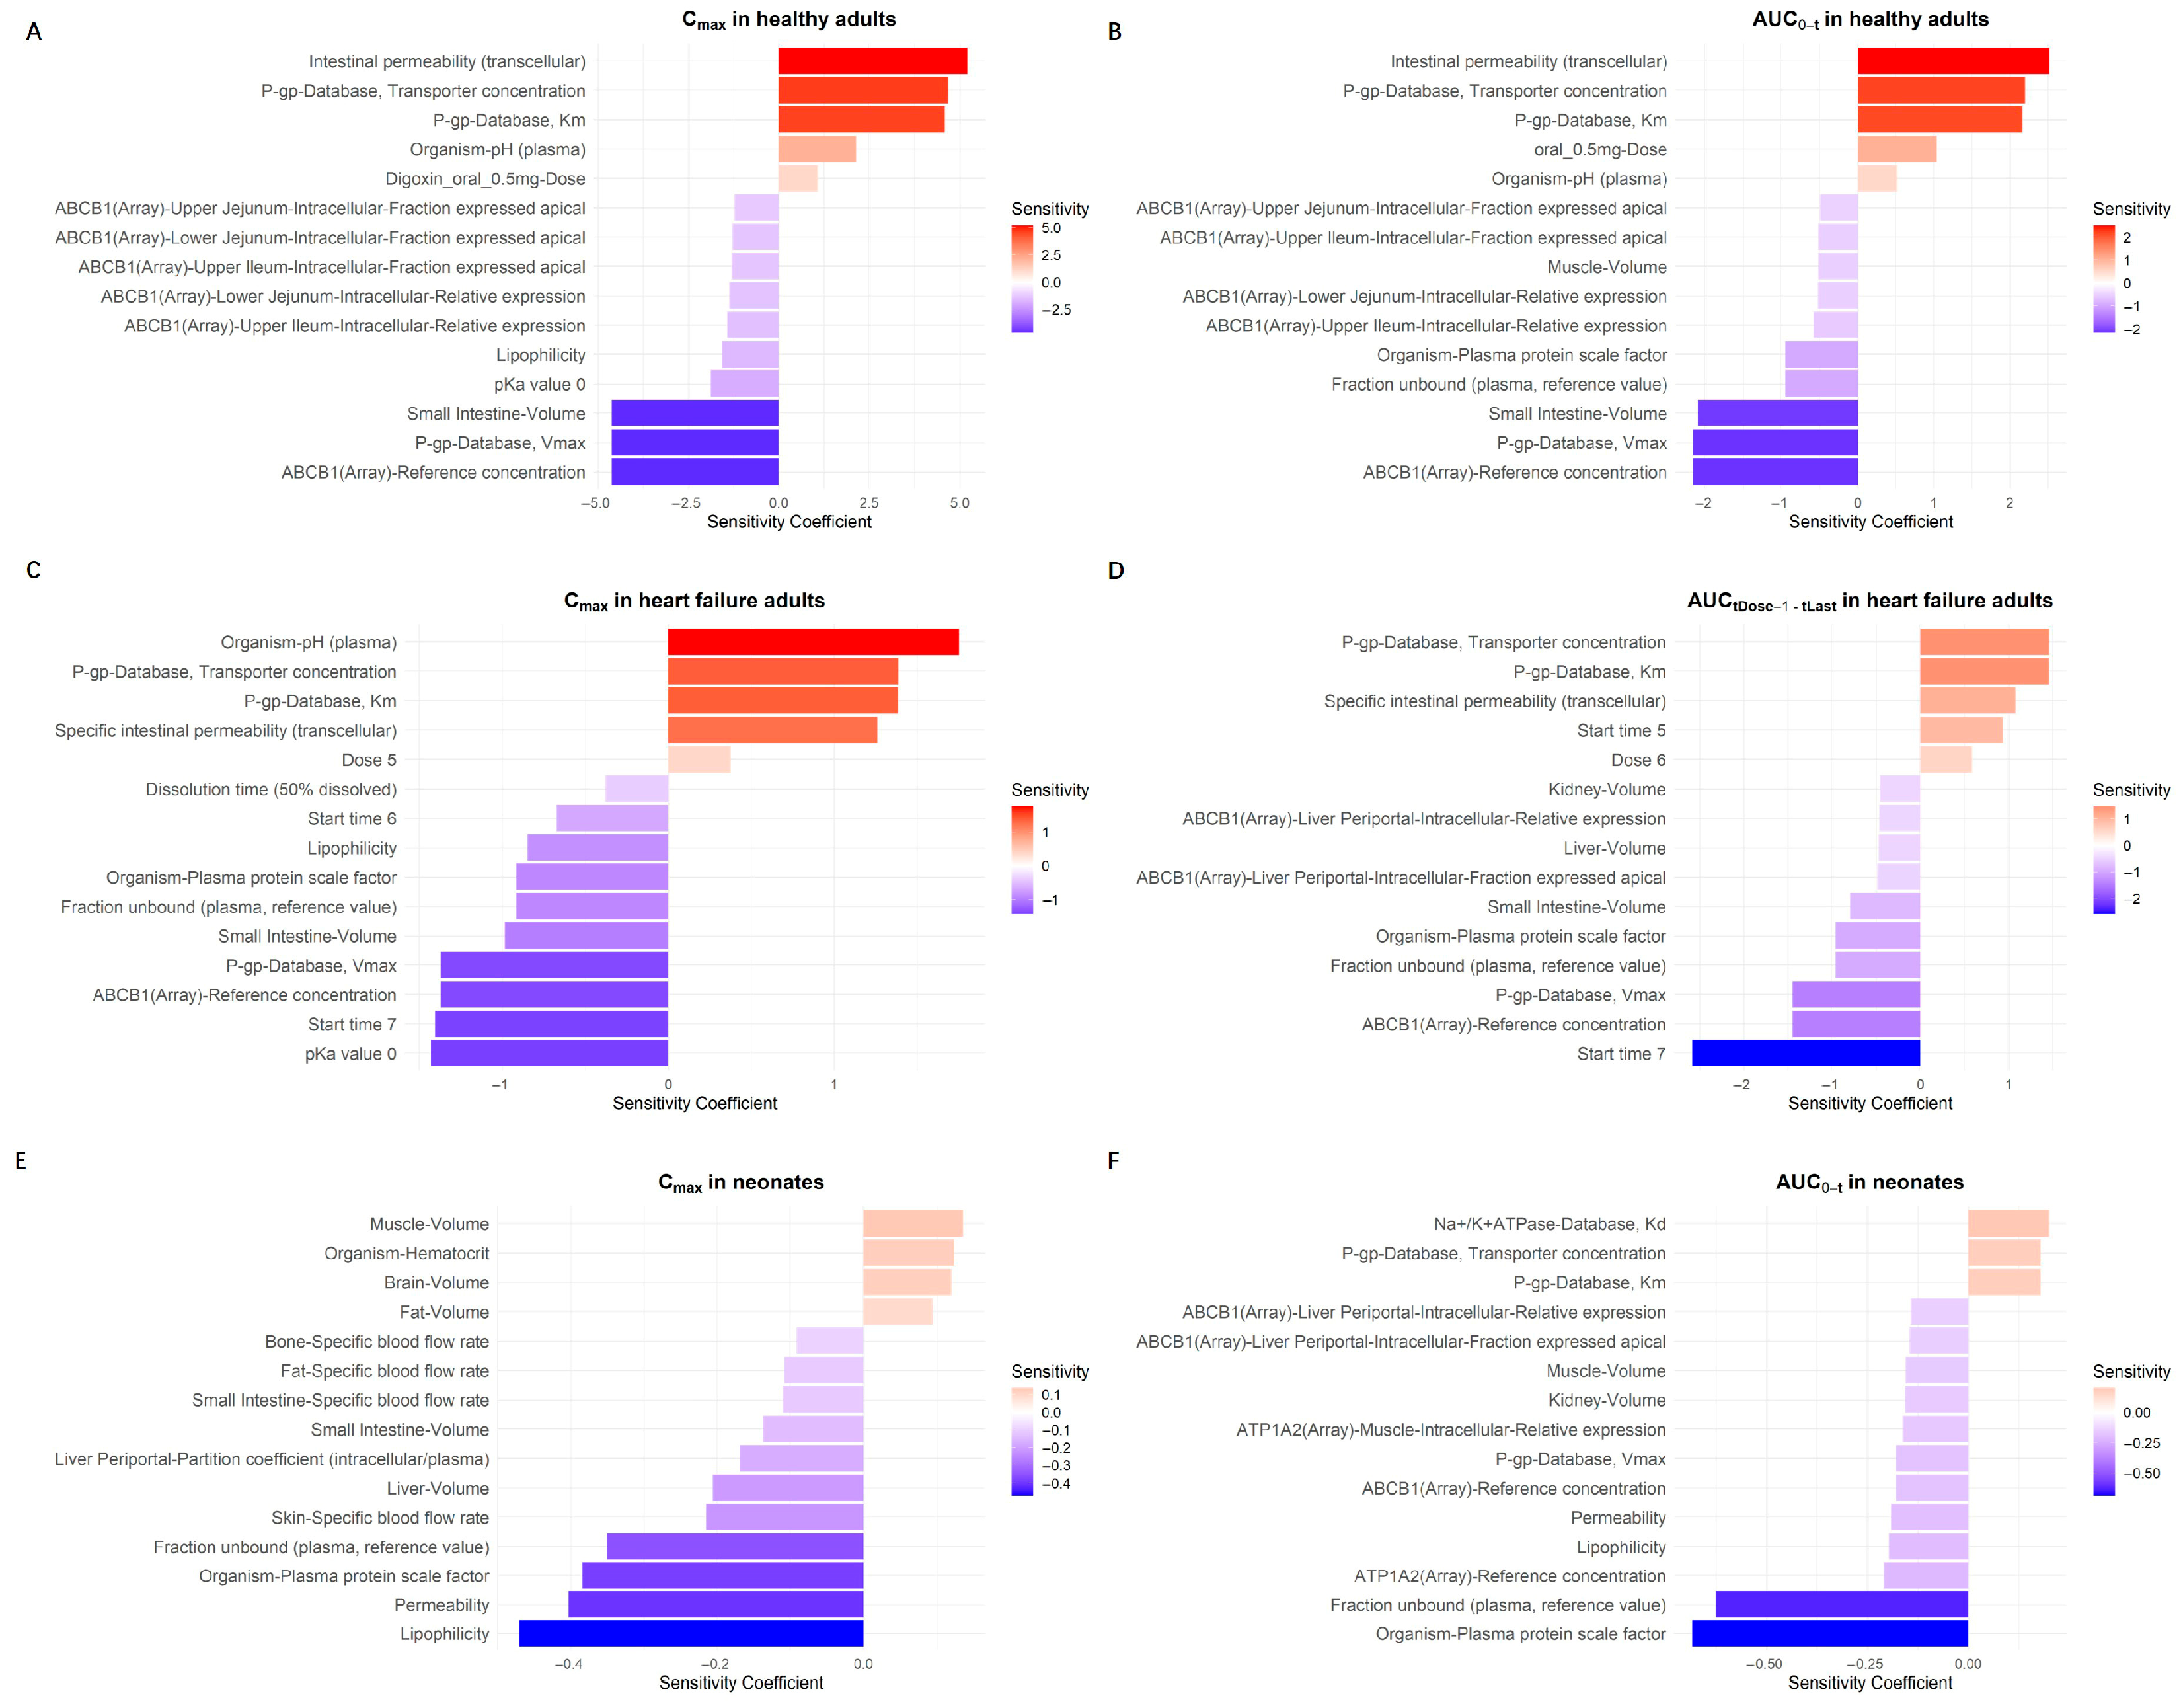
A local sensitivity analysis was conducted to identify model parameters that most strongly influenced digoxin exposure (AUC) and peak concentration (Cmax) across populations (Figure 6). In healthy adults, intestinal permeability and P-gp-related parameters (transporter concentration and Km) had the greatest positive influence on both Cmax and AUC (Figure 6A,B). Parameters such as small intestinal volume, fraction unbound, and relative expression of ABCB1 transporters had negative sensitivity coefficients, indicating an inverse effect on drug exposure.
Figure 6.
Sensitivity analysis of model parameters for digoxin Cmax and AUC in different populations. This figure presents the results of local sensitivity analyses evaluating the influence of physiological parameters on model outputs in three populations: healthy adults (Panels (A,B)), adults with heart failure (Panels (C,D)), and neonates (Panels (E,F)). Panels (A,C,E) correspond to the maximum plasma concentration (Cmax), while Panels (B,D,F) depict the area under the concentration–time curve (AUC). The bars represent sensitivity coefficients calculated based on parameter perturbation. Positive and negative values indicate direct or inverse relationships with the corresponding PK outputs.
In heart failure patients (Figure 6C,D), P-gp transporter parameters remained key contributors to variability in both Cmax and AUC. P-gp-related parameters, including transporter concentration, Km, and Vmax, were identified as highly influential in the sensitivity analysis of both Cmax and AUC. This includes the ABCB1 (reference concentration), which corresponds to the gene encoding P-glycoprotein. These findings highlight the significant impact of P-gp expression and function on the pharmacokinetics of digoxin in heart failure patients. Additionally, specific intestinal permeability and dissolution time were also influential. Conversely, parameters such as organ-specific volumes and fraction unbound exerted negative effects on model outputs.
In neonates (Figure 6E,F), the sensitivity profile shifted. In pediatric patients, digoxin is primarily administered via intravenous injection rather than oral routes. As a result, parameters related to intestinal absorption, such as P-gp transporter activity, did not appear among the most sensitive factors in the local sensitivity analysis. This reflects the limited relevance of efflux transporters like P-gp under intravenous dosing conditions. Organ-specific physiological parameters, such as liver and muscle volume, brain blood flow, and fraction unbound in plasma, played a more prominent role in determining digoxin exposure.
These results highlight population-specific determinants of digoxin pharmacokinetics and support the model’s utility in guiding dose adjustments based on individual physiological and transporter-related variability.
3.4. Model Prediction
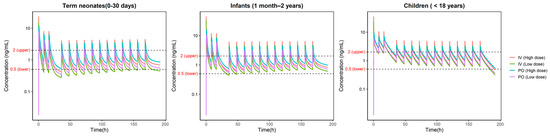
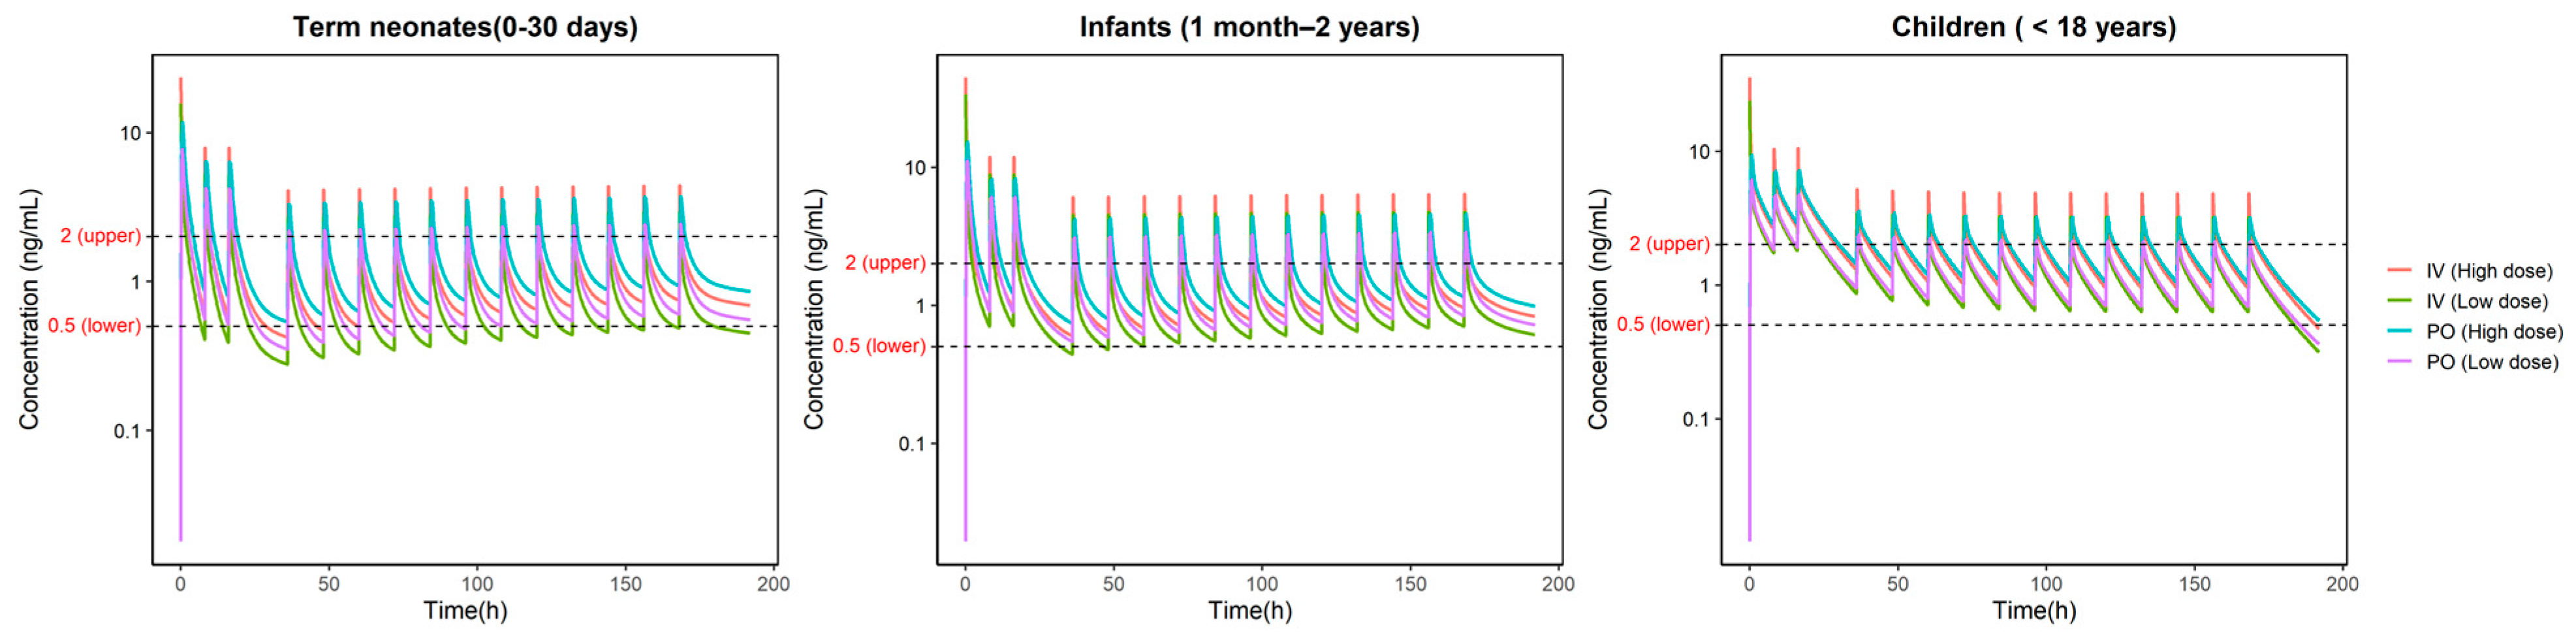
Based on the criteria of evaluation for children’s TDM, it is observed that the trough concentration at steady state (Cmin,ss) should be in therapeutic window (0.5–2 ng/mL). Figure 7 presents the predicted pharmacokinetic concentration–time profiles of digoxin under standard dosing regimens across three pediatric age groups. Even though high peak concentrations (C max) were observed in these groups, it is still considered irrelevant, because digoxin is an effect-site delay drug, and its toxicity is not directly correlated with the plasma peak concentration, which is also sharply decreased after reaching the peak.
Figure 7.
Predicted pharmacokinetic profiles under FDA dosing regimens of digoxin in pediatric populations of different age groups: term neonates (0–30 days), infants (1 month–2 years), and children (<18) years. The therapeutic window is indicated by dashed lines (0.5–2 ng/mL).
In the term neonates’ group (0–30 days), the steady-state trough concentrations in both IV and PO low-dose regimens were below the lower limit of the therapeutic range, suggesting that this dosing strategy may not provide adequate therapeutic exposure. High-dose groups were generally satisfactory.
In the infant group (1 month–2 years), at the beginning stage of administration, the low-dose IV group was reaching the lower boundary of therapeutic window, suggesting that it may more slowly achieve a therapeutic effect. For rest of the three dosing groups, the performance was generally good.
In the childrens’ group (2–18 years), all dosing regimens exhibited relatively stable concentration–time profiles with overall exposure and less fluctuation. Most regimens remained within the therapeutic window, particularly the oral low-dose regimen, which maintained plasma concentrations within the therapeutic range throughout the simulation, suggesting favorable safety. However, the gap between PO and IV seems smaller than younger groups, suggesting the current method of converting the IV dose directly from 75% of the corresponding PO dose may need reconsidering for younger children’s groups.
4. Discussion
Pediatric heart failure has numerous challenges in treatment, with insufficient pharmacokinetic studies and significant physiological changes during development. Children are not simply “small adults” [48], and they need more accurate dosing and physiological analysis.
This PBPK model provides a mechanistical method to dig into the principle of pediatric PK. Through a stepwise extrapolation from healthy adults to adults with heart failure, and then to pediatric patients, the model characterized PK differences in numerous angles. In the first translation, disease-related changes were represented as systematic blood flow rate, intestinal permeability, Na+/K+-ATPase affinity, and GFR. In the second translation, age-related parameters were considered, including scaled physiology (body weight, organ size, blood flow rate, etc.), deficient renal function, and increasing Na+/K+-ATPase affinity. Those factors significantly contribute to PK differences across populations. Therefore, the final version of the PBPK model can provide accurate simulations and predictions when applied in pediatrics.
The model prediction results also reveals that in term neonates, the intravenous low-dose current regimen led to trough concentrations below the lower limit of the therapeutic window, suggesting that the currently used standard dosing may fail to achieve optimal therapeutic exposure. Importantly, our mechanistic framework allows for the elucidation of the underlying cause, the increasing Na+/K+-ATPase affinity in neonates, which mainly contributes to their closer binding with tissue with lower plasma concentration. Consequently, neonates and infants may require higher doses to achieve equivalent pharmacodynamic and toxicodynamic effects. This finding reflects the maturation of drug disposition processes with age and represents the limitations of uniform dosing strategies in pediatric populations. Thus, this study supports dose adjustments based on the developmental stage to achieve proper efficacy.
The existing PK models of digoxin barely consider pediatric situations based on developmental physiology. Compared to traditional population pharmacokinetic (PopPK) models [49,50] or empirically scaled dosing strategies [3] that primarily rely on data availability to characterize observed PK behavior, this PBPK model enables reliable extrapolation and prediction across age groups with data scarcity, and also provides physiological explanations of PK differences between adults and children. Beyond dose adjustment [8,9], the PBPK model also has advantages in predicting drug–drug interactions [51], supporting formulation evaluation [52], and informing regulatory decisions [53]. With further integration of real-world data, population variability modeling, and prospective clinical validation, this model may expand its utility in both pediatric pharmacotherapy and regulatory science [53].
Several limitations should also be pointed out in this model with limited pediatric data. Due to ethical constraints [6] and the inherent challenges of conducting clinical studies in children, pediatric pharmacokinetic data of digoxin remain limited. In this paper, there are only seven neonates and infants obtained for us to characterize their digoxin PK behavior and perform validation. Data from other age groups are still unavailable to obtain for validating our simulations. In the future, more observed data from different age groups could enrich and improve this work. Next, digoxin is a substrate of P-gp [49], yet the expression and activity levels of P-gp during various stages of pediatric development are not well characterized. This is because there is only limited IV observed data from neonates and infants; we could not optimize the influence of P-gp changes without PO observed PK performance. In addition, numerous drug–drug interactions (DDIs) mediated by P-gp have been studied [15,22,49,51,54], whereas the current model focuses solely on digoxin monotherapy rather than co-medications. Future work could focus on pediatric DDI models if data for validation is available. Moreover, heart failure has different disease progressions [55], but the current model did not classify patients by disease severity, since the paper containing PK data did not clearly illustrate all the levels of heart failure. This may limit its ability to reflect pathophysiological variability among different subgroups. Lastly, the model focuses solely on the pharmacokinetics of digoxin and does not incorporate pharmacodynamic (PD) components related to therapeutic effects or toxicity, such as changes in heart rate or the risk of arrhythmias.
Future research could focus on clinical applicability. Integration of PD components, particularly linking predicted cardiac tissue concentrations with clinical outcomes, will enable a more comprehensive PK–PD framework. Moreover, expanding the model to include different pediatric subgroups—such as varying stages of heart failure, comorbidities like renal impairment, or alternative dosing routes—will further enhance its utility. Apart from that, the integration of PBPK modeling with machine learning techniques also offers promising opportunities for automated parameter optimization and improved model scalability.
5. Conclusions
This study developed a PBPK model to characterize digoxin pharmacokinetics in pediatric heart failure patients by incorporating age-related development and disease-specific physiology through two stepwise extrapolations. Using this model, current pediatric dosing recommendations were evaluated, and their potential inadequacy in neonates was identified. By integrating developmental physiology, this model provides a strong reference to support dose adjustment and optimization strategies in clinical practice.
Author Contributions
Y.Z. and Y.L. designed the research; Y.Z. wrote the manuscript; H.H. and K.H. acquired funding and supervised the research; and H.H. and K.H. reviewed and edited the manuscript. All authors have read and agreed to the published version of the manuscript.
Funding
This research was supported by the Natural Science Foundation of China (grant 82373949). The work was conducted at China Pharmaceutical University. We sincerely thank all the colleagues and mentors who contributed to this work.
Institutional Review Board Statement
Not applicable. This study was based on published literature data and did not involve new studies with human or animal subjects.
Informed Consent Statement
Not applicable.
Data Availability Statement
All data used in this study are available from the published literature cited in this article.
Conflicts of Interest
The authors declare no conflicts of interest.
References
- Patocka, J.; Nepovimova, E.; Wu, W.; Kuca, K. Digoxin: Pharmacology and toxicology-A review. Environ. Toxicol. Pharmacol. 2020, 79, 103400. [Google Scholar] [CrossRef] [Scilit]
- Mlambo, V.C.; Algaze, C.A.; Mak, K.; Collins, R.T., 2nd. Impact of Abnormal Potassium on Arrhythmia Risk During Pediatric Digoxin Therapy. Pediatr. Cardiol. 2024, 45, 901–908. [Google Scholar] [CrossRef] [Scilit]
- Administration USFaD. LANOXIN (Digoxin) Tablets, for Oral Use: Highlights of Prescribing Information. 2019. Available online: https://www.accessdata.fda.gov/drugsatfda_docs/label/2016/020405s013lbl.pdf (accessed on 22 December 2025).
- Pauwels, S.; Allegaert, K. Therapeutic drug monitoring in neonates. Arch. Dis. Child. 2016, 101, 377–381. [Google Scholar] [CrossRef] [Scilit] [PubMed]
- Oeffl, N.; Schober, L.; Faudon, P.; Schweintzger, S.; Manninger, M.; Köstenberger, M.; Sallmon, H.; Scherr, D.; Kurath-Koller, S. Antiarrhythmic Drug Dosing in Children-Review of the Literature. Children 2023, 10, 847. [Google Scholar] [CrossRef] [Scilit] [PubMed]
- Conklin, L.S.; Hoffman, E.P.; van den Anker, J. Developmental Pharmacodynamics and Modeling in Pediatric Drug Development. J. Clin. Pharmacol. 2019, 59, S87–S94. [Google Scholar] [CrossRef] [Scilit] [PubMed]
- Abdel Jalil, M.H.; Abdullah, N.; Alsous, M.M.; Saleh, M.; Abu-Hammour, K. A systematic review of population pharmacokinetic analyses of digoxin in the paediatric population. Br. J. Clin. Pharmacol. 2020, 86, 1267–1280. [Google Scholar] [CrossRef] [Scilit]
- Lin, W.; Chen, Y.; Unadkat, J.D.; Zhang, X.; Wu, D.; Heimbach, T. Applications, Challenges, and Outlook for PBPK Modeling and Simulation: A Regulatory, Industrial and Academic Perspective. Pharm. Res. 2022, 39, 1701–1731. [Google Scholar] [CrossRef] [Scilit]
- Alasmari, F.; Alasmari, M.S.; Muwainea, H.M.; Alomar, H.A.; Alasmari, A.F.; Alsanea, S.; Alshamsan, A.; Rasool, M.F.; Alqahtani, F. Physiologically-based pharmacokinetic modeling for single and multiple dosing regimens of ceftriaxone in healthy and chronic kidney disease populations: A tool for model-informed precision dosing. Front. Pharmacol. 2023, 14, 1200828. [Google Scholar] [CrossRef] [Scilit]
- Thai, H.T.; Mazuir, F.; Cartot-Cotton, S.; Veyrat-Follet, C. Optimizing pharmacokinetic bridging studies in paediatric oncology using physiologically-based pharmacokinetic modelling: Application to docetaxel. Br. J. Clin. Pharmacol. 2015, 80, 534–547. [Google Scholar] [CrossRef] [Scilit]
- Bilić Ćurčić, I.; Ninčević, V.; Kizivat, T.; Raguž-Lučić, N. Enzymes and Transporters Involved in Drug Interactions. In Drug Interactions in Gastroenterology: A Clinical Guide; Springer: Berlin/Heidelberg, Germany, 2025; pp. 191–202. [Google Scholar]
- Deepalakshmi, M.; Arun, K.; Srikanth Jupudi, A.A.; Kailash Kumar, S.; Sanjay, V.; Yogesh, V. P-glycoprotein (P-gp) Mediated Drug Interaction between Digoxin & Orange Juice-An Exploratory Study by in-silico Approach. Cuest. Fisioter. 2025, 54, 424–452. [Google Scholar]
- Michiba, K.; Namai, M.; Hashimoto, Y.; Shimomura, O.; Miyazaki, Y.; Hashimoto, S.; Ohara, Y.; Enomoto, T.; Oda, T.; Maeda, K. Characterization of intestinal transporters in human ileal spheroid–derived differentiated cells for the prediction of intestinal drug absorption. Drug Metab. Dispos. 2025, 53, 100075. [Google Scholar] [CrossRef] [Scilit]
- Yamazaki, S.; Evers, R.; De Zwart, L. Physiologically-based pharmacokinetic modeling to evaluate in vitro-to-in vivo extrapolation for intestinal P-glycoprotein inhibition. CPT Pharmacomet. Syst. Pharmacol. 2022, 11, 55–67. [Google Scholar] [CrossRef] [Scilit]
- Chen, Y.; Shao, W.; Wang, X.; Geng, K.; Wang, W.; Li, Y.; Liu, Z.; Xie, H. Physiologically Based Pharmacokinetic Modeling to Assess Ritonavir-Digoxin Interactions and Recommendations for Co-Administration Regimens. Pharm. Res. 2024, 41, 2199–2212. [Google Scholar] [CrossRef] [Scilit] [PubMed]
- Tillement, J.P.; Zini, R.; Lecomte, M.; d’Athis, P. Binding of digitoxin, digoxin and gitoxin to human serum albumin. Eur. J. Drug Metab. Pharmacokinet. 1980, 5, 129–134. [Google Scholar] [CrossRef] [Scilit] [PubMed]
- Askari, A. The sodium pump and digitalis drugs: Dogmas and fallacies. Pharmacol. Res. Perspect. 2019, 7, e00505. [Google Scholar] [CrossRef] [Scilit] [PubMed]
- Iisalo, E. Clinical pharmacokinetics of digoxin. Clin. Pharmacokinet. 1977, 2, 1–16. [Google Scholar] [CrossRef] [Scilit]
- Vazquez-Hernandez, M.; Bouzas, L.; Tutor, J.C. Glomerular filtration rate estimation using the Cockcroft-Gault and modification of diet in renal disease formulas for digoxin dose adjustment in patients with heart failure. Upsala J. Med. Sci. 2009, 114, 154–159. [Google Scholar] [CrossRef] [Scilit]
- Meek, M.E.; Barton, H.A.; Bessems, J.G.; Lipscomb, J.C.; Krishnan, K. Case study illustrating the WHO IPCS guidance on characterization and application of physiologically based pharmacokinetic models in risk assessment. Regul. Toxicol. Pharmacol. 2013, 66, 116–129. [Google Scholar] [CrossRef] [Scilit]
- Steiness, E.; Waldorff, S.; Hansen, P.B. Renal digoxin clearance: Dependence on plasma digoxin and diuresis. Eur. J. Clin. Pharmacol. 1982, 23, 151–154. [Google Scholar] [CrossRef] [Scilit]
- Troutman, M.D.; Thakker, D.R. Efflux ratio cannot assess P-glycoprotein-mediated attenuation of absorptive transport: Asymmetric effect of P-glycoprotein on absorptive and secretory transport across Caco-2 cell monolayers. Pharm. Res. 2003, 20, 1200–1209. [Google Scholar] [CrossRef] [Scilit]
- Katz, A.; Lifshitz, Y.; Bab-Dinitz, E.; Kapri-Pardes, E.; Goldshleger, R.; Tal, D.M.; Karlish, S.J. Selectivity of digitalis glycosides for isoforms of human Na,K-ATPase. J. Biol. Chem. 2010, 285, 19582–19592. [Google Scholar] [CrossRef] [Scilit]
- Sullivan, M.J.; Knight, J.D.; Higginbotham, M.B.; Cobb, F.R. Relation between central and peripheral hemodynamics during exercise in patients with chronic heart failure. Muscle blood flow is reduced with maintenance of arterial perfusion pressure. Circulation 1989, 80, 769–781. [Google Scholar] [CrossRef] [Scilit] [PubMed]
- Gilbert, C.; Cherney, D.Z.; Parker, A.B.; Mak, S.; Floras, J.S.; Al-Hesayen, A.; Parker, J.D. Hemodynamic and neurochemical determinates of renal function in chronic heart failure. Am. J. Physiol. Regul. Integr. Comp. Physiol. 2016, 310, R167–R175. [Google Scholar] [CrossRef] [Scilit]
- Bundgaard, H.; Kjeldsen, K. Human myocardial Na,K-ATPase concentration in heart failure. Mol. Cell. Biochem. 1996, 163, 277–283. [Google Scholar] [CrossRef] [Scilit]
- Schwinger, R.H.; Wang, J.; Frank, K.; Müller-Ehmsen, J.; Brixius, K.; McDonough, A.A.; Erdmann, E. Reduced sodium pump alpha1, alpha3, and beta1-isoform protein levels and Na+,K+-ATPase activity but unchanged Na+-Ca2+ exchanger protein levels in human heart failure. Circulation 1999, 99, 2105–2112. [Google Scholar] [CrossRef] [Scilit] [PubMed]
- Wang, H.; Yuan, W.; Lu, Z. Effects of ouabain and digoxin on gene expression of sodium pump alpha-subunit isoforms in rat myocardium. Chin. Med. J. 2001, 114, 1055–1059. [Google Scholar]
- Baek, M.; Weiss, M. Down-regulation of Na+ pump alpha 2 isoform in isoprenaline-induced cardiac hypertrophy in rat: Evidence for increased receptor binding affinity but reduced inotropic potency of digoxin. J. Pharmacol. Exp. Ther. 2005, 313, 731–739. [Google Scholar] [CrossRef] [Scilit]
- Schwinger, R.H.; Bundgaard, H.; Müller-Ehmsen, J.; Kjeldsen, K. The Na, K-ATPase in the failing human heart. Cardiovasc. Res. 2003, 57, 913–920. [Google Scholar] [CrossRef] [Scilit]
- Marsh, A.J.; Lloyd, B.L.; Taylor, R.R. Age dependence of myocardial Na+-K+-ATPase activity and digitalis intoxication in the dog and guinea pig. Circ. Res. 1981, 48, 329–333. [Google Scholar] [CrossRef] [Scilit]
- Park, M.K. Use of digoxin in infants and children, with specific emphasis on dosage. J. Pediatr. 1986, 108, 871–877. [Google Scholar] [CrossRef] [Scilit] [PubMed]
- Wettrell, G. Distribution and elimination of digoxin in infants. Eur. J. Clin. Pharmacol. 1977, 11, 329–335. [Google Scholar] [CrossRef] [Scilit]
- Kramer, W.G.; Kolibash, A.J.; Lewis, R.P.; Bathala, M.S.; Visconti, J.A.; Reaming, R.H. Pharmacokinetics of digoxin: Relationship between response intensity and predicted compartmental drug levels in man. J. Pharmacokinet. Biopharm. 1979, 7, 47–61. [Google Scholar] [CrossRef] [Scilit]
- Greiner, B.; Eichelbaum, M.; Fritz, P.; Kreichgauer, H.-P.; Von Richter, O.; Zundler, J.; Kroemer, H.K. The role of intestinal P-glycoprotein in the interaction of digoxin and rifampin. J. Clin. Investig. 1999, 104, 147–153. [Google Scholar] [CrossRef] [Scilit] [PubMed]
- Ding, R.; Tayrouz, Y.; Riedel, K.D.; Burhenne, J.; Weiss, J.; Mikus, G.; Haefeli, W.E. Substantial pharmacokinetic interaction between digoxin and ritonavir in healthy volunteers. Clin. Pharmacol. Ther. 2004, 76, 73–84. [Google Scholar] [CrossRef] [Scilit]
- Eckermann, G.; Lahu, G.; Nassr, N.; Bethke, T.D. Absence of pharmacokinetic interaction between roflumilast and digoxin in healthy adults. J. Clin. Pharmacol. 2012, 52, 251–257. [Google Scholar] [CrossRef] [Scilit] [PubMed]
- Gurley, B.J.; Swain, A.; Williams, D.K.; Barone, G.; Battu, S.K. Gauging the clinical significance of P-glycoprotein-mediated herb-drug interactions: Comparative effects of St. John’s wort, Echinacea, clarithromycin, and rifampin on digoxin pharmacokinetics. Mol. Nutr. Food Res. 2008, 52, 772–779. [Google Scholar] [CrossRef] [Scilit] [PubMed]
- Becquemont, L.; Verstuyft, C.; Kerb, R.; Brinkmann, U.; Lebot, M.; Jaillon, P.; Funck-Brentano, C. Effect of grapefruit juice on digoxin pharmacokinetics in humans. Clin. Pharmacol. Ther. 2001, 70, 311–316. [Google Scholar] [CrossRef] [Scilit]
- Jalava, K.-M.; Partanen, J.; Neuvonen, P.J. Itraconazole decreases renal clearance of digoxin. Ther. Drug Monit. 1997, 19, 609–613. [Google Scholar] [CrossRef] [Scilit]
- Ragueneau, I.; Poirier, J.M.; Radembino, N.; Sao, A.B.; Funck-Brentano, C.; Jaillon, P. Pharmacokinetic and pharmacodynamic drug interactions between digoxin and macrogol 4000, a laxative polymer, in healthy volunteers. Br. J. Clin. Pharmacol. 1999, 48, 453–456. [Google Scholar] [CrossRef] [Scilit]
- Martin, D.; Tompson, D.; Boike, S.; Tenero, D.; Ilson, B.; Citerone, D.; Jorkasky, D. Lack of effect of eprosartan on the single dose pharmacokinetics of orally administered digoxin in healthy male volunteers. Br. J. Clin. Pharmacol. 1997, 43, 661–664. [Google Scholar] [CrossRef] [Scilit]
- Hayward, R.; Greenwood, H.; Hamer, J. Comparison of digoxin and medigoxin in normal subjects. Br. J. Clin. Pharmacol. 1978, 6, 81–86. [Google Scholar] [CrossRef] [Scilit] [PubMed]
- Oosterhuis, B.; Jonkman, J.; Andersson, T.; Zuiderwijk, P.; Jedema, J. Minor effect of multiple dose omeprazole on the pharmacokinetics of digoxin after a single oral dose. Br. J. Clin. Pharmacol. 1991, 32, 569–572. [Google Scholar] [CrossRef] [Scilit]
- Ohnhaus, E.; Vozeh, S.; Nuesch, E. Absorption of digoxin in severe right heart failure. Eur. J. Clin. Pharmacol. 1979, 15, 115–120. [Google Scholar] [CrossRef] [Scilit]
- Zhengxiang, L.; Shuxian, F.; Lin, W.; Tongxin, Z.; Hanrong, Y.; Shu, Y. Clinical study on chronopharmacokinetics of digoxin in patients with congestive heart failure. Curr. Med. Sci. 1998, 18, 21–24. [Google Scholar] [CrossRef] [Scilit]
- Miyakawa, T.; Shionoiri, H.; Takasaki, I.; Kobayashi, K.; Ishii, M. The effect of captopril on pharmacokinetics of digoxin in patients with mild congestive heart failure. J. Cardiovasc. Pharmacol. 1991, 17, 576–580. [Google Scholar] [CrossRef] [Scilit]
- Di Cicco, M.; Kantar, A.; Masini, B.; Nuzzi, G.; Ragazzo, V.; Peroni, D. Structural and functional development in airways throughout childhood: Children are not small adults. Pediatr. Pulmonol. 2021, 56, 240–251. [Google Scholar] [CrossRef] [Scilit]
- Cui, C.; Qu, Y.; Sia, J.E.V.; Zhu, Z.; Wang, Y.; Ling, J.; Li, H.; Jiang, Y.; Pan, J.; Liu, D. Assessment of Aging-Related Function Variations of P-gp Transporter in Old-Elderly Chinese CHF Patients Based on Modeling and Simulation. Clin. Pharmacokinet. 2022, 61, 1789–1800. [Google Scholar] [CrossRef] [Scilit]
- Dong, Q.; Chen, C.; Taubert, M.; Bilal, M.; Kinzig, M.; Sörgel, F.; Scherf-Clavel, O.; Fuhr, U.; Dokos, C. Understanding adefovir pharmacokinetics as a component of a transporter phenotyping cocktail. Eur. J. Clin. Pharmacol. 2024, 80, 1069–1078. [Google Scholar] [CrossRef] [Scilit] [PubMed]
- Hanke, N.; Frechen, S.; Moj, D.; Britz, H.; Eissing, T.; Wendl, T.; Lehr, T. PBPK Models for CYP3A4 and P-gp DDI Prediction: A Modeling Network of Rifampicin, Itraconazole, Clarithromycin, Midazolam, Alfentanil, and Digoxin. CPT Pharmacomet. Syst. Pharmacol. 2018, 7, 647–659. [Google Scholar] [CrossRef] [Scilit] [PubMed]
- Farhan, N.; Cristofoletti, R.; Basu, S.; Kim, S.; Lingineni, K.; Jiang, S.; Brown, J.D.; Fang, L.L.; Lesko, L.J.; Schmidt, S. Physiologically-based pharmacokinetics modeling to investigate formulation factors influencing the generic substitution of dabigatran etexilate. CPT Pharmacomet. Syst. Pharmacol. 2021, 10, 199–210. [Google Scholar] [CrossRef] [Scilit]
- Zhang, X.; Yang, Y.; Grimstein, M.; Fan, J.; Grillo, J.A.; Huang, S.M.; Zhu, H.; Wang, Y. Application of PBPK Modeling and Simulation for Regulatory Decision Making and Its Impact on US Prescribing Information: An Update on the 2018–2019 Submissions to the US FDA’s Office of Clinical Pharmacology. J. Clin. Pharmacol. 2020, 60, S160–S178. [Google Scholar] [CrossRef] [Scilit] [PubMed]
- Moj, D.; Hanke, N.; Britz, H.; Frechen, S.; Kanacher, T.; Wendl, T.; Haefeli, W.E.; Lehr, T. Clarithromycin, Midazolam, and Digoxin: Application of PBPK Modeling to Gain New Insights into Drug-Drug Interactions and Co-medication Regimens. AAPS J. 2017, 19, 298–312. [Google Scholar] [CrossRef] [Scilit] [PubMed]
- Shah, A.M.; Solomon, S.D. Phenotypic and pathophysiological heterogeneity in heart failure with preserved ejection fraction. Eur. Heart J. 2012, 33, 1716–1717. [Google Scholar] [CrossRef] [Scilit] [PubMed]

Disclaimer/Publisher’s Note: The statements, opinions and data contained in all publications are solely those of the individual author(s) and contributor(s) and not of MDPI and/or the editor(s). MDPI and/or the editor(s) disclaim responsibility for any injury to people or property resulting from any ideas, methods, instructions or products referred to in the content. |
© 2026 by the authors. Licensee MDPI, Basel, Switzerland. This article is an open access article distributed under the terms and conditions of the Creative Commons Attribution (CC BY) license.