


Abstract
Dryland shrub restoration is often assessed by vegetation recovery, yet belowground microbial organization remains less resolved. We analyzed bacterial 16S rRNA and fungal ITS amplicon sequence variants (ASVs) from four Caragana korshinskii plantations established 5, 10, 20 and 30 years before sampling. Within each plantation, five shrubs were sampled as within-plantation subsamples. Fine roots and rhizosphere samples were collected at 25–30 cm soil depth, while non-rhizosphere soils were collected at the same depth but 10 or 30 cm horizontally from the sampled root system. A soil-chemistry-matched subset defined a PCA-based edaphic axis (PC1 = 48.4%) that ordered the four sampled plantations and was associated with higher soil water content, lower electrical conductivity and lower total nitrogen and soil organic matter in the older plantations. ASV pools contracted from the soil to the rhizosphere and root compartments, indicating hierarchical filtering. Sample-level Bray–Curtis analyses showed strong microhabitat structuring, particularly for bacteria, while null-model analysis assigned most bacterial turnover to homogeneous selection (91.9%). Fungal turnover more often fell into the dispersal-limitation category (79.4%), but this ITS-based result should be interpreted cautiously. Rhizosphere candidate indicators and exploratory association-network summaries suggested differences among plantation age/site classes, including an apparent increase in retained associations in the 10-year plantation; however, these network comparisons are treated as hypothesis-generating because the network for each plantation age/site class was based on only five samples. Because each plantation age/site class was represented by a single plantation, plantation age is confounded with site, and all age-related patterns are interpreted descriptively within this chronosequence rather than as replicated temporal effects.
1. Introduction
Restoration of degraded drylands is not simply the re-establishment of plant cover. In water-limited ecosystems, the persistence of restored vegetation depends on changes in soil water availability, salinity-related constraints, nutrient cycling and biological feedbacks. Microbial communities mediate many of these processes, but their responses to shrub restoration can be difficult to interpret because vegetation development, soil chemistry, root-associated habitats and dispersal constraints change simultaneously [1,2,3].
Root-associated microbiomes are assembled from surrounding soil through nested habitat filters. Non-rhizosphere soil acts as a regional microbial reservoir, the rhizosphere is a chemically active interface shaped by root exudation and nutrient flux, and root-associated material can contain microbes from root surfaces, attached particles and internal tissues depending on sampling and sterilization procedures [4,5,6,7,8,9,10]. This operational distinction is critical: Without validated surface sterilization, root samples should not be interpreted as a strict endosphere. In this study, we therefore use the term root compartment to describe the root tissue-rhizoplane fraction, rather than claiming a strictly endophytic microbiome.
Community assembly theory helps distinguish compositional change from the processes that may generate it. Plant development and drought can redirect rhizosphere recruitment and root-associated microbial dynamics [11,12], while deterministic and stochastic assembly frameworks provide a way to interpret turnover beyond taxonomic dissimilarity alone [13]. Beta-nearest taxon index (betaNTI) and Raup–Crick Bray–Curtis (RCbray) approaches are widely used to classify turnover into selection, dispersal-related and undominated categories [14,15,16,17]. Their interpretation, however, depends on the quality of phylogenetic information and null-model assumptions. This is especially relevant for ITS-based fungal data, for which phylogenetic signals may be weaker and sequence alignment more uncertain than for bacterial 16S rRNA genes. Therefore, fungal assembly categories should be treated as framework-based indications rather than direct measurements of dispersal barriers.
Caragana korshinskii is a xerophytic leguminous shrub widely planted for sand fixation, wind erosion control and revegetation in northern China. Chronosequence studies are useful for evaluating long-term ecological development, but they also require careful interpretation because space-for-time substitution cannot fully exclude historical site differences [18]. Previous work has shown that C. korshinskii plantations can alter soil moisture and carbon–nitrogen pools, but these changes are not necessarily monotonic fertility gains in water-limited landscapes [19,20,21]. Therefore, the key question is not simply whether older plantations harbor more diverse or more functional microbiomes but whether soil conditions and root-associated microbial communities differ systematically among plantation age/site classes and microhabitats.
Here, we analyzed bacterial and fungal ASV datasets from 5-, 10-, 20- and 30-year C. korshinskii plantations. We asked three questions: (i) Does the soil-chemistry-matched subset define a measurable edaphic axis across plantation age/site classes; (ii) how strongly are bacterial and fungal ASV pools filtered from soil to rhizosphere and the operational root compartment; and (iii) do community structure, null-model categories, rhizosphere candidate modules and exploratory association-network summaries show domain-specific patterns? We interpret all contrasts among plantation age/site classes as chronosequence-associated spatial differences rather than direct temporal trajectories within the same plantation.
2. Materials and Methods
2.1. Study Site and Sampling Strategy
This study was conducted in an artificial forest of C. korshinskii located in Wuwei City, Gansu Province, China (37°12′–38°13′ N, 101°59′–104°12′ E). The region has an arid to semi-arid continental climate, with mean annual precipitation of approximately 110–160 mm and mean annual evaporation exceeding 2000 mm. Four plantations established in different years were selected to represent 5-, 10-, 20-, and 30-year stand-age classes. For each age class, one plantation with comparable soil type and vegetation conditions was selected, and five C. korshinskii shrubs were randomly sampled within the plantation.
Four plantations established in different years were selected to represent 5-, 10-, 20-, and 30-year plantation age/site classes. One plantation with comparable soil type and vegetation conditions was selected for each plantation age/site class, and five C. korshinskii shrubs were randomly sampled within the plantation. Because plantation age and site are inseparable in this design, these four groups are referred to consistently throughout as plantation age/site classes.
The five shrubs represented within-plantation spatial subsamples rather than independent plantation-level replicates. Accordingly, plantation age was completely confounded with site in this chronosequence, and statistical contrasts among plantation age/site classes were interpreted descriptively rather than as replicated temporal effects.
Sampling was standardized to fine roots encountered at a vertical soil depth of 25–30 cm. This interval was selected because field excavation consistently located fine roots at this depth and because previous C. korshinskii rhizosphere work identified root-hair-rich roots at approximately 30–40 cm below the soil surface [21], supporting sampling within the shallow active-root zone while maintaining a consistent depth among plantations. Root and rhizosphere samples were collected from this soil layer. Rhizosphere soil was defined as soil tightly adhering to fine roots after gentle shaking, whereas the operational root compartment consisted of root material remaining after removal of loosely attached soil. Non-rhizosphere soil was collected from the same 25–30 cm vertical layer at horizontal distances of 10 and 30 cm from the sampled root system. Thus, “Soil 10 cm” and “Soil 30 cm” refer to horizontal distance from the root system rather than sampling depth.
Each sampled shrub yielded four operational microbiome sample types: soil at 10 cm, soil at 30 cm, rhizosphere and root compartment. Five shrub-level samples were collected for each sample type within each plantation, yielding 20 samples per plantation age/site class and 80 microbiome samples in total. Each sample was retained separately and subjected to an independent DNA extraction; no field samples or DNA extracts were pooled. Only triplicate PCR products derived from the same DNA sample were pooled before library preparation. Because surface sterilization and sterilization-efficiency controls were not performed, the root compartment was operationally defined as a root tissue–rhizoplane fraction rather than a strict endosphere. All samples were transported to the laboratory on ice and stored at −80 °C until DNA extraction.
2.2. DNA Extraction, ASV Inference and Taxonomic Assignment
Total genomic DNA was extracted from soil and root samples using the FastDNA Spin Kit (MP Biomedicals, Solon, OH, USA), following the manufacturer’s protocol. Bacterial communities were profiled by amplifying the V5–V6 region of the 16S rRNA gene using primers 799F (5′-AACMGGATTAGATACCCKG-3′) and 1115R (5′-AGGGTTGCGCTCGTTG-3′) [22,23]. Fungal communities were profiled using primers ITS1F (5′-CTTGGTCATTTAGAGGAAGTAA-3′) and ITS2R (5′-GCTGCGTTCTTCATCGATGC-3′) [24,25]. PCR amplification was performed in triplicate for each sample, and products from replicate reactions were pooled, purified and sequenced on an Illumina MiSeq PE300 platform (Illumina, San Diego, CA, USA).
Paired-end reads were processed as ASVs using a DADA2 (v1.34.0)-based workflow [26]. Default DADA2 filtering settings were used unless overridden by read-quality profiles: maxN = 0, maxEE = 2 for each read, truncQ = 2, minLen = 20, and truncLen = 0. Reads were dereplicated, denoised, merged and screened for chimeras using the consensus chimera-removal method. Taxonomy was assigned using SILVA for bacterial 16S rRNA ASVs and UNITE for fungal ITS ASVs [27,28].
Non-target ASVs were inspected before ecological analyses. In the supplied bacterial ASV table, no chloroplast ASVs were detected, and 63 mitochondrial ASVs comprising 729 reads (0.013% of total bacterial reads) were flagged for exclusion. ASVs with extremely low abundance or low prevalence were filtered before downstream analyses according to the thresholds specified for each analysis.
2.3. Soil Environmental Measurements and PCA-Derived Environmental Axis
Soil environmental variables included soil water content (SWC), total nitrogen (TN), soil organic matter (SOM), electrical conductivity (EC), pH and total phosphorus (TP). These measurements were available for a soil-chemistry-matched subset and were not assumed to represent complete physicochemical coverage of all microbiome samples. Environmental profiles by plantation age/site class were summarized using means, standard deviations and standard errors.
Each variable was standardized by Z-score transformation before PCA. The oriented first principal component was retained as a descriptive PCA-derived Edaphic Gradient Index (EGI) [29]. EGI is an author-derived summary of multivariate soil chemistry and is not a validated “restoration index”. PCA, Spearman’s rank correlation and Kruskal–Wallis calculations were conducted in R v4.4.3. Because each plantation age/site class was represented by a single plantation, plantation age and site are confounded. Therefore, age-associated trends, including Spearman and Kruskal–Wallis outputs generated from shrub-level subsamples, are treated only as descriptive within-dataset summaries and are not used as inferential tests of replicated plantation-age effects. Linear fits, where shown, are likewise descriptive visual summaries. The loadings of SWC, TN, SOM, EC, pH and TP on PC1 and PC2 are reported in Supplementary Table S1.
2.4. Soil-Root Filtering, Diversity and Beta-Diversity Analysis
ASV pools were constructed for each plantation age/site class and microhabitat. An ASV was considered present in a group when it had a count of at least one in at least one sample from that group. For the filtering analysis only, soil at 10 cm and soil at 30 cm were combined as an upstream soil reservoir so that cumulative soil-to-rhizosphere and soil-to-root retention could be quantified. In contrast, soil at 10 cm and soil at 30 cm were retained as separate microhabitats in beta-diversity and null-model analyses to preserve horizontal-distance-specific community structure. Retention between upstream and downstream compartments was calculated as the number of shared ASVs divided by the upstream ASV-pool size. Filtering strength was calculated as 1 − retention. Root-compartment source categories were based on ASV occurrence in the corresponding soil and rhizosphere pools and do not imply confirmed internal colonization.
Observed richness was defined as the number of non-zero ASVs per sample, and Shannon diversity was calculated from filtered ASV count tables. Bray–Curtis dissimilarities were calculated from relative-abundance tables after library-size normalization to sample-wise proportions. These analyses were implemented in R using vegan 2.6-4 [30,31]: Shannon diversity with vegan::diversity, Bray–Curtis dissimilarity with vegan::vegdist, PERMANOVA with vegan::adonis2, and multivariate dispersion with vegan::betadisper followed by permutation testing. The sample-level PERMANOVA used 9999 permutations and the model community dissimilarity ~ plantation age/site class × microhabitat [30]. Because only one plantation represented each plantation age/site class, the plantation age/site term is confounded with site; its R2 and p values are therefore reported only as descriptive partitioning within the sampled chronosequence and are not interpreted as replicated plantation-age inference. Microhabitat contrasts are interpreted primarily as within-chronosequence compartment structure. Homogeneity of multivariate dispersion was evaluated for the corresponding grouping factors and interpreted jointly with PERMANOVA [31,32].
2.5. Phylogenetic Null-Model Analysis
Phylogenetic community analyses were performed in R v4.4.3 using picante v1.8.2 and ape v5.8.1. ASV-level phylogenetic trees were matched to the corresponding community abundance matrices using functions implemented in ape. Community assembly categories were inferred using the beta-nearest taxon index (βNTI) and Bray–Curtis-based Raup–Crick metric (RCbray) within each plantation age/site class × microhabitat group [14,15]. βNTI quantifies the standardized deviation of observed between-community phylogenetic turnover (βMNTD) from a randomized null expectation; values outside ±2 indicate turnover that is stronger or weaker than expected under the null model. When |βNTI| ≤ 2, RCbray evaluates whether abundance-based taxonomic dissimilarity is greater or lower than expected by chance. ASV-level phylogenetic trees were pruned to match the bacterial and fungal abundance matrices. Abundance-weighted βMNTD was calculated among the five shrub-level subsamples within each plantation age/site class × microhabitat group using a phylogenetic-community workflow based on the picante framework [33]. Null distributions were generated by randomizing taxa across the phylogeny, and βNTI was calculated as the standardized deviation of observed βMNTD from its null expectation. RCbray was estimated using null communities that preserved sample sequencing depth and observed richness while drawing taxa from the regional abundance pool.
Turnover was assigned to assembly categories using conventional thresholds: βNTI > 2, heterogeneous selection (greater phylogenetic turnover than expected under variable selection regimes); βNTI < −2, homogeneous selection (lower phylogenetic turnover than expected under similar selection regimes); |βNTI| ≤ 2 and RCbray > 0.95, dispersal limitation (greater taxonomic turnover than expected when selection is not dominant); |βNTI| ≤ 2 and RCbray < −0.95, homogenizing dispersal (lower taxonomic turnover than expected, consistent with high exchange); and |βNTI| ≤ 2 with |RCbray| ≤ 0.95, undominated processes, for which no single selection/dispersal category exceeds the decision thresholds and drift or weak processes may contribute [14,15,16,17]. For fungal ITS data, these categories were interpreted as framework-based indications because ITS phylogenetic signal can be weaker than that of 16S rRNA genes.
2.6. Core ASVs, Candidate Indicators and Association Networks
Core and candidate-indicator analyses were restricted to the rhizosphere subset. Core ASVs were defined separately for each plantation age/site class using prevalence ≥ 50% and mean relative abundance ≥ 0.0001. Candidate indicators were identified using the IndVal framework implemented in indicspecies v1.8.0 [34]. Because no ASV passed FDR-adjusted significance, the analysis was treated as exploratory, and candidate indicators were defined as ASVs with permutation p ≤ 0.05 and IndVal ≥ 0.25. Candidate modules contrasting younger and older plantation age/site classes were summarized using cumulative relative abundance, but individual ASVs were not interpreted as confirmed biomarkers.
Cross-domain networks were constructed separately for each plantation age/site class from matched bacterial and fungal ASV tables. ASVs with prevalence ≥ 20% and mean relative abundance ≥ 1 × 10⁻⁴ were retained, and the top 220 bacterial and top 220 fungal ASVs were selected per plantation age/site class using a combined prevalence-abundance score. Counts were transformed using a centered log-ratio transformation after adding a small pseudocount. Pairwise Spearman correlations were calculated in R v4.4.3 using the stats package, and edges were retained when |ρ| ≥ 0.60 and FDR-adjusted p ≤ 0.05. Network objects and topological characteristics were analyzed using igraph v2.3.1. Networks were treated as undirected weighted association graphs. Node degree was calculated using igraph::degree; community structure was evaluated using the Louvain algorithm implemented in igraph::cluster_louvain; and network modularity was calculated using igraph::modularity. Because each plantation age/site class contained only five samples (n = 5), the four networks (one per plantation age/site class) were treated as exploratory descriptive analyses rather than stable estimates of ecological association structure. No formal inference about edge stability, between-network differences, or keystone taxa was made. Given the very small sample size relative to the number of retained features, resampling-based stability analysis would not overcome the limited effective sample size; network metrics were therefore used only as sample-dependent descriptive summaries under identical filtering and correlation thresholds [35,36,37].
2.7. Taxon-Based Functional Proxy Synthesis and Visualization
Genus-level relative abundance tables were summarized into taxon-based functional proxy groups. Bacterial proxy groups included nitrogen cycling/symbiosis, plant-beneficial potential, stress resilience, oligotrophic/desert adaptation and carbon decomposition, using a curated genus-to-proxy mapping based on FAPROTAX categories and published ecological information where applicable [38]. Fungal proxies included mycorrhizal potential, saprotrophic decomposition, potential plant pathogens and stress-tolerant dark fungi using FUNGuild and literature-based annotations [39,40]. Network-related interpretation followed the compositional-data and microbial-network cautions described in previous studies [35,36,37].
A bacterial restoration proxy, fungal remodeling proxy and potential pathogen-pressure proxy were calculated by summing the relative abundance of assigned genera. The custom proxy index was calculated as the standardized bacterial restoration proxy plus standardized fungal remodeling proxy minus standardized potential pathogen pressure. This index was used only as a visualization and hypothesis-generating synthesis. It does not represent measured ecosystem function, enzyme activity, nitrogen fixation, decomposition rate or disease incidence. Visualizations were generated in R v4.4.3 using vegan and ggplot2 v4.0.3-based workflows [41,42].
3. Results
3.1. The Soil-Chemistry Subset Defines an Edaphic Axis and a Hierarchical Soil-Root ASV Gradient
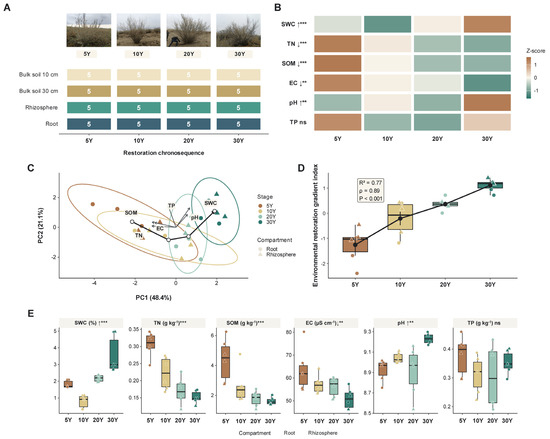
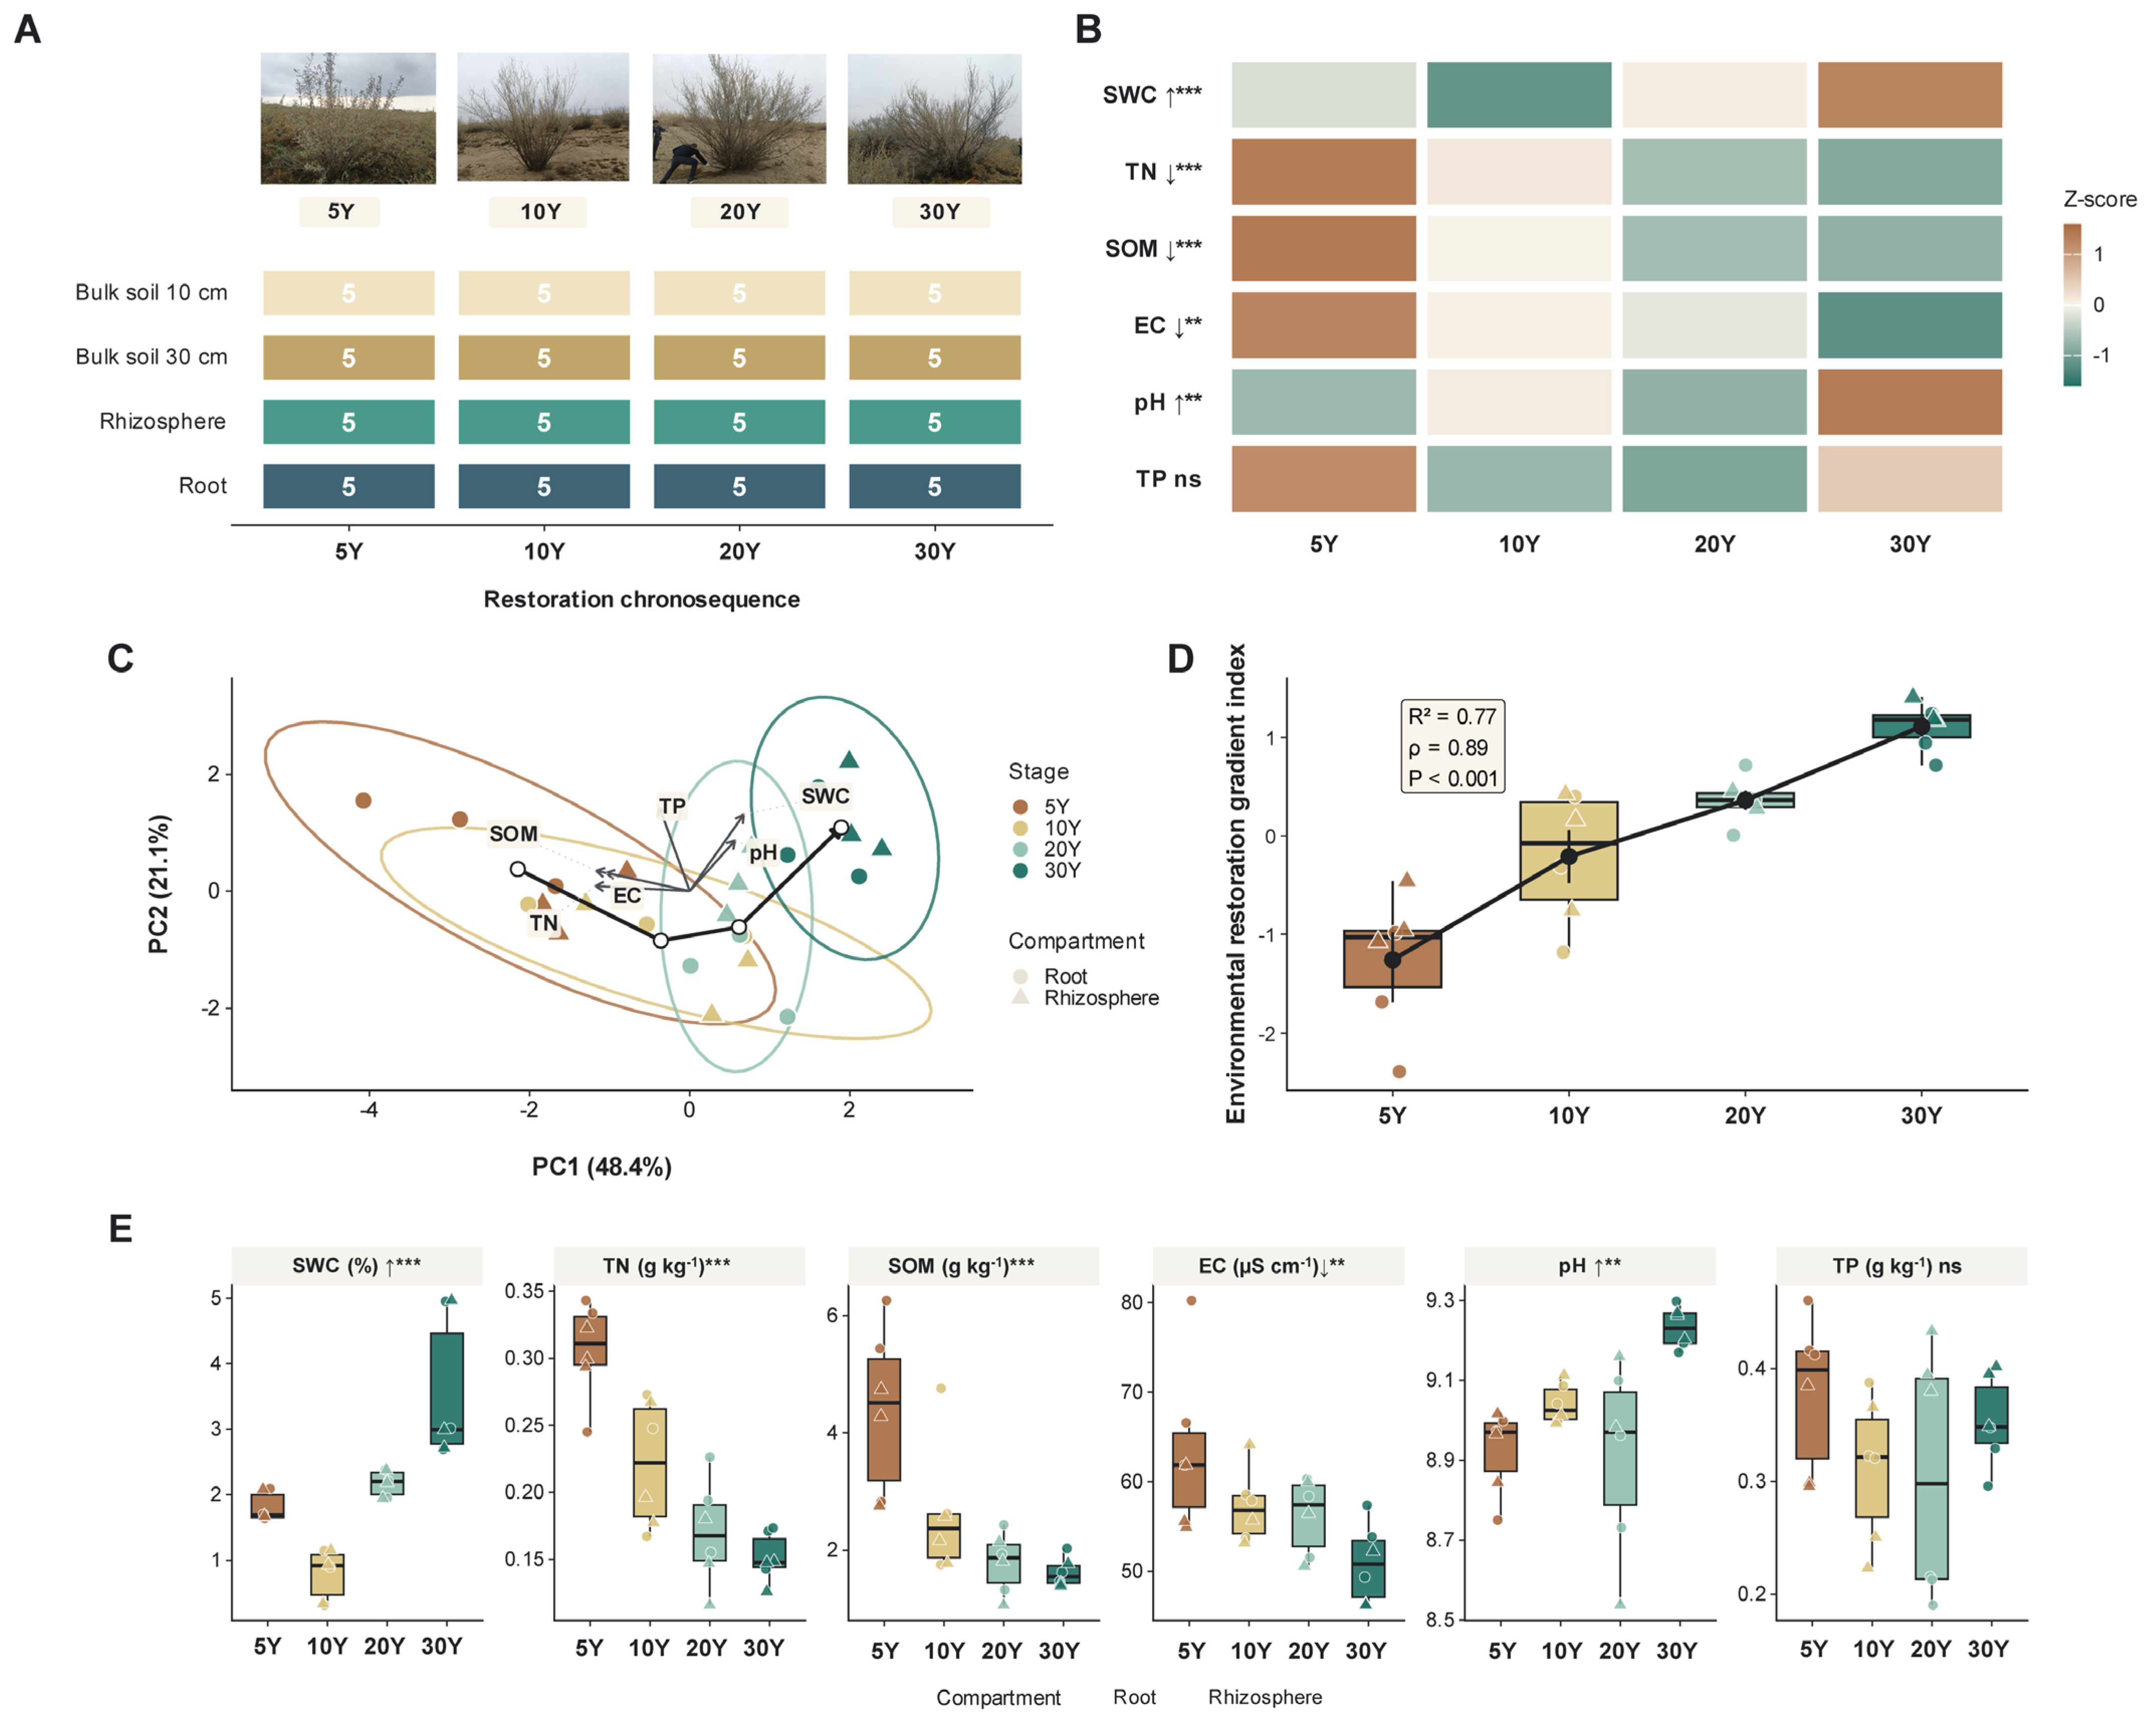
The environmental analysis was intentionally restricted to the soil-chemistry-matched subset shown in Figure 1 and was not treated as a complete physicochemical profile for all microbiome samples. Within this subset, the first two PCA axes explained 69.5% of the measured edaphic variation (PC1 = 48.4%; PC2 = 21.1%). The oriented PC1 score was summarized as a PCA-derived Edaphic Gradient Index (EGI), with mean scores of −1.26, −0.21, 0.36, and 1.11 for the 5-, 10-, 20-, and 30-year plantations, respectively (Figure 1D). This monotonic ordering describes the four sampled plantations but is not treated as an inferential plantation-age trend because each plantation age/site class is represented by a single plantation. Spearman and Kruskal–Wallis calculations based on shrub-level subsamples are therefore considered descriptive only and are not used as evidence of a replicated age effect. The loadings of SWC, TN, SOM, EC, pH and TP on PC1 and PC2 are reported in Supplementary Table S1. EGI is used only as a compact description of the measured soil-chemistry gradient, not as an independently validated restoration index or proof of temporal causality.
Figure 1.
Soil-chemistry-matched samples define a PCA–derived edaphic axis across the sampled Caragana korshinskii plantation age/site classes. (A) Chronosequence and belowground sampling design. (B) Standardized soil environmental profiles across plantation age/site classes. SWC, soil water content; TN, total nitrogen; SOM, soil organic matter; EC, electrical conductivity; TP, total phosphorus. (C) PCA of scaled soil variables, showing environmental vectors and the contributions of soil variables to PC1 and PC2; complete loadings are reported in Supplementary Table S1. (D) PCA–derived Edaphic Gradient Index (EGI) calculated from oriented PC1 scores. (E) Differences in representative soil variables among plantation age/site classes. EGI is an author-derived descriptive axis and should not be interpreted as an independently validated restoration index. In panel C, arrows indicate environmental loading vectors. Asterisks in panels B and E indicate differences among plantation age/site classes (** p < 0.01; *** p < 0.001); ns, not significant.
The individual variables in Figure 1B,E show why this gradient should be interpreted as edaphic reconfiguration rather than uniform fertility improvement. Soil water content was higher and electrical conductivity lower in the older sampled plantations, indicating differences in water- and salinity-related conditions. By contrast, total nitrogen and soil organic matter were lower along the same chronosequence, and total phosphorus showed no uniform pattern among plantation age/site classes. Thus, the soil-chemistry subset does not support a simple statement that older plantations had uniformly greater fertility. It instead indicates a resource-stress landscape in which water-related conditions differed while measured N and organic matter pools were lower in the sampled root-associated soil fractions of older plantations.
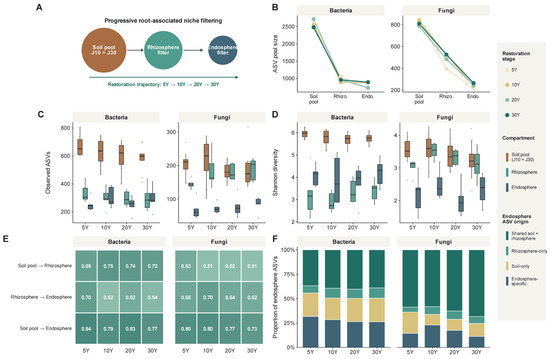
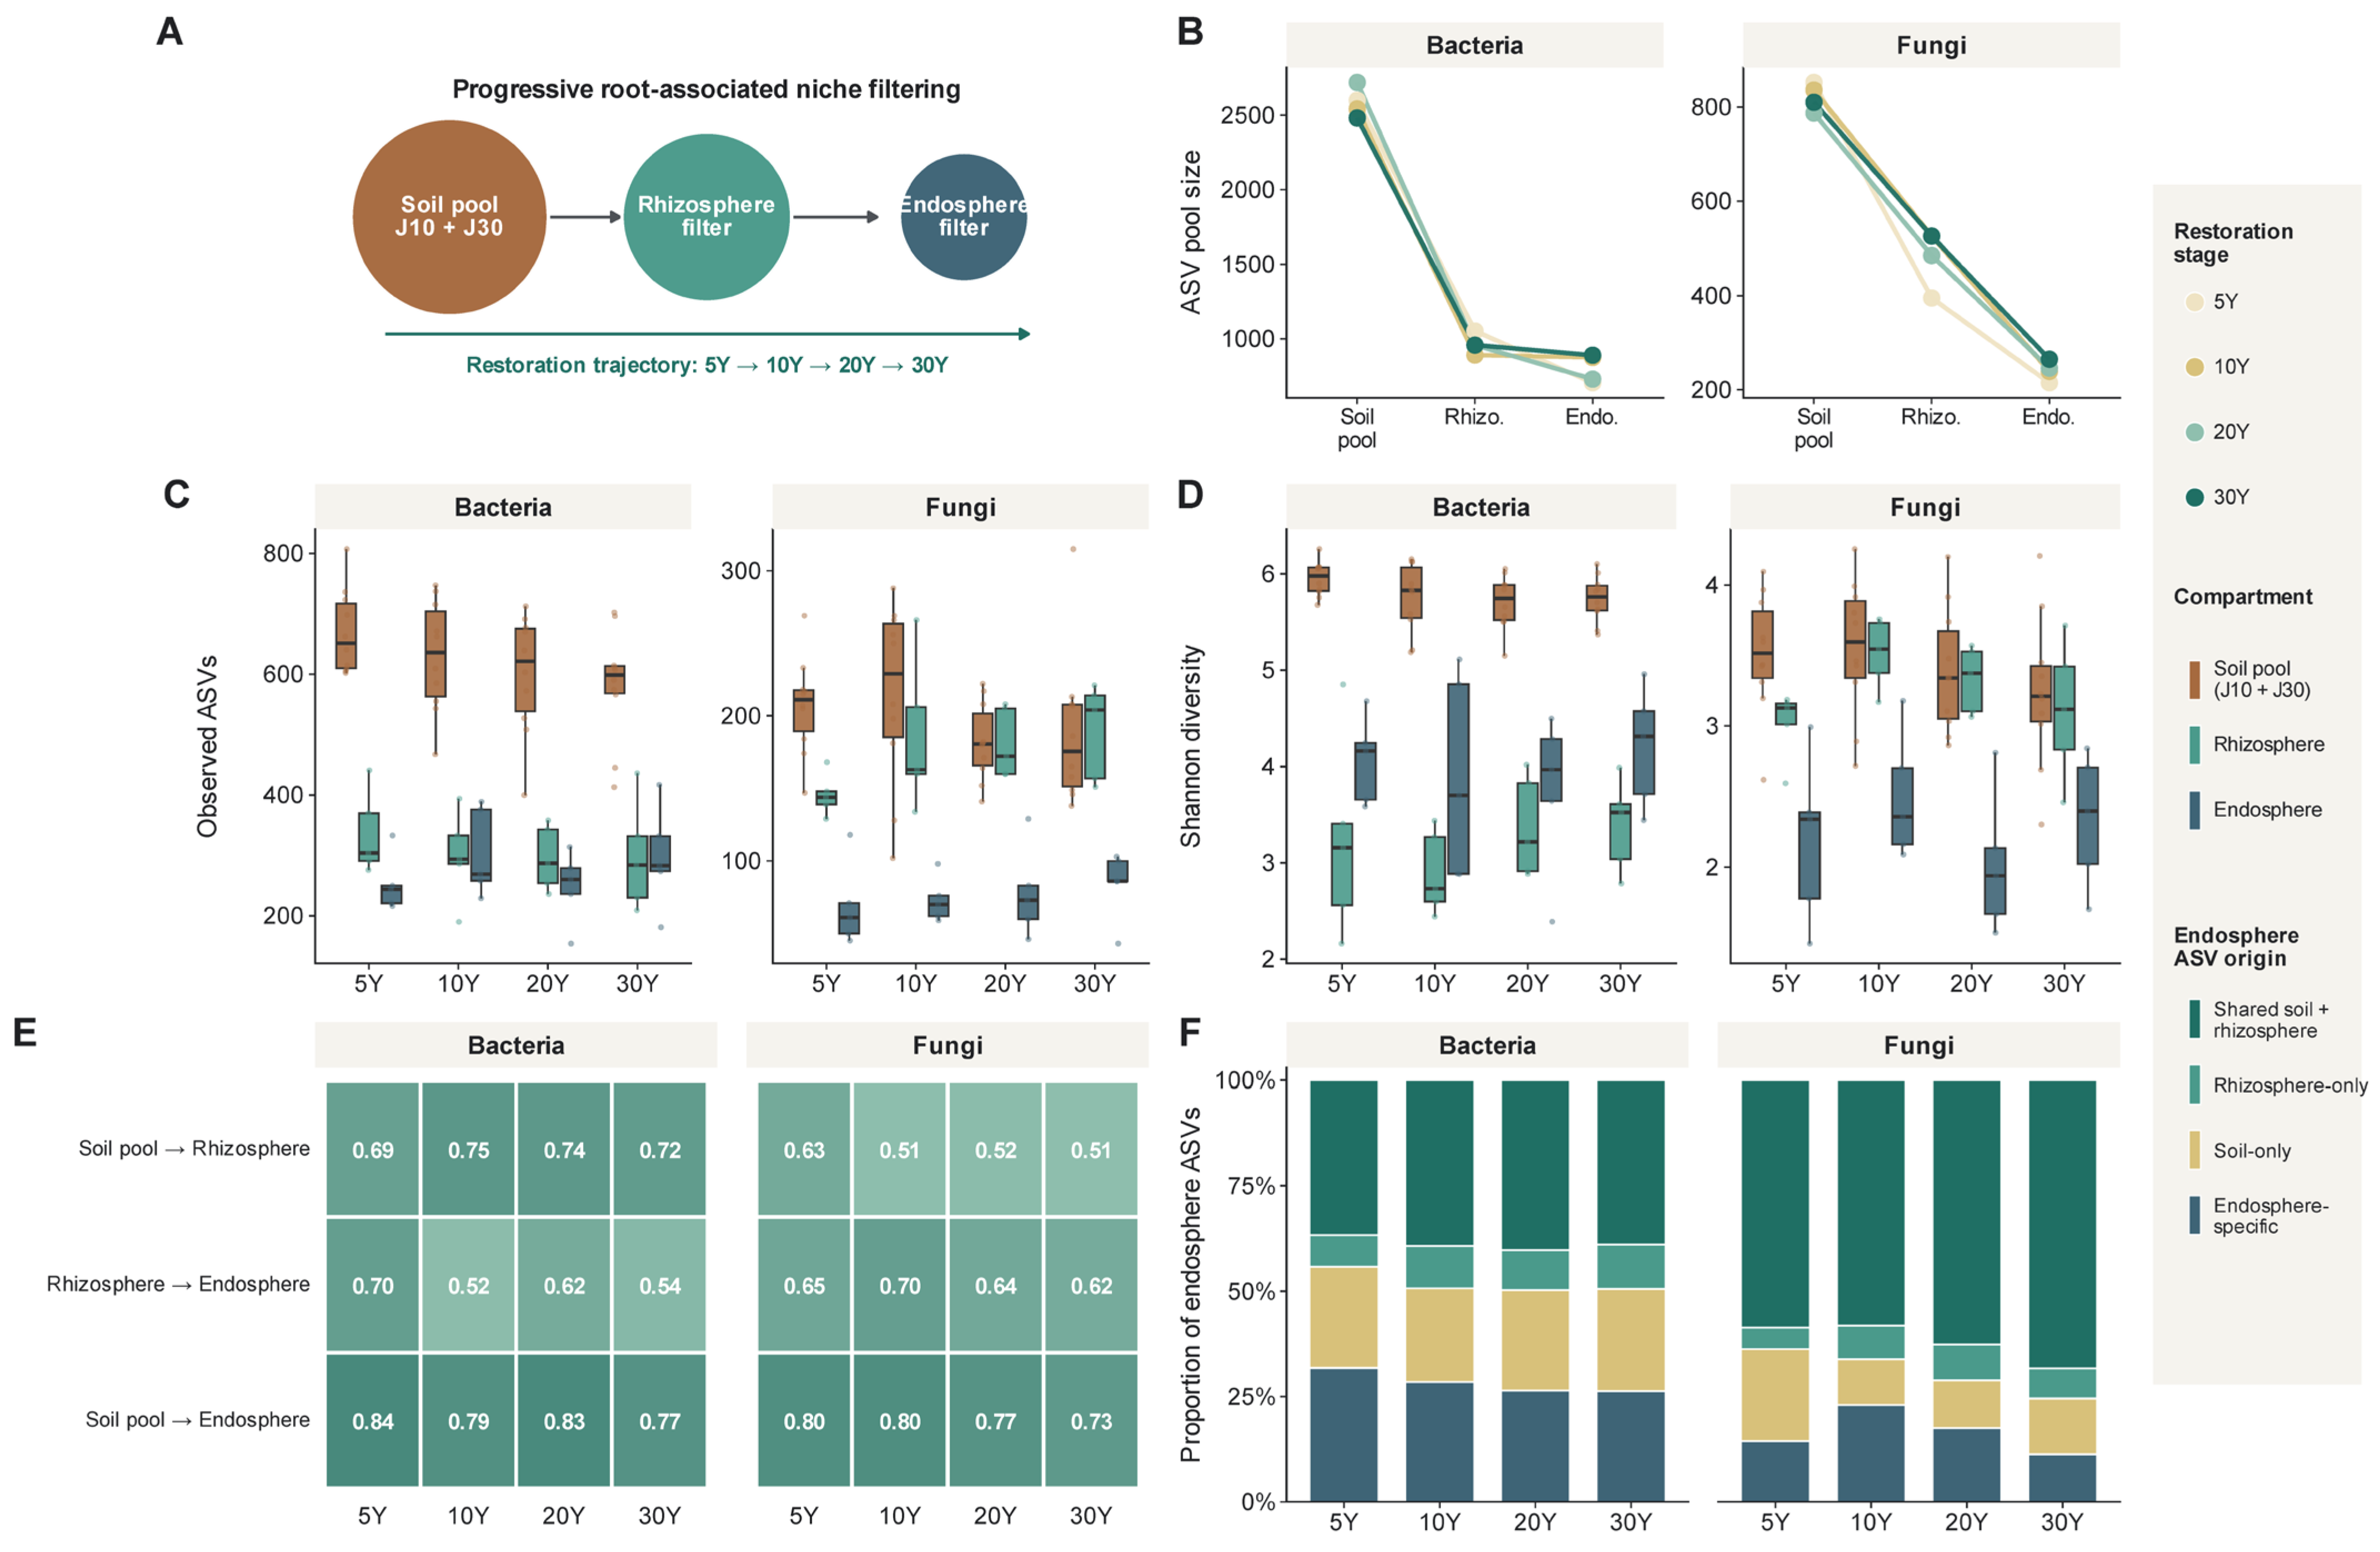
The ASV pool data in Figure 2 show strong compartment-associated filtering within the same chronosequence. Soil-pool richness was consistently larger than rhizosphere and root-compartment pools in both microbial domains. Bacterial soil-pool richness ranged from 2482 to 2720 ASVs, whereas rhizosphere and root-compartment pools contained 891–1053 and 705–890 ASVs, respectively (Figure 2B). Fungal pools showed a sharper contraction toward the root-associated fraction: 787–852 ASVs occurred in the soil pool, 395–526 in the rhizosphere, and 215–265 in the root compartment. Importantly, the direction and magnitude of this soil-to-root contraction were broadly similar across the four plantation age/site classes, indicating that hierarchical compartment filtering was a persistent feature of the sampled system rather than a pattern restricted to one age/site class. Sample-level richness and Shannon diversity followed the same compartment hierarchy (Figure 2C,D), supporting the conclusion that local diversity loss was primarily associated with soil–root compartmentalization rather than a direct, monotonic plantation-age effect.
Figure 2.
Hierarchical and domain-specific filtering of bacterial and fungal ASVs across the soil pool, rhizosphere and operational root compartment. (A) Soil-to-root filtering model. (B) ASV pool sizes across compartments and plantation age/site classes. (C,D) Observed richness and Shannon diversity. (E) Filtering strength across soil-to-rhizosphere, rhizosphere-to-root and soil-to-root transitions. (F) Root-compartment ASV source partitioning based on occurrence in soil and rhizosphere pools. Colors denote plantation age/site classes and microhabitat/source categories as indicated in the figure legends.
Filtering-strength values in Figure 2E further show that the filtering hierarchy differed between bacteria and fungi. For bacteria, soil-to-rhizosphere filtering ranged from 0.69 to 0.75, and soil-to-root filtering ranged from 0.77 to 0.84, while rhizosphere-to-root filtering varied more strongly among plantation age/site classes (0.52–0.70). For fungi, soil-to-rhizosphere filtering was lower (0.51–0.63), but rhizosphere-to-root filtering remained high (0.62–0.70), indicating a stronger inner-root barrier under the operational sampling definition. Figure 2F also separates root-compartment ASVs by their occurrence in upstream pools. Because root material was not confirmed by surface-sterilization controls, root-specific ASVs are interpreted only as ASVs restricted to the processed root tissue–rhizoplane fraction, not as validated endophytes.
3.2. Beta Diversity and Null-Model Categories Reveal Domain-Specific Structuring
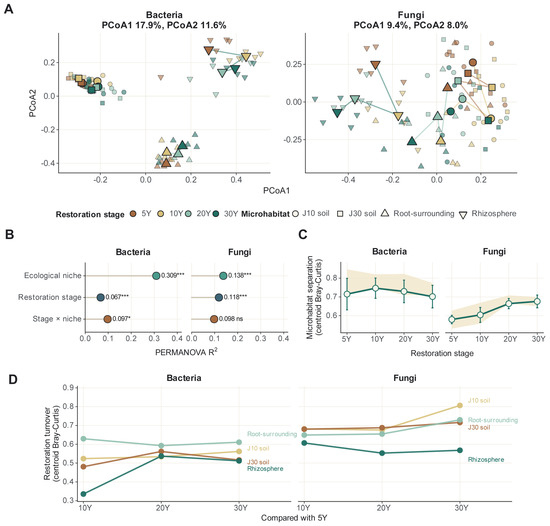
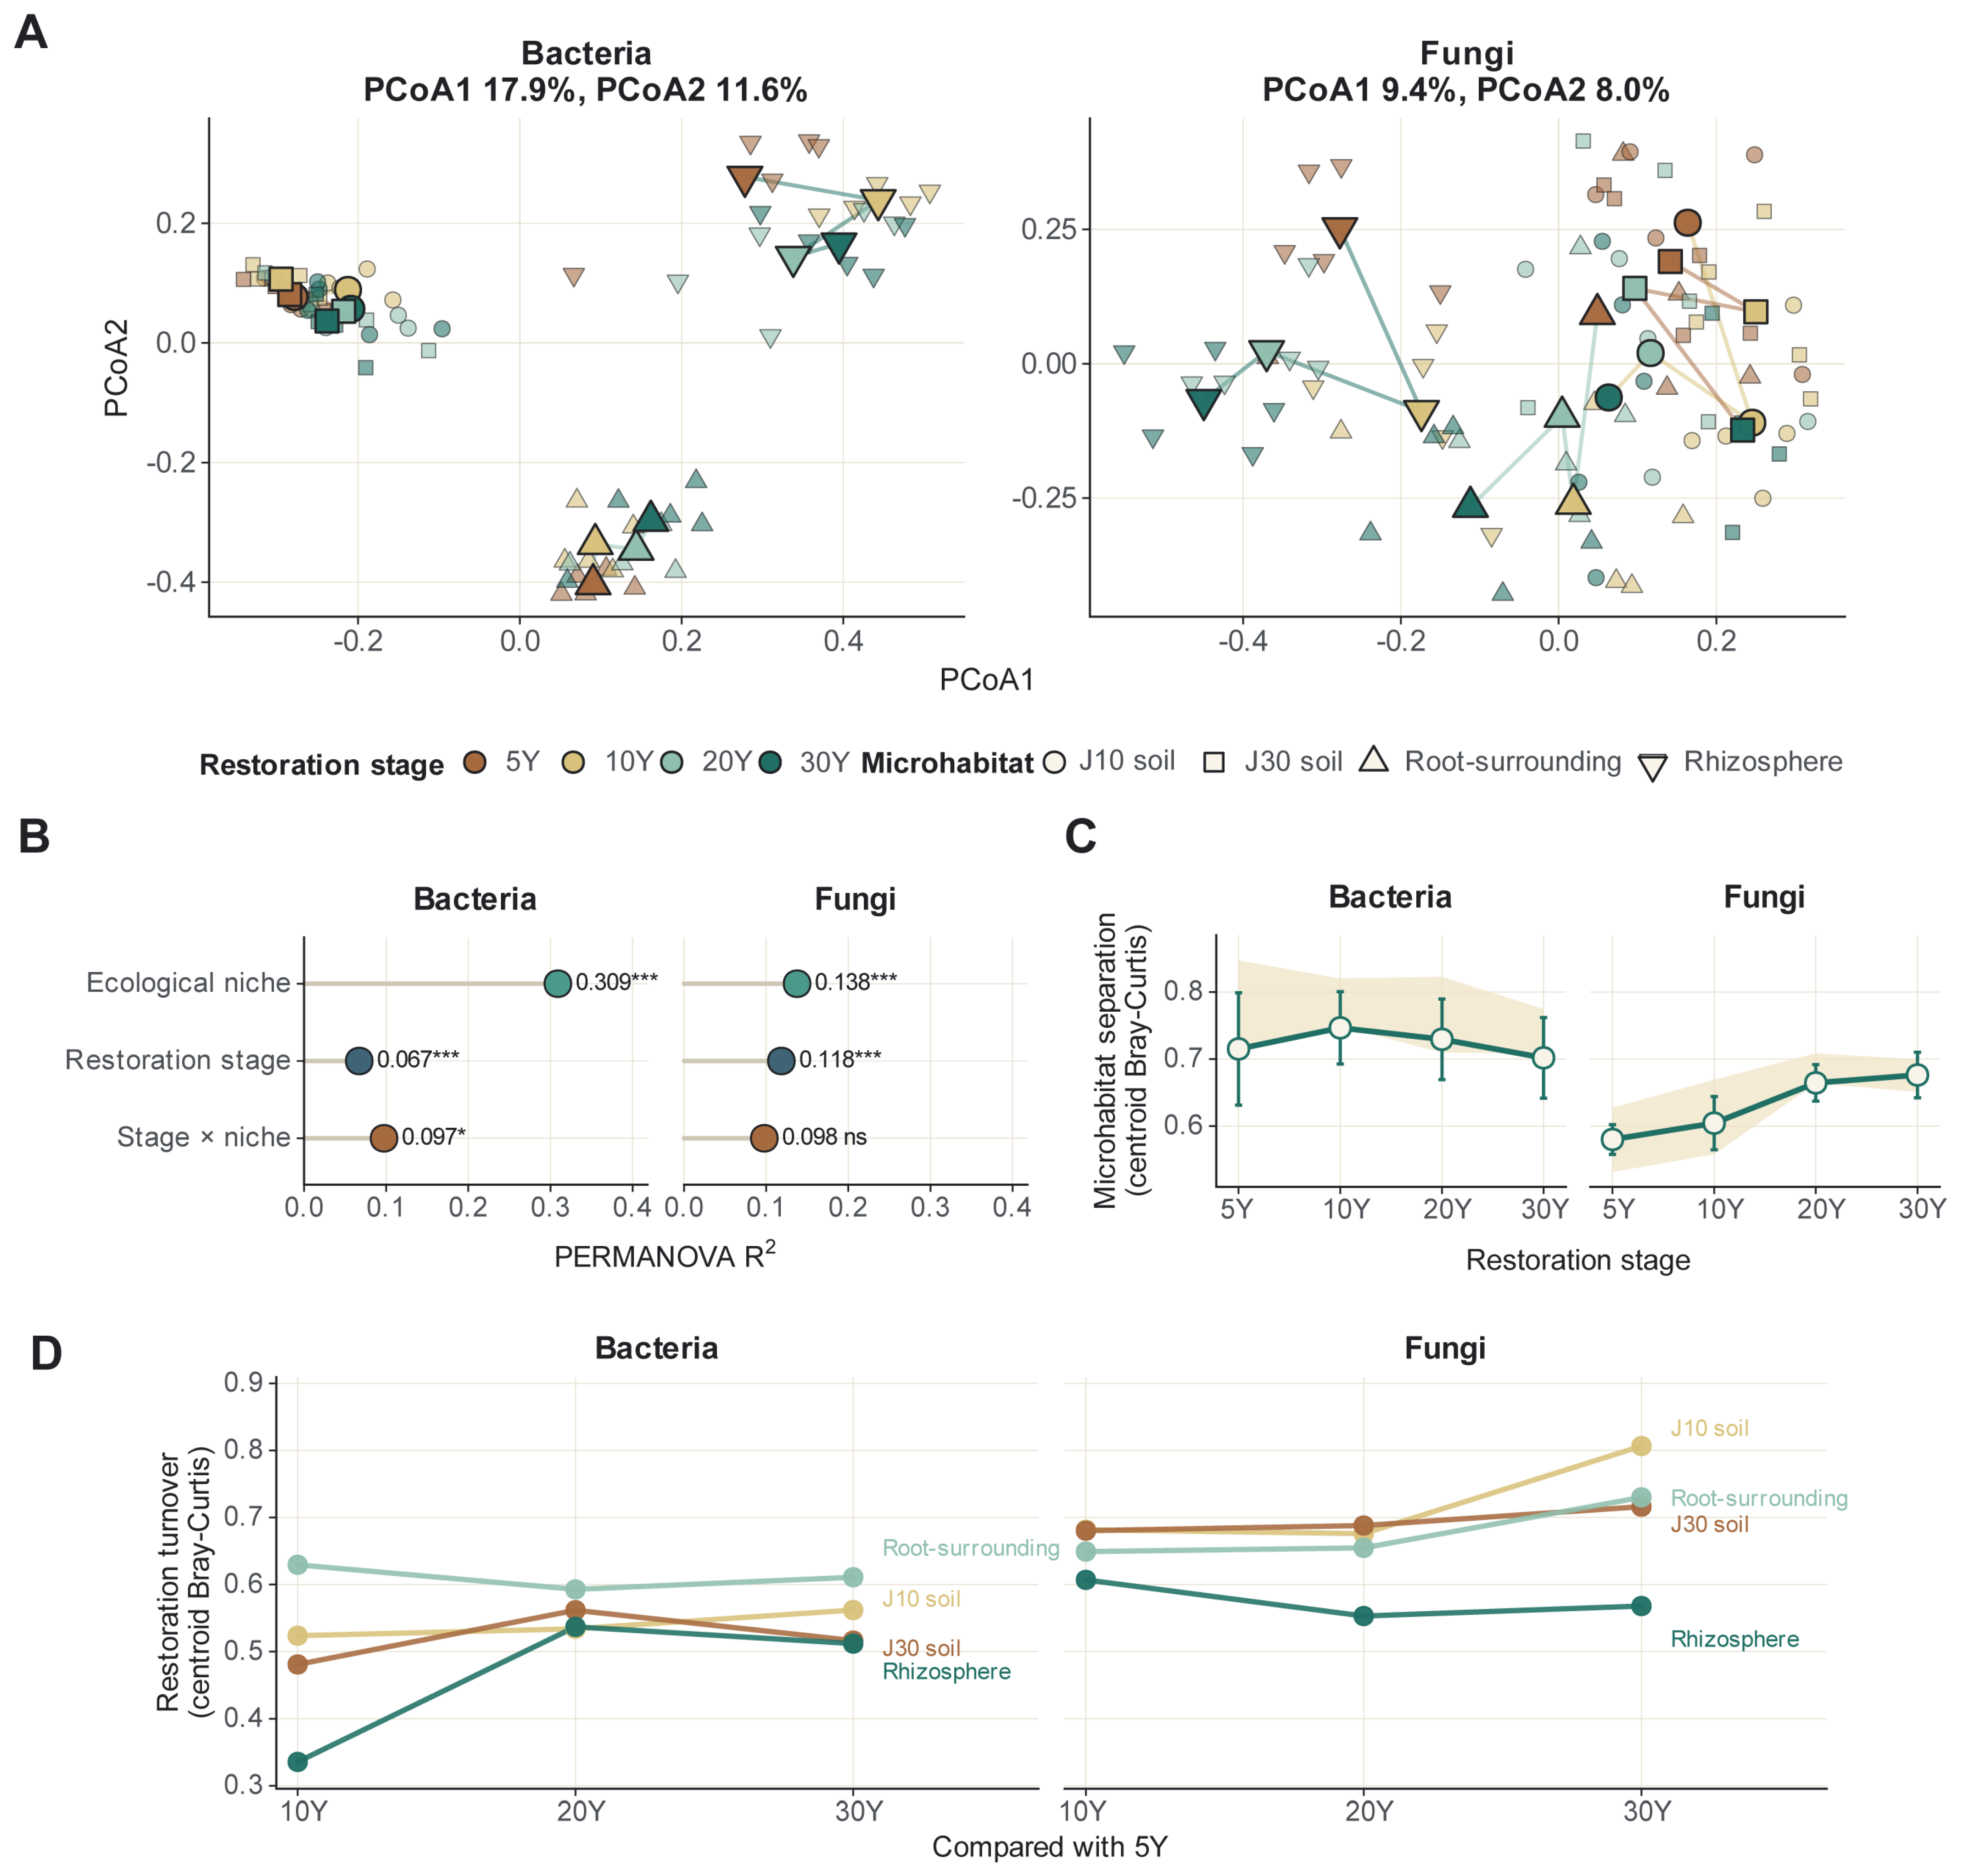
Bray–Curtis PCoA showed separation associated with both plantation age/site class and microhabitat, but these patterns must be interpreted in light of the sampling hierarchy (Figure 3A). For bacteria, PCoA1 and PCoA2 explained 17.9% and 11.6% of community variation, and the ordination showed a pronounced microhabitat gradient. The sample-level PERMANOVA partitioned 30.9% of bacterial variation to microhabitat, 6.7% to plantation age/site, and 9.7% to their interaction (Figure 3B). For fungi, PCoA1 and PCoA2 explained 9.4% and 8.0% of variation, with 13.8% partitioned to microhabitat and 11.8% to plantation age/site. Because each plantation age/site class corresponds to one plantation, the plantation age/site term is inseparable from site, and its permutation p value is not interpreted as evidence of an independently replicated age effect. The same caution applies to the interaction term. PERMDISP analysis showed that multivariate dispersion did not differ significantly among plantation age/site classes for either bacteria (F = 0.785, p = 0.506) or fungi (F = 1.332, p = 0.270). In contrast, dispersion differed strongly among microhabitats for both bacteria (F = 12.212, p < 0.001) and fungi (F = 25.523, p < 0.001). Therefore, significant microhabitat-associated PERMANOVA effects cannot be attributed exclusively to differences in community centroids and may reflect a combination of centroid separation and heterogeneous within-group dispersion. Accordingly, plantation age/site-associated PERMANOVA statistics are treated only as descriptive variance partitioning within this chronosequence and are not interpreted as independently replicated age effects. The same caution applies to the plantation age/site × microhabitat interaction.
Figure 3.
Plantation age/site class and soil–root microhabitat structure bacterial and fungal beta-diversity patterns within the sampled chronosequence. (A) Bray–Curtis PCoA of bacterial and fungal communities. (B) PERMANOVA effect sizes for plantation age/site class, microhabitat and their interaction. (C) Microhabitat separation estimated from centroid distances within each plantation age/site class. (D) Community dissimilarity of later plantations relative to the 5–year reference within each microhabitat. PERMANOVA interpretation is paired with PERMDISP diagnostics because dispersion can influence distance-based tests. Significance codes in panel (B) are * p < 0.05 and *** p < 0.001; ns, not significant.
The centroid summaries in Figure 3C,D clarify figure-level patterns. Bacterial microhabitat separation remained pronounced across the four plantation age/site classes, whereas fungal microhabitat separation was greater in the older sampled plantations than in the younger plantations, indicating that the magnitude of fungal compartment differentiation varied across the chronosequence. Contrasts between the 5-year reference plantation and later plantation age/site classes also differed among microhabitats, particularly for fungi. Because the design is a space-for-time substitution, these contrasts are interpreted as differences among sampled plantations rather than measured temporal trajectories within the same plantation.
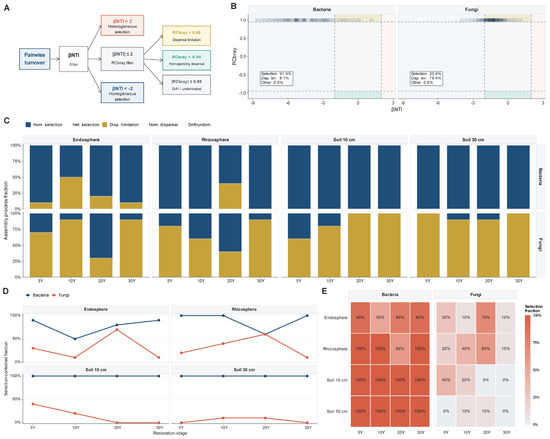
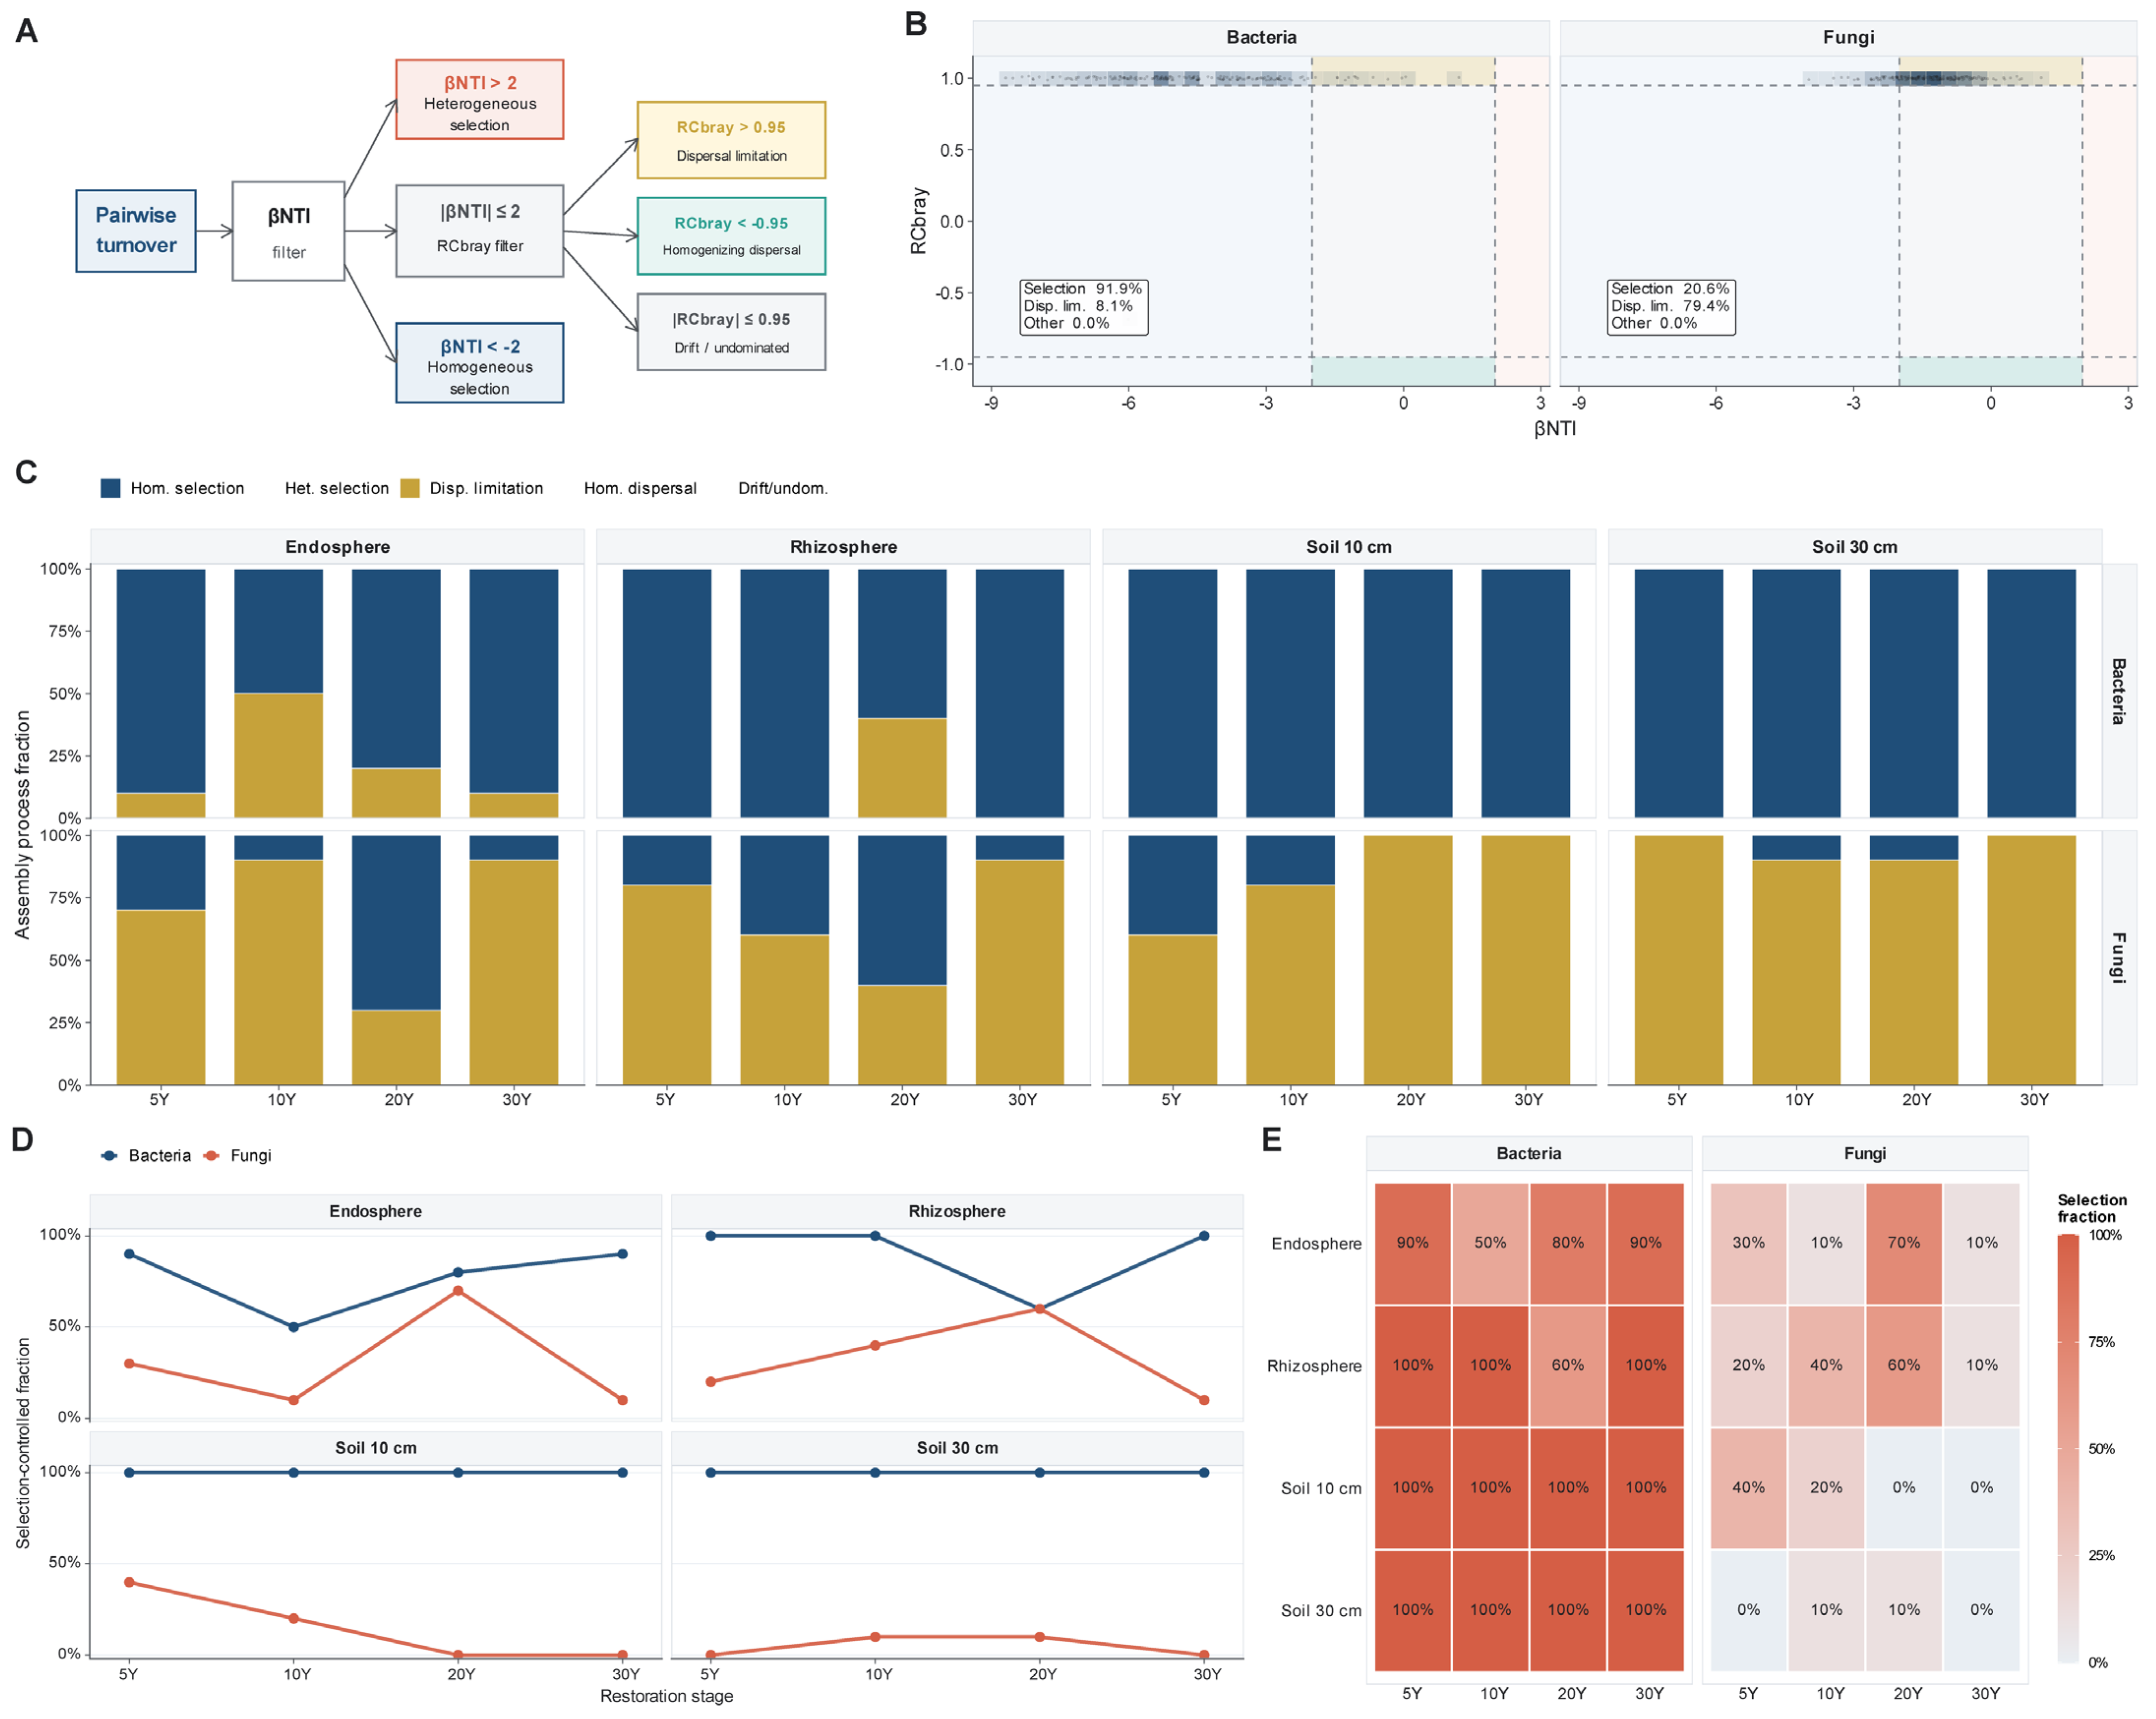
The βNTI–RCbray analysis assigned bacterial and fungal turnover to contrasting categories within plantation age/site class × microhabitat groups (Figure 4). Across all matched pairwise comparisons, 91.9% of bacterial turnover was assigned to selection-controlled categories, almost entirely homogeneous selection, and 8.1% was assigned to dispersal limitation (Figure 4B). Bacterial selection fractions were especially stable in the two soil microhabitats, where selection-controlled fractions were 100% across all plantation age/site classes. Root-associated bacterial groups were more variable: the root compartment decreased from 90% selection in the 5-year plantation to 50% in the 10-year plantation and then increased to 80%–90% in the 20- and 30-year plantations, whereas the rhizosphere showed a temporary reduction to 60% in the 20-year plantation before returning to 100% in the 30-year plantation.
Figure 4.
Null–model analysis assigns bacterial and fungal turnover to contrasting assembly categories. (A) βNTI–RCbray decision framework. (B) Pairwise decision space and overall category fractions. (C) Assembly-category partitioning across plantation age/site class × microhabitat groups. (D) Patterns of selection-controlled fractions across plantation age/site classes. (E) Heatmap of selection-controlled fractions. Colors denote the assembly categories defined in panel A; heatmap color intensity in panel E represents the selection-controlled fraction.
Fungal turnover was more frequently assigned to the dispersal-limitation category (79.4%) than to selection-controlled categories (20.6%; Figure 4B), but this result is less secure than the bacterial result because ITS-based phylogenies can provide weaker support for βNTI thresholds. The strongest fungal selection fractions occurred in root-associated microhabitats in the 20-year plantation: 70% in the root compartment and 60% in the rhizosphere. In contrast, fungal selection in soil at 10 cm and soil at 30 cm declined to 0% in the older sampled soil microhabitats. These values are best treated as framework-based indications of turnover-category assignment rather than direct evidence that fungal dispersal barriers were measured.
3.3. Rhizosphere Candidate Modules and Exploratory Cross-Domain Association Networks
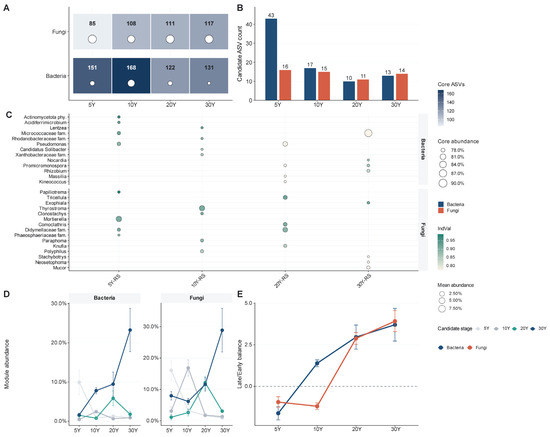
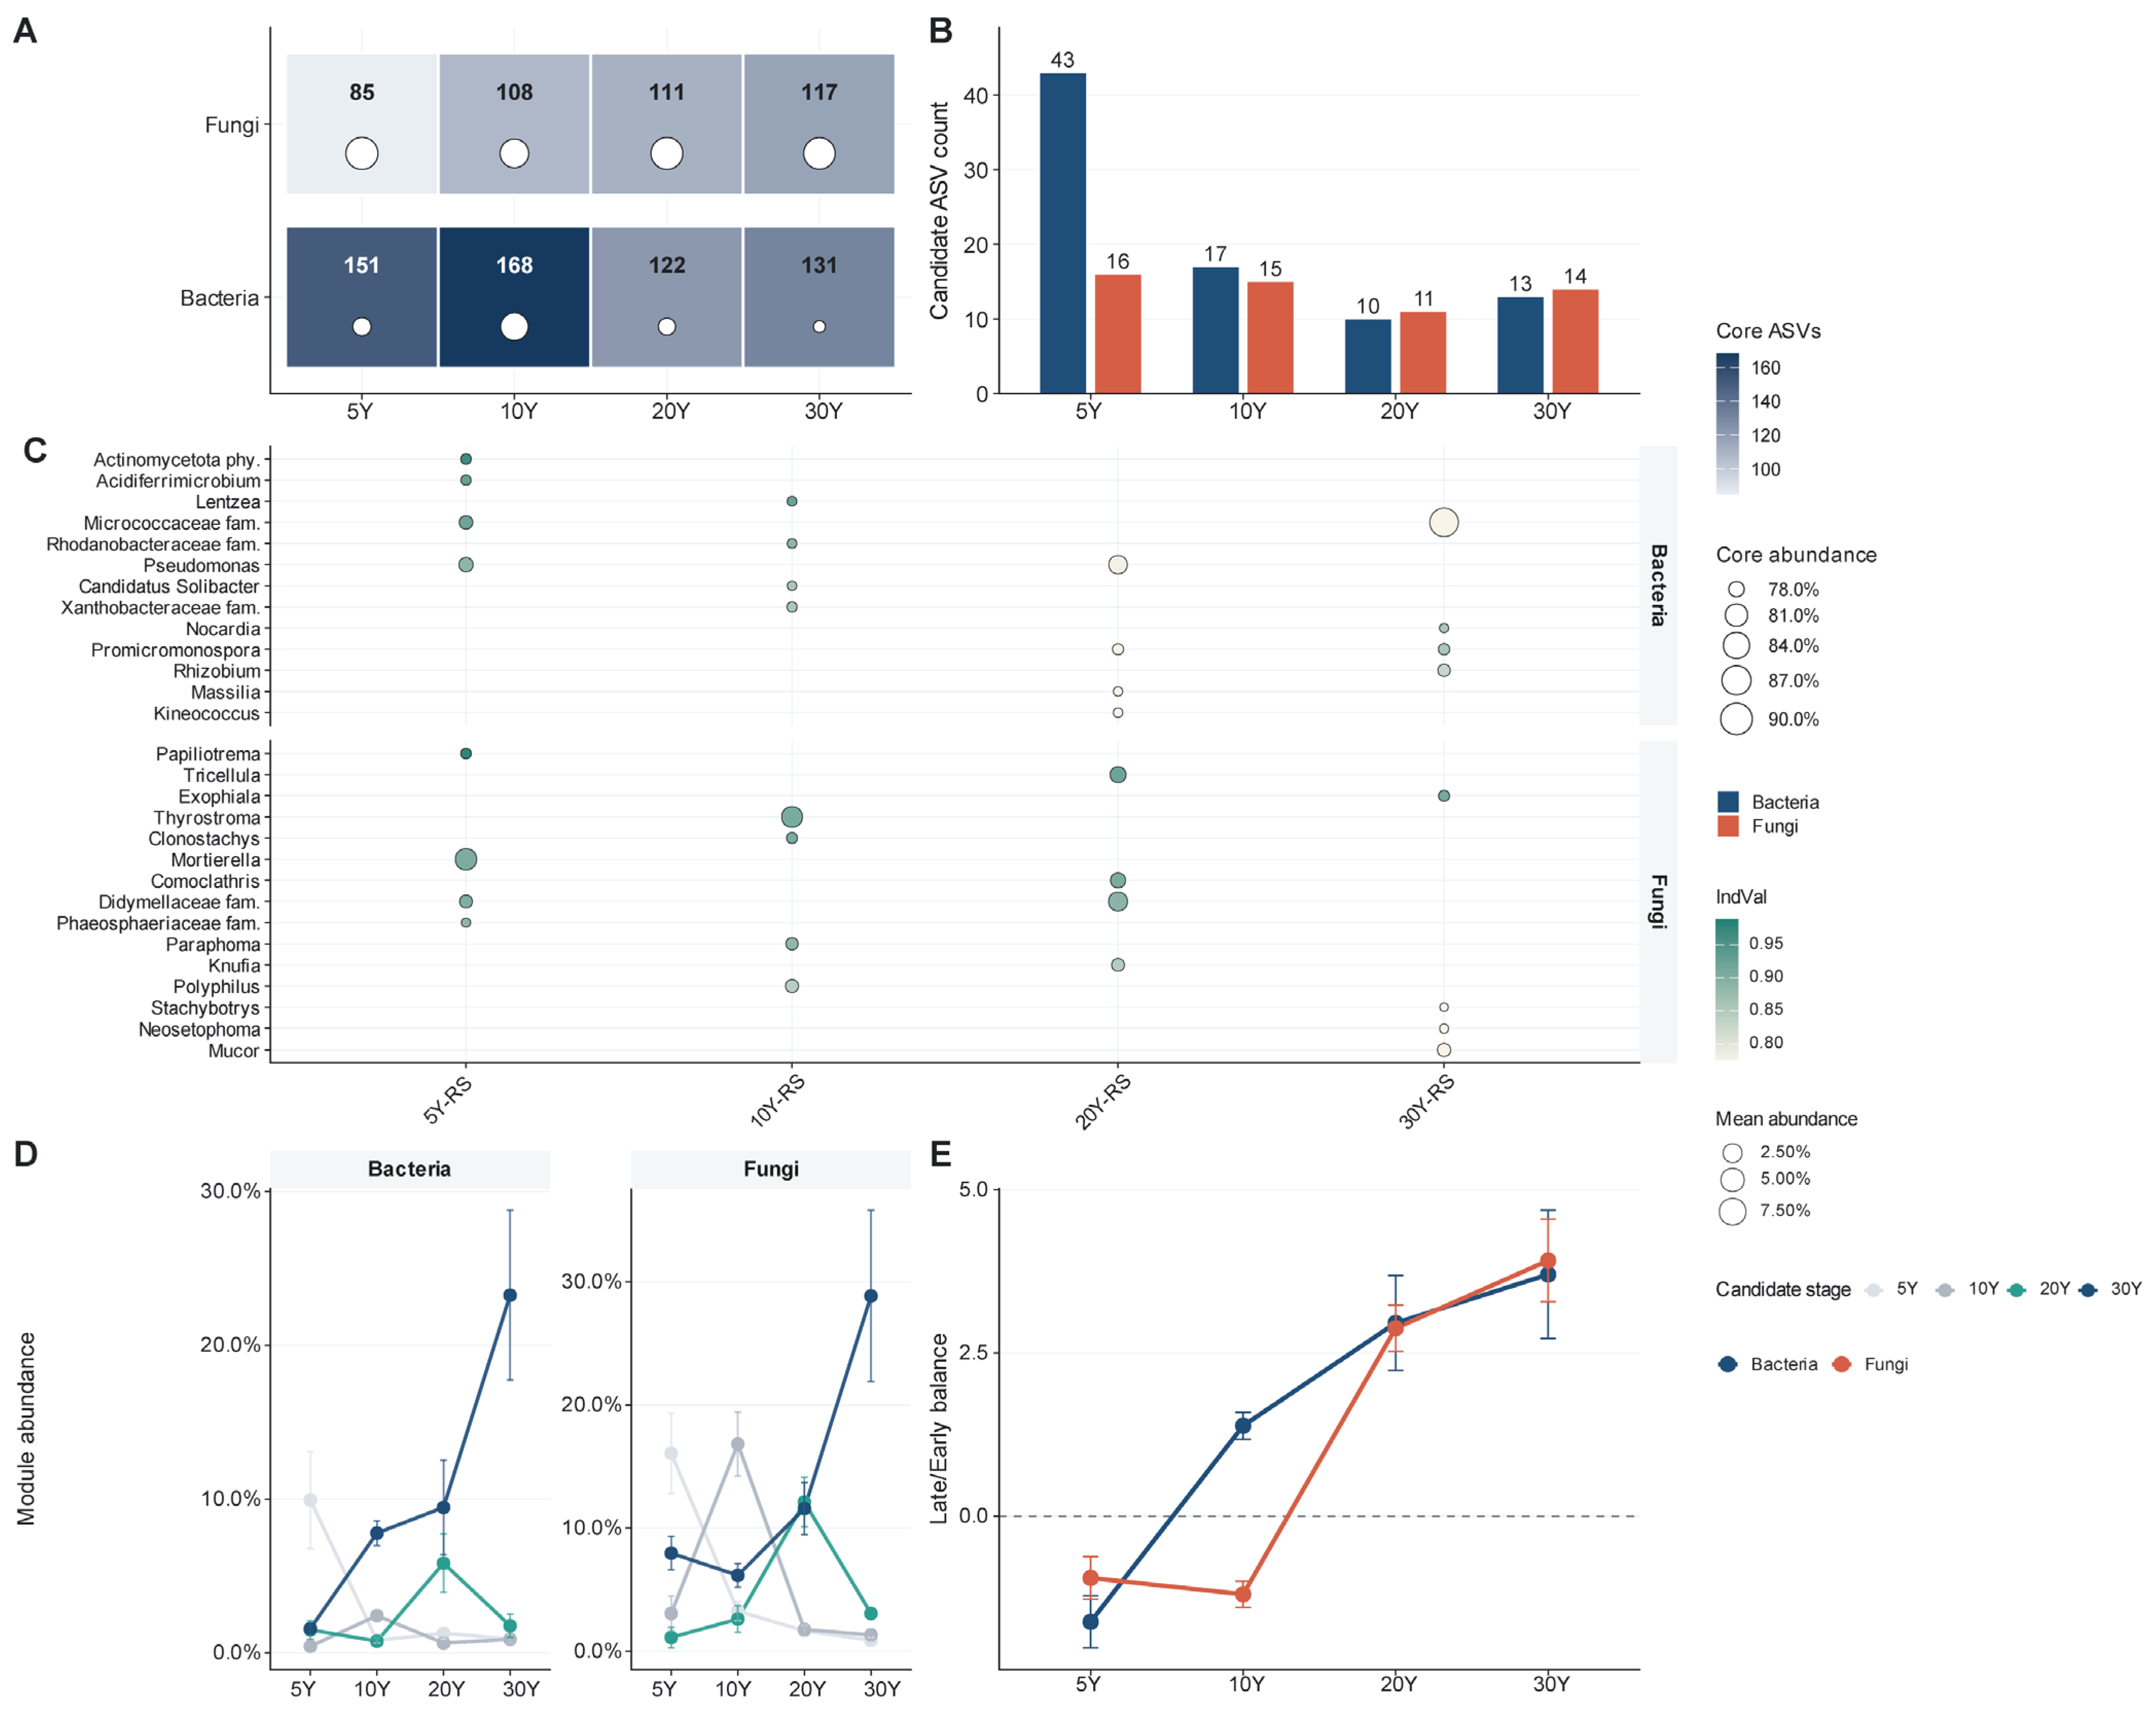
The rhizosphere subset was analyzed separately, and the results were not extended to the entire soil–root continuum (Figure 5). No ASV passed FDR-adjusted IndVal significance; therefore, the indicator analysis is exploratory, and all taxa are described as permutation-supported candidate indicators. Core ASVs remained abundant but differed between domains. Bacterial core richness peaked in the 10-year plantation and then declined (151, 168, 122 and 131 core ASVs in the 5-, 10-, 20- and 30-year plantations, respectively), whereas fungal core richness increased gradually after the 5-year plantation (85, 108, 111 and 117 core ASVs). Candidate indicators included 83 bacterial and 56 fungal ASVs. Bacterial candidates were concentrated in the 5-year plantation (43 ASVs), while fungal candidates were more evenly distributed across plantation age/site classes (16, 15, 11 and 14 ASVs from 5 to 30 years).
Figure 5.
Rhizosphere core ASVs and permutation-supported candidate indicators show exploratory module differences among plantation age/site classes. (A) Core ASVs by plantation age/site class in rhizosphere bacteria and fungi. (B) Candidate indicator ASV counts by plantation age/site class. (C) Representative candidate taxa shown at the most informative available taxonomic rank. (D) Abundance of candidate modules across plantation age/site classes. (E) Younger/older candidate-module balance. No ASV passed FDR-adjusted IndVal significance; therefore, these patterns should be interpreted as exploratory candidate-module differences, not significant biomarkers.
The taxon labels in Figure 5C provide examples of candidate-module turnover without serving as functional proof. Candidate bacterial taxa in the younger plantation age/site classes included Kineococcus and Massilia, whereas those in older classes included Rhizobium, Promicromonospora, Nocardia, Pseudomonas and several family- or phylum-level assignments. Fungal candidates included Mucor and Neosetophoma in younger classes and Mortierella, Clonostachys, Exophiala, Tricellula and Papiliotrema in older classes. The module-abundance trajectories and younger/older balance show a directional difference toward candidate modules associated with the 20- and 30-year plantations, but this should be read as a candidate module-level pattern rather than statistically confirmed single-ASV biomarkers.
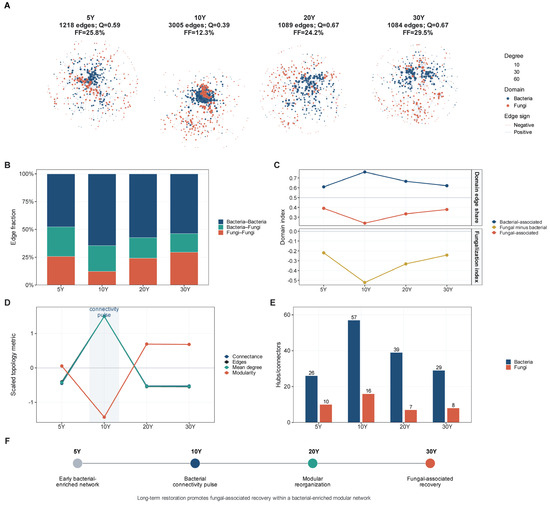
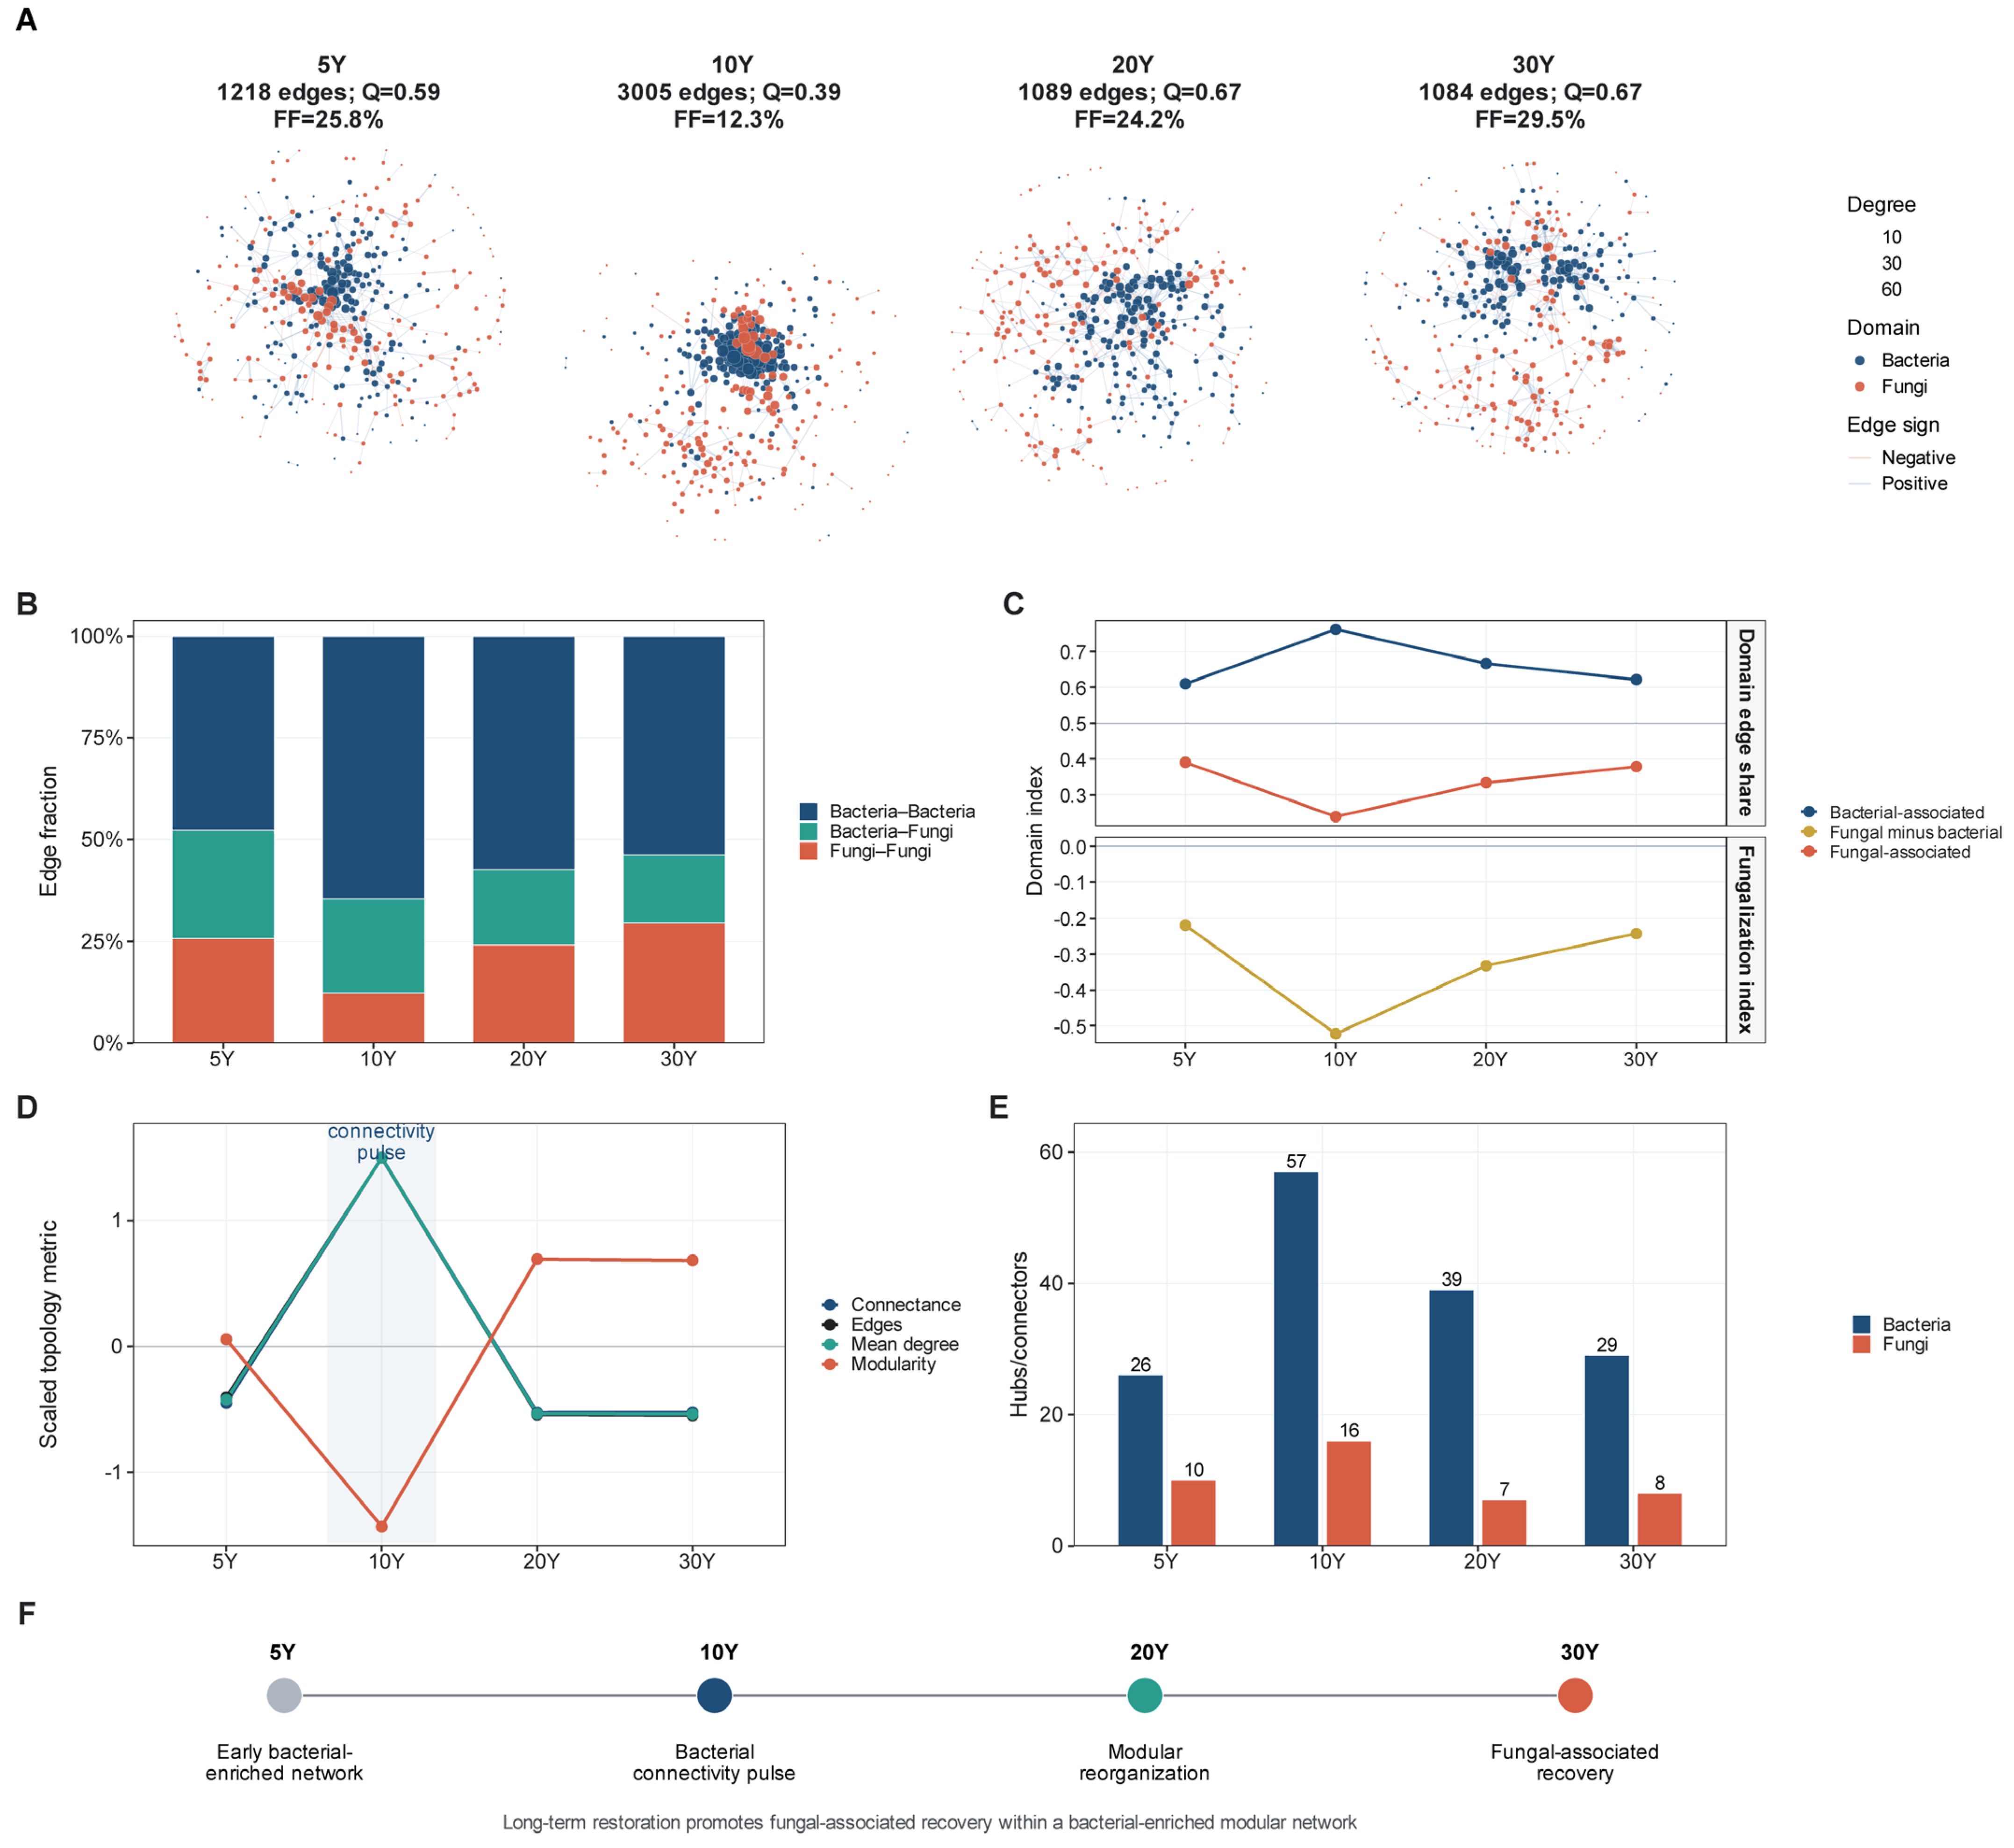
Cross-domain association networks were examined as an exploratory descriptive analysis because each plantation age/site class contained only five samples (Figure 6). Under identical feature-number and correlation-threshold rules, the 10-year network retained 3005 associations, compared with 1218, 1089 and 1084 in the 5-, 20- and 30-year networks, respectively. Mean degree was also highest in the 10-year network (15.03), while modularity was lowest (Q = 0.387). These values describe an apparent intermediate increase in retained connectivity within this dataset; given n = 5 per network, they are not interpreted as statistically validated differences in network topology or as evidence of a reproducible network transition.
Figure 6.
Exploratory cross–domain microbial association networks across plantation age/site classes. (A) Bacterial–fungal association networks by plantation age/site class. (B) Bacteria–bacteria, bacteria–fungi and fungi–fungi edge proportions. (C) Domain-level edge shares and fungalization index. (D) Network topology metrics. (E) Domain composition of hub/connector labels. (F) Conceptual summary of statistical association architecture. Each network was constructed from n = 5 samples; therefore, network topology and between-class contrasts are exploratory and were not subjected to formal stability inference.
Descriptively, bacteria–bacteria edges dominated all four networks and were most numerous in the 10-year network, whereas fungi–fungi edges represented 12.3% of retained associations at 10 years and 24.2% and 29.5% at 20 and 30 years, respectively. The fungalization index remained negative across all networks, and bacterial nodes accounted for more hub/connector labels than fungal nodes. Because these networks were constructed from only five samples per plantation age/site class, edge proportions, fungalization values and hub/connector counts are reported only as sample-dependent topology summaries and are not interpreted as stable ecological properties or keystone-taxon evidence.
4. Discussion
This study identifies multi-level differences in root-associated microbiomes among four C. korshinskii plantations representing a 5–30-year chronosequence. The soil-chemistry subset defined a PCA-based edaphic axis; ASV pools contracted sharply from soil to root; microhabitats accounted for a large share of sample-level bacterial beta-diversity variations; null-model assignments contrasted between bacteria and fungi, though the fungal result requires caution; rhizosphere candidate modules differed among sampled plantations; exploratory network summaries showed an apparent increase in retained associations in the 10-year plantation. Crucially, each plantation age/site class was represented by one plantation and five shrubs sampled within that plantation. Thus, plantation age is confounded with site, the shrubs are within-plantation subsamples rather than independent plantation replicates, and age-associated patterns cannot be generalized as replicated temporal effects [18]. The appropriate inference is therefore restricted to coordinated spatial differences observed across this particular chronosequence.
The PCA-derived edaphic axis separates two processes that are often conflated in restoration studies: stress amelioration and fertility accumulation. Higher soil water content and lower electrical conductivity in the older sampled plantations are consistent with partial alleviation of water- and salinity-related constraints, whereas lower TN and SOM argue against a simple fertility-accumulation narrative [2,3,19,20,21]. Importantly, the present analysis demonstrates that soil chemistry differed among plantation age/site classes, but it does not by itself establish that these edaphic differences caused the observed microbial compositional differences. Soil chemistry was available only for a matched subset, and a direct constrained model linking the complete microbial dissimilarity matrix to measured edaphic predictors was not part of the current dataset. We therefore interpret edaphic reconfiguration as a co-occurring environmental axis, not a demonstrated causal driver of microbiome change.
The hierarchical ASV contraction in Figure 2 fits the broader root-microbiome concept that plants recruit subsets of microorganisms from surrounding soil reservoirs [4,5,6,7,8,9,10]. Nevertheless, the operational definition of the root sample limits ecological interpretation. Because the root material was not supported by documented surface sterilization and sterilization-efficiency controls, the root compartment cannot be treated as a strict endosphere. Root-surface particles, rhizoplane biofilms and internal tissues may therefore all contribute DNA to the same sample. The filtering signal itself remains clear: Both bacterial and fungal ASV pools contracted sharply from the combined soil reservoir to the rhizosphere and root compartment, and the direction of contraction was similar across plantation age/site classes. Root-specific ASVs should therefore be interpreted as ASVs detected in the processed root tissue–rhizoplane fraction rather than confirmed internal colonizers.
The beta-diversity and null-model analyses together suggest that bacteria and fungi were structured differently across the sampled plantation age/site and microhabitat gradients. Bacterial beta diversity was strongly associated with microhabitat (PERMANOVA R2 = 0.309), but significant PERMDISP among microhabitats indicates that this effect may reflect both community-centroid differences and heterogeneous within-group dispersion [30,31,32]. The bacterial null-model result, with 91.9% of comparisons assigned to homogeneous selection, is consistent with repeated filtering under similar microhabitat conditions [13,14,15,16,17]. The fungal result should be framed more cautiously. Although 79.4% of fungal comparisons fell into the dispersal-limitation category under the βNTI–RCbray framework, ITS-based phylogenies may provide weaker signals than bacterial 16S rRNA phylogenies. Thus, this result indicates how the null model classified fungal turnover and should not be interpreted as a direct measurement of physical dispersal barriers.
The rhizosphere candidate-module analysis provides a useful but explicitly exploratory view of differences among plantation age/site classes. Because no ASV passed FDR-adjusted IndVal significance, the appropriate unit of interpretation is the distribution of candidate modules among plantation age/site classes rather than individual biomarkers. The bacterial candidate set was concentrated in the 5-year plantation, whereas fungal candidates were more evenly distributed, and candidate modules associated with the older plantations increased toward 20–30 years. These patterns are consistent with previous evidence that plant development and drought can alter rhizosphere assemblages [11,12], but the present data do not identify causal functions for individual genera. Candidate taxa such as Rhizobium, Pseudomonas, Mortierella or Exophiala should therefore be treated as targets for follow-up isolation, qPCR, metagenomics or cultivation experiments rather than as direct evidence of nitrogen fixation, decomposition, stress tolerance or pathogenesis.
The association-network analysis was retained only as an exploratory structural summary. The 10-year network contained more retained associations and a higher mean degree than the other three networks under the same filtering and correlation thresholds, but each network was estimated from only five samples. At this sample size, individual correlations and derived topology can be highly sensitive to sampling variation, compositionality, feature filtering and the choice of association method [35,36,37]. Methodological reviews emphasize sample size as a primary determinant of microbiome-network reliability and note that substantially larger group sizes are generally required for robust correlation-network inference [43]. Recent resampling benchmarks likewise show marked sample-size sensitivity of Spearman-based network attributes, with stabilization commonly requiring tens to hundreds of samples depending on the metric and dataset [44]. We therefore do not interpret the apparent 10-year increase as a stable age-related topological transition, and hub/connector labels are not used to infer keystone taxa. The network results are presented solely as hypothesis-generating patterns that require validation with substantially larger, independently replicated sample sets.
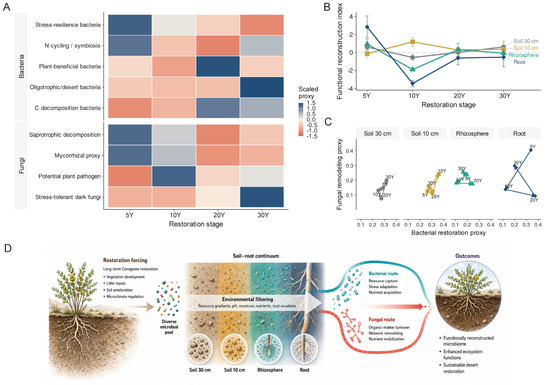
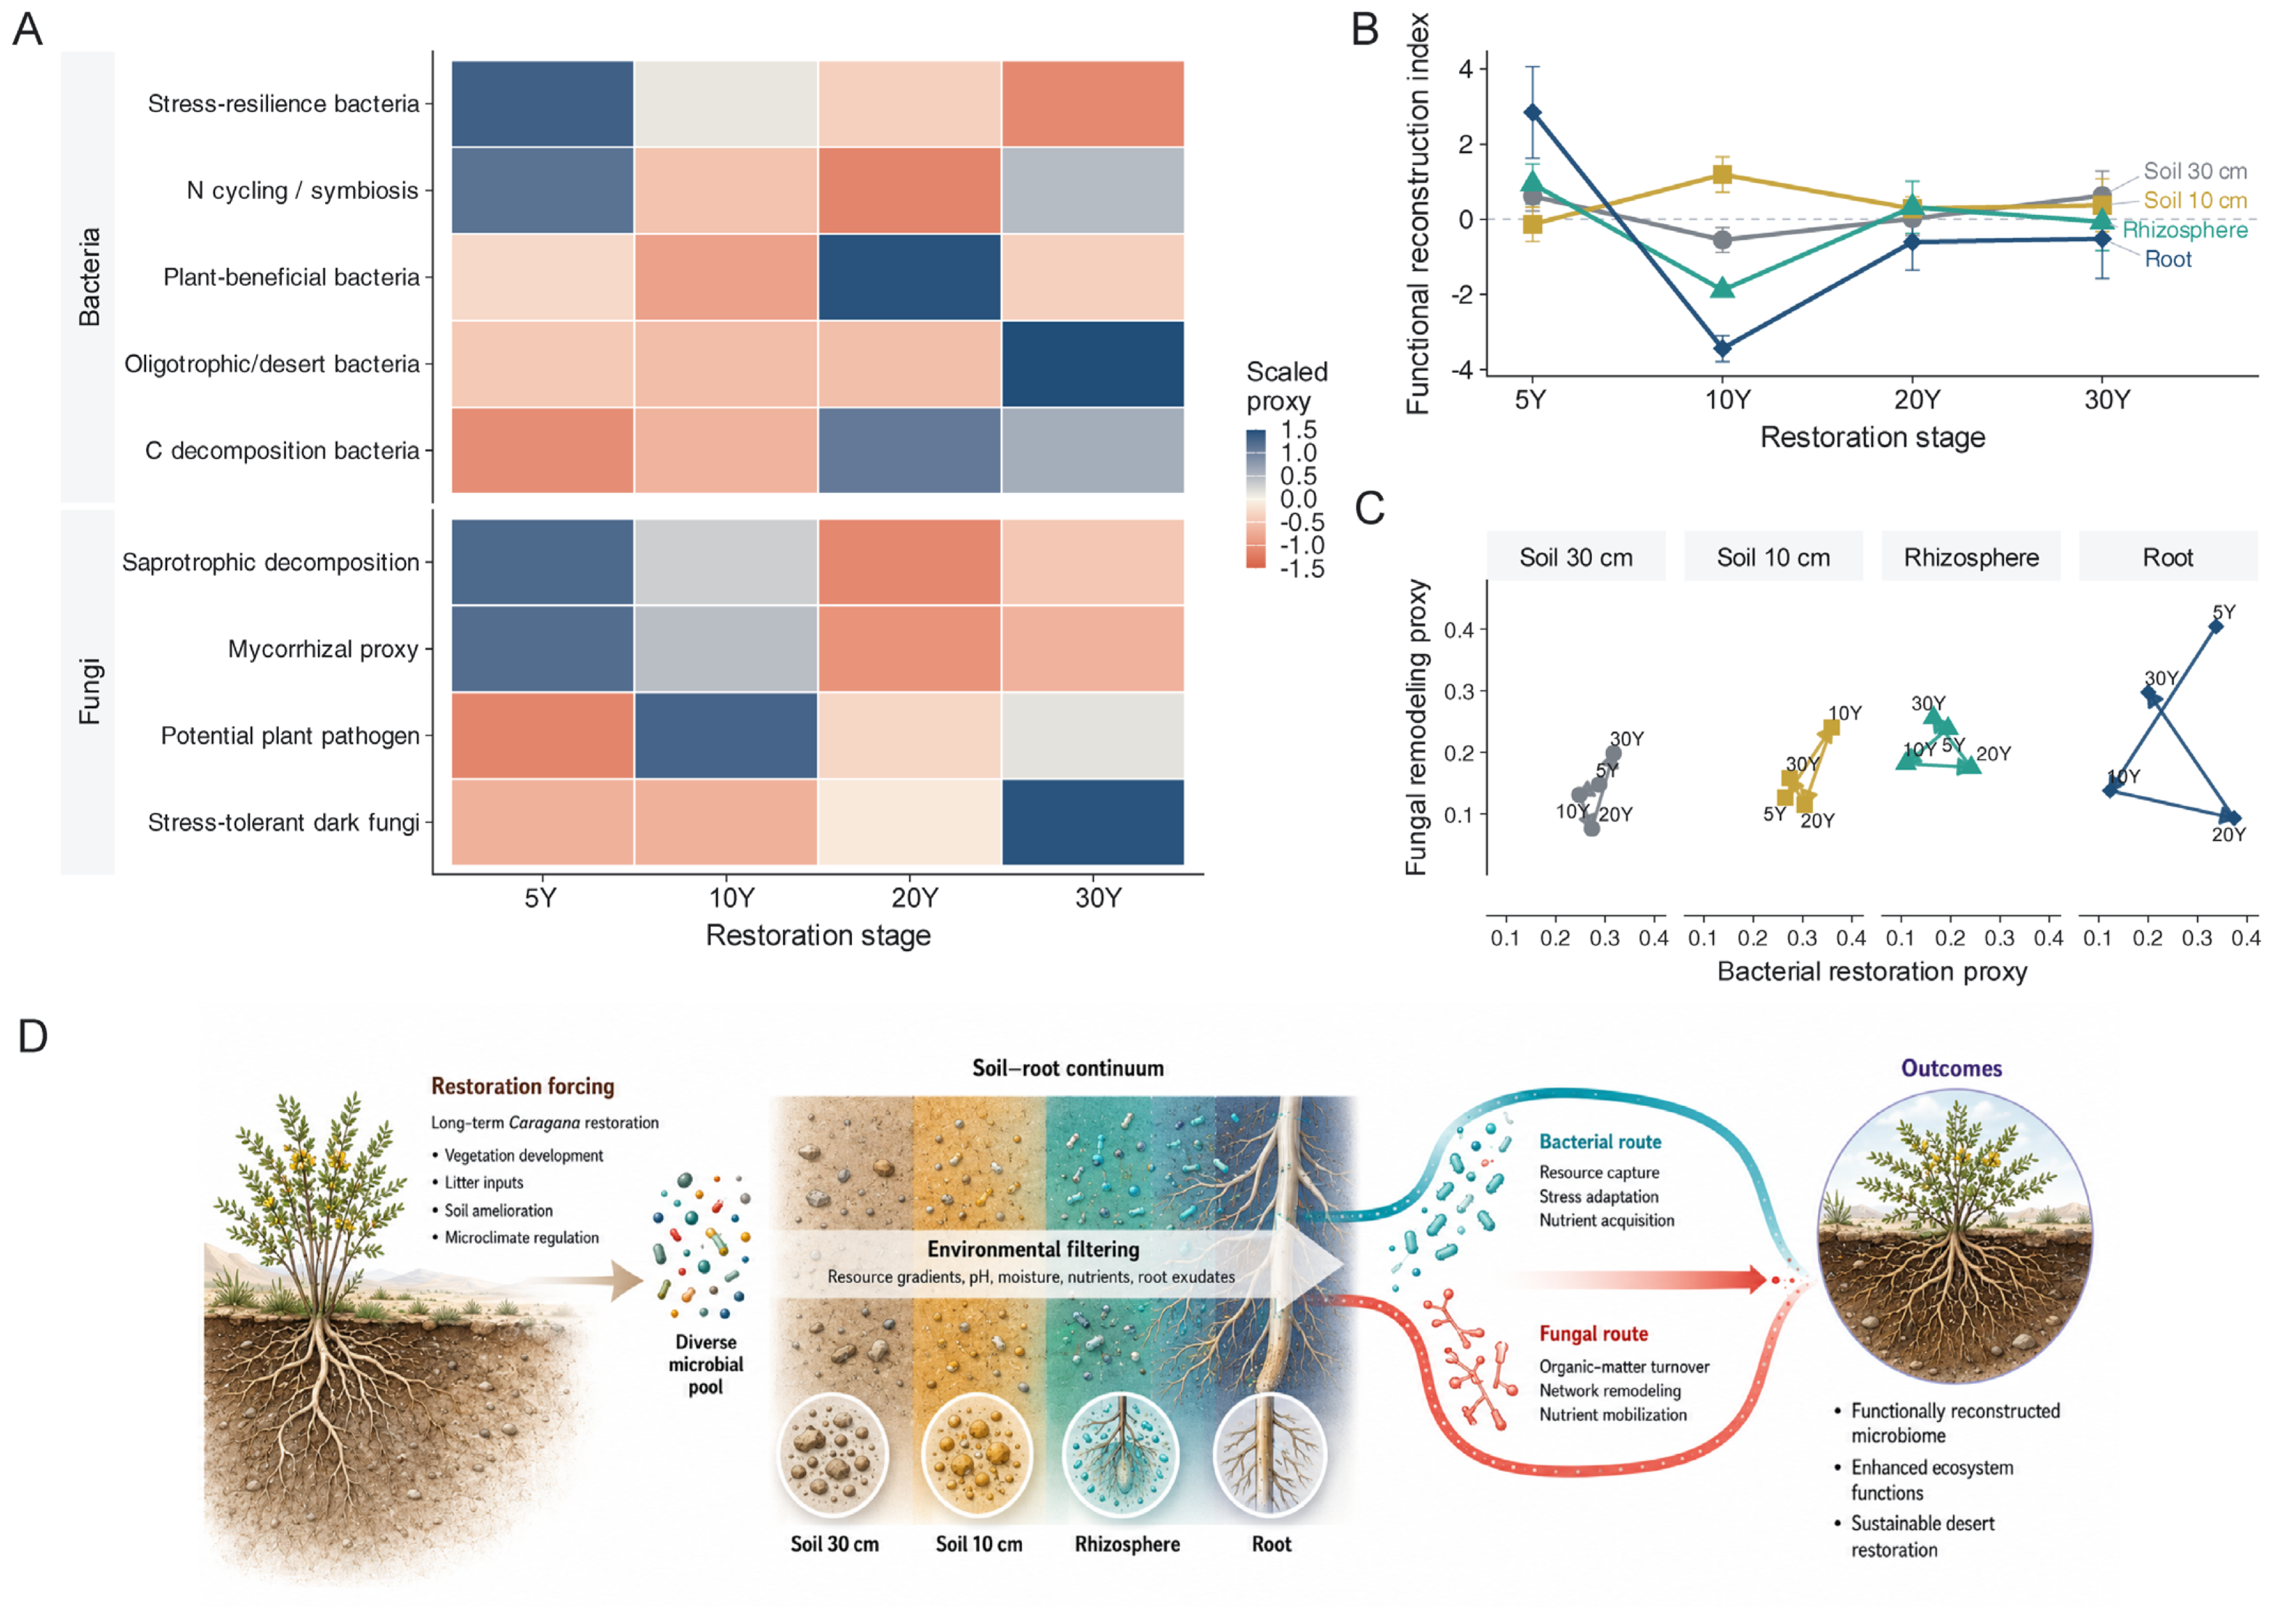
We provide a conservative taxon-based synthesis of the microbiome patterns observed across this study rather than an independent validation of microbial function (Figure 7). In Figure 7A, the proxy heatmap indicates that bacterial and fungal proxy groups were redistributed across plantation age/site classes rather than uniformly enhanced: bacterial proxies related to stress resilience, nitrogen cycling/symbiosis, plant-beneficial potential, oligotrophic/desert adaptation and carbon decomposition, together with fungal proxies related to saprotrophic decomposition, mycorrhizal potential, potential plant pathogens and stress-tolerant dark fungi, showed class-dependent patterns. Figure 7B further suggests that these taxon-derived proxy profiles differed among microhabitats, with the root compartment showing a stronger deviation in the 5-year plantation than bulk soil and rhizosphere samples, consistent with the strong soil–root filtering observed in Figure 2. Figure 7C visualizes the joint trajectories of bacterial restoration-related and fungal remodeling-related proxies, showing that soil, rhizosphere and root-compartment samples followed different paths in proxy space. Therefore, Figure 7D is interpreted as a hypothesis-generating model linking the PCA-derived edaphic axis, soil–root ASV filtering, rhizosphere candidate modules and exploratory association-network patterns to potential functional directions that require validation through metagenomics, metatranscriptomics, enzyme assays, isotope tracing, culture collections or inoculation experiments. These proxies do not represent direct measurements of nitrogen fixation, carbon decomposition, enzyme activity, mycorrhizal exchange, pathogen activity or ecosystem function [38,39,40].
Figure 7.
Taxon–based functional proxy synthesis and conservative conceptual model. (A) Functional proxy heatmap inferred from genus–level taxonomy. (B) Custom proxy index across plantation age/site classes and microhabitats. (C) Proxy phase portrait. (D) Conceptual synthesis linking edaphic reconfiguration, root-associated filtering, exploratory association-network patterns and taxon-based hypotheses. The proxies are not direct functional measurements, the network component is exploratory, and the custom index should not be interpreted as measured ecosystem function.
Several limitations define the scope of inference. First, each plantation age/site class was represented by a single plantation containing five sampled shrubs. Plantation age is therefore fully confounded with site, and shrub-level observations are within-plantation subsamples rather than independent plantation-level replicates. The chronosequence is also a space-for-time substitution and cannot exclude historical differences among plantations [18]. Accordingly, age-associated statistics are treated descriptively, and the conclusions are restricted to the four sampled plantations rather than generalized temporal effects of plantation age. Second, soil chemistry was available only for the matched subset rather than all microbiome samples, and the present study does not directly establish that measured edaphic variables explain community dissimilarity. Third, the root compartment was not verified as a strict endosphere. Fourth, PERMANOVA results require explicit PERMDISP diagnostics [30,31,32]. Fifth, ITS-based null-model assignments are less secure than 16S-based bacterial assignments. Indicator taxa are exploratory because no ASV passed FDR-adjusted significance. Finally, the four association networks (one per plantation age/site class) were each based on only n = 5 samples; network edges, topology metrics and hub/connector labels are therefore exploratory, sample-dependent summaries rather than stable ecological properties. Functional proxies are taxon-derived hypotheses rather than measurements. These limitations restrict the conclusions to the chronosequence-associated edaphic differences, compartment filtering and domain-sensitive community structure observed in the sampled plantations rather than direct functional, causal or population-level age effects.
5. Conclusions
Overall, the four sampled C. korshinskii plantations showed coordinated differences in soil conditions and root-associated microbiomes, including marked ASV contraction across soil–root compartments, pronounced bacterial microhabitat structure and predominantly homogeneous-selection assignments for bacteria. Fungal null-model categories, taxon-based functional proxies and the four association networks (one per plantation age/site class) remain hypothesis-generating rather than direct functional or stable network evidence. Because one plantation represented each plantation age/site class, this study does not provide replicated plantation-level evidence for an age effect; instead, it documents a coherent set of belowground patterns across this specific space-for-time chronosequence. These findings provide a conservative framework for interpreting soil–root microbial organization in dryland shrub restoration while clearly separating observed patterns from untested causal mechanisms.
Supplementary Materials
The following supporting information can be downloaded at https://www.mdpi.com/article/10.3390/f17091057/s1. Table S1: Loadings and relative contributions of soil physicochemical variables to the first two principal components.
Author Contributions
Conceptualization, Y.S.; methodology, Y.S. and B.W.; investigation, B.W., X.H., Y.W., H.M. and J.Z.; data curation, B.W.; formal analysis, B.W.; visualization, B.W.; writing—original draft preparation, B.W. and X.H.; writing—review and editing, Y.S., B.W. and X.H.; supervision, Y.S. and Y.W.; project administration, Y.S. All authors have read and agreed to the published version of the manuscript.
Funding
This research was funded by the Natural Science Foundation of Gansu Province (24JRRH008) and the Key Research and Development Program of Wuwei City (WW24A01YFN008).
Data Availability Statement
Raw bacterial 16S rRNA and fungal ITS amplicon sequencing data generated in this study have been deposited in the Genome Sequence Archive (GSA), National Genomics Data Center, China National Center for Bioinformation, under accession number CRA044892.
Acknowledgments
During the preparation of this manuscript, the authors utilized ChatGPT (OpenAI, version GPT-5.5) for the purposes of text polishing and language refinement, as well as for assisting the generation of Figure 7D. The authors have thoroughly reviewed and edited all AI-generated outputs and assume full responsibility for the final content and data presented in this publication.
Conflicts of Interest
The authors declare no conflicts of interest.
References
- Reynolds, J.F.; Smith, D.M.S.; Lambin, E.F.; Turner, B.L.; Mortimore, M.; Batterbury, S.P.J.; Downing, T.E.; Dowlatabadi, H.; Fernandez, R.J.; Herrick, J.E.; et al. Global desertification: Building a science for dryland development. Science 2007, 316, 847–851. [Google Scholar] [CrossRef] [Scilit]
- Maestre, F.T.; Eldridge, D.J.; Soliveres, S.; Kefi, S.; Delgado-Baquerizo, M.; Bowker, M.A.; Garcia-Palacios, P.; Gaitan, J.; Gallardo, A.; Lazaro, R.; et al. Structure and functioning of dryland ecosystems in a changing world. Annu. Rev. Ecol. Evol. Syst. 2016, 47, 215–237. [Google Scholar] [CrossRef] [Scilit]
- Wang, L.; Jiao, W.; MacBean, N.; Rulli, M.C.; Manzoni, S.; Vico, G.; D’Odorico, P. Dryland productivity under a changing climate. Nat. Clim. Change 2022, 12, 981–994. [Google Scholar] [CrossRef] [Scilit]
- Berendsen, R.L.; Pieterse, C.M.J.; Bakker, P.A.H.M. The rhizosphere microbiome and plant health. Trends Plant Sci. 2012, 17, 478–486. [Google Scholar] [CrossRef] [Scilit]
- Hacquard, S.; Garrido-Oter, R.; Gonzalez, A.; Spaepen, S.; Ackermann, G.; Lebeis, S.; McHardy, A.C.; Dangl, J.L.; Knight, R.; Ley, R.; et al. Microbiota and host nutrition across plant and animal kingdoms. Cell Host Microbe 2015, 17, 603–616. [Google Scholar] [CrossRef] [Scilit]
- Trivedi, P.; Leach, J.E.; Tringe, S.G.; Sa, T.; Singh, B.K. Plant–microbiome interactions: From community assembly to plant health. Nat. Rev. Microbiol. 2020, 18, 607–621. [Google Scholar] [CrossRef] [Scilit]
- Bulgarelli, D.; Rott, M.; Schlaeppi, K.; Ver Loren van Themaat, E.; Ahmadinejad, N.; Assenza, F.; Rauf, P.; Huettel, B.; Reinhardt, R.; Schmelzer, E.; et al. Revealing structure and assembly cues for Arabidopsis root-inhabiting bacterial microbiota. Nature 2012, 488, 91–95. [Google Scholar] [CrossRef] [Scilit]
- Edwards, J.; Johnson, C.; Santos-Medellin, C.; Lurie, E.; Podishetty, N.K.; Bhatnagar, S.; Eisen, J.A.; Sundaresan, V. Structure, variation, and assembly of the root-associated microbiomes of rice. Proc. Natl. Acad. Sci. USA 2015, 112, E911–E920. [Google Scholar] [CrossRef] [Scilit]
- Ling, N.; Wang, T.; Kuzyakov, Y. Rhizosphere bacteriome structure and functions. Nat. Commun. 2022, 13, 836. [Google Scholar] [CrossRef] [Scilit]
- Xiong, C.; Zhu, Y.-G.; Wang, J.-T.; Singh, B.K.; Han, L.-L.; Shen, J.-P.; Li, P.-P.; Wang, G.-B.; Wu, C.-F.; Ge, A.-H.; et al. Host selection shapes crop microbiome assembly and network complexity. New Phytol. 2021, 229, 1091–1104. [Google Scholar] [CrossRef] [Scilit]
- Chaparro, J.M.; Badri, D.V.; Vivanco, J.M. Rhizosphere microbiome assemblage is affected by plant development. ISME J. 2014, 8, 790–803. [Google Scholar] [CrossRef] [Scilit]
- Naylor, D.; DeGraaf, S.; Purdom, E.; Coleman-Derr, D. Drought and host selection influence bacterial community dynamics in the grass root microbiome. ISME J. 2017, 11, 2691–2704. [Google Scholar] [CrossRef] [Scilit]
- Nemergut, D.R.; Schmidt, S.K.; Fukami, T.; O’Neill, S.P.; Bilinski, T.M.; Stanish, L.F.; Knelman, J.E.; Darcy, J.L.; Lynch, R.C.; Wickey, P.; et al. Patterns and processes of microbial community assembly. Microbiol. Mol. Biol. Rev. 2013, 77, 342–356. [Google Scholar] [CrossRef] [Scilit]
- Stegen, J.C.; Lin, X.; Konopka, A.E.; Fredrickson, J.K. Stochastic and deterministic assembly processes in subsurface microbial communities. ISME J. 2012, 6, 1653–1664. [Google Scholar] [CrossRef] [Scilit]
- Stegen, J.C.; Lin, X.; Fredrickson, J.K.; Chen, X.; Kennedy, D.W.; Murray, C.J.; Rockhold, M.L.; Konopka, A. Quantifying community assembly processes and identifying features that impose them. ISME J. 2013, 7, 2069–2079. [Google Scholar] [CrossRef] [Scilit]
- Ning, D.; Deng, Y.; Tiedje, J.M.; Zhou, J. A general framework for quantitatively assessing ecological stochasticity. Proc. Natl. Acad. Sci. USA 2019, 116, 16892–16898. [Google Scholar] [CrossRef] [Scilit]
- Zhou, J.; Deng, Y.; Zhang, P.; Xue, K.; Liang, Y.; Van Nostrand, J.D.; Yang, Y.; He, Z.; Wu, L.; Stahl, D.A.; et al. Stochasticity, succession, and environmental perturbations in a fluidic ecosystem. Proc. Natl. Acad. Sci. USA 2014, 111, E836–E845. [Google Scholar] [CrossRef] [Scilit]
- Walker, L.R.; Wardle, D.A.; Bardgett, R.D.; Clarkson, B.D. The use of chronosequences in studies of ecological succession and soil development. J. Ecol. 2010, 98, 725–736. [Google Scholar] [CrossRef] [Scilit]
- Chai, Q.; Ma, Z.; An, Q.; Wu, G.-L.; Chang, X.; Zheng, J.; Wang, G. Does artificial Caragana korshinskii plantation increase soil carbon continuously in a water-limited landscape on the Loess Plateau, China? Land Degrad. Dev. 2019, 30, 1691–1698. [Google Scholar] [CrossRef] [Scilit]
- Zeng, Q.; Liu, Y.; Xiao, L.; An, S. Soil, leaf and root ecological stoichiometry of Caragana korshinskii on the Loess Plateau of China in relation to plantation age. PLoS ONE 2017, 12, e0168890. [Google Scholar] [CrossRef] [Scilit]
- Liu, W.; Qiu, K.; Xie, Y.; Wang, R.; Li, H.; Meng, W.; Yang, Y.; Huang, Y.; Li, Y.; He, Y. Years of sand fixation with Caragana korshinskii drive the enrichment of its rhizosphere functional microbes by accumulating soil N. PeerJ 2022, 10, e14271. [Google Scholar] [CrossRef] [Scilit]
- Chelius, M.K.; Triplett, E.W. The diversity of archaea and bacteria in association with the roots of Zea mays L. Microb. Ecol. 2001, 41, 252–263. [Google Scholar] [CrossRef] [Scilit]
- Redford, A.J.; Bowers, R.M.; Knight, R.; Linhart, Y.; Fierer, N. The ecology of the phyllosphere: Geographic and phylogenetic variability in the distribution of bacteria on tree leaves. Environ. Microbiol. 2010, 12, 2885–2893. [Google Scholar] [CrossRef] [Scilit]
- Gardes, M.; Bruns, T.D. ITS primers with enhanced specificity for basidiomycetes—Application to the identification of mycorrhizae and rusts. Mol. Ecol. 1993, 2, 113–118. [Google Scholar] [CrossRef] [Scilit]
- White, T.J.; Bruns, T.; Lee, S.; Taylor, J. Amplification and direct sequencing of fungal ribosomal RNA genes for phylogenetics. In PCR Protocols: A Guide to Methods and Applications; Innis, M.A., Gelfand, D.H., Sninsky, J.J., White, T.J., Eds.; Academic Press: San Diego, CA, USA, 1990; pp. 315–322. [Google Scholar]
- Callahan, B.J.; McMurdie, P.J.; Rosen, M.J.; Han, A.W.; Johnson, A.J.A.; Holmes, S.P. DADA2: High-resolution sample inference from Illumina amplicon data. Nat. Methods 2016, 13, 581–583. [Google Scholar] [CrossRef] [Scilit]
- Quast, C.; Pruesse, E.; Yilmaz, P.; Gerken, J.; Schweer, T.; Yarza, P.; Peplies, J.; Glöckner, F.O. The SILVA ribosomal RNA gene database project: Improved data processing and web-based tools. Nucleic Acids Res. 2013, 41, D590–D596. [Google Scholar] [CrossRef] [Scilit]
- Abarenkov, K.; Nilsson, R.H.; Larsson, K.-H.; Taylor, A.F.S.; May, T.W.; Frøslev, T.G.; Pawlowska, J.; Lindahl, B.; Põldmaa, K.; Truong, C.; et al. The UNITE database for molecular identification and taxonomic communication of fungi and other eukaryotes: Sequences, taxa and classifications reconsidered. Nucleic Acids Res. 2024, 52, D791–D797. [Google Scholar] [CrossRef] [Scilit]
- Jolliffe, I.T.; Cadima, J. Principal component analysis: A review and recent developments. Philos. Trans. R. Soc. A 2016, 374, 20150202. [Google Scholar] [CrossRef] [Scilit]
- Anderson, M.J. A new method for non-parametric multivariate analysis of variance. Austral. Ecol. 2001, 26, 32–46. [Google Scholar] [CrossRef] [Scilit]
- Anderson, M.J.; Ellingsen, K.E.; McArdle, B.H. Multivariate dispersion as a measure of beta diversity. Ecol. Lett. 2006, 9, 683–693. [Google Scholar] [CrossRef] [Scilit]
- Anderson, M.J.; Walsh, D.C.I. PERMANOVA, ANOSIM, and the Mantel test in the face of heterogeneous dispersions: What null hypothesis are you testing? Ecol. Monogr. 2013, 83, 557–574. [Google Scholar] [CrossRef] [Scilit]
- Kembel, S.W.; Cowan, P.D.; Helmus, M.R.; Cornwell, W.K.; Morlon, H.; Ackerly, D.D.; Blomberg, S.P.; Webb, C.O. Picante: R tools for integrating phylogenies and ecology. Bioinformatics 2010, 26, 1463–1464. [Google Scholar] [CrossRef] [Scilit]
- De Cáceres, M.; Legendre, P. Associations between species and groups of sites: Indices and statistical inference. Ecology 2009, 90, 3566–3574. [Google Scholar] [CrossRef] [Scilit]
- Gloor, G.B.; Macklaim, J.M.; Pawlowsky-Glahn, V.; Egozcue, J.J. Microbiome datasets are compositional: And this is not optional. Front. Microbiol. 2017, 8, 2224. [Google Scholar] [CrossRef] [Scilit]
- Kurtz, Z.D.; Müller, C.L.; Miraldi, E.R.; Littman, D.R.; Blaser, M.J.; Bonneau, R.A. Sparse and compositionally robust inference of microbial ecological networks. PLoS Comput. Biol. 2015, 11, e1004226. [Google Scholar] [CrossRef] [Scilit]
- Weiss, S.; Van Treuren, W.; Lozupone, C.; Faust, K.; Friedman, J.; Deng, Y.; Xia, L.C.; Xu, Z.Z.; Ursell, L.; Alm, E.J.; et al. Correlation detection strategies in microbial data sets vary widely in sensitivity and precision. ISME J. 2016, 10, 1669–1681. [Google Scholar] [CrossRef] [Scilit]
- Louca, S.; Parfrey, L.W.; Doebeli, M. Decoupling function and taxonomy in the global ocean microbiome. Science 2016, 353, 1272–1277. [Google Scholar] [CrossRef] [Scilit]
- Nguyen, N.H.; Song, Z.; Bates, S.T.; Branco, S.; Tedersoo, L.; Menke, J.; Schilling, J.S.; Kennedy, P.G. FUNGuild: An open annotation tool for parsing fungal community datasets by ecological guild. Fungal Ecol. 2016, 20, 241–248. [Google Scholar] [CrossRef] [Scilit]
- Douglas, G.M.; Maffei, V.J.; Zaneveld, J.R.; Yurgel, S.N.; Brown, J.R.; Taylor, C.M.; Huttenhower, C.; Langille, M.G.I. PICRUSt2 for prediction of metagenome functions. Nat. Biotechnol. 2020, 38, 685–688. [Google Scholar] [CrossRef] [Scilit]
- Oksanen, J.; Simpson, G.L.; Blanchet, F.G.; Kindt, R.; Legendre, P.; Minchin, P.R.; O’Hara, R.B.; Solymos, P.; Stevens, M.H.H.; Szöcs, E.; et al. vegan: Community Ecology Package, R package version 2.6-4; R Foundation for Statistical Computing: Vienna, Austria, 2022. [Google Scholar]
- Wickham, H. ggplot2: Elegant Graphics for Data Analysis, 2nd ed.; Springer: New York, NY, USA, 2016. [Google Scholar] [CrossRef] [Scilit]
- Fabbrini, M.; Scicchitano, D.; Candela, M.; Turroni, S.; Rampelli, S. Connect the dots: Sketching out microbiome interactions through networking approaches. Microbiome Res. Rep. 2023, 2, 25. [Google Scholar] [CrossRef] [Scilit]
- Jiang, W.; Zhai, Y.; Chen, D.; Yu, Q. A novel robust network construction and analysis workflow for mining infant microbiota relationships. mSystems 2025, 10, e01570-24. [Google Scholar] [CrossRef] [Scilit]
Disclaimer/Publisher’s Note: The statements, opinions and data contained in all publications are solely those of the individual author(s) and contributor(s) and not of MDPI and/or the editor(s). MDPI and/or the editor(s) disclaim responsibility for any injury to people or property resulting from any ideas, methods, instructions or products referred to in the content. |
© 2026 by the authors. Licensee MDPI, Basel, Switzerland. This article is an open access article distributed under the terms and conditions of the Creative Commons Attribution (CC BY) license.