


Abstract
Climate niches define species’ adaptive boundaries, forming a fundamental basis for understanding global patterns of plant diversity. However, existing assessments remain scale-limited or geographically confounded, leaving the complete picture of plant climate niches poorly understood. Here, we systematically evaluate the climate niches of 314,625 extant vascular plant species across a two-dimensional, orthogonal climate space defined by thermal and hydrological gradients, comparing how these niches diverge across plant growth and life forms. Our findings reveal that species richness peaks in warmer, central-to-right regions of climate space, whereas peripheral areas support far fewer species, indicating that few taxa adapt to extreme climatic conditions. Globally, most species exhibit intermediate niche breadths, with very few extreme specialists or broad generalists. Furthermore, both climatic niche breadth and positioning vary substantially across strategies. Across vegetative strategies, self-supporting woody taxa (trees and shrubs) as well as climbers and epiphytes generally maintain broader niches than herbs and subshrubs. In terms of niche positioning, herbs and subshrubs occupy cooler niches and, together with shrubs, show a general shift toward drier environments. Among life forms, annual therophytes and phanerophytes occupy the broadest climate spaces through different strategies. Specifically, phanerophytes and nanophanerophytes dominate warm and humid macroclimates, cold-tolerant hemicryptophytes shift heavily into colder climate space, and annual therophytes display strong drought adaptation by overwhelmingly occupying hyper-arid zones. These marked niche divergences among plant strategies advance our understanding of life-history adaptations and provide a crucial theoretical framework for predicting species vulnerability and guiding biodiversity conservation under future climate change.
1. Introduction
Although climate constrains plant geographic distribution [1], analyzing it solely in geographic space often obscures climatic effects due to confounding factors like dispersal limitations and biotic interactions [2]. Shifting the analytical focus to an orthogonal climate space overcomes this spatial noise and better reflects intrinsic climatic requirements [3,4]. By directly mapping species onto climate space, this approach provides a more accurate representation of intrinsic physiological tolerances, effectively decoupling environmental filtering from geographical confounding factors and laying a critical foundation for understanding plant distribution and community assembly [5,6,7]. Within this framework, quantifying climatic niche breadth and positioning becomes an imperative prerequisite for biodiversity conservation and management. Indeed, against the backdrop of accelerating global change, characterizing these niche attributes is vital for predicting species’ sensitivity and vulnerability to shifting temperature and precipitation regimes [8,9]. Such insights are paramount for anticipating widespread range shifts and prioritizing vulnerable taxa in future conservation agendas.
Ever since Hutchinson formalized the ecological niche as an n-dimensional hypervolume [10], this concept has been widely applied by macroecologists to analyze the climatic ranges of species [11,12]. This hypervolume framework provides a robust quantitative basis for capturing how multidimensional environmental factors interactively constrain plant survival and reproduction [11]. Recent innovative studies further link climatic niches to functional trait spectra, showing that “slow” resource-acquisition strategies (e.g., high leaf mass per area and high root tissue density) are strongly tied to specialized, marginal niches in stress-prone environments [8,13].
Growth forms represent fundamental architectural strategies of plants, dictating biomass allocation and the trade-offs between structural investment and resource acquisition [14]. Broad categories, such as trees, shrubs, herbs, and lianas, reflect contrasting light-use efficiencies, mechanical support costs, and hydraulic safety margins [15]. Furthermore, these categories encapsulate fundamental differences in life-history strategies (such as longevity and generation time) and dispersal capacities, which critically govern whether species can tolerate climatic extremes in situ or track shifting environmental conditions through migration and rapid colonization. In parallel, Raunkiærian life forms capture evolutionary solutions to seasonality and extreme climatic stress, specifically classified by the positioning of perennating buds during unfavorable periods [16]. These life forms encompass a continuum of survival strategies, ranging from stress tolerance (which is generally more developed in phanerophytes) to stress avoidance, which is characteristic of therophytes and, to a lesser extent, geophytes [17]. Ultimately, evaluating how growth forms and life forms partition climate space clarifies how plant physical design and phenological strategies jointly shape broad-scale stress tolerance, providing a key mechanistic link between physiological persistence and biome-scale ecosystem functioning. Although global plant distributions are increasingly documented [18], climatic niches have rarely been systematically evaluated within a two-dimensional climate space across the full spectrum of vascular plant growth and life forms.
In this study, we conducted a comprehensive evaluation of the climatic niches of 314,625 extant vascular plant species by projecting the global flora into a two-dimensional orthogonal climate space. Utilizing global distribution records and standardized climatic variables, we quantified niche breadth and centroids for all major growth forms and Raunkiærian life forms. Specifically, we tested whether distinct growth and life forms exhibit specialized, non-random occupation patterns within climate space. In doing so, this study illuminates the adaptive mechanisms of plant life histories, providing a critical theoretical framework for understanding global plant distribution patterns and guiding biodiversity conservation.
2. Materials and Methods
2.1. Compilation of Plant Data
To establish a near-complete global checklist of vascular plant species paired with plant form classifications, we merged two of the largest global botanical repositories—the World Checklist of Vascular Plants [19] and the Global Inventory of Floras and Traits [20]—following the harmonization protocol outlined by Taylor et al. (2023) [21]. Public database queries and taxonomic processing were streamlined in R using the rWCVP (version 1.3.0) [22] and GIFT (version 1.3.3) [23] packages. Species were categorized into distinct plant functional types along two primary axes: vegetative growth habit (growth forms, comprising trees, shrubs, subshrubs, herbs, epiphytes, and climbers) and the vertical positioning of perennating buds during unfavorable seasonal conditions (Raunkiær life forms, comprising phanerophytes, nanophanerophytes, chamaephytes, geophytes, hemicryptophytes, and therophytes) [21]. Species names were aligned with the WCVP taxonomic standard. Where a species exhibited different growth or life forms across datasets, we retained all reported classifications to capture its phenotypic variation. While this approach acknowledges genuine intraspecific phenotypic plasticity and Raunkiaer-type life-form flexibility, we recognize that some inconsistencies may also stem from taxonomic ambiguities, divergent data-compilation conventions, or database errors rather than true biological variation. Following taxonomic harmonization and data quality filtering, a total of 314,625 extant vascular plant species were retained for analysis, whereas 126,039 taxa missing functional trait data were omitted. Across growth habits, the retained flora encompassed 52,307 trees, 46,841 shrubs, 23,855 subshrubs, 133,661 herbs, 31,410 epiphytes, and 21,628 climbers. Across Raunkiær life forms, it comprised 75,726 phanerophytes, 37,159 nanophanerophytes, 40,938 chamaephytes, 43,601 geophytes, 56,087 hemicryptophytes, and 20,722 therophytes.
Species-level geographic occupancy was extracted from native distribution records in the WCVP database. Spatial information in WCVP was retrieved at Level 3 of the Taxonomic Databases Working Group scheme (TDWG botanical countries; [24]), encompassing 369 terrestrial units. To rasterize the regional polygon data into a uniform spatial framework, global terrestrial areas were discretized using an equal-area Behrmann projection at a 110 km × 110 km grid resolution (approximately 1° at the equator) [3]. A spatial intersection was performed between the grid cells and the TDWG Level 3 polygons using the sf package (version 1.0.21) to map grid cells to their corresponding botanical regions. Cultivated, introduced, and extinct records were strictly omitted to isolate naturalized, extant realized distributions. We then structured species occurrences across botanical regions into a sparse matrix, which was subsequently multiplied by the grid-to-region spatial mapping matrix. This procedure derived the final global gridded species assemblage presence–absence matrix, yielding a clean, binary occupancy dataset where rows represent geographic grid cells and columns represent individual plant species.
2.2. Construction of the Climate Space
We built a two-dimensional climate space to map plant species distributions, allowing us to quantify climatic niches unconfounded by geographic landmass configurations [3,4]. We selected 12 macroclimatic predictors across the 1981–2010 baseline period to capture global thermal energy and water availability gradients. Eleven bioclimatic variables (bio1–7 and bio12–15) were retrieved from the CHELSA v2.1 database at a 30 arc-second resolution [25]. To accurately reflect annual water balance, these predictors were supplemented with potential evapotranspiration (PET) derived from the monthly CHELSA-BIOCLIM+ dataset [26]. Monthly PET values were aggregated annually and averaged across an identical 30-year climatological window to maintain temporal consistency. Together, these twelve variables form a comprehensive hydrothermal framework that captures the key climatic drivers of species distribution and ecosystem patterns. All spatial raster processing and grid aggregations of the 12 environmental layers onto the 110 km × 110 km equal-area grid system were executed in R using the terra package (version 1.8.60) [27].
To eliminate severe multicollinearity among climate variables and extract the primary orthogonal axes of environmental variation, we performed a principal component analysis on the standardized climate variables across all terrestrial grid cells supporting non-zero plant species richness. The first two principal components were retained as coordinate axes to define the two-dimensional climate space, with PC1 capturing temperature-related gradients and PC2 reflecting water resources-related gradients (Table 1). This climate space was then discretized into a uniform grid of climatic cells by dividing both axes into 30 equal intervals. This 30 × 30 resolution balances environmental detail with computational efficiency, ensuring sufficient granularity to capture microclimatic variation while preventing data overfitting across the climate space. Each valid geographic grid cell was uniquely projected into a single climatic cell based on its coordinate PC scores. Consequently, the geographical distribution of each species was projected into climate space as an occupied region composed of a specific set of climatic cells.
Table 1.
Principal component analysis (PCA) loadings, standard deviations, and explained variances of the 12 climatic variables used to define the two-dimensional global climatic niche space. The variables are grouped by environmental category (temperature vs. water availability), and the ecological interpretations of the first two principal components (PC1 as temperature-related and PC2 as water resources-related) are detailed based on their dominant loadings.
2.3. Quantification of Species’ Climatic Niches
By mapping species’ geographic ranges into the gridded climate space, each species’ realized climatic niche was represented as a set of occupied climatic cells. From this climate space occupancy, we calculated species richness per climatic cell as the aggregate sum of distinct species present and quantified two properties characterizing the climatic niche for each individual plant species, namely niche breadth and niche centroid.
The climatic niche breadth, denoted as Ncells, was defined as the total number of unique climatic cells occupied by a species in climate space. To determine the positional centroid of a species’ climatic niche, we calculated both unweighted and area-weighted centroid coordinates along the orthogonal PC1 axis representing temperature-related gradients and the PC2 axis representing water resources-related gradients. The unweighted centroid, Cunweighted, represents the simple geometric center of the occupied climatic cells of a species, derived as
where Pi is the coordinate midpoint of either the PC1 or PC2 score for the i-th occupied climatic cell.
Because environmental conditions are distributed highly unevenly across the terrestrial globe, we calculated the area-weighted centroid, Cweighted, to adjust for the uneven spatial prevalence of environmental conditions. Each occupied climatic cell was weighted by its geographic occurrence frequency, defined as the actual number of geographic grid cells, gi, comprising that climatic cell:
where wi represents the proportional geographic representation of climatic cell i relative to the total geographic grid coverage spanned across all climatic cells occupied by that species.
2.4. Statistical Analyses
All statistical analyses and graphical visualizations were executed in the R version 4.5.0 software environment [28]. To describe global variations in climatic niche breadth, unweighted centroids, and area-weighted centroids, we estimated probability density functions and computed median values with interquartile ranges. To evaluate variations in climatic niche properties among distinct growth forms and Raunkiær life forms, we performed non-parametric Kruskal–Wallis tests followed by Dunn’s post hoc pairwise comparisons using the rstatix (version 0.7.2) and multcompView (version 0.1.10) packages [29,30]. To assess the structural composition of climatic niche specialization and positional preferences within each plant form, species were grouped into four global quartiles (0%–25%, 25%–50%, 50%–75%, and 75%–100%) based on the distributions of niche breadth and area-weighted PC centroids. We then calculated and compared the relative proportions of species within each quartile group across individual growth forms and life forms using 100 percent stacked bar plots.
3. Results
3.1. Global Plant Climate Niche Patterns
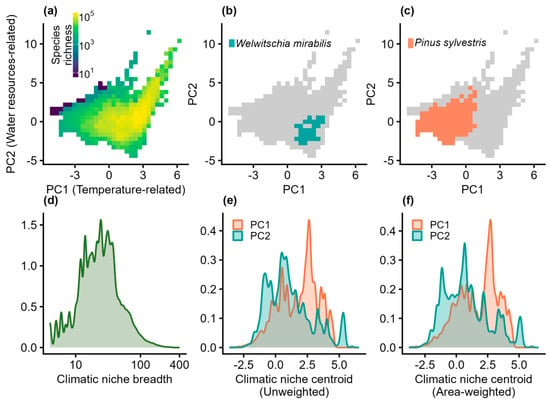
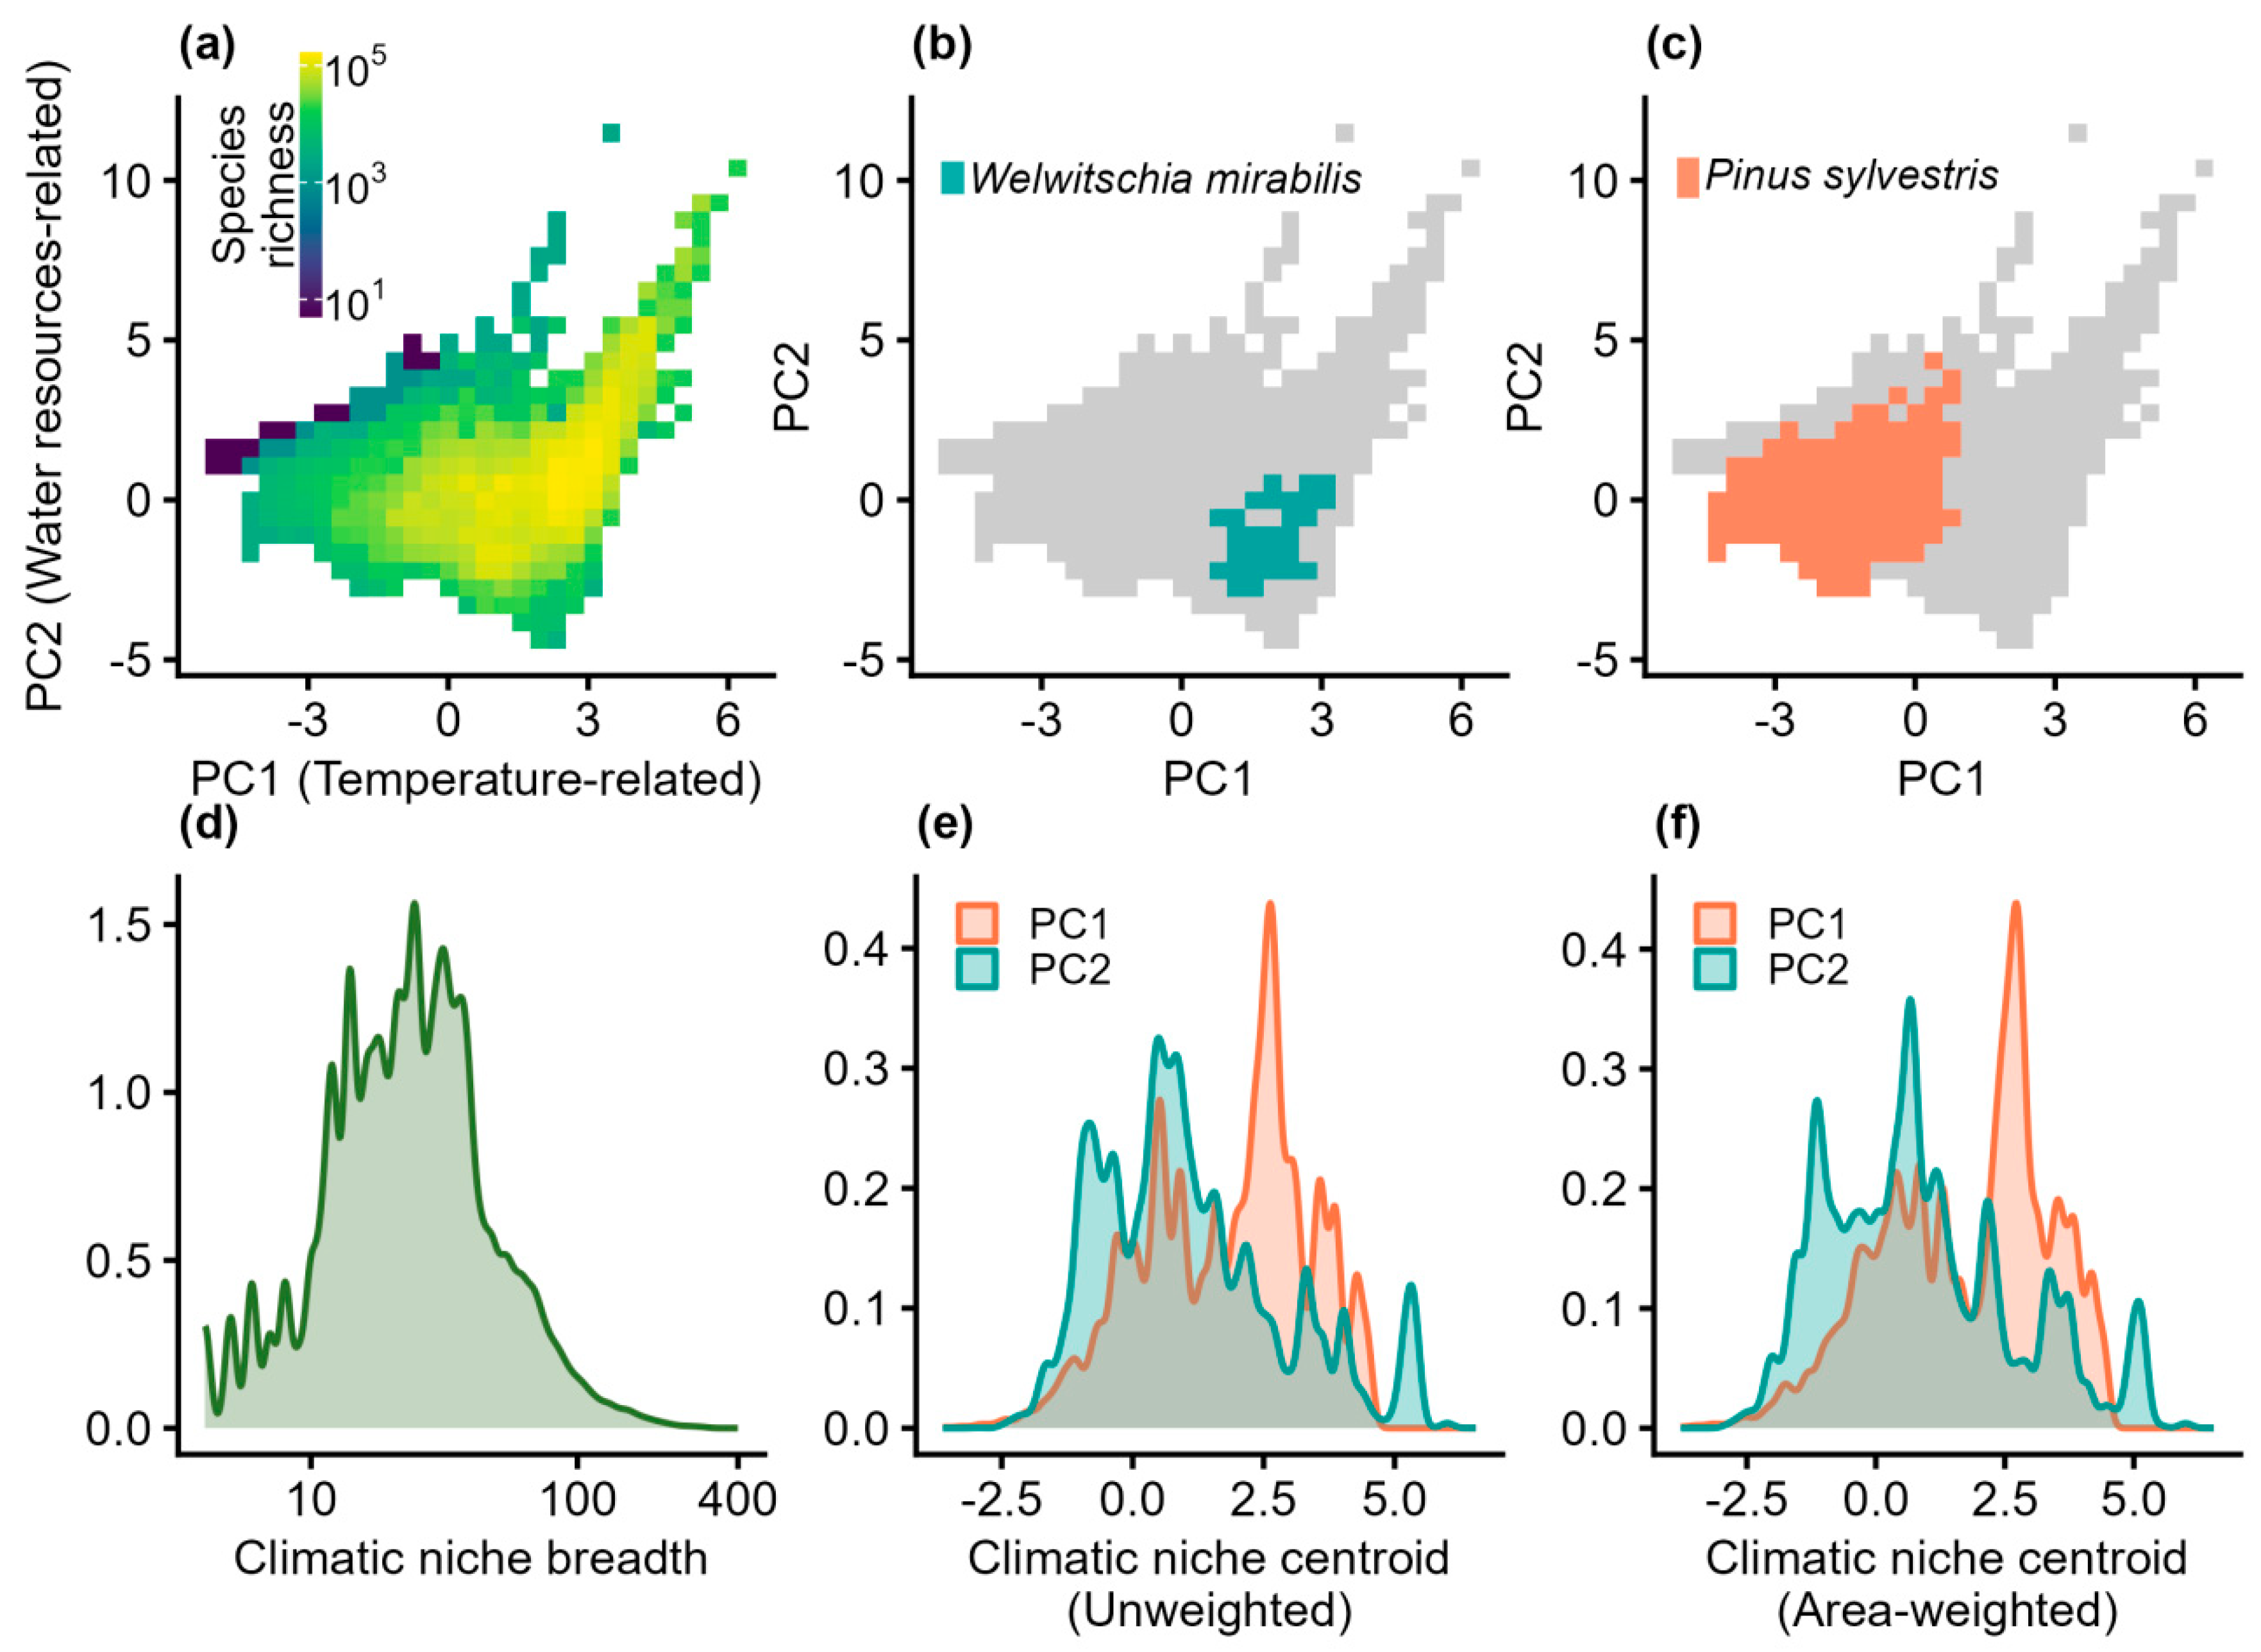
In the two-dimensional climate space defined by PC1 (temperature) and PC2 (water), global plant species richness shows a highly concentrated pattern (Figure 1a). Plant species richness varies widely across the 319 grid cells in this climate space, with most biodiversity clustered in the warmer, center-right region of the climate space. In contrast, peripheral regions with extreme environments, such as severe aridity or extreme cold, pose strong physiological limits, supporting much lower species richness. To highlight the diversity of species tolerances, two contrasting gymnosperm species were mapped across the global grid (Figure 1b,c). Welwitschia mirabilis serves as a classic example of a hyper-specialist, occupying a restricted climatic niche, confined to just 28 cells (8.78% of the total space) in relatively warmer regions (Figure 1b). In contrast, Pinus sylvestris functions as a widespread generalist, occupying a much broader climatic niche, covering 108 grid cells (33.86% of the global grid) extending into colder zones across wide moisture ranges (Figure 1c).
Figure 1.
Species richness, two contrasting species examples, and niche probability distributions across the climatic principal component space: (a) Distribution of global plant species richness within the two-dimensional climatic space defined by PC1 (temperature-related gradient) and PC2 (water resources-related gradient), with richness values presented on a log10 scale. (b,c) Distinct climatic niche spaces overlaying the total available global climatic grid skeleton (grey background), such as the highly specialized and restricted niche (highlighted in teal) occupied by Welwitschia mirabilis (b) and the widely generalized niche (highlighted in orange) occupied by Pinus sylvestris (c). (d–f) Global probability density distributions across all extant plant species for climatic niche breadth (d), unweighted climatic niche centroids representing the geometric centers of occupied climatic grids (e), and area-weighted climatic niche centroids accounting for the actual geographic surface area of those occupied climatic grid cells (f) along the PC1 and PC2 axes.
Globally, most plant species have intermediate climatic niche breadths, whereas extreme specialists (minimum = 1 cell) and widespread generalists (maximum = 307 cells) are relatively rare (Figure 1d). Similarly, species centroids along both the temperature (PC1) and water (PC2) axes are concentrated in moderate environmental conditions, with fewer species occupying extreme climates (Figure 1e,f).
3.2. Divergences in Climatic Niches Across Plant Growth Forms
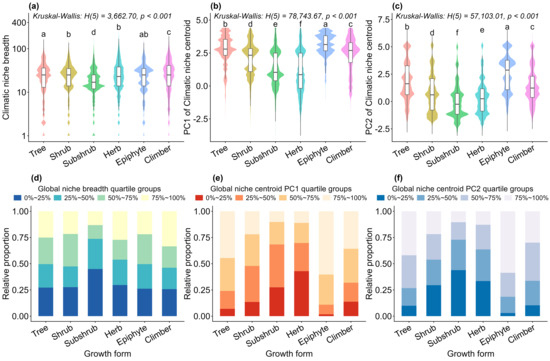
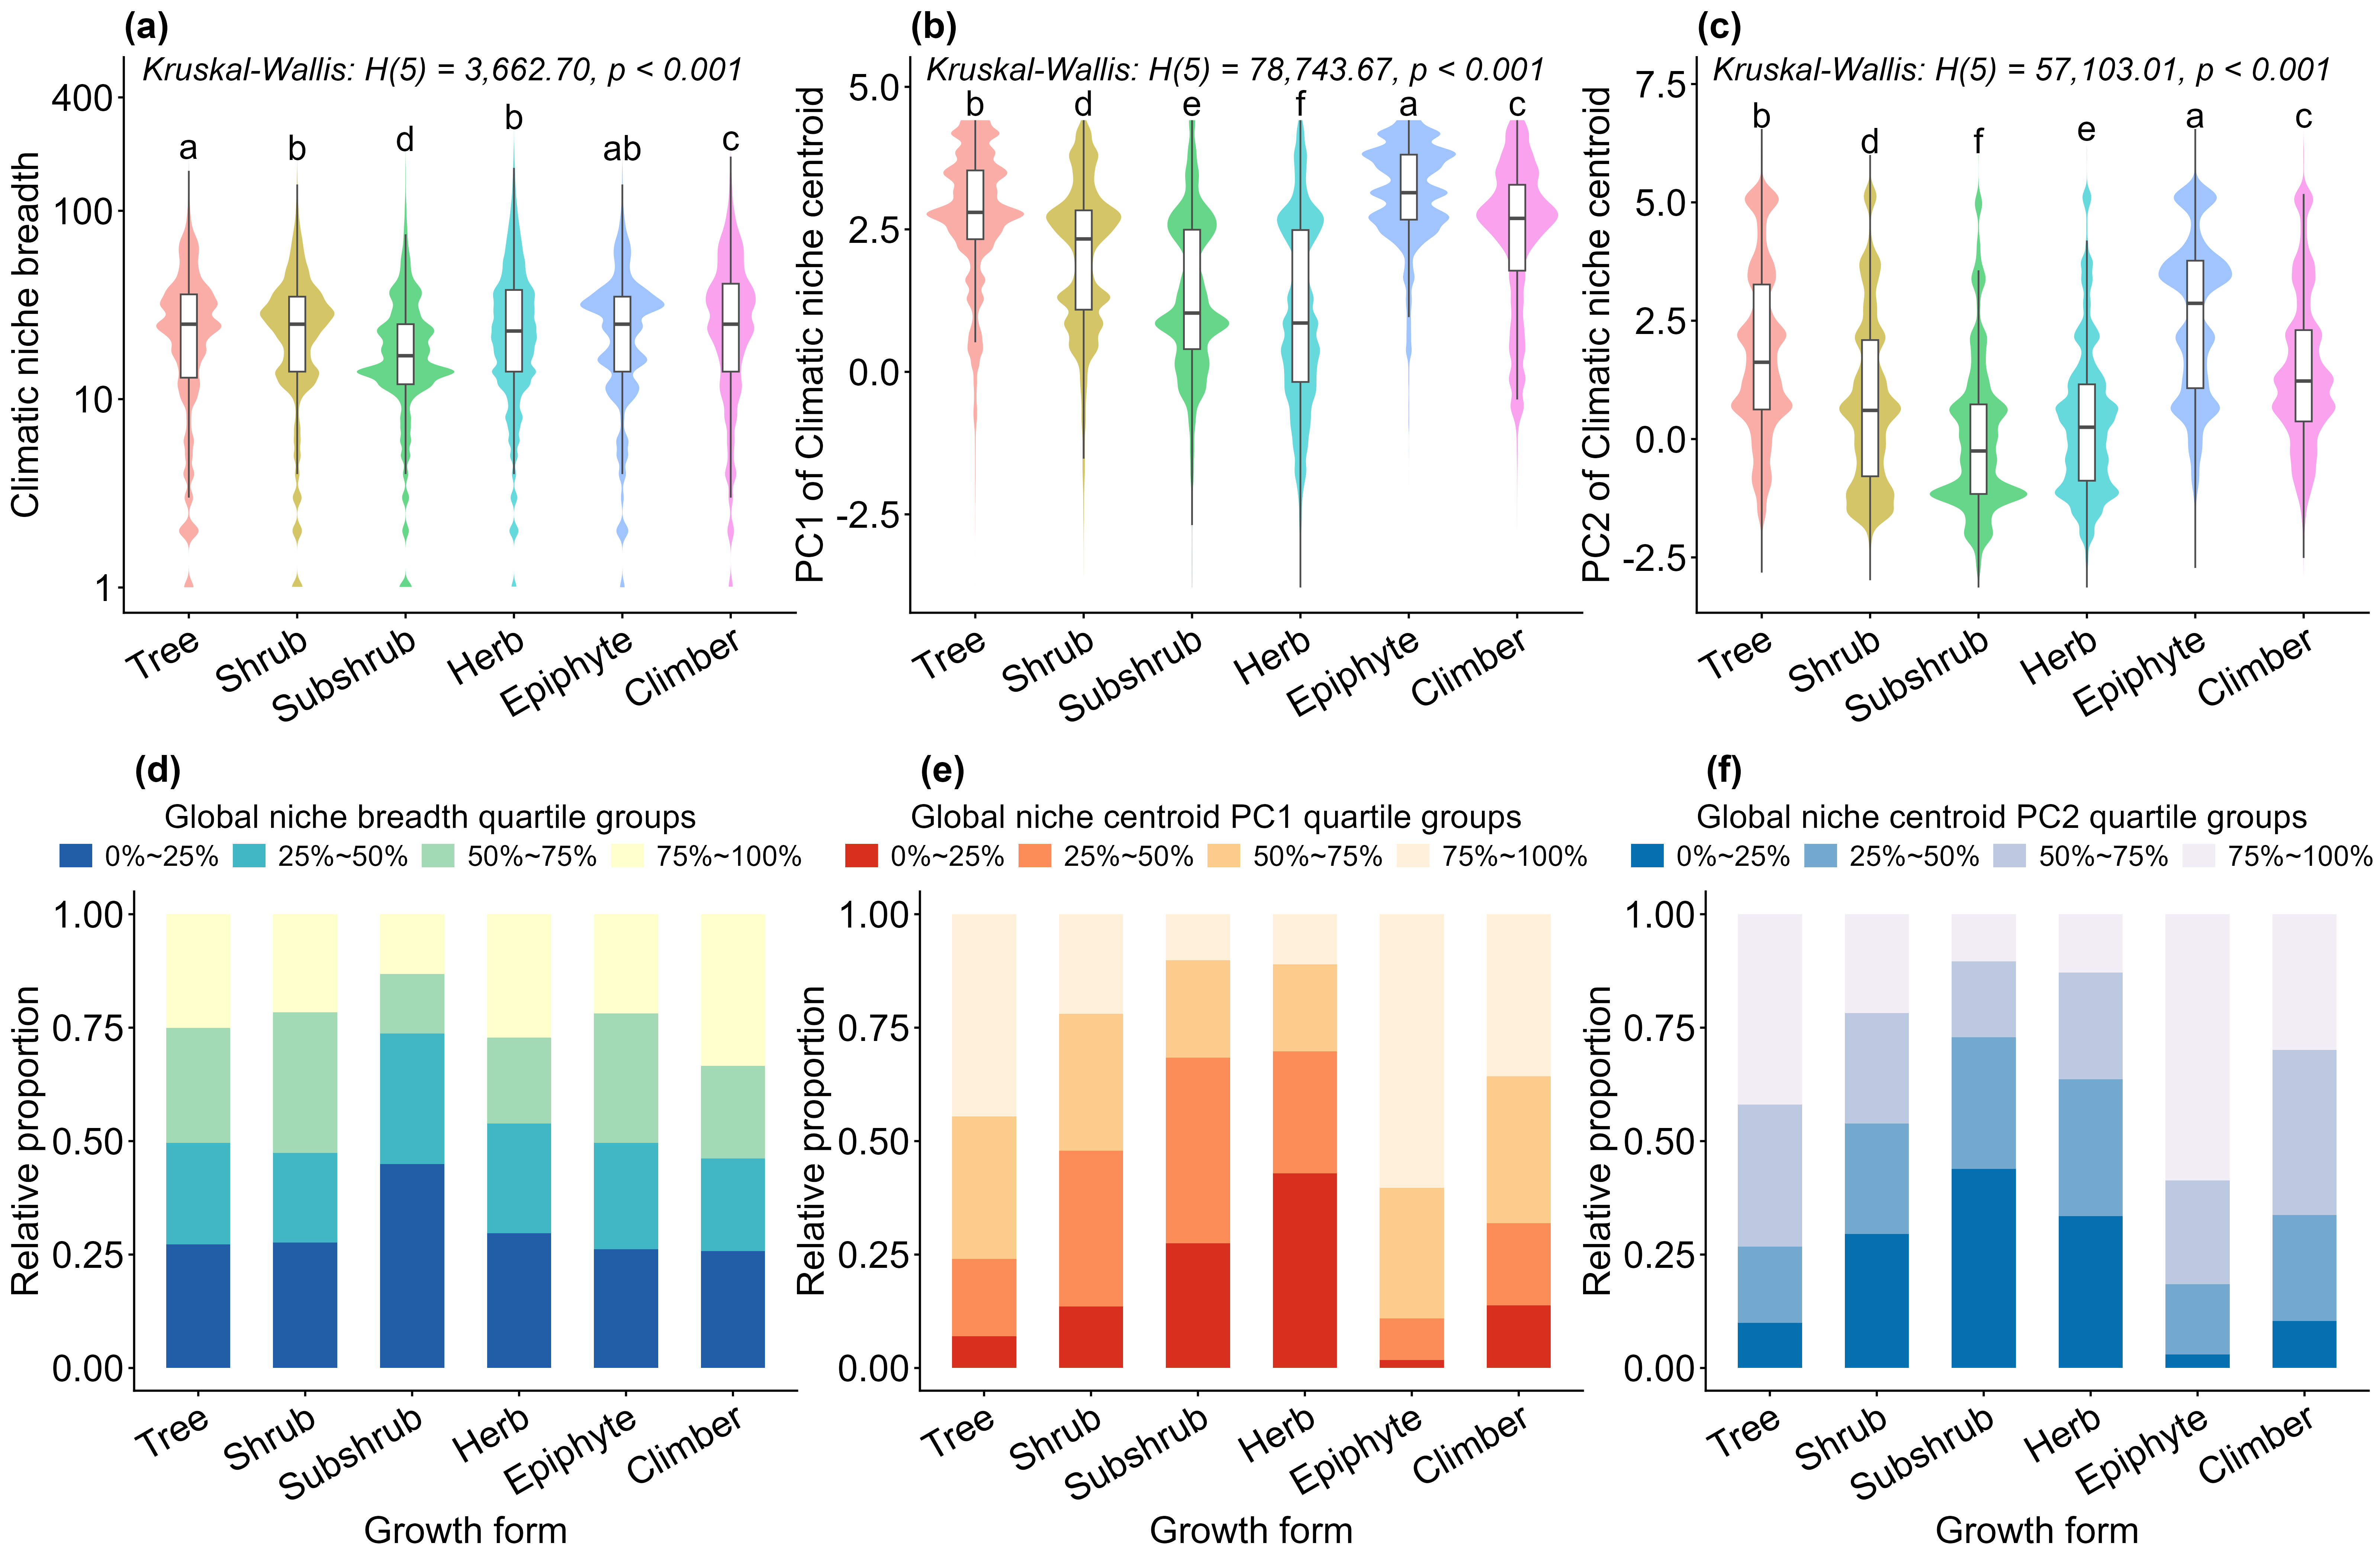
Different plant growth forms across the globe show distinct climatic niche breadths and positions (p < 0.001; Figure 2a–c). Trees, shrubs, climbers, and epiphytes consistently maintain the widest climatic niches, all sharing an identical median niche breadth of 25 cells. In contrast, subshrubs and herbs exhibit narrower climatic niches. Herbs possess a median niche breadth of 23 cells, whereas subshrubs display the most constrained environmental capacity of all examined groups, with a median niche breadth of just 17 cells (Figure 2a). These variations are cleanly mirrored in the discrete global quartile compositions (Figure 2d). More than half of the shrub and tree species are concentrated within the upper global quartiles (50%–75% and 75%–100%), indicating broad macroclimatic tolerance. Conversely, subshrubs are heavily overrepresented in the lowest global quartile group (0%–25%), representing a pronounced evolutionary skew toward restricted and highly localized environmental configurations within this group. Herbs also exhibit a strong concentration in the same lower range.
Figure 2.
Variations in climatic niche breadth, niche positions, and global quartile group compositions across different plant growth forms: (a–c) Distribution of climatic niche breadth (log10 scale) (a), alongside area-weighted climatic niche centroids along the temperature-related axis (PC1) (b) and the water resources-related axis (PC2) (c) across distinct plant growth forms. In these panels, the violin plots illustrate probability density distributions, horizontal bars inside the boxes indicate medians, italicized texts denote the overall non-parametric Kruskal–Wallis test results, and different lowercase letters represent significant pairwise differences based on Dunn’s post hoc tests. (d–f) The 100% stacked bar plots showing the relative proportions of plant species within each growth form that fall into the four global quartile groups (0%–25%, 25%–50%, 50%–75%, and 75%–100%) calculated across all pooled global plant species for niche breadth (d), area-weighted PC1 centroid position (e), and area-weighted PC2 centroid position (f).
The positions of niche centroids along the two climate axes further show that, beyond differences in niche breadth, growth forms also occupy distinct locations in climate space (Figure 2b,c). Along the thermal axis (PC1), herbs and subshrubs occupy notably cooler niches, maintaining lower median PC1 centroids (Figure 2b). The stacked quartile proportions (Figure 2e) further show this pattern, where the highest thermal quartile (75%–100%) is mostly dominated by epiphytes and climbers, in sharp contrast to the low proportion of herbs and subshrubs. Tree species likewise showed a strong tendency toward warmer thermal regimes. Along the hydrological gradient (PC2), subshrubs, shrubs, and herbs show lower median values, shifting toward drier environments. Conversely, epiphytes, trees, and climbers occupy higher positions along this gradient (Figure 2c). This hydrological contrast is clearly demonstrated in the global quartile breakdown (Figure 2f). The hyper-arid quartile (0%–25%) captures a disproportionately large percentage of the global subshrub, shrub, and herb flora. For epiphytes, trees, and climbers, over 50% of their species fall into the higher moisture quartiles (50%–75% and 75%–100%).
3.3. Divergences in Climatic Niches Across Plant Life Forms
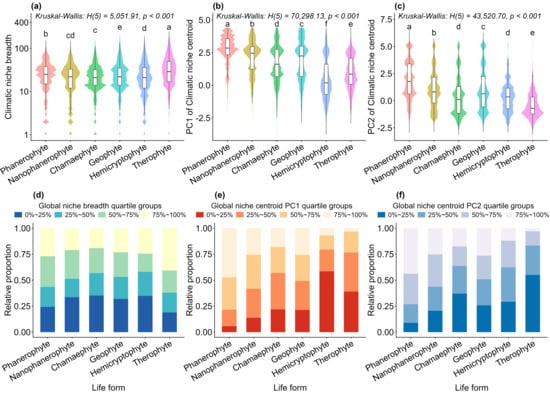
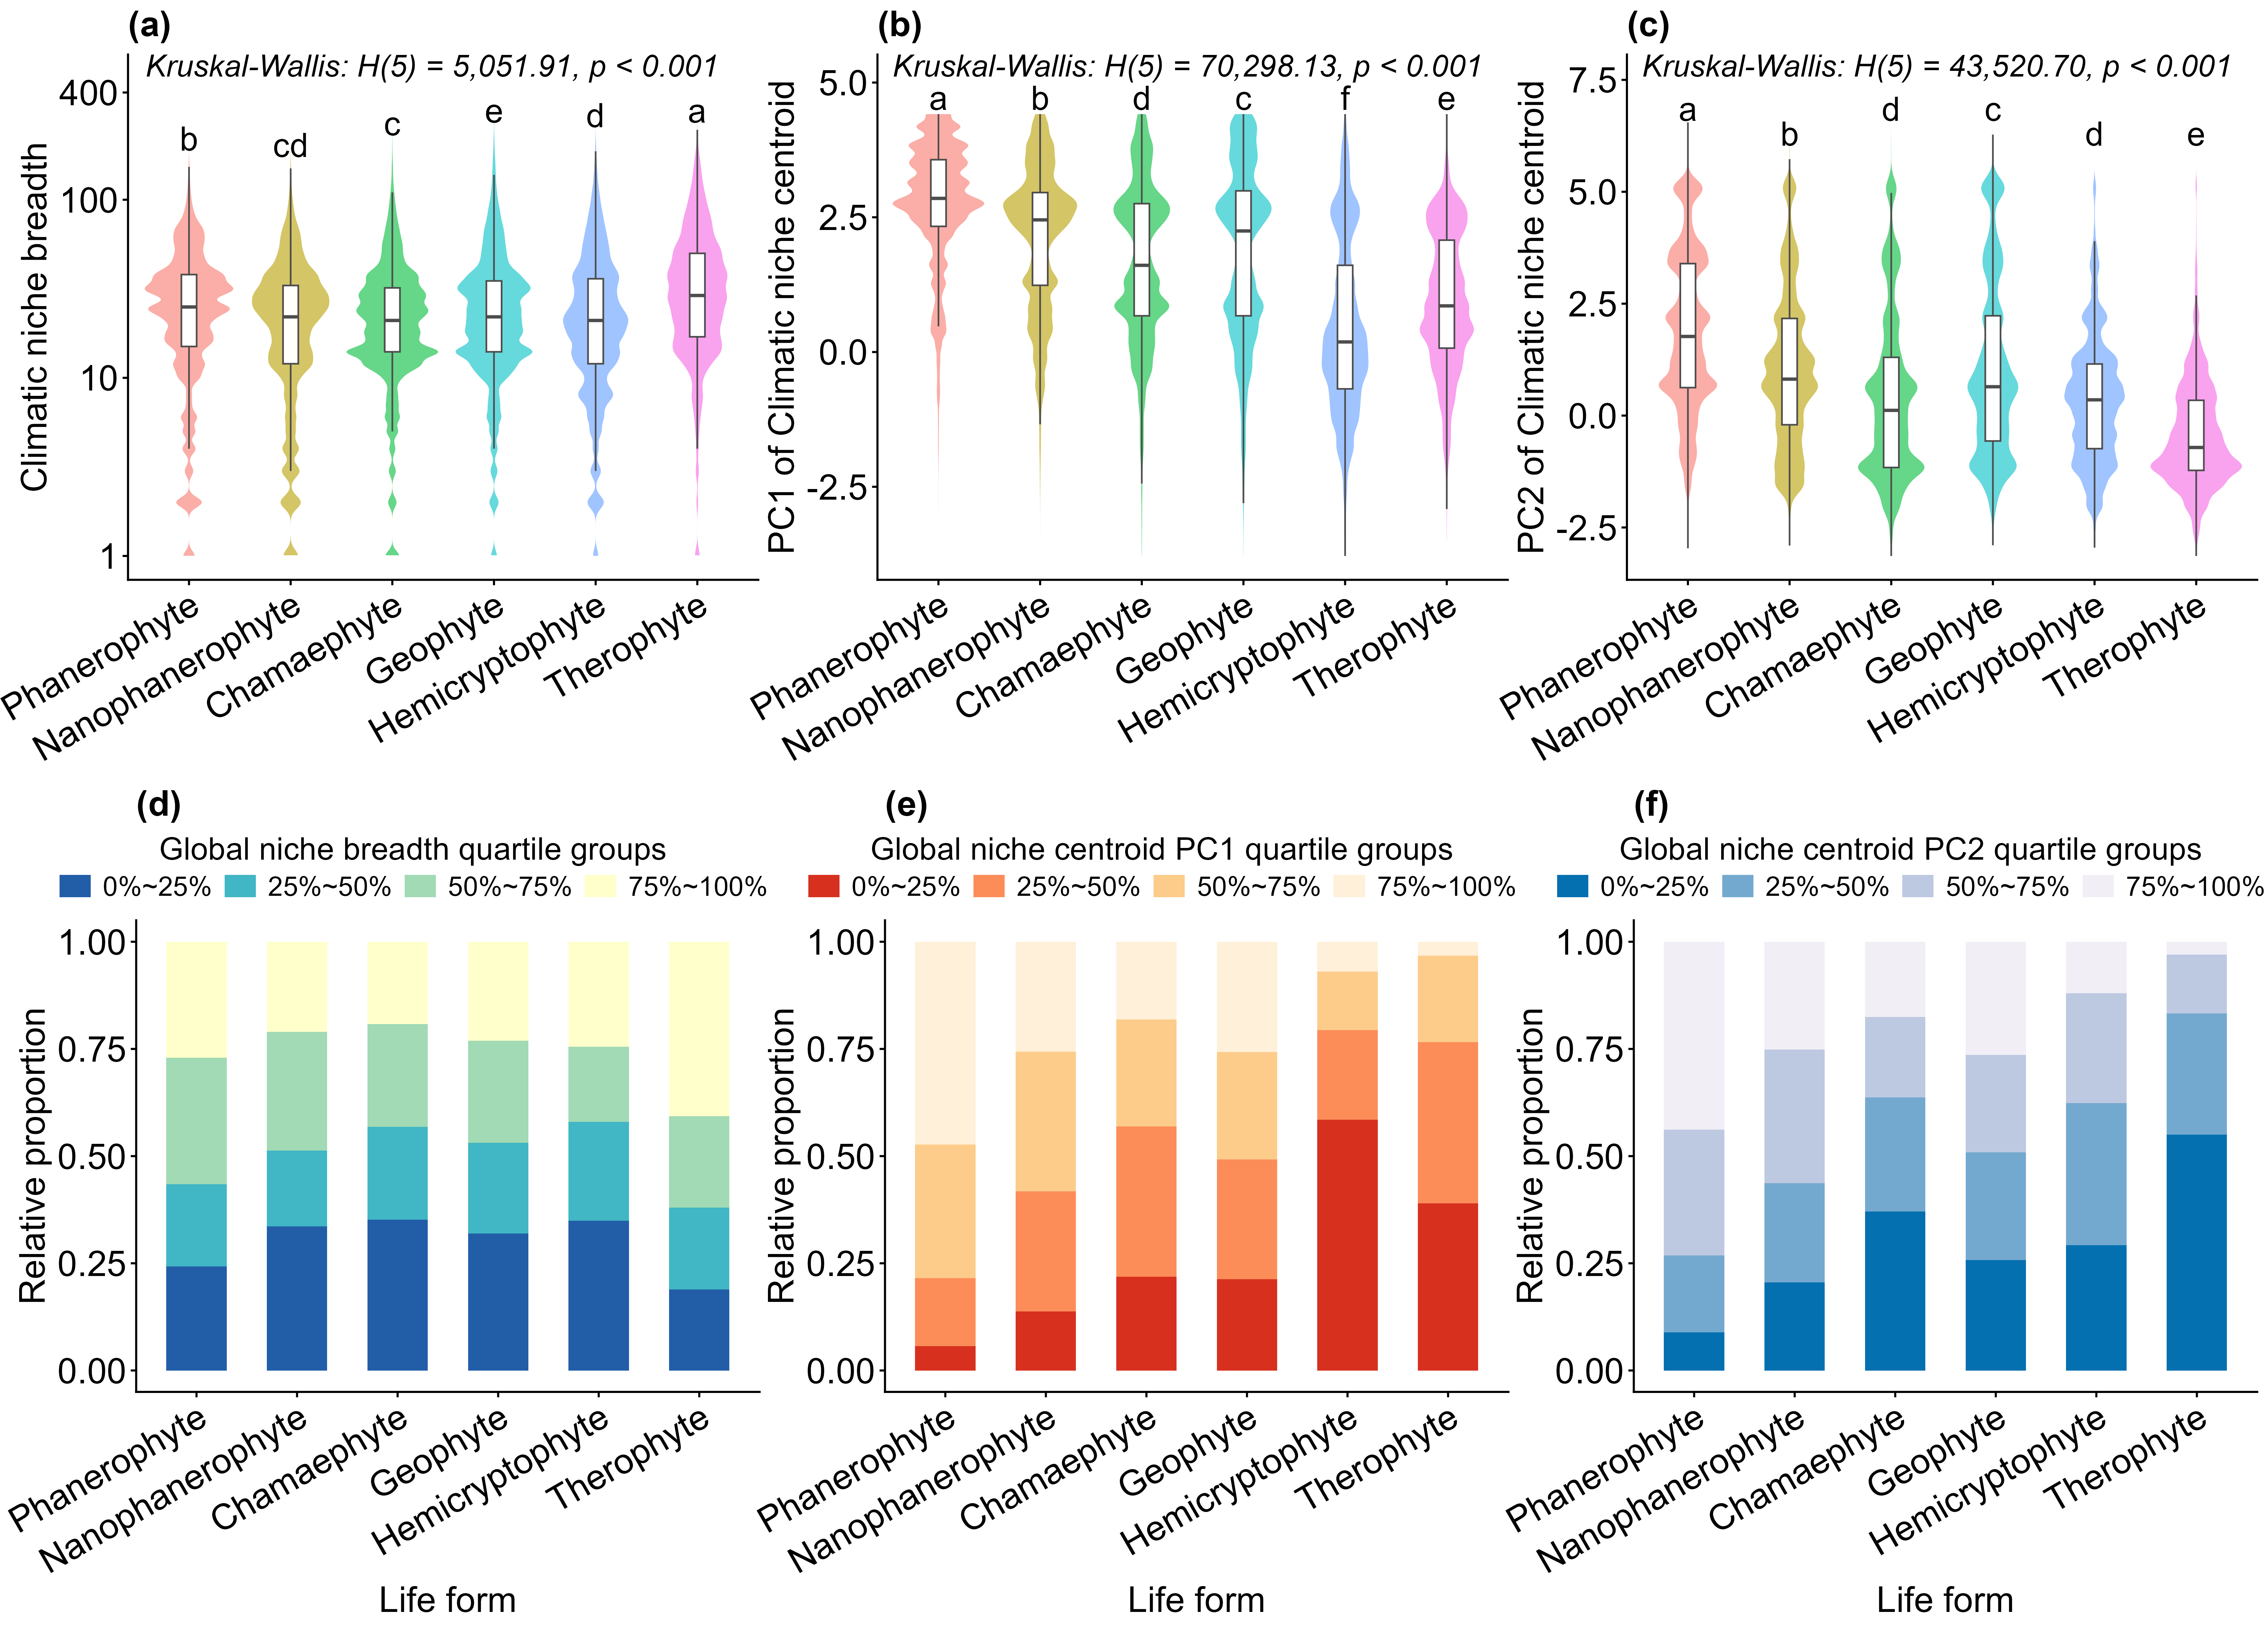
Evaluating global flora under the Raunkiær life-form framework reveals clear differences in all three niche attributes (p < 0.001; Figure 3a–c). Climatic niche breadth varies substantially across plant life forms (Figure 3a,d). Therophytes (annual plants) surprisingly exhibit the largest median climatic niche breadth (Figure 3a), with a striking 40.73% of annual species concentrated within the highest global generalist quartile (75%–100%; Figure 3d). Among perennial strategies, phanerophytes display the widest environmental tolerances, with over half of their flora clustered in the two upper global quartiles (50%–100%; Figure 3a,d). In contrast, hemicryptophytes, chamaephytes, nanophanerophytes, and geophytes show narrow environmental tolerances, with high proportions concentrated in the lowest global quartile (0%–25%) (Figure 3d).
Figure 3.
Variations in climatic niche breadth, niche positions, and global quartile group compositions across different plant life forms: (a–c) Distribution of climatic niche breadth (log10 scale) (a), alongside area-weighted climatic niche centroids along the temperature-related axis (PC1) (b) and the water resources-related axis (PC2) (c) across distinct plant life forms. In these panels, the violin plots illustrate probability density distributions, horizontal bars inside the boxes indicate medians, italicized texts denote the overall non-parametric Kruskal–Wallis test results, and different lowercase letters represent significant pairwise differences based on Dunn’s post hoc tests. (d–f) The 100% stacked bar plots showing the relative proportions of plant species within each life form that fall into the four global quartile groups (0%–25%, 25%–50%, 50%–75%, and 75%–100%) calculated across all pooled global plant species for niche breadth (d), area-weighted PC1 centroid position (e), and area-weighted PC2 centroid position (f).
The positions of niche centroids along the two climatic axes further reflect the ecological differences driven by life history strategies (Figure 3b,c). Along the temperature-related gradient (PC1), phanerophytes and nanophanerophytes possess the highest median centroid scores, reflecting an optimal positioning within stable warm-temperate and tropical zones (Figure 3b). This profile contrasts sharply with hemicryptophytes, whose distributions extend significantly deeper into negative PC1 territory (Figure 3b). This thermal segregation is highly pronounced in the discrete quartile distributions, where a substantial 47.31% of phanerophytes cluster in the warmest global quartile (75%–100%), while a massive 58.45% of hemicryptophytes are compressed into the coldest global quartile (0%–25%; Figure 3e). Along the water resources-related gradient (PC2), different life forms show significant variations (Figure 3c). Therophytes are significantly shifted toward the arid end of the axis, exhibiting the lowest global median PC2, whereas phanerophytes maintain a highly water-dependent profile with an elevated median (Figure 3c). This hydrological divergence is confirmed by the relative proportion profiles, where the hyper-arid global quartile (0%–25%) captures a disproportionately massive 54.99% of the global therophyte flora, contrasting sharply with the stable moisture requirements of phanerophytes, of which 43.81% are strictly restricted to the wettest macroclimatic quartile (75%–100%; Figure 3f).
4. Discussion
4.1. Macroclimate and Global Niche Patterns
In this study, projecting the global flora onto a standardized environmental coordinate system successfully transitions biodiversity mapping from traditional geographic landscapes to an orthogonal climate space (Figure 1a). This framework demonstrates that climate conditions in peripheral cells are too extreme for plant survival, resulting in very low species richness in these areas. This pattern likely stems from severe physiological constraints, as overcoming extreme frost, prolonged drought, or high evaporative demand requires costly metabolic and structural adaptations that only a few specialized lineages have evolved [31]. For example, taxa occupying hyper-arid and high-evaporative peripheral zones often rely on specialized physiological adaptations, such as Crassulacean Acid Metabolism (CAM) and C4 photosynthetic pathways found in succulent lineages (e.g., Cactaceae and Euphorbiaceae) or drought-tolerant desert shrubs (e.g., Amaranthaceae). Similarly, survival in the coldest peripheral regimes is restricted to cold-hardy arctic-alpine cushions and prostrate dwarf shrubs equipped with specialized freeze–thaw protective mechanisms. The high concentration of species richness in central-to-warm, moderate-moisture regions reflects the convergence of many species’ realized niches in this portion of climate space, likely driven by a combination of physiological constraints, evolutionary history, and the prevalence of climatically moderate conditions globally. However, this aggregate pattern does not imply a single shared optimum, as niche positions vary substantially across growth and life forms. Moreover, niche breadth follows a clear unimodal distribution, indicating that the vast majority of vascular plants possess moderate climatic tolerances rather than extreme ones (Figure 1d). Although a few extreme specialists occupy marginal zones and a subset of generalists span wide environmental gradients [12], most species act as environmental subordinates with restricted-to-moderate niches, aligning with recent findings on plant strategies [32]. Ultimately, this global baseline supports Hutchinson’s duality by demonstrating that macroecological and environmental constraints shape the realized niche occupancy of the global flora [11]. Crucially, climate space effectively captures these macroecological and environmental boundaries while filtering out geographic noise [4].
4.2. Divergent Macroclimatic Adaptations in Plant Growth and Life Forms
Functional sorting across plant growth forms directly underlies their divergent climate space occupation (Figure 2). The strong preference of epiphytes, climbers, and trees for warm and wet regimes (Figure 2e,f) highlights their evolutionary dependence on high thermal energy and water availability, validating that vegetative growth forms are functionally coordinated with global climatic gradients [21]. This trend is largely consistent with the findings of Taylor et al. (2023) [21], who showed that self-supporting woody plants and non-self-supporting structural forms (epiphytes and climbers) are more likely to occupy warmer regions, whereas herbs are more prevalent in colder areas. This climatic sorting strongly mirrors the “Slow–Fast” plant economics spectrum: while acquisitive or structurally complex forms thrive in high-resource, benign tropical and temperate cores, species occupying marginal and stress-prone niches adopt conservative survival strategies [8]. For instance, the pronounced concentration of subshrubs and herbs in colder (Figure 2b,e), drier (Figure 2c,f), and narrower climate spaces (Figure 2a,d) reflects the steep physiological costs of maintaining hydraulic vessel integrity and freezing resistance in extreme environments. Conversely, self-supporting woody perennials (trees and large shrubs) leverage massive architectural carbon allocation and long-term resource storage to buffer environmental fluctuations, enabling over 50% of their species to achieve broad macroclimatic tolerances across the upper niche-breadth quartiles (Figure 2d) [33].
Evaluating plant niches through Raunkiær life forms reveals a functional hierarchy (Figure 3) that challenges traditional assumptions of woody dominance in climatic tolerance [34]. A pivotal finding of this research is the annual generalist paradigm exhibited by therophytes, which achieve the widest global climatic niche breadths not through active tissue tolerance, but by employing a temporal stress-escape strategy—surviving unfavorable seasons as dormant seeds [32]. This seasonal avoidance facilitates a much broader macroclimatic expansion across hyper-arid gradients (Figure 3c,f) than is possible for many perennial herbs, supporting the concept that macroclimatic filtering interacts directly with life-history strategies [21]. In contrast, perennial strategies with year-round vegetative structures trade off broad climatic generalism for localized, specialized survival. While chamaephytes and hemicryptophytes exhibit narrow climatic breadths (Figure 3a,d) due to the specialization of perennating tissue near or at the soil surface, sheltering buds under ground-level microhabitats or winter snow cover enables them to colonize extreme, seasonal cold regimes where tall phanerophytes are structurally excluded [6,35]. Conversely, phanerophytes leverage extensive carbon allocation and architectural complexity to dominate stable, warm, and wet regimes, maintaining broad niches across non-extreme zones (Figure 3d–f). Interestingly, the two life forms possessing the broadest niche breadths display opposite hydrological preferences. Phanerophytes are highly dependent on moist conditions, whereas annual therophytes are strongly shifted toward hyper-arid environments (Figure 3f). This reveals that completely different evolutionary strategies can both lead to broad climatic niches, showing that plants can achieve wide spatial success either through intense resource exploitation in humid zones or specialized drought avoidance in hyper-arid regions. Together, these patterns highlight the diverse evolutionary pathways through which perennating anatomy enables plants to successfully navigate global climatic constraints.
4.3. Limitations and Future Implications
Although this study leverages massive global datasets, our findings reflect the realized climatic niche—where plants actually live—rather than their absolute physiological tolerance. Because of dispersal barriers (such as oceans and mountain ranges), evolutionary history, and species competition, plants rarely occupy every region they could physiologically survive [33]. Additionally, fine-scale edaphic factors such as soil properties and lithology further constrain local occurrences, meaning that even climatically suitable areas may remain unoccupied if substrate conditions are unfavorable. For instance, a species might thrive in a warmer climate if transplanted, but in nature, it is excluded by stronger competitors or simply never managed to cross a geographical barrier. From the conceptual lens of island biogeography [36], favorable core climate zones can be conceptualized as large, accessible “mainlands,” whereas peripheral extreme climates act as isolated “remote islands.” Due to the dual constraints of geographical dispersal limitations and physiological barriers, these climatic extremes are difficult to colonize, reinforcing the notion that realized niches are profoundly shaped by spatial accessibility rather than physiological limits alone. Furthermore, raw species occurrence records are heavily biased toward accessible or well-studied regions. Moving past raw occurrence records to truly quantify a species’ climatic boundary requires tools like ENMTools [37] and density transformations [38] to standardize the data. These tools correct for spatial sampling effort, ensuring that dense cluster records in populated areas do not distort the inferred climatic niche. Ultimately, a species’ real-world distribution is not equivalent to its physiological endurance. Furthermore, edaphic factors—such as geological substrates, soil texture and depth, water-holding capacity, pH, and nutrient availability—exert a strong influence on plant distribution, particularly for taxa with specialized soil requirements. Some observed macro-patterns (e.g., the concentration of subshrubs in arid climates) may be partly driven by soil attributes that covary with climate, such as shallow soils in arid regions, rather than being dictated by climate alone. Acknowledging that our findings represent climate niche patterns potentially modulated by underlying soil conditions, future integration of high-resolution edaphic data will provide a more comprehensive picture of plant ecological strategies. Nevertheless, the global environmental baseline established in this work represents the actual, realized ecological reality of species under current climate and biotic regimes. By mapping where plants successfully persist today, this baseline provides a crucial, grounded starting point for modeling potential range shifts and predicting biodiversity responses to ongoing global change [3].
Additionally, our analyses rely on native distribution records generalized to TDWG Level 3 botanical units and rasterized at a 110 km × 110 km grid resolution, which represents a standard resolution for global-scale macroecological studies [3]. While this broad grain effectively captures continental and global trends, it may obscure micro-scale variations, localized topoclimatic refugia, and fine-grain habitat heterogeneity. This limitation is particularly relevant when interpreting the broad climatic niches observed for therophytes (annuals); their apparent climatic generalism at coarse grains may partly reflect an artifact of scale, wherein species tolerate local, micro-habitat disturbances rather than wide macroclimatic extremes—a form of environmental or disturbance-driven generalism that macroclimatic data alone cannot capture. Consequently, future research conducted with high-density point occurrences and at finer spatial resolutions will be valuable to complement these macro-scale findings and provide a more granular perspective on plant climate niche dynamics. Furthermore, integrating plant functional traits (such as specific leaf area, wood density, and seed mass) into future frameworks will allow for a direct test of the trait–environment relationships that mechanistically underpin these patterns, shifting our approach from correlative macroclimate descriptions to a deeper understanding of how diverse life forms partition climate space.
In addition to spatial resolution, the geometric structure of climatic niches represents another important methodological aspect. Our metric of climatic niche breadth (Ncells) is based on the discrete count of occupied climatic cells, which directly reflects the realized environmental volume currently filled by a species. However, ecological niches in environmental space are not necessarily contiguous and may contain unoccupied regions or “holes” within an overall envelope due to geographic barriers, competitive exclusion, or non-analog climates [33,39,40]. Consequently, cell-count estimates may assign lower breadth values to species with disjunct climatic distributions compared to continuous geometric-envelope metrics (e.g., convex hulls). While explicitly quantifying topological holes across over 300,000 species was beyond the scope of this baseline study, applying hole-detection methods and topological data analysis represents a promising direction for future work to explore the geometric complexity and fragmentation of plant climate spaces.
Furthermore, while our macroecological framework robustly characterizes global plant climate niches based on phenotypic strategies and life forms, it does not explicitly test phylogenetic relationships. Future research incorporating phylogenetic comparative methods will be valuable to disentangle the extent to which these observed niche breadths and divergences are constrained by shared ancestry versus convergent evolutionary adaptations.
Finally, while our selection of standard macroclimatic variables effectively captures broad environmental gradients, their biological relevance may vary across plant forms. Macroclimates closely reflect the free-air conditions experienced by tall woody perennials, whereas low-stature plants (such as herbs, subshrubs, and chamaephytes) often experience microclimates decoupled from macroclimate near the soil surface. Similarly, annual therophytes may be more sensitive to interannual climatic fluctuations during critical growing seasons than to long-term multi-year means. Acknowledging that our current variable set may more directly characterize the niches of canopy-forming taxa than of understory or short-lived plants, future studies integrating high-resolution microclimatic and inter-annual variability data will help refine these global niche estimations.
5. Conclusions
In conclusion, this study provides a comprehensive, lineage-wide evaluation of the global climatic niches of vascular plants by projecting the global flora onto a two-dimensional, orthogonal climate space. We demonstrate that global plant diversity is highly aggregated within core thermal and hydrological zones, with the vast majority of species functioning as environmental subordinates with moderate tolerances rather than extreme specialists. Crucially, our findings reveal that vegetative growth habits and Raunkiær life forms undergo strict functional sorting along macroclimatic gradients, driven by distinct structural investments and evolutionary trade-offs in bud protection. Together, these empirical patterns offer strong validation for and functional coordination across the global flora, fulfilling our framework’s primary objectives by establishing a critical macroecological baseline.
Author Contributions
Conceptualization, Y.Y.; Methodology, Y.Y.; Validation, Y.Y. and Y.G.; Formal Analysis, Y.G., H.H. and N.D.; Visualization, Y.Y. and H.H.; Writing—Original Draft Preparation, Y.Y.; Writing—Review and Editing, Y.Y.; Funding Acquisition, Y.Y. All authors have read and agreed to the published version of the manuscript.
Funding
This research was funded by the National Natural Science Foundation of China (grant number [31700415]) and the Natural Science Foundation of Anhui Province (grant number [1808085QC60]).
Data Availability Statement
The data and codes to produce figures and tables have been deposited in a Figshare repository (https://doi.org/10.6084/m9.figshare.33085253.v1). The supplementary code used for data preprocessing is available from the corresponding author upon reasonable request.
Conflicts of Interest
The authors declare no conflicts of interest.
References
- Moulatlet, G.M.; Merow, C.; Maitner, B.; Boyle, B.; Feng, X.; Frazier, A.E.; Hinojo-Hinojo, C.; Newman, E.A.; Roehrdanz, P.R.; Song, L.; et al. General laws of biodiversity: Climatic niches predict plant range size and ecological dominance globally. Proc. Natl. Acad. Sci. USA 2025, 122, e2517585122. [Google Scholar] [CrossRef] [Scilit] [PubMed]
- Wiens, J.J. The niche, biogeography and species interactions. Phil. Trans. R. Soc. B 2011, 366, 2336. [Google Scholar] [CrossRef] [Scilit] [PubMed]
- Coelho, M.T.P.; Barreto, E.; Rangel, T.F.; Diniz-Filho, J.A.F.; Zimmermann, N.E.; Graham, C.H. The geography of climate and the global patterns of species diversity. Nature 2023, 622, 537–544. [Google Scholar] [CrossRef] [Scilit] [PubMed]
- Graham, C.H.; Araujo, M.L.; Barreto, E.; Dambros, C.S.; Diniz-Filho, J.A.F.; Zimmermann, N.E.; Rangel, T.F.; Coelho, M.T.P. Biodiversity patterns redefined in environmental space. Ecol. Lett. 2025, 28, e70008. [Google Scholar] [CrossRef] [Scilit] [PubMed]
- Carscadden, K.A.; Emery, N.C.; Arnillas, C.A.; Cadotte, M.W.; Afkhami, M.E.; Gravel, D.; Livingstone, S.W.; Wiens, J.J. Niche breadth: Causes and consequences for ecology, evolution, and conservation. Q. Rev. Biol. 2020, 95, 179–214. [Google Scholar] [CrossRef] [Scilit]
- Liu, H.; Ye, Q.; Wiens, J.J. Climatic-niche evolution follows similar rules in plants and animals. Nat. Ecol. Evol. 2020, 4, 753–763. [Google Scholar] [CrossRef] [Scilit] [PubMed]
- Rodrigues, J.F.M.; Botero, C.A. The global determinants of climate niche breadth in birds. Nat. Commun. 2025, 16, 3685. [Google Scholar] [CrossRef] [Scilit] [PubMed]
- Chen, Y.; Hautier, Y.; Kowalchuk, G.A.; Barry, K.E. ‘Slow-Fast’ plant trait spectra are associated with ecological niches across global climatic gradients. Glob. Ecol. Biogeogr. 2025, 34, e70115. [Google Scholar] [CrossRef] [Scilit]
- Lee, S.K.; Lee, D.H.; Park, Y.B.; Ryu, D.H.; Kim, J.M.; Kim, E.J.; Park, J.H.; Park, J.W.; Cho, K.M.; Seo, J.H.; et al. Climate change alters ecological niches and distribution of two major forest species in Korea, accelerating the pace of forest succession. Forests 2025, 16, 1331. [Google Scholar] [CrossRef] [Scilit]
- Hutchinson, G.E. “Concluding remarks”. Cold Spring Harbor Symposia on Quantitative Biology; Cold Spring Harbor Laboratory Press: Woodbury, NY, USA, 1957; Volume 22, pp. 415–427. [Google Scholar]
- Colwell, R.K.; Rangel, T.F. Hutchinson’s duality: The once and future niche. Proc. Natl. Acad. Sci. USA 2009, 106, 19651–19658. [Google Scholar] [CrossRef] [Scilit] [PubMed]
- Park, B.J.; Heo, T.I.; Cheon, K. Ecological niches of generalist and specialist plants in the subalpine conifer habitats (Abies sp.) of Northeast Asia: From South Korea to the Manchurian region of China. Forests 2024, 15, 2119. [Google Scholar] [CrossRef] [Scilit]
- Tordoni, E.; Carmona, C.P.; Toussaint, A.; Tamme, R.; Pärtel, M. Global patterns and determinants of multiple facets of plant diversity. Glob. Ecol. Biogeogr. 2024, 33, e13823. [Google Scholar] [CrossRef] [Scilit]
- Herms, D.A.; Mattson, W.J. The dilemma of plants: To grow or defend. Q. Rev. Biol. 1992, 67, 283–335. [Google Scholar] [CrossRef] [Scilit]
- Isnard, S.; Prosperi, J.; Wanke, S.; Wagner, S.T.; Samain, M.S.; Trueba, S.; Frenzke, L.; Neinhuis, C.; Rowe, N.P. Growth form evolution in Piperales and its relevance for understanding angiosperm diversification: An integrative approach combining plant architecture, anatomy, and biomechanics. Int. J. Plant Sci. 2012, 173, 610–639. [Google Scholar] [CrossRef] [Scilit] [PubMed]
- Cain, S.A. Life-forms and phytoclimate. Bot. Rev. 1950, 16, 1–32. [Google Scholar] [CrossRef] [Scilit]
- Shu, W.S.; Ye, Z.H.; Zhang, Z.Q.; Lan, C.Y.; Wong, M.H. Natural Colonization of Plants on Five Lead/Zinc Mine Tailings in Southern China. Restor. Ecol. 2005, 13, 49–60. [Google Scholar] [CrossRef] [Scilit]
- Pennington, P.T.; Cronk, Q.C.B.; Richardson, J.A.; Woodward, F.I.; Lomas, M.R.; Kelly, C.K. Global climate and the distribution of plant biomes. Phil. Trans. R. Soc. B 2004, 359, 1465–1476. [Google Scholar] [CrossRef] [Scilit] [PubMed]
- Govaerts, R.; Nic Lughadha, E.; Black, N.; Turner, R.; Paton, A. The World Checklist of Vascular Plants, a continuously updated resource for exploring global plant diversity. Sci. Data 2021, 8, 215. [Google Scholar] [CrossRef] [Scilit] [PubMed]
- Weigelt, P.; König, C.; Kreft, H. GIFT—A Global Inventory of Floras and Traits for macroecology and biogeography. J. Biogeogr. 2020, 47, 16–43. [Google Scholar] [CrossRef] [Scilit]
- Taylor, A.; Weigelt, P.; Denelle, P.; Cai, L.; Kreft, H. The contribution of plant life and growth forms to global gradients of vascular plant diversity. New Phytol. 2023, 240, 1548–1560. [Google Scholar] [CrossRef] [Scilit] [PubMed]
- Brown, M.J.M.; Walker, B.E.; Black, N.; Govaerts, R.H.A.; Ondo, I.; Turner, R.; Nic Lughadha, E. rWCVP: A companion R package for the World Checklist of Vascular Plants. New Phytol. 2023, 240, 1355–1365. [Google Scholar] [CrossRef] [Scilit] [PubMed]
- Denelle, P.; Weigelt, P.; Kreft, H. GIFT—An R package to access the Global Inventory of Floras and Traits. Methods Ecol. Evol. 2023, 14, 2738–2748. [Google Scholar] [CrossRef] [Scilit]
- Brummitt, R.K. World Geographic Scheme for Recording Plant Distributions, 2nd ed.; Hunt Institute for Botanical Documentation, Carnegie Mellon University: Pittsburgh, PA, USA, 2001; Available online: http://rs.tdwg.org/wgsrpd/doc/data/ (accessed on 13 May 2025).
- Karger, D.N.; Conrad, O.; Böhner, J.; Kawohl, P.; Kreft, H.; Soria-Auza, R.W.; Zimmermann, N.E.; Linder, H.P.; Kessler, M. Climatologies at high resolution for the earth’s land surface areas. Sci. Data 2017, 4, 170122. [Google Scholar] [CrossRef] [Scilit] [PubMed]
- Brun, P.; Zimmermann, N.E.; Hari, C.; Pellissier, L.; Karger, D.N. Global climate-related predictors at kilometre resolution for the past and future. Earth Syst. Sci. Data 2022, 14, 5573–5603. [Google Scholar] [CrossRef] [Scilit]
- Hijmans, R.J. terra: Spatial Data Analysis; R Package Version 1.8-60; Comprehensive R Archive Network: Vienna, Austria, 2025. [Google Scholar] [CrossRef] [Scilit]
- R Core Team. R: A Language and Environment for Statistical Computing; R Foundation for Statistical Computing: Vienna, Austria, 2025; Available online: https://www.R-project.org/ (accessed on 10 August 2025).
- Kassambara, A. rstatix: Pipe-Friendly Framework for Basic Statistical Tests; R Package Version 1.0.0; Comprehensive R Archive Network: Vienna, Austria, 2026. [Google Scholar] [CrossRef] [Scilit]
- Graves, S.; Piepho, H.; Selzer, L.; Dorai-Raj, S. multcompView: Visualizations of Paired Comparisons, R package version 0.1-11; Comprehensive R Archive Network: Vienna, Austria, 2026. [Google Scholar] [CrossRef] [Scilit]
- Choat, B.; Jansen, S.; Brodribb, T.J.; Cochard, H.; Delzon, S.; Bhaskar, R.; Bucci, S.J.; Feild, T.S.; Gleason, S.M.; Hacke, U.G.; et al. Global convergence in the vulnerability of forests to drought. Nature 2012, 491, 752–755. [Google Scholar] [CrossRef] [Scilit] [PubMed]
- Grinder, R.M.; Wiens, J.J. Niche width predicts extinction from climate change and vulnerability of tropical species. Glob. Change Biol. 2023, 29, 618–630. [Google Scholar] [CrossRef] [Scilit] [PubMed]
- Caron, F.S.; Lazovskis, J.; Burslem, D.F.R.P.; Morimoto, J. The evolution of Hutchinsonian climatic niche hypervolumes in gymnosperms. Glob. Ecol. Biogeogr. 2026, 35, e70257. [Google Scholar] [CrossRef] [Scilit]
- Biancari, L.; Aguiar, M.R.; Eldridge, D.J.; Oñatibia, G.R.; Le Bagousse-Pinguet, Y.; Saiz, H.; Gross, N.; Austin, A.T.; Ochoa, V.; Gozalo, B.; et al. Drivers of woody dominance across global drylands. Sci. Adv. 2024, 10, eadn6007. [Google Scholar] [CrossRef] [Scilit]
- Warren, D.L.; Glor, R.E.; Turelli, M. Environmental niche equivalency versus conservatism: Quantitative approaches to niche evolution. Evolution 2008, 62, 2868–2883. [Google Scholar] [CrossRef] [Scilit] [PubMed]
- MacArthur, R.H.; Wilson, E.O. The Theory of Island Biogeography; Princeton University Press: Princeton, NJ, USA, 1967. [Google Scholar]
- Warren, D.L.; Glor, R.E.; Turelli, M. ENMTools: A toolbox for comparative studies of environmental niche models. Ecography 2010, 33, 607–611. [Google Scholar] [CrossRef] [Scilit]
- Broennimann, O.; Fitzpatrick, M.C.; Pearman, P.B.; Petitpierre, B.; Pellissier, L.; Yoccoz, N.G.; Thuiller, W.; Fortin, M.-J.; Randin, C.; Zimmermann, N.E.; et al. Measuring ecological niche overlap from occurrence and spatial environmental data. Glob. Ecol. Biogeogr. 2012, 21, 481–497. [Google Scholar] [CrossRef] [Scilit]
- Blonder, B. Do hypervolumes have holes? Am. Nat. 2016, 187, E93–E105. [Google Scholar] [CrossRef] [Scilit] [PubMed]
- Conceição, P.; Morimoto, J. ‘Holey’niche! finding holes in niche hypervolumes using persistence homology. J. Math. Biol. 2022, 84, 58. [Google Scholar] [CrossRef] [Scilit] [PubMed]

Disclaimer/Publisher’s Note: The statements, opinions and data contained in all publications are solely those of the individual author(s) and contributor(s) and not of MDPI and/or the editor(s). MDPI and/or the editor(s) disclaim responsibility for any injury to people or property resulting from any ideas, methods, instructions or products referred to in the content. |
© 2026 by the authors. Licensee MDPI, Basel, Switzerland. This article is an open access article distributed under the terms and conditions of the Creative Commons Attribution (CC BY) license.