


Abstract
Areca palm (Areca catechu L.) is an important perennial tropical cash crop in Hainan Province, and accurate information on its spatial distribution is essential for plantation monitoring and land-resource management. Focusing on Sanya, China, this study integrated 0.59 m RGB imagery acquired from Google Earth between October 2021 and February 2025, field surveys conducted in 2025, Landsat time-series data from 1986 to 2016, ASTER GDEM V3 data, and data from the 2019 Third National Land Survey. Three ResNet U-Net models were compared with Segment Anything Model adapted using Low-Rank Adaptation (SAMLoRA) using a ViT-B backbone, and the mapped distribution was further analyzed in terms of spatial clustering, terrain characteristics, historical spectral changes, and land-use context. SAMLoRA demonstrated favorable segmentation performance and was selected for citywide mapping. After manual cross-checking, the estimated area of areca palm plantations was 5468 ha, with most plantations concentrated in Tianya and Yazhou districts. Spatial analysis revealed significant clustering, and plantations occurred predominantly on gentle slopes. Historical spectral and land-use analyses further indicated that most mapped plantations showed no candidate spectral disturbance under the specified parameters and corresponded primarily to the “other garden land” category. This study provides a city-scale, high-resolution distribution baseline for fragmented tropical cash-crop plantations and offers a practical framework for plantation monitoring, agricultural spatial planning, and future assessments of land-use transitions and environmental suitability.
1. Introduction
The areca palm (Areca catechu L.) is an important perennial tropical cash tree crop in Hainan Province. Its cultivation supports rural livelihoods and influences the agricultural structure and land resource allocation. Long-term remote sensing research has documented the continued expansion of areca palm cultivation in China and the pronounced regional differences [1]. The high-resolution mapping of other tropical cash crop plantations has shown that plantation expansion can be accompanied by forest loss and other ecological impacts [2]. In Sanya, cropland protection, urban expansion, and tourism development coexist, which is why spatially explicit information on areca palm plantations is a prerequisite for assessing forest–agriculture mosaics and improving agricultural land management.
Historically, the monitoring and reporting of tree cash-crop landscapes have relied mainly on agricultural statistics and field inventories, whereas more recent assessments have also incorporated land-use surveys and remote-sensing products. Statistical yearbooks provide administrative-unit totals, field surveys offer site-level observations, and land-use inventories describe broad land categories. However, these sources do not consistently delineate the location, boundary, size, and spatial configuration of individual plantation patches. This limitation is particularly important in smallholder landscapes, where tree crops are distributed as fragmented and irregular patches and may be intercropped with other perennial species. Landscape fragmentation can be characterized using patch number and size, edge density, nearest-neighbor relationships, and spatial autocorrelation. In the present study, fragmentation was addressed primarily through high-resolution boundary delineation and grid-based global and local spatial association rather than through a complete suite of landscape metrics. A boundary-resolved baseline complements aggregate statistics and provides the spatial foundation for regional survey planning, monitoring prioritization, and subsequent landscape analysis.
Remote sensing provides an important bridge between aggregate agricultural statistics and spatially explicit plantation monitoring. Chaves et al. [3] summarized recent applications of Landsat 8 and Sentinel-2 imagery in land-use and land-cover mapping, while Mahlayeye et al. [4] reviewed remote-sensing methods that use spectral and temporal information to characterize crop patterns. These data are suitable for broad-scale monitoring and historical analysis, but mixed pixels at medium spatial resolution can obscure small plantations, narrow gaps, and irregular boundaries. Multi-source imagery and deep-learning methods have improved the identification of smallholder production systems and woody crops [5,6], while higher-resolution imagery provides additional information on crown texture, planting-row morphology, and local spatial context. For areca palm management in Sanya, the question extends beyond how much land is planted to where the plantations occur, how their boundaries are configured, and where spatial concentrations have formed.
Previous studies of palm crops have demonstrated that high-resolution imagery and deep-learning methods can successfully identify individual crowns, regular planting patterns, and plantation boundaries [7,8]. These approaches perform particularly well in relatively homogeneous plantations with distinguishable crowns, regular spacing, limited canopy overlap, and consistent image quality. Their performance may decline in heterogeneous smallholder landscapes because of intercropping, overlapping crowns, topographic shadows, variable illumination, irregular management, and spectral-textural similarities among tropical tree crops. In Sanya, areca palm is frequently adjacent to or intercropped with coconut, rubber, mango, and pepper. Such landscape heterogeneity makes task-specific adaptation and evaluation necessary before methods developed for regular and homogeneous palm plantations can be applied locally.
At the landscape scale, semantic-segmentation models transform high-resolution image mosaics into spatially continuous maps that support patch delineation and spatial-pattern analysis. U-Net combines encoder-derived semantic information with decoder-level spatial detail and has been widely applied to high-resolution remote-sensing segmentation [7,9]. ResNet backbones facilitate deeper feature extraction and can improve recognition where crown texture and plantation structure are relatively stable [10]. However, ResNet U-Net models may produce omissions, fragmented boundaries, or false positives in small patches, intercropped stands, shaded terrain, and locations where neighboring tree crops exhibit similar crown colors and planting patterns. These limitations indicate that pixel-level accuracy alone may not fully represent mapping utility; patch completeness and boundary continuity are also important for producing a spatially explicit plantation baseline.
The Segment Anything Model (SAM) provides generic shape and boundary representations learned from large-scale image data [11]. Low-Rank Adaptation (LoRA) enables task-specific adaptation by updating a limited set of parameters while preserving most pretrained weights [12]. For fragmented areca palm landscapes, this combination may help retain irregular patch boundaries and narrow spatial gaps while reducing the computational and sample requirements of full-parameter fine-tuning. This study focused on overall mapping performance under the selected model configurations and evaluated SAMLoRA as a parameter-efficient segmentation approach in comparison with the ResNet U-Net models. The relative contributions of pretrained representations and parameter-efficient adaptation warrant further evaluation through more systematic comparative experiments.
Existing remote-sensing studies of areca palm have examined long-term regional expansion using Landsat time series [1], high-resolution semantic segmentation [9], PlanetScope-based feature optimization [13], and disease recognition [14]. These studies demonstrate the feasibility of remote-sensing-based areca palm monitoring. Terrain variables, particularly elevation and slope, provide important contextual information for understanding plantation distribution and site conditions, while LandTrendr-based segmentation of Landsat time series can provide retrospective evidence of candidate spectral changes within currently mapped plantations [15]. The detected spectral breakpoints represent changes under the specified data and parameter settings rather than verified years of plantation establishment or management. Previous areca palm remote sensing studies mostly adopted medium-resolution imagery and traditional machine learning or shallow segmentation methods, which are limited to macroscopic pattern analysis and fail to extract fragmented small patches with precise boundaries. Moreover, few studies combine fine-scale mapping, spatial clustering, terrain features, and long-term spectral trajectory analysis for areca palm plantations. This study applies high-resolution 0.59 m RGB data and parameter-efficient SAMLoRA fine-tuning to improve patch extraction accuracy, and further integrates multi-dimensional spatial and historical spectral analysis, making up for the single-dimension defects of existing studies and providing refined local baseline data. However, fine-scale citywide mapping that integrates spatial clustering, terrain characteristics, historical spectral evidence, and land-use context remains limited. Building on these studies, the present research aimed to (1) compare the segmentation performance of ResNet U-Net models and SAMLoRA and produce a citywide distribution map; (2) quantify district-level area, grid-based spatial clustering, and terrain-frequency characteristics; (3) examine candidate historical spectral changes within currently mapped large patches; and (4) quantify spatial correspondence between the current map and the 2019 land-use classes.
2. Materials and Methods
2.1. Study Area
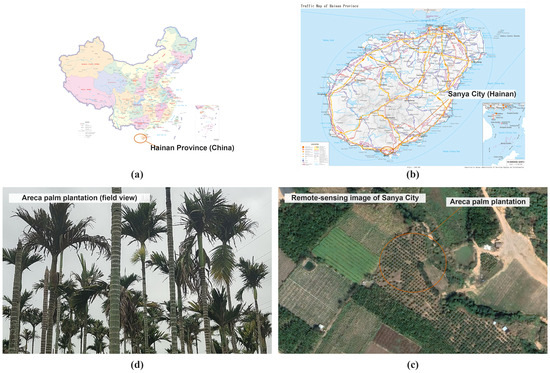
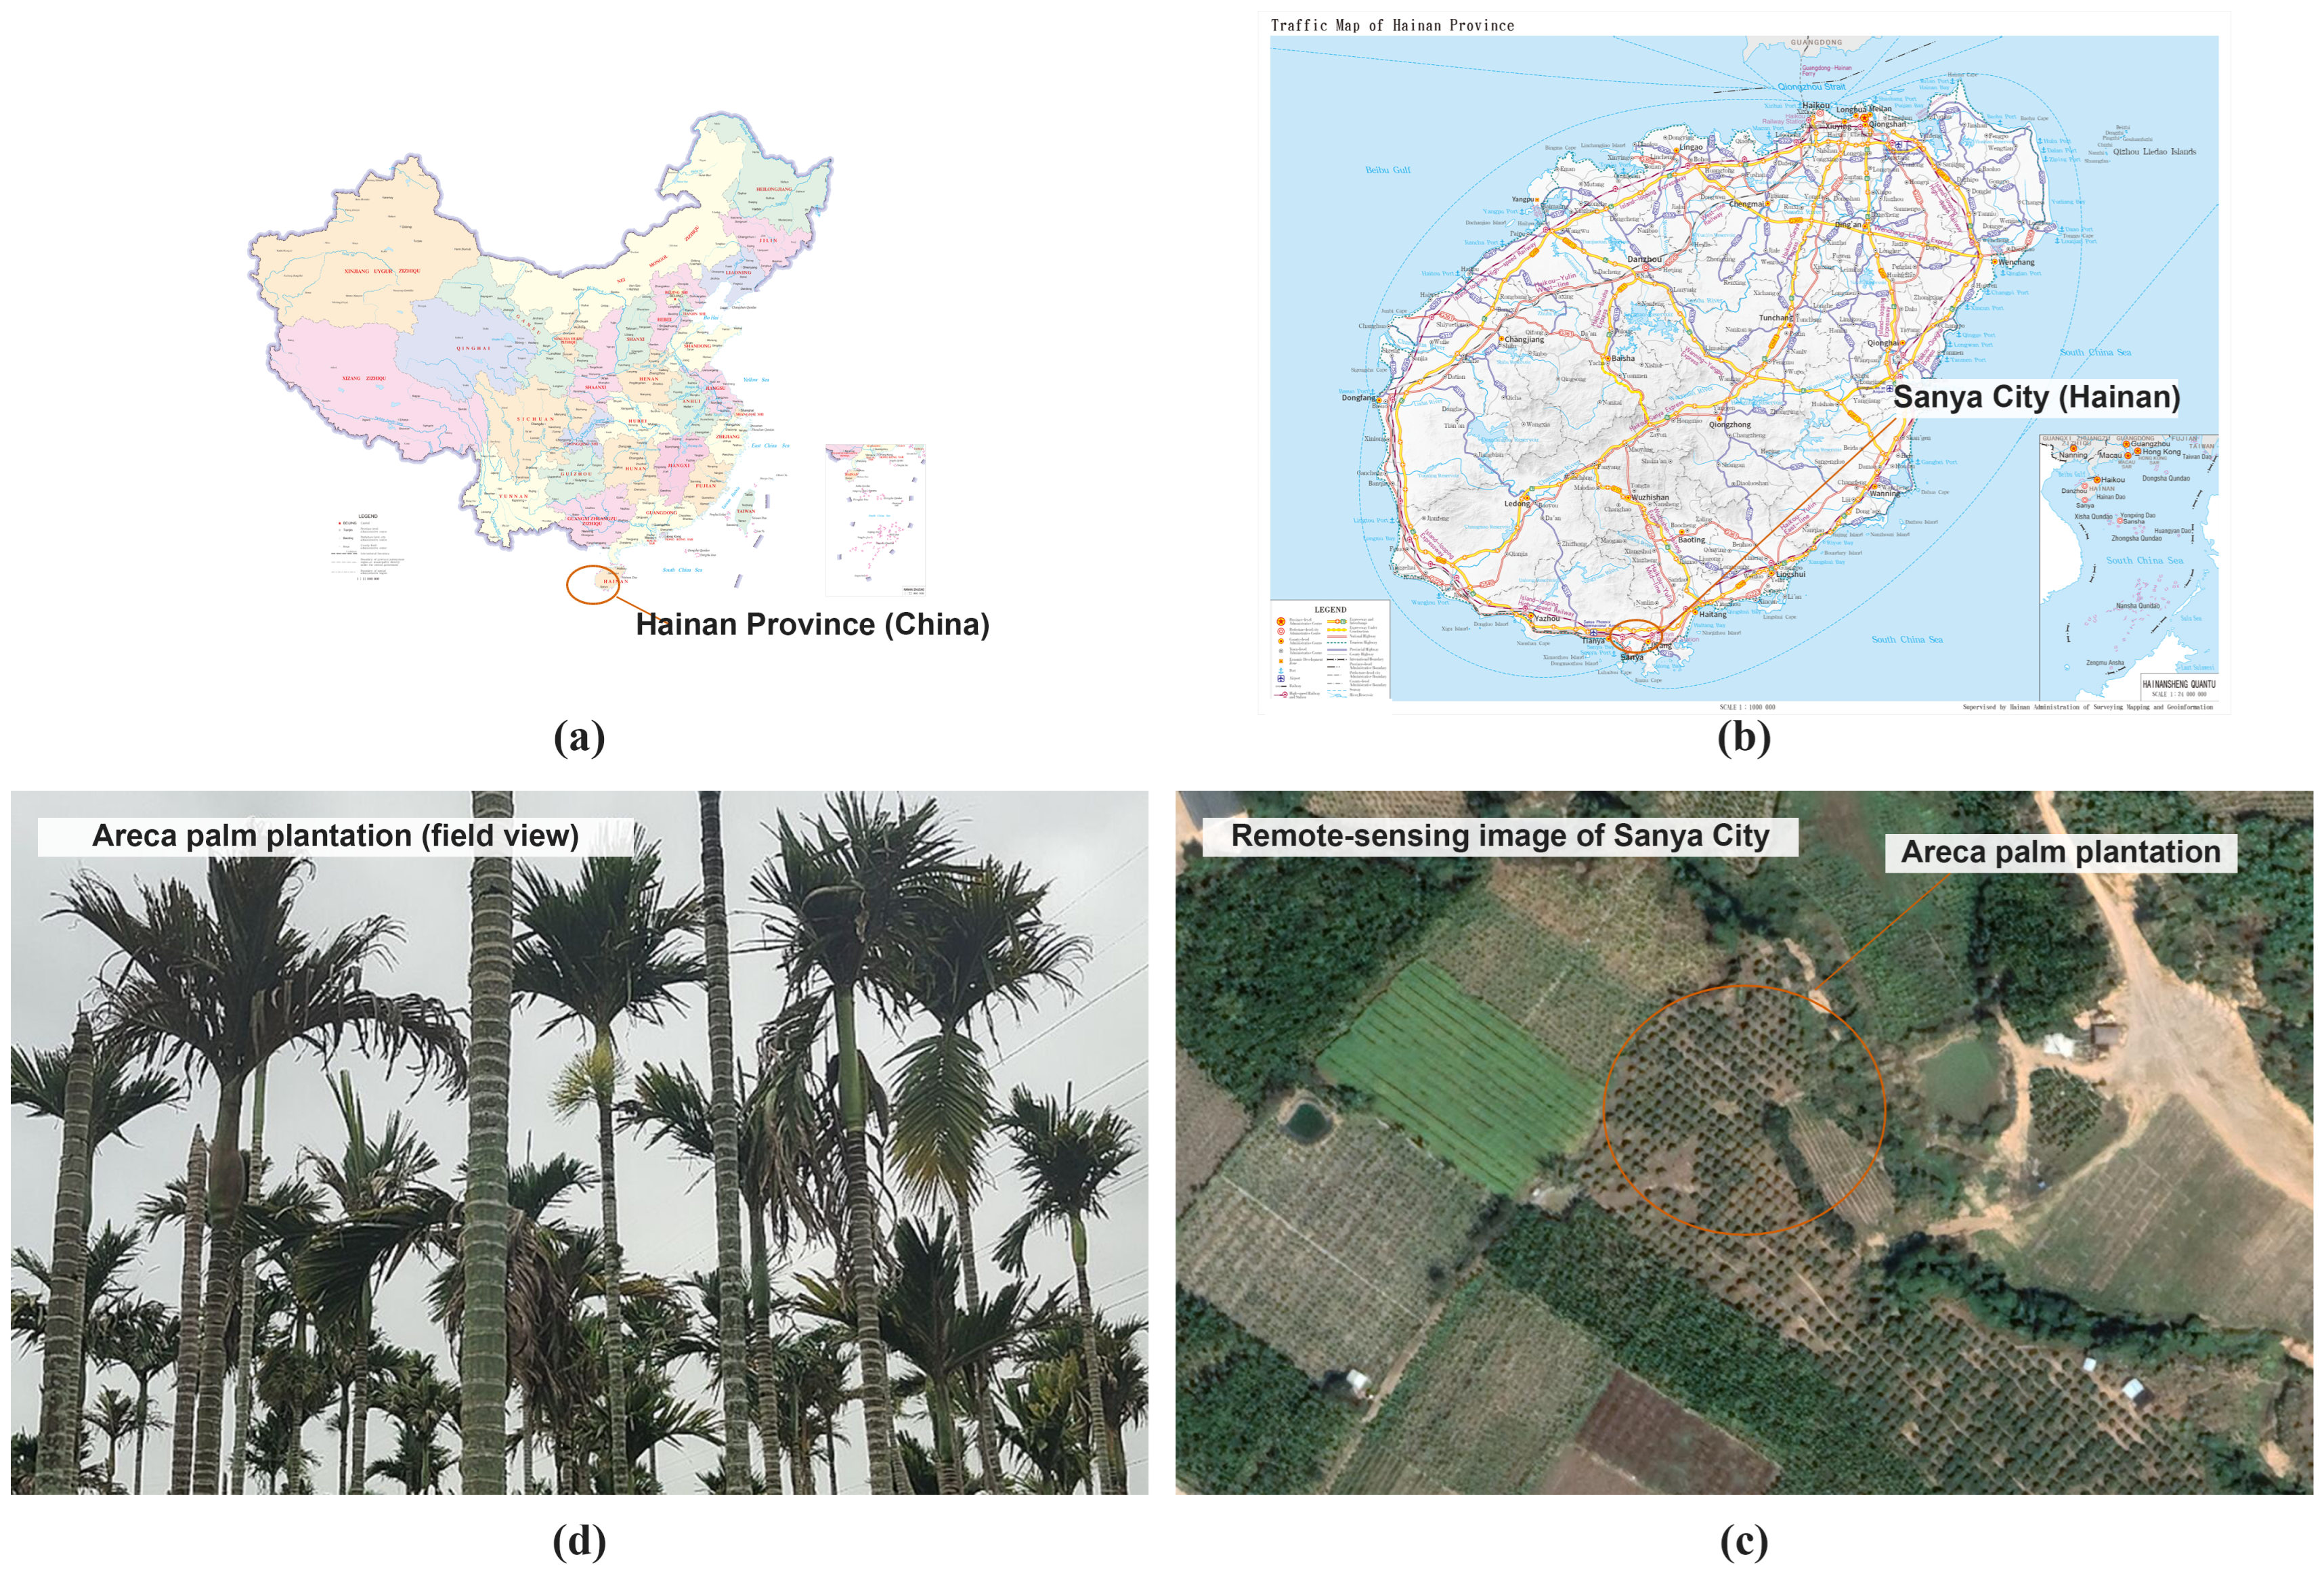
Sanya is located in southern Hainan Island and has a tropical maritime monsoon climate, with a mean annual temperature of approximately 25.7 °C. The terrain comprises coastal plains, hills, and mountains. Areca palms are sensitive to low temperatures, and their growth is influenced by water availability and drainage. Sanya is both a major areca palm production area in Hainan and an area where urban construction and tourism development constrain agricultural land. The location of the study area and representative landscapes are shown in Figure 1.
Figure 1.
Overview of the study area: (a) standard map of China and the location of Hainan Province; (b) transportation map of Hainan Province and the location of Sanya; (c) a representative areca palm plantation in Google Earth imagery; and (d) a field view of an areca palm plantation in Sanya. The standard map base was not redrawn, only an indicator of the study-area location was superimposed.
2.2. Data Sources
This study adopted RGB visible bands (Blue: 450–495 nm, Green: 495–570 nm, Red: 620–750 nm) from high-resolution Google Earth imagery. These bands effectively capture canopy texture, greenness, and morphological differences of scattered areca palm plantations. High-resolution RGB data is more suitable for fine-grained fragmentated crop mapping than medium-resolution multispectral data under current data availability. The acquisition dates ranged from October 2021 to February 2025. After geometric correction and projection transformation, the imagery was used for sample annotation and citywide inferences. Images with a low cloud cover, relatively consistent color, and clear texture were prioritized. Acquisition dates, image counts, and spatial coverage are provided in Figure S1 and Table S1 [15,16,17,18]. The imagery was obtained from the Google Earth Historical Imagery service and downloaded using the third-party map-downloading software Shuijingzhu Universal Map Downloader v4.1.61.16332 (Chengdu Shuijing Software Co., Ltd., Chengdu, China). Because the acquisition dates differed among locations, the final map represented a spatially explicit estimate under the available imagery for this period, rather than a single-year inventory. While we prioritized images with minimal cloud cover and consistent visual appearance, the lack of strict temporal uniformity may introduce seasonal variations in canopy reflectance and texture. However, given that areca palm is a perennial evergreen species with relatively stable canopy structure, the impact of phenological changes on its morphological features (e.g., crown shape and planting patterns) is considered secondary compared to land-cover transitions. Nevertheless, future work should employ commercial high-resolution imagery with controlled acquisition dates to minimize seasonal effects and enable consistent time-series mapping.
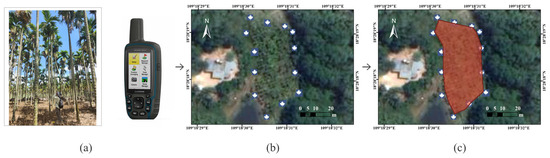
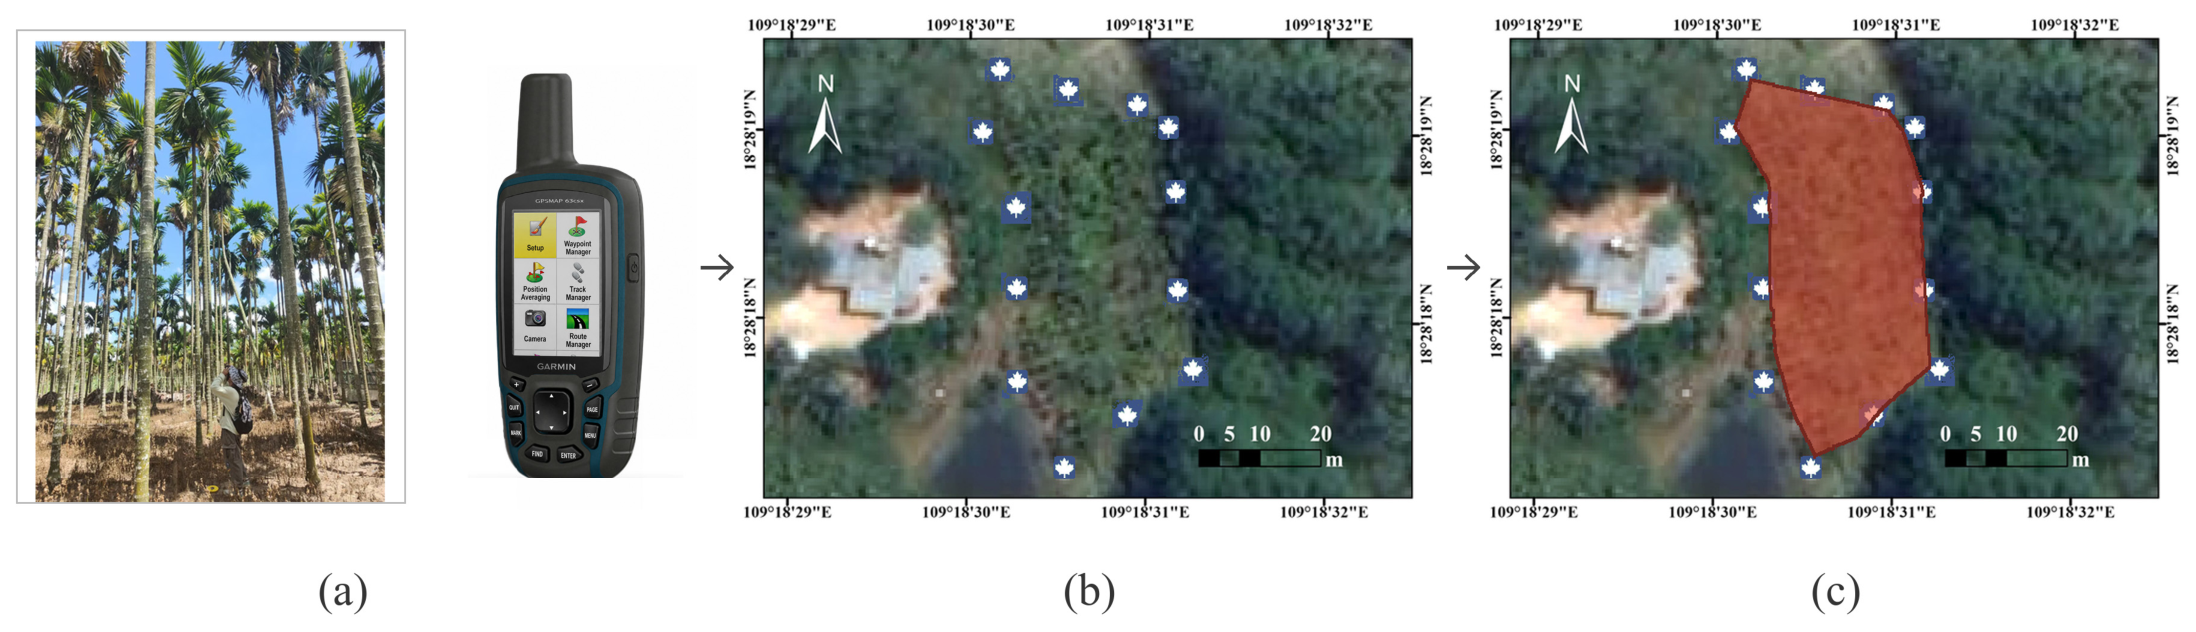
Field surveys were conducted from March to May 2025 in 21 survey areas, rather than in 21 independent plots. The survey team used a Garmin GPSMAP 63csx handheld GPS receiver (Garmin International, Inc., Olathe, KS, USA). to record points around areca palm plantations. These points were imported into ArcMap 10.8 (Esri, Redlands, CA, USA) and cross-checked against Google Earth images acquired near the survey date. Plantation boundaries were then delineated by visual interpretation and cross-checked by multiple interpreters to reduce labeling errors caused by temporal differences.
Landsat 5 and Landsat 8 surface-reflectance data for 1986–2016 were obtained through Google Earth Engine (GEE) and processed using Landsat Ecosystem Disturbance Adaptive Processing System (LEDAPS) [19] and Land Surface Reflectance Code (LaSRC) [20], respectively. Clouds, shadows, and snow were masked before annual compositing. ASTER GDEM V3 data at 30 m resolution were used for elevation and slope analyses [21,22]. Data from the Third National Land Survey, referenced to 2019, were used to quantify correspondence with land-use classes, while ownership information was not considered. The Hainan Statistical Yearbooks for 2021–2024 provided the annual city-level cultivated area of areca palm in Sanya, reported in hectares, without spatial information on plantation locations or boundaries. The yearbook values were compiled as annual municipal statistics for administrative reporting, whereas the mapped estimate was calculated by summing plantation patches delineated from high-resolution imagery acquired at different dates between 2021 and 2025. The two sources differ in reference period, statistical unit, boundary definition, and area-calculation procedure. The yearbook data were used only to compare the magnitude of the mapped area and were not treated as reference data for map-accuracy validation.
2.3. High-Resolution Mapping and Model Evaluation
The samples were jointly constructed from field survey points and Google Earth images. After point verification, visual interpretation, and cross-checking by multiple interpreters, the dataset comprised 2304 RGB images of 256 × 256 pixels and 6502 annotated areca palm plantation patches. The Areca palm plantation was the target class and all remaining pixels were treated as the background. The survey, GPS verification, and boundary delineation workflows are shown in Figure 2. After shuffling with random seed 42, 60% of the samples were assigned to the training set, while the remaining 40% were divided equally between the internal validation and held-out evaluation sets (20% each). K-fold cross-validation was not used. The training set was used for parameter learning and the internal validation set to monitor the convergence and select the best checkpoint for each model. The held-out evaluation set did not contribute to parameter updates; however, its metrics were used for model comparison. Therefore, this design represents a random-sample evaluation rather than a spatial block or fully independent final product validation.
Figure 2.
Field survey and sample-construction workflow for areca palm plantations: (a) field survey and recording of GPS points around plantation boundaries; (b) verification of GPS points against Google Earth imagery; and (c) visual interpretation and vector-boundary delineation using the points and imagery.
The compared models comprised U-Net with ResNet-18, ResNet-34, and ResNet-50 backbones [10] and SAMLoRA, which used the SAM ViT-B image encoder with LoRA fine-tuning [11,12]. All models received 256 × 256-pixel inputs. Owing to the 16 GB GPU-memory limit, the batch size was 16 for ResNet-18/34 U-Nets and 8 for ResNet-50 U-Net and SAMLoRA. The training was conducted in Windows 11 with Python 3.10 and PyTorch 2.9.1 on an Intel i7-13700K CPU and an NVIDIA GeForce RTX 4080 16 GB GPU. All models were trained for 100 epochs without early stopping. At the end of each epoch, the performance was evaluated on the internal validation set, a checkpoint was saved, and the parameters from the epoch with the lowest validation loss were retained. A cross-entropy loss and the Adam optimizer were used. For SAMLoRA, LoRA rank was 4 and a uniform learning rate of 5.2481 × 10⁻⁵ was applied. The ResNet-18, ResNet-34, and ResNet-50 U-Nets used layer-wise differential learning-rate ranges of 3.0200 × 10⁻⁶ to 3.0200 × 10⁻⁵, 1.3183 × 10⁻⁵ to 1.3183 × 10⁻⁴, and 5.2481 × 10⁻⁶ to 5.2481 × 10⁻⁵, respectively. The shallower backbone layers used lower rates, whereas the deeper feature modules and decoder used higher rates. The model architecture and loss curves are shown in Figures S2 and S3, respectively.
The model comparison evaluated the overall segmentation performance of the selected configurations. SAMLoRA was treated as an integrated parameter-efficient segmentation framework and compared with the three ResNet U-Net models. The effects of SAM pretraining and LoRA-based adaptation were not quantified separately. The reported results characterize the performance of each complete model configuration under the specified training settings rather than the independent effect of either component. In this study, accuracy and the Dice coefficient were calculated using the internal validation set, whereas precision, recall, and F1-score for the areca palm class were calculated using the held-out evaluation set. Because these metrics were derived from different data subsets, their sources are identified separately in Table 1, and Dice and F1-score were not treated as direct comparisons on the same dataset. The model selection considered the internal-validation Dice coefficient, held-out recall and F1-score, and visual segmentation completeness in representative areas.
Table 1.
Internal-validation and held-out evaluation metrics for the compared models.
After the selected model was applied to citywide inference, the research team manually cross-checked and corrected evident false positives and omissions caused by cloud shadows, illumination differences, mixed vegetation, and blurred boundaries, and then calculated the district-level areas. No new independent validation samples were established for the final manually corrected map. Therefore, its area estimates and subsequent analyses were treated as exploratory spatial results under multi-date imagery rather than as a single-year inventory or an independently validated mapping product.
2.4. Spatial Patterns and Historical Context
In ArcMap10.8, the final map was projected to WGS 84/UTM Zone 49N. A 1 × 1 km grid was constructed, and the area of the areca palm plantation was calculated within each cell. The global Moran’s I, local Moran’s I, and Getis–Ord General G were also calculated. The local Moran’s I was used to identify high–high and low–low clusters and high–low and low–high spatial outliers [23,24]. The k-nearest neighbor spatial weights (k = 8) were selected after testing several neighborhood sizes (k = 4, 6, 8, 10). The results showed that k = 8 provided a stable estimate of global and local spatial autocorrelation while capturing the typical clustering patterns of fragmented plantations in the study area. A distance-based Euclidean metric and row standardization were applied to ensure comparability of weights across grid cells. Statistical significance was determined using Z- and p-values reported by ArcMap10.8.
Terrain analysis was performed using the ASTER GDEM V3 and its derived slope layer. To match the spatial resolution of ASTER GDEM V3, the 0.59 m areca palm plantation raster was resampled to 30 m and converted to points in ArcGIS Pro 3.1 (Esri, Redlands, CA, USA). Elevation and slope values were then assigned to these points using the Extract Values to Points tool. Consequently, the reported frequencies represent the numbers of resampled 30 m raster cells rather than field-sampling points or individual trees. The mean, median, and modal elevations were calculated separately for each LISA class.
Given that Landsat time-series data have a spatial resolution of 30 m, small parcels (<2 hectares) are susceptible to the mixed-pixel effect, which can introduce significant uncertainty in the detection of spectral breaks. To minimize these scale-related errors by focusing on parcels larger than 2 hectares, a historical spectral analysis was conducted using LandTrendr and the annual Landsat NBR series for 1986–2016 [25]. The annual window extended from 1 January to 30 December, with clouds, shadows, and snow masking. The maximum number of segments was six, spike threshold was 0.9, vertex-count overshoot was three, recovery threshold was 0.25, model-fit p-value threshold was 0.05, best-model proportion was 0.75, and minimum number of observations was six. The change type was set to loss and the minimum mapping unit was 12 Landsat pixels (approximately 1.08 ha). The retrospective window ended in 2016, leaving an interval of approximately five years before the earliest high-resolution imagery in 2021. This setup was used only to explore the historical spectral trajectories of current patches. It could not identify changes after 2016 or directly attribute candidate events to the establishment, expansion, or management of the areca palm. The Parameters and Google Earth Engine code are provided in Table S2 and Code S1.
For land-use context, the final map was overlaid with the Third National Land Survey data referenced to 2019, and corresponding areas were calculated only for classes including ‘other garden land,’ ‘orchard,’ ‘dryland,’ and ‘other forest land.’ Because the datasets differed in date, boundary delineation, and area calculation conventions, percentages were calculated using the total overlaid area. The overlay was not used to infer the pre-plantation land cover or direction of land conversion.
3. Results
3.1. Model Evaluation and Mapping Results
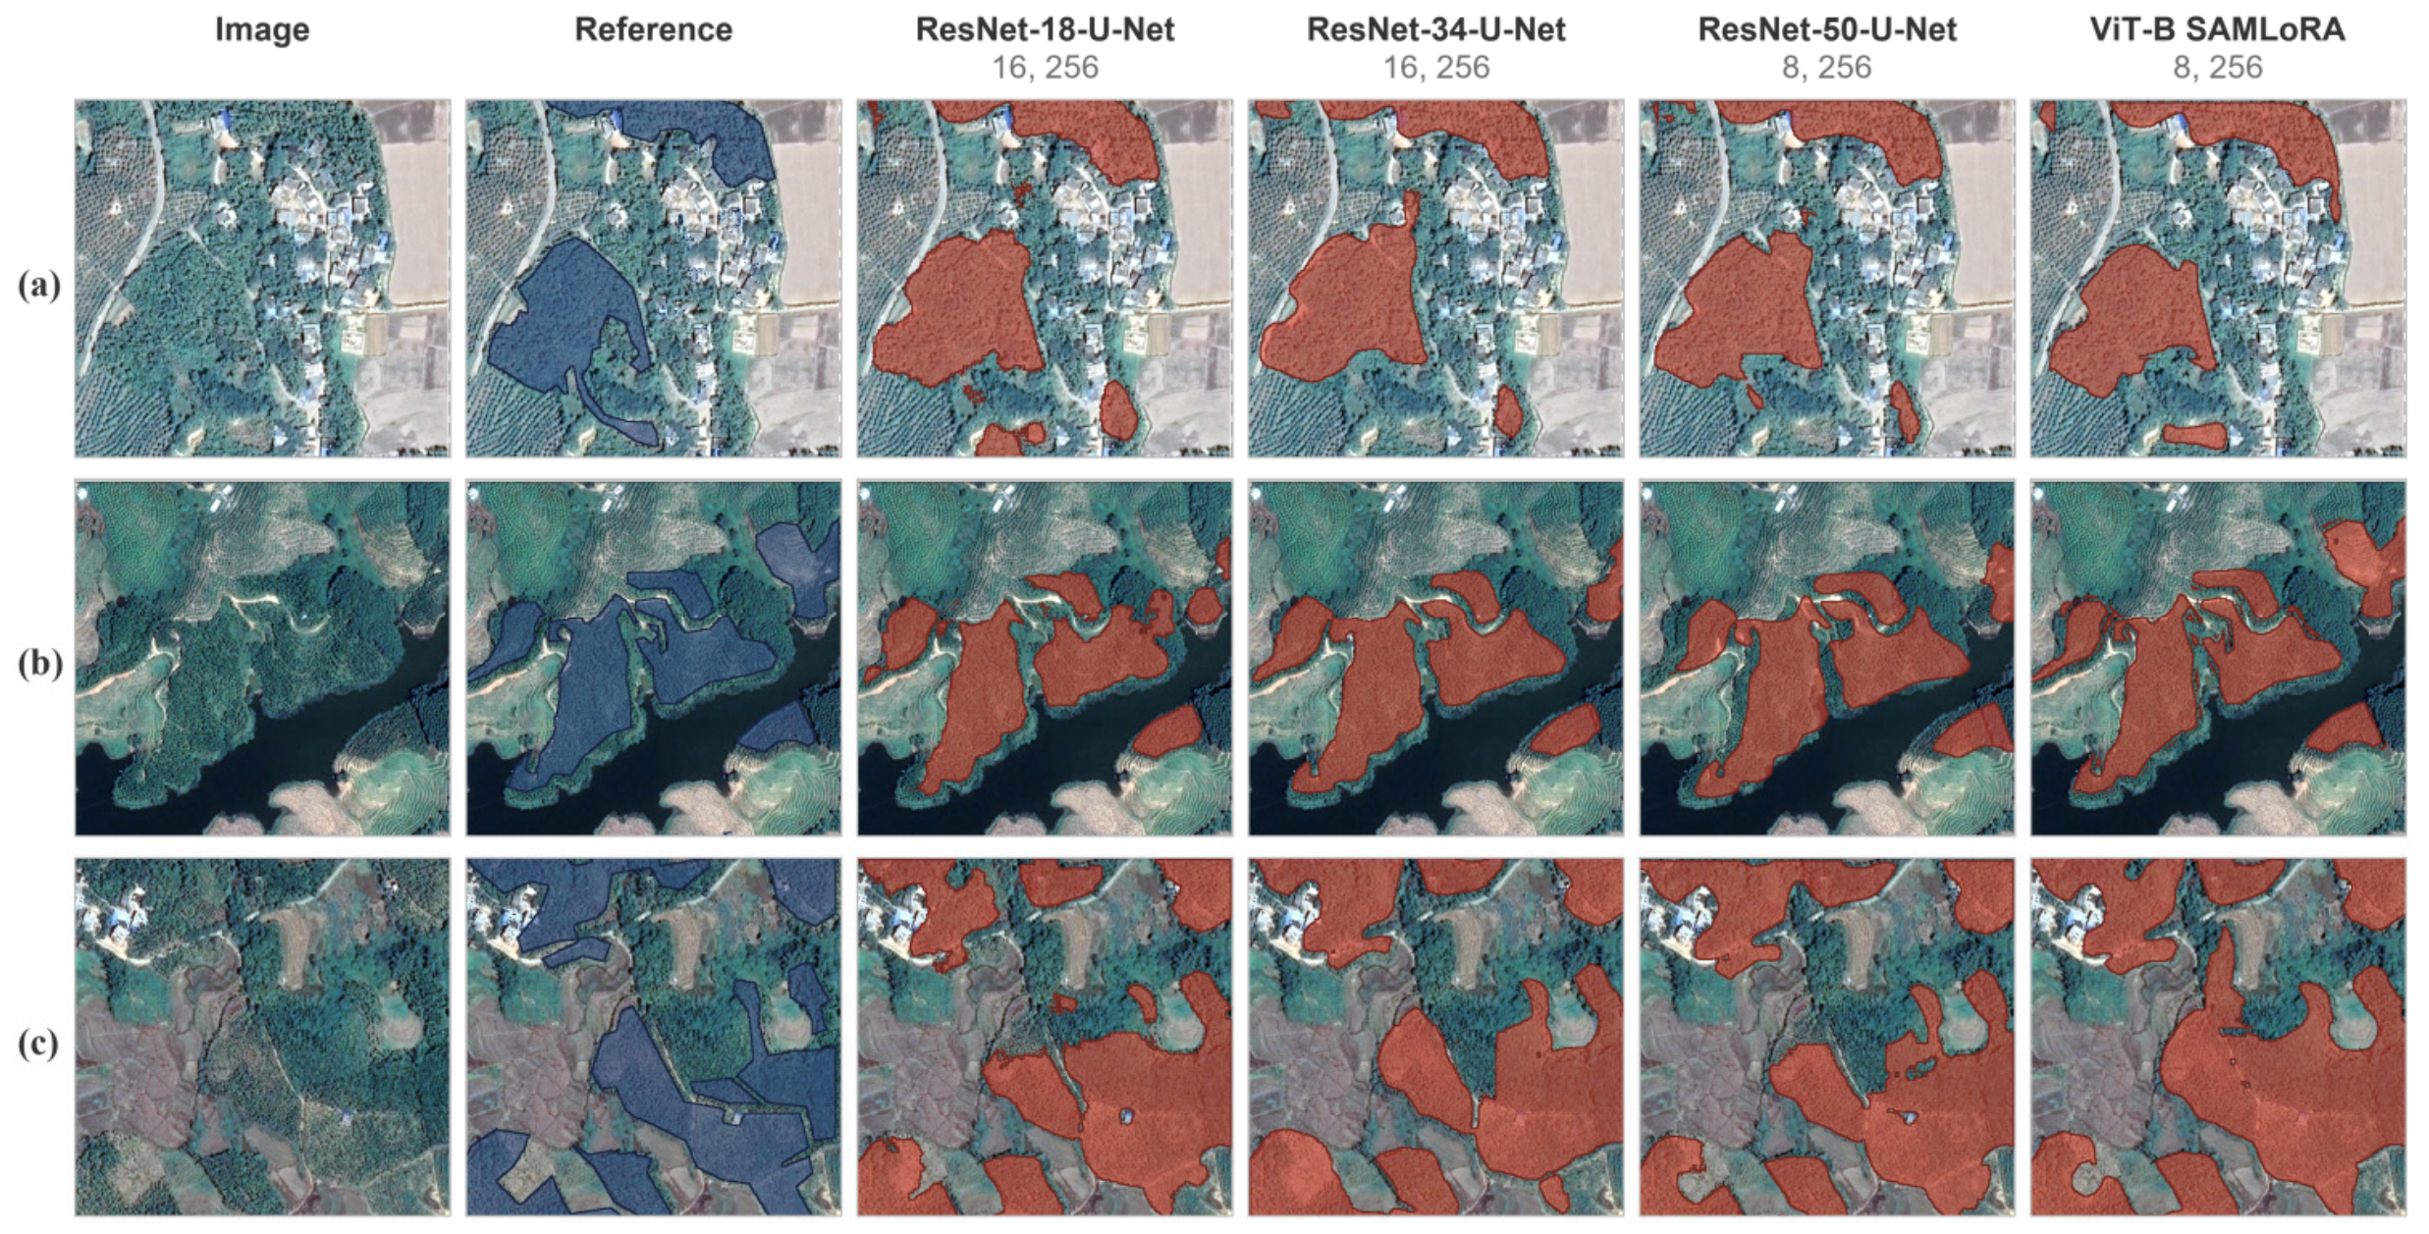
The original evaluation results for the four models are listed in Table 1. ResNet-50 U-Net achieved the highest precision for areca palm in the held-out evaluation set (0.831). SAMLoRA (ViT-B) achieved precision, recall, and F1-score values of 0.817, 0.809, and 0.813, respectively, and internal validation accuracy and Dice values of 0.93 and 0.70, respectively. Considering the internal-validation Dice, held-out recall, F1-score, and visual completeness in the representative areas, SAMLoRA was selected for citywide inference. The local results of the different models are shown in Figure 3.
Figure 3.
Segmentation results for areca palm plantations under three representative landscape conditions: (a) fragmented plantation patches adjacent to built-up land and mixed vegetation; (b) elongated plantation patches with irregular boundaries in a heterogeneous landscape; and (c) multiple adjoining plantation patches with complex boundaries and mixed land-cover backgrounds. For each subfigure, the first column shows the original Google Earth imagery, the second column shows the reference annotations (blue), and the remaining columns show the predictions (red) generated by ResNet-18 U-Net, ResNet-34 U-Net, ResNet-50 U-Net, and SAMLoRA (ViT-B), respectively. The numbers below each model name indicate the batch size and input image dimensions. ResNet, residual network; SAMLoRA, Segment Anything Model adapted using Low-Rank Adaptation; ViT-B, Vision Transformer Base.
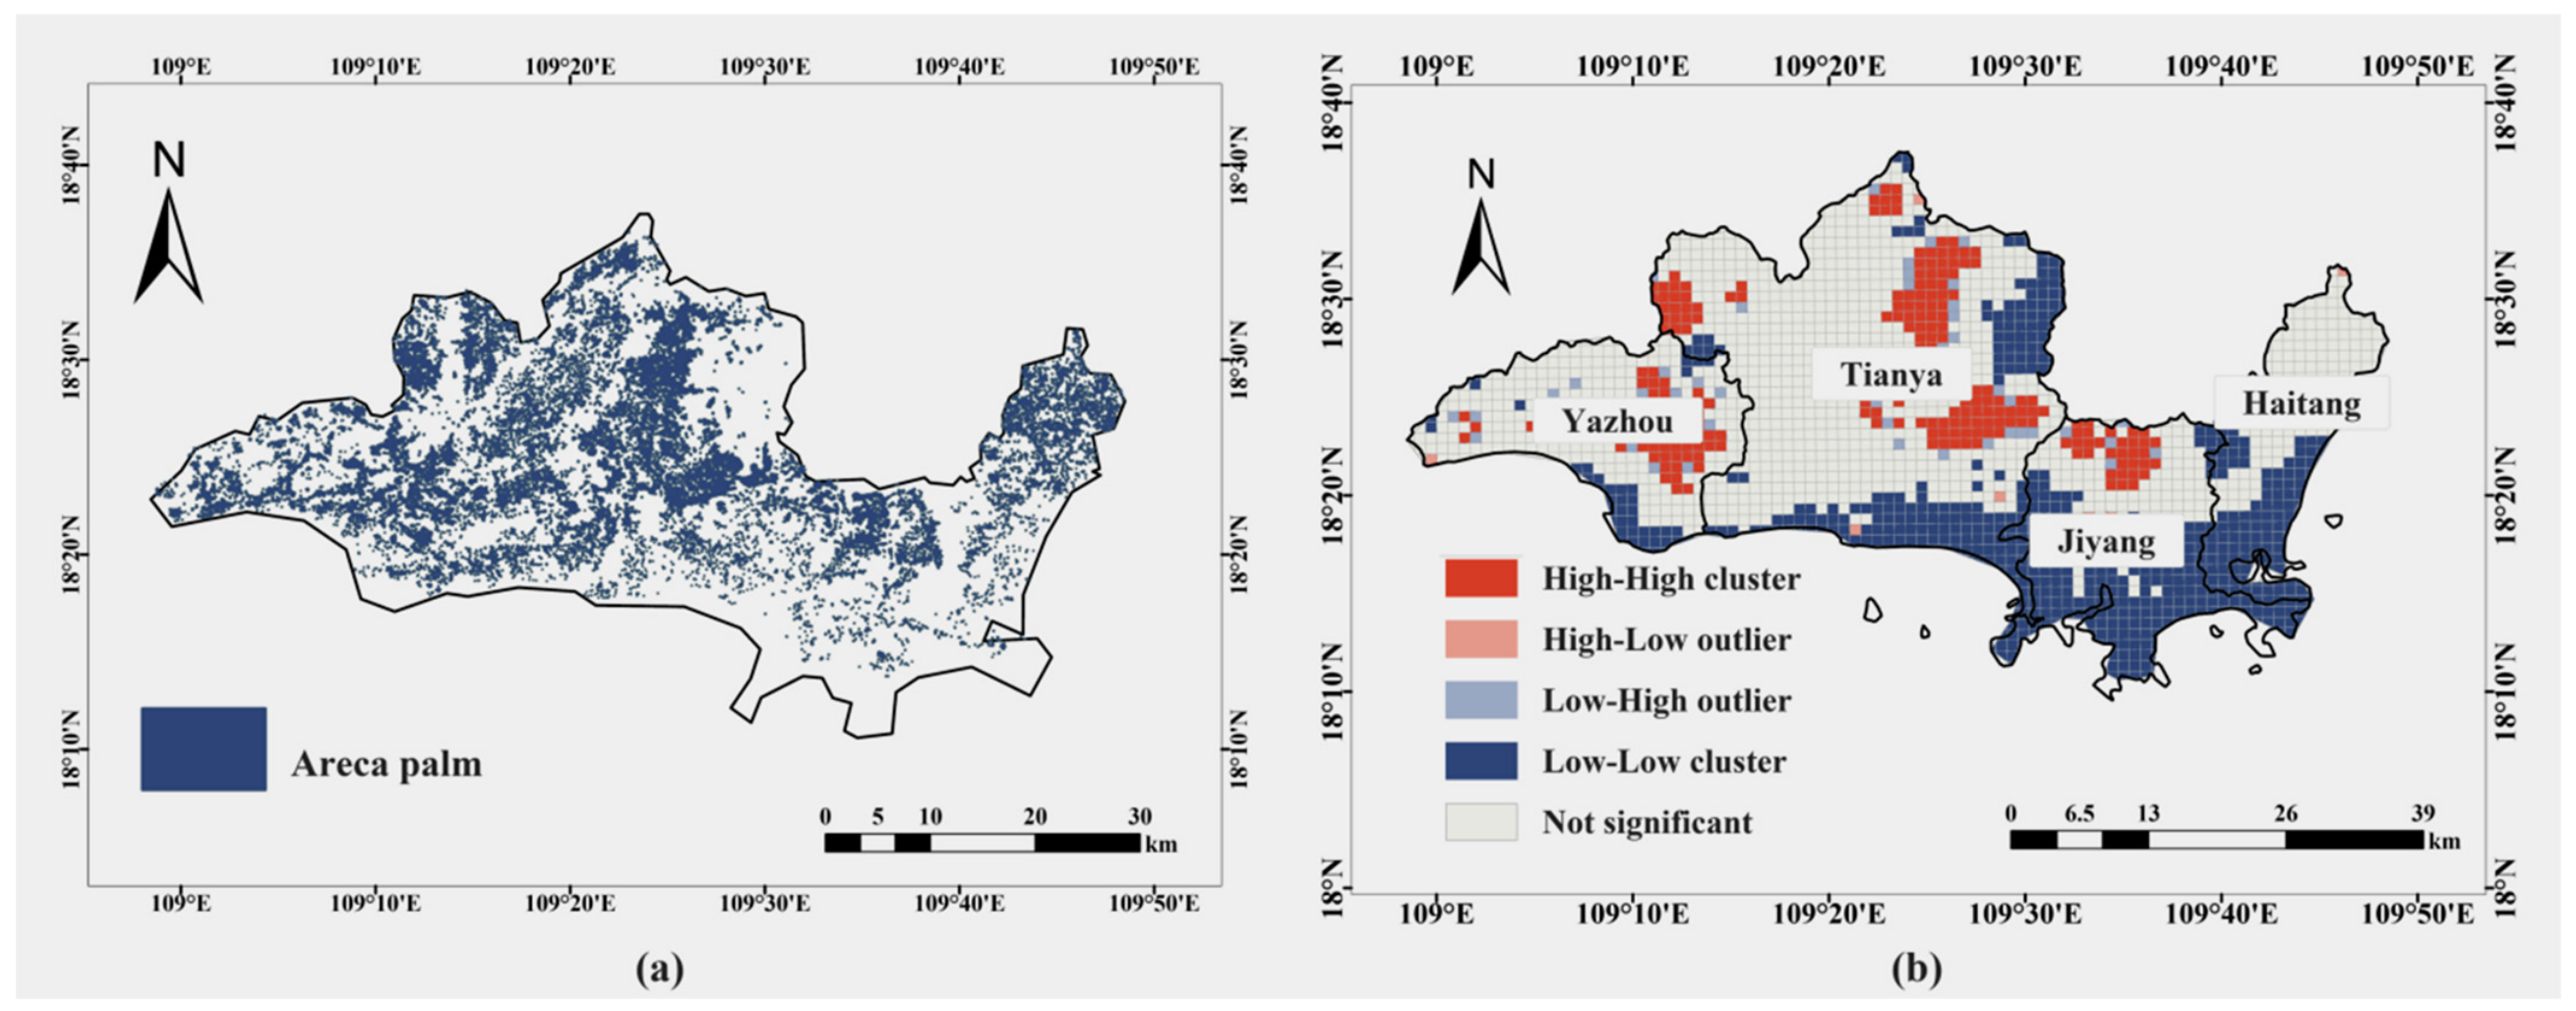
After manual cross-checking of the SAMLoRA inference, the spatially explicit estimate of the areca palm plantation area in Sanya was 5468 ha (Figure 4a). The Tianya, Yazhou, Jiyang, and Haitang districts had 3190, 1312, 581 ha, and 384 ha, respectively (Table 2). Tianya and Yazhou together accounted for 4502 ha, or 82.3% of the citywide estimates. The statistical yearbooks reported 5472 ha in 2021, 6423 ha in 2022, 6415 ha in 2023, and 6395 ha in 2024. Because the imagery spans 2021–2025 and the statistical definitions differ, this comparison is only an order-of-magnitude reference and does not validate the map accuracy.
Figure 4.
Spatial distribution and local spatial association of areca palm plantations in Sanya: (a) spatial distribution after manual cross-checking and (b) LISA classes based on a 1 × 1 km grid and local Moran’s I.
Table 2.
Spatially explicit estimates of areca palm plantation area by district in Sanya.
3.2. Spatial Clustering and Terrain Characteristics
The spatial statistics for the 1 × 1 km grid are presented in Table 3. Global Moran’s I was 0.476871, with an expected value of −0.000479, Z = 44.263173, and p = 0.000001. The Getis–Ord General G was 0.001955, with an expected value of 0.000479, Z = 44.488623, and p = 0.000001. Both statistics indicated that the grid-level plantation area departed significantly from a spatially random pattern.
Table 3.
Spatial autocorrelation statistics for areca palm plantations.
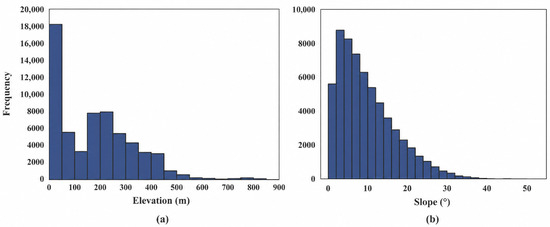
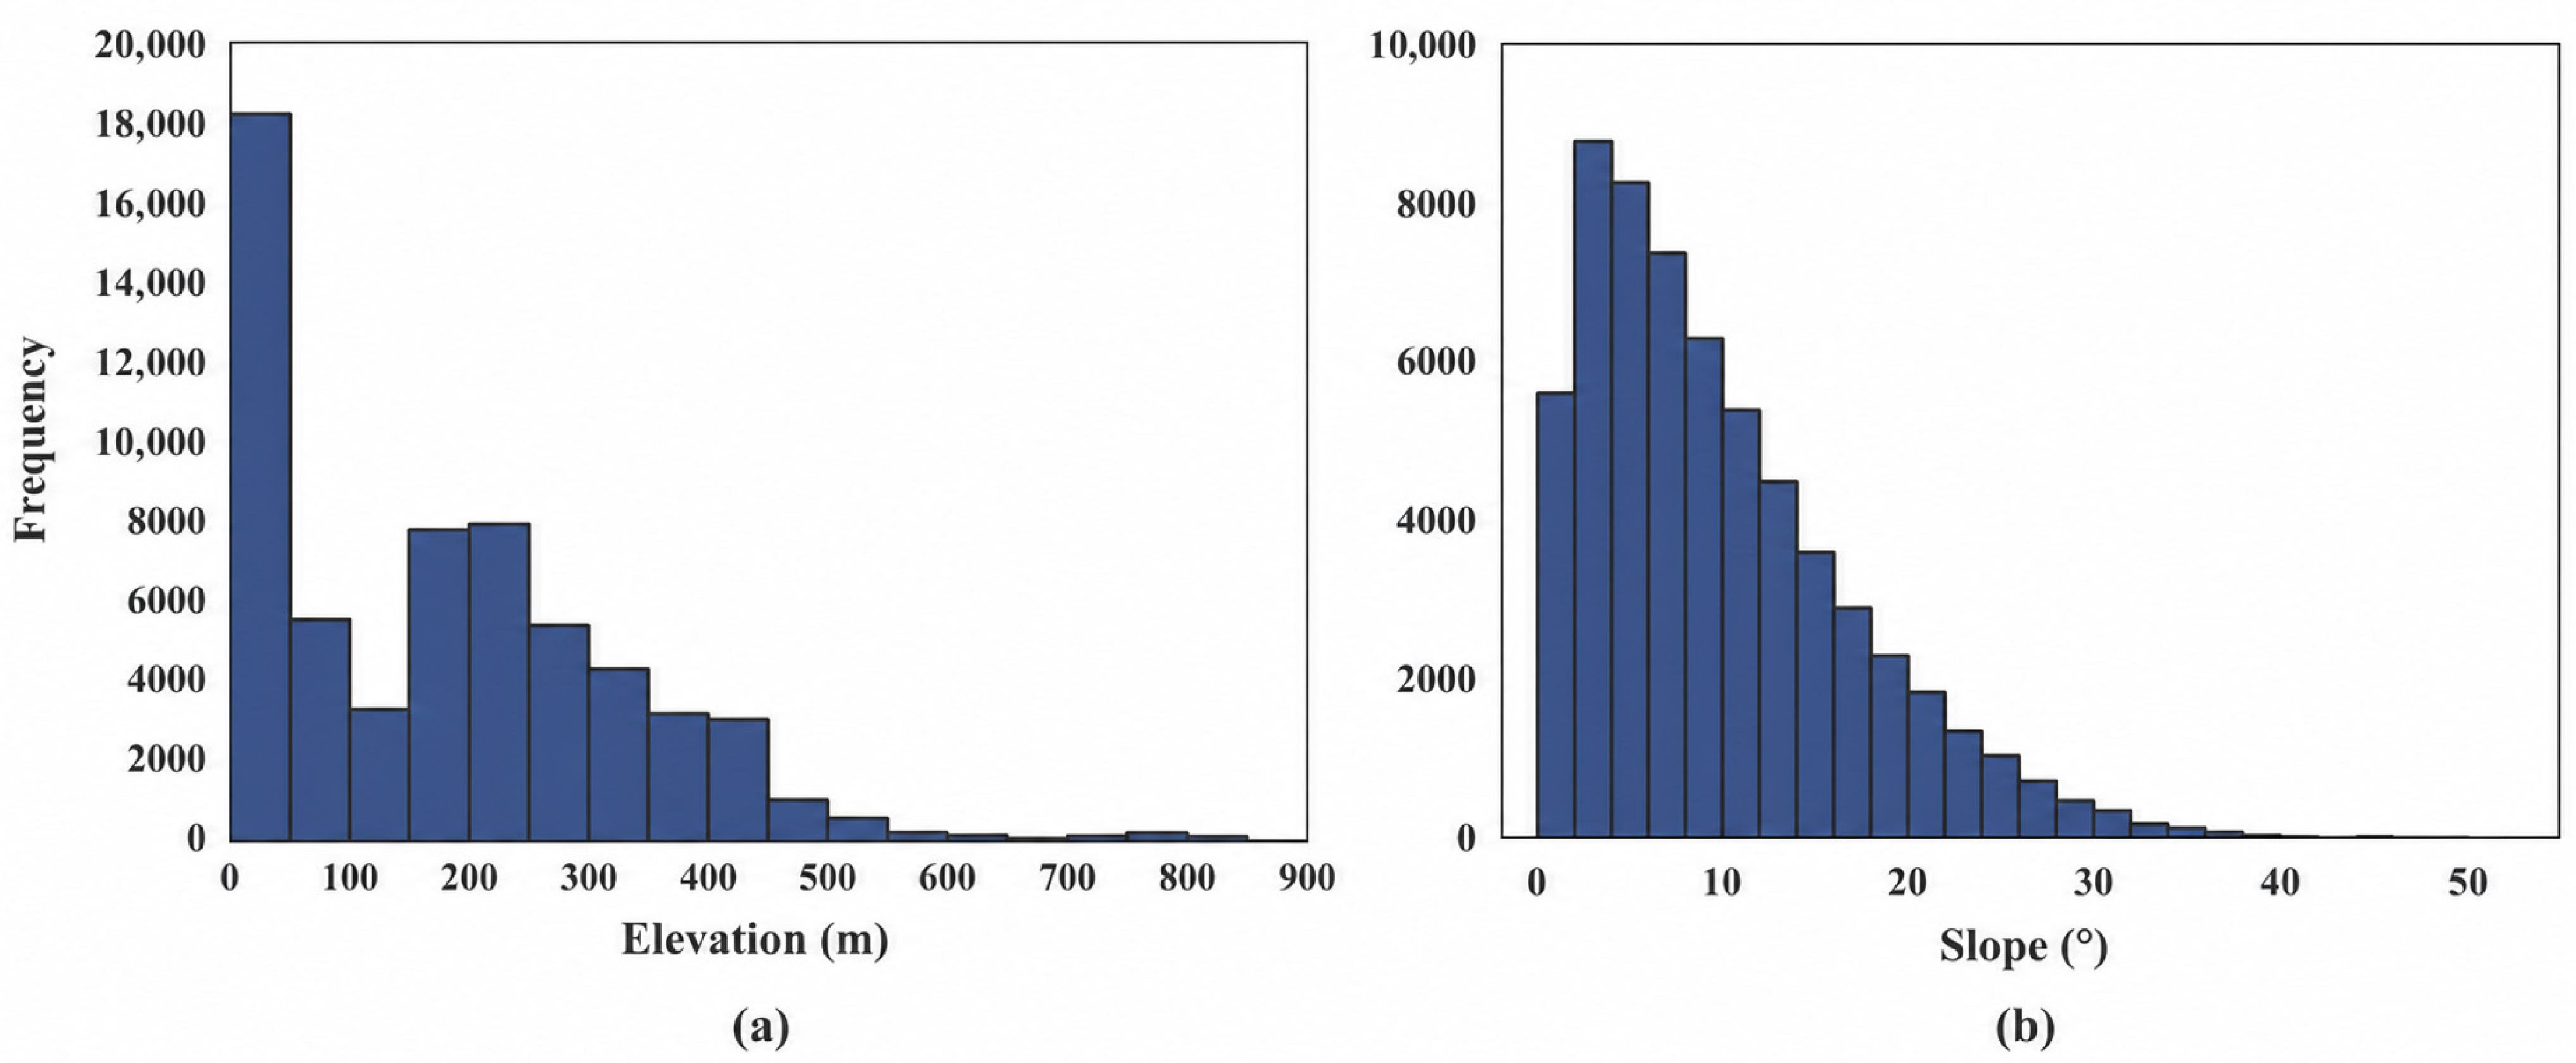
In the LISA map, contiguous high–high cells occurred mainly in central and northern Tianya, with additional local clusters in Yazhou and Jiyang. Haitang was dominated by low–low and non-significant cells (Figure 4b). The elevation frequency among the 30 m grid points was highest at 0–50 m. Within the high–high cells, the mean, median, and modal elevations of the plantation points were 214.62, 209, and 13 m, respectively. The slope frequency was concentrated mainly at 0–15°, peaked near 5°, and decreased markedly above 20° (Figure 5).
Figure 5.
Terrain-frequency distributions of areca palm plantations in Sanya: (a) elevation and (b) slope. Frequency denotes the number of grid points obtained after resampling the 0.59 m mapped raster to 30 m and converting it to points.
3.3. Historical Spectral Evidence and Correspondence with 2019 Land Use
Within the current areca palm plantation with patches larger than 2 ha, LandTrendr classified 70.1% of the area as having no candidate spectral disturbances between 1986 and 2016. The candidate event years 1987 and 1988 accounted for 22.0% and 1.7% of the study area, respectively, whereas the remaining years showed low and dispersed proportions. The magnitude represents the change in the spectral index scaled by 1000, and the results are provided in Table S3. These years denote spectral change vertices under the specified parameters and not the validated years of plantation establishment or management.
Table 4 presents the overlay results of the 2019 Third National Land Survey. The current map corresponded to 4682.34, 492.75, 208.19, and 93.54 ha of “other garden land,” “orchard,” “dryland,” and “other forest land,” respectively, representing 85.5%, 9.0%, 3.8%, and 1.7% of the total overlaid area. The overlaid area totaled 5476.82 ha, 8.82 ha (0.16%) more than the mapped area. The two totals were reported separately because of differences in boundary delineation, acquisition date, and calculation conventions.
Table 4.
Corresponding areas between the current areca palm plantation map and 2019 land-use classes.
4. Discussion
4.1. Mapping Performance and Scope of Application
SAMLoRA (ViT-B) and ResNet-50 U-Net achieved similar F1-scores; however, SAMLoRA had a higher recall and internal validation Dice and a slightly lower precision, indicating fewer omissions at the cost of a small increase in false positives. Because SAMLoRA produced more complete patches and boundaries in the representative areas, it was used for citywide inferences. This result supports the potential of SAM pretrained representations and of parameter-efficient LoRA fine-tuning for areca palm plantation mapping [11,12]. Under the experimental design used in this study, the comparison reflects the combined performance of pretrained representations and LoRA-based adaptation within the selected SAMLoRA configuration. Future controlled comparisons could clarify the contribution of each component.
A previous 30 m Landsat study reported an overall accuracy of 0.67 and an areca palm F1-score of 0.66 [1], whereas a 3 m PlanetScope random-forest approach achieved an overall accuracy of 88.30% [13]. High-resolution deep-learning studies have also demonstrated the value of multiscale features and boundary modeling [7,8,9]. These accuracy values are not directly comparable because the datasets, spatial resolutions, and validation designs differ. In this study, spatial proximity among randomly partitioned samples may have introduced optimistic bias, although the held-out evaluation set was used for model comparison. Because the final manually corrected map was not independently validated, the reported metrics describe performance under the existing sample partition, and the 5468 ha value should be interpreted as a spatially explicit estimate derived from multi-date imagery. Within these constraints, the held-out evaluation results, manual cross-checking, and order-of-magnitude agreement with municipal statistics support the map’s use as a city-scale spatial baseline. It can inform management decisions by identifying plantation concentration zones, guiding monitoring and field-survey priorities, and providing spatial information for district-level agricultural and land-use planning.
4.2. Implications of Spatial Patterns and Land Use
Significant global spatial autocorrelation and high-value LISA cells indicated that the areca palm plantations were clustered at a 1 km grid scale. The concentration of the slope frequency at 0–15° may reflect the lower costs of site preparation, management, and harvesting on gentle slopes. However, the simultaneous occurrence of the highest frequency at 0–50 m elevation and a mean elevation above 200 m for high–high cells indicates that plantations are present in both lowlands and hills. Because sensitivity to grid size and neighbor number were not tested and soil, precipitation, irrigation, and transportation variables were not included, the analysis describes spatial association but cannot identify the causal effects of terrain or socioeconomic factors.
Tianya and Yazhou accounted for 82.3% of the mapped area, which is consistent with the regional differences reported at the Hainan Island scale [1]. In the 2019 survey overlay, 85.5% of the area corresponded to “other garden land,” indicating strong spatial correspondence between the current map and the land used for perennial cash crops. Small areas corresponding to orchards, drylands, and other forestlands may reflect intercropping, boundary differences, or temporal mismatches. Because the overlaid area was 0.16% larger than the mapped area and the 2019 survey predated the 2021–2025 mapping imagery, these results could not reveal pre-plantation land classes, conversion directions, or land-use drivers.
4.3. Historical Spectral Evidence and Study Limitations
The LandTrendr results apply only to current patches larger than 2 ha ending in 2016. The absence of a candidate event for 70.1% of the area means that no spectral breakpoint was detected at a 30 m resolution under the specified NBR series and thresholds; this does not demonstrate ecological stability, continuous areca palm cultivation, or an absence of management [25]. The concentration of signals during 1987–1988 may include early land-cover changes but may also reflect the beginning of the time series, image quality, or model parameters. Changes after 2016 and former plantations were not included. Therefore, these results should be regarded as historical spectral evidence and not as proof of areca palm expansion, renewal, or year of establishment.
Beyond the lack of independent validation for the final map, four sources of uncertainty remain: Google Earth imagery contains only RGB bands and spans multiple years; random sample partitioning cannot assess spatial transferability; 30 m Landsat and DEM processing may obscure small patches and introduce scale effects [26,27]; and the 2019 land survey data differ temporally and spatially from the mapping imagery. Together, the held-out evaluation, manual cross-checking, and order-of-magnitude agreement with municipal statistics support the validity of the map for characterizing broad city-scale distribution patterns. The identified uncertainties mainly limit parcel-level accuracy, temporal specificity, spatial transferability, and causal interpretation; they do not preclude its use as a regional baseline for spatial analysis, survey prioritization, and management support.
5. Conclusions
This study used 0.59 m imagery and SAMLoRA with a ViT-B backbone to establish a baseline distribution for areca palm plantations in Sanya. SAMLoRA achieved precision, recall, and F1-score values of 0.817, 0.809, and 0.813, respectively, for the held-out evaluation set and an internal validation Dice coefficient of 0.70. After manual correction, the spatially explicit area estimate was 5468 ha, of which 82.3% was in Tianya and Yazhou. The mapped distribution showed significant clustering at the 1 km grid scale, and the slope frequency among the 30 m grid points was concentrated mainly at 0–15°. An exploratory historical analysis and overlay with 2019 land-use data provided additional evidence of spectral changes and land-class correspondence. Given the random sample split, multi-date imagery, and lack of independent validation of the final map, these findings should serve as a regional baseline and starting point for subsequent research, rather than as a single-year inventory or causal explanation.
The main contribution of this study is the integration of high-resolution plantation mapping with spatial clustering, terrain, historical spectral behavior, and land-use context under a single analytical framework, thereby providing spatially explicit baseline data for fragmented tropical cash crop plantations in Sanya. Future work should prioritize commercial high-resolution satellite data with controlled acquisition dates and quality to improve temporal consistency; use multi-temporal classification and change detection to identify land-cover sources before plantation establishment and land-cover outcomes after abandonment or crop conversion; and integrate terrain-, climate-, soil-, and water-related variables to assess the environmental suitability for areca palm cultivation. The results also indicate that future research should move beyond single-date accuracy comparisons to temporally consistent long-term observations, interpretation of land cover transitions, and environmental suitability assessments.
Supplementary Materials
The following supporting information can be downloaded at https://www.mdpi.com/article/10.3390/f17091031/s1: Figure S1. Spatial coverage of the 0.59 m Google Earth RGB imagery used in this study. The overlaid points indicate image-acquisition information; detailed acquisition dates and image counts are provided in Table S1. Figure S2. Architectures of the evaluated segmentation models: (a) ResNet U-Net with a residual encoder, skip-feature concatenation, and a U-Net decoder; and (b) SAMLoRA with a frozen ViT-B image encoder and trainable LoRA adapters (rank = 4). ViT-B denotes the Vision Transformer Base architecture, and LoRA denotes Low-Rank Adaptation. Figure S3. Training and validation loss trajectories of the evaluated models: (a) ResNet-18 U-Net; (b) ResNet-34 U-Net; (c) ResNet-50 U-Net; and (d) SAMLoRA with a ViT-B backbone. All models were trained for 100 epochs without early stopping. The horizontal axes show the number of batches processed, as recorded in the original training logs. Table S1. Google Earth image-acquisition dates and image counts by district in Sanya. Table S2. LandTrendr parameter settings and output configuration used in this study. Code S1. Google Earth Engine JavaScript implementation of the LandTrendr analysis. Table S3. Candidate spectral-event years, magnitudes, and durations for currently mapped areca palm plantation patches larger than 2 ha, derived using LandTrendr for 1986–2016. Magnitude denotes the spectral-index change multiplied by 1000; the candidate LandTrendr vertices should not be interpreted as validated years of plantation establishment or management.
Author Contributions
Conceptualization, H.L.; methodology, X.W., W.Z. and H.L.; software, X.W.; validation, X.W., W.Z., C.W., X.C. and Y.X.; formal analysis, X.W., W.Z. and H.L.; investigation, X.W., W.Z., C.W., X.C. and Y.X.; resources, H.L., B.C. and H.W.; data curation, X.W., W.Z., C.W. and Z.Z.; writing—original draft preparation, X.W. and W.Z.; writing—review and editing, X.W., W.Z., Y.X., Z.Z., X.Q., B.C., H.W. and H.L.; visualization, X.W. and W.Z.; supervision, B.C., H.W. and H.L.; project administration, H.L.; funding acquisition, H.L. All authors have read and agreed to the published version of the manuscript.
Funding
This research was funded by the “National Natural Science Foundation of China, grant number 32160364”.
Data Availability Statement
Google Earth high-resolution imagery and the Third National Land Survey data cannot be publicly redistributed because of source and use restrictions. Landsat and ASTER GDEM data are available on public platforms. Subject to compliance with the applicable data-use agreements, the model training records, derived statistics, and principal code can be made available by the authors upon reasonable request.
Acknowledgments
The authors thank those students who assisted with fieldwork and data collection, and instructors for their constructive comments on the improvement of this study.
Conflicts of Interest
The authors declare no conflicts of interest.
References
- Wang, C.; Yin, Z.; Luo, R.; Qian, J.; Fu, C.; Wang, Y.; Xie, Y.; Liu, Z.; Qiu, Z.; Pei, H. Spatiotemporal evolution and impact mechanisms of areca palm plantations in China (1987–2022). Forests 2024, 15, 1679. [Google Scholar] [CrossRef] [Scilit]
- Wang, Y.; Hollingsworth, P.M.; Zhai, D.; West, C.D.; Green, J.M.H.; Chen, H.; Hurni, K.; Su, Y.; Warren-Thomas, E.; Xu, J.; et al. High-resolution maps show that rubber causes substantial deforestation. Nature 2023, 623, 340–346. [Google Scholar] [CrossRef] [Scilit] [PubMed]
- Chaves, M.E.D.; Picoli, M.C.A.; Sanches, I.D. Recent applications of landsat 8/OLI and Sentinel-2/MSI for land use and land cover mapping: A systematic review. Remote Sens. 2020, 12, 3062. [Google Scholar] [CrossRef] [Scilit]
- Mahlayeye, M.; Darvishzadeh, R.; Nelson, A. Cropping patterns of annual crops: A remote sensing review. Remote Sens. 2022, 14, 2404. [Google Scholar] [CrossRef] [Scilit]
- Maskell, G.; Chemura, A.; Nguyen, H.; Gornott, C.; Mondal, P. Integration of Sentinel optical and radar data for mapping smallholder coffee production systems in Vietnam. Remote Sens. Environ. 2021, 266, 112709. [Google Scholar] [CrossRef] [Scilit]
- Lin, C.; Jin, Z.; Mulla, D.; Ghosh, R.; Guan, K.; Kumar, V.; Cai, Y. Toward large-scale mapping of tree crops with high-resolution satellite imagery and deep learning algorithms: A case study of olive orchards in Morocco. Remote Sens. 2021, 13, 1740. [Google Scholar] [CrossRef] [Scilit]
- Freudenberg, M.; Nölke, N.; Agostini, A.; Urban, K.; Wörgötter, F.; Kleinn, C. Large scale palm tree detection in high resolution satellite images using U-net. Remote Sens. 2019, 11, 312. [Google Scholar] [CrossRef] [Scilit]
- Li, W.; Fu, H.; Yu, L.; Cracknell, A. Deep learning based oil palm tree detection and counting for high-resolution remote sensing images. Remote Sens. 2017, 9, 22. [Google Scholar] [CrossRef] [Scilit]
- Wang, S.; Wang, Y.; Yue, J.; Liang, H.; Zhang, Z.; Li, B. UniU-net: A unified U-net deep learning approach for high-precision areca palm segmentation in remote sensing imagery. Appl. Sci. 2025, 15, 4813. [Google Scholar] [CrossRef] [Scilit]
- He, K.; Zhang, X.; Ren, S.; Sun, J. Deep residual learning for image recognition. In Proceedings of the 2016 IEEE Conference on Computer Vision and Pattern Recognition (CVPR), Las Vegas, NV, USA, 27–30 June 2026; Institute of Electrical and Electronics Engineers: New York, NY, USA, 2016; pp. 770–778. [Google Scholar] [CrossRef] [Scilit]
- Kirillov, A.; Mintun, E.; Ravi, N.; Mao, H.; Rolland, C.; Gustafson, L.; Xiao, T.; Whitehead, S.; Berg, A.C.; Lo, W.-Y.; et al. Segment anything. In Proceedings of the 2023 IEEE/CVF International Conference on Computer Vision (ICCV), Paris, France, 2–6 October 2023; Institute of Electrical and Electronics Engineers: New York, NY, USA, 2023; pp. 3992–4003. [Google Scholar] [CrossRef] [Scilit]
- Zhang, K.; Liu, D. Customized segment anything model for medical image segmentation. arXiv 2023, arXiv:2304.13785. [Google Scholar] [CrossRef] [Scilit]
- Jin, Y.; Guo, J.; Ye, H.; Zhao, J.; Huang, W.; Cui, B. Extraction of Arecanut planting distribution based on the feature space optimization of PlanetScope imagery. Agriculture 2021, 11, 371. [Google Scholar] [CrossRef] [Scilit]
- Guo, J.; Jin, Y.; Ye, H.; Huang, W.; Zhao, J.; Cui, B.; Liu, F.; Deng, J. Recognition of areca leaf yellow disease based on PlanetScope satellite imagery. Agronomy 2022, 12, 14. [Google Scholar] [CrossRef] [Scilit]
- Zhao, Q.; Yu, L.; Li, X.; Peng, D.; Zhang, Y.; Gong, P. Progress and trends in the application of Google Earth and Google earth engine. Remote Sens. 2021, 13, 3778. [Google Scholar] [CrossRef] [Scilit]
- Yu, L.; Gong, P. Google Earth as a virtual globe tool for earth science applications at the global scale: Progress and perspectives. Int. J. Remote Sens. 2012, 33, 3966–3986. [Google Scholar] [CrossRef] [Scilit]
- Chen, W.; Xu, Y.; Zhang, Z.; Yang, L.; Pan, X.; Jia, Z. Mapping agricultural plastic greenhouses using Google Earth images and deep learning. Comput. Electron. Agric. 2021, 191, 106552. [Google Scholar] [CrossRef] [Scilit]
- Li, W.; Dong, R.; Fu, H.; Wang, J.; Yu, L.; Gong, P. Integrating Google Earth imagery with Landsat data to improve 30-m resolution land cover mapping. Remote Sens. Environ. 2020, 237, 111563. [Google Scholar] [CrossRef] [Scilit]
- Masek, J.G.; Vermote, E.F.; Saleous, N.; Wolfe, R.; Hall, F.G.; Huemmrich, F.; Gao, F.; Kutler, J.; Lim, T.K. LEDAPS Calibration, Reflectance, Atmospheric Correction Preprocessing Code, version 2; ORNL DAAC: Oak Ridge, TN, USA, 2013. [CrossRef]
- Vermote, E.; Roger, J.C.; Franch, B.; Skakun, S. LaSRC (Land Surface Reflectance Code): Overview, application and validation using MODIS, VIIRS, LANDSAT and Sentinel 2 data’s. In Proceedings of the IGARSS 2018—2018 IEEE International Geoscience and Remote Sensing Symposium, Valencia, Spain, 22–27 July 2018; pp. 8173–8176. [Google Scholar] [CrossRef] [Scilit]
- Abrams, M.; Yamaguchi, Y.; Crippen, R. Aster global DEM (GDEM), Version 3. In International Archives of the Photogrammetry, Remote Sensing and Spatial Information Sciences; Copernicus GmbH: Göttingen, Germany, 2022; Volume XLIII-B4-2022, pp. 593–598. [Google Scholar] [CrossRef] [Scilit]
- Fujisada, H.; Urai, M.; Iwasaki, A. Technical methodology for ASTER global DEM. IEEE Trans. Geosci. Remote Sens. 2012, 50, 3725–3736. [Google Scholar] [CrossRef] [Scilit]
- Anselin, L. Local indicators of spatial association—LISA. Geogr. Anal. 1995, 27, 93–115. [Google Scholar] [CrossRef] [Scilit]
- Lee, J.; Li, S. Extending Moran’s index for measuring spatiotemporal clustering of geographic events. Geogr. Anal. 2017, 49, 36–57. [Google Scholar] [CrossRef] [Scilit]
- Pasquarella, V.J.; Arévalo, P.; Bratley, K.H.; Bullock, E.L.; Gorelick, N.; Yang, Z.; Kennedy, R.E. Demystifying LandTrendr and CCDC temporal segmentation. Int. J. Appl. Earth Obs. Geoinf. 2022, 110, 102806. [Google Scholar] [CrossRef] [Scilit]
- Reinosch, E.; Backa, J.; Adler, P.; Deutscher, J.; Eisnecker, P.; Hoffmann, K.; Langner, N.; Puhm, M.; Rüetschi, M.; Straub, C.; et al. Detailed validation of large-scale Sentinel-2-based forest disturbance maps across Germany. Forestry 2025, 98, 437–453. [Google Scholar] [CrossRef] [Scilit]
- Viana-Soto, A.; Senf, C. The European Forest Disturbance Atlas: A forest disturbance monitoring system using the Landsat archive. Earth Syst. Sci. Data 2025, 17, 2373–2404. [Google Scholar] [CrossRef] [Scilit]

Disclaimer/Publisher’s Note: The statements, opinions and data contained in all publications are solely those of the individual author(s) and contributor(s) and not of MDPI and/or the editor(s). MDPI and/or the editor(s) disclaim responsibility for any injury to people or property resulting from any ideas, methods, instructions or products referred to in the content. |
© 2026 by the authors. Licensee MDPI, Basel, Switzerland. This article is an open access article distributed under the terms and conditions of the Creative Commons Attribution (CC BY) license.