


Abstract
This study used Camellia pyxidiacea var. rubituberculata as the rootstock and the improved cultivar Camellia oleifera ‘Qianyou 2’ as the scion for heterografting (CO group), with homografting (using C. pyxidiacea var. rubituberculata as both rootstock and scion) as the control. The physiological and metabolic changes during graft healing were investigated by measuring enzyme activities, targeted analysis of endogenous hormones, and non-targeted metabolomics via LC-MS/MS. The results indicate that, compared to homologous grafting, an integrated response pattern characterized by “defense prioritization and growth suppression” was observed in heterologous grafting combinations. At the hormonal level, heterografting significantly inhibited growth-promoting hormones (e.g., zeatin riboside), while defense-related hormones (salicylic acid SA, jasmonic acid JA) and their metabolite, capsidiol, were continuously accumulated and upregulated. At the metabolic pathway level, phenylpropanoid metabolism was redirected: the activity of phenylalanine ammonia-lyase (PAL) was suppressed, shifting synthesis toward soluble defense compounds like coumarins. Enzymatically, the activities of polyphenol oxidase (PPO) and peroxidase (POD) were significantly enhanced in the mid-to-late stages of healing, promoting the oxidative crosslinking of phenolic compounds and the formation of lignin-related physical barriers. Thus, these three mutually corroborating levels—hormonal signaling, dynamic enzyme activities, and global metabolic networks—collectively point to a healing mode characterized by defense prioritization and growth suppression. This study provides theoretical guidance for the grafting utilization of C. pyxidiacea var. rubituberculata.
1. Introduction
Grafting is one of the methods for large-scale vegetative propagation [1]. Initially used to improve the agronomic traits of crops, it is now widely applied in the selection and breeding of superior varieties and in the cultivation of horticultural crops, generating substantial economic benefits. When a branch or bud from one plant is grafted onto the stem, trunk, or root of another plant, the scion can come from the same individual (autograft) or from two different individuals (heterograft) [2]. During the process of graft union formation, frequent exchange of substances occurs between the scion and the rootstock. Small molecules (such as sucrose and hormones) and macromolecules (such as nucleic acids and proteins) can be transported over short distances through plasmodesmata [3,4] or over long distances via the phloem [5]. Several factors influence the graft union and growth during the grafting process. These factors are reflected in the physicochemical differences between the scion and the rootstock, including the presence of sugars and phenolic compounds [6,7], endogenous hormones [8,9], and nucleic acids and proteins [10,11]. These differences significantly affect graft union and are considered the primary factors [12].
Camellia oleifera, a species of the genus Camellia L. in the family Theaceae, is an ever-green shrub or small tree that is native to China. It has a long history of cultivation, is widely distributed, and is extensively cultivated, making it one of the world’s four major woody oilseed crops [13,14]. Tea seed oil, extracted from the mature seeds of C. oleifera, contains approximately 90% unsaturated fatty acids, such as oleic and linoleic acids, and is also rich in bioactive compounds like tocopherols (vitamin E), squalene, and tea polyphenols [15]. Long-term consumption of tea seed oil can help soften blood vessels, lower blood lipids and blood pressure, alleviate cardiovascular diseases, and reduce cholesterol levels [16]. C. pyxidiacea var. rubituberculata, a member of the Camellia sect. Pyxidicae, is a unique plant species endemic to Guizhou, China, and is found in the Qianxinan Prefecture. This species thrives in a typical “rocky” environment, specifically in karst rocky desertification areas. Due to its unique natural habitat and adaptability to karst rocky desertification, it can be used as an ecological and economically valuable native tree species for vegetation restoration in these regions [17,18]. However, C. pyxidiacea var. rubituberculata has thick fruit peels, low seed yield, and low productivity per unit area, which have limited its utilization. Nevertheless, its adaptability to rocky desertification areas in Guizhou provides a new approach for C. oleifera seedling production. Using C. pyxidiacea var. rubituberculata seeds to develop rootstocks for C. oleifera seedlings and promoting their cultivation in rocky mountainous areas can explore new avenues for developing the tea oil industry in these challenging environments [19].
Currently, bud grafting on seedling rootstocks is one of the primary methods for propagating superior C. oleifera seedlings. This process involves cutting the scion into a wedge shape and inserting it into a longitudinally split rootstock. This procedure subjects both the scion and rootstock to high-intensity cutting, creating large areas of trauma that are exposed to the air, making them susceptible to pathogen infection and dehydration. Research has shown that plants respond to injury by producing stress responses that form self-defense mechanisms against damage or adverse conditions. The wounded areas secrete specific compounds to resist external influences and promote healing and growth [20,21]. Hormones, as key regulators of plant cell growth and development, play a crucial role in this process by promoting plant regeneration [22,23]. However, plant hormones do not act independently; they exist in a network of antagonistic and cooperative relationships. As signaling molecules, they regulate their own levels and those of other hormones, forming a complex crosstalk [24,25]. These processes indicate that a series of biochemical changes occur within the scion and rootstock after wounding. During this period, various substances that may influence graft union formation are likely produced. However, there is currently limited research on the changes that occur during this phase, and the impact of these changes on graft union remains unclear [26].
Furthermore, immediately after grafting, the healing cut sites of the plants produce a large amount of reactive oxygen species (ROS), which can cause oxidative damage to the cells at the graft union. Enzymes such as peroxidase (POD), superoxide dismutase (SOD), and catalase (CAT) play a crucial role in scavenging excess ROS at the cut surfaces, thereby maintaining stable ROS levels and preventing further membrane lipid peroxidation [27]. Phenylalanine ammonia-lyase (PAL) and polyphenol oxidase (PPO) are also involved in the graft healing process, with PAL participating in lignin synthesis and PPO promoting cell differentiation and lignification [28]. Research has shown that graft unions with high compatibility, such as those in cucumber, exhibit higher SOD and POD activities. Similarly, compatible melon grafts show higher antioxidant enzyme activity and lower ROS levels at the graft interface. These antioxidant enzymes have become important indicators for evaluating graft union success and the compatibility between the scion and rootstock [29].
To address this, the present study used C. pyxidiacea var. rubituberculata as the rootstock and C. oleifera cultivar ‘Qianyou No. 2’ as the scion for interspecific grafting (heterograft). As a control, self-grafting (autograft) of C. pyxidiacea var. rubituberculata was also performed (Guizhou Academy of Forestry, Guiyang, Guizhou Province, China). The study involved measuring the activities of relevant enzymes, targeted analysis of endogenous hormones, and non-targeted metabolomic analysis using LC-MS/MS. The aim was to systematically compare the hormonal dynamics during the critical stages of graft union formation between the two grafting combinations. This approach is intended to provide a physiological and molecular understanding of the graft union mechanism, thereby offering a theoretical basis for the utilization of C. pyxidiacea var. rubituberculata in grafting. It should be noted that this study was application-oriented, focusing on grafting high-yield Camellia oleifera cultivars onto the drought-tolerant rootstock of C. pyxidiacea var. rubituberculat. The primary objective was to evaluate the healing physiological characteristics of this heterograft combination. Consequently, we used autografting of C. pyxidiacea var. rubituberculat (i.e., grafting onto its own rootstock) as a control to eliminate the confounding effects of the rootstock’s genetic background, thereby more directly revealing the specific responses triggered by the introduction of the heterologous scion.
2. Materials and Methods
2.1. Plant Materials and Grafting Procedure
Mature fruits of C. pyxidiacea var. rubituberculata were collected in October 2024 from Xingren County, Guizhou Province, China. After shade-drying, the seeds were subjected to moist-sand stratification for vernalization following the protocol of LY/T 2329—2014 “Technical Regulations for Camellia Grafting”: a 15 cm high sand bed was prepared using clean medium-coarse sand; a layer of screened and surface-disinfected seeds was sown, covered with 8–12 cm of sand, and maintained to raise rootstock seedlings.
In late May 2025, semi-lignified, pest-free current-year spring shoots with plump buds were harvested from ‘Qianyou 2’, an improved oil-tea cultivar, at the Improved Oil-Tea Cultivar Base of Guizhou Academy of Forestry, to serve as scions for the heterologous grafting treatment (CO group). Homologous grafting of C. pyxidiacea var. rubituberculata onto itself served as the control (CK group).
Seedling rootstock grafting was performed according to the following protocol: (1) Rootstock preparation: Rootstock seedlings were carefully lifted from the sandbed and washed free of sand. The shoot was severed 1.2 cm–1.5 cm above the cotyledons, and a vertical cleft 1.0 cm–1.2 cm long was made along the pith; the taproot was trimmed to 6.0 cm while preserving the cotyledons. (2)Scion cutting: A one-bud-one-leaf scion was shaped by making two opposing 1.0 cm–1.2 cm long cuts 0.1 cm–0.2 cm below the leaf bud, meeting at the pith, and severing 0.1 cm–0.2 cm above the bud. (3) Joining and wrapping: The scion was inserted into the rootstock cleft ensuring that one side of the cambium was aligned, and the graft union was tightly bound with an aluminum strip (3 cm–3.8 cm × 0.8 cm–1 cm × 0.11 mm). (4) Post-grafting care: The grafted seedlings were immediately watered to maintain humidity and transplanted within 30 min into non-woven fabric bags filled with yellow subsoil. A plastic tunnel and shade net were erected to provide humid and shaded conditions; relative humidity inside the tunnel was maintained at 80%–90% with 75% shading density.
Sampling was conducted at 7 day intervals over 35 days post-grafting, yielding six sampling time points. At each time point, three biologically independent grafted seedlings per treatment were randomly selected. The graft union region (1.0 cm–1.5 cm) was excised, placed in 1.5 mL centrifuge tubes, flash-frozen in liquid nitrogen, and stored for subsequent analysis.
2.2. Physiological and Metabolic Index Determination
The activities of key enzymes were determined using spectrophotometric methods [30]. Specifically, the activities of phenylalanine ammonia-lyase (PAL), polyphenol oxidase (PPO), peroxidase (POD), catalase (CAT), and superoxide dismutase (SOD) were measured. PAL activity was determined using the L-phenylalanine conversion method by monitoring the formation of trans-cinnamic acid at 290 nm. PPO activity was measured by tracking the increase in absorbance at 470 nm due to the oxidation of catechol. POD activity was assayed by measuring the change in absorbance at 470 nm due to the oxidation of guaiacol in the presence of hydrogen peroxide. CAT activity was determined by monitoring the decrease in absorbance at 240 nm due to the decomposition of hydrogen peroxide. SOD activity was measured using the nitroblue tetrazolium (NBT) reduction method, with the inhibition of NBT reduction monitored at 560 nm. These enzymatic activities were quantified to evaluate the physiological and metabolic responses during the graft union process.
2.3. Targeted Analysis and Quantification of Endogenous Hormones
For the targeted analysis and quantification of endogenous hormones, including ABA, GAs, CKs, IAA, JAs, and SA, 100 mg of each sample was placed in a 2 mL grinding tube, to which 498 µL of 80% methanol and 2 µL of SA-D4 internal standard solution (2 µg/mL) were added. The mixture was homogenized and ground at low temperature for 3 min, followed by low-temperature ultrasonic extraction for 1 h. Next, 25 mg of EN15662 extraction salt (containing 4 g of magnesium sulfate, 1 g of sodium chloride, 1 g of sodium citrate dihydrate, and 0.5 g of sodium dihydrogen citrate sesquihydrate) was added, and the mixture was immediately dispersed by shaking. The tubes were then vigorously shaken on an oscillator for 10 min. After centrifugation at 10 °C for 10 min, 100 µL of the supernatant was collected and mixed with 60 µL of water. The resulting solution was vortexed and transferred to an injection vial. The samples were analyzed using LC-ESI-MS/MS (UHPLC-Qtrap) (Thermo Fisher Scientific Shanghai China) for qualitative and quantitative detection of target compounds. The specific parameters were as follows: Waters BEH C18 (2.1 * 100 mm, 1.7 μm) liquid chromatography column, column temperature 30 °C, injection volume 10 μL, mobile phase A (0.1% formic acid in water), mobile phase B (0.1% formic acid in acetonitrile), equilibration time 3 min, acquisition time 10 min. Mass spectrometry conditions: AB SCIEX QTRAP 6500+, detection mode positive/negative, Curtain Gas (CUR) 35, Collision Gas (CAD) Medium, Ion Spray Voltage (IS) +5500/−4500, Temperature (TEM) 550, Ion Source Gas1 (GS1) 50, Ion Source Gas2 (GS2) 50, Scheduled MRM, Basic, MRM detection window 120 s. In the Sciex quantitative software OS, the ion fragments were automatically identified and integrated with default parameters, and manually checked. Linear regression standard curves were plotted with the mass spectrometry peak area of the analytes on the y-axis and the concentration of the analytes on the x-axis. Sample concentrations were calculated by substituting the mass spectrometry peak area of the sample analytes into the linear equation.
2.4. Non-Targeted Metabolomics Analysis
This study included 40 samples (6 time points for the CK control group and CO experimental group, with 3 biological replicates each, and a QC quality control group with 4 biological replicates) for non-targeted metabolomics analysis using liquid chromatography–tandem mass spectrometry (LC-MS/MS). After data acquisition, the raw data were processed using Progenesis CD (Waters Corporation, Milford, CT, USA) for peak detection, extraction, alignment, and integration. The Human Metabolome Database (HMDB, http://www.hmdb.ca/, accessed on 19 Decenmber 2025) and Metlin (https://metlin.scripps.edu/, accessed on 19 Decenmber 2025) as well as an in-house database were used for metabolite annotation. The annotated data were preprocessed to eliminate or reduce errors introduced during the experiment and analysis. This preprocessing included the removal of features with more than 20% missing values within each group, imputation of missing values with the minimum value across all samples, normalization of the sample’s mass spectrometry peak response intensity using the sum normalization method, and the removal of variables with a relative standard deviation (RSD) > 30% in the QC samples. The data were then log10-transformed to obtain the final data matrix for subsequent analysis. Statistical analyses, including principal component analysis (PCA) and orthogonal partial least squares discriminant analysis (OPLS-DA), were performed on the samples (including QC samples) using the ropls package (R packages, Version 1.6.2). Metabolites were annotated by comparing them to the HMDB and KEGG databases (https://www.kegg.jp/kegg/pathway.html, accessed on 20 Decenmber 2025) using Progenesis v2.2 software (Waters, Milford, MA, USA). The variable importance in projection (VIP) scores were calculated for the OPLS-DA model. Differential metabolites were identified using a combination of univariate statistical analysis (t-test) and multivariate statistical analysis (OPLS-DA/PLS-DA), along with fold change (FC) values. False discovery rate (FDR) correction was applied for multiple testing, and pathway enrichment analysis was conducted using the Python scipy.stats package. Visualization of the results was performed using the Majorbio Cloud Platform (https://cloud.majorbio.com/, accessed on 23 Decenmber 2025).
2.5. Multivariate Statistical Analysis and Differential Metabolite Screening
For each time point (CO{i}_vs_CK{i}, i = 1–6), OPLS-DA models were constructed using the R package ropls (v1.38.0). The robustness of the models was evaluated using 7-fold cross-validation to assess R2Y (explained variance) and Q2 (predictive ability). To exclude overfitting, 200 random permutation tests were performed. Variable importance in projection (VIP) values were extracted as a measure of variable importance. Differential metabolites (SCMs) were identified by combining multivariate statistical analysis (VIP_OPLS-DA > 1) with univariate statistical analysis (two-sample t-test p < 0.05, adjusted for false discovery rate [FDR] using the Benjamini–Hochberg method, FDR < 0.05). To enhance the reliability of the results, a more stringent fold change threshold of |log2FC| ≥ 1 (i.e., a 2-fold change) was applied, which is more rigorous than the commonly used |log2FC| > 0.14. To further identify the most discriminative and significant metabolites, a weighted Score ranking was used. The formula for the Score is: Score = VIP0.6 × (−log10 p) × |log2FC|0.4. This approach helps in pinpointing the most biologically relevant and statistically significant metabolites from the screened SCMs.
2.6. Time-Series Clustering Analysis
Using the union of strictly filtered SCMs across six time points as input, a time-series matrix was constructed based on the mean metabolite abundance of three biological replicates at each time point in the CO group. The R package Mfuzz (v2.66.0) was employed to sequentially perform filter.NA (thres = 0.25), fill.NA (mode = “mean”), and standardize for data normalization. The fuzzy exponent m was estimated using the mestimate() function. Fuzzy C-means clustering was then executed via the mfuzz() function with the number of clusters k set to 9 and set.seed = 2026. Finally, time-series profile plots for each cluster and the metabolite membership matrix were generated.
2.7. KEGG Pathway Enrichment Analysis
KEGG pathway annotation was based on the KEGG Pathway database, comprising 109 plant-related pathways and 688 background metabolites. For each set of differentially abundant metabolites against the background set, a hypergeometric test (Python SciPy v1.13, scipy.stats.hypergeom.sf) was performed to evaluate enrichment significance. Multiple testing correction was applied using the Benjamini–Hochberg method with a significance threshold of α = 0.05. Significantly enriched pathways were visualized as bubble plots (matplotlib v3.9), with bubble size and color representing −log10(p), Rich Factor (hit/pathway size), and the number of hits, respectively.
2.8. Correlation Analysis
Based on key hormones, enzyme activities, and strictly filtered SCMs (with a focus on metabolites identified in the BR pathway), a correlation network was constructed using the Pearson correlation coefficient (|r| ≥ 0.7, p < 0.05). The network, comprising nodes (metabolites, hormones, and enzyme activities) and edges (positive or negative correlations), was visualized using Cytoscape v3.10.
2.9. Data Analysis
Enzyme activities and endogenous hormone contents are expressed as the mean ± standard deviation (SD) of three biological replicates (n = 3 per treatment per time point). The Shapiro–Wilk test was used to assess residual normality, and Levene’s test was applied to evaluate homogeneity of variance. A two-way analysis of variance (two-way ANOVA) was conducted to evaluate the effects of grafting treatment, sampling time, and their interaction. When the interaction was significant, independent-samples t-tests (with Welch’s correction for unequal variances) were performed to compare the differences between the CO and CK groups at each time point, with multiple comparisons across the six time points corrected using the Benjamini–Hochberg false discovery rate (FDR) procedure. Significance levels were set at * p < 0.05, ** p < 0.01, and *** p < 0.001. All statistical analyses were performed using SPSS 23.0.
3. Results
3.1. Dynamic Changes in Enzyme Activities at the Graft Junction During Graft Healing
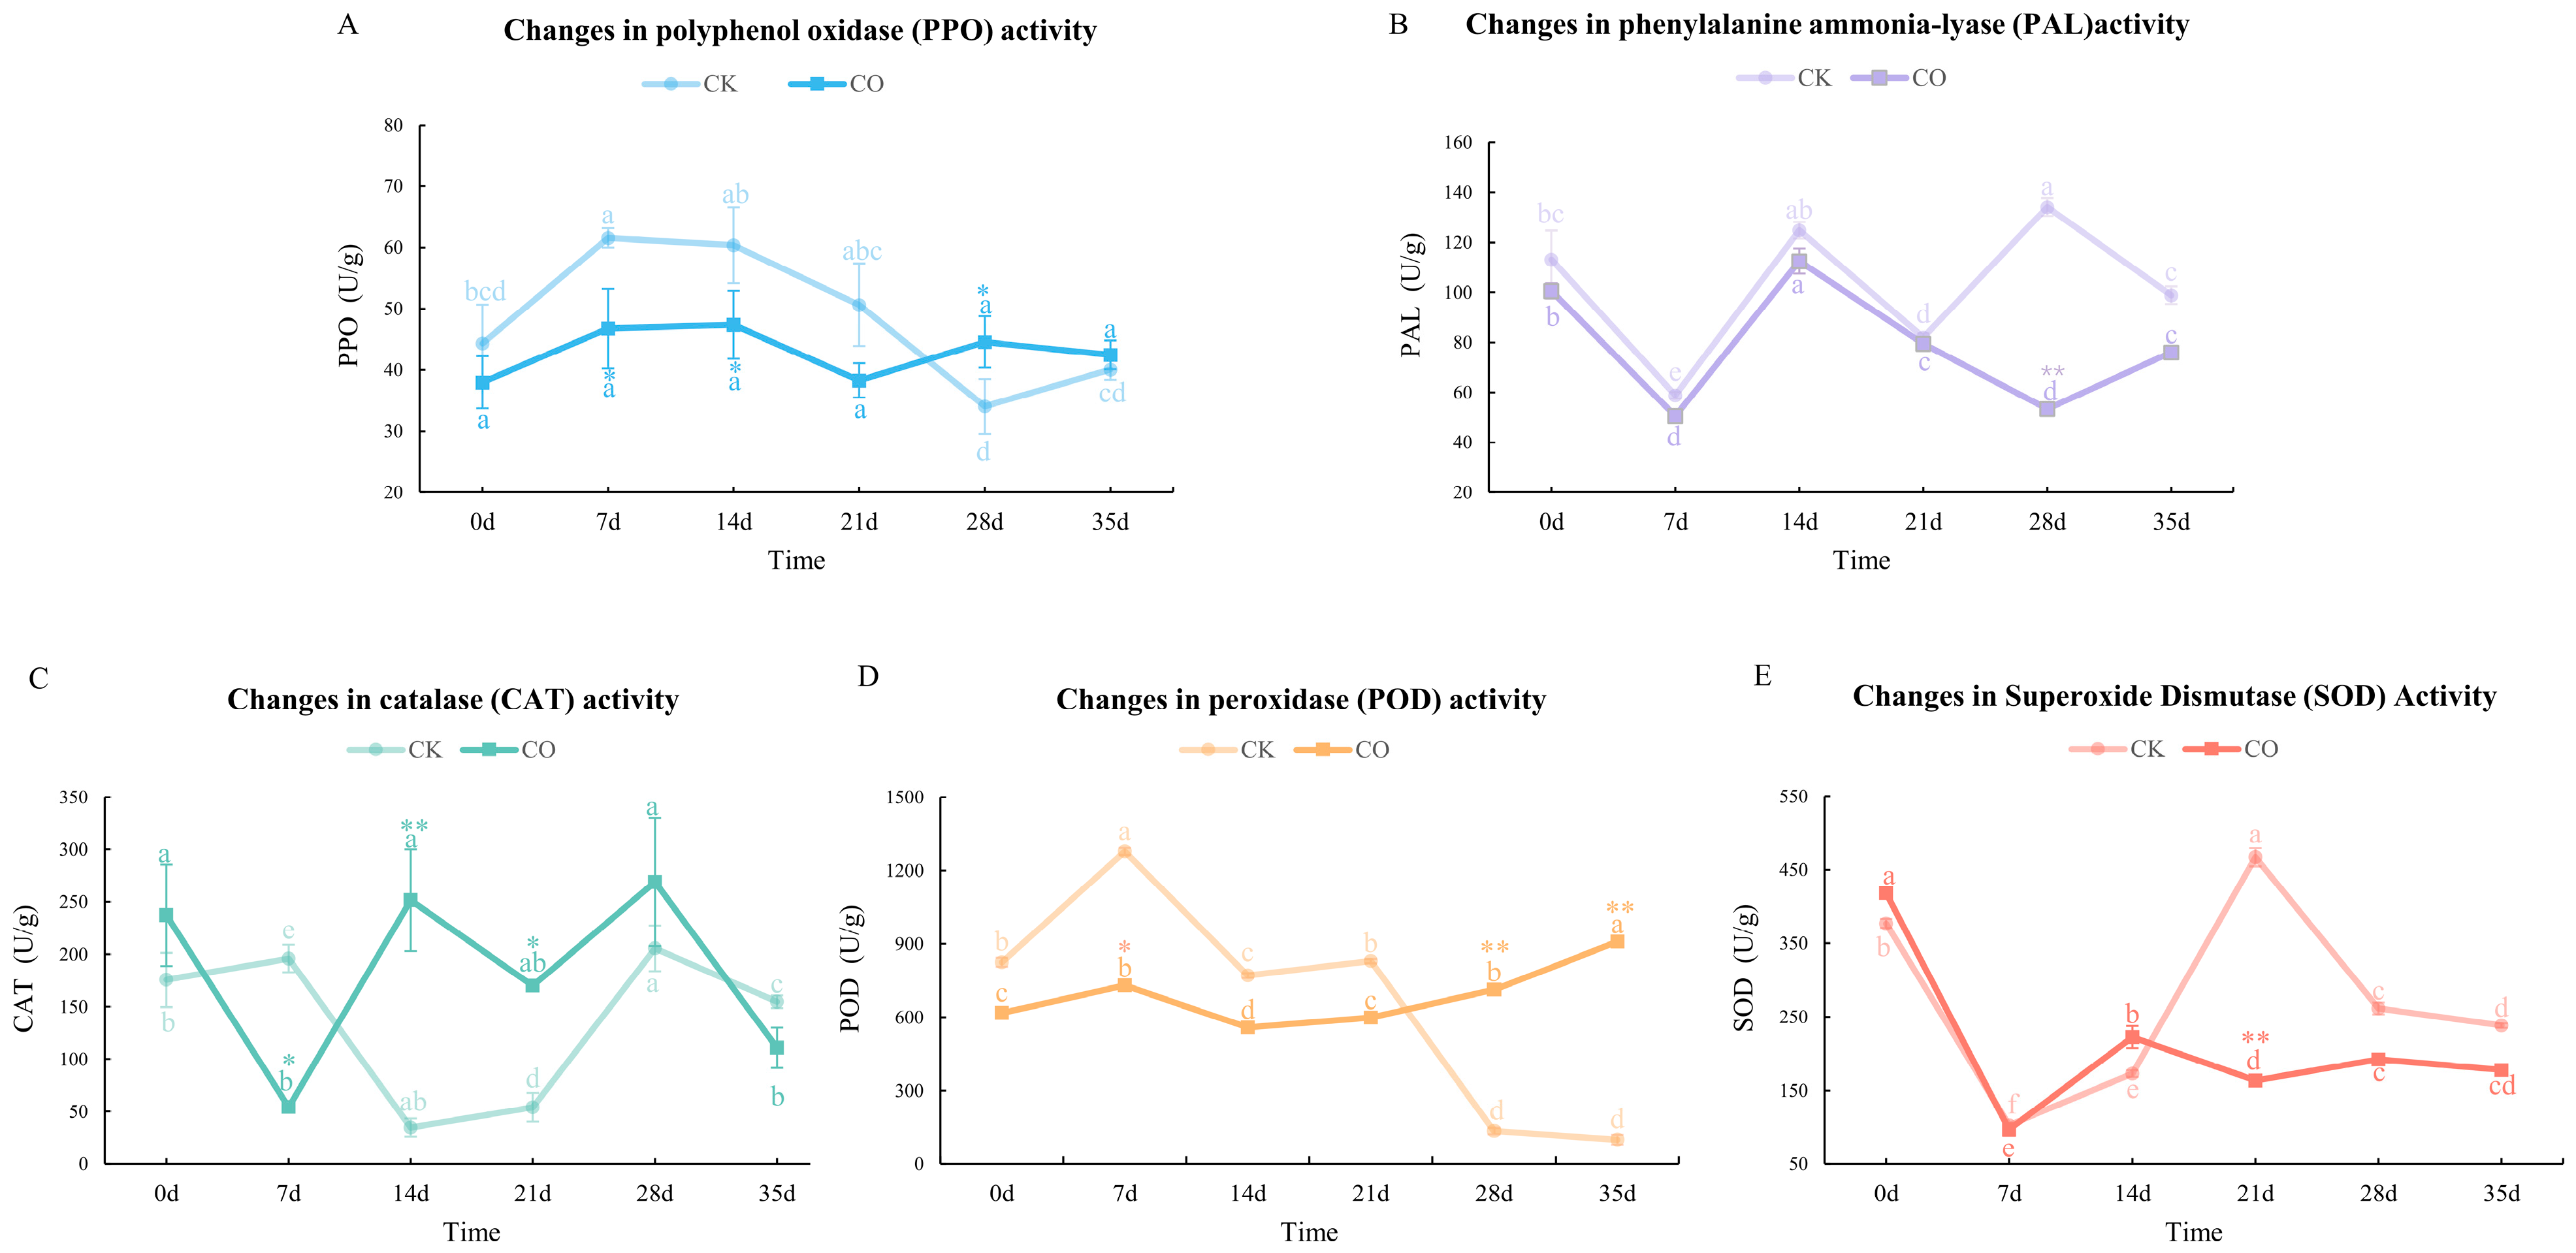
This study further investigated the dynamic changes in the activities of five key enzymes. As shown in Figure 1A, PPO activity exhibited a biphasic pattern of initial inhibition followed by promotion after grafting. From 7 to 21 days post-grafting (d), PPO activity in the CO group was consistently and significantly lower than that in the CK group (p < 0.05). However, during the middle-to-late stages of healing (28 and 35 d), PPO activity in the CO group was significantly higher than that in the CK group (p < 0.001). In contrast to PPO, PAL activity was continuously inhibited throughout the observation period (Figure 1B). Starting at 7 d, PAL activity in the CO group was significantly lower than that in the CK group (p < 0.05), and this inhibitory effect was further enhanced at 28 and 35 d (p < 0.001). The variation in POD activity followed a trend similar to that of PPO (Figure 1D). During the early stage of grafting (7 d), CO treatment inhibited POD activity; however, during the middle-to-late stages of healing (28–35 d), POD activity in the CO group was significantly upregulated (p < 0.001). The response of CAT activity to CO treatment showed a phased fluctuation (Figure 1C). At 7 d, CAT activity in the CO group was significantly lower than that in the CK group (p < 0.05). From 14 to 28 d, the activity in the CO group became significantly higher than that in the CK group, and by 35 d, the difference between the two groups disappeared. The changes in SOD activity also exhibited temporal specificity (Figure 1E): SOD activity in the CO group was higher than that in the CK group at 14 d, but significantly lower at 21 d.
Figure 1.
Dynamic changes in enzyme activities. (A) Polyphenol oxidase (PPO) activity; (B) Phenylalanine ammonia-lyase (PAL) activity; (C) Catalase (CAT) activity; (D) Peroxidase (POD) activity; (E) Superoxide dismutase (SOD) activity. CK, homologous grafting group; CO, heterologous grafting group. The x-axis represents storage time (0, 7, 14, 21, 28, 35 d), and the y-axis indicates enzyme activity (U g−1). Different lowercase letters above data points denote significant differences at p < 0.05 among sampling times within the same group; Single asterisk (*) indicates significant differences (p < 0.05) between CK and CO at the same time point.; double asterisks (**) indicate extremely significant differences (p < 0.01) between CK and CO at the same time point. Vertical bars represent the standard error of the mean (SEM).
In summary, the activities of enzymes related to antioxidant defense and phenylpropanoid metabolism were generally higher in the CO group. Specifically, PPO, POD, and CAT activities were markedly activated during the middle-to-late stages of healing, PAL activity was continuously inhibited, and SOD activity displayed phased fluctuations. These temporal differential patterns of enzyme activities systematically reflect the dynamic physiological adaptation process of the rootstock in response to the heterologous scion.
3.2. Dynamic Changes in Endogenous Hormone Contents at the Graft Junction During the Graft Healing Process
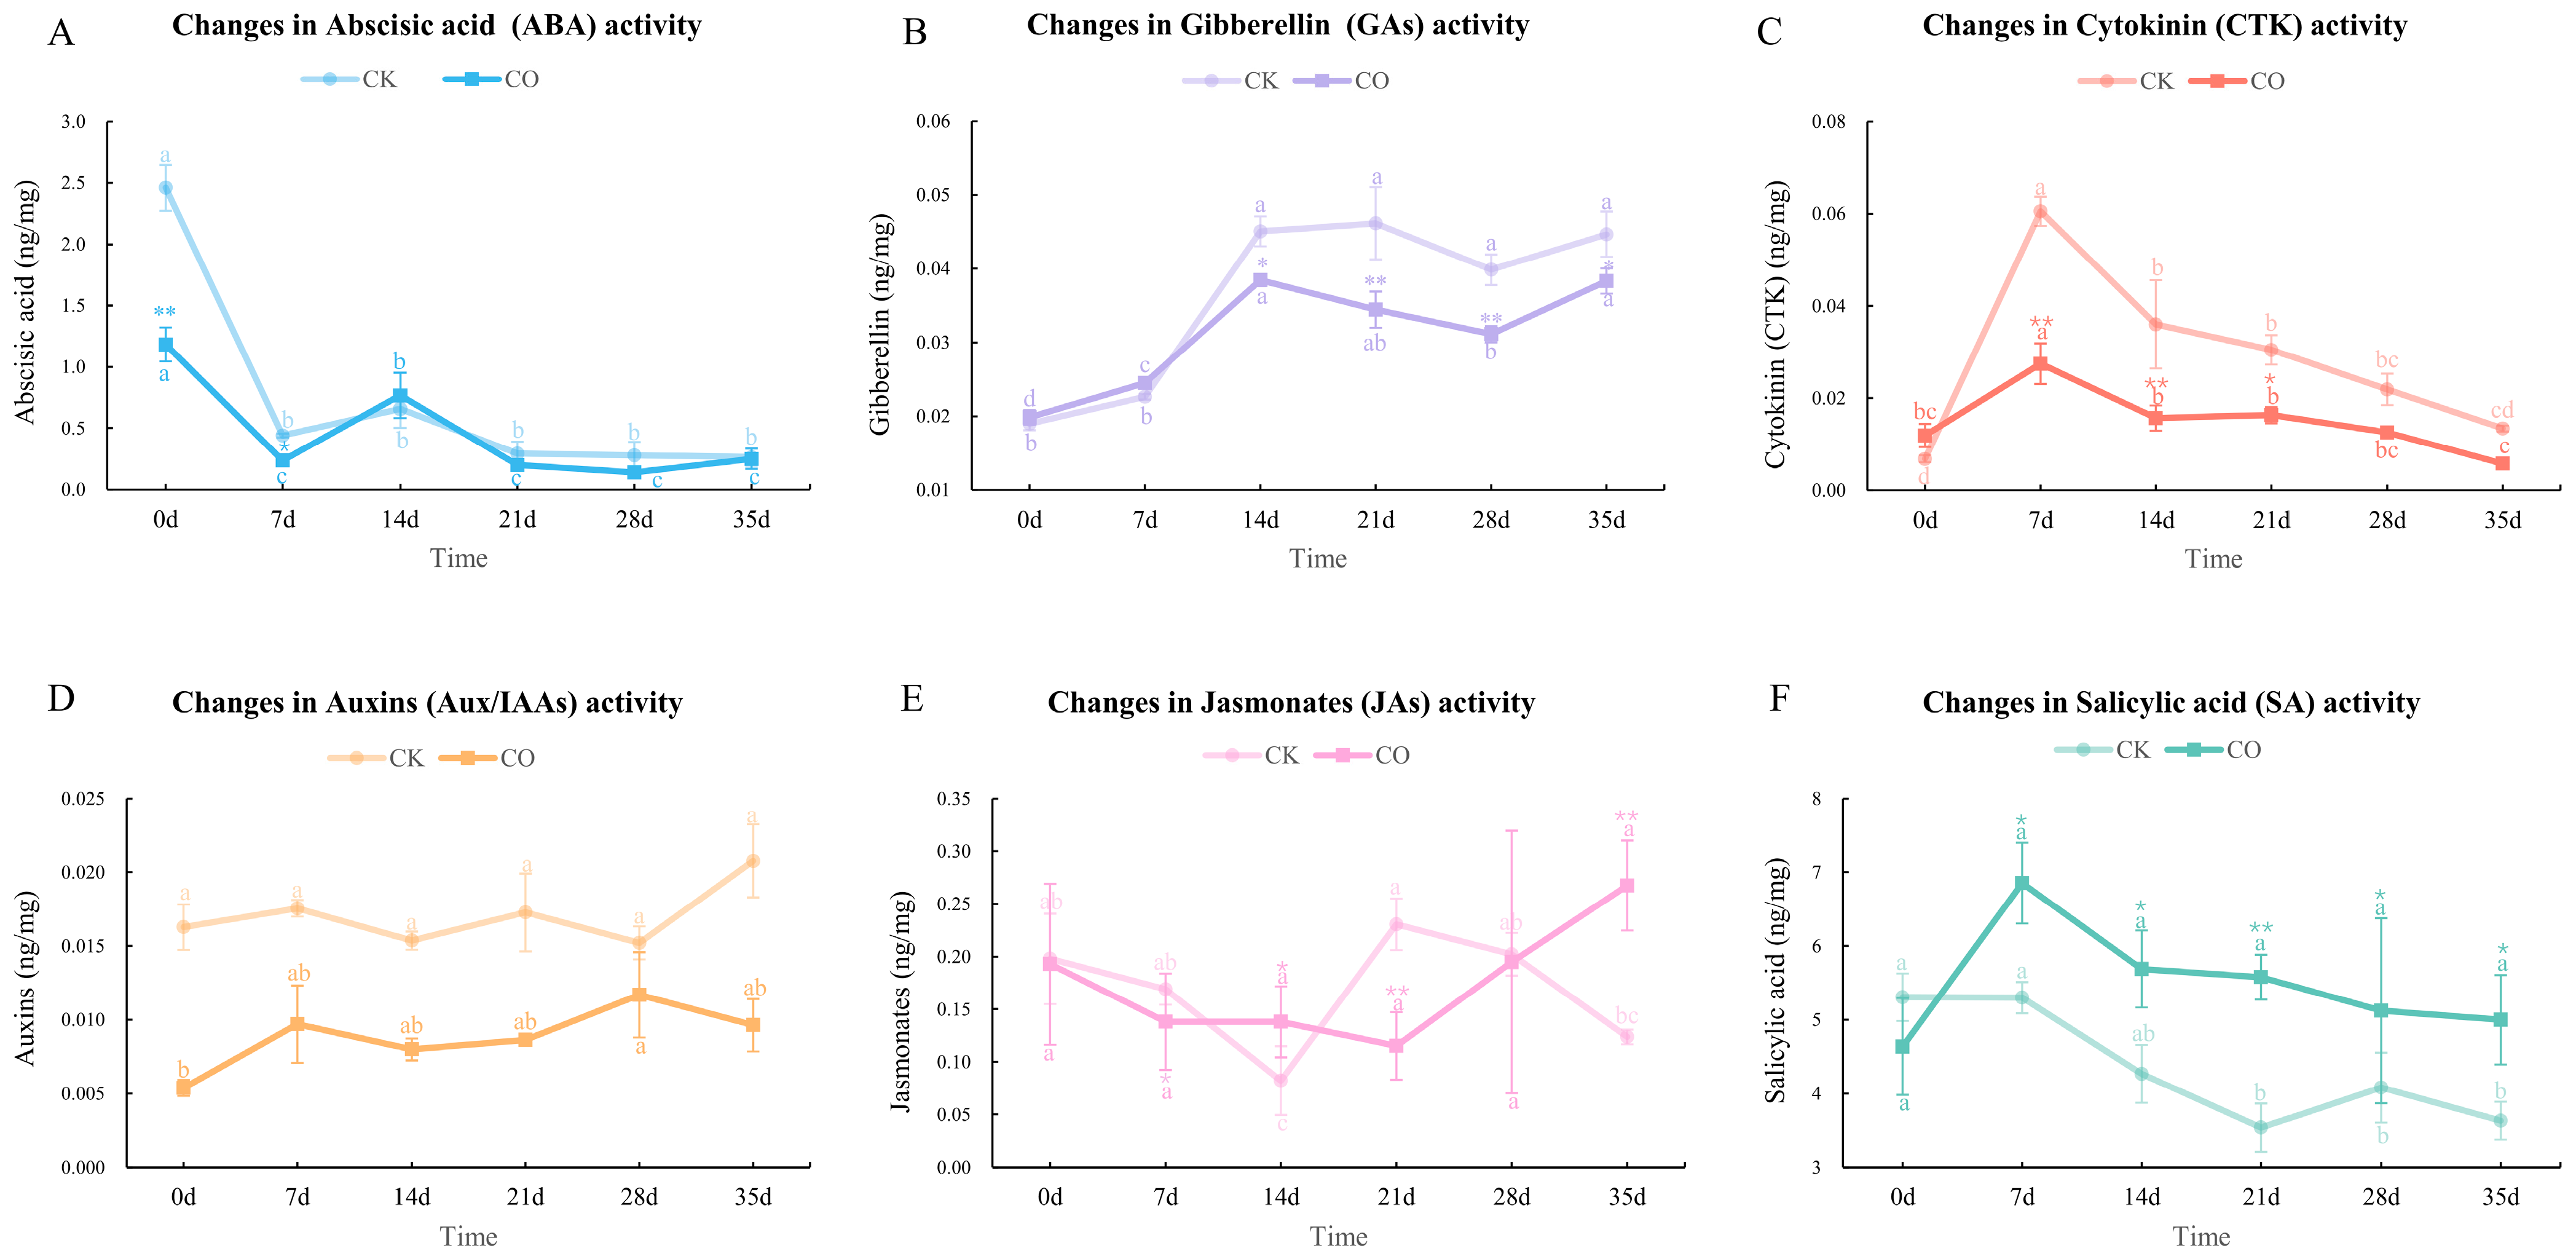
On the day of grafting (0 d), abscisic acid (ABA) contents in the scions of both the homologous graft (CK) and heterologous graft (CO) were relatively high (Figure 2A). Notably, the CK group (2.461 ng/mg) was significantly higher than the CO group (1.183 ng/mg), indicating that the initial stress response induced by the grafting procedure varied depending on the grafting combination. Subsequently, ABA contents in both groups declined continuously and converged after 21 d, maintaining a low range of 0.26–0.66 ng/mg, which suggests a gradual restoration of physiological stability at the graft junction.
Figure 2.
Dynamic variations in endogenous abscisic acid (ABA, (A)), gibberellins (GAs, (B)), cytokinin (CTK, (C)), auxins (Aux/IAAs, (D)), jasmonates (JAs, (E)), and salicylic acid (SA, (F)) contents under CK (homologous grafting) and CO heterologous grafting during 35 days of storage. All values are presented as means ± SEM. Lowercase letters mark significant differences at p < 0.05 within a single treatment across time points; * denotes significant differences (p < 0.05) between CK and CO at the same time point.; ** denotes an extremely significant difference (p < 0.01) between the two groups at the same sampling day.
Regarding growth-promoting hormones, gibberellins (GAs) in the CK group increased continuously post-grafting, remaining at a high level (0.045–0.047 ng/mg) from 14 d to 35 d. In contrast, the overall GA content in the CO group was lower, peaking at 14 d (0.0385 ng/mg) before declining significantly (Figure 2B). For cytokinins (CTK), the CK group exhibited a distinct peak at 7 d (0.0605 ng/mg). Conversely, the CO group maintained a lower overall CTK level, with a smaller peak amplitude that occurred earlier (0.0275 ng/mg) (Figure 2C). Auxin/indole-3-acetic acid (Aux/IAA) levels in the CK group remained consistently high and stable (0.015–0.021 ng/mg). In the CO group, however, Aux/IAA levels were highly significantly lower than those in the CK group at all measured time points, accounting for only 33%–66% of the CK levels (Figure 2D). These results indicate that heterologous grafting significantly inhibits the accumulation of hormones associated with cell elongation, division, and growth signaling at the graft junction.
In terms of defense-related hormones, jasmonates (JAs) in the CK group fluctuated and reached a peak at 21 d (0.231 ng/mg). In the CO group, JA content increased significantly during the late stage of healing (35 d) to 0.267 ng/mg, surpassing the CK group (0.124 ng/mg) during the same period (Figure 2E). Salicylic acid (SA) in the CK group gradually decreased post-grafting, whereas it remained at a high level throughout the observation period in the CO group. Particularly from 7 d to 21 d, SA levels in the CO group were significantly higher than those in the CK group (Figure 2F), suggesting that heterologous grafting may induce a more sustained activation of systemic defense signaling.
In summary, compared to the CK group, the levels of GAs, CTK, and Aux/IAA at the graft junction in the CO group were significantly reduced, while JAs and SA remained at elevated levels during the late stage of healing. These differences may collectively regulate the healing process at the graft interface and the early growth trend of the scion, providing crucial physiological evidence for further elucidating the healing mechanisms at the metabolomic level in subsequent studies.
3.3. Multivariate Statistical Analysis of Metabolomics
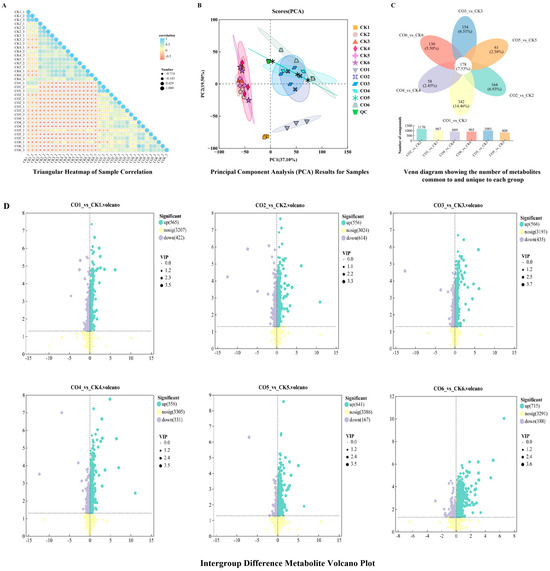
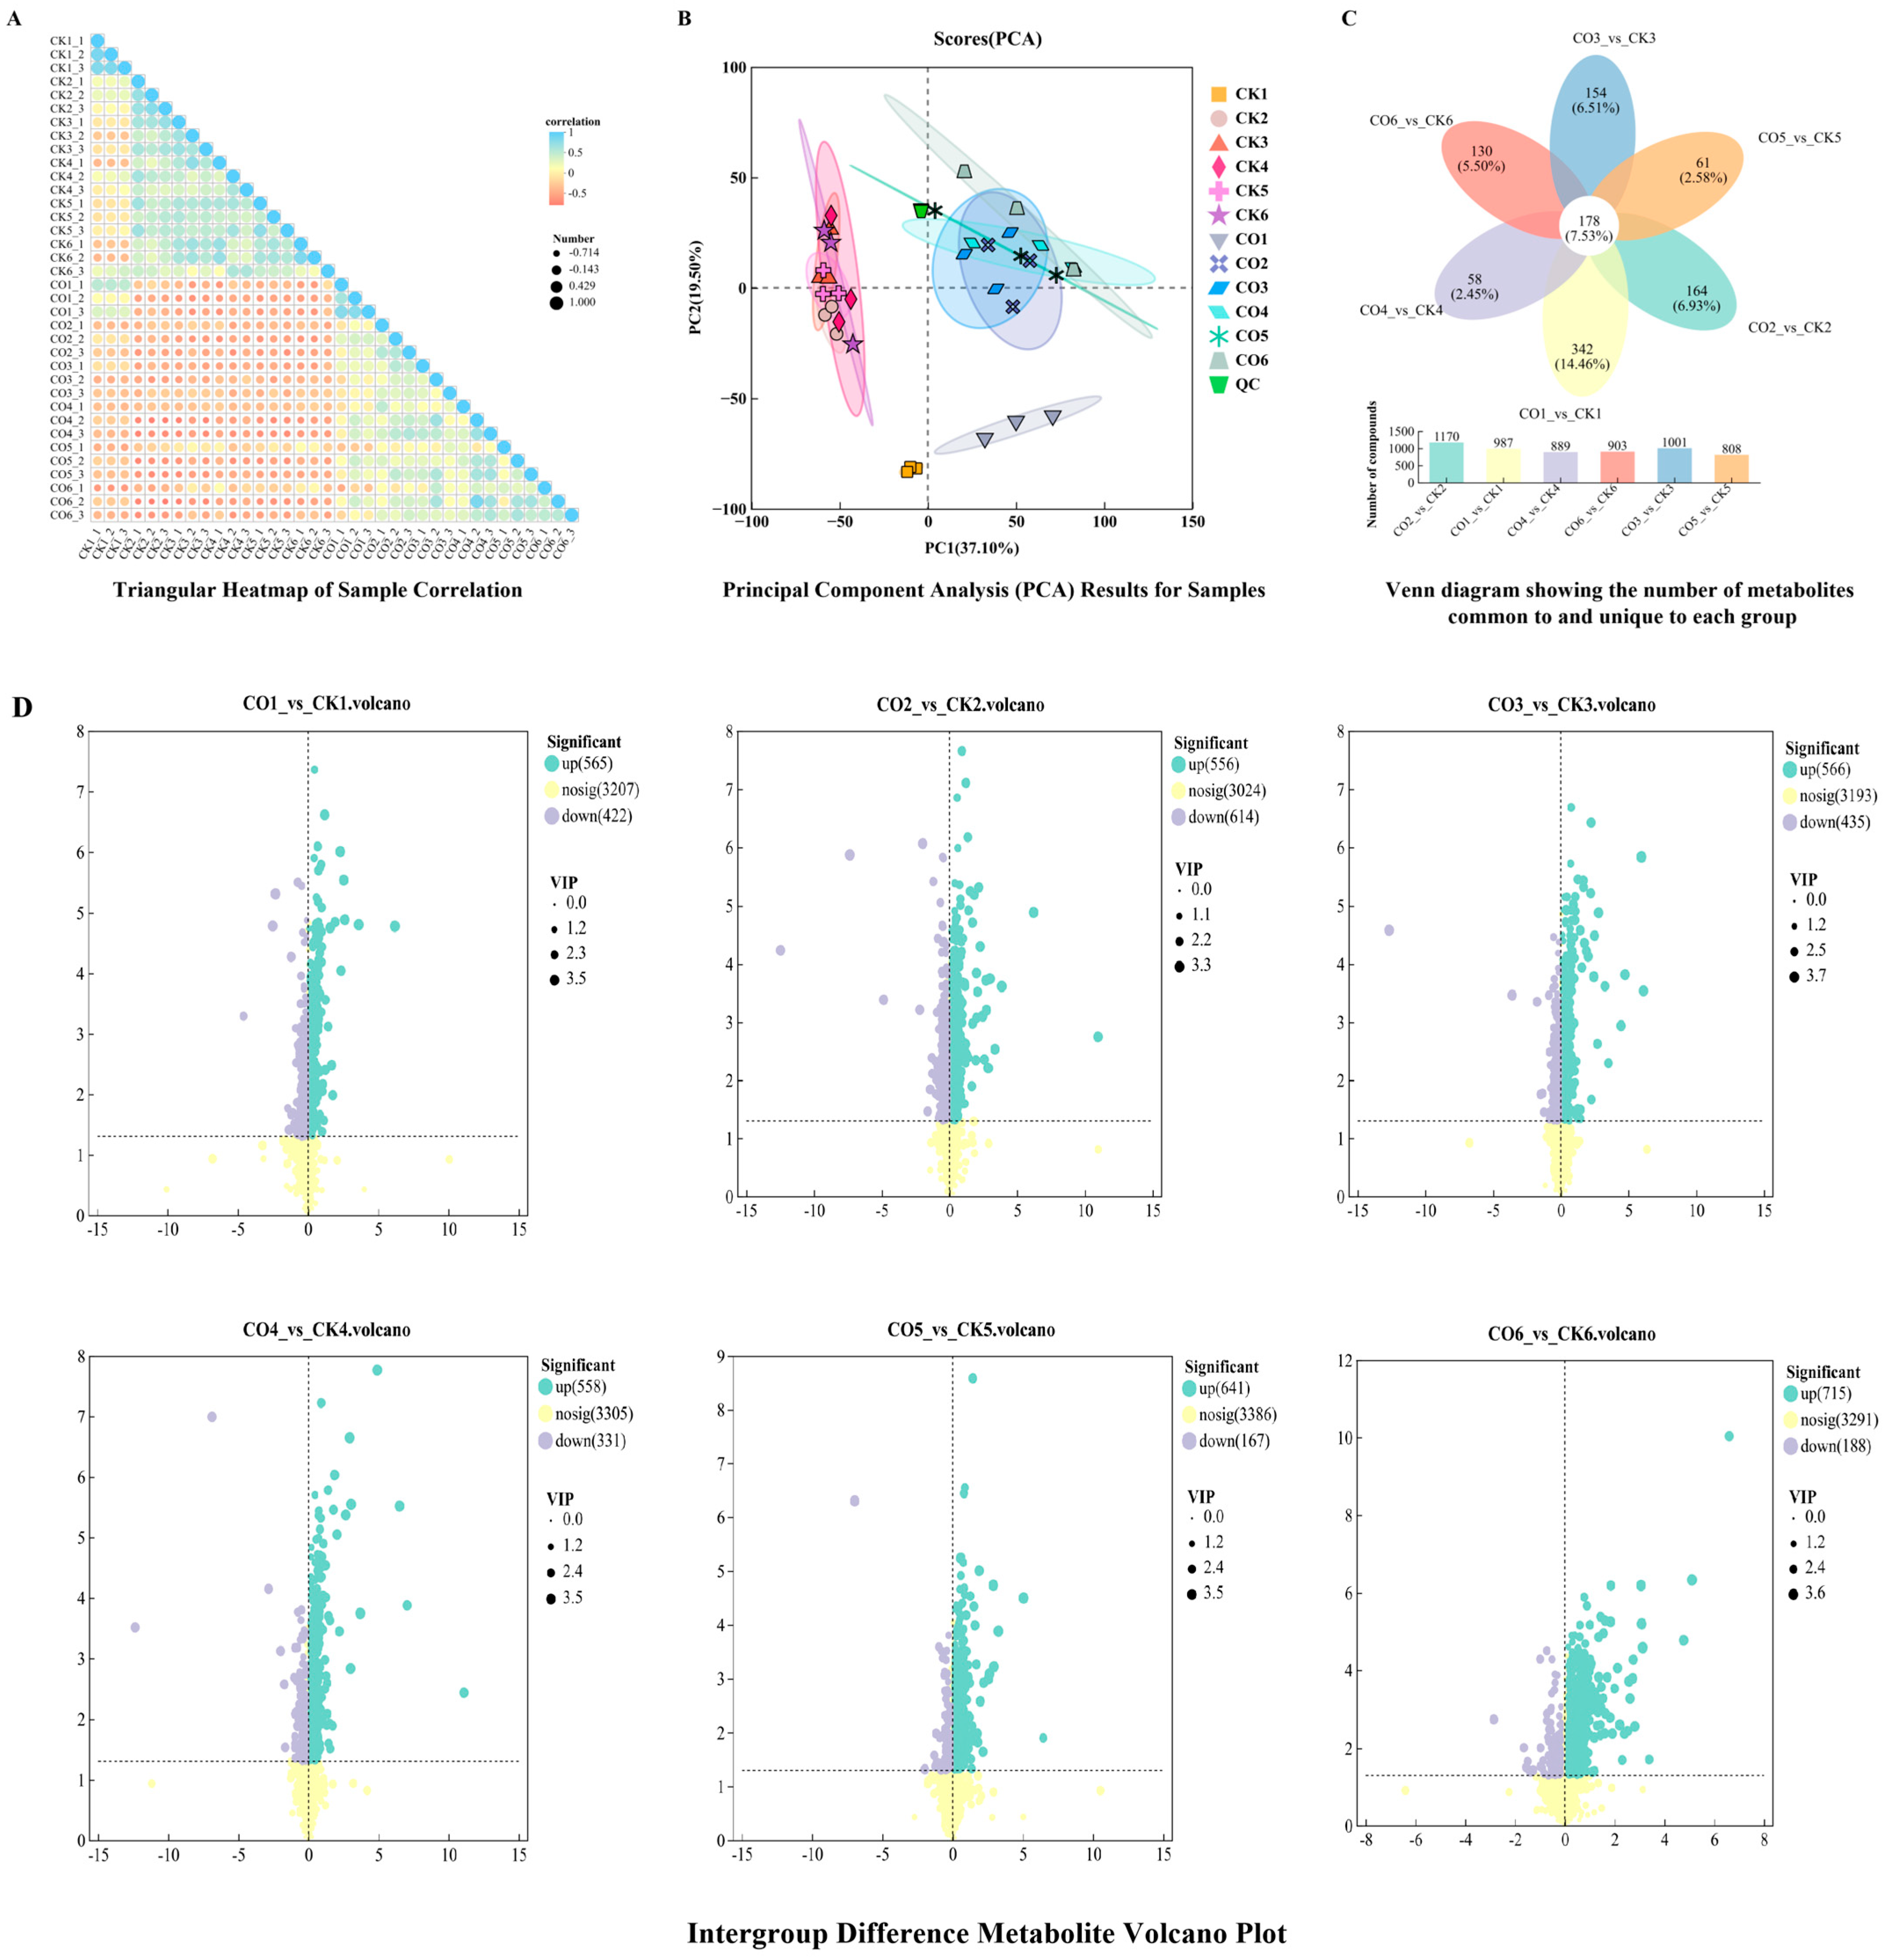
In this study, correlation heatmaps and principal component analysis (PCA) were performed on the samples, which encompassed six specific sampling time points (0, 7, 14, 21, 28, and 35 days post-grafting) for both the CK and CO treatment groups. As shown in Figure 3A, the biological replicates within each sample group (i.e., each treatment–time combination, which also represents a specific sampling time point) exhibited high similarity, with correlation coefficients generally exceeding 0.8, indicating good experimental reproducibility. PCA incorporating quality control (QC) samples was used to verify analytical stability and grouping trends. As illustrated in Figure 3B, the samples from the CK and CO groups were clearly separated along the first principal component (PC1), indicating systematic metabolic differences between the two grafting treatments. The variance contributions of PC1 and PC2 were 37.10% and 19.50%, respectively, cumulatively explaining 56.60% of the total variance. The tight clustering of samples within each group at each corresponding time point, along with the concentrated distribution of QC samples, confirmed the stability of the experimental process and the reliability of the data quality, thereby validating the suitability of the dataset for subsequent differential analysis.
Figure 3.
Multivariate statistical analysis of metabolomics profiles. (A) Triangular sample correlation heatmap colored by Pearson correlation coefficients, with dot size indicating correlation strength. (B) PCA score plot of CK, CO and QC samples; PC1 and PC2 account for 37.10% and 19.50% of total variation, ellipses represent 95% confidence intervals. (C) Venn diagram showing shared and unique DAMs across six CO vs. CK pairwise comparisons, with metabolite counts and corresponding percentages labelled in each partition; the bar graph underneath summarizes total DAMs per comparison. (D) Volcano plots of DAMs for six time-point pairwise comparisons. X-axis: log2(fold change); Y-axis: −log10(p). Green = significantly upregulated, purple = significantly downregulated, yellow = non-significant metabolites. Dot size corresponds to VIP value.
A total of 2043 and 2145 metabolites were identified in the positive (pos) and negative (neg) ion detection modes, respectively. As shown in Figure 3C, these accounted for 24.09% and 20.56% of the total identified metabolites. Further comparison of the number of differentially abundant metabolites between the CO and CK groups at different time points revealed that, except at day 7, the number of upregulated metabolites in the CO group consistently exceeded that of downregulated metabolites. This disparity significantly widened during the later stages of graft healing (days 28 and 35). Temporally, the number of upregulated metabolites exhibited an overall increasing trend, with a particularly significant surge after day 28. Conversely, the number of downregulated metabolites followed a trend of initial increase followed by a decrease, peaking at day 7 before gradually declining, and showing a slight rebound by day 35 (Figure 3D). These dynamic trends suggest that the metabolic regulation of the CO group during the scion–rootstock healing process is time-dependent and likely involves distinct metabolic regulatory mechanisms.
3.4. HMDB Annotation Analysis of the Metabolome
Following database retrieval and annotation, the identified metabolites were classified into different chemical taxonomies. Based on phytochemical classification, the metabolites primarily comprised primary metabolites (937, 22.34%), secondary metabolites (1998, 47.64%), and other metabolites (1259, 30.02%).
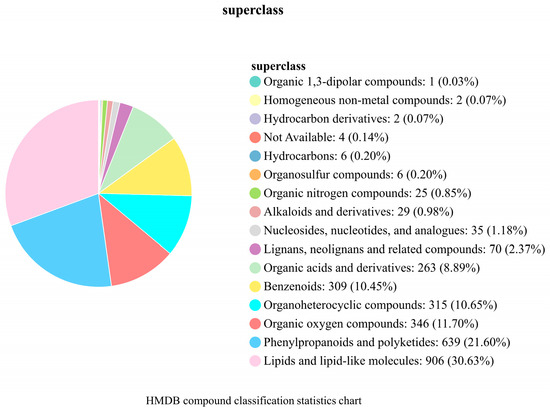
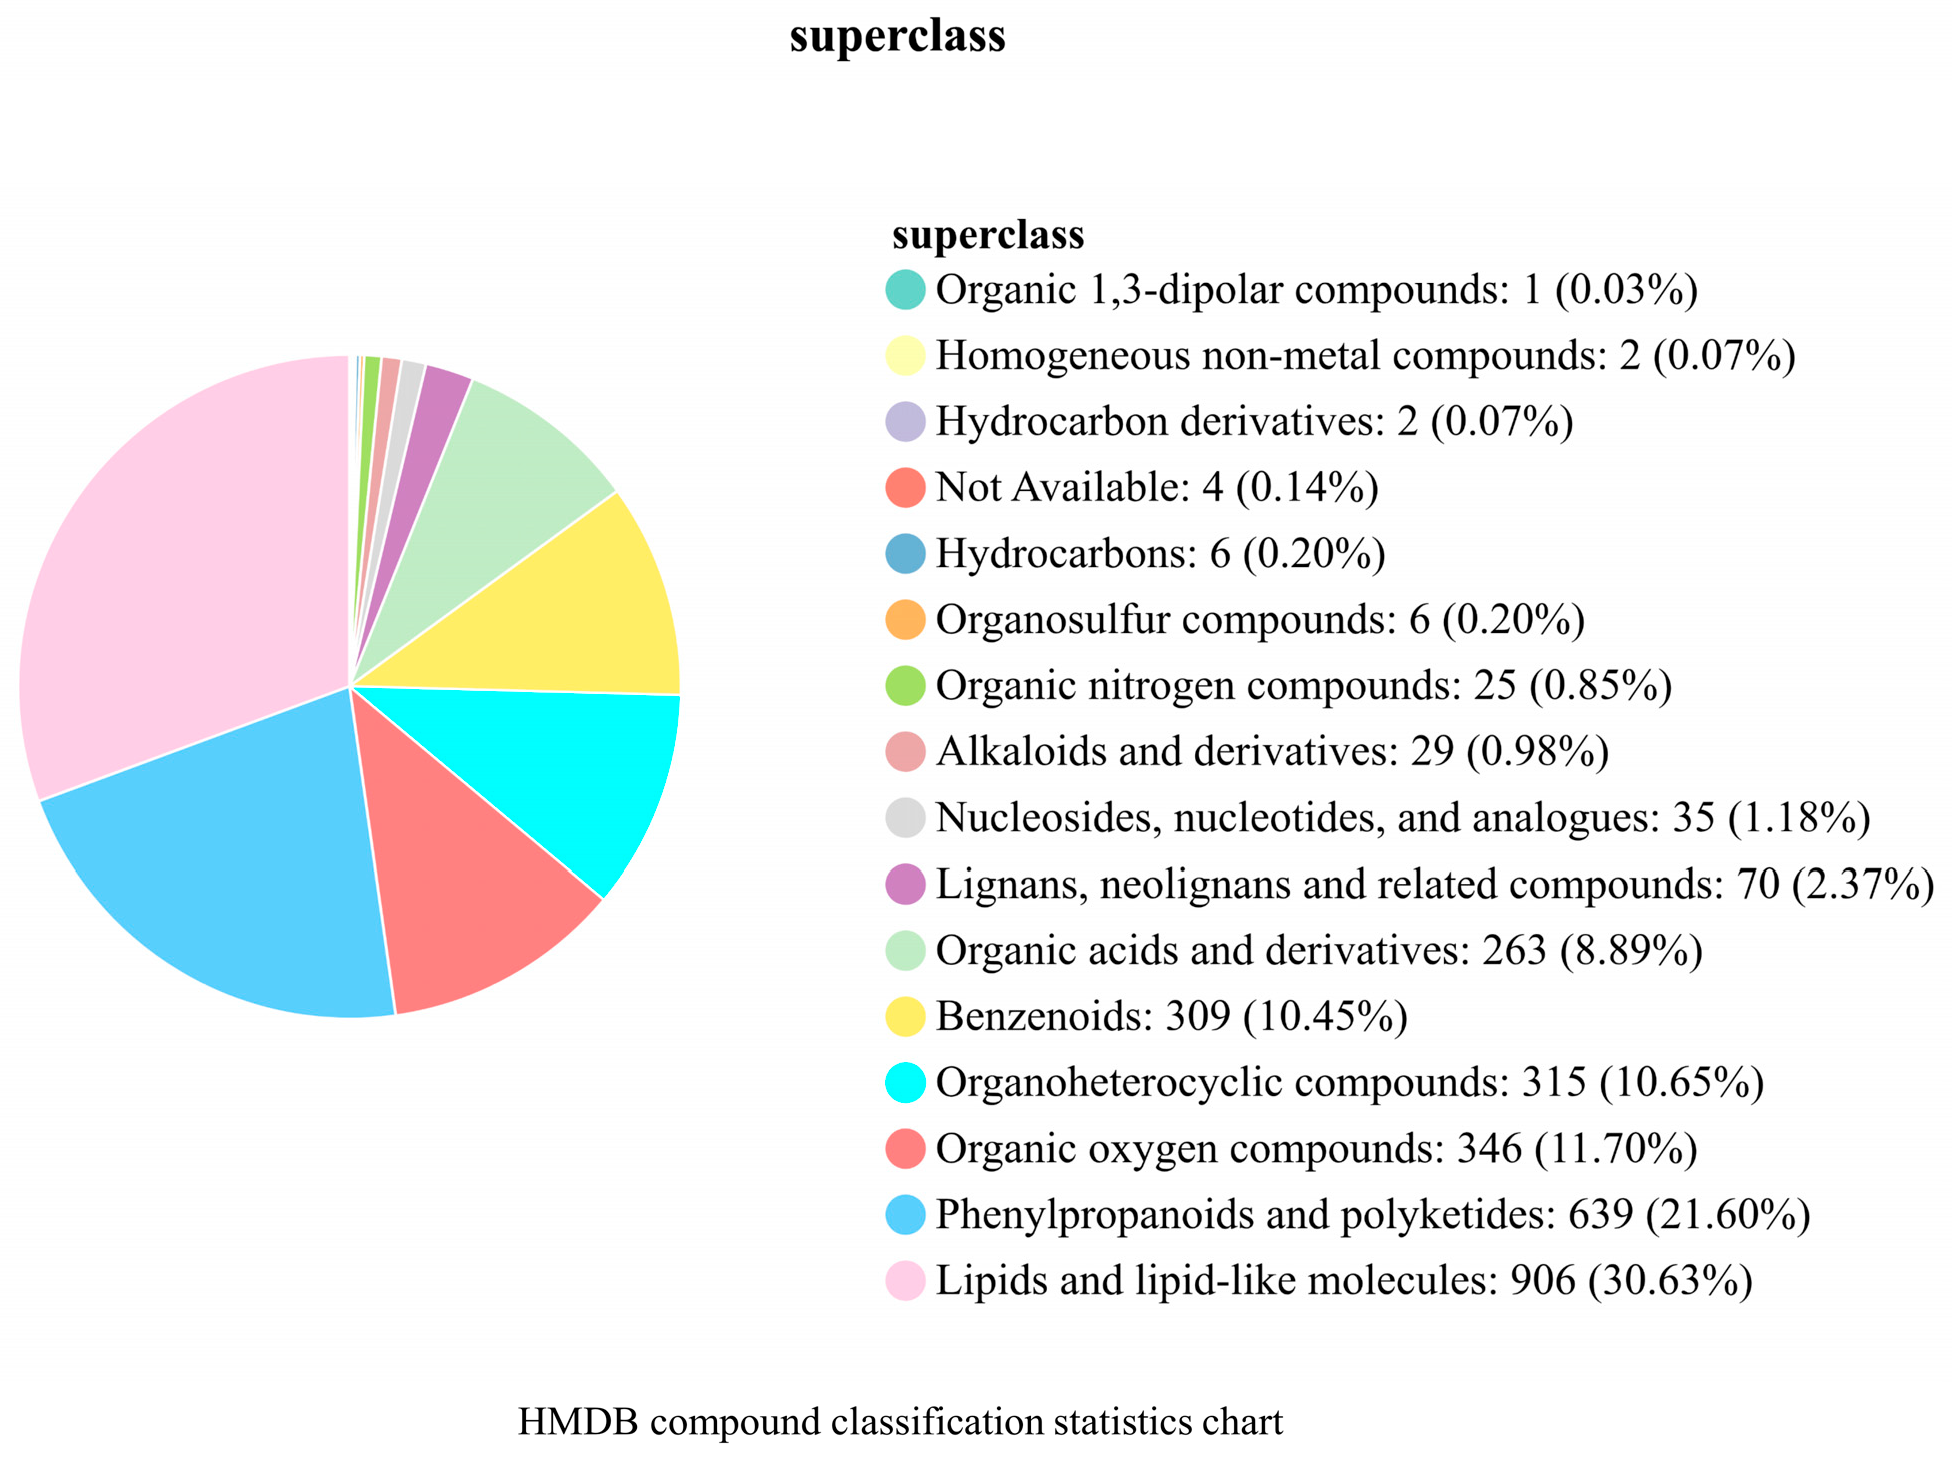
Further super-class annotation was performed using the Human Metabolome Database (HMDB) (Figure 4), successfully annotating 2958 metabolites across 18 super-classes. The predominant categories included lipids and lipid-like molecules (906, 30.63%), phenylpropanoids and polyketides (639, 21.60%), organic oxygen compounds (346, 11.70%), organic heterocyclic compounds (315, 10.65%), benzenoids (309, 10.45%), and organic acids and their derivatives (263, 8.89%). Together, these six super-classes accounted for over 90% of the total. Other categories, such as lignans, neolignans, and related compounds (70, 2.37%), nucleosides, nucleotides, and analogues (35, 1.18%), and alkaloids and their derivatives (29, 0.98%), constituted relatively minor proportions. A small number of metabolites were assigned to super-classes including organic nitrogen compounds, organic sulfur compounds, and hydrocarbons.
Figure 4.
HMDB compound classification statistics chart.
These results indicate that the metabolome is predominantly composed of secondary metabolites, with chemical types highly concentrated in lipids, phenylpropanoids and polyketides, and organic oxygen- and heterocyclic-containing compounds. This provides a foundational chemical structural basis for subsequent functional and pathway analyses of differentially abundant metabolites.
3.5. Analysis of Significantly Changed Metabolites
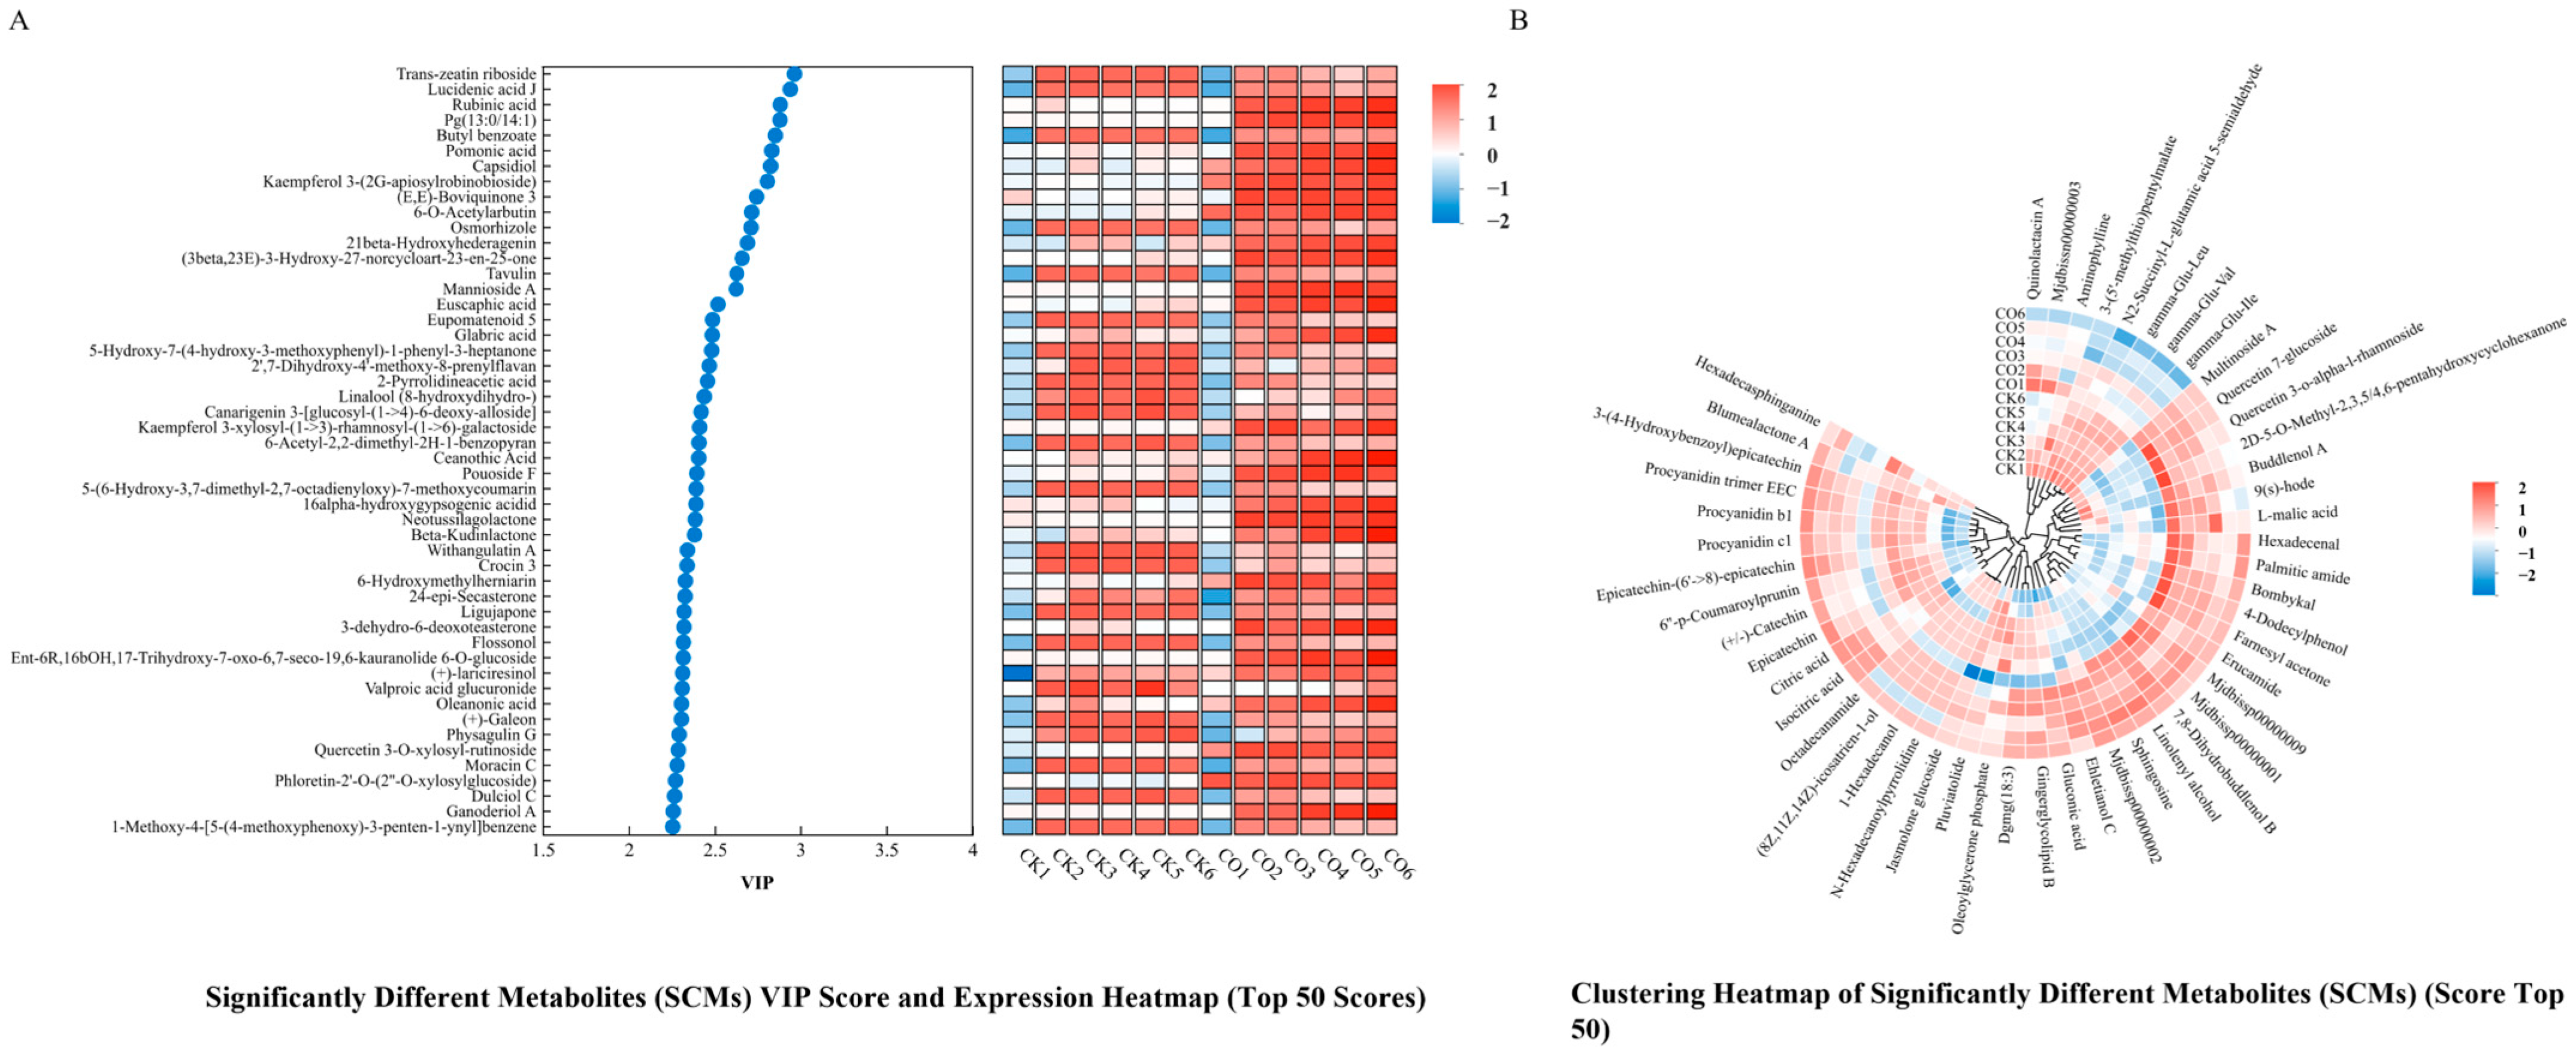
Based on stringent screening thresholds (VIP > 1, p < 0.05, FDR < 0.05, and |log2FC| ≥ 1), a total of 107 to 190 significantly changed metabolites (SCMs) were identified between the CK and CO groups across six time points, yielding a cumulative total of 397 SCMs (detailed in Table 1). The number of upregulated metabolites was significantly higher than that of downregulated metabolites at each time point. Particularly during the late stage of healing, this ratio was severely unbalanced (Day 28: 89 vs. 18; Day 35: 147 vs. 13), reflecting the metabolic remodeling characteristics induced by heterologous grafting. By combining fold change with the weighted score of the Variable Importance in Projection (VIP) (for calculation details, see Section 2.5), the top 50 signature metabolites were further selected from the strictly screened SCMs for subsequent analysis. The VIP values of these signature metabolites ranged from 1.63 to 2.97 (p ≤ 0.014), indicating their critical role in distinguishing between the two groups and suggesting their potential responses to key physiological changes during the grafting process.
Table 1.
Strict SCM counts per time point.
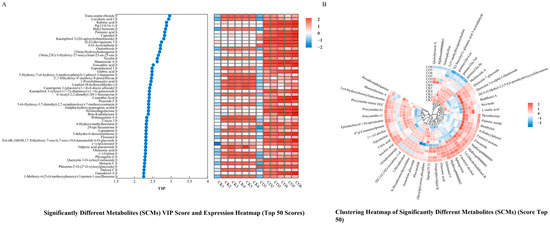
As shown in Figure 5A,B, the 50 signature SCMs comprised 41 upregulated and 9 downregulated metabolites. The upregulated metabolites clustered into a single group, with the phytoalexin capsidiol exhibiting the highest VIP value, and the coumarin compound 6-hydroxymethylherniarin displaying the highest upregulation fold change. The downregulated metabolites were further divided into two sub-clusters. The first sub-cluster consisted of five metabolites, represented by 4′-hydroxyacetophenone derivatives. Except for α-hydrojuglone-4-glucoside and L-γ-glutamyl-β-phenyl-β-L-alanine, which were slightly upregulated on days 28 and 14 post-grafting, respectively, this sub-cluster generally showed an increasingly downregulated trend as the graft healing progressed. The second sub-cluster, represented by 2-pyrrolidineacetic acid, was slightly upregulated in the early stage of grafting before returning to a downregulated state. Among the downregulated metabolites, the cytokinin trans-zeatin riboside exhibited the highest VIP value, while L-γ-glutamyl-β-phenyl-β-L-alanine displayed the highest downregulation fold change.
Figure 5.
Characterization of the top 50 significantly changed metabolites (SCMs). (A) VIP score scatter plot paired with expression heatmap for top 50 SCMs sorted by VIP values. X-axis: VIP score; heatmap color scale reflects normalized metabolite abundance (blue = low, red = high) across CK and CO samples at six time points. (B) Circular clustering heatmap of the top 50 SCMs, illustrating abundance patterns of metabolites in all sample groups based on normalized signal intensities.
3.6. Temporal Clustering of Differentially Abundant Metabolites (Mfuzz)
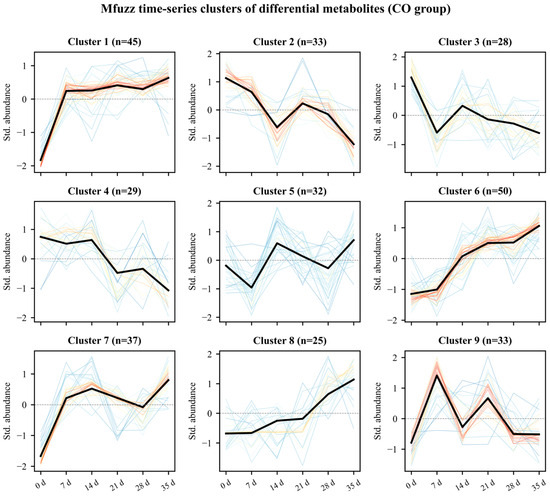
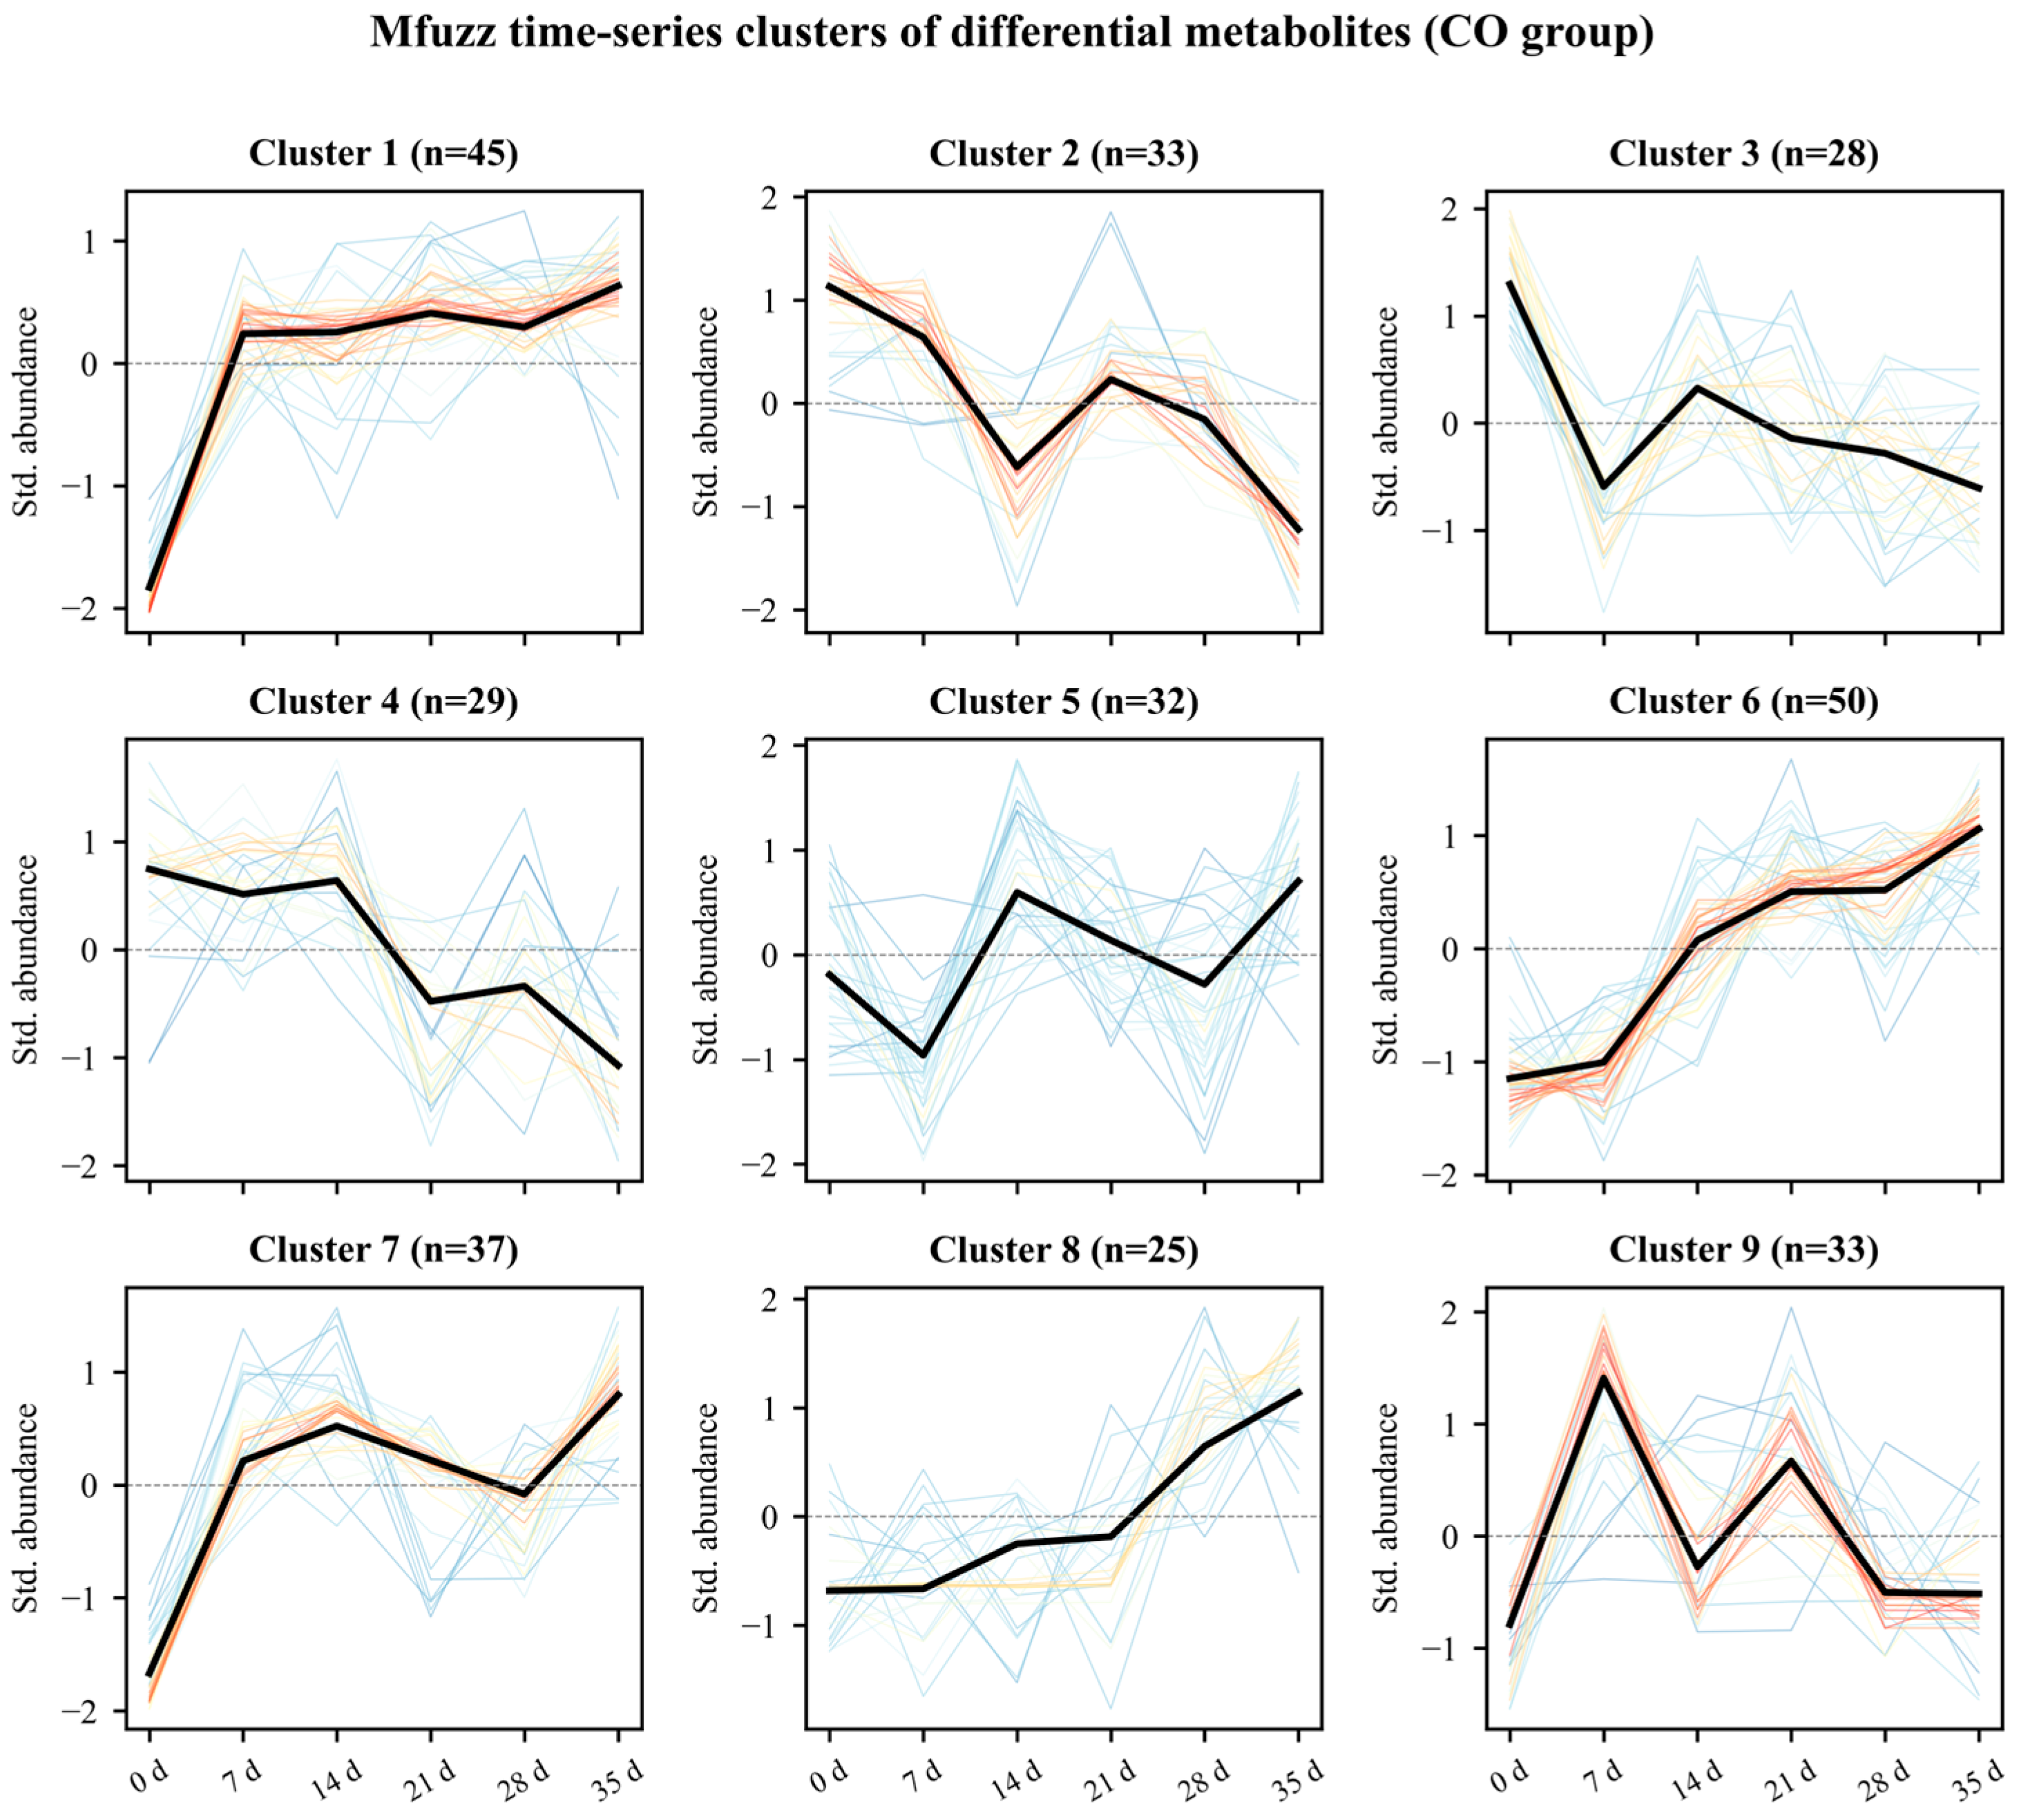
Using the union of strictly screened SCMs across the six time points (397 in total) as input, a fuzzy C-means clustering (Mfuzz) was performed on the mean abundance matrix of metabolites in the CO group at each time point (see Section 2.6 for methods). A total of 312 metabolites were assigned to the clustering analysis and categorized into nine dynamic pattern clusters (Figure 6). Each cluster represents a typical temporal pattern of metabolite variation during the healing process. Based on the Mfuzz centroid curves, the nine clusters can be classified into three major categories:
Figure 6.
Mfuzz time-series clustering of differentially accumulated metabolites (DAMs) from the CO group. Nine expression clusters were classified according to standardized metabolite abundance at 0–35 d storage. Each panel shows one cluster, with metabolite counts (n) noted in the cluster title. Faint colored lines represent single-metabolite trends, while bold black lines indicate the mean abundance pattern of each cluster. The y-axis shows standardized abundance, and the dashed line at y = 0 represents the baseline expression.
(i) Continuous increase: Clusters 1 (n = 45), 5 (n = 32), 6 (n = 50), 7 (n = 37), and 8 (n = 25). The metabolites in these five clusters exhibited low standardized abundances on the day of grafting (0 d), gradually increased throughout the healing process, and reached high levels by day 35. This category comprised 189 metabolites (60.6% of the total clustered metabolites), constituting the main body of metabolite accumulation during the late healing stage in the CO group. (ii) Continuous decrease: Clusters 2 (n = 33), 3 (n = 28), and 4 (n = 29). The metabolites in these three clusters were at high levels in the early stage of grafting (0 d), gradually decreased during the healing process, and reached their lowest levels by day 35. This category included 90 metabolites, reflecting the consumption of certain primary metabolites during the healing process. (iii) Fluctuating pattern: Cluster 9 (n = 33), which exhibited a characteristic transient peak at day 7 followed by fluctuations.
Overall, the “continuous increase” temporal pattern dominated the metabolites in the CO group. This finding corroborates the significant expansion in the number of upregulated metabolites during the late healing stage observed in Section 3.5, further supporting the metabolic remodeling characteristics of heterologous grafting from a temporal dimension.
3.7. KEGG Pathway Annotation and Differential Metabolite Enrichment Analysis
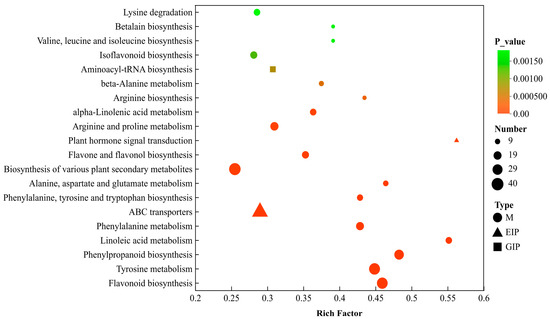
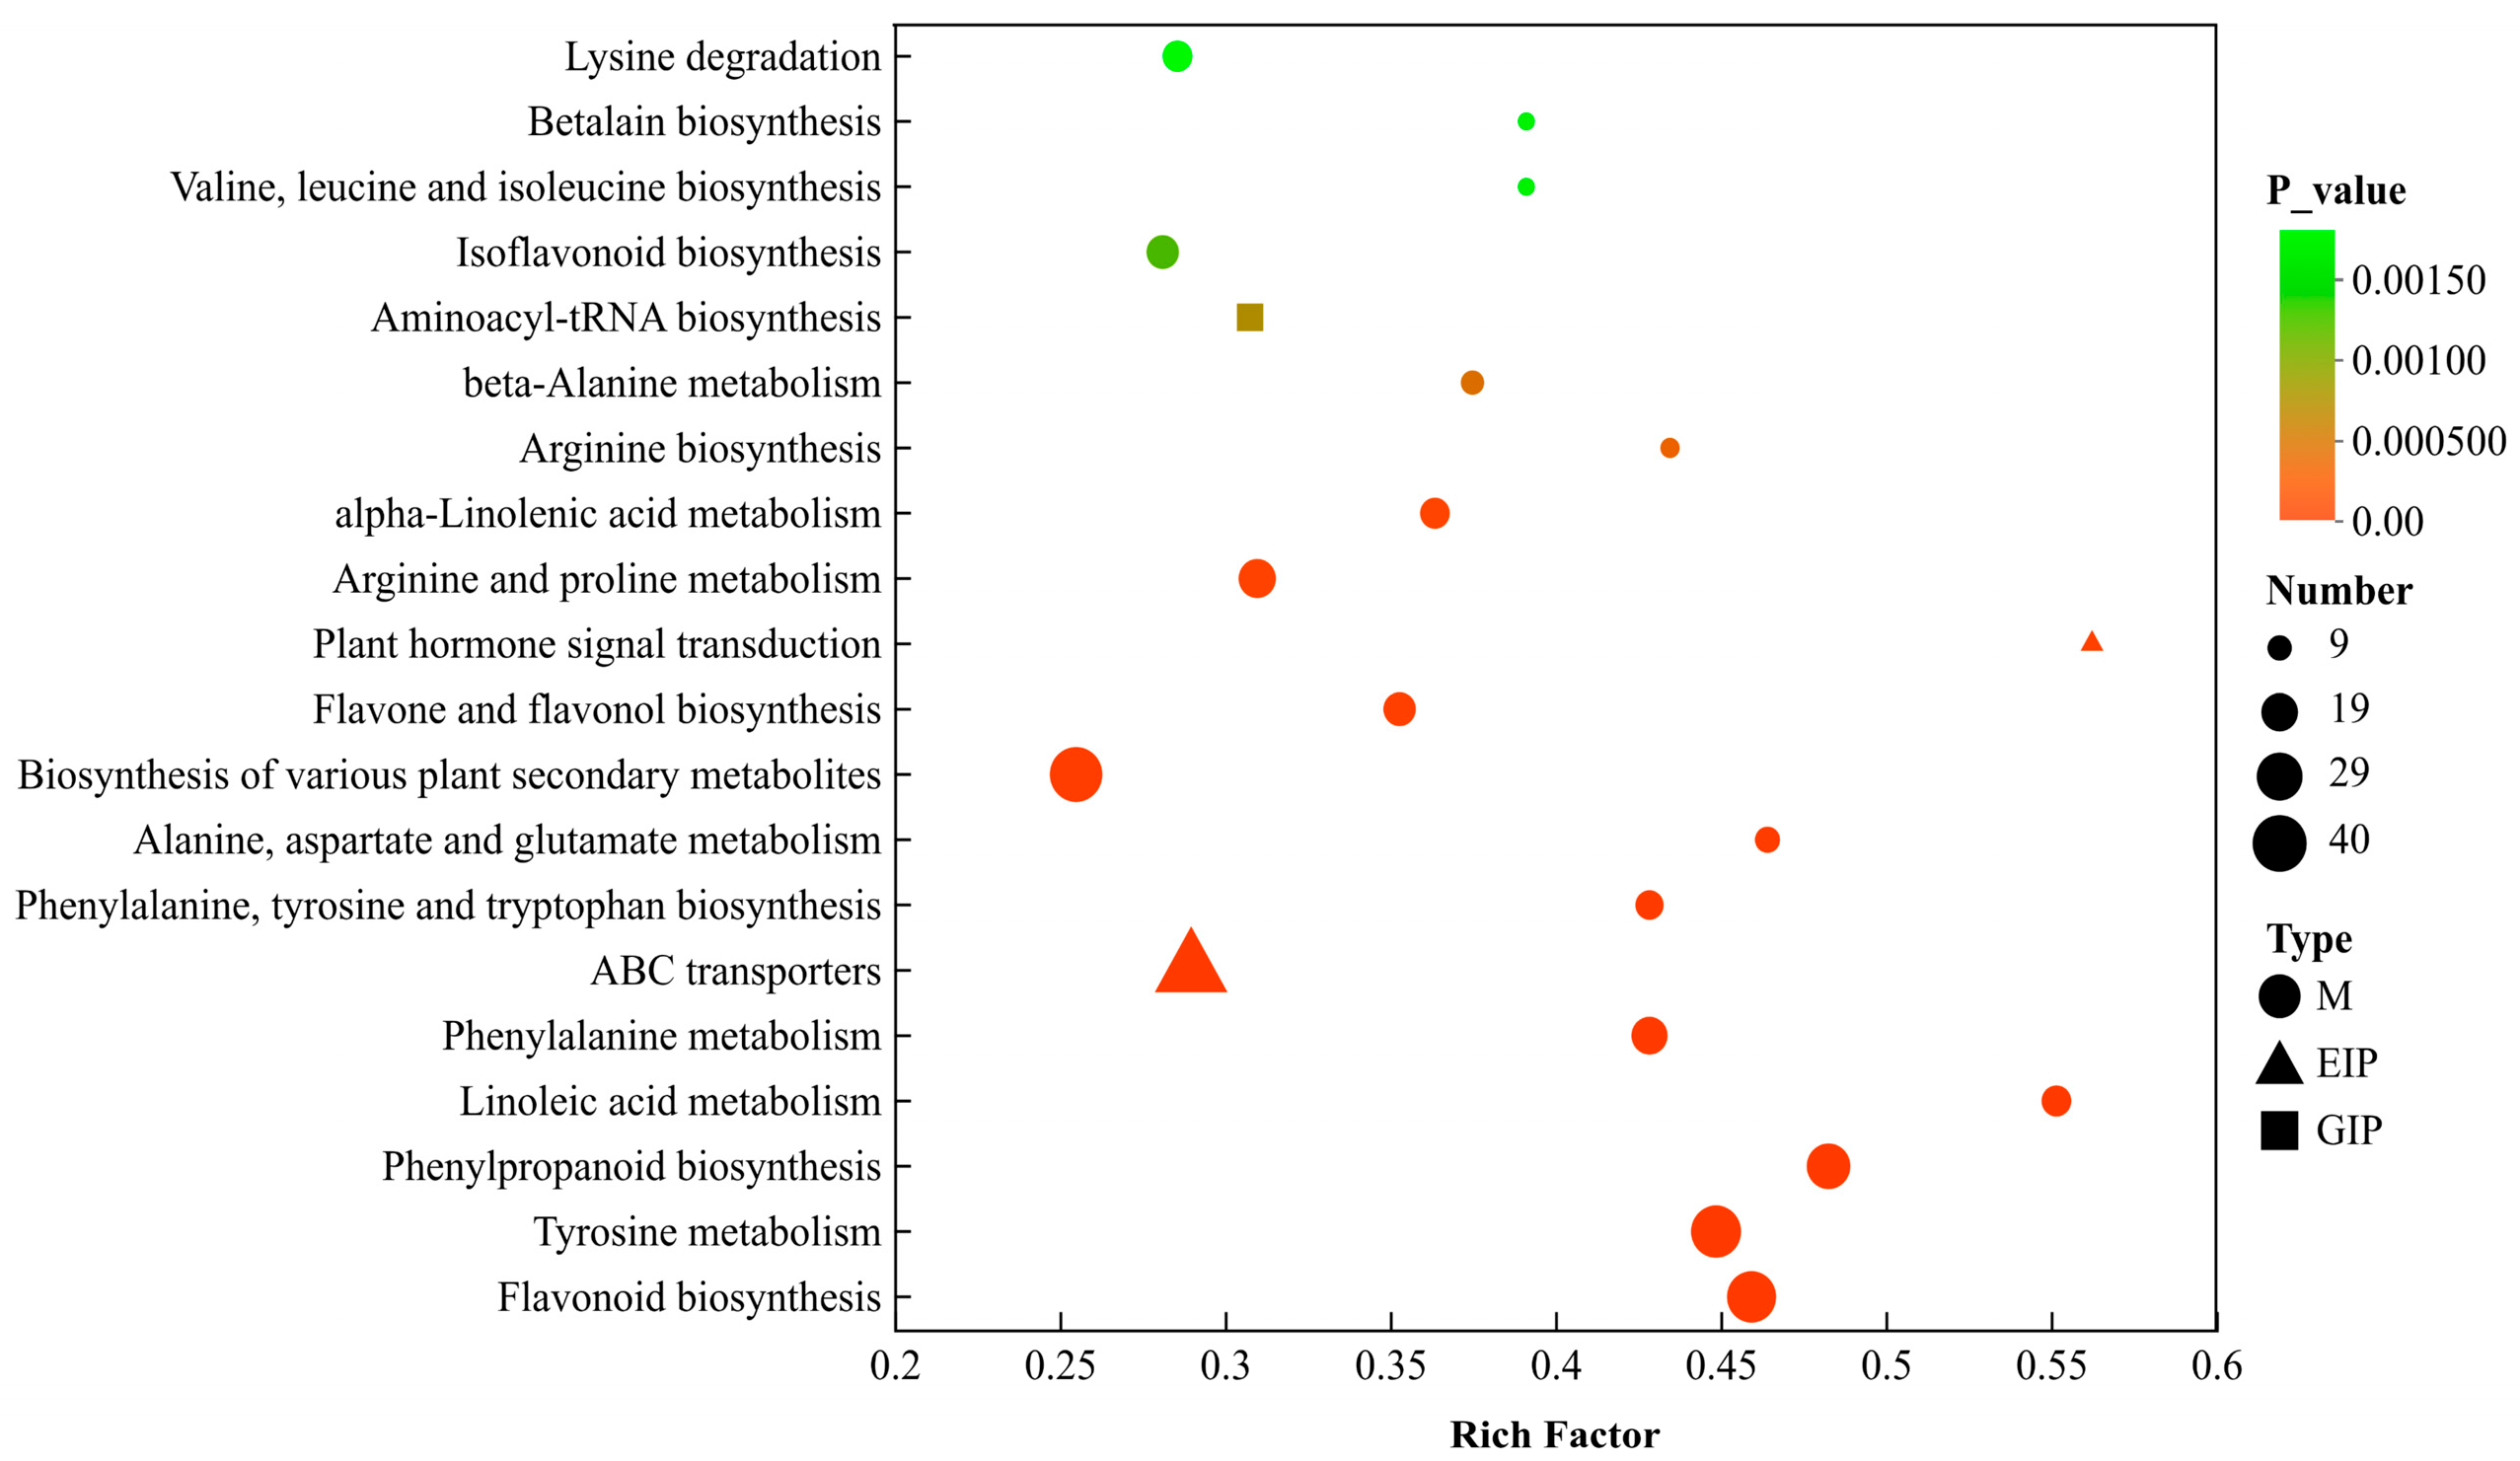
As shown in Figure 7, KEGG database annotation results indicated that out of the identified metabolites, 1539 (36.7%) were successfully annotated with metabolic pathways, among which 688 (16.4%) could be further mapped to 37 specific pathways. These pathways were primarily enriched in the metabolism category, including 34 pathways such as biosynthesis of cofactors, biosynthesis of plant secondary metabolites, flavonoid biosynthesis, and terpenoid and polyketide metabolism. They were also involved in the environmental information processing category, including ABC transporters and the plant hormone signal transduction pathway, which is closely related to graft healing. Additionally, the aminoacyl-tRNA biosynthesis pathway under the genetic information processing category was also identified.
Figure 7.
KEGG enrichment bubble plot of SCMs. X-axis: Rich factor; Y-axis: enriched KEGG pathways. Bubble color represents the p-value (green = more significant enrichment), bubble size indicates the count of enriched metabolites. Circle, triangle and square symbols stand for Metabolism (M), Environmental Information Processing (EIP) and Genetic Information Processing (GIP) pathways, respectively.
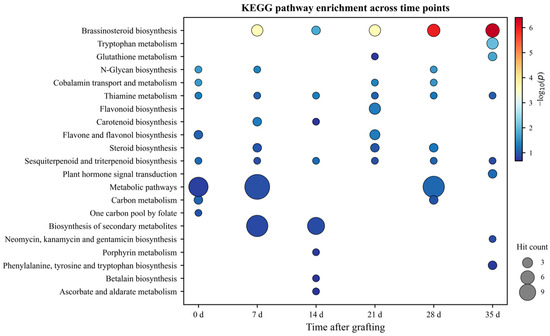
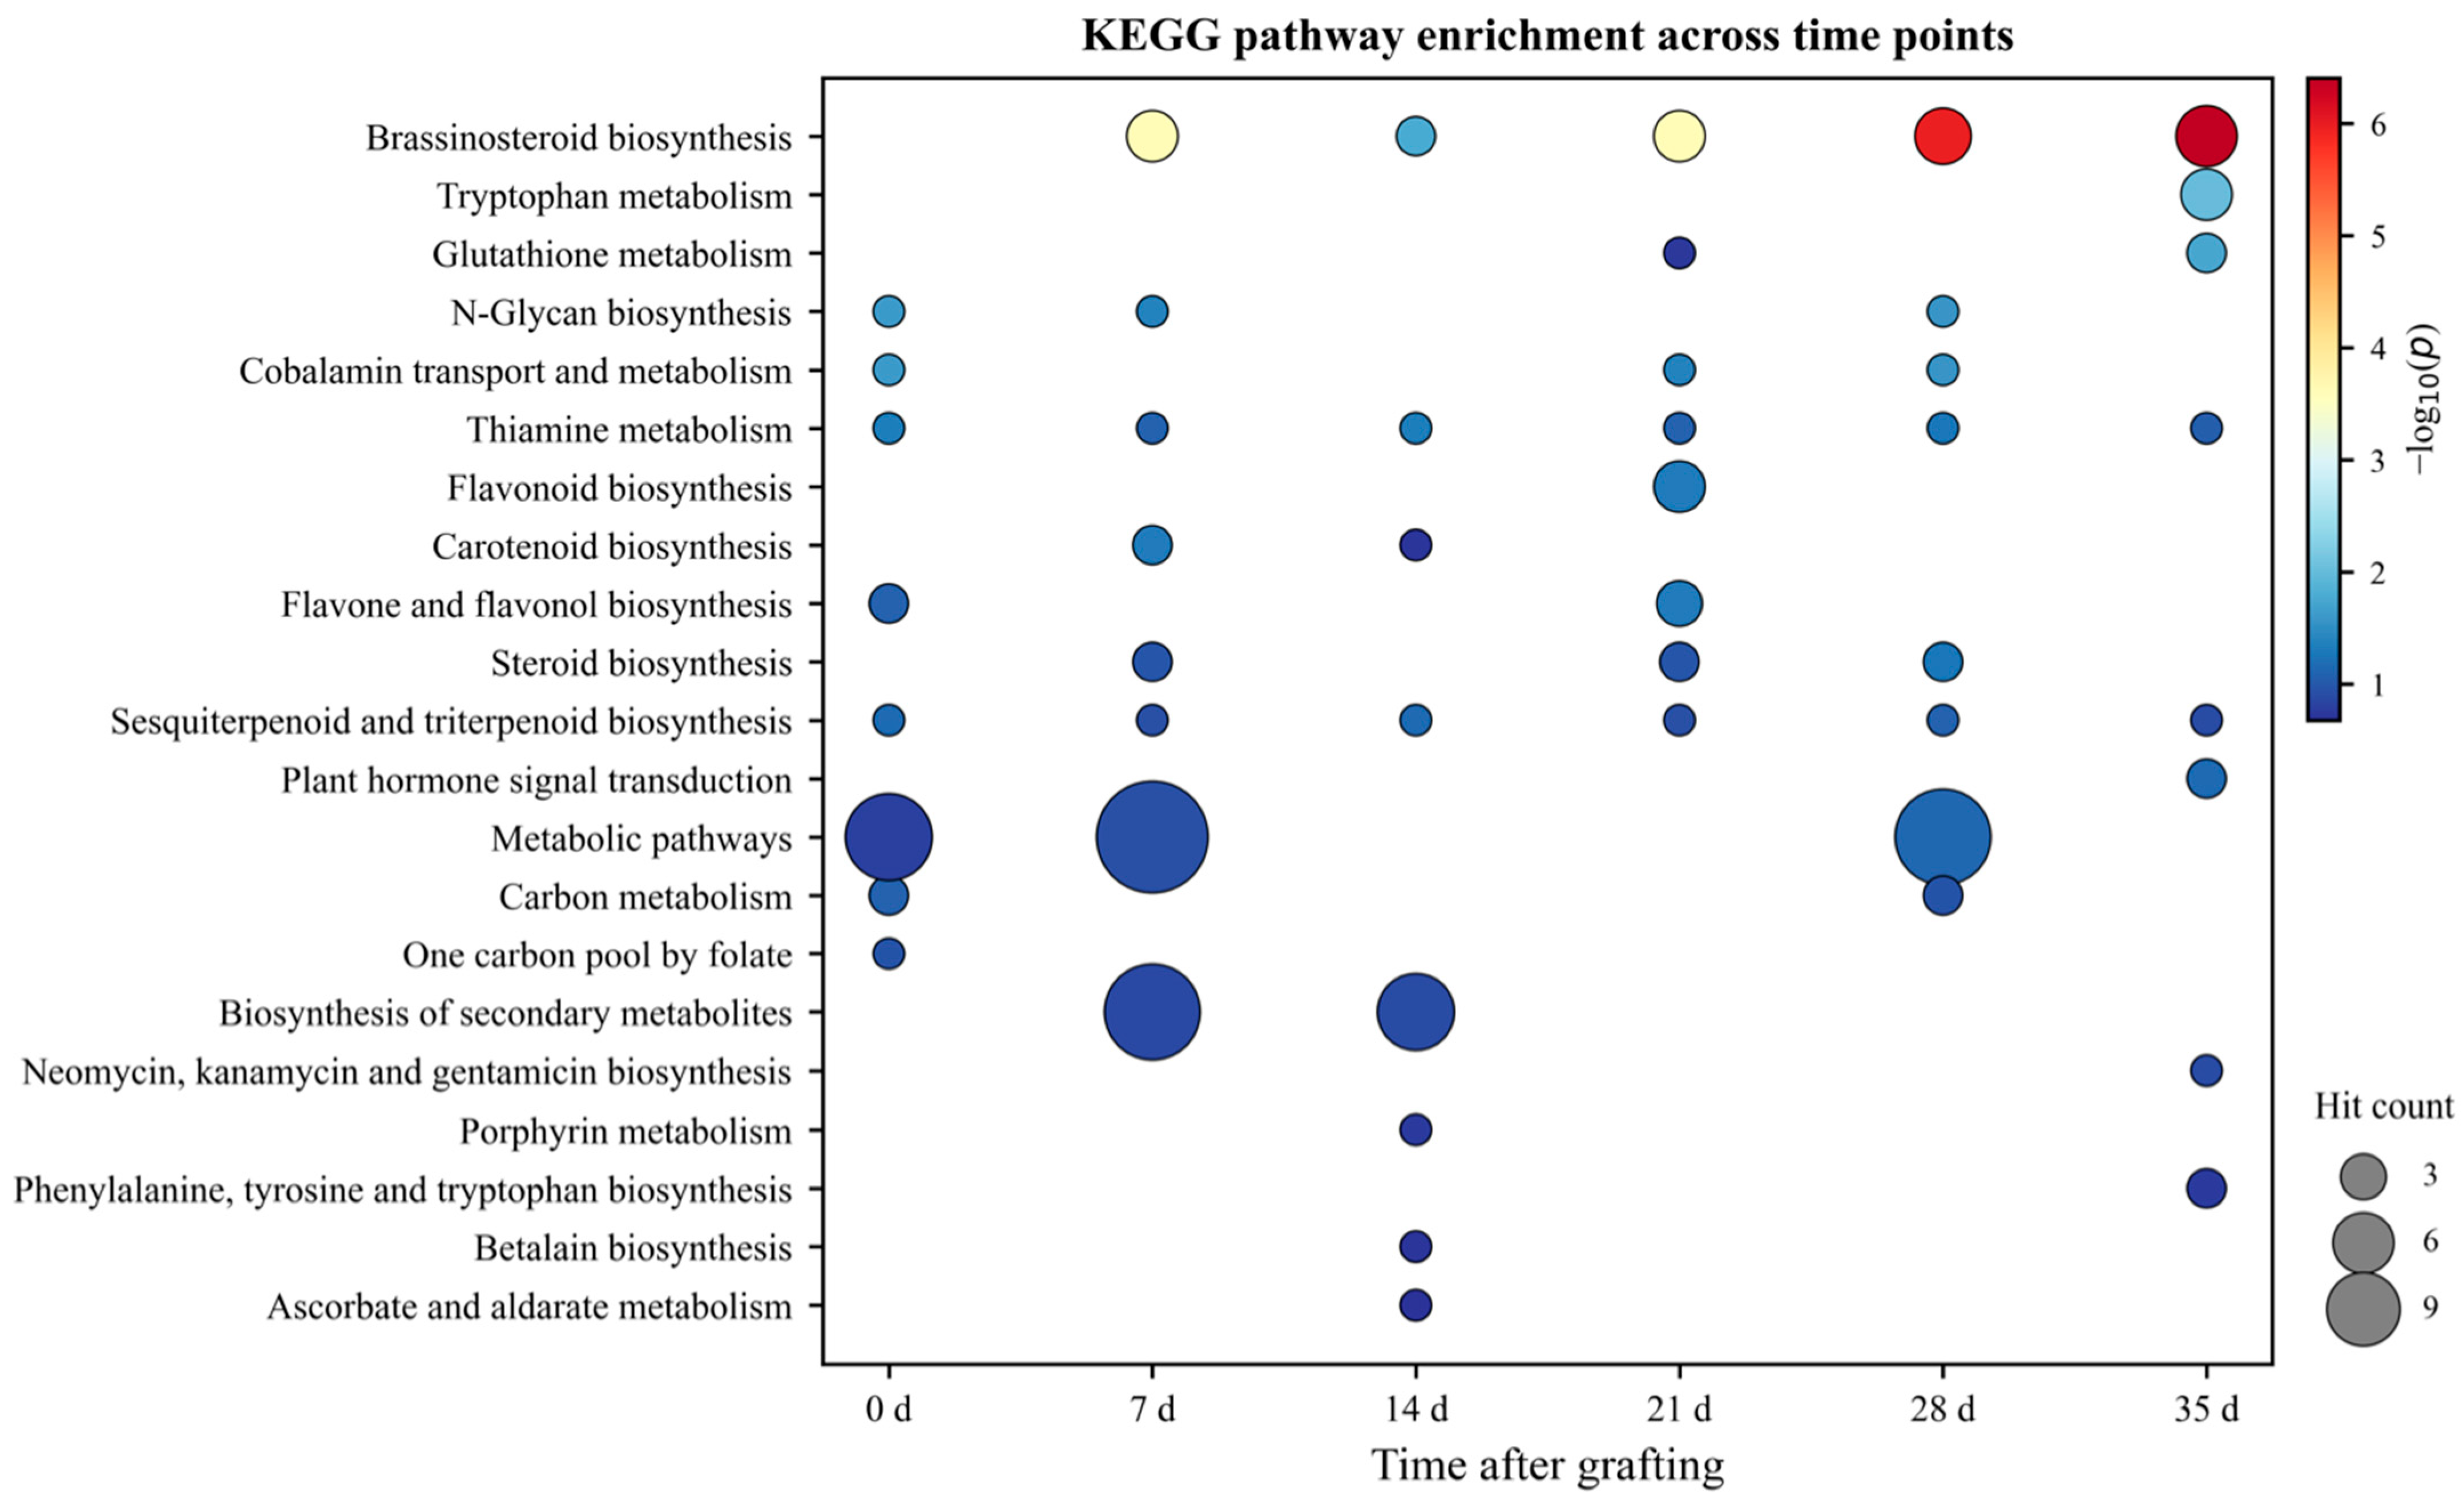
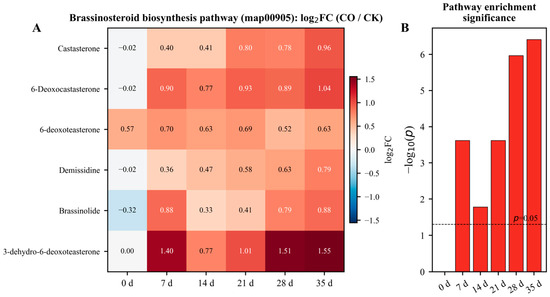
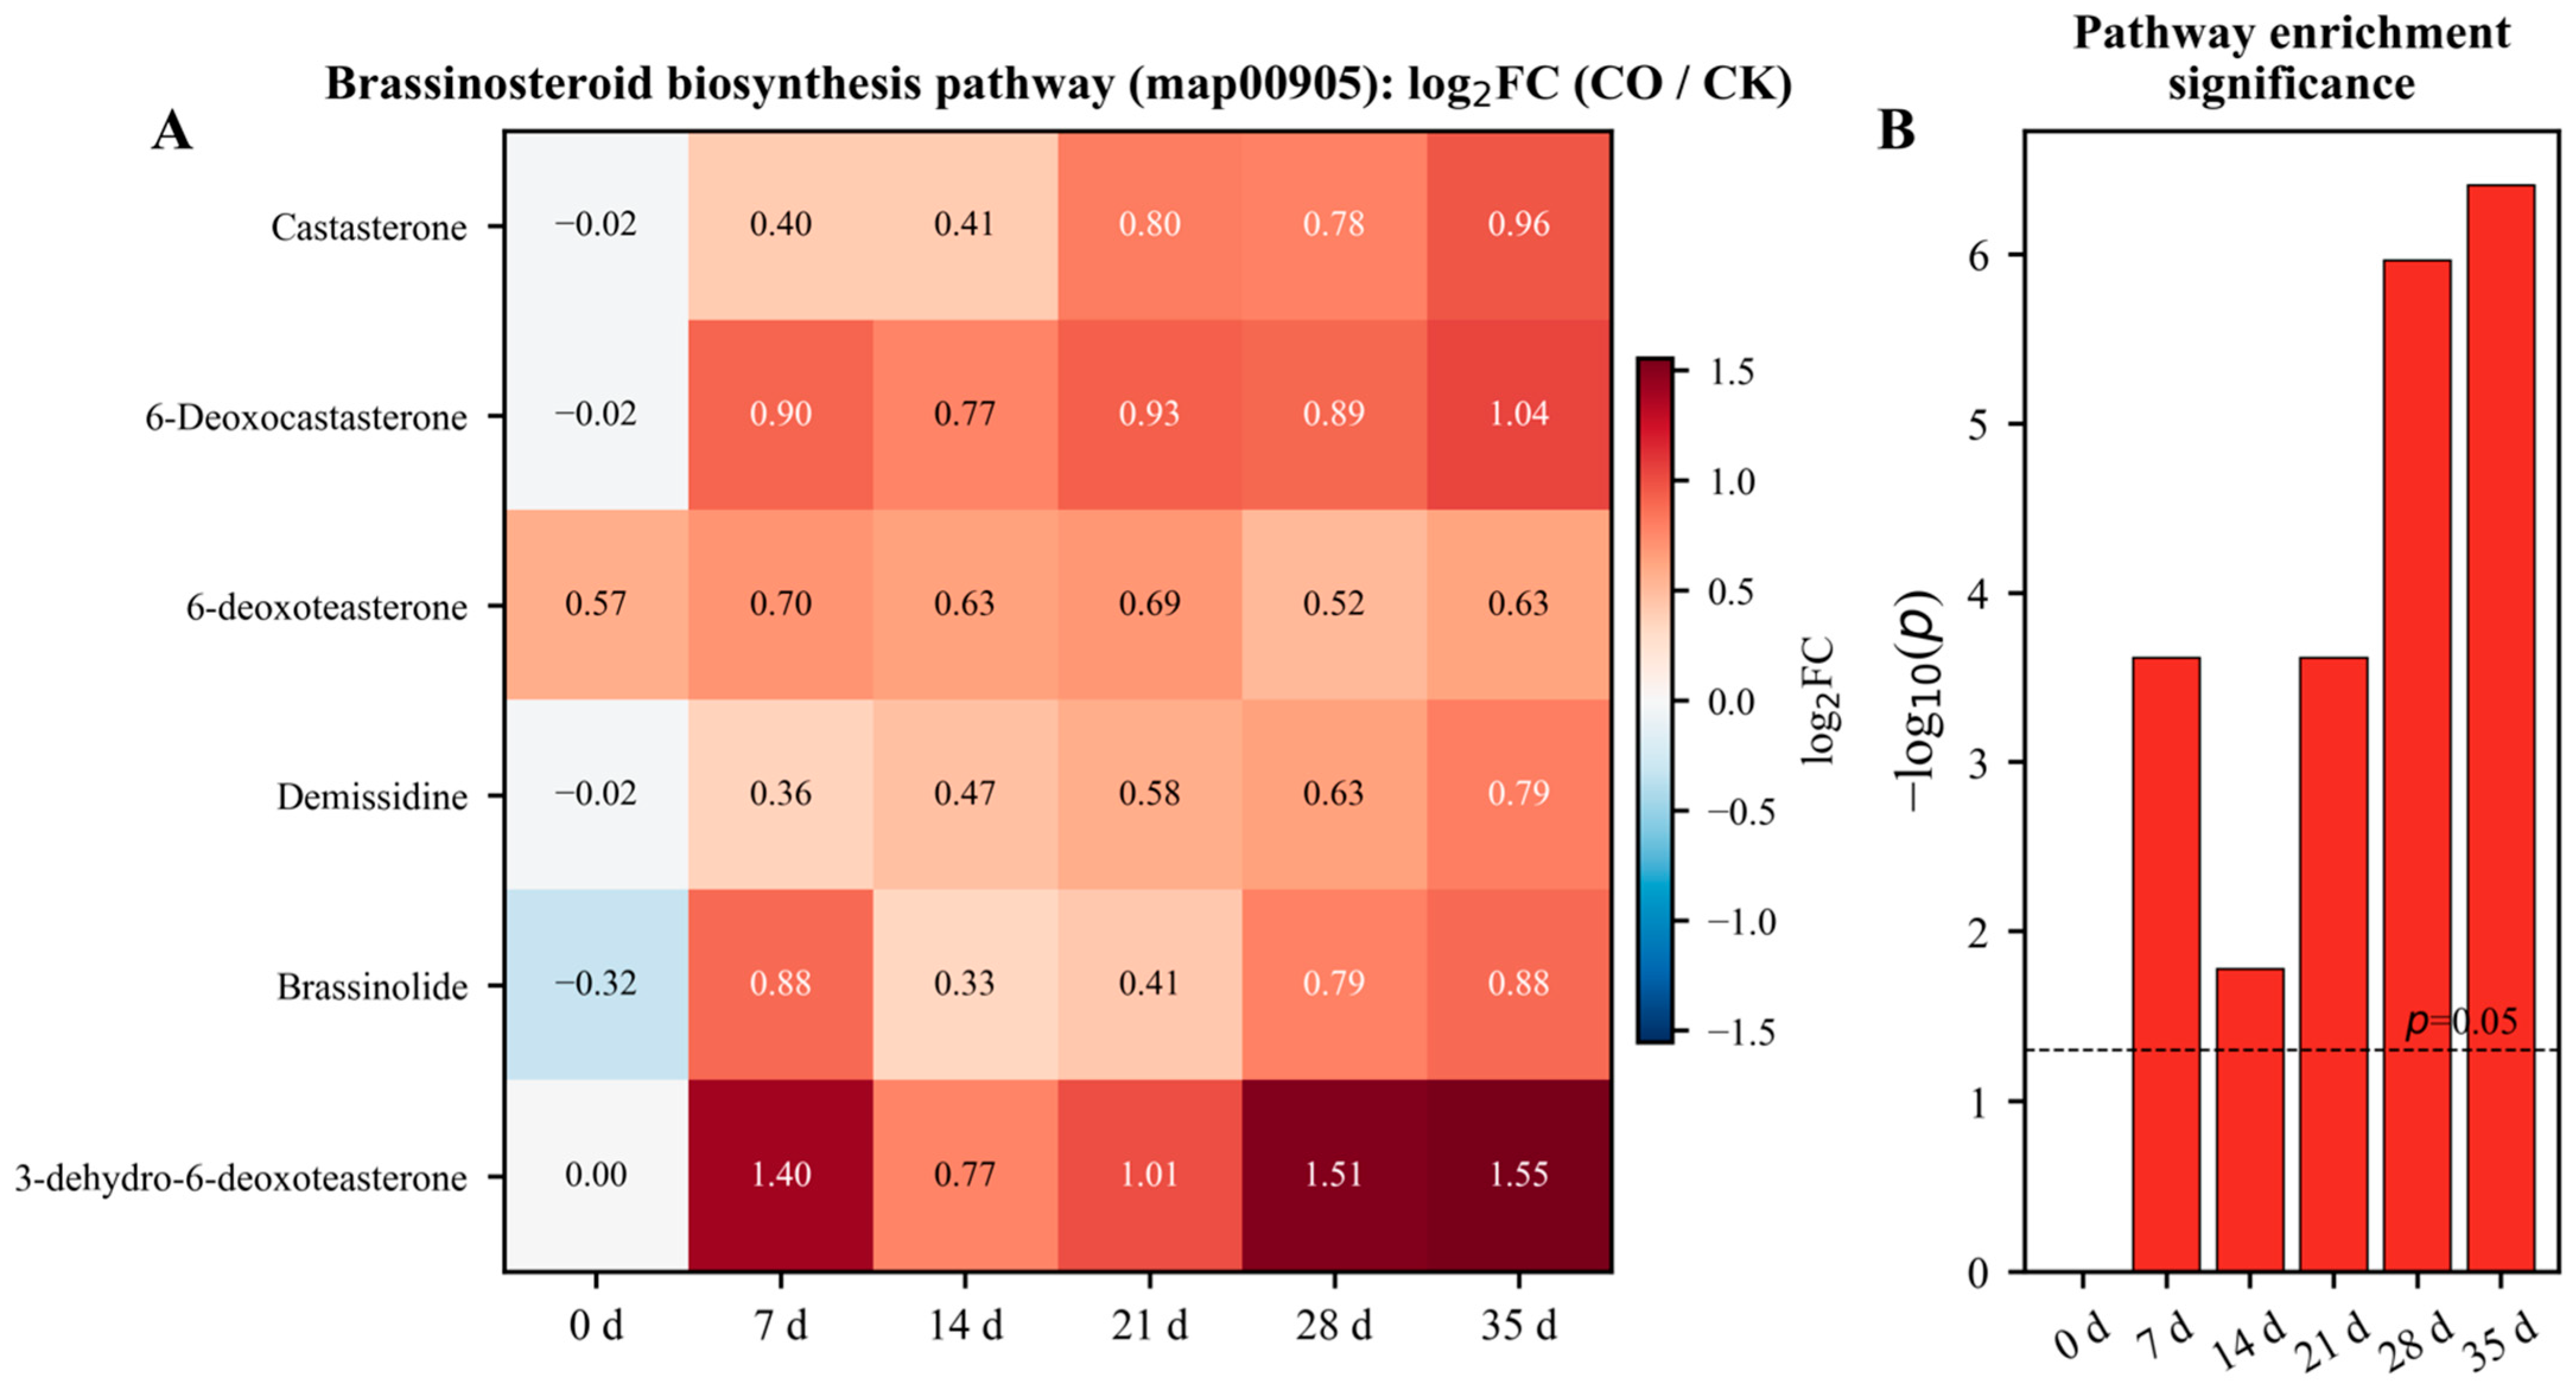
Further hypergeometric testing on the pooled differentially abundant metabolites at each time point (see Section 2.7 for methods) revealed (Figure 8) that the brassinosteroid biosynthesis pathway (map00905) exhibited continuous and highly significant enrichment during the middle and late stages of healing in the CO group (21 d, 28 d, and 35 d). The p-value reached as low as 3.90 × 10⁻⁷ (FDR = 1.09 × 10⁻⁵) at day 35, with 6 out of the 9 annotated metabolites being hit. Other sequentially enriched pathways included tryptophan metabolism (map00380), glutathione metabolism (map00480), and plant hormone signal transduction (map04075). The metabolites identified in the brassinosteroid biosynthesis pathway (map00905) and their corresponding log2FC values are presented in Table 2, while the dynamic changes in pathway significance are shown in Figure 7 and Figure 9.
Figure 8.
Temporal bubble plot of KEGG pathway enrichment for DAMs at six time points after grafting. X-axis: sampling days post grafting; Y-axis: enriched KEGG pathways. Bubble size reflects metabolite hit count in each pathway, while bubble color illustrates −log10 (p) values (red = higher statistical significance).
Table 2.
The log2FC of BR-biosynthesis metabolites (CO vs. CK).
Figure 9.
Temporal profiles of the brassinosteroid biosynthesis pathway (map00905). (A) Heatmap of log2(fold change, CO/CK) for pathway metabolites over 0–35 d post grafting. Color scale spans −1.5 to 1.5 for log2FC; red = upregulated metabolites, blue = downregulated metabolites. (B) Bar plot of pathway enrichment significance expressed as −log10(p). The dashed horizontal line represents the significance cutoff at p = 0.05.
3.8. Correlation Analysis of Key Metabolites
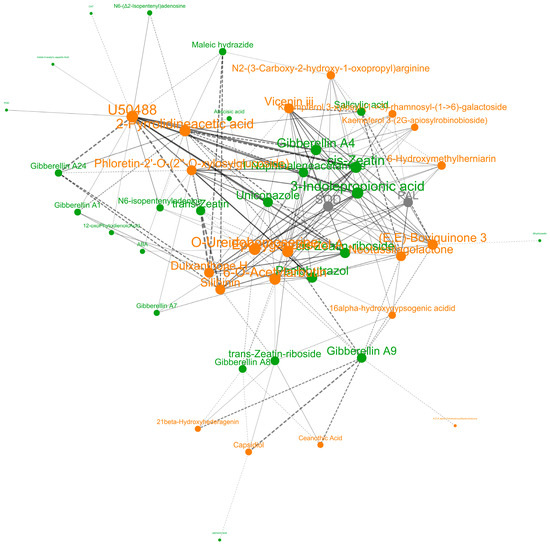
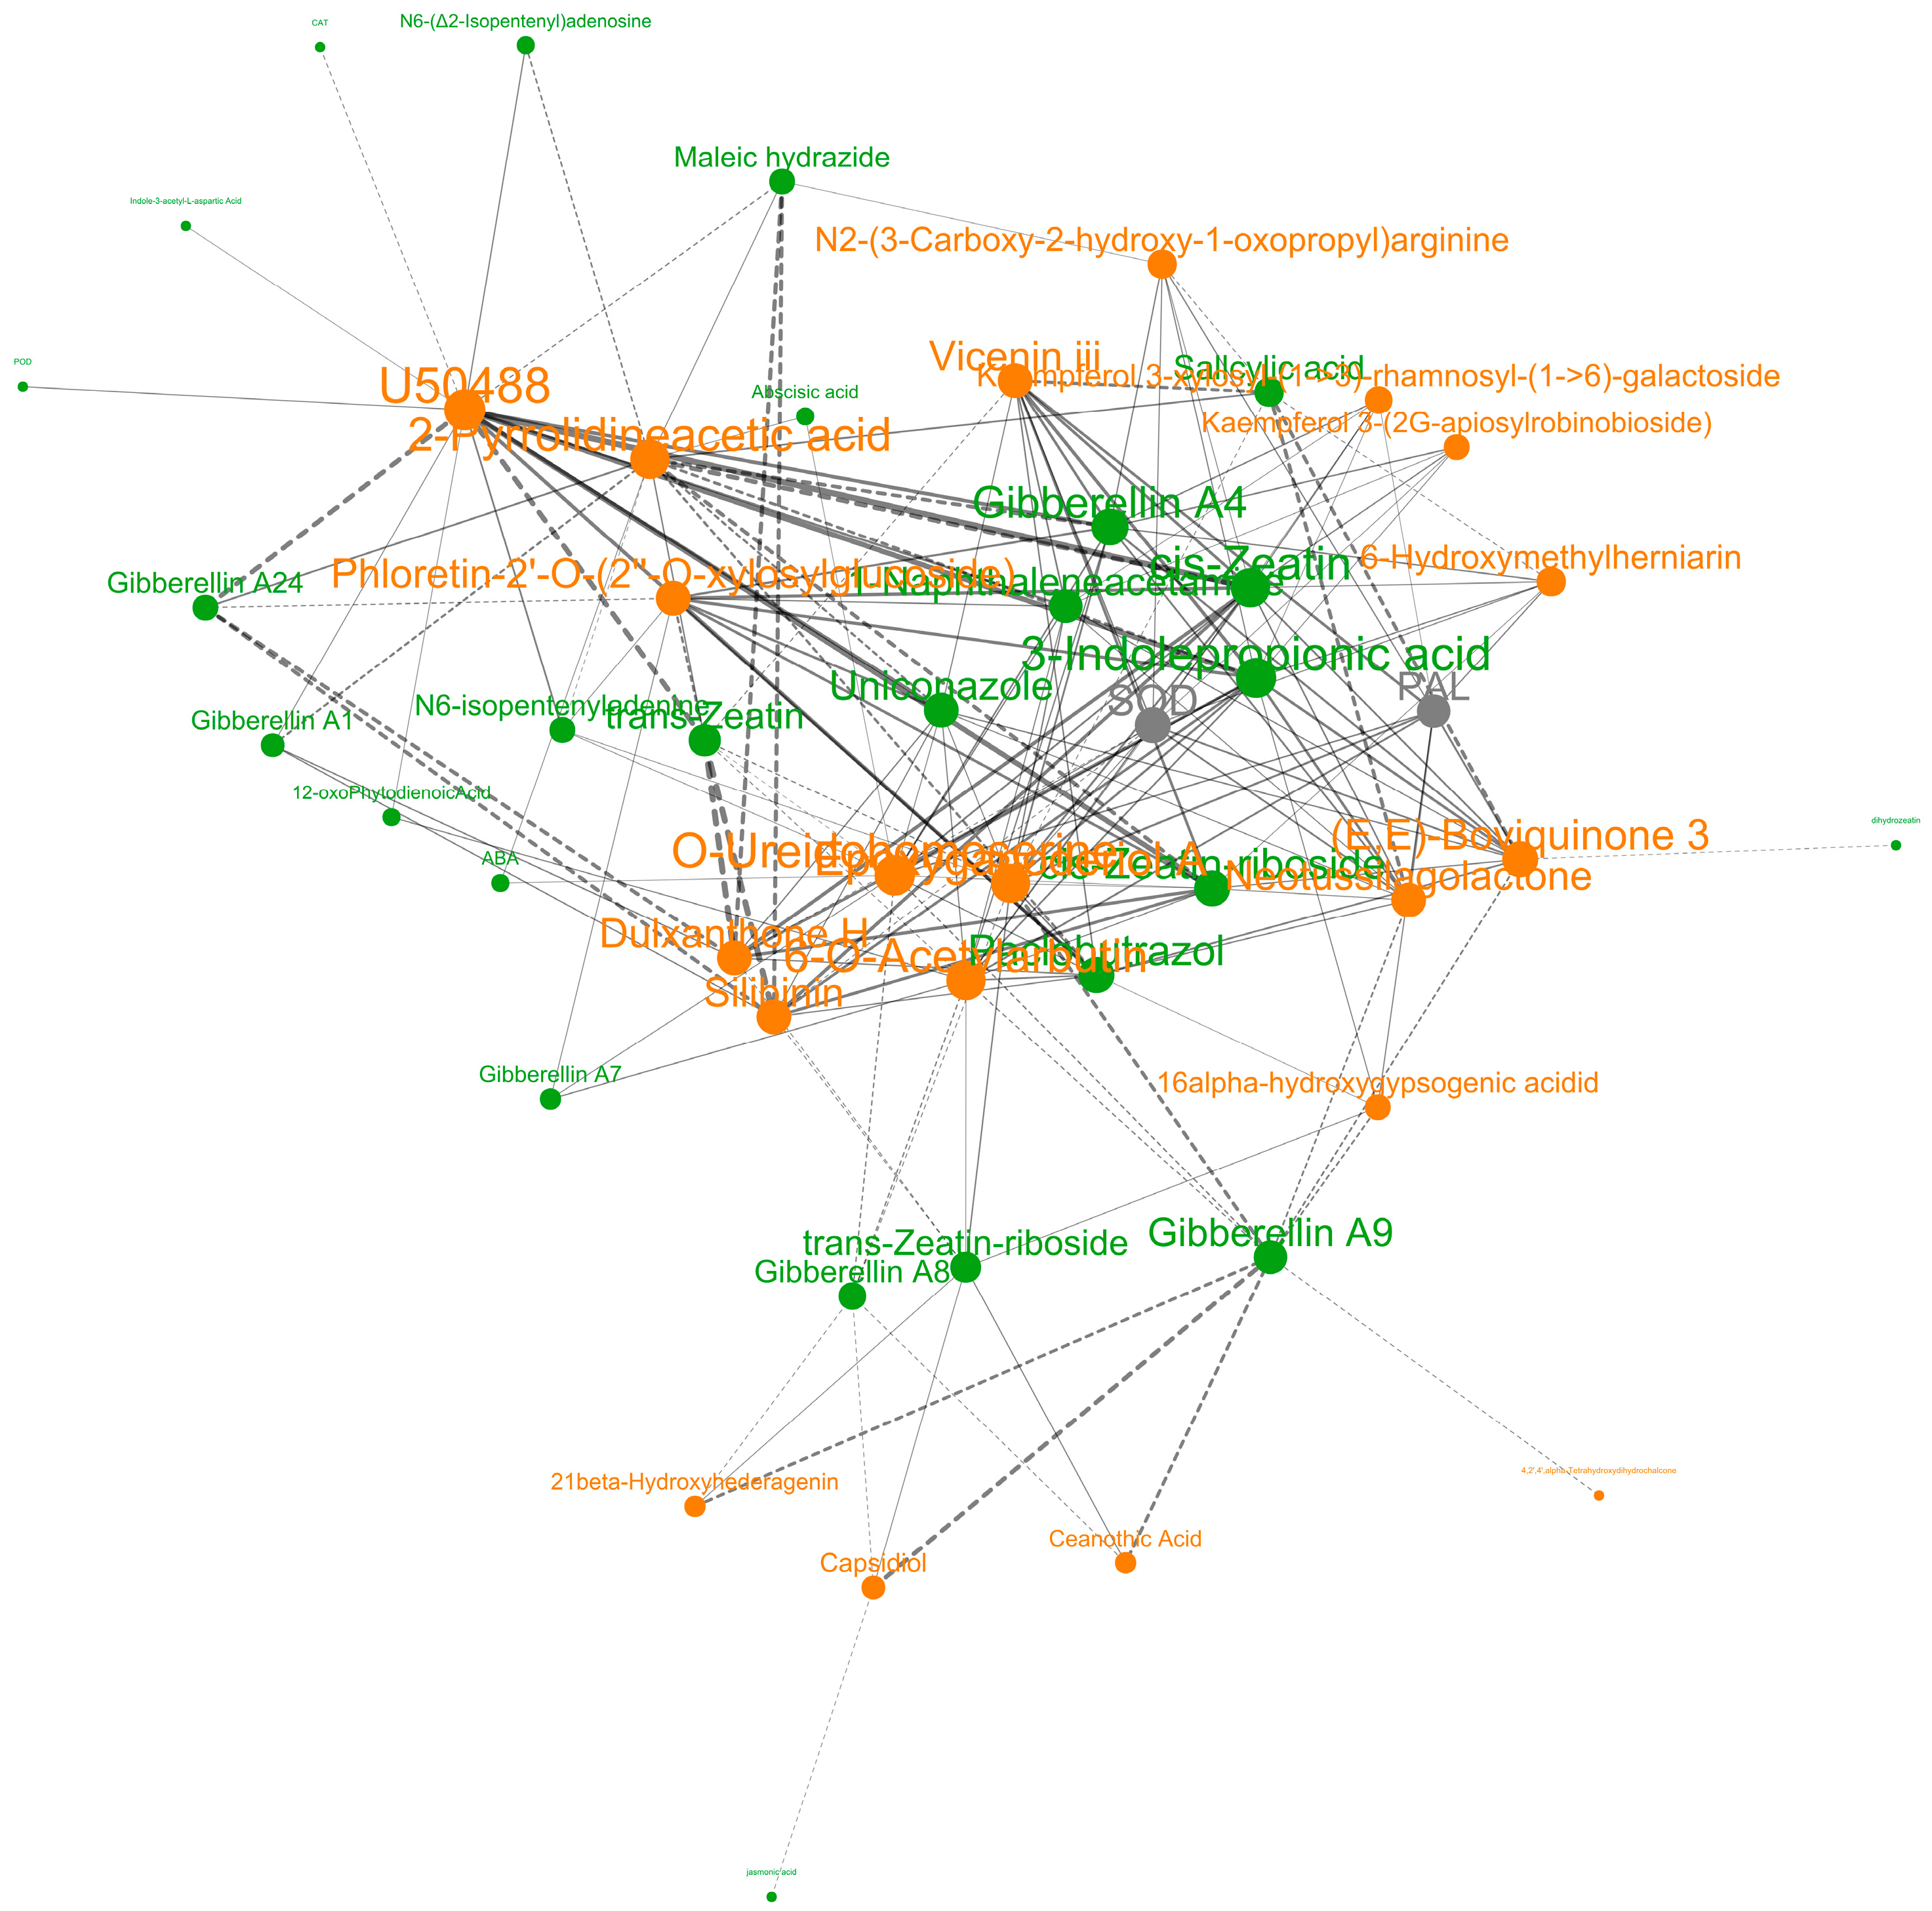
The correlation analysis of key chemical substances during the graft healing process is presented in Figure 10. The metabolites induced in the CO group exhibited high synergy with specific hormone signaling and enzymatic activity changes. Gibberellin A1, A2, A4, A8, and A9, along with trans-zeatin, cis-zeatin, and 3-indolepropionic acid, were tightly interconnected, indicating a synergistic role of these hormones in regulating cell division and elongation. Correspondingly, salicylic acid, capsidiol, ceanothic acid, vicenin III, kaempferol, and 6-hydroxymethylherniarin formed another cluster, suggesting that the activation of defense responses drove the coordinated upregulation of specific metabolic pathways. Notably, connections between these two functional clusters were sparse, forming distinct network boundaries. This structural organization indicates that the graft healing process is not a simple superposition of individual pathways. Rather, the defense metabolic network is preferentially activated, which systematically suppresses the resource allocation and signaling synergy of the growth network.
Figure 10.
Correlation network of core metabolites, plant hormones and enzyme activities. Orange nodes = metabolites, green nodes = plant hormones, gray nodes = enzyme activities. Solid edges show positive correlations, dashed edges show negative correlations, and edge thickness corresponds to correlation magnitude.
4. Discussion
Graft compatibility is determined by a complex network of physiological and molecular interactions, with the core being the dynamic balance between growth and defense signals during the healing process [31]. This study systematically compared the physiological and metabolic responses of self-grafted and heterografted C. oleifera with C. pyxidiacea var. rubituberculata during graft union. The results indicate that, compared to self-grafting, heterografting exhibits a response pattern characterized by sustained activation of defense programs and suppression of growth programs. This pattern is corroborated at the levels of hormone signaling, enzyme activity dynamics, and the global metabolic network, revealing the intrinsic physiological mechanisms underlying the delayed healing in heterografts.
Successful grafting relies on the rapid initiation of cell proliferation to re-establish vascular connections, which is facilitated by the coordinated action of hormones such as auxins, cytokinins, and gibberellins [32]. In the self-grafted group, an initial rapid increase in ABA was followed by a decline, while GAs, CTKs, and Aux/IAA steadily accumulated, favoring the formation and proliferation of the callus tissue [33]. In contrast, the heterografted group exhibited a shift from “active growth” to “defense prioritization.” The levels of growth hormones were significantly suppressed, while SA and JA remained at high levels during the later stages of healing. This difference is directly reflected in the overall metabolic reconfiguration. KEGG enrichment analysis showed significant enrichment of the “plant hormone signal transduction” pathway, confirming the central regulatory role of hormone signals at the metabolite level. Among the key differential metabolites, the highest VIP value for upregulated substances was capsidiol, while the highest VIP value for downregulated substances was zeatin riboside. These findings provide direct metabolite evidence for the “growth-defense” trade-off theory [34]. The heterografted scion may be recognized by the rootstock as a persistent biotic stress, leading to the reallocation of resources from primary metabolism related to cell division and elongation to the synthesis of defensive secondary metabolites such as phytoalexins and alkaloids via JA signaling pathways [35].
The phenylpropanoid pathway is crucial for the production of lignin and various antimicrobial phenolic and flavonoid compounds [36]. In this study, the activity of PAL (phenylalanine ammonia-lyase) in the heterografted group was continuously suppressed throughout the healing period, while the metabolomic data showed that “phenylpropanoids and polyketides” were the second-largest super-class, with significantly upregulated coumarin compounds such as 6-hydroxymethylherniarin. As the initiating and rate-limiting enzyme in this pathway, PAL activity is typically positively correlated with flux [37]. The regulation of the phenylpropanoid pathway is highly branch-specific and context-dependent [38]. The limited pool of phenylalanine was preferentially directed to non-PAL-limited or differently regulated branches. The suppression of PAL activity likely reduced the flux towards lignin monomers, while other regulatory points (such as 4-coumarate: CoA ligase) directed more metabolic flow towards the synthesis of soluble defense compounds like coumarins and flavonoids [39,40]. This aligns with the strong activation of PPO (polyphenol oxidase) and POD (peroxidase) activities observed in the later stages of healing. Both PPO and POD are involved not only in the final polymerization of lignin monomers but also in the oxidation of phenolic compounds. Their high activity may lead to the rapid turnover of phenolic precursors, forming a feedback loop that further influences upstream PAL activity [41]. Therefore, the phenylpropanoid metabolism in heterografts is not entirely inhibited but rather redirected, reducing the flux towards lignification-related processes to support the efficient production of soluble phenolic compounds with direct antimicrobial or signaling functions, to address potential compatibility barriers.
In the later stages of healing (28–35 days), the heterografted group exhibited a significant increase in PPO and POD activities. These enzymes play a critical role in the final polymerization of lignin, wound browning, and the formation of physical barriers [42]. Their activation, along with the dynamic upregulation of CAT (catalase) activity, indicates an active process of oxidative cross-linking and reactive oxygen species (ROS) balance. This is consistent with the accumulation of lipids, organic acids, and phenolic compounds in the metabolome. The burst of ROS is a common stress signal that can activate defense responses, including JA synthesis [43]. Changes in lipid metabolism may be related to membrane system reconstruction and oxidative stress responses, while phenolic compounds serve as substrates for PPO/POD, and their oxidation products contribute to cell wall cross-linking [44]. Additionally, the phased increase in CAT activity helps control hydrogen peroxide levels, preventing excessive oxidative damage [45]. Therefore, although the heterografted group has weaker cell division signals, it is forming a biochemical barrier through the enhanced oxidation and polymerization of phenolic compounds, attempting to establish a physical isolation and stabilization. This partially compensates for the structural weakness due to insufficient growth signals but may also delay the differentiation and connection of vascular tissues.
KEGG enrichment analysis revealed that the brassinosteroid (BR) biosynthesis pathway (map00905) was significantly enriched in the CO group during the middle-to-late stages of healing (21 d–35 d). Multiple BR biosynthetic intermediates showed an upward trend (Table 2); however, their specific regulatory roles require further validation through hormone quantification and gene expression analysis.
This observation does not contradict the suppression of GAs, CTK, and IAA observed in the CO group. BRs interact with other growth hormones through a complex network of synergistic and antagonistic relationships. The localized accumulation of BR may represent a compensatory activation mechanism, attempting to reconstruct vascular connections and promote cell elongation under conditions of suppressed growth hormone signaling [46]. Furthermore, Mfuzz temporal clustering revealed multiple clusters in the CO group that exhibited a continuous increase throughout the healing process (e.g., Clusters 1 and 6). The members of these clusters are primarily secondary metabolites and hormone-related molecules, further supporting the dynamic reshaping of the “defense-growth balance” along a temporal dimension.
It should be noted that this study did not include C. oleifera ‘Qianyou No. 2’ autografting (C. oleifera/C. oleifera) as a second control group. In an ideal experimental design, three comparisons—(i) rootstock genotype autografting (C. pyxidiacea var. rubituberculata/C. pyxidiacea var. rubituberculata, i.e., the current CK group), (ii) scion genotype autografting (C. oleifera/C. oleifera), and (iii) heterografting (C. pyxidiacea var. rubituberculata/C. oleifera, i.e., the CO group)—would formally disentangle the contributions of rootstock and scion genotypes to the healing process. However, our experimental design was driven by the aforementioned application-oriented objective, which prioritizes addressing the practical industrial question of “what are the healing physiological barriers in this specific rootstock–scion combination.” Therefore, using C. pyxidiacea var. rubituberculata autografting as the control effectively serves this goal. Nevertheless, the absence of the C. oleifera autografting control does limit our ability to fully distinguish between “general stress responses caused by heterografting” and “genotype-specific incompatibility effects unique to the C. pyxidiacea var. rubituberculata/C. oleifera combination.” Future studies, given sufficient germplasm availability, should incorporate the C. oleifera/C. oleifera autografting control to more comprehensively elucidate the contribution of genetic background to healing regulation in rootstock–scion interactions. Furthermore, the current evidence for the stage-specific activation of the BR pathway is primarily derived from non-targeted metabolomics enrichment analysis; targeted hormone quantification and gene expression validation are still required to definitively confirm its regulatory function.
5. Conclusions
This study systematically compared the physiological and metabolic dynamic differences between heterologous grafting (CO) and homologous grafting (CK) within 35 days post-grafting, using C. pyxidiacea var. rubituberculata as the rootstock and C. oleifera ‘Qianyou 2’ as the scion. Integrating data from enzyme activities, endogenous hormones, and untargeted metabolomics, and combining OPLS-DA discrimination, stringent screening of differentially abundant metabolites, Mfuzz temporal clustering, and KEGG pathway enrichment analysis, the main conclusions are as follows: (1) The healing interface in heterologous grafting remains in a prolonged state of “high defense and low growth.” The activities of PPO, POD, and CAT were significantly activated during the middle and late stages of healing, while PAL activity was continuously suppressed. This was accompanied by the accumulation of SA and JA, alongside decreased levels of GAs, CTK, and IAA. (2) Based on stringent thresholds (VIP > 1, p < 0.05, FDR < 0.05, and |log2FC| ≥ 1), a total of 107–190 significantly changed metabolites (SCMs) were identified across the six time points (yielding a cumulative total of 397). The number of upregulated metabolites in the CO group was significantly higher than that of downregulated metabolites, and this disparity further expanded during the late healing stage, reflecting the metabolic remodeling characteristics of heterologous grafting. KEGG pathway enrichment analysis demonstrated that the brassinosteroid (BR) biosynthesis pathway (map00905) was continuously and significantly enriched in the CO group during the middle-to-late healing stages (21 d–35 d), with the lowest FDR reaching 1.09 × 10⁻⁵. Although multiple BR biosynthetic intermediates were upregulated, the physiological significance of this pathway warrants further validation. (3) Mfuzz temporal clustering categorized the strictly screened differentially abundant metabolites into nine dynamic pattern groups, systematically delineating the differentiated evolutionary trajectories of the metabolome during the heterologous graft healing process.
From an applied perspective, the hormonal imbalances identified in this study suggest concrete strategies for improving heterografting success in nursery practice. The sustained suppression of gibberellins, cytokinins, and auxin at the graft interface indicates that exogenous supplementation—such as applying GA3 or 6 BA as a graft union paste, or brassinolide during the mid-to-late healing stage—may help restore the growth–defense balance and accelerate vascular reconnection. Concurrently, minimizing additional abiotic stressors (e.g., dehydration, temperature shock) during the critical 0 d–21 d window could prevent compounding the SA/JA-mediated defense overactivation. Future research should validate these hormone application strategies under commercial nursery conditions, extend physiological observations beyond 35 days to correlate early metabolic markers with long-term graft survival and yield, and incorporate C. oleifera autografting controls to isolate genotype-specific incompatibility effects. Additionally, targeted quantification of brassinosteroids and expression analysis of their biosynthetic genes are needed to confirm the regulatory role of the BR pathway proposed here. Together, these efforts will bridge the gap between molecular insights and practical horticultural interventions, ultimately supporting the large-scale propagation of high-yield C. oleifera on stress-tolerant C. pyxidiacea var. rubituberculata rootstock in karst mountainous regions.
In summary, the “defense-priority, growth-suppressed” pattern triggered by heterografting was corroborated across three levels: enzyme activity, hormone dynamics, and metabolic networks. The stage-specific activation of the BR pathway preliminarily suggests its potential regulatory role in heterograft healing, providing a novel entry point for elucidating graft healing mechanisms. These findings offer significant theoretical guidance for the graft propagation of C. pyxidiacea var. rubituberculata and the development of the C. oleifera industry in karst mountainous regions. It is worth noting that the absence of the C. oleifera ‘Qianyou No. 2’ autografting control was acknowledged and discussed in the preceding section; future studies should build upon this work to further dissect the contribution of genotype-specific effects in rootstock–scion interactions.
Author Contributions
Conceptualization, Q.Z. and M.S.; methodology, Q.Z.; investigation, C.X. and Y.W.; resources, Y.Z.; data curation, C.X. and Y.W.; writing—original draft preparation, Q.Z. and M.S.; writing—review and editing, Q.Z. and M.S.; visualization, F.L.; supervision, F.L. and X.L.; project administration, M.L. and B.M.; funding acquisition, Y.Z. and J.X. All authors have read and agreed to the published version of the manuscript.
Funding
This research was funded by the Science and Technology Department of Guizhou Province (funding number: Qiankehejichu-ZK [2024] zhongdian 091 and Qiankefuqi [2018]4003) and the Forestry Bureau of Guizhou Project (grant number: 2026-ZM-30, Qianlinkehe [2026]zhongdian 008, Gui [2026]TG5 and Gui [2025]TG02).
Data Availability Statement
The original contributions presented in this study are included in the article. Further inquiries can be directed to the corresponding author.
Acknowledgments
We gratefully acknowledge Majorbio Bio-pharm Technology Co., Ltd. (Shanghai, China) for their assistance in metabolite identification, data processing, and bioinformatics analysis. The authors also thank the platform for providing the LC-MS/MS instrumentation and technical consultation.
Conflicts of Interest
The authors declare no conflicts of interest.
References
- Goldschmidt, E.E. Plant grafting: New mechanisms, evolutionary implications. Front. Plant Sci. 2014, 5, 727. [Google Scholar] [CrossRef] [Scilit] [PubMed]
- Rubio, B.; Stammitti, L.; Cookson, S.J.; Teyssier, E.; Gallusci, P. Small RNA populations reflect the complex dialogue estab-lished between heterograft partners in grapevine. Hortic. Res. 2022, 9, uhab067. [Google Scholar] [CrossRef] [Scilit] [PubMed]
- Stegemann, S.; Bock, R. Exchange of genetic material between cells in plant tissue grafts. Science 2009, 324, 649–651. [Google Scholar] [CrossRef] [Scilit] [PubMed]
- Frey, C.; Álvarez, R.; Encina, A.; Acebes, J.L. Tomato graft union failure is associated with alterations in tissue development and the onset of cell wall defense responses. Agronomy 2021, 11, 1197. [Google Scholar] [CrossRef] [Scilit]
- Zhao, D.; Zhong, G.Y.; Song, G.O. Transfer of endogenous small RNAs between branches of scions and rootstocks in grafted sweet cherry trees. PLoS ONE 2020, 15, e236376. [Google Scholar] [CrossRef] [Scilit] [PubMed]
- Prodhomme, D.; Valls, F.J.; Hévin, C.; Franc, C.; Hilbert, G.; de Revel, G.; Richard, T.; Ollat, N.; Cookson, S.J. Metabolite profiling during graft union formation reveals the reprogramming of primary metabolism and the induction of stilbene syn-thesis at the graft interface in grapevine. BMC Plant Biol. 2019, 19, 599. [Google Scholar] [CrossRef] [Scilit] [PubMed]
- Grégoire, L.; Josep, V.F.; Sylvain, P.; Duyen, P.; Anne-Sophie, S.; Ghislaine, H.; Céline, F.; Gilles, D.R.; Tristan, R.; Nathalie, O.; et al. Identifying early metabolite markers of successful graft union formation in grapevine. Hortic. Res. 2022, 9, uhab070. [Google Scholar] [CrossRef] [Scilit] [PubMed]
- Matsuoka, K.; Yanagi, R.; Yumoto, E.; Yokota, T.; Yamane, H.; Satoh, S.; Asahina, M. RAP2.6L and jasmonic acid–responsive genes are expressed upon Arabidopsis hypocotyl grafting but are not needed for cell proliferation related to healing. Plant Mol. Biol. 2018, 96, 531–542. [Google Scholar] [CrossRef] [Scilit] [PubMed]
- Cui, Q.; Xiel, L.; Dong, C.; Gao, L.; Shang, Q. Stage-specific events in tomato graft formation and the regulatory effects of auxin and cytokinin. Plant Sci. 2021, 304, 110803. [Google Scholar] [CrossRef] [Scilit] [PubMed]
- Sima, X.; Jang, B.; Fang, J.; He, Y.; Fang, Z.; Saravana, K.K.; Ren, W.; Qiu, L.; Chen, X.; Zheng, B. Identification by deep se-quencing and profiling of conserved and novel hickory microRNAs involved in the graft process. Plant Biotechnol. Rep. 2015, 9, 115–124. [Google Scholar] [CrossRef] [Scilit]
- Mo, Z.; Feng, G.; Su, W.; Liu, Z.; Peng, F. Identification of miRNAs associated with graft union development in pecan [Carya illinoinensis (Wangenh.) K. Koch]. Forests 2018, 9, 472. [Google Scholar] [CrossRef] [Scilit]
- Wang, C.; Yang, A.; Yin, H.; Zhang, J. Influence of water stress on endogenous hormone contents and cell damage of maize seedlings. J. Integr. Plant Biol. 2018, 50, 427–434. [Google Scholar] [CrossRef] [Scilit] [PubMed]
- Qi, H.; Sun, X.; Yan, W.; Ye, H.; Chen, J.; Yu, J.; Jun, D.; Wang, C.; Xia, T.; Chen, X.; et al. Genetic relationships and low diversity among the tea-oil Camellia species in Sect. Oleifera, a bulk woody oil crop in China. Front. Plant Sci. 2020, 13, 996731. [Google Scholar] [CrossRef] [Scilit] [PubMed]
- Quan, W.; Wang, A.; Gao, C.; Li, C. Applications of Chinese Camellia oleifera and its byproducts: A review. Front. Chem. 2022, 10, 921246. [Google Scholar] [CrossRef] [Scilit] [PubMed]
- Wang, J.; Tang, X.; Chu, Q.; Zhang, M.; Zhang, Y.; Xu, B. Characterization of the volatile compounds in Camellia oleifera seed oil from different geographic origins. Molecules 2022, 27, 308. [Google Scholar] [CrossRef] [Scilit] [PubMed]
- Lin, P.; Wang, K.; Wang, Y.; Hu, Z.; Yan, C.; Huang, H.; Ma, X.; Cao, Y.; Long, W.; Liu, W.; et al. The genome of oil-Camellia and population genomics analysis provide insights into seed oil domestication. Genome Biol. 2022, 23, 14. [Google Scholar] [CrossRef] [Scilit] [PubMed]
- Yuan, C.; Yang, B.; Dai, X.; Yang, C. Life table and survival analysis of natural populations of the endemic plant Camellia rubituberculata. Jiangsu Agric. Sci. 2016, 44, 275–280. [Google Scholar] [CrossRef]
- Li, Z.; Yuan, W.; Zhang, Y.; Zhou, L.; Shang, L. Fruit traits and seed germination characteristics of Camellia rubituberculata. North. Hortic. 2025, 2, 34–37. [Google Scholar] [CrossRef] [Scilit]
- Yang, Z.; Cu, J.; Yang, C.; Yang, C.; Yuan, C.; Yang, B.; Dai, X. Experimental study on the breeding for shoots seedlings grafting of Camellia rubituberculata. Guizhou For. Sci. Technol. 2018, 46, 21–24. [Google Scholar] [CrossRef]
- Bi, Y.; Zhang, J.; Song, Z.; Wang, Z.; Qiu, L.; Hu, J.; Gong, Y. Arbuscular mycorrhizal fungi alleviate root damage stress induced by simulated coal mining subsidence ground fissures. Sci. Total Environ. 2019, 652, 398–405. [Google Scholar] [CrossRef] [Scilit] [PubMed]
- Zhang, G.; Zhao, F.; Chen, L.; Pan, Y.; Sun, L.; Bao, N.; Zhang, T.; Cui, C.; Qiu, Z.; Zhang, Y.; et al. Jasmonate-mediated wound signalling promotes plant regeneration. Nat. Plants 2019, 5, 491–497. [Google Scholar] [CrossRef] [Scilit] [PubMed]
- Takahashi, F.; Hanada, K.; Kondo, T.; Shinozaki, K. Hormone-like peptides and small coding genes in plant stress signaling and development. Curr. Opin. Plant Biol. 2019, 51, 88–95. [Google Scholar] [CrossRef] [Scilit] [PubMed]
- Li, K.; Liang, Y.; Xing, L.; Mao, J.; Liu, Z.; Dong, F.; Meng, Y.; Han, M.; Zhao, C.; Bao, L.; et al. Transcriptome analysis reveals multiple hormones, wounding and sugar signaling pathways mediate adventitious root formation in apple rootstock. Int. J. Mol. Sci. 2018, 19, 2201. [Google Scholar] [CrossRef] [Scilit] [PubMed]
- Koo, A.J.K.; Howe, G.A. The wound hormone jasmonate. Phytochemistry 2009, 70, 1571–1580. [Google Scholar] [CrossRef] [Scilit] [PubMed]
- Zhang, T.; Poudel, A.N.; Jewell, J.B.; Kitaoka, N.; Staswick, P.; Matsuura, H.; Koo, A.J. Hormone crosstalk in wound stress response: Wound-inducible amidohydrolases can simultaneously regulate jasmonate and auxin homeostasis in Arabidopsis thaliana. J. Exp. Bot. 2016, 67, 2107–2120. [Google Scholar] [CrossRef] [Scilit] [PubMed]
- Loupit, G.; Cookson, S.J. Identifying molecular markers of successful graft union formation and compatibility. Front. Plant Sci. 2020, 11, 610352. [Google Scholar] [CrossRef] [Scilit] [PubMed]
- Liu, J.; Shi, F.; Guan, J.; Zhang, L.; Cai, S.; Liu, L.; Shen, Y. Effects of NaCl stress on the growth and physiological characteristics of Quercus chenii Nakai. J. Cent. South Univ. For. Technol. 2023, 43, 45–56. [Google Scholar] [CrossRef]
- Liu, J.; Du, C.; Fan, H. Research advance on healing mechanism of plant grafting. J. Zhejiang A F Univ. 2018, 35, 552–561. [Google Scholar] [CrossRef]
- Xu, Q.; Guo, S.; Li, H.; Du, N.; Shu, S.; Sun, J. Physiological aspects of compatibility and incompatibility in grafted cucumber seedlings. J. Am. Soc. Hortic. Sci. 2015, 140, 299–307. [Google Scholar] [CrossRef] [Scilit]
- He, Z.; Zhang, Y.; Xun, C.; Zhang, Z.; Ma, Y.; Wei, X.; Wan, Z.; Wang, R. Analysis of the differences among Camellia oleifera grafting combinations in its healing process. Plants 2025, 14, 2432. [Google Scholar] [CrossRef] [Scilit] [PubMed]
- Melnyk, C.W. Plant grafting: Insights into tissue regeneration. Regeneration 2017, 4, 3–14. [Google Scholar] [CrossRef] [Scilit] [PubMed]
- Notaguchi, M.; Okamoto, S. Dynamics of long-distance signaling via plant vascular tissues. Front. Plant Sci. 2015, 6, 161. [Google Scholar] [CrossRef] [Scilit] [PubMed]
- Melnyk, C.W.; Meyerowitz, E.M. Plant grafting. Curr. Biol. 2015, 25, 183–188. [Google Scholar] [CrossRef] [Scilit] [PubMed]
- Hu, B.; Jiang, Z.; Wang, W.; Qiu, Y.; Zhang, Z.; Liu, Y.; Li, A.; Gao, X.; Liu, L.; Qian, Y.; et al. Nitrate-NRT1.1B-SPX4 cascade integrates nitrogen and phosphorus signaling networks in plants. Nat. Plants 2019, 5, 401–413. [Google Scholar] [CrossRef] [Scilit] [PubMed]
- Wasternack, C.; Song, S. Jasmonates: Biosynthesis, metabolism, and signaling by proteins activating and repressing tran-scription. J. Exp. Bot. 2017, 68, 1303–1321. [Google Scholar] [CrossRef] [Scilit] [PubMed]
- Dong, N.Q.; Lin, H.X. Contribution of phenylpropanoid metabolism to plant development and plant environment interactions. J. Integr. Plant Biol. 2021, 63, 180–209. [Google Scholar] [CrossRef] [Scilit] [PubMed]
- Barros, J.; Escamilla-Trevino, L.; Song, L.; Rao, X.; Serrani-Yarce, J.C.; Palacios, M.D.; Engle, N.; Choudhury, F.K.; Tschaplinski, T.J.; Venables, B.J.; et al. 4-Coumarate 3-hydroxylase in the lignin biosynthesis pathway is a cytosolic ascorbate peroxidase. Nat. Commun. 2019, 10, 1995. [Google Scholar] [CrossRef] [Scilit] [PubMed]
- Shulaev, V.; Cortes, D.; Miller, G.; Mittler, R. Metabolomics for plant stress response. Physiol. Plant 2008, 132, 199–208. [Google Scholar] [CrossRef] [Scilit] [PubMed]
- Barros, J.; Serrani-Yarce, J.C.; Chen, F.; Baxter, D.; Venables, B.J.; Dixon, R.A. Role of bifunctional ammonia-lyase in grass cell wall biosynthesis. Nat. Plants 2016, 2, 16050. [Google Scholar] [CrossRef] [Scilit] [PubMed]
- Dixon, R.A.; Achnine, L.; Kota, P.; Liu, C.; Reddy, M.S.; Wang, L. The phenylpropanoid pathway and plant defence—A ge-nomics perspective. Mol. Plant Pathol. 2002, 3, 371–390. [Google Scholar] [CrossRef] [Scilit] [PubMed]
- Miedes, E.; Vanholme, R.; Boerjan, W.; Molina, A. The role of the secondary cell wall in plant resistance to pathogens. Front. Plant Sci. 2014, 5, 358. [Google Scholar] [CrossRef] [Scilit] [PubMed]
- Aloni, B.; Cohen, R.; Karni, L.; Aktas, H.; Edelstein, M. Hormonal signaling in rootstock-scion interactions. Sci. Horticul-Turae 2010, 127, 119–126. [Google Scholar] [CrossRef] [Scilit]
- Mittler, R.; Zandalinas, S.I.; Fichman, Y.; Breusegemet, F.V. Reactive oxygen species signaling in plant stress responses. Nat. Rev. Mol. Cell Biol. 2022, 23, 663–679. [Google Scholar] [CrossRef] [Scilit] [PubMed]
- Boerjan, W.; Ralph, J.; Baucher, M. Lignin biosynthesis. Annu. Rev. Plant Biol. 2003, 54, 519–546. [Google Scholar] [CrossRef] [Scilit] [PubMed]
- Waszczak, C.; Carmody, M.; Kangasjärvi, J. Reactive oxygen species in plant signaling. Annu. Rev. Plant Biol. 2018, 69, 209–236. [Google Scholar] [CrossRef] [Scilit] [PubMed]
- Tang, J.; Han, Z.; Chai, J. Q&A: What are brassinosteroids and how do they act in plants? BMC Biol. 2022, 20, 133. [Google Scholar] [CrossRef] [Scilit] [PubMed]

Disclaimer/Publisher’s Note: The statements, opinions and data contained in all publications are solely those of the individual author(s) and contributor(s) and not of MDPI and/or the editor(s). MDPI and/or the editor(s) disclaim responsibility for any injury to people or property resulting from any ideas, methods, instructions or products referred to in the content. |
© 2026 by the authors. Licensee MDPI, Basel, Switzerland. This article is an open access article distributed under the terms and conditions of the Creative Commons Attribution (CC BY) license.