Article

Multidimensional Drivers of Green Production in Non-Timber Forest Products: A Cross-Validation of Econometrics and Machine Learning

School of Economics and Management, Beijing Forestry University, Beijing 100083, China
*
Author to whom correspondence should be addressed.
These authors contributed equally to this work.
Forests 2026, 17(8), 875; https://doi.org/10.3390/f17080875
Submission received: 30 April 2026 / Revised: 10 July 2026 / Accepted: 25 July 2026 / Published: 27 July 2026

Abstract

Based on survey data from 579 farmer households in major non-timber forest product (NTFP) regions of Zhejiang Province, this study comprehensively employs binary logit/ordered probit and machine learning methods for cross-validation. It systematically examines the effects of multiple factors, including perceived property rights security, technical training, village rules and regulations, ecological awareness, and economic incentives, on forest farmers’ adoption of green production technologies. The cross-validation between econometric and machine learning approaches enhances the reliability of the findings. Results show that perceived property rights security is robustly and positively associated with green production behavior, while village rules and regulations and ecological awareness emerge as the two most critical driving factors. These associations exhibit significant NTFP-type heterogeneity: the impacts of technical training and forestry subsidies vary in direction depending on the crop cultivated, rendering traditional one-size-fits-all policies ineffective. This study highlights the crucial role of informal institutions and environmental awareness in the green transition, offering empirical evidence for designing differentiated training programs, optimizing penalty gradients, and implementing targeted subsidy policies.

1. Introduction

Non-timber forest products (NTFPs) play a critical role in achieving the synergy between sustainable forestry development and income growth for mountain forest farmers [1,2]. As a national pioneer in the under-forest economy, Zhejiang Province has introduced a series of policy measures since 2024, including the Several Policy Measures on Accelerating the High-Quality Development of the Under-Forest Economy. These policies explicitly set goals such as establishing over 100 common-prosperity parks for the under-forest economy and generating an additional RMB 20 billion in output value, while incorporating green production behavior (GPB) into the core evaluation indicators for forest food certification and standardized forestry land development. Nevertheless, in practice, the adoption rate of green production technologies among forest farmers remains low [3]. Their behavioral decisions are influenced by a complex set of factors, including property rights institutions, technical training, village rules and regulations, ecological awareness, and economic incentives [4]. Identifying the direction, relative importance, and heterogeneity of these factors is of urgent practical significance for optimizing policy design [5,6].
Existing research has yielded substantial findings on farmers’ GPB, yet systematic analyses focusing on NTFPs as a unique operational object remain insufficient [7,8]. The relationship between property rights security and forest farmers’ long-term green investment behavior is often simplified to the legal dimension of holding forest tenure certificates, neglecting the more direct psychological factor of farmers’ perceived property rights security [9]. Regarding technical training, most studies assume a uniformly positive effect [10]. However, technical requirements and training adaptability may vary across different NTFP types, and the heterogeneity of training effects has not received sufficient attention. Furthermore, how the stringency of penalties in village rules and regulations is associated with GPB, and how ecological awareness is related to it requires further empirical testing [11,12]. Theoretically, the integrated application of the Theory of Planned Behavior, Property Rights Theory, and Incentive Theory remains largely conceptual, lacking systematic empirical testing of these multidimensional factors [13,14,15]. Methodologically, while traditional econometric models provide marginal effect estimates, they struggle to capture nonlinear relationships and high-order interaction effects among variables. In contrast, machine learning methods excel at prediction and feature ranking but are often criticized for their black-box nature, which lacks economic interpretability [16,17].
To address these gaps, this study aims to identify the key drivers and NTFP-type heterogeneity of forest farmers’ green production behavior in NTFP production. Drawing on survey data from 579 farmer households in the main NTFP-producing regions of Zhejiang Province, this study constructs an analytical framework encompassing perceived property rights security, technical training, village rules and regulations, ecological awareness, economic incentives, and operational characteristics. First, binary logit and ordered probit models are employed to estimate the marginal effects of each factor on the adoption decision and adoption intensity of green production technologies, followed by NTFP-type heterogeneous group regressions. Second, machine learning models are used to output feature importance rankings, and Shapley Additive Explanations (SHAP) values are applied to visualize the nonlinear relationships and interaction effects of key variables. By comparing out-of-sample prediction accuracy and mutually validating variable importance across methods, this study verifies the stable positive effect of these factors on GPB. This approach not only retains the economic meaning of marginal effects but also uncovers the nonlinear patterns and interaction effects of core variables such as village rules and regulations and ecological awareness, offering empirical evidence for differentiated NTFP green production policies. The remainder of this paper is organized as follows: Section 2 develops the theoretical framework and hypotheses; Section 3 describes the data and methods; Section 4 presents the results and discussion; and Section 5 concludes with policy implications.

2. Theoretical Analysis and Research Hypotheses

2.1. Theoretical Basis

The theoretical analysis of this study integrates the Theory of Planned Behavior, Property Rights Theory, and Incentive Theory. The Theory of Planned Behavior posits that behavioral intention is jointly determined by attitudes toward behavior, subjective norms, and perceived behavioral control [18]. In the context of green production decisions for NTFPs, forest farmers’ ecological awareness, the social pressure from village rules and regulations, and perceived property rights security together with resource conditions shape their adoption intensity and behavior. Property Rights Theory emphasizes that the security and stability of property rights directly affect resource users’ incentives to make long-term investments and adopt sustainable management practices [19,20]. For forestland management, subjectively perceived property rights security constitutes the core property rights foundation of farmers’ decision-making. Incentive Theory suggests that economic incentives and organizational support can promote the adoption of GPB by reducing costs and increasing expected benefits [21]. Based on the above theories, this study classifies influencing factors into five categories, property rights security, human and social capital, economic incentives, operational characteristics, and external environment, and examines their effects on the adoption decision and adoption intensity of green production practices.

2.2. Perceived Property Rights Security and GPB

Property rights security is a key prerequisite for motivating forest farmers to undertake long-term green investments. According to Property Rights Theory, when forestland rights are clear and protected, farmers are more willing to invest in sustainable management measures with longer payback periods [22]. Behavioral economics research indicates that subjective perceptions often influence decisions more directly than objective facts [23]. Even if forestland is objectively free of disputes, farmers’ willingness to make long-term green investments may still be suppressed if they worry about future policy changes or potential rights infringement. Only when farmers are subjectively convinced that their rights and interests are protected can the endogenous incentive for GPB be fully realized. Therefore, this study focuses on forest farmers’ perceived property rights security regarding forestland. Accordingly, we propose Hypothesis 1 (H1): A higher level of perceived property rights security is positively associated with GPB.

2.3. Roles of Technical Training, Village Rules, and Ecological Awareness

Technical training is an important intervention for enhancing forest farmers’ capacity to adopt green production technologies. Through systematic knowledge transfer and skill acquisition, technical training can lower the technical barriers and cognitive costs of green production [24]. However, differences in technical requirements, training content, and applicability across NTFP types may lead to heterogeneous training effects. For example, bamboo has a short management cycle and fast regrowth, making training effects readily observable; in contrast, tea production demands high quality control, and inappropriate training may even be counterproductive. Therefore, this study argues that the effect of technical training is not uniformly positive but exhibits heterogeneity across NTFP types. Accordingly, we propose Hypothesis 2 (H2): The effect of the frequency of forestry technical training is heterogeneous (varying by NTFP type).
Village rules and regulations, as informal institutional arrangements in rural communities, constrain farmers’ production and management behaviors through social sanctions and reputational mechanisms. In the context of NTFP production, such rules may be related to forestland protection, fertilizer and pesticide use, harvesting behavior, waste disposal, and other practices that affect the ecological quality of products such as Moso Bamboo, Camellia Oleifera, and Tea Plant. The severity of penalties for undesirable behaviors is a core manifestation of the binding force of village rules and regulations [25]. Moderate penalty severity can create effective deterrence while maintaining acceptability among community members, thereby incentivizing the internalization of green production norms. Meanwhile, ecological awareness reflects the extent to which forest farmers recognize that green production contributes to the value realization of forest products, and is a direct manifestation of attitudes toward behavior in the Theory of Planned Behavior [26]. Farmers with higher levels of ecological awareness are more inclined to adopt green production technologies. Thus, village rules and regulations and ecological awareness represent two different but complementary mechanisms: the former reflects external community-level constraints, while the latter reflects farmers’ internal environmental motivation. Accordingly, we propose Hypothesis 3 (H3): Village rules and regulations and ecological awareness have positive associations on GPB.

2.4. Economic Incentives and Heterogeneity in Operational Characteristics

Economic incentives are an important external driver influencing forest farmers’ GPB. Forestry subsidies directly reduce the marginal cost of green production and, through a signaling effect, enhance farmers’ expectations and confidence in policy support [27]. The greater the number of subsidy programs, the stronger the policy support received by farmers, and the more likely they are to adopt green production technologies. At the same time, the share of forestry income in total household income reflects the degree to which farmers’ livelihoods depend on forestry operations. The higher this share, the greater the long-term incentive for farmers to maintain forestland productivity and adopt green and sustainable production methods to secure their long-term income sources. Accordingly, we propose Hypothesis 4 (H4): The number of forestry subsidies and the share of forestry income have positive effects on GPB.
Different types of NTFPs exhibit significant differences in growth cycles, market values, technical requirements, and policy attention [28]. Bamboo has a short management cycle and fast regrowth; oil tea has a long payback period and high upfront investment; and tea production demands high quality control and brand development. These differences may lead to heterogeneity in the factors influencing GPB across crop types. Furthermore, forestland area reflects operational scale; farmers with larger areas may be more willing to adopt green technologies due to economies of scale. The number of forestland plots reflects the degree of land fragmentation; too many plots may increase coordination costs and monitoring difficulty, inhibiting the overall adoption of green technologies. Accordingly, we propose Hypothesis 5 (H5): NTFP type and operational scale have heterogeneous effects on GPB. Based on the above analysis, the final core hypotheses are summarized in Table 1.

3. Data and Methods

3.1. Study Area and Sampling Design

The data used in this study were obtained from a field survey conducted by the research team in Zhejiang Province from February to April 2026. Zhejiang Province is one of the major NTFP-producing regions in China, with a well-developed under-forest economy and abundant practical experience in green development [29]. It is also the birthplace of the concept “lucid waters and lush mountains are invaluable assets” and a national pioneer demonstration zone for ecological civilization construction. Therefore, selecting Zhejiang Province as the study area provides a typical and representative context for examining forest farmers’ adoption of green production technologies.
The sampling design combined stratified sampling, purposive sampling, and random sampling. First, based on the dominant NTFP production areas in Zhejiang Province, three representative crops, namely Moso Bamboo, Camellia Oleifera, and Tea Plant, were selected as case crops. These crops are not only important components of the local NTFP industry, but also represent different production and management characteristics. Moso Bamboo has a short management cycle and strong regeneration capacity, Camellia Oleifera requires relatively long-term investment, and Tea Plant involves higher requirements for quality control and refined management. Thus, these three crops provide suitable cases for examining NTFP-type heterogeneity in GPB. Second, five sample counties were selected according to NTFP production conditions. In each county, 2–3 townships were selected based on cooperative distribution, economic development, and geographical location; within each township, 2–3 administrative villages were chosen. Finally, with the assistance of village committees and local cooperatives, eligible households engaged in the three target crops were identified, and farmer households were randomly selected for face-to-face surveys. A total of 620 questionnaires were distributed, and 579 valid questionnaires were returned, yielding an effective response rate of 93.4%. The sample covered forest farmers with different ages, education levels, and operational scales, demonstrating good representativeness.

3.2. Descriptive Statistics

Table 2 provides clear definitions and descriptive statistics for the core variables. The dependent variables are adoption (AD) and adoption intensity (AI). AD is a binary variable coded as 1 if the forest farmer adopts green production technologies and 0 otherwise. Its mean is 0.693 (SD = 0.462). AI is an ordered categorical variable reflecting the number of green production technologies adopted, with a mean of 1.731 (SD = 1.343). The explanatory variables cover individual characteristics, household characteristics, operational characteristics, cognitive levels, and crop types. The age distribution of forest farmers is relatively dispersed; males account for the vast majority (mean gender = 0.896), and the mean age is 50.254 years. The mean years of education is 7.630, indicating a relatively low level of education overall. The mean household labor force size is 2.394 members. The mean number of forestry subsidies received is 0.625, suggesting that subsidy coverage is not high. The mean forestland area is 3.471 hectares, and the mean number of forestland plots is 4.067, reflecting a fragmented pattern of forestland management. The mean ecological awareness is 0.625, indicating that more than 60% of forest farmers agree that green production contributes to the value realization of forest products. All variables are defined in detail in Table 2.

3.3. Econometric Model Specification

Before model specification, a multicollinearity test was first conducted using the Pearson correlation coefficient. The formula for calculating the correlation coefficient R is as follows:
R = i = 1 n x i x ¯ y i y ¯ i = 1 n x i x ¯ 2 i = 1 n y i y ¯ 2 ,
where xi and yi denote the values of the i-th variable, and x ¯ and y ¯ represent the means of all input explanatory variables x and the dependent variable y, respectively. For the binary variable of adoption (AD), this study employs a binary logit model.
This model assumes that the probability of a forest farmer adopting GPB follows a logistic distribution. Let the dependent variable ADi take the value 1 if adopted and 0 if not adopted. The core formula is as follows [30]:
P A D i = 1 X i = e x p X i β 1 + e x p X i β ,
where Xi is the vector of explanatory variables and β is the vector of coefficients to be estimated. This formula represents the probability of adoption given the independent variables, and the model is estimated using the maximum likelihood estimation method. For the ordered categorical variable of AI, which ranges from 0 to 4, this study employs an ordered probit model. This model is based on a latent variable framework, assuming the existence of an unobservable continuous latent variable AIi*, with the following linear expression [31]:
A I i * = X i β + ϵ i ,   ϵ i ~ N 0 1 ,
where ϵi follows a standard normal distribution. Furthermore, based on a threshold model, the continuous latent variable AIi* is mapped to the ordered observed outcomes (levels 0 to 4). The model estimates a set of cutoff points (thresholds μ1 < μ2 < … < μ4), and the observed AIi is determined by which interval AIi* falls into [32]:
A I i = 0 , if   A I i * μ 1 1 , if   μ 1 < A I i * μ 2 2 , if   μ 2 < A I i * μ 3 3 , if   μ 3 < A I i * μ 4 4 , if   A I i * > μ 4 ,
Thus, the probability that a forest farmer’s AI equals a specific level j can be expressed as:
P A I i = j X i = Φ μ j + 1 X i β Φ μ j X i β ,
where Φ(·) is the standard normal cumulative distribution function, and we define μ0 = −∞, μ5 = +∞. The thresholds μ1 through μ4 are estimated jointly with the coefficient vector β using the maximum likelihood estimation method. Unlike ordinary least squares, the ordered probit model has a discrete ordered-dependent variable; therefore, maximum likelihood estimation is employed to ensure the consistency and efficiency of the parameter estimates. To test the robustness of the model, the ordinary least squares (OLS) model is further employed for robustness checks.

3.4. Machine Learning Model Establishment

For the binary variable of adoption (whether to adopt it), this study employs binary classification models for prediction. For the ordered categorical variable of AI, multi-class classification models are used. To capture potential complex nonlinear relationships and interaction effects among variables, this study further establishes machine learning prediction models. The algorithm selection is based on an ensemble learning framework, and a total of nine classification algorithms are compared, including K-Nearest Neighbors, Logistic Regression, Support Vector Machine, Decision Tree, Random Forest, Gradient Boosting Tree, eXtreme Gradient Boosting (XGB), Multi-Layer Perceptron, and Light Gradient Boosting Machine [33,34,35,36]. All 579 samples were randomly divided into a training set and a test set at a ratio of 8:2, resulting in 463 samples in the training set and 116 samples in the test set. Grid search was used for hyperparameter tuning, and accuracy and F1 score were adopted as comprehensive metrics for evaluating model performance. The formulas for accuracy and F1 score are as follows [37]:
Accuracy = T P + T N T P + T N + F P + F N ,
where TP (true positive), TN (true negative), FP (false positive), and FN (false negative) are defined. For binary classification problems, the F1 score is calculated as:
F 1 = 2 × Precision × Recall Precision + Recall ,
where precision equals TP/(TP + FP) and recall equals TP/(TP + FN). For multi-class classification problems, this study adopts a weighted average approach to compute the F1 score, fully taking into account class imbalance. The calculation of the weighted F1 score involves three steps. First, precision and recall are calculated separately for each class. Second, the F1 score for each class is obtained. Third, the F1 scores of all classes are weighted summed using the proportion of samples in each class to the total number of samples as the weight. The specific calculation is as follows:
Suppose there are K classes. For the k-th class, let TPk denote the number of true positives, FPk the number of false positives, and FNk the number of false negatives. Then [38]:
F 1 k = 2 × Precision k × Recall k Precision k + Recall k .
Let nk be the number of samples in the k-th class and N the total number of samples. The weight for that class is wk = nk/N. The weighted F1 score is then calculated as:
Weighted F 1 = k = 1 K w k × F 1 k .
In this study, the weighted F1 score described above is uniformly adopted as one of the evaluation metrics for multi-class classification tasks, and together with accuracy, it is used for comparing and selecting among the nine classification algorithms.
To further explore the complex interaction effects of explanatory variables on forest farmers’ adoption of GPB, this study introduces the SHAP (Shapley Additive Explanations) algorithm based on game theory for feature importance and marginal contribution analysis. The SHAP algorithm employs a contribution accumulation interpretation strategy, approximating the output of the black-box machine learning model as a linear sum of contributions from each input variable, and decomposes the prediction for each sample. The SHAP value ϕj of a single variable jj to the prediction f(x) is defined as follows [39,40]:
ϕ j = S F j S ! F S 1 ! F ! f S j f S ,
where F is the set of all features, S is any subset of features not containing j, and f(S) denotes the model prediction using only the features in subset S.

4. Results and Discussion

4.1. Benchmark Regression Results

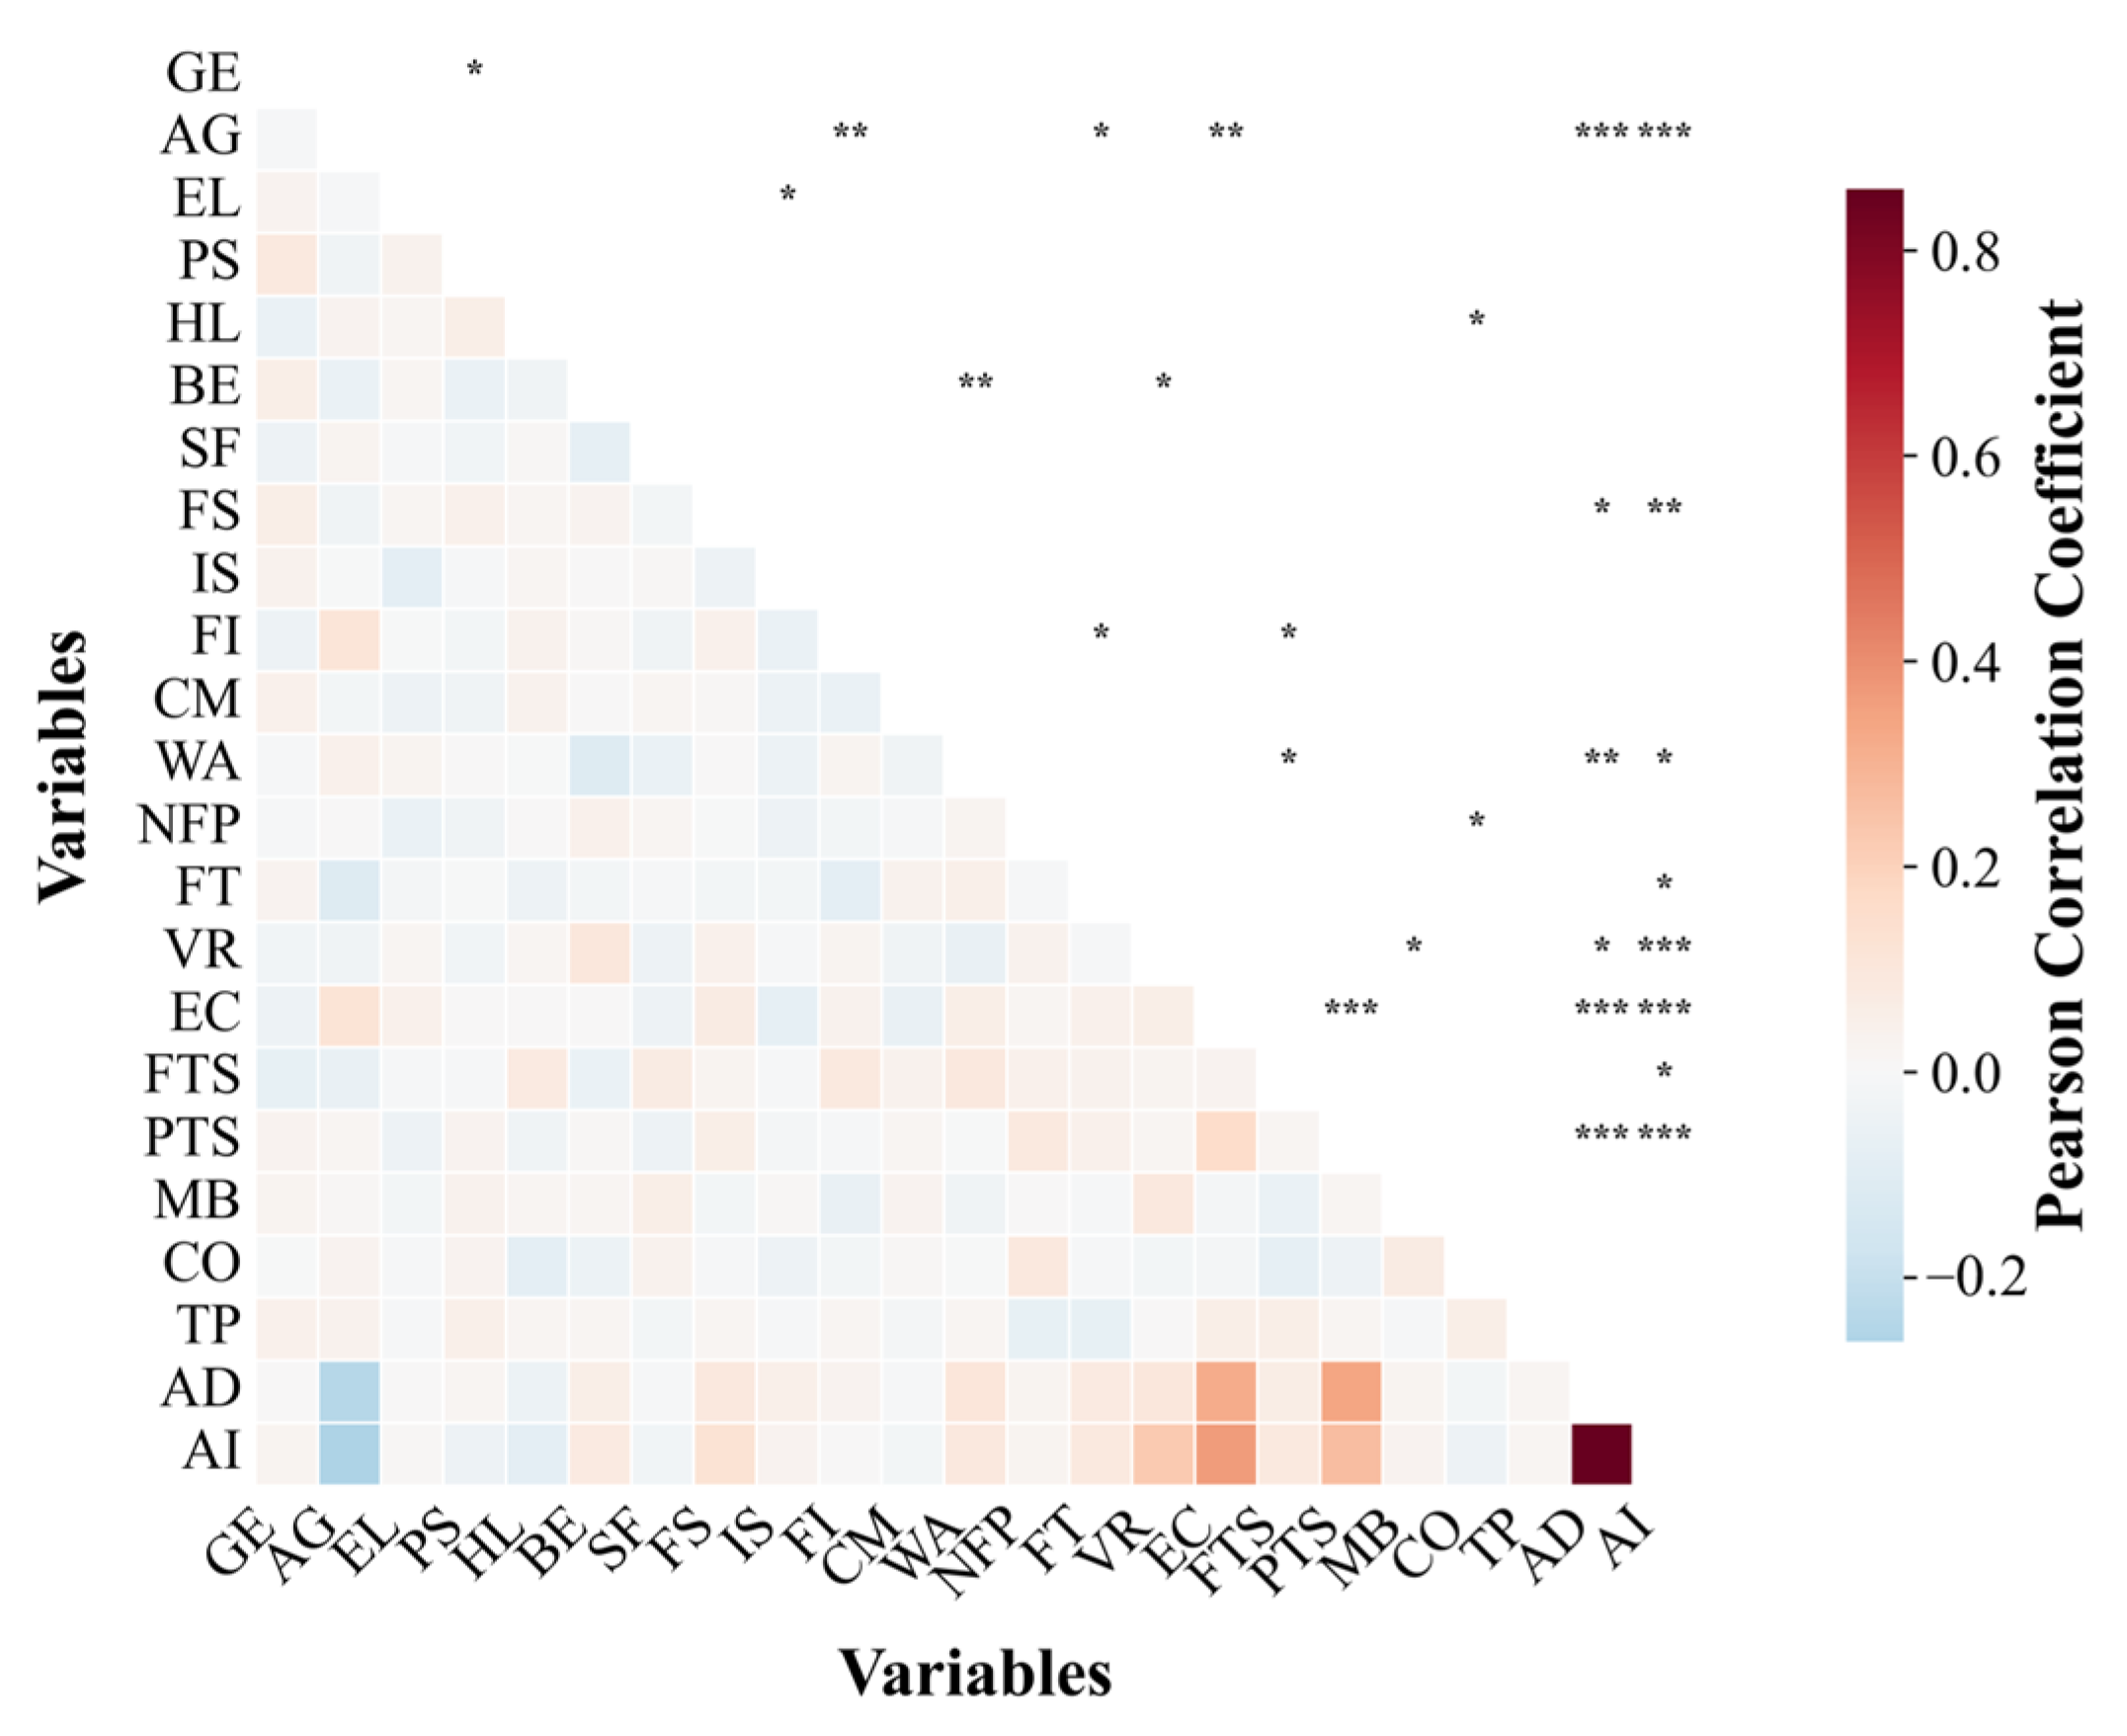
To test for multicollinearity among the model variables, this study calculated the Pearson correlation coefficients between all explanatory variables (Figure 1). The correlations between all explanatory variables were below 0.6, confirming that multicollinearity is not a serious concern.
Based on the regression results presented in Table 3, in terms of overall model fit, the likelihood ratio chi-square of the AI model is 242.548, significant at the 1% level. The McFadden R2 is 0.144, indicating that the model has good explanatory power. The estimation results of the AD model are largely consistent with those of the AI model in terms of variable significance. For example, age (AG), income share (IS), forestland area (WA), village rules and regulations (VR), ecological awareness (EC), and perceived property rights security (PTS) are all significant and have the same direction of effects, indicating that the conclusions of the two models are consistent (Table 3).
The benchmark regression results show that perceived property rights security is robustly and positively associated with GPB. In the AI model, the coefficient of perceived property rights security (PTS) is 0.249, significantly positive at the 1% level (z = 5.619). In the AD model, it is also significantly positive (coefficient 0.896, p < 0.01). This indicates that stronger subjective perceptions of forestland rights protection increase farmers’ adoption intensity of green production technologies. Thus, stable perceived property rights can strengthen farmers’ willingness to make long-term green investments, supporting H1.
Village rules and regulations and ecological awareness also have significant positive effects on GPB. In the AI model, the coefficients of village rules and regulations (VR) and ecological awareness (EC) are 0.380 and 0.932, respectively, both significant at the 1% level. In the AD model, VR is marginally significant at the 10% level, while EC remains significantly positive at the 1% level. These results indicate that moderate penalties and ecological value recognition can promote both adoption decisions and adoption intensity. This suggests that informal institutions and ecological awareness are important internal mechanisms shaping farmers’ green production behavior, supporting H3.
Economic incentives show positive but relatively weaker effects. The coefficient of forestry subsidies (FS) is 0.190, significant at the 5% level, while the coefficient of income share (IS) is 0.331, marginally significant at the 10% level. Both positive coefficients indicate that subsidies and higher forestry income dependence can enhance farmers’ adoption intensity. This confirms the role of economic incentives in reducing green production costs and strengthening long-term production motivation, supporting H4.
By contrast, technical training, crop type, and operational scale are not directly supported in the full-sample regression. This suggests that the effects proposed in H2 and H5 may vary across NTFP types and therefore require further NTFP-type heterogeneity analyses.
To test the robustness of the benchmark regression results, we further employ the OLS model to estimate the dependent variables (AD and AI). The results, presented in Table 4, show that the significance and direction of the effects for the core explanatory variables are highly consistent with those from the logit/probit regression results in Table 3. For example, key variables such as forestland area (WA), village rules and regulations (VR), ecological awareness (EC), and perceived property rights security (PTS) maintain consistent coefficient signs and significance levels in the AD and AI estimations across both model specifications. This indicates that the core findings of the baseline regression regarding the positive roles of perceived property rights security, informal institutions, and ecological awareness in promoting farmers’ adoption of green production practices are robust to alternative model specifications.

4.2. Heterogeneity Analysis

Based on the heterogeneity analysis results presented in Table 5, this study conducted group regressions according to three NTFP types (Moso Bamboo, Camellia Oleifera, and Tea Plant) to further test the robustness and heterogeneity of each hypothesis across different grower groups. In terms of model fit, the likelihood ratio chi-square of each group model is significant, and the McFadden R2 ranges from 0.132 to 0.471, indicating that the models have reasonable explanatory power. Regarding sample sizes, the Moso Bamboo group has 123 observations, the Camellia Oleifera group 152 observations, and the Tea Plant group 166 observations. Overall, the effects of age, ecological awareness, and perceived property rights security are consistent across groups, while factors such as business experience, forestry subsidies, forestland area, village rules and regulations, and training exhibit significant between-group heterogeneity.
H1 is further supported in the heterogeneity analysis. Perceived property rights security (PTS) is significantly positive in all groups and in both models, with significance levels reaching 1%. This indicates that, regardless of whether farmers plant Moso Bamboo, Camellia Oleifera, or Tea Plant, their subjective perception of forestland rights protection consistently promotes the adoption and AI of green production technologies. Thus, H1 has universal applicability across crops.
H2 is supported in the heterogeneity analysis. Forestry technical training (FT) is marginally significantly positive in the AD model for the Moso Bamboo group (coefficient 0.460, p < 0.1), but significantly negative in the AI model for the Tea Plant group (coefficient −0.116, p < 0.1), with opposite directions. This result supports the heterogeneity hypothesis H2, i.e., the effect of training varies by crop type: it has a positive effect on Moso Bamboo growers but a negative effect on Tea Plant growers.
H3 is further supported in the heterogeneity analysis. Ecological awareness (EC) is significantly positive in all groups and in both models (p < 0.01), making it one of the most robust core variables. Village rules and regulations (VR) are significantly positive in the AI models for all three groups (significance levels of 5%, 1%, and 1%, respectively), but are mostly insignificant in the AD models. This indicates that village rules and regulations mainly positively affect AI rather than the adoption decision. The overall positive-effect hypothesis (H3) receives cross-group support.
H4 is partially supported in the heterogeneity analysis. Forestry subsidies (FS) are significantly positive in the AI models for the Moso Bamboo and Camellia Oleifera groups (p < 0.05), but are insignificant in the Tea Plant group, suggesting that subsidy policies are effective for Moso Bamboo and Camellia Oleifera growers but not clearly effective for Tea Plant growers. Income share (IS) is not significant in any group, and its positive effect is not robustly supported in the heterogeneity analysis. Thus, H4 is partially supported.
H5 is supported in the heterogeneity analysis. The group regression results show that the effects of several variables vary by NTFP type: business experience (BE) is significantly positive only in the Moso Bamboo group; forestry subsidies (FS) are significant in the Moso Bamboo and Camellia Oleifera groups but insignificant in the Tea Plant group; forestland area (WA) is significantly positive in the Moso Bamboo group, marginally significant in the Camellia Oleifera group, and insignificant in the Tea Plant group; forestry technical training (FT) has opposite directions between the Moso Bamboo and Tea Plant groups. These results indicate that NTFP type is an important source of heterogeneity, and operational scale (forestland area) has a stronger promoting effect for Moso Bamboo growers. Thus, H5 is supported.
The heterogeneity analysis further confirms the robustness of H1 and H3, validates the expected heterogeneity of H2 and H5, and provides partial support for H4.

4.3. Machine Learning Model Results

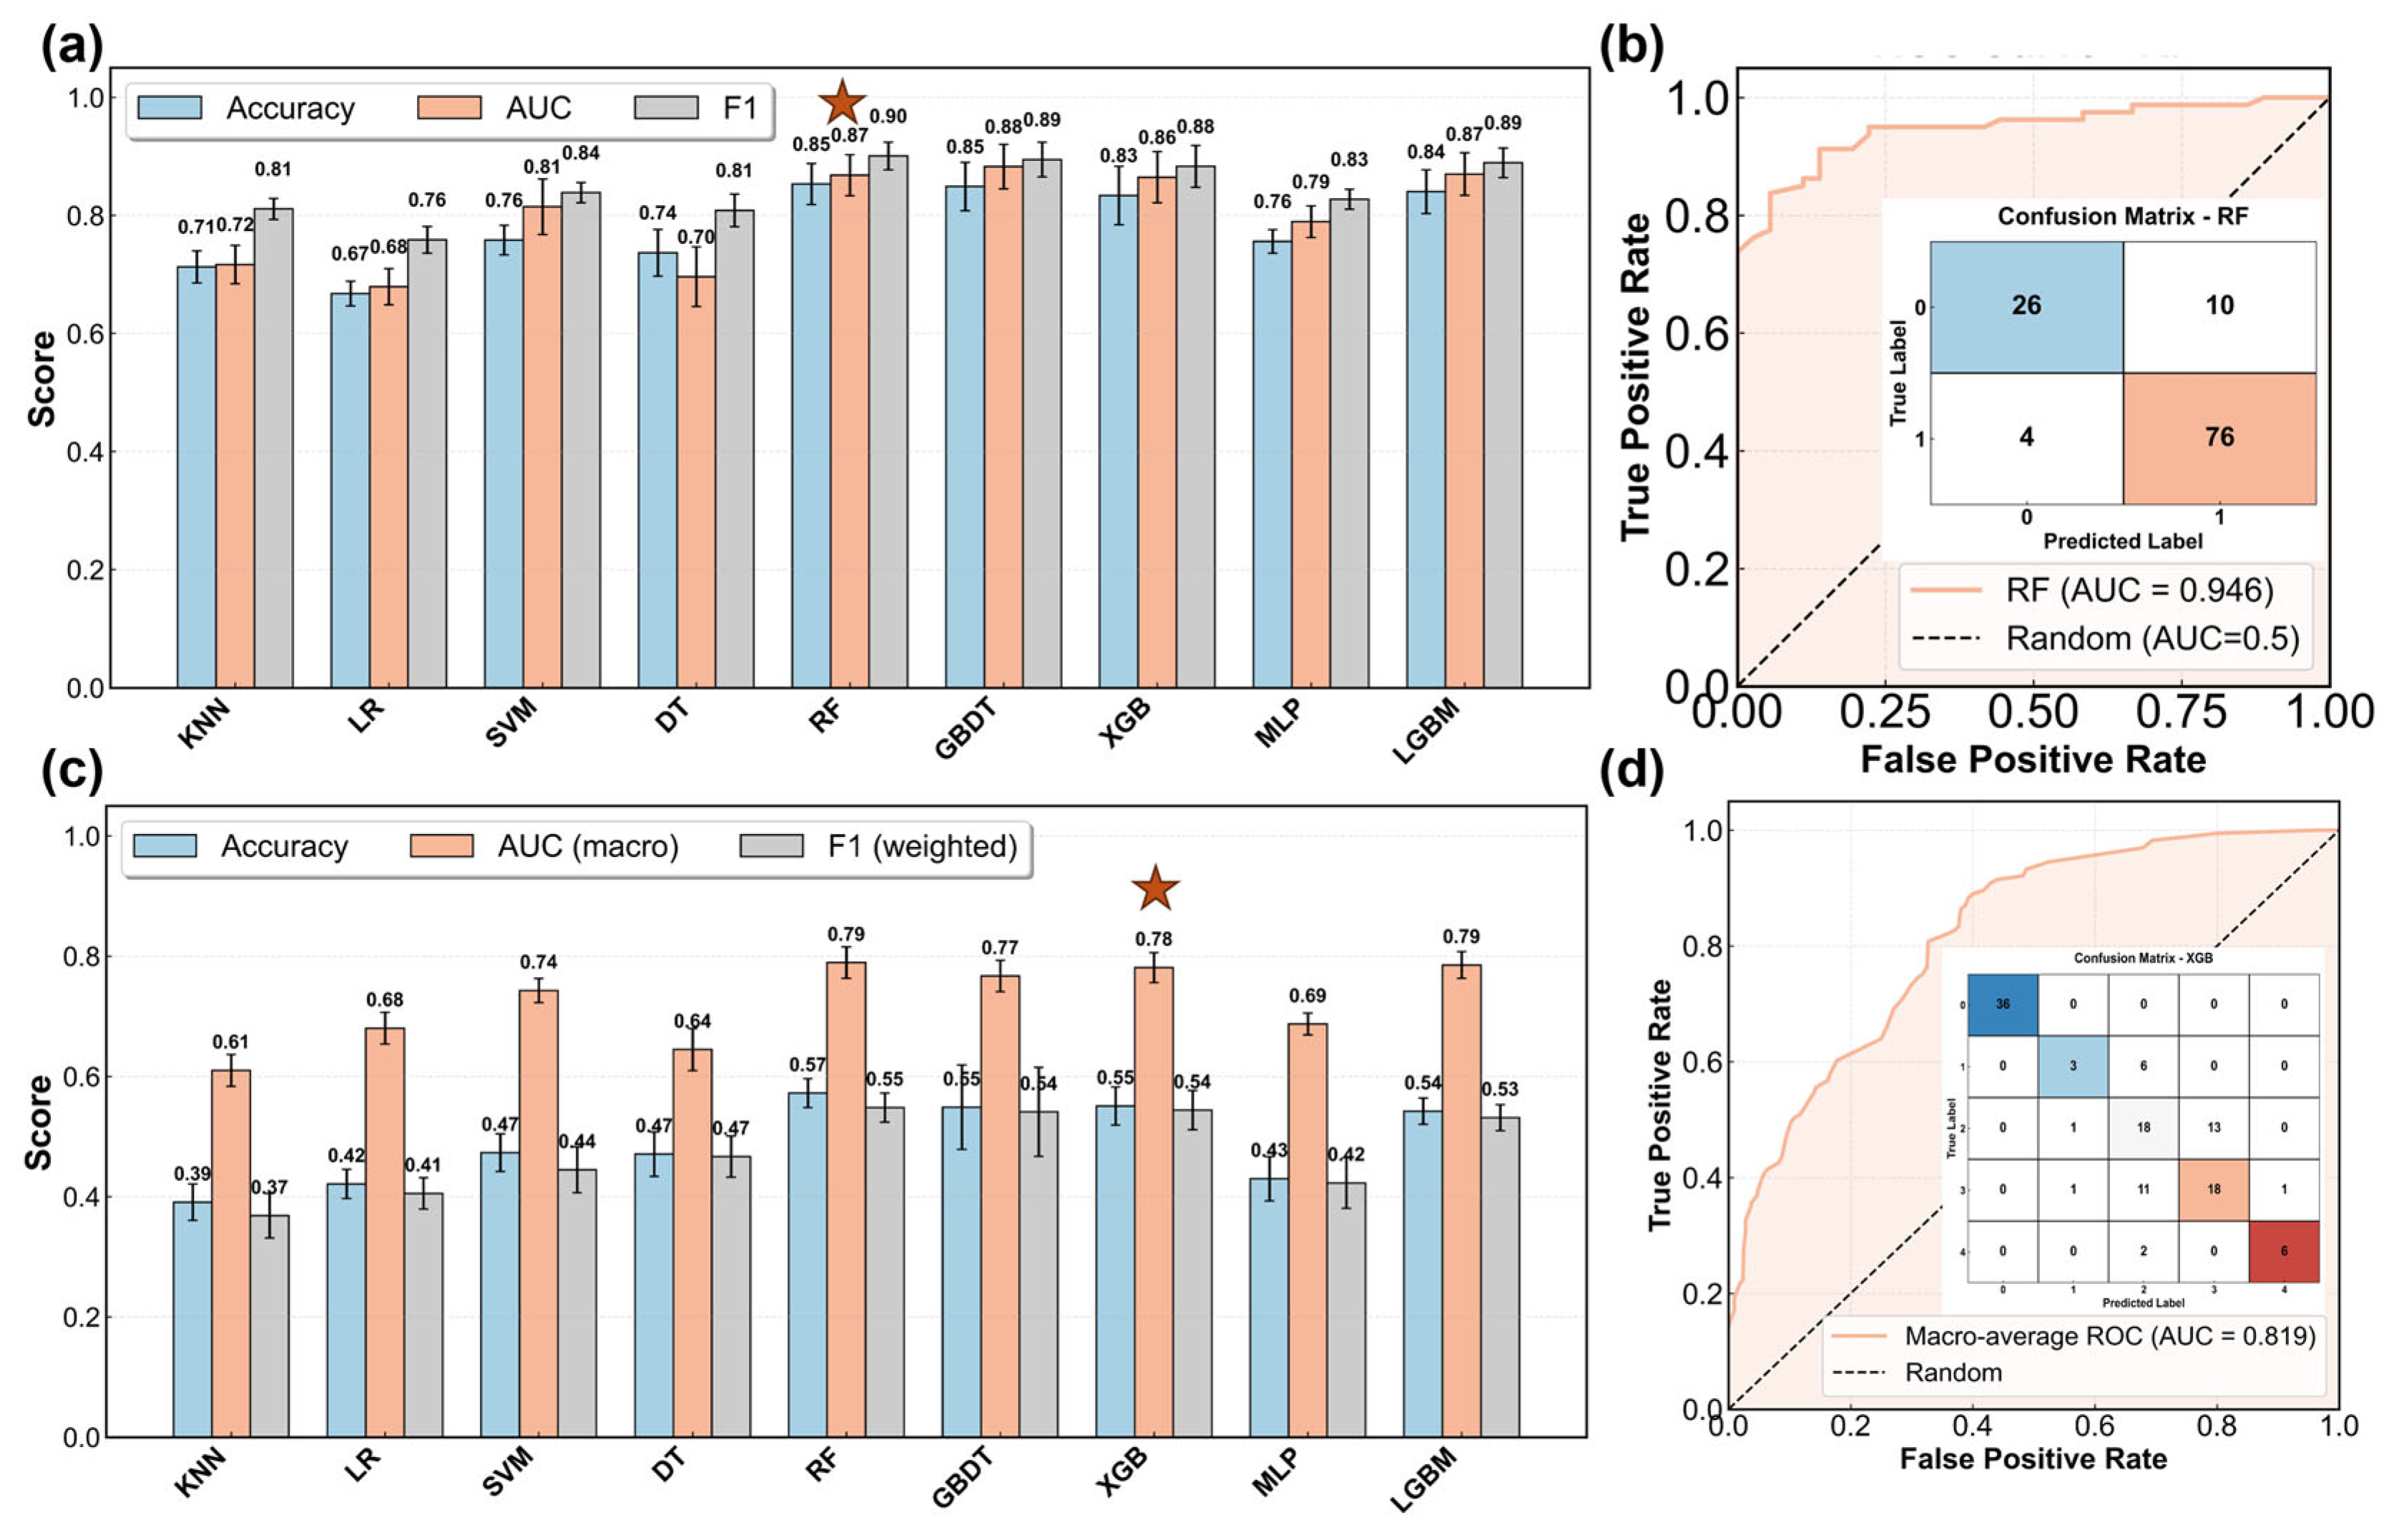
For the binary-dependent variable AD (adoption decision) and the multi-class-dependent variable AI (adoption intensity), we compared several machine learning algorithms. Figure 2a presents the five-fold cross-validation accuracy of different machine learning algorithms. For the binary classification task, all models exhibited a good predictive performance. Among them, RF achieved the best overall performance, with an average accuracy of 0.85, an AUC of 0.87, and an F1 score of 0.90. GBDT ranked second, with an accuracy of 0.85, an AUC of 0.88, and an F1 score of 0.89. Overall, ensemble tree-based models significantly outperformed traditional linear models (e.g., logistic regression) and KNN in the binary classification task. For the best-performing RF model, its ROC curve and confusion matrix are shown in Figure 2b. The AUC of the RF model on the validation set reached as high as 0.946, demonstrating high predictive accuracy.
For the multi-class classification task, the predictive performance of all models was generally lower than that for the binary classification task, reflecting the greater complexity of the multi-class problem (Figure 2c). The XGB model performed relatively the best, with an average accuracy of 0.55, an AUC of 0.78, and an F1 score of 0.54. The ROC curve of the XGB model shows that the AUC reaches 0.819, while the misclassifications in the confusion matrix are concentrated in categories 2 and 3 (Figure 2d). Since categories 2 and 3 are adjacent, these misclassifications have a relatively minor impact on the subsequent interpretability analysis, and the model results remain reasonably reliable.
Based on the comparison of the results from the two tasks, this study selects the best-performing RF model for the binary classification task and the best-performing XGB model for the multi-class classification task for subsequent SHAP interpretability analysis.
Based on the variable importance ranking results presented in Table 6, this study compares the importance of each variable in the AD model and the AI model. The importance value reflects the contribution of a variable to model prediction; the higher the ranking, the more critical the influence.
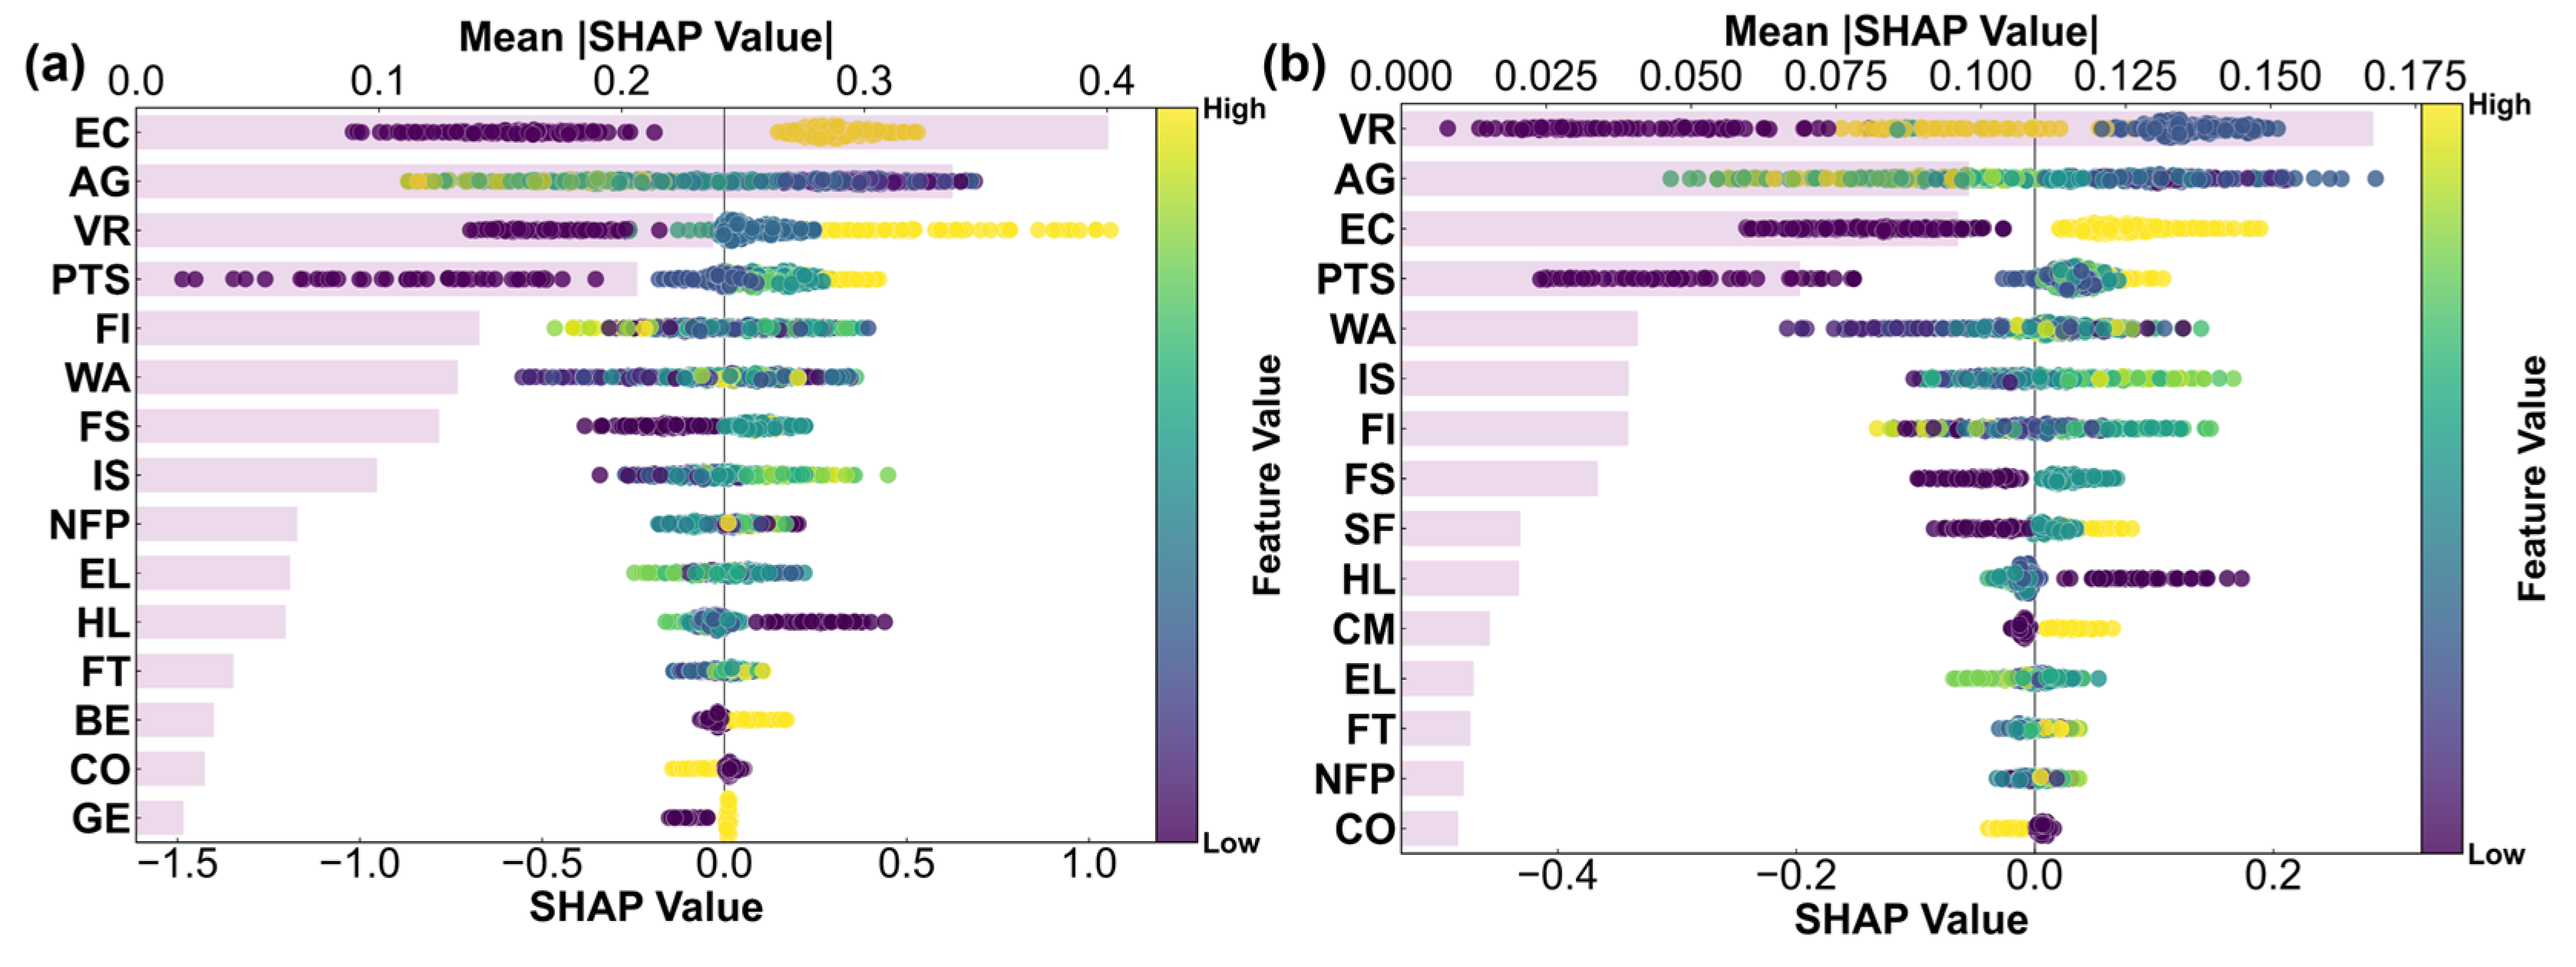
In the AD model, the top-five variables in terms of importance are ecological awareness (EC), age (AG), village rules and regulations (VR), perceived property rights security (PTS), and forestry income (FI) (Figure 3a). Among them, ecological awareness has an importance value of 0.195, ranking first. Its regression coefficient is 1.755, significant at the 1% level, indicating that cognitive factors are the most critical variables affecting the adoption decision, further supporting H3 (positive effects of village rules and regulations and ecological awareness). Age ranks second with an importance value of 0.163, with a negative coefficient significant at the 1% level. Village rules and regulations rank third with an importance value of 0.116, with a positive coefficient significant at the 10% level, also validating H3. Perceived property rights security ranks fourth with an importance value of 0.100, with a positive coefficient significant at the 1% level, providing strong evidence from the machine learning perspective for H1 (positive effect of perceived property rights security). Forestry income ranks fifth with an importance value of 0.069, but its coefficient is not significant, indicating that although this variable contributes to model prediction, it is not statistically robust. Forestland area (WA) ranks sixth with an importance value of 0.064, with a positive and significant coefficient. Forestry subsidies (FS) rank seventh with an importance value of 0.061, with a positive but non-significant coefficient. Income share (IS) ranks eighth with an importance value of 0.048, with a positive and significant coefficient. The importance values of the remaining variables are all below 0.04, indicating relatively small contributions.
In the AI model, the top-five variables in terms of importance are village rules and regulations (VR), age (AG), ecological awareness (EC), perceived property rights security (PTS), and forestland area (WA) (Figure 3b). Among them, village rules and regulations have an importance value of 0.238, ranking first and far exceeding other variables. Its regression coefficient is 0.380, significant at the 1% level, indicating that village rules and regulations contribute the most to predicting AI, again validating H3. Age ranks second with an importance value of 0.139, with a negative and significant coefficient. Ecological awareness ranks third with an importance value of 0.136, with a positive and significant coefficient, further supporting H3. Perceived property rights security ranks fourth with an importance value of 0.098, with a positive and significant coefficient, reinforcing the robustness of H1. Forestland area ranks fifth with an importance value of 0.058, with a positive and significant coefficient. Income share ranks sixth with an importance value of 0.056, with a positive coefficient significant at the 10% level, providing partial support for H4. Forestry income ranks seventh with an importance value of 0.056, but its coefficient is not significant. Forestry subsidies rank eighth with an importance value of 0.048, with a positive and significant coefficient, also partially supporting H4. Soil fertility (SF) ranks ninth with an importance value of 0.029, but its coefficient is not significant. Household labor force (HL) ranks tenth with an importance value of 0.029, with a negative and significant coefficient.
Comparing the two models, it can be seen that ecological awareness, age, village rules and regulations, and perceived property rights security are all ranked among the top four or five in both models, with highly consistent importance rankings. Moreover, the directions of their regression coefficients are the same and their significance is stable, indicating that these four variables are the core factors influencing forest farmers’ GPB. This fully validates the robustness of H1 and H3 under the machine learning framework. Forestry income ranks high in both models but its coefficient is not significant, suggesting that although this variable contributes to model prediction, its explanatory power is limited. Forestland area and income share show some importance in both models and have significant coefficients, partially supporting H4. In addition, household labor force ranks tenth in the AI model with a significant coefficient, while it ranks eleventh in the AD model with a non-significant coefficient, indicating that its effect on AI is stronger than its effect on the adoption decision. The variable importance rankings are generally consistent with the significance levels of the regression coefficients, verifying the reliability of the model results.

4.4. Heterogeneity Analysis via Machine Learning

Based on the machine learning heterogeneity analysis results presented in Table 7, farmers were grouped by three NTFP types: Moso Bamboo, Camellia Oleifera, and Tea Plant. The importance rankings show clear differences in the key variables associated with AD and AI across crop groups, providing machine learning evidence for the heterogeneity proposed in H2 and H5.
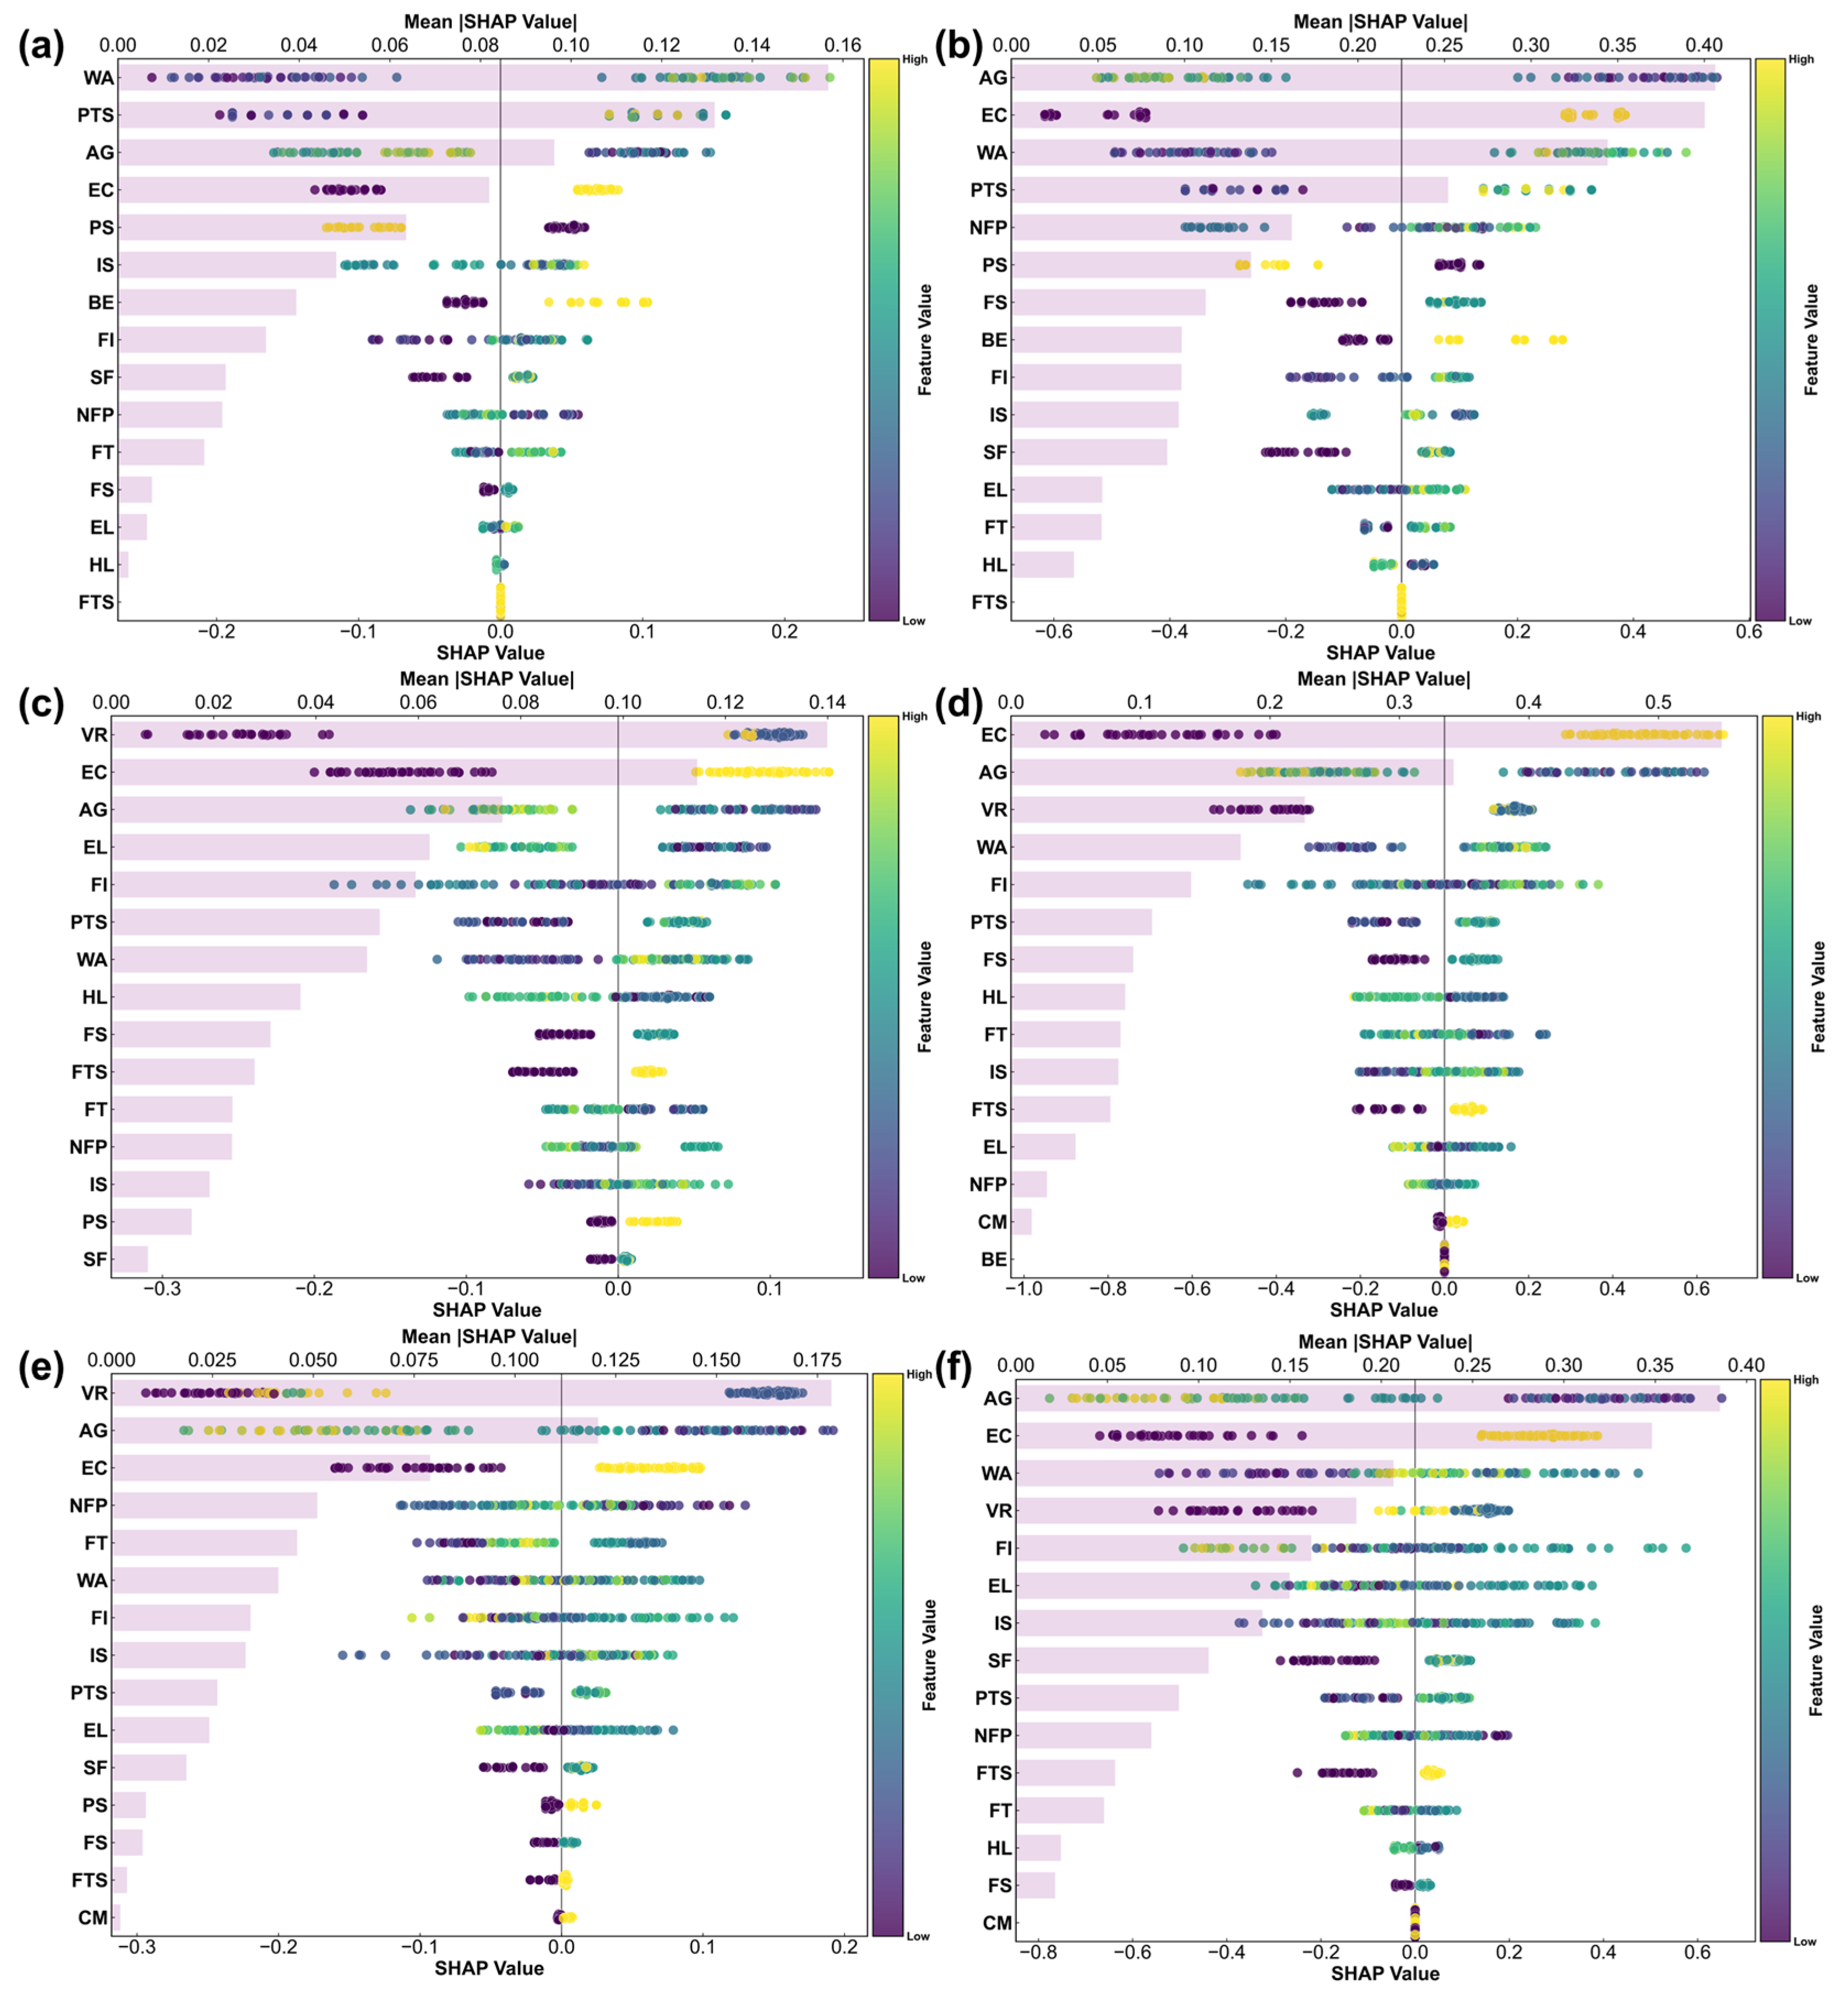
In the Moso Bamboo group, the most important variables in the AD model are forestland area (WA), perceived property rights security (PTS), and age (AG) (Figure 4a), while age (AG), ecological awareness (EC), forestland area (WA), and PTS rank highest in the AI model (Figure 4b). This indicates that operational scale and perceived tenure security are more closely related to green production behavior among Moso Bamboo growers. In contrast, for Camellia Oleifera growers, village rules and regulations (VR) and EC are the dominant variables in the AD and AI models, respectively (Figure 4c,d), suggesting that informal institutions and ecological awareness play a more central role in this group. For Tea Plant growers, VR ranks first in the AD model, while AG, EC, WA, and VR are highly important in the AI model (Figure 4e,f). Notably, forestry technical training (FT) ranks among the top-five variables only in the Tea Plant AD model, indicating that the relevance of training varies across NTFP types.
The SHAP distributions further reveal nonlinear patterns in several key variables. For VR, low penalty severity generally corresponds to negative or near-zero SHAP values, indicating a limited contribution to GPB. When VR reaches a moderate level, its SHAP values become clearly positive, especially in the Camellia Oleifera and Tea Plant groups, suggesting that moderate village-rule penalties may represent an effective threshold for improving adoption behavior. However, the SHAP values do not show a continuous increase at the highest penalty levels, implying that overly strict rules may not generate additional benefits. Similarly, EC shows consistently positive SHAP contributions when farmers recognize the ecological value of green production, confirming its stable role across NTFP types. PTS also shows positive SHAP contributions in several groups, particularly for Moso Bamboo, but its strength varies across crops, indicating that perceived tenure security is important but not uniform across NTFP production contexts.
Comparing the three groups, AG and EC are consistently ranked among the most important variables, indicating their stable relevance across NTFP types. VR is highly important in the Camellia Oleifera and Tea Plant groups but weak in the Moso Bamboo group, while WA is most important for Moso Bamboo growers. These differences confirm that the factors associated with GPB are crop-specific. Overall, the machine learning results cross-validate the regression findings in Table 5 and further support the heterogeneity hypotheses H2 and H5. To make the hypothesis testing results clearer, Table 8 summarizes the final empirical conclusions for all five hypotheses.

5. Conclusions and Recommendations

5.1. Conclusions

Based on survey data from 579 farmer households in Zhejiang Province, this study employs binary logit, ordered probit, and machine learning models to examine the factors influencing forest farmers’ adoption of green production technologies, with a focus on NTFP-type heterogeneity (Moso Bamboo, Camellia Oleifera, and Tea Plant). In line with this study’s objective, the results identify the key drivers of GPB and explain how their effects vary across major NTFP types. The main conclusions are as follows:
(1)
Perceived property rights security is robustly and positively associated with GPB, remaining consistently significant across all NTFP types. This highlights the importance of subjective tenure security for long-term green investment and confirms H1.
(2)
Village rules and regulations (moderate penalties) and ecological awareness jointly play a central positive role, emerging as the two most influential pillars in both econometric and machine learning analyses. However, the effect of village rules is weaker for Moso Bamboo growers. These results support H3 and indicate that informal institutional constraints and ecological value recognition are key internal drivers of GPB.
(3)
Technical training effects are crop-specific. It positively influences adoption decisions for Moso Bamboo but negatively affects Tea Plant, demonstrating that one-size-fits-all training is counterproductive. This supports H2 and suggests that training programs should be tailored to crop-specific technical requirements.
(4)
Economic incentives are partially effective and crop-dependent. Forestry subsidies promote adoption for Moso Bamboo and Camellia Oleifera growers but not for Tea Plant growers. Forestry income share is only marginally significant in the full sample. Forestland area strongly promotes green production only for Moso Bamboo growers, underscoring scale and NTFP type as key sources of heterogeneity. These findings partially support H4 and H5, showing that incentives and operational characteristics affect GPB differently across NTFP types.
(5)
Cross-validation between machine learning and econometric models (RF, AUC = 0.946 for adoption decision; XGB, AUC = 0.819 for adoption intensity) confirms the robustness and reliability of the core findings. Overall, effective NTFP green production governance should shift from uniform policy instruments toward differentiated strategies combining property rights security, village-level regulation, ecological awareness, crop-specific training, and targeted subsidies.

5.2. Policy Implications

Based on the above conclusions, the following policy recommendations are proposed:
(1)
Strengthen perceived property rights security through routine publicity of tenure confirmation, transparent dispute resolution, and stable future adjustment expectations. This is essential because perceived property rights security is positively associated with GPB across all NTFP types. For Moso Bamboo growers, enhance rights protection experience via cooperative or village collective management.
(2)
Implement crop-differentiated training programs. Abandon one-size-fits-all approaches: for Moso Bamboo, focus on short-term green tending techniques; for Camellia Oleifera, emphasize long-term returns and cost sharing; for Tea Plant, avoid excessive technical intervention, strengthen ecological planting concepts and quality premium recognition, and suspend or re-evaluate existing training that has shown negative effects. This responds to the heterogeneous effects of training across crops.
(3)
Refine penalty gradients in village rules to leverage informal institutions. Maintain moderate penalty severity as the most effective. Establish tiered penalty standards based on local conditions, integrate ecological awareness education into rule dissemination, and use role models to enhance farmers’ identification with green production. This can strengthen the combined role of village rules and ecological awareness in promoting GPB.
(4)
Design precise forestry subsidies. Continue supporting Moso Bamboo and Camellia Oleifera growers; for Tea Plant growers, explore combining subsidies with technical certification for green production. Link subsidies to training participation and rule compliance to create a synergistic mechanism. Since subsidies are crop-dependent, incentive policies should shift from broad compensation to targeted support.
(5)
Address operational-scale heterogeneity. Provide additional rewards or low-interest loans for large-scale Moso Bamboo growers. For fragmented land, reduce coordination costs via land exchange or trusteeship. Encourage Camellia Oleifera and Tea Plant growers to achieve scale effects through cooperatives to improve green technology adoption efficiency. These measures reflect the different roles of operational scale across NTFP types and support more differentiated green production governance.

Author Contributions

Conceptualization, C.X. and Y.J.; formal analysis, C.X. and Y.J.; visualization, J.Y. and B.Z.; investigation, J.Y. and B.Z.; project administration, Y.Z. and C.W.; writing—original draft preparation, C.X. and Y.J. All authors have read and agreed to the published version of the manuscript.

Funding

This research was funded by the Beijing Forestry University Science and Technology Innovation Project (Grant number 2021SCL01).

Data Availability Statement

Data will be made available on request.

Conflicts of Interest

Informed consent for participation was obtained from all subjects involved in the study, and the study did not contain identifiable participant information. The authors declare that they have no known competing financial interests or personal relationships that could have appeared to influence the work reported in this paper.

References

  1. Angelsen, A.; Jagger, P.; Babigumira, R.; Belcher, B.; Hogarth, N.J.; Bauch, S.; Börner, J.; Smith-Hall, C.; Wunder, S. Environmental Income and Rural Livelihoods: A Global-Comparative Analysis. World Dev. 2014, 64, S12–S28. [Google Scholar] [CrossRef] [Scilit] [PubMed]
  2. Date, A.A.; Lele, S. Marketing of NTFPs by forest-dependent communities in Maharashtra, India: Alternative models for state support. For. Policy Econ. 2025, 178, 103584. [Google Scholar] [CrossRef] [Scilit]
  3. da Silva, E.J.; Schweinle, J. Understanding green jobs in the forest sector: Findings from a systematic literature review. For. Policy Econ. 2025, 179, 103608. [Google Scholar] [CrossRef] [Scilit]
  4. Munthali, M.G.; Nankwenya, B.; Nyirenda, Z.; Chilora, L.; Chiwaula, L.; Chirombo, B.; Troosters, W. Unlocking youth opportunities in the forest sector: The role of green jobs in generating youth employment in Malawi. For. Policy Econ. 2025, 179, 103625. [Google Scholar] [CrossRef] [Scilit]
  5. Wang, J.; He, J. Hidden inequality: Rethinking non-timber forest products for bioeconomic development in Southwest China. For. Policy Econ. 2026, 182, 103691. [Google Scholar] [CrossRef] [Scilit]
  6. Kleinschmit, D.; Giurca, A.; Lehmann, R.; Rodríguez, F.; Sinaga, H. Bioeconomy governance in the global South: State of the art and the way forward. For. Policy Econ. 2025, 171, 103403. [Google Scholar] [CrossRef] [Scilit]
  7. Rosenfeld, T.; Pokorny, B.; Marcovitch, J.; Poschen, P. BIOECONOMY based on non-timber forest products for development and forest conservation—Untapped potential or false hope? A systematic review for the BRAZILIAN amazon. For. Policy Econ. 2024, 163, 103228. [Google Scholar] [CrossRef] [Scilit]
  8. de Mello, N.G.R.; Gulinck, H.; Van den Broeck, P.; Parra, C. Social-ecological sustainability of non-timber forest products: A review and theoretical considerations for future research. For. Policy Econ. 2020, 112, 102109. [Google Scholar] [CrossRef] [Scilit]
  9. Zhou, W.; Chen, J.; Zhang, Z.-q.; Zhang, Y. The effects of internet use on the cultivation of non-timber forest products. Technol. Forecast. Soc. Change 2024, 207, 123620. [Google Scholar] [CrossRef] [Scilit]
  10. Zhou, Z.; Xiao, X.; Yang, S.; Yang, F.; Wang, F. Enjoying green training and making hotels greener: A daily investigation of hotel green training on employee green behavior. Int. J. Hosp. Manag. 2026, 132, 104378. [Google Scholar] [CrossRef] [Scilit]
  11. Andrews-Speed, P.; Yang, M.; Shen, L.; Cao, S. The regulation of China’s township and village coal mines: A study of complexity and ineffectiveness. J. Clean. Prod. 2003, 11, 185–196. [Google Scholar] [CrossRef] [Scilit]
  12. Li, C.; Sun, M.; Xu, X.; Zhang, L.; Guo, J.; Ye, Y. Environmental village regulations matter: Mulch film recycling in rural China. J. Clean. Prod. 2021, 299, 126796. [Google Scholar] [CrossRef] [Scilit]
  13. Maleki, S.; Naeimi, A.; Bijani, M.; Salahi Moghadam, N. Comparing predictive power of planned behavior and social cognition theories on students’ pro-environmental behaviors: The case of University of Zanjan, Iran. J. Clean. Prod. 2025, 486, 144386. [Google Scholar] [CrossRef] [Scilit]
  14. Kou, Z.; Tang, Y.; Wu, H.; Zhou, M. Ownership, volatility, and equity incentives: Theory and evidence from listed companies in China. Econ. Model. 2023, 128, 106470. [Google Scholar] [CrossRef] [Scilit]
  15. Bibi, G.; Hashmi, H.B.A.; Nauman, S.; Abbass, K.; Song, H. Perspective of the theory of planned behavior and self-determination theory on sustainable hospitality: How green human resource management influences pro-environmental behavior via employee perceptions and motivation. J. Environ. Manag. 2025, 396, 127889. [Google Scholar] [CrossRef] [Scilit] [PubMed]
  16. Charfeddine, L.; Zaidan, E.; Alban, A.Q.; Bennasr, H.; Abulibdeh, A. Modeling and forecasting electricity consumption amid the COVID-19 pandemic: Machine learning vs. nonlinear econometric time series models. Sustain. Cities Soc. 2023, 98, 104860. [Google Scholar] [CrossRef] [Scilit]
  17. Zhang, Z.; Liu, H.; Shi, T.; Li, Q.; Niu, H. Measuring and forecasting global digital economy efficiency: An integrated approach using the super-efficiency sequential SBM model and machine learning algorithms. Inf. Process. Manag. 2026, 63, 104638. [Google Scholar] [CrossRef] [Scilit]
  18. Chang, M.-Y.; Kuo, H.-Y.; Chen, H.-S. Perception of Climate Change and Pro-Environmental Behavioral Intentions of Forest Recreation Area Users—A Case of Taiwan. Forests 2022, 13, 1476. [Google Scholar] [CrossRef] [Scilit]
  19. Schlager, E.; Ostrom, E. Property-Rights Regimes and Natural Resources: A Conceptual Analysis. Land Econ. 1992, 68, 249–262. [Google Scholar] [CrossRef] [Scilit]
  20. Sikor, T.; He, J.; Lestrelin, G. Property Rights Regimes and Natural Resources: A Conceptual Analysis Revisited. World Dev. 2017, 93, 337–349. [Google Scholar] [CrossRef] [Scilit]
  21. Ellingsen, T.; Johannesson, M. Pride and prejudice: The human side of incentive theory. Am. Econ. Rev. 2008, 98, 990–1008. [Google Scholar] [CrossRef] [Scilit]
  22. Mkandawire, N.D.; Mangisoni, J.; Pangapanga, I.; Machila, K. Assessing the impact of land tenure security on farm-level investment in soil and water conservation practices: Evidence from smallholder farmers in Malawi. Land Use Policy 2025, 159, 107803. [Google Scholar] [CrossRef] [Scilit]
  23. Asdar, A.; Baba, S.; Jamil, M.H. Understanding farmer adoption of the System of Rice Intensification (SRI) through the theory of planned behavior and its socio-economic benefits. Sustain. Futures 2026, 11, 101801. [Google Scholar] [CrossRef] [Scilit]
  24. Xie, X.; Zhu, Q.; Qi, G. How can green training promote employee career growth? J. Clean. Prod. 2020, 259, 120818. [Google Scholar] [CrossRef] [Scilit]
  25. Yan, J.; Zhang, D.; Xia, F. Evaluation of village land use planning risks in green concepts: The case of Qiwangfen Village in Beijing. Land Use Policy 2021, 104, 105386. [Google Scholar] [CrossRef] [Scilit]
  26. Kumar, J.; Huang, J.; Kumari, J. Drivers of green consumer behavior in hotels: The roles of green attitudes and environmental gardening identity (PLS-SEM and fsQCA evidence). J. Retail. Consum. Serv. 2026, 88, 104476. [Google Scholar] [CrossRef] [Scilit]
  27. Chen, L.; Gao, Y. How to implement the government subsidy policy in promoting the green development of agriculture in Hebei province? J. Clean. Prod. 2025, 496, 145141. [Google Scholar] [CrossRef] [Scilit]
  28. Hao, T.; Zhu, Q.; Zeng, M.; Shen, J.; Shi, X.; Liu, X.; Zhang, F.; de Vries, W. Impacts of nitrogen fertilizer type and application rate on soil acidification rate under a wheat-maize double cropping system. J. Environ. Manag. 2020, 270, 110888. [Google Scholar] [CrossRef] [Scilit] [PubMed]
  29. Li, B.; Xu, C.; Zhu, Z.; Kong, F. Does e-commerce drive rural households engaged in non-timber forest product operations to adopt green production behaviors? J. Clean. Prod. 2021, 320, 128855. [Google Scholar] [CrossRef] [Scilit]
  30. Ye, F.; Lord, D. Comparing three commonly used crash severity models on sample size requirements: Multinomial logit, ordered probit and mixed logit models. Anal. Methods Accid. Res. 2014, 1, 72–85. [Google Scholar] [CrossRef] [Scilit]
  31. Kini, B.A.; Othayoth, D.; Rameesha, T.V. Identifying critical factors affecting passenger satisfaction in inland water transit integrating Best Worst Method and Ordered Probit Model. Transp. Policy 2025, 172, 103785. [Google Scholar] [CrossRef] [Scilit]
  32. Downward, P.; Lera-Lopez, F.; Rasciute, S. The Zero-Inflated ordered probit approach to modelling sports participation. Econ. Model. 2011, 28, 2469–2477. [Google Scholar] [CrossRef] [Scilit]
  33. Kang, X.; Wang, L.; Chang, C.; Zhu, X.; Liu, X.; Qiu, C.; Meng, X.; Chen, D. Integrating Pigeon-Inspired Optimization and Support Vector Machines for Forest Aboveground Biomass Estimation. Forests 2026, 17, 524. [Google Scholar] [CrossRef] [Scilit]
  34. Almeida, R.O.; Munis, R.A.; Camargo, D.A.; da Silva, T.; Sasso Júnior, V.A.; Simões, D. Prediction of Road Transport of Wood in Uruguay: Approach with Machine Learning. Forests 2022, 13, 1737. [Google Scholar] [CrossRef] [Scilit]
  35. Luo, M.; Anees, S.A.; Huang, Q.; Qin, X.; Qin, Z.; Fan, J.; Han, G.; Zhang, L.; Shafri, H.Z. Improving Forest Above-Ground Biomass Estimation by Integrating Individual Machine Learning Models. Forests 2024, 15, 975. [Google Scholar] [CrossRef] [Scilit]
  36. Gou, W.; Shi, Z.Z.; Zhu, Y.; Gu, X.F.; Dai, F.Z.; Gao, X.Y.; Wang, L.N. Multi-objective optimization of three mechanical properties of Mg alloys through machine learning. Mater. Genome Eng. Adv. 2024, 2, e54. [Google Scholar] [CrossRef] [Scilit]
  37. Alkhereibi, A.H.; Abulibdeh, R.; Abulibdeh, A. Global smart cities classification using a machine learning approach to evaluating livability, technology, and sustainability performance across key urban indices. J. Clean. Prod. 2025, 503, 145394. [Google Scholar] [CrossRef] [Scilit]
  38. Mallesh, N.; Zhao, M.; Meintker, L.; Höllein, A.; Elsner, F.; Lüling, H.; Haferlach, T.; Kern, W.; Westermann, J.; Brossart, P.; et al. Knowledge transfer to enhance the performance of deep learning models for automated classification of B cell neoplasms. Patterns 2021, 2, 100351. [Google Scholar] [CrossRef] [Scilit] [PubMed]
  39. Lundberg, S.M.; Erion, G.; Chen, H.; DeGrave, A.; Prutkin, J.M.; Nair, B.; Katz, R.; Himmelfarb, J.; Bansal, N.; Lee, S.-I. From local explanations to global understanding with explainable AI for trees. Nat. Mach. Intell. 2020, 2, 56–67. [Google Scholar] [CrossRef] [Scilit] [PubMed]
  40. Yang, W.; Chen, Y. The influencing factors and nonlinear effects on residents’ green space usage behavior patterns: An interpretable machine learning modelling approach. Travel Behav. Soc. 2026, 43, 101223. [Google Scholar] [CrossRef] [Scilit]
Figure 1. Pearson correlation coefficient matrix with significance markers (***, **, and * indicate significance levels of 1%, 5%, and 10%).
Forests 17 00875 g001
Figure 2. Machine learning model results: (a) comparison of prediction accuracy of different binary classification models for AD (The red five-pointed star represents the highest accuracy algorithm); (b) ROC curve and confusion matrix of the optimal model for AD; (c) comparison of prediction accuracy of different multi-class classification models for AI; (d) ROC curve and confusion matrix of the optimal model for AI.
Forests 17 00875 g002
Figure 3. Global analysis results of feature importance: (a) AD; (b) AI.
Forests 17 00875 g003
Figure 4. Heterogeneity analysis results of feature importance: (a) AD of MB; (b) AI of MB; (c) AD of CO; (d) AI of CO; (e) AD of TP; (f) AI of TP.
Forests 17 00875 g004
Table 1. Hypothesis contents and covered variables.
No.Hypothesis ContentCovered Original Variables
H1A higher level of perceived property rights security is positively associated with GPBPerceived property rights security
H2The effect of the frequency of forestry technical training is heterogeneousForestry technical training frequency
H3Village rules and ecological awareness have positive effectsVillage rules and ecological awareness
H4The number of forestry subsidies and the income share have positive effectsNumber of forestry subsidies, income share
H5NTFP type and operational scale have heterogeneous effectsPlanting (Moso Bamboo, Camellia Oleifera, Tea Plant) and number of forestland plots
Table 2. Descriptive statistics of main variables.
Variable TypeVariable NameVariable DescriptionSymbolMeanStandard Deviation
Dependent variablesAdoption (binary)Whether green production technologies are adopted: Yes = 1, No = 0AD0.6930.462
Adoption intensityNumber of green production technologies adoptedAI1.7311.343
Explanatory variablesGenderMale = 1, Female = 0GE0.8960.305
AgeActual age of the farmer (years)AG50.25411.711
Education levelYears of formal education (years)EL7.6302.537
Political statusVillage cadre: Yes = 1, No = 0PS0.2940.456
Household labor forceNumber of labor force membersHL2.3940.805
Business experienceYes = 1, No = 0BE0.2610.439
Soil fertility1 = Good; 2 = Medium; 3 = PoorSF1.8550.625
Forestry subsidiesNumber of forestry subsidy programs received in the given yearFS0.6250.529
Income shareShare of agricultural income in total household income (%)IS0.4610.241
Forestry incomeHousehold income from forestry operations (RMB 10,000)FI7.8134.469
Cooperative membershipWhether the farmer has joined a cooperative: Yes = 1, No = 0CM0.2940.456
Forestland areaForestland area owned by the household (ha)WA3.4711.743
Number of forestland plotsNumber of forestland plots owned by the householdNFP4.0671.795
Forestry technicalNumber of times the farmer participated in forestry technical training in the past three yearsFT2.8201.496
Village rules and regulationsPerceived severity of penalties for undesirable behaviors: No penalty = 1, Too light = 2, Moderate = 3, Too severe = 4VR2.0970.910
Ecological awarenessWhether agrees that green production contributes to the value realization of forest products: Yes = 1, No = 0EC0.6250.484
Place safetyWhether there are land disputes: Yes = 0, No = 1FTS0.8010.399
Perceived property rights securityDegree of agreement that forestland rights and interests are protected: Strongly disagree = 1, Slightly disagree = 2, Neutral = 3, Slightly agree = 4, Strongly agree = 5PTS2.7551.079
Moso BambooWhether they plant Moso Bamboo: Yes = 1, No = 0MB0.2120.409
Camellia OleiferaWhether they plant Camellia Oleifera: Yes = 1, No = 0CO0.2630.440
Tea PlantWhether they plant Tea Plant: Yes = 1, No = 0TP0.2870.453
Table 3. Binary Logit and Ordered Probit regression results.
VariablesAD: Binary LogitAI: Ordered Probit
GE0.127 (0.342)0.138 (0.898)
AG−0.078 *** (−7.206)−0.032 *** (−7.551)
EL0.000 (0.005)0.003 (0.170)
PS0.029 (0.116)−0.169 (−1.642)
HL−0.134 (−0.943)−0.123 ** (−2.114)
BE0.246 (0.928)0.133 (1.248)
SF0.225 (1.211)0.031 (0.411)
FS0.302 (1.412)0.190 ** (2.153)
IS1.257 *** (2.689)0.331 * (1.703)
FI0.037 (1.426)0.006 (0.584)
CM0.133 (0.530)−0.015 (−0.149)
WA0.217 *** (3.228)0.076 *** (2.833)
NFP0.008 (0.123)−0.005 (−0.196)
FT0.058 (0.750)0.017 (0.535)
VR0.210 * (1.781)0.380 *** (7.209)
EC1.755 *** (7.226)0.932 *** (9.059)
FTS0.214 (0.785)0.155 (1.290)
PTS0.896 *** (7.474)0.249 *** (5.619)
MB0.327 (1.155)0.095 (0.825)
CO0.017 (0.065)−0.068 (−0.636)
TP0.001 (0.004)0.019 (0.187)
LR chi2207.753 ***242.548 ***
McFadden R20.2910.144
Observations579579
Note: ***, **, and * indicate significance levels of 1%, 5%, and 10%, and z value is in parentheses.
Table 4. Robustness test results (OLS model).
VariablesADAI
GE0.004 (0.071)0.130 (0.847)
AG−0.011 *** (−7.853)−0.034 *** (−8.409)
EL0.001 (0.179)0.004 (0.235)
PS0.005 (0.129)−0.169 * (−1.652)
HL−0.022 (−1.050)−0.116 ** (−2.003)
BE0.042 (1.109)0.129 (1.207)
SF0.028 (1.048)0.035 (0.475)
FS0.038 (1.208)0.183 ** (2.074)
IS0.177 *** (2.584)0.401 ** (2.073)
FI0.006 (1.589)0.007 (0.669)
CM0.015 (0.414)0.002 (0.021)
WA0.031 *** (3.281)0.081 *** (3.023)
NFP−0.002 (−0.267)−0.005 (−0.206)
FT0.006 (0.561)0.022 (0.712)
VR0.035 * (1.905)0.281 *** (5.452)
EC0.286 *** (8.190)0.980 *** (9.961)
FTS0.017 (0.405)0.132 (1.110)
PTS0.127 *** (8.213)0.253 *** (5.808)
MB0.032 (0.783)0.104 (0.908)
CO0.012 (0.317)−0.041 (−0.387)
TP0.001 (0.027)0.023 (0.224)
R2/Adjusted R20.304/0.2780.364/0.321
F valueF (21, 557) = 11.594 ***F (21, 557) = 14.010 ***
Observations579579
Note: ***, **, and * indicate significance levels of 1%, 5%, and 10%, and t value is in parentheses.
Table 5. Heterogeneity analysis results.
VariablesMBCOTP
ADAIADAIADAI
GE−0.303
(−0.273)
−0.380
(−1.013)
−0.587
(−0.689)
0.149
(0.468)
0.916
(1.251)
0.485
(1.469)
AG−0.077 **
(−2.455)
−0.029 ***
(−3.200)
−0.087 ***
(−3.472)
−0.032 ***
(−3.535)
−0.095 ***
(−4.002)
−0.025 ***
(−3.129)
EL−0.036
(−0.263)
0.005
(0.112)
−0.138
(−1.357)
−0.032
(−0.809)
−0.036
(−0.390)
0.020
(0.549)
PS−1.832 **
(−2.133)
−0.178
(−0.717)
0.346
(0.637)
−0.275
(−1.333)
0.053
(0.108)
−0.172
(−0.893)
HL0.047
(0.116)
−0.160
(−1.185)
−0.164
(−0.510)
−0.244 *
(−1.952)
−0.050
(−0.194)
−0.117
(−1.114)
BE3.383 ***
(3.142)
0.560 **
(2.132)
−0.384
(−0.692)
−0.039
(−0.168)
−0.021
(−0.042)
−0.093
(−0.469)
SF0.875 *
(1.774)
0.156
(0.948)
0.177
(0.458)
−0.031
(−0.205)
0.492
(1.170)
0.000
(0.001)
FS1.054
(1.476)
0.435 **
(2.079)
0.965 **
(2.042)
0.374 **
(2.085)
−0.051
(−0.117)
−0.064
(−0.377)
IS−1.293
(−0.871)
−0.183
(−0.397)
1.145
(1.227)
0.154
(0.397)
1.234
(1.299)
0.011
(0.030)
FI0.074
(0.990)
0.024
(0.995)
0.060
(1.030)
0.025
(1.053)
−0.027
(−0.503)
−0.013
(−0.602)
CM−1.348 **
(−1.997)
−0.339
(−1.453)
0.164
(0.301)
0.036
(0.171)
0.187
(0.352)
0.161
(0.775)
WA1.154 ***
(3.608)
0.184 ***
(2.796)
0.120
(0.828)
0.108 *
(1.820)
0.212
(1.504)
0.069
(1.318)
NFP−0.171
(−0.907)
0.060
(1.016)
0.022
(0.160)
0.023
(0.409)
−0.094
(−0.772)
−0.004
(−0.091)
FT0.460 *
(1.845)
0.125
(1.639)
0.096
(0.588)
0.013
(0.210)
−0.242
(−1.408)
−0.116 *
(−1.811)
VR−0.309
(−1.023)
0.239 **
(2.187)
0.125
(0.522)
0.300 ***
(2.810)
0.041
(0.181)
0.320 ***
(3.219)
EC1.782 ***
(2.684)
1.109 ***
(4.581)
1.774 ***
(3.660)
1.165 ***
(5.536)
2.339 ***
(4.575)
1.089 ***
(5.397)
FTS1.520 *
(1.915)
0.149
(0.584)
0.627
(1.176)
0.290
(1.303)
−0.105
(−0.181)
0.048
(0.198)
PTS1.058 ***
(2.671)
0.307 ***
(2.954)
0.968 ***
(3.499)
0.253 **
(2.404)
1.011 ***
(4.160)
0.301 ***
(3.488)
LR chi269.188 ***80.257 ***68.404 ***78.540 ***63.871 ***62.854 ***
McFadden R20.4710.2250.3580.1810.3170.132
Observations123123152152166166
Note: ***, **, and * indicate significance levels of 1%, 5%, and 10%, and z value is in parentheses.
Table 6. The importance ranking of variables.
VariableADAI
No.ImportanceCoefficientNo.ImportanceCoefficient
EC10.195 1.755 *** (7.226)30.1360.932 *** (9.059)
AG20.163 −0.078 *** (−7.206)20.139−0.032 *** (−7.551)
VR30.116 0.210 * (1.781)10.2380.380 *** (7.209)
PTS40.100 0.896 *** (7.474)40.0980.249 *** (5.619)
FI50.069 0.037 (1.426)70.0560.006 (0.584)
WA60.064 0.217 *** (3.228)50.0580.076 *** (2.833)
FS70.061 0.302 (1.412)80.0480.190 ** (2.153)
IS80.048 1.257 *** (2.689)60.0560.331 * (1.703)
NFP90.032 0.008 (0.123)140.015−0.005 (−0.196)
EL100.031 0.000 (0.005)120.0180.003 (0.170)
HL110.030 −0.134 (−0.943)100.029−0.123 ** (−2.114)
FT120.020 0.058 (0.750)130.0170.017 (0.535)
BE130.016 0.246 (0.928)170.0080.133 (1.248)
CO140.014 0.017 (0.065)150.014−0.068 (−0.636)
GE150.010 0.127 (0.342)160.0080.138 (0.898)
CM160.009 0.133 (0.530)110.022−0.015 (−0.149)
TP170.008 0.001 (0.004)190.0020.019 (0.187)
SF180.007 0.225 (1.211)90.0290.031 (0.411)
FTS190.004 0.214 (0.785)210.0010.155 (1.290)
PS200.004 0.029 (0.116)200.001−0.169 (−1.642)
MB210.001 0.327 (1.155)180.0070.095 (0.825)
Note: ***, **, and * indicate significance levels of 1%, 5%, and 10%, and z value is in parentheses.
Table 7. Importance (Imp.) ranking of in heterogeneity analysis.
VariablesMBCOTP
ADAIADAIADAI
No.Imp.No.Imp.No.Imp.No.Imp.No.Imp.No.Imp.
WA10.21430.14770.06740.08660.06130.104
PTS20.1840.10860.0760.05390.03990.045
AG30.13110.17430.10320.16620.17910.194
EC40.11220.17120.15410.26630.11720.175
PS50.08760.059140.021170120.013170
IS60.066100.041130.026100.0480.04970.068
BE70.05480.042180180180160
FI80.04590.04250.0850.06770.05150.081
SF90.032110.038150.01160110.02780.053
NFP100.03150.069120.032130.01340.076100.037
FT110.026130.022110.03290.04150.068120.024
FS120.0170.04890.04270.046130.011140.011
EL130.009120.02240.083120.024100.03660.075
HL140.003140.01580.0580.043170130.012
GE150150170150160150
CM160160160.007140.008150.003180
VR17017010.18830.1110.26440.094
FTS180180100.038110.037140.006110.027
Table 8. Summary of research hypotheses and empirical conclusions.
No.Hypothesis ContentEmpirical Conclusion
H1A higher level of perceived property rights security is positively associated with GPBSupported
H2The effect of the frequency of forestry technical training is heterogeneousSupported
H3Village rules and ecological awareness have positive associationsSupported
H4The number of forestry subsidies and the income share have positive associationsPartially supported
H5NTFP type and operational scale have heterogeneous effectsSupported
Disclaimer/Publisher’s Note: The statements, opinions and data contained in all publications are solely those of the individual author(s) and contributor(s) and not of MDPI and/or the editor(s). MDPI and/or the editor(s) disclaim responsibility for any injury to people or property resulting from any ideas, methods, instructions or products referred to in the content.