Article

Divergent Low-Flow Trajectories in Two Forested Catchments of the Chilean Coastal Range with Contrasting Management Histories


1
Centro de Investigaciones Bioforest Spa, Coronel 4202270, Chile
2
Instituto de Conservación, Biodiversidad y Territorio, Facultad de Ciencias Forestales y Recursos Naturales, Universidad Austral de Chile, Valdivia 5110566, Chile
*
Author to whom correspondence should be addressed.
Forests 2026, 17(8), 876; https://doi.org/10.3390/f17080876
Submission received: 2 June 2026 / Revised: 24 July 2026 / Accepted: 27 July 2026 / Published: 28 July 2026
(This article belongs to the Special Issue Recent Advances and Future Perspectives in Forest Hydrology)

Abstract

Disentangling the effects of climate variability and forest management on catchment hydrology remains a major challenge in temperate plantation landscapes. We analyzed 21 hydrological years (1997/98–2017/18) of precipitation and runoff records from two experimental catchments in the Chilean Coastal Range with contrasting silvicultural histories to characterize changes in low-flow behavior. Hydroclimatic and low-flow indices were evaluated using the monotonic trends test, Sen’s slope estimates, change point detection, and standardized inter-catchment anomaly differences. Annual and seasonal precipitation indices, rainfall frequency, and maximum dry-spell duration showed no significant monotonic trends, whereas maximum 5-day precipitation declined at LP. The two catchments nevertheless exhibited divergent low-flow trajectories. Los Pinos, managed through partial harvesting and thinning within a forest mosaic, showed decreasing normalized low-flow availability and longer low-flow exposure during the latter part of the record. La Reina, clearcut in 1999/2000 and subsequently reforested, showed a progressive increase in low-flow magnitude and normalized low-flow availability, together with declining flow variability and fewer below-threshold events. Standardized inter-catchment comparisons confirmed a temporal divergence in low-flow behavior. They also revealed a concurrent shift in inter-catchment precipitation anomalies. These results indicate contrasting long-term hydrological trajectories that are consistent with differences in forest management histories; however, the non-paired study design, limited pre-harvest observations at La Reina, and differential precipitation forcing preclude formal attribution to silvicultural effects alone. This study highlights the value of long-term experimental catchments for evaluating low-flow dynamics under interacting climatic and land-management influences.

1. Introduction

Understanding how climate variability and land-use change jointly influence catchment hydrology remains one of the major challenges in forest hydrology [1,2]. Ongoing climate change is intensifying the hydrologic cycle, increasing the frequency and severity of droughts while amplifying precipitation extremes [3,4]. Central Chile provides a clear regional case: between 2010 and 2018, the so-called “Mega Drought” reduced rainfall by 20%–40% for nearly ten years, marking the longest dry period ever recorded [5]. Climate projections based on CMIP6 scenarios indicate that annual precipitation may decline by an additional 30%–40% by the end of the century, especially under high-emission scenarios [6,7,8].
Alongside these climatic changes, south central Chile has experienced profound land-use transformations over the past centuries [9,10]. During the second half of the twentieth century, large areas of degraded agricultural land were progressively converted into commercial forest plantations as part of extensive landscape restoration programs [11]. These changes occurred within landscapes that had already undergone severe degradation following decades of intensive farming, repeated burning, and widespread loss of native forests [11,12]. By around 1950, nearly 19 million hectares were already classified as highly eroded [12].
Long-term experimental catchments have provided the foundation for understanding how forest cover and forest management influence catchment hydrology under a wide range of climatic conditions [13,14]. Depending on the monitoring design and available data, these studies have relied on classical paired-catchment experiments, before–after analyses in individual catchments, or comparative analyses of long-term experimental catchments [15,16,17,18]. Each approach offers distinct advantages for investigating hydrological responses, while also presenting limitations in separating the effects of forest management from those of climate variability.
These approaches have been applied to evaluate the hydrological consequences of afforestation, deforestation, forest regrowth, forest conversion, and silvicultural operations [1,19,20]. Decades of experimental catchment research have established broad conceptual relationships between forest cover, annual water yield, summer streamflow, and peak flows [21,22,23,24]. However, these generalized relationships are increasingly recognized as being strongly conditioned by local factors, including antecedent land-use, forest composition, catchment characteristics, and climatic variability [13,21,25]. Consequently, interpreting long-term hydrological trajectories requires consideration of both forest management history and hydroclimatic context.
Recent syntheses of forest hydrology in Chile have highlighted an important conceptual nuance. Most plantations were established on landscapes previously degraded by intensive agriculture, repeated burning, or severe soil erosion rather than replacing intact native forest [26]. Under these conditions, forest establishment may improve soil structure, increase infiltration capacity, and enhance water storage, meaning that hydrological responses cannot be interpreted solely as a function of forest cover. Instead, they depend on the interaction between antecedent land conditions, forest development, management history, and climate variability [13,21,26].
Despite these advances, long-term evidence describing how low-flow regimes evolve under contrasting forest management histories remains scarce [27]. In particular, few experimental catchments provide sufficiently long hydrological records to evaluate multi-decadal low-flow trajectories while simultaneously accounting for inter-annual hydroclimatic variability [28,29]. Consequently, it remains difficult to determine whether divergent low-flow behavior is consistent with differences in forest management history, broader climatic variability, or the interaction between both drivers [30,31].
Previous studies conducted in the study region have documented several components of the hydrological response to forest management. Rainfall interception studies demonstrated that interception losses vary systematically with forest age and climatic conditions along the Chilean Coastal Range [27,28,29]. At La Reina, earlier analyses showed that clearcutting affected both summer and annual runoff during the first years following harvesting [29], while subsequent work evaluated annual rainfall–runoff relationships as part of broader assessments of forest influences on flood generation [30].
However, these studies evaluated individual hydrological processes or relatively short post-treatment periods. None examined the complete 21-year monitoring record using a common analytical framework integrating multiple low-flow indices, hydroclimatic context variables, change-point detection, and standardized inter-catchment comparisons. Consequently, the long-term evolution of low-flow behavior under contrasting forest management histories has remained largely unexplored. This study extends previous work by integrating complementary low-flow metrics with long-term hydroclimatic analyses to evaluate the evolution of low-flow regimes in two experimental catchments with contrasting forest management histories. Rather than seeking formal causal attribution, the study assesses whether observed hydrological trajectories are consistent with differences in management history while explicitly considering concurrent climatic variability and the limitations imposed by the comparative study design.
To address this gap, we analyzed 21 consecutive hydrological years (1997/98–2017/18) of precipitation and discharge records from two long-term experimental catchments in the Coastal Range of southern Chile. While the catchments are located within a similar humid temperate region and share broadly comparable geomorphic settings, they differ substantially in land-cover and forest management history, providing an opportunity to examine contrasting long-term low-flow trajectories within a common regional hydroclimatic context.
The central research question is the following: How did the low-flow regime evolve in two experimental catchments with contrasting forest management histories under a comparable regional climatic condition? Specifically, our objectives were to: (1) characterize the hydroclimatic context of both catchments, including precipitation and atmospheric evaporative demand, to identify potential climatic influences on long-term hydrological variability; (2) quantify temporal changes in low-flow magnitude, normalized low-flow availability, flow-regime variability, and low-flow persistence using a complementary set of hydrological indices (Q95, Qmin7d, BFIproxy, CV, RCdry, and the duration and frequency of below-threshold low-flow events); and (3) evaluate whether the observed low-flow trajectories diverged between catchments using standardized inter-catchment anomaly differences, and assess whether those trajectories were consistent with their contrasting forest management histories versus differential climate forcing.

2. Materials and Methods

2.1. Study Area

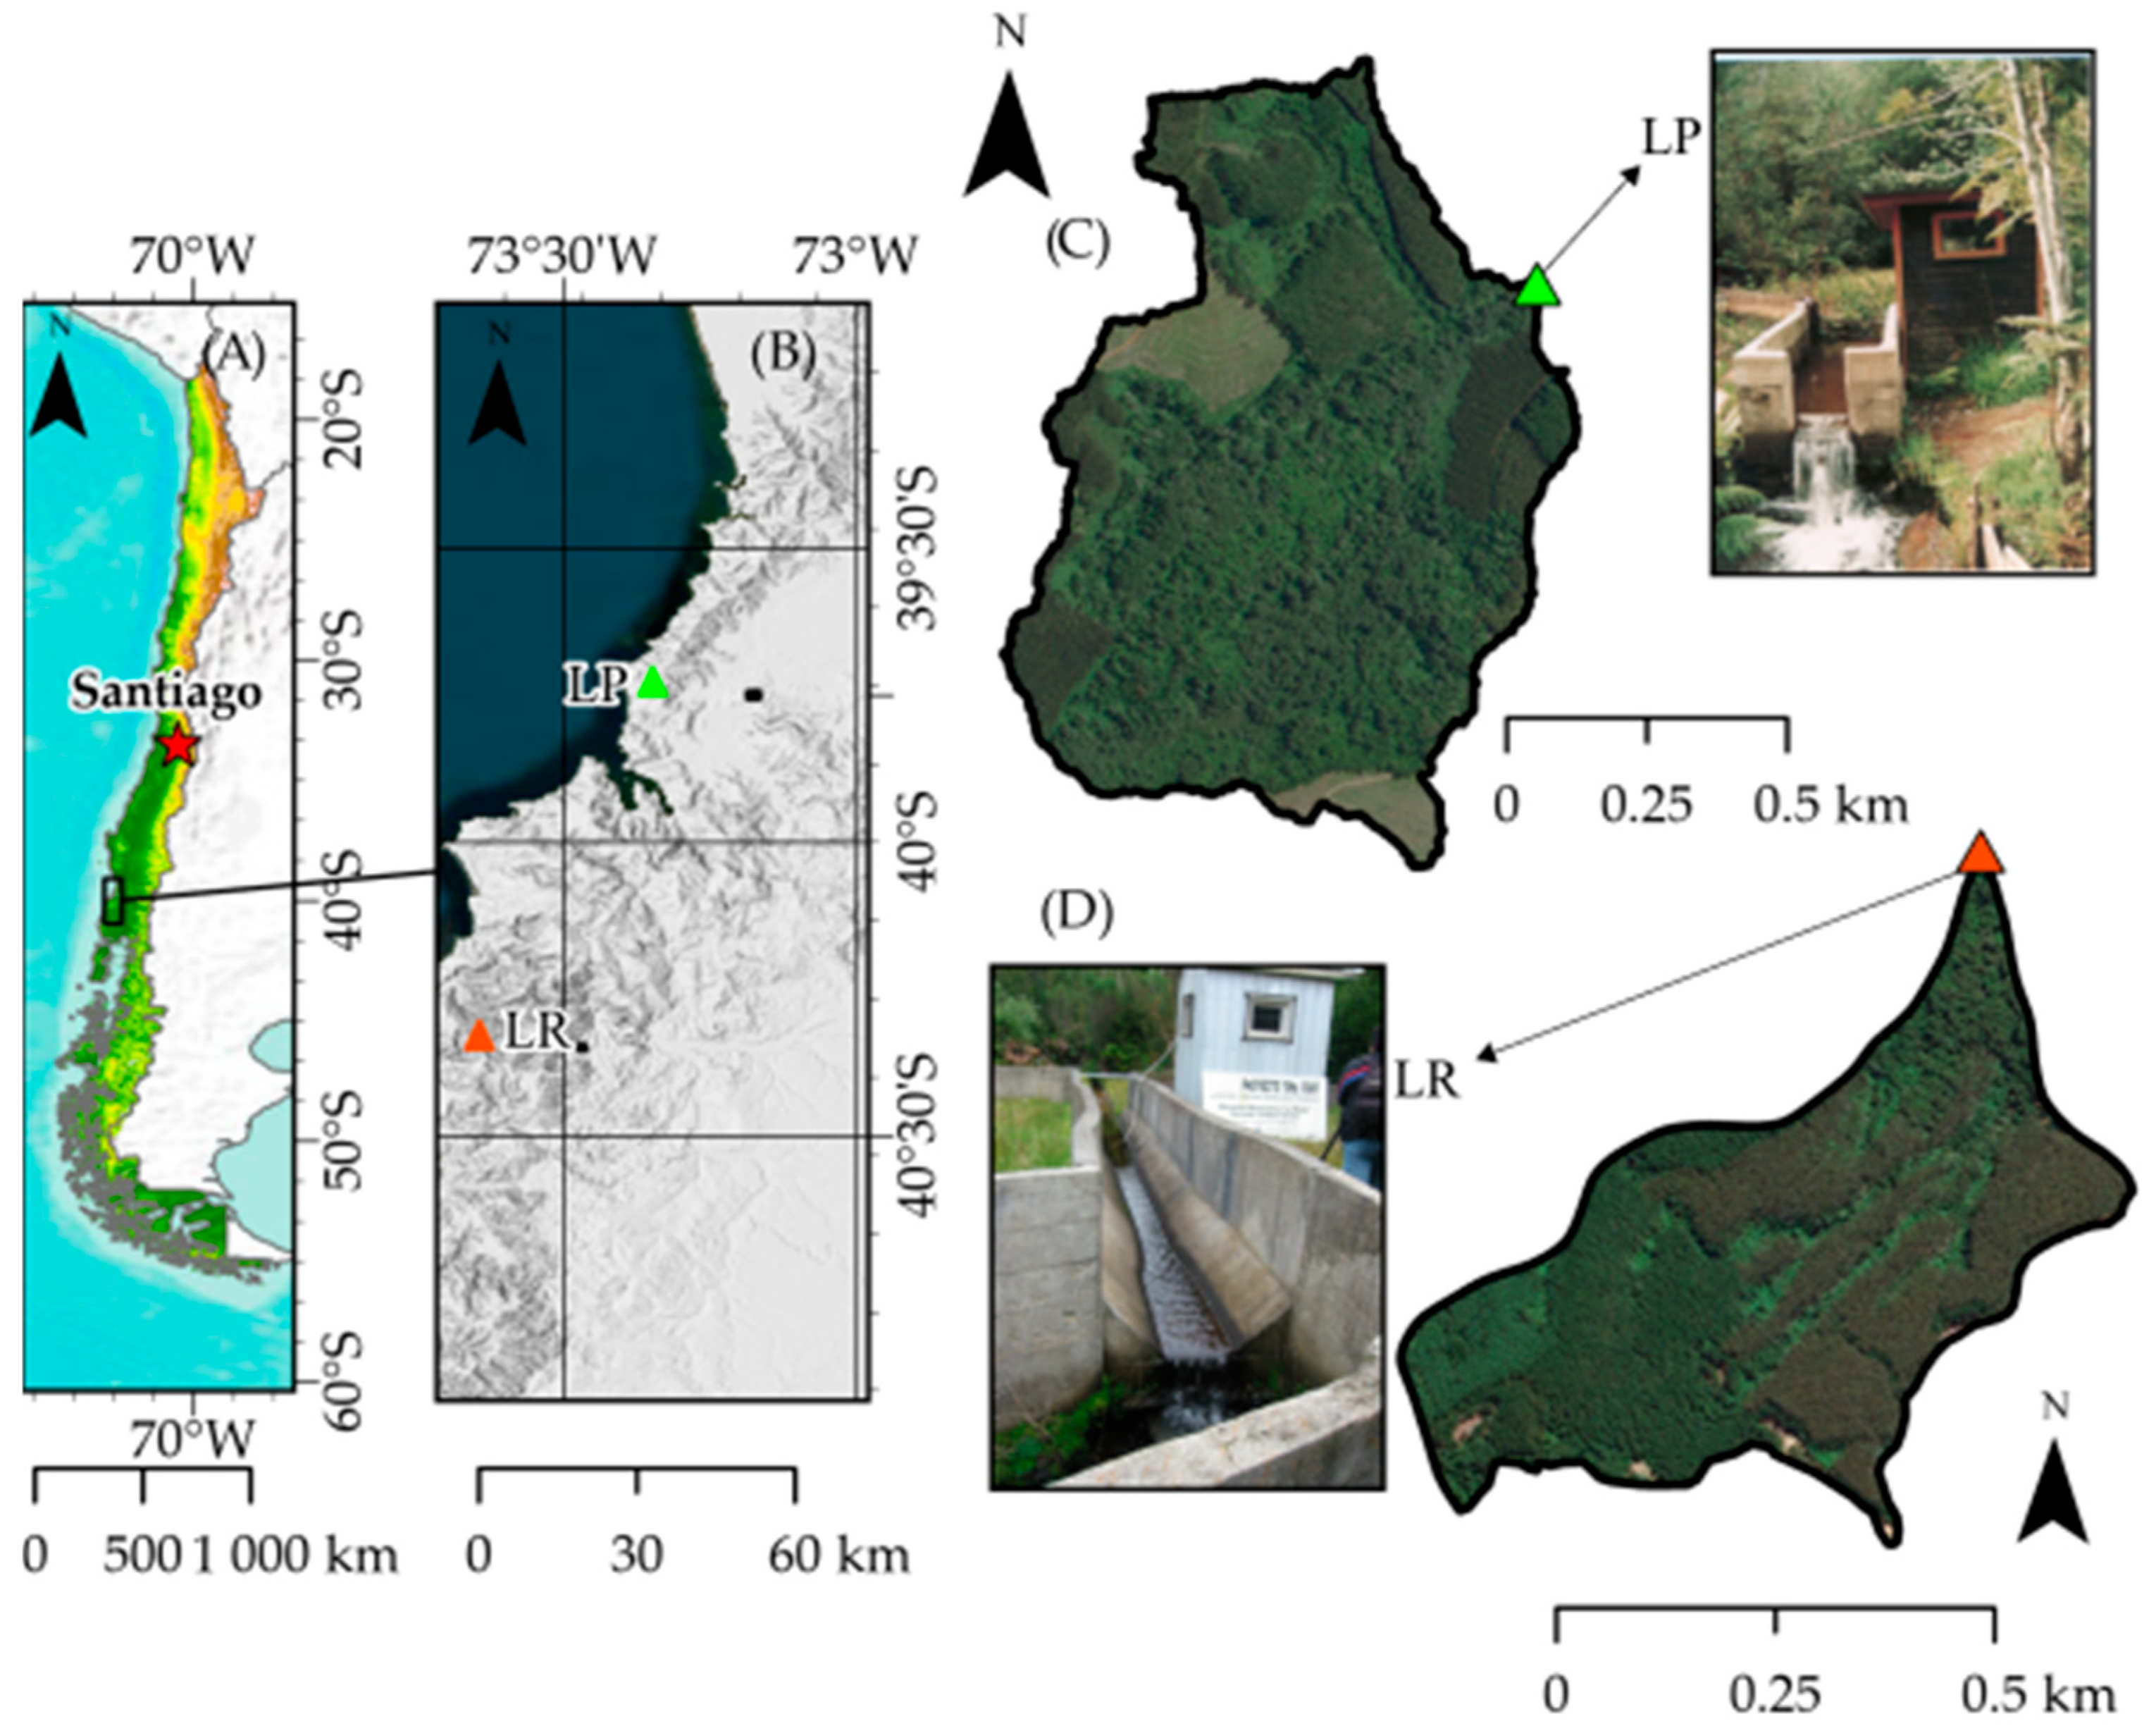
This study was conducted in two long-term experimental catchments located in the Coastal Range of southern Chile, which were continuously monitored between 1997 and 2018: Los Pinos (LP; 91 ha, 39°48′ S) and La Reina (LR; 34.4 ha, 40°34′ S). The Los Pinos (LP) catchment (91 ha) is 22 km to the northeast of the city of Valdivia (Figure 1B,C). Soils are derived from volcanic ashes deposited on metamorphic rocks; they are considered as a transition from loamy to red clayed soils. The La Reina (LR) catchment (34.4 ha) is 60 km to the west from the city of Osorno (Figure 1B,D). Soils are a transition from those originating from old volcanic ashes deposited on volcanic conglomerates and those derived from old clays sedimented on volcanic andesitic and basaltic formations. Both catchments have a northern aspect and are exposed to the predominant winds during the rainy periods. The two catchments have a rainy temperate climate with Mediterranean influence and with annual precipitations between 2000 and 2500 mm. Seventy-five percent of the annual total precipitation is concentrated in the period between May and August. Key catchment characteristics and mean hydroclimatic statistics are summarized in Table 1.
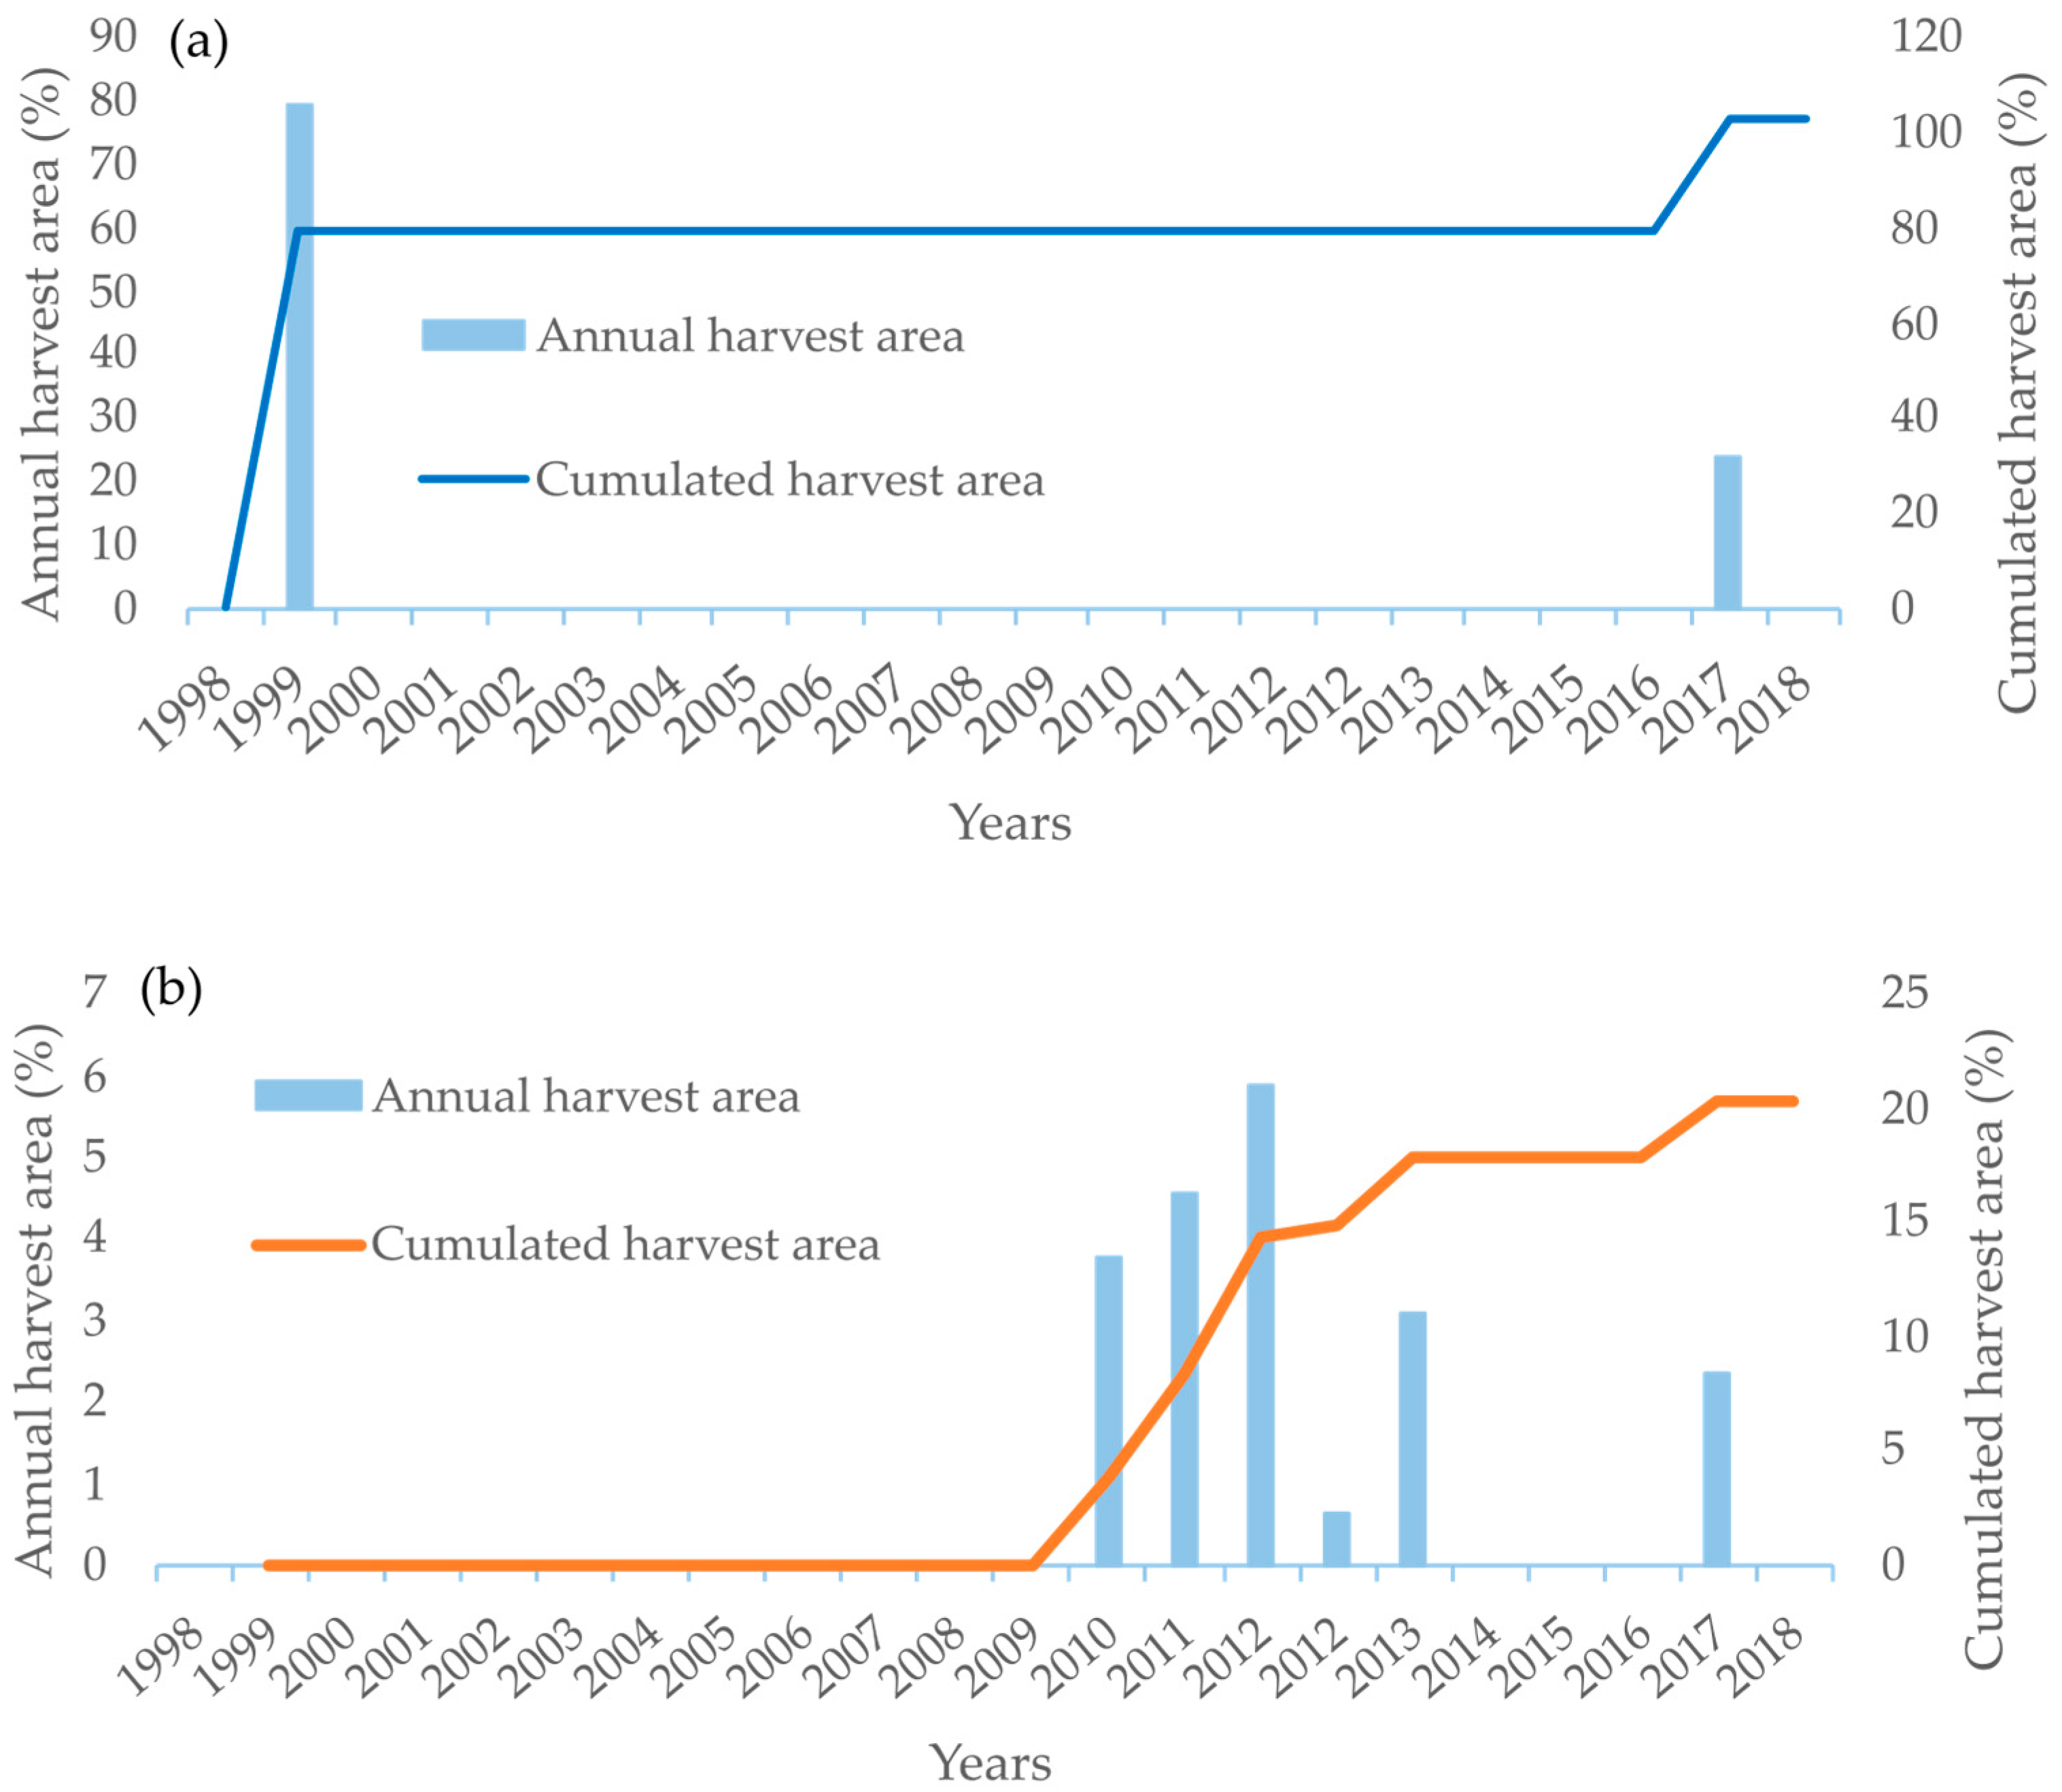
LP has been managed using a mosaic approach, with stands of different ages and species. A total of 66.6% of the catchment area is covered with native forests, where no operations had occurred during the study. Of the remaining area, 14.6% corresponds to stands of P. radiata, 9.6% of Eucalyptus nitens, and 4.9% to E. globulus (Appendix A). The different establishment years were associated with partial cuts and replanting in the study, which never comprised more than 7% of the LP total catchment area. In 2018, the cumulated harvest area was up to 20% of the catchment area (Figure 2b). At LR, 79.4% of total catchment area was originally covered by a plantation of Pinus radiata established in 1977, which was clearcut between the last months of 1999 and early 2000 (Figure 1A,B). In June–July 2000, LR was reforested with E. nitens and P. radiata (42.1% and 37.3%, respectively, of the total catchment area). In early 2017, a new cycle of harvesting began, and by end of March 2018, the area covered by E. nitens had been completely clearcut (Appendix A). In 2018, the cumulated harvest reached the 100% of the catchment area (Figure 2a).

2.2. Hydrometeorological Data

Precipitation was measured independently in each catchment using tipping-bucket rain gauges connected to automated data loggers. The gauges recorded precipitation continuously throughout the monitoring period, and the raw observations were aggregated to daily totals for the analyses. Discharge was controlled in both catchments by a rectangular notch weir at LP and a flume at LR, both equipped with pressure transducers recording the water level on 6 min basis. Daily values of P (mm d−1) and Q (mm d−1) were computed for each catchment, with Q normalized by catchment area. Records cover the period 1997–2018; the analytical period in this study spans the 21 hydrological years from 1997/98 to 2017/18 (1 April–31 March). Missing data accounted for 5% of monthly Q at LP and 9% at LR and were treated as gaps rather than imputed. Daily air temperature (Tmin and Tmax, °C) was extracted from ERA5 to each catchment and used exclusively for the estimation of potential evapotranspiration [31]. For each catchment, daily potential evapotranspiration (PET, mm d−1) was estimated using the Hargreaves–Samani (1985) method, which requires only daily Tmax and Tmin as inputs. Extraterrestrial radiation (Ra, MJ m−2 d−1) was computed for catchment latitude following the FAO-56 procedure [32]. PET is interpreted here exclusively as an indicator of atmospheric evaporative demand; no vegetation coefficient was applied, and no claim is made about actual evapotranspiration from either catchment. Annual PET totals (PETann) were derived by summing daily values within each valid hydrological year.
Additionally, as quality control, hydrological years with fewer than 90% valid daily records in any of the four variables (P, Q, Tmin, Tmax) were excluded from all annual and seasonal analyses. This conservative completeness criterion was adopted to avoid potential bias in annual low-flow metrics arising from incomplete daily records, particularly for indices such as Q95 and Qmin7d that are sensitive to missing observations during low-flow periods. No gap filling or interpolation was performed because reconstructed values could artificially modify annual flow-duration distributions and minimum-flow statistics. Consequently, all annual analyses are based exclusively on hydrological years meeting the predefined completeness threshold. After applying these criteria, 19 valid hydrological years were retained for LP and 15 for LR. Annual and seasonal aggregations were computed by summing daily values within each valid hydrological year or seasonal window. Seasonal aggregations followed the wet-season (May–September) and dry-season (December–March) windows applied to temperate south-central Chile.

2.3. Hydroclimatic and Low-Flow Indices

To characterize temporal variability in climatic forcing and catchment hydrological response, a suite of annual hydroclimatic and hydrological indices was derived from daily records (Table 2).
Hydroclimatic indices were derived to represent the overall annual climatic water input; the precipitation supply during the recharge (Pwet) and highest-atmospheric-demand (Pdry) seasons; precipitation occurrence and event frequency (rainy days); multi-day precipitation extremes, potentially associated with high runoff generation (Pmax5d); drought persistence; and interruption of rainfall (dry-spell).
Six annual low-flow indices were derived for each catchment from the daily discharge record of each valid hydrological year. These indices represent different but related aspects of the dry-season flow regime: magnitude, normalized low-flow availability, flow regime variability, and duration and frequency of low-flow episodes. Together, they provide a more robust characterization of regime change than any single metric [33,34]. Index definitions and hydrological interpretations are summarized in Table 2.
For each valid hydrological year, the flow duration curve (FDC) for each valid hydrological year was constructed by ranking daily Q values in descending order and assigning exceedance probabilities using the Weibull plotting position (P = m/(N + 1) × 100%), where m is rank in descending order and N is the number of valid daily observations. The low-flow index Q95 (mm d−1) is the daily discharge exceeded 95% of the time. Q95 was calculated from the complete hydrological year rather than from dry season. The 7-day minimum runoff (Qmin7d, mm d−1) is the annual minimum of the 7-day centered moving-average discharge. Both are standard FDC-derived low-flow metrics [35].
A normalized low-flow index (BFIproxy) was computed as:
BFIproxy = Q95/(Qannual/365)
where Qannual/365 is the mean daily runoff in each year. BFIproxy expresses Q95 relative to the mean daily runoff of the same hydrological year [13,36], independently of the absolute magnitude of discharge. This normalization allows for the direct comparison of catchments that differ substantially in mean annual runoff, as do LP (mean 1331 mm yr−1) and LR (mean 1514 mm yr−1). The index is analogous in concept to the baseflow index (BFI) derived from digital filtering but does not require complete daily records without gaps—an advantage given the data incompleteness in LR.
The coefficient of variation in daily runoff (CV) was computed within each valid hydrological year as the ratio of the standard deviation to the mean of daily Q. High values of CV indicate a flashy, precipitation-dominated flow regime with little subsurface buffering; a progressive decline in CV over time is consistent with an increase in catchment water regulation capacity, as has been observed in afforestation studies where growing forest litter and root development improve soil infiltration and storage [37,38].
The dry-season runoff coefficient (RCdry = Qdry/Pdry, December–March) was computed as a seasonal indicator of the partitioning of summer precipitation between evapotranspiration and runoff. Annual precipitation (P) and annual potential evapotranspiration (PET) were estimated via the Hargreaves–Samani (1985) method with Ra from FAO-56 [32,39].
The number of days per year when daily Q fell below a site-specific low-flow threshold (LP: 1.30 mm d−1; LR: 0.20 mm d−1) was computed for each valid year, along with the number of distinct low-flow events (consecutive days below the threshold count as a single event) [40]. These thresholds correspond approximately to the long-term median Q95 of each catchment over the full study period and are therefore site-specific. Because the absolute values differ between catchments, the within-catchment temporal trends and the standardized inter-catchment comparison (DiffZ, Section 2.5) are the appropriate bases for interpretation; direct comparison of absolute durations between LP and LR is not valid. We initially evaluated a threshold defined as 20% of the long-term mean daily discharge. However, this threshold represented markedly different positions in the flow-duration distributions of the two catchments. At LP, 20% of mean discharge was substantially lower than Q95, whereas at LR, it exceeded Q95. Consequently, the 20–of-mean criterion identified only exceptionally low flows at LP but a broader range of low-flow conditions at LR. We therefore used the site-specific long-term Q95 as the event threshold, ensuring a comparable exceedance-based definition across catchments. All context variables and low-flow indices are listed with their definitions in Table 2.

2.4. Trend and Change-Point Analysis

2.4.1. Mann–Kendall Trend Test and Theil–Sen Slope Estimator

Non-parametric methods were applied to temporal trends in hydrometeorological and hydrological indices, which were using the non-parametric Mann–Kendall (MK) test [41,42]. The test evaluates the null hypothesis that observations are independently and identically distributed with no monotonic trend, against the alternative of a monotonic upward or downward trend. All tests were performed at a significance threshold of α = 0.05. Results at α = 0.10 are reported in Table 3. Positive lag-1 autocorrelation, common in annual streamflow series exhibiting climatic persistence, inflates the variance of the MK test statistic S and increases the probability of type-I error [43]. Prior to each application, the lag-1 autocorrelation coefficient (r1) was computed from the series. When |r1| > 0.1, the modified MK test of [44] was applied, which corrects the variance of S using the effective sample size derived from the autocorrelation structure of the series; the original MK test was used when |r1| ≤ 0.1. The 0.1 threshold is the conservative cutoff adopted in recent streamflow-trend assessments. It avoids over-correcting series with negligible serial dependence. Both variants were implemented using the pymannkendall 1.4.3 in Python v.3.11 environment [45].
The magnitude of detected trends was quantified using the Theil–Sen slope estimator [45], defined as the median of all pairwise slopes between observations. The estimator β is expressed in units of the response variable per hydrological year and provides a robust, outlier-resistant measure of the rate of change that does not require distributional assumptions [43]. The indices evaluated for trend analysis are listed in Table 2. A trend is considered meaningful only when (i) p ≤ 0.05 and the sign of the Sen slope is physically consistent, or when (ii) p ≤ 0.10 and the result is corroborated by the Pettitt change-point test or by a consistent signal in the inter-catchment comparison. A set of hydroclimatic indices were evaluated for monotonic trends.

2.4.2. Pettitt Change-Point Test

Abrupt, non-monotonic shifts in the central tendency of each annual series were identified using the non-parametric Pettitt [36] change-point test, implemented via the pyhomogeneity Python library [46]. The test uses the Mann–Whitney statistic to locate the most probable single change point and returns an approximate two-sided p-value for that location, together with the sub-period medians before and after the detected shift. The test is distribution-free and robust to outliers and skewed distributions [47]. A simulation-based comparison of seven non-parametric change-point methods by [43] demonstrated that the Pettitt test achieves the best balance between statistical power and a low false-positive rate for annual streamflow series. Change points were considered statistically significant at α = 0.05.

2.5. Inter-Catchment Comparison Using Standardized Anomalies

The comparison between catchments was based on standardized anomalies (Z-scores) calculated within each basin during the 13 hydrological years with valid data simultaneously in LP and LR. For each variable v and basin c, the standardized anomaly was:
Z(v, c, t) = [x(v, c, t) − μ(v, c)]/σ(v, c)
where μ and σ are the mean and standard deviation of the variable computed over the 13 common years within that catchment. The inter-catchment difference was then defined as:
DiffZ(v, t) = Z(v, LR, t) − Z(v, LP, t)
A positive DiffZ in a given year indicates that LR was anomalously high relative to its own long-term mean by more than LP was relative to its mean. This approach removes catchment-level differences in mean values and scales while preserving inter-annual co-variability. It does not require the two catchments to share identical climate forcing, but does assume that regional inter-annual climate variability affects both sites in a broadly similar direction—an assumption that is only partially supported by the moderate inter-annual precipitation correlation observed between LP and LR over the common period (Pearson r = 0.59, p = 0.034). The Pettitt change-point test was applied to the DiffZ series of Q95, BFIproxy, and low-flow duration to assess whether the relative behavior of the two catchments in low-flow indices shifted at a detectable point in time. The DiffZ series for precipitation (DiffZp) was also subjected to the Pettitt test and evaluated alongside the runoff-related DiffZ series to identify concurrent inter-catchment changes in precipitation forcing that could confound the hydrological interpretation.

3. Results

3.1. Hydroclimatic Context: Precipitation and Atmospheric Demand

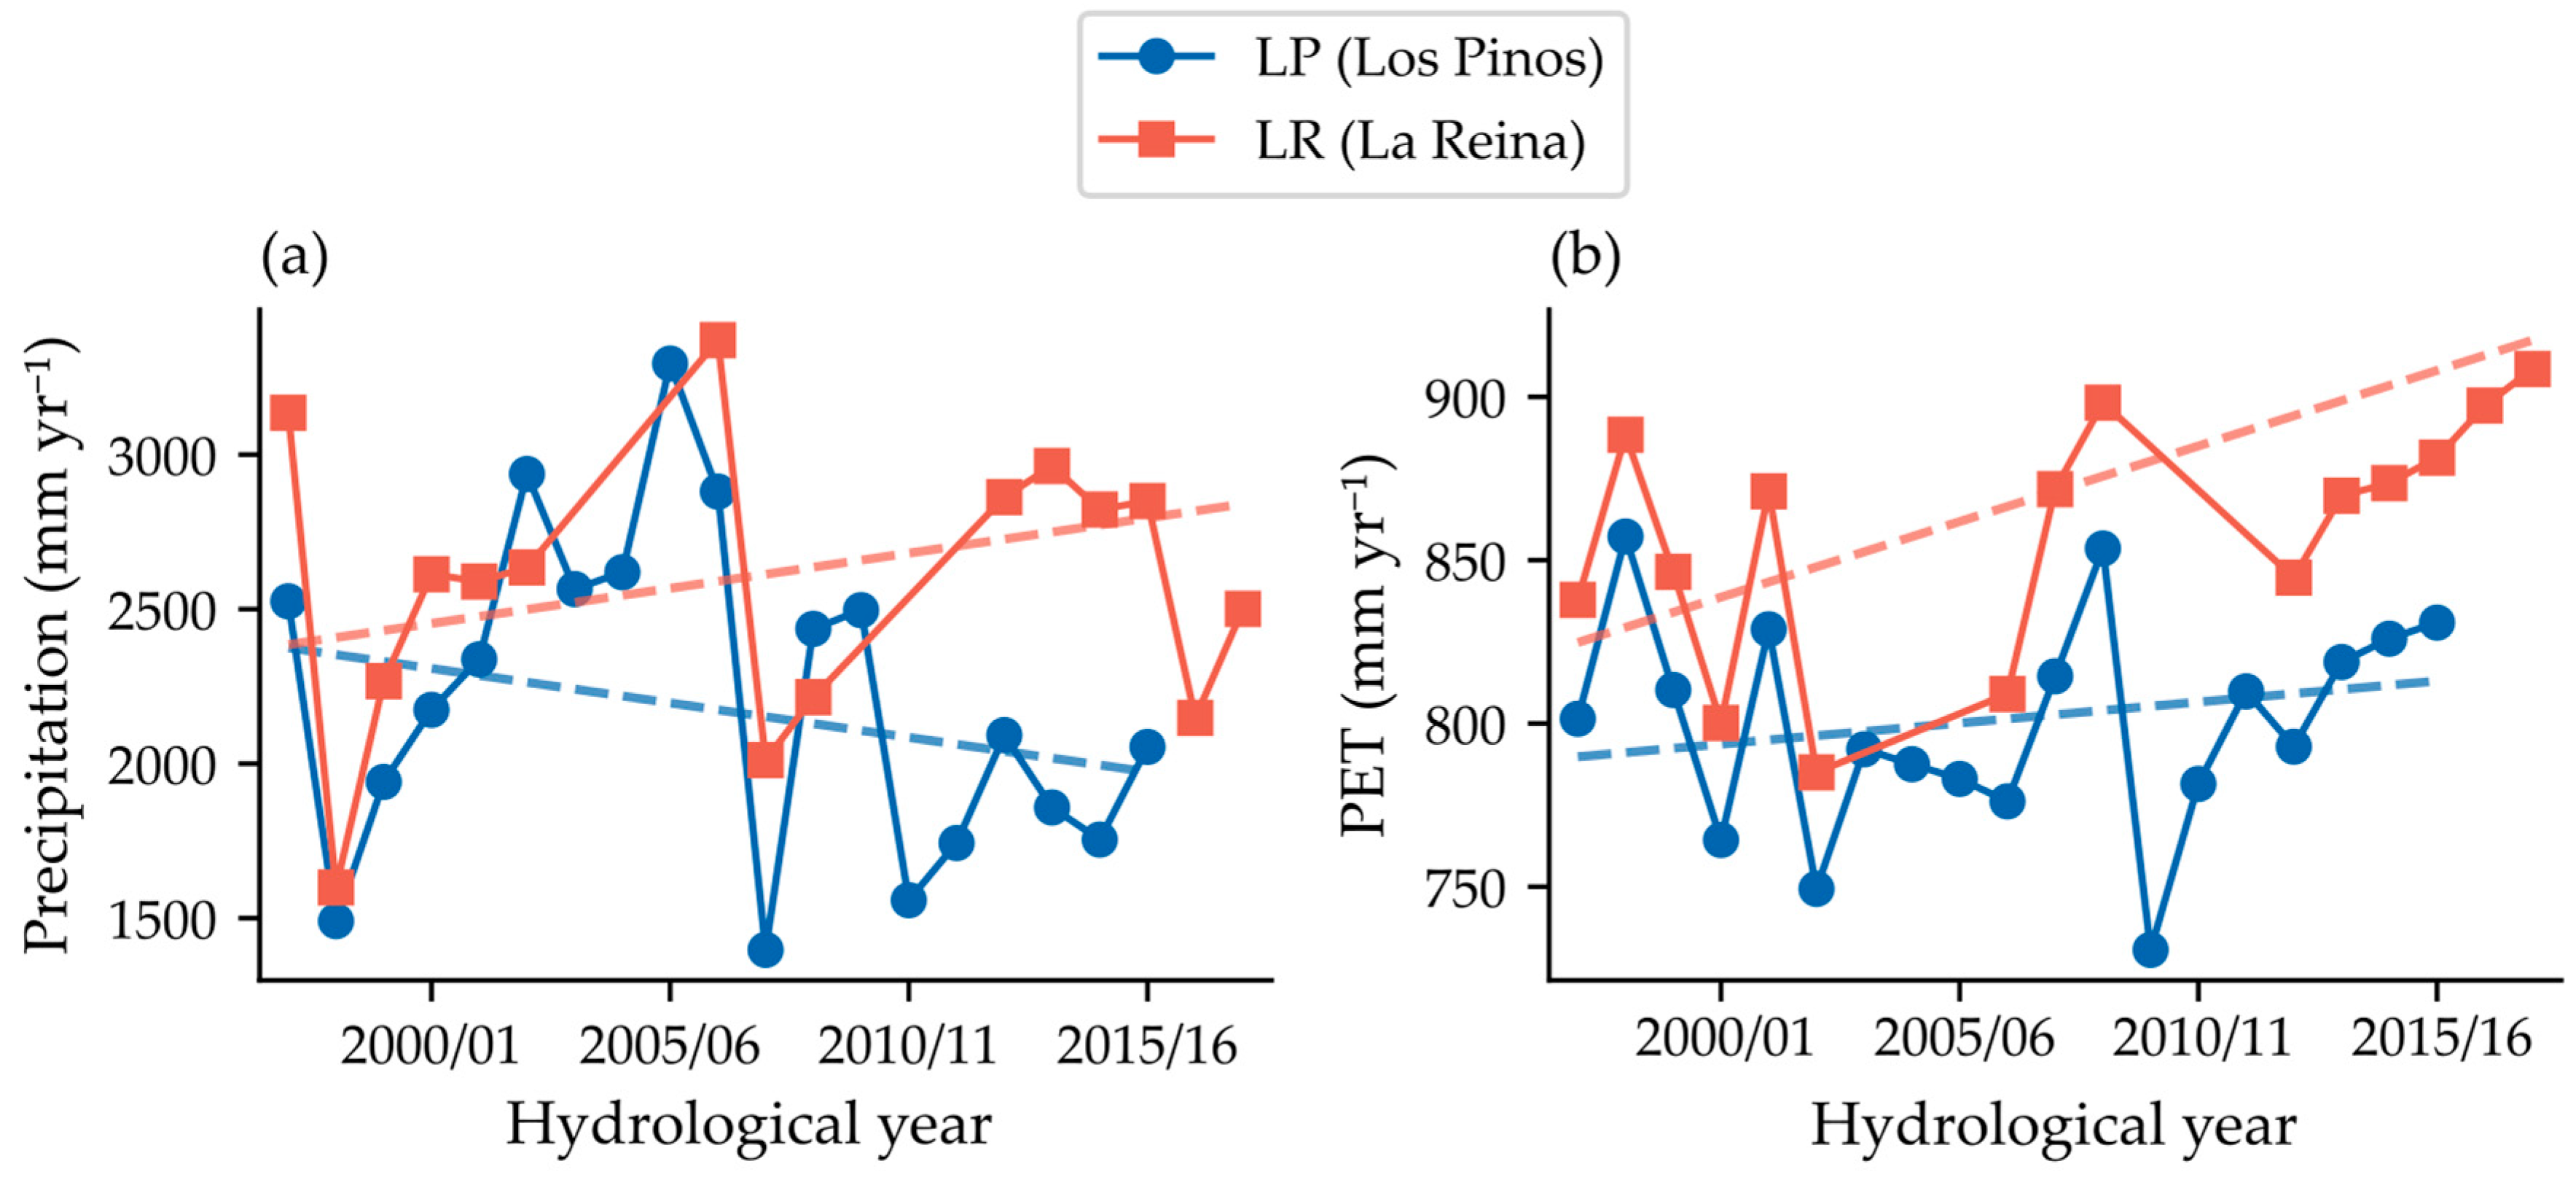
Mean annual precipitation reached 2219 ± 525 mm yr−1 at LP and 2572 ± 463 mm yr−1 at LR, but no significant monotonic trend was detected in either LP or LR (Hamed–Rao MK, p > 0.40 in both cases; Table 3). Although several relatively dry years occurred after 2006/07 in LP, no statistically significant long-term reduction in annual precipitation was detected. Annual PET showed contrasting behavior between the two catchments (Figure 3a). Whereas LP did not show a statistically significant trend (mean 800 ± 33 mm yr−1; p = 0.529), LR exhibited a significant positive trend (mean 859 ± 38 mm yr−1; p = 0.023; Sen β = +4.6 mm yr−1), equivalent to an increase of approximately 69 mm over the analytical period (Figure 3b).
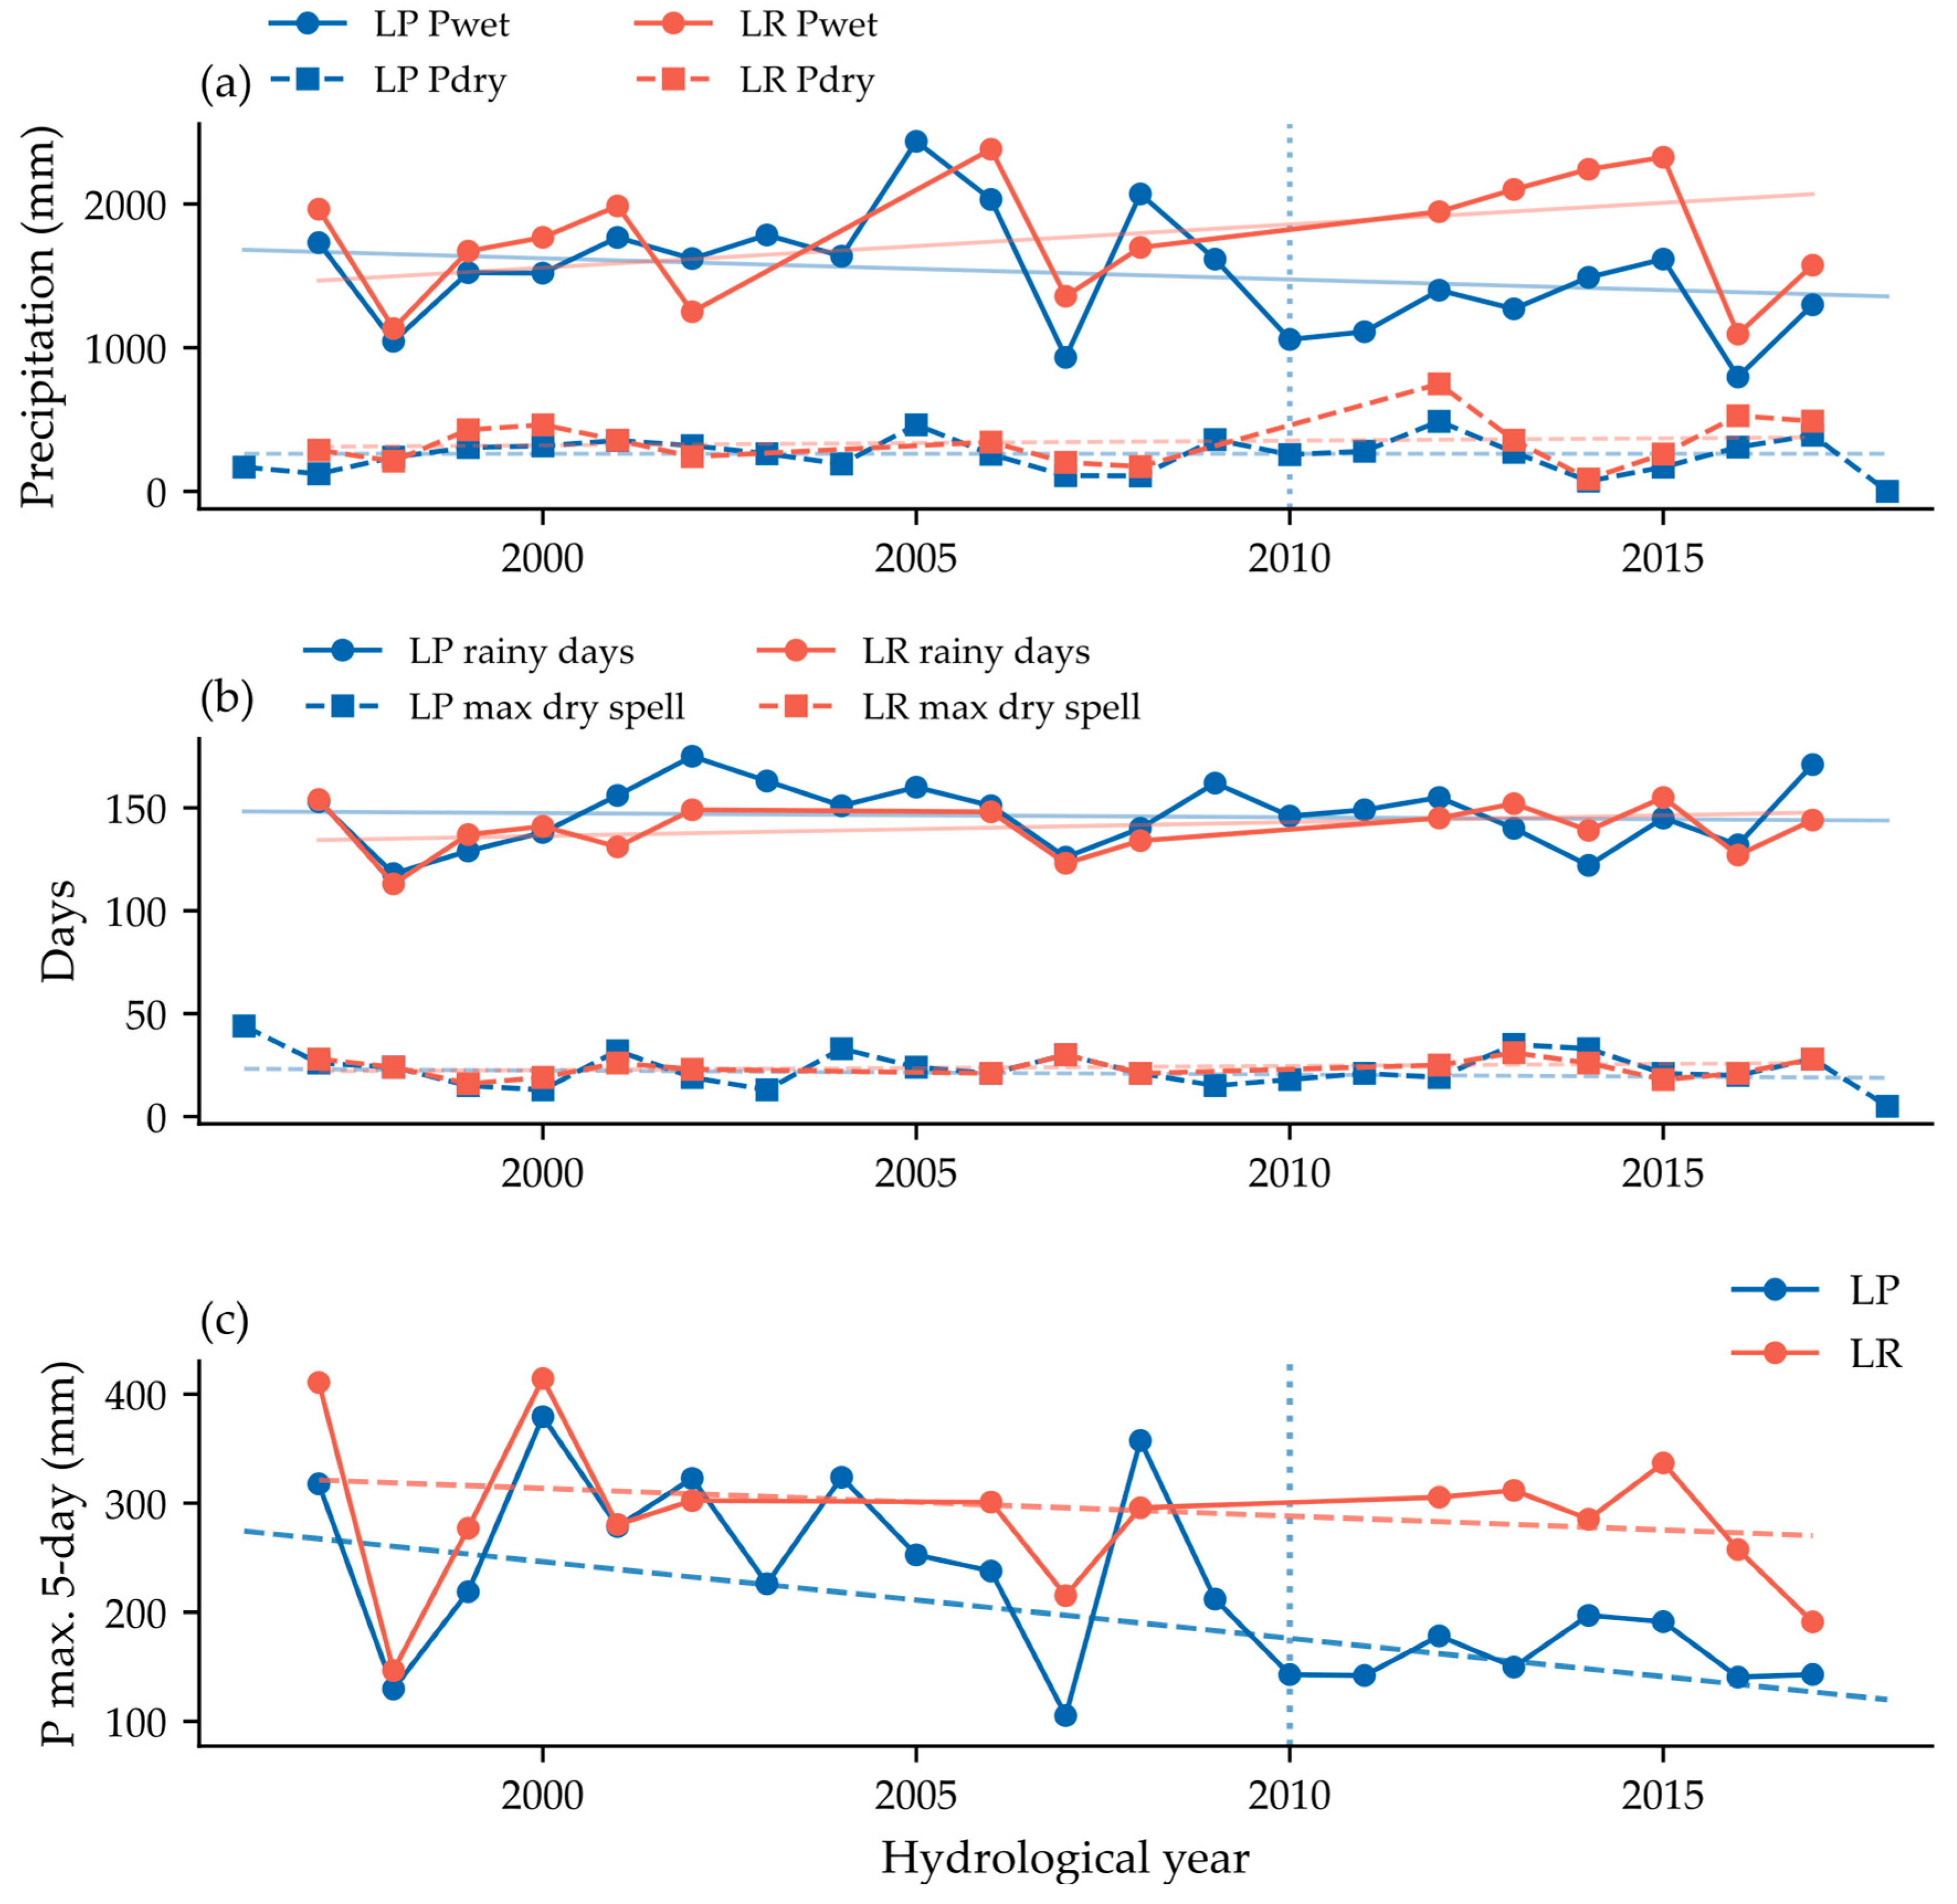
Hydroclimatic indices derived from the daily precipitation record are presented in Figure 4. Pwet showed considerable inter-annual variability in both catchments, ranging from approximately 900 to 2400 mm in LP and from 1000 to 2300 mm in LR (Figure 4a). Variability in Pdry was substantially lower, generally remaining below 500 mm in both catchments. Neither seasonal index exhibited significant monotonic trends (MK; p > 0.05; Table 3). The rainy days index ranged between approximately 120 and 175 days in LP and between 115 and 155 days in LR (Figure 4b). Maximum annual dry-spell duration varied from approximately 15 to 40 consecutive days in both catchments. Likewise, the annual number of rainy days and the maximum annual dry-spell duration showed no significant temporal trends (MK; p > 0.05; Table 3). In contrast, Pmax5d exhibited marked inter-annual variability in both catchments (Figure 4c). In LP, Pmax5d decreased over the study period, with a significant negative trend (MK; p = 0.045; Sen’s slope = −7.0 mm yr−1) and a significant Pettitt change point in 2010/11 (p = 0.048). In contrast, neither the trend nor the change-point test was significant for LR (Table 4).

3.2. Annual Runoff and Runoff Coefficient

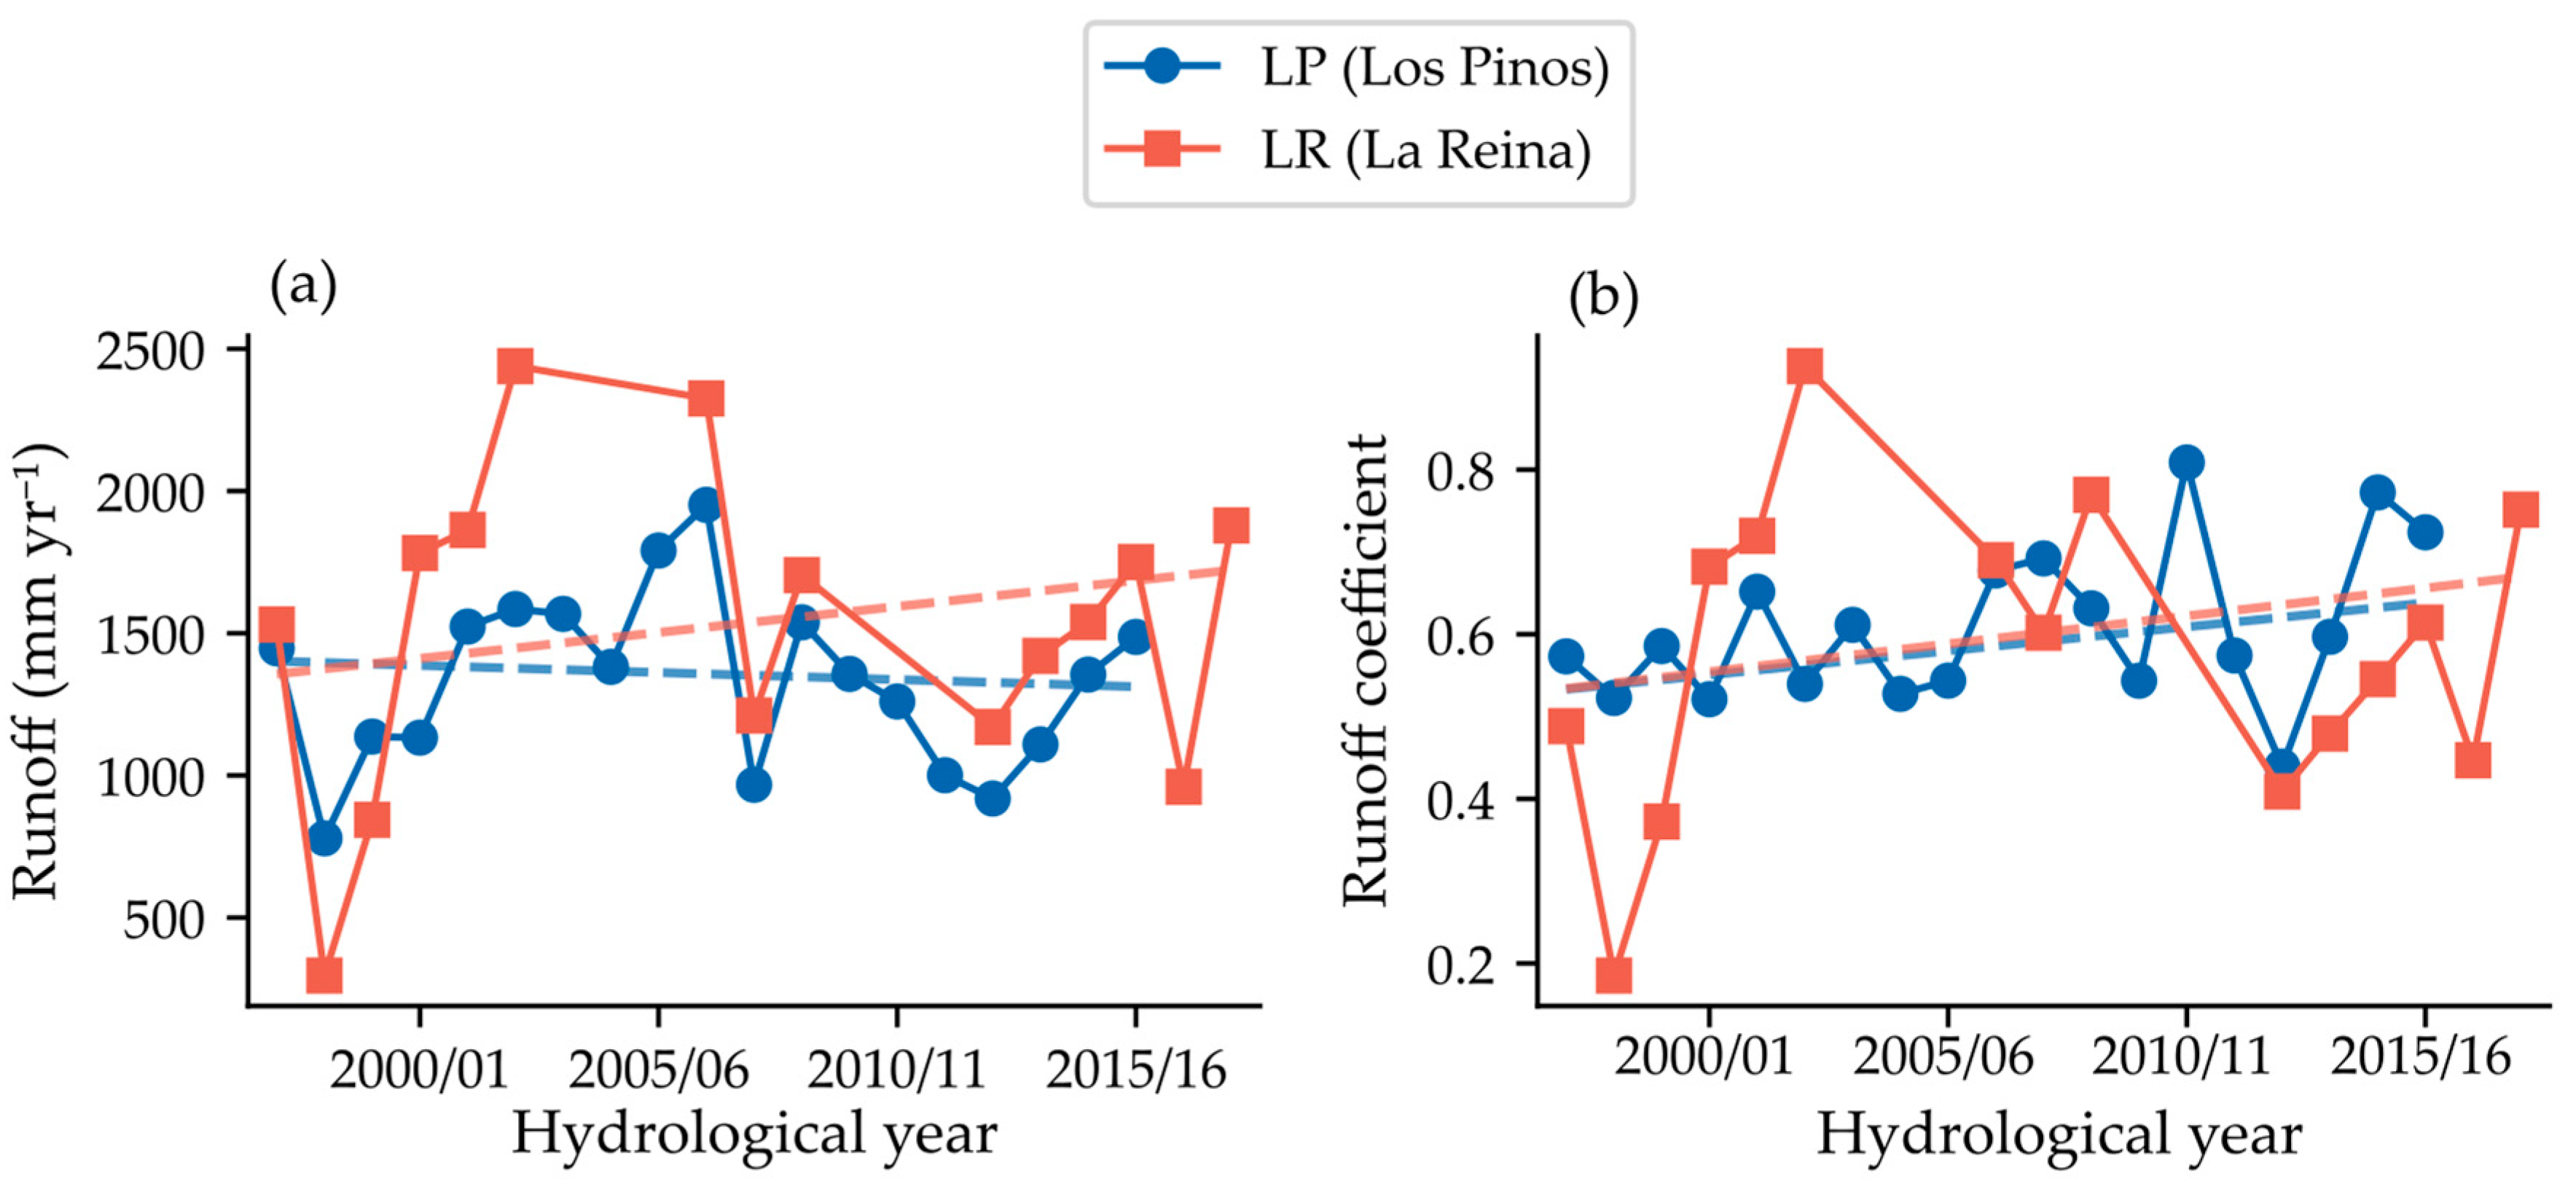
Annual runoff exhibited substantial inter-annual variability in both catchments (Figure 5a). Mean annual runoff was 1331 ± 306 mm yr−1 at LP and 1514 ± 560 mm yr−1 at LR. Runoff variability was notably larger at LR, particularly during the years immediately surrounding the 1999/2000. Nevertheless, no statistically significant monotonic trend or abrupt Pettitt change point was detected in annual runoff at either catchment (Table 3).
The annual runoff coefficient (Q/P) also showed marked year-to-year variability (Figure 5b). LP displayed relatively stable runoff coefficients throughout the record, generally ranging between 0.50 and 0.80, whereas LR exhibited substantially larger fluctuations during 2000/01 to 2005/06 period. Despite this variability, no statistically significant long-term trend in annual runoff coefficient was detected at LR. LP exhibited a marginal positive tendency (Hamed–Rao MK: p = 0.069; Sen β = +0.006 yr−1).

3.3. Low-Flow Regime: Contrasting Multi-Index Signals

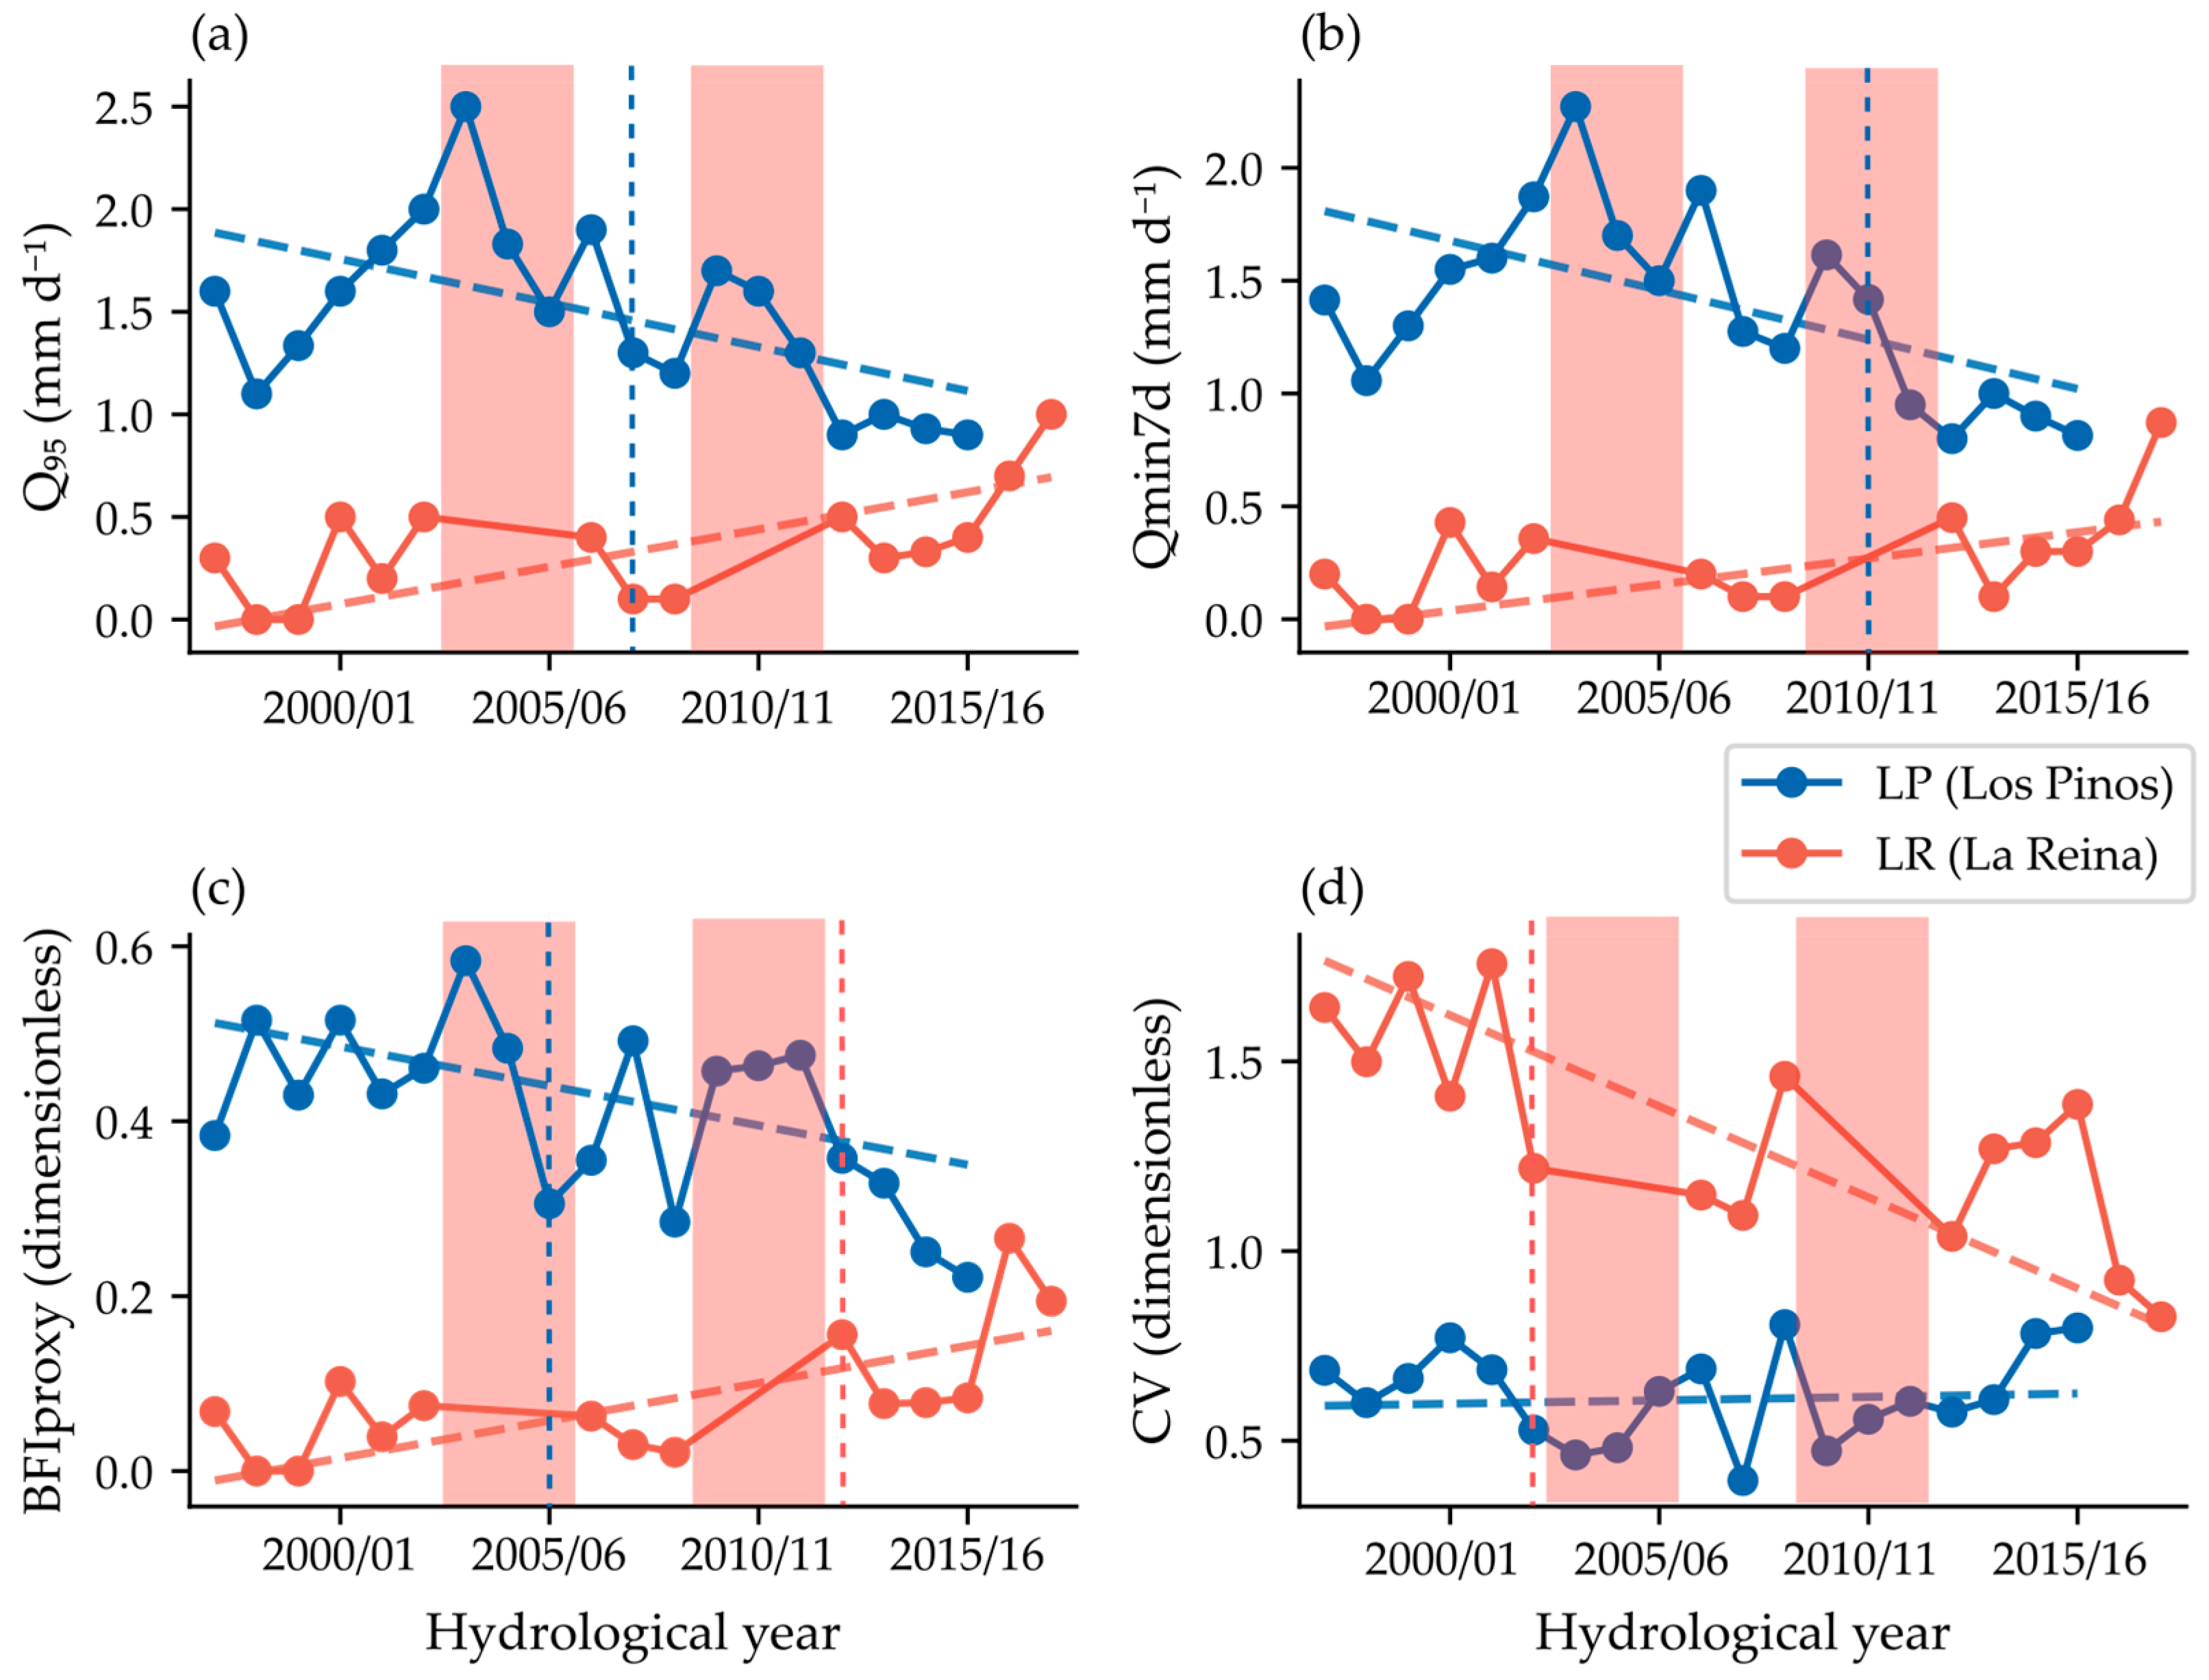
The four low-flow indices showed contrasting and internally consistent patterns between LP and LR, as described below and summarized in Table 3 and illustrated in Figure 3.

3.3.1. LP—Progressive Decline in Low-Flow Conditions

Low-flow conditions at LP declined progressively during the second half of the study period (Figure 6a,b). The low-flow index Q95 showed a negative Sen slope (β = −0.043 mm d−1 yr−1; Hamed–Rao MK p = 0.097) together with a near-significant Pettitt change point in 2006/07 (K = 66, p = 0.054), after which median Q95 declined from 1.70 to 1.20 mm d−1, representing a reduction of approximately 29%. A similar pattern was observed for the annual 7-day minimum runoff (Qmin7d; Figure 6b). Although the Mann–Kendall trend was not statistically significant (p = 0.117), the Pettitt test identified a significant change point in 2010/11 (K = 70, p = 0.034). Median Qmin7d declined from 1.54 mm d−1 before the transition to 0.90 mm d−1 afterward, equivalent to a reduction of approximately 41%.
The BFIproxy at LP showed the strongest monotonic signal of all low-flow indices: a statistically significant decreasing trend (Hamed–Rao MK: p = 0.036, Sen β = −0.009 yr−1, mean 0.41 ± 0.10). CV at LP showed no significant trend (p = 0.624), consistent with a stable overall flow regime variability despite the declining BFIproxy. The temporal evolution of low-flow indices suggests a progressive reduction in low-flow conditions at LP beginning around 2006–2010.

3.3.2. LR—Progressive Increase in Low-Flow Conditions over the Post-Clearcut Record

In contrast to LP, low-flow conditions at LR increased progressively through time (Figure 6a,b). Both Q95 and Qmin7d exhibited statistically significant positive trends over the study period. Q95 increased at a rate of Sen β = +0.036 mm d−1 yr−1 (τ = +0.419, p = 0.032), while Qmin7d increased at β = +0.025 mm d−1 yr−1 (τ = +0.400, p = 0.041). No significant Pettitt change was detected. The earliest years of the LR record were characterized by extremely low dry-season runoff conditions, including complete cessation of measurable flow in two hydrological years (1998/99 and 1999/00), when Q95 reached 0.00 mm d−1. In contrast, by the final years of the record, Q95 had increased to values approaching 0.70–1.00 mm d−1. No significant Pettitt change point was detected in Q95 or Qmin7d at LR (p = 0.291 for both). BFIproxy at LR showed the strongest trend signal of all indices (Hamed–Rao MK: p = 0.012, τ = +0.495, Sen β = +0.009 yr−1; mean 0.08 ± 0.07). The index ranged from 0.00 in 1998/99–1999/00 to 0.19–0.27 in 2016/17–2017/18, approaching values comparable to LP (mean 0.41) by the end of the analytical period (Figure 6c). The CV declined (Hamed–Rao MK: p = 0.008, τ = −0.524, Sen β = −0.048 yr−1; mean 1.31 ± 0.27) from values consistently above 1.4 during the late 1990s and early 2000s to values below 1.0 during the final years of the study period. Dry-season RC at LR also increased significantly (Hamed–Rao MK: p = 0.038, Sen β = +0.020 yr−1), while no significant change was detected in annual P (p = 0.857) or Q (p = 0.621; Figure 6d).

3.3.3. Low-Flow Duration and Frequency

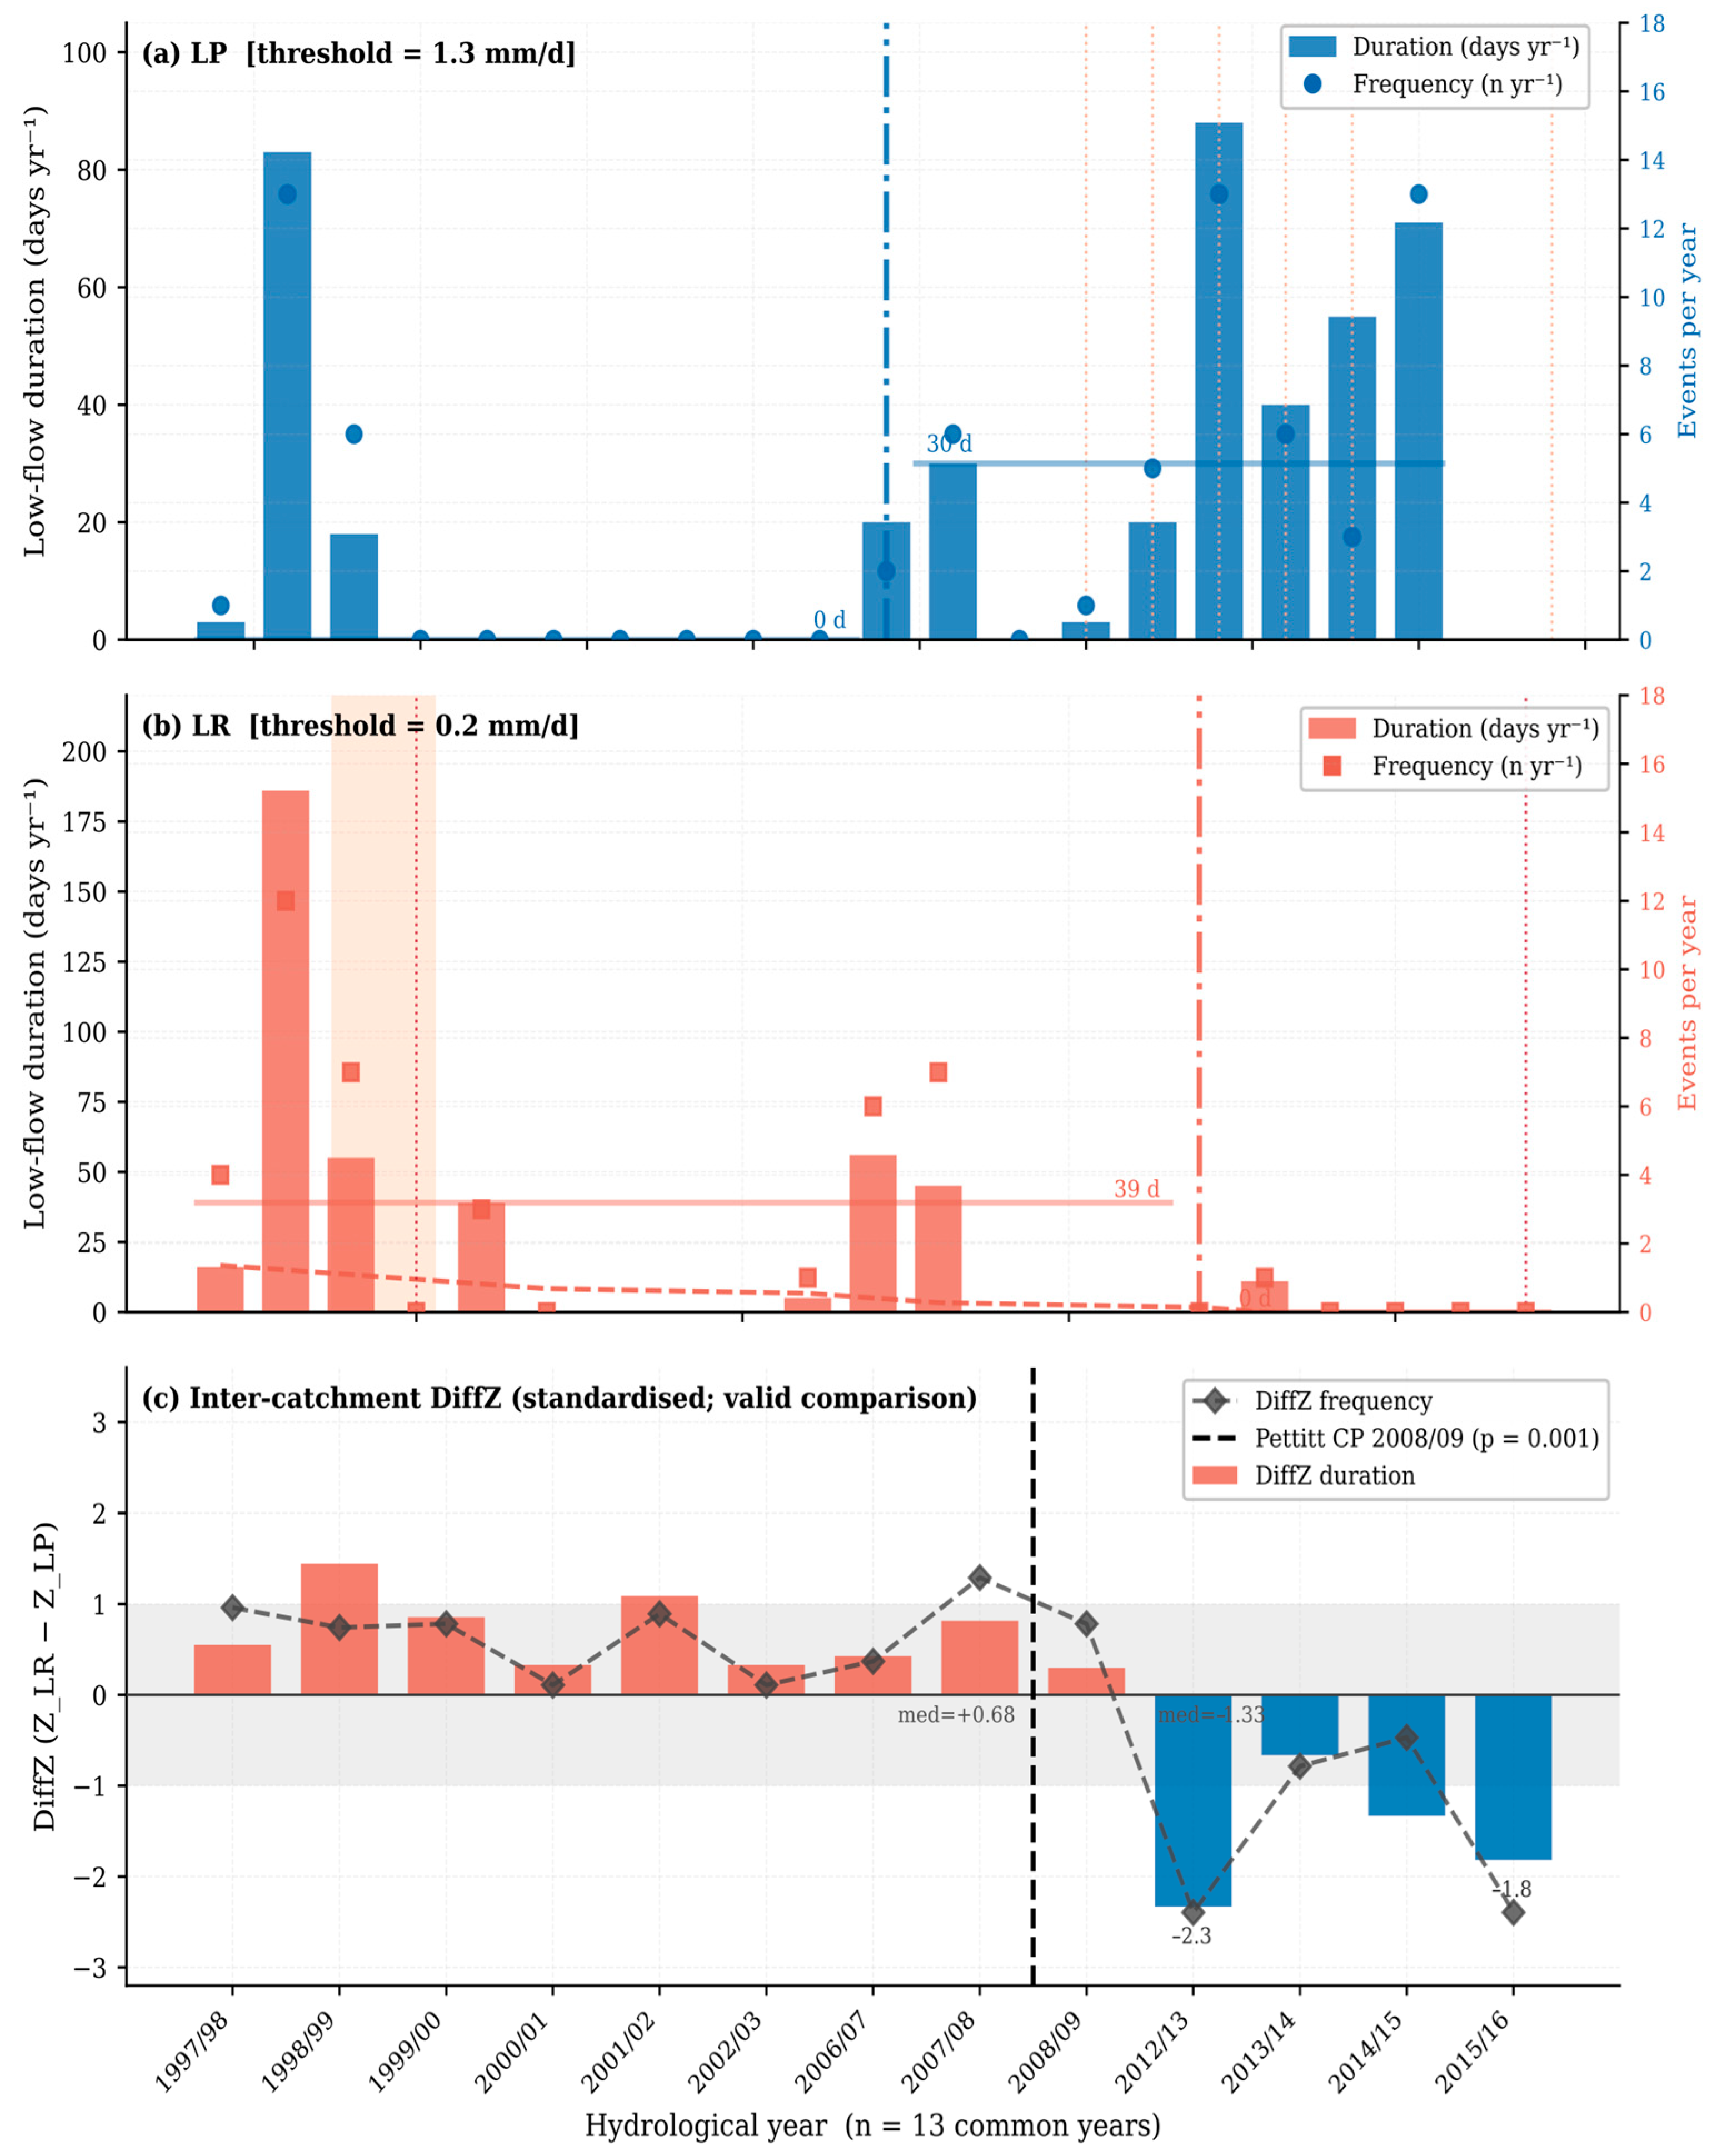
The annual number of days when discharge fell below the site-specific threshold provided a complementary characterization of dry-season flow conditions that focuses on the temporal exposure to low-flow states rather than their magnitude. Within-catchment trends and the DiffZ comparison (Figure 7c) are the suitable frameworks; the absolute values of LP and LR are not directly comparable because the thresholds differ.
At LP, low-flow duration was effectively zero in seven of the ten years from 2000/01 to 2009/10, indicating that daily discharge rarely fell below 1.30 mm d−1 during this period. From 2011/12 onward, duration increased substantially: 20, 88, 40, 55 and 71 days in the five years 2011/12–2015/16. The Pettitt test detected a change point in 2007/08 (K = 60, p = 0.038; median before: 0 d, after: 30 d). The MK trend did not reach significance (p = 0.127, β = +1.8 d yr−1), consistent with an abrupt rather than gradual increase in low-flow duration. Low-flow frequency followed a similar pattern (Pettitt CP 2007/08, p = 0.098; median before: 0 events yr−1, after: 5 events yr−1; Figure 7a).
At LR, the opposite trajectory was observed (Figure 7b). Low-flow duration peaked in the earliest years of the record (186 d in 1998/99; 55 d in 1999/00), reflecting near-complete dry-season flow cessation between the 1999/00 and 2002/03 periods. Duration declined significantly over the 15-year LR record (Hamed–Rao MK: p = 0.032, β = −1.7 d yr−1; Pettitt CP 2012/13, K = 38, p = 0.064; median before: 39 d, after: 0 d). In five of the final six valid years of the LR record (2012/13–2017/18), low-flow duration was zero. Low-flow frequency at LR declined similarly (p = 0.038, β = −0.31 events yr−1; Pettitt CP 2012/13, p = 0.066). DiffZ duration exhibited the strongest statistical response, with a Pettitt change point also detected in 2008/09 (K = 40, p = 0.002) and median values shifting from +0.68 to −1.33 (Figure 7).

3.4. Inter-Catchment Comparison: Standardized Anomaly Differences

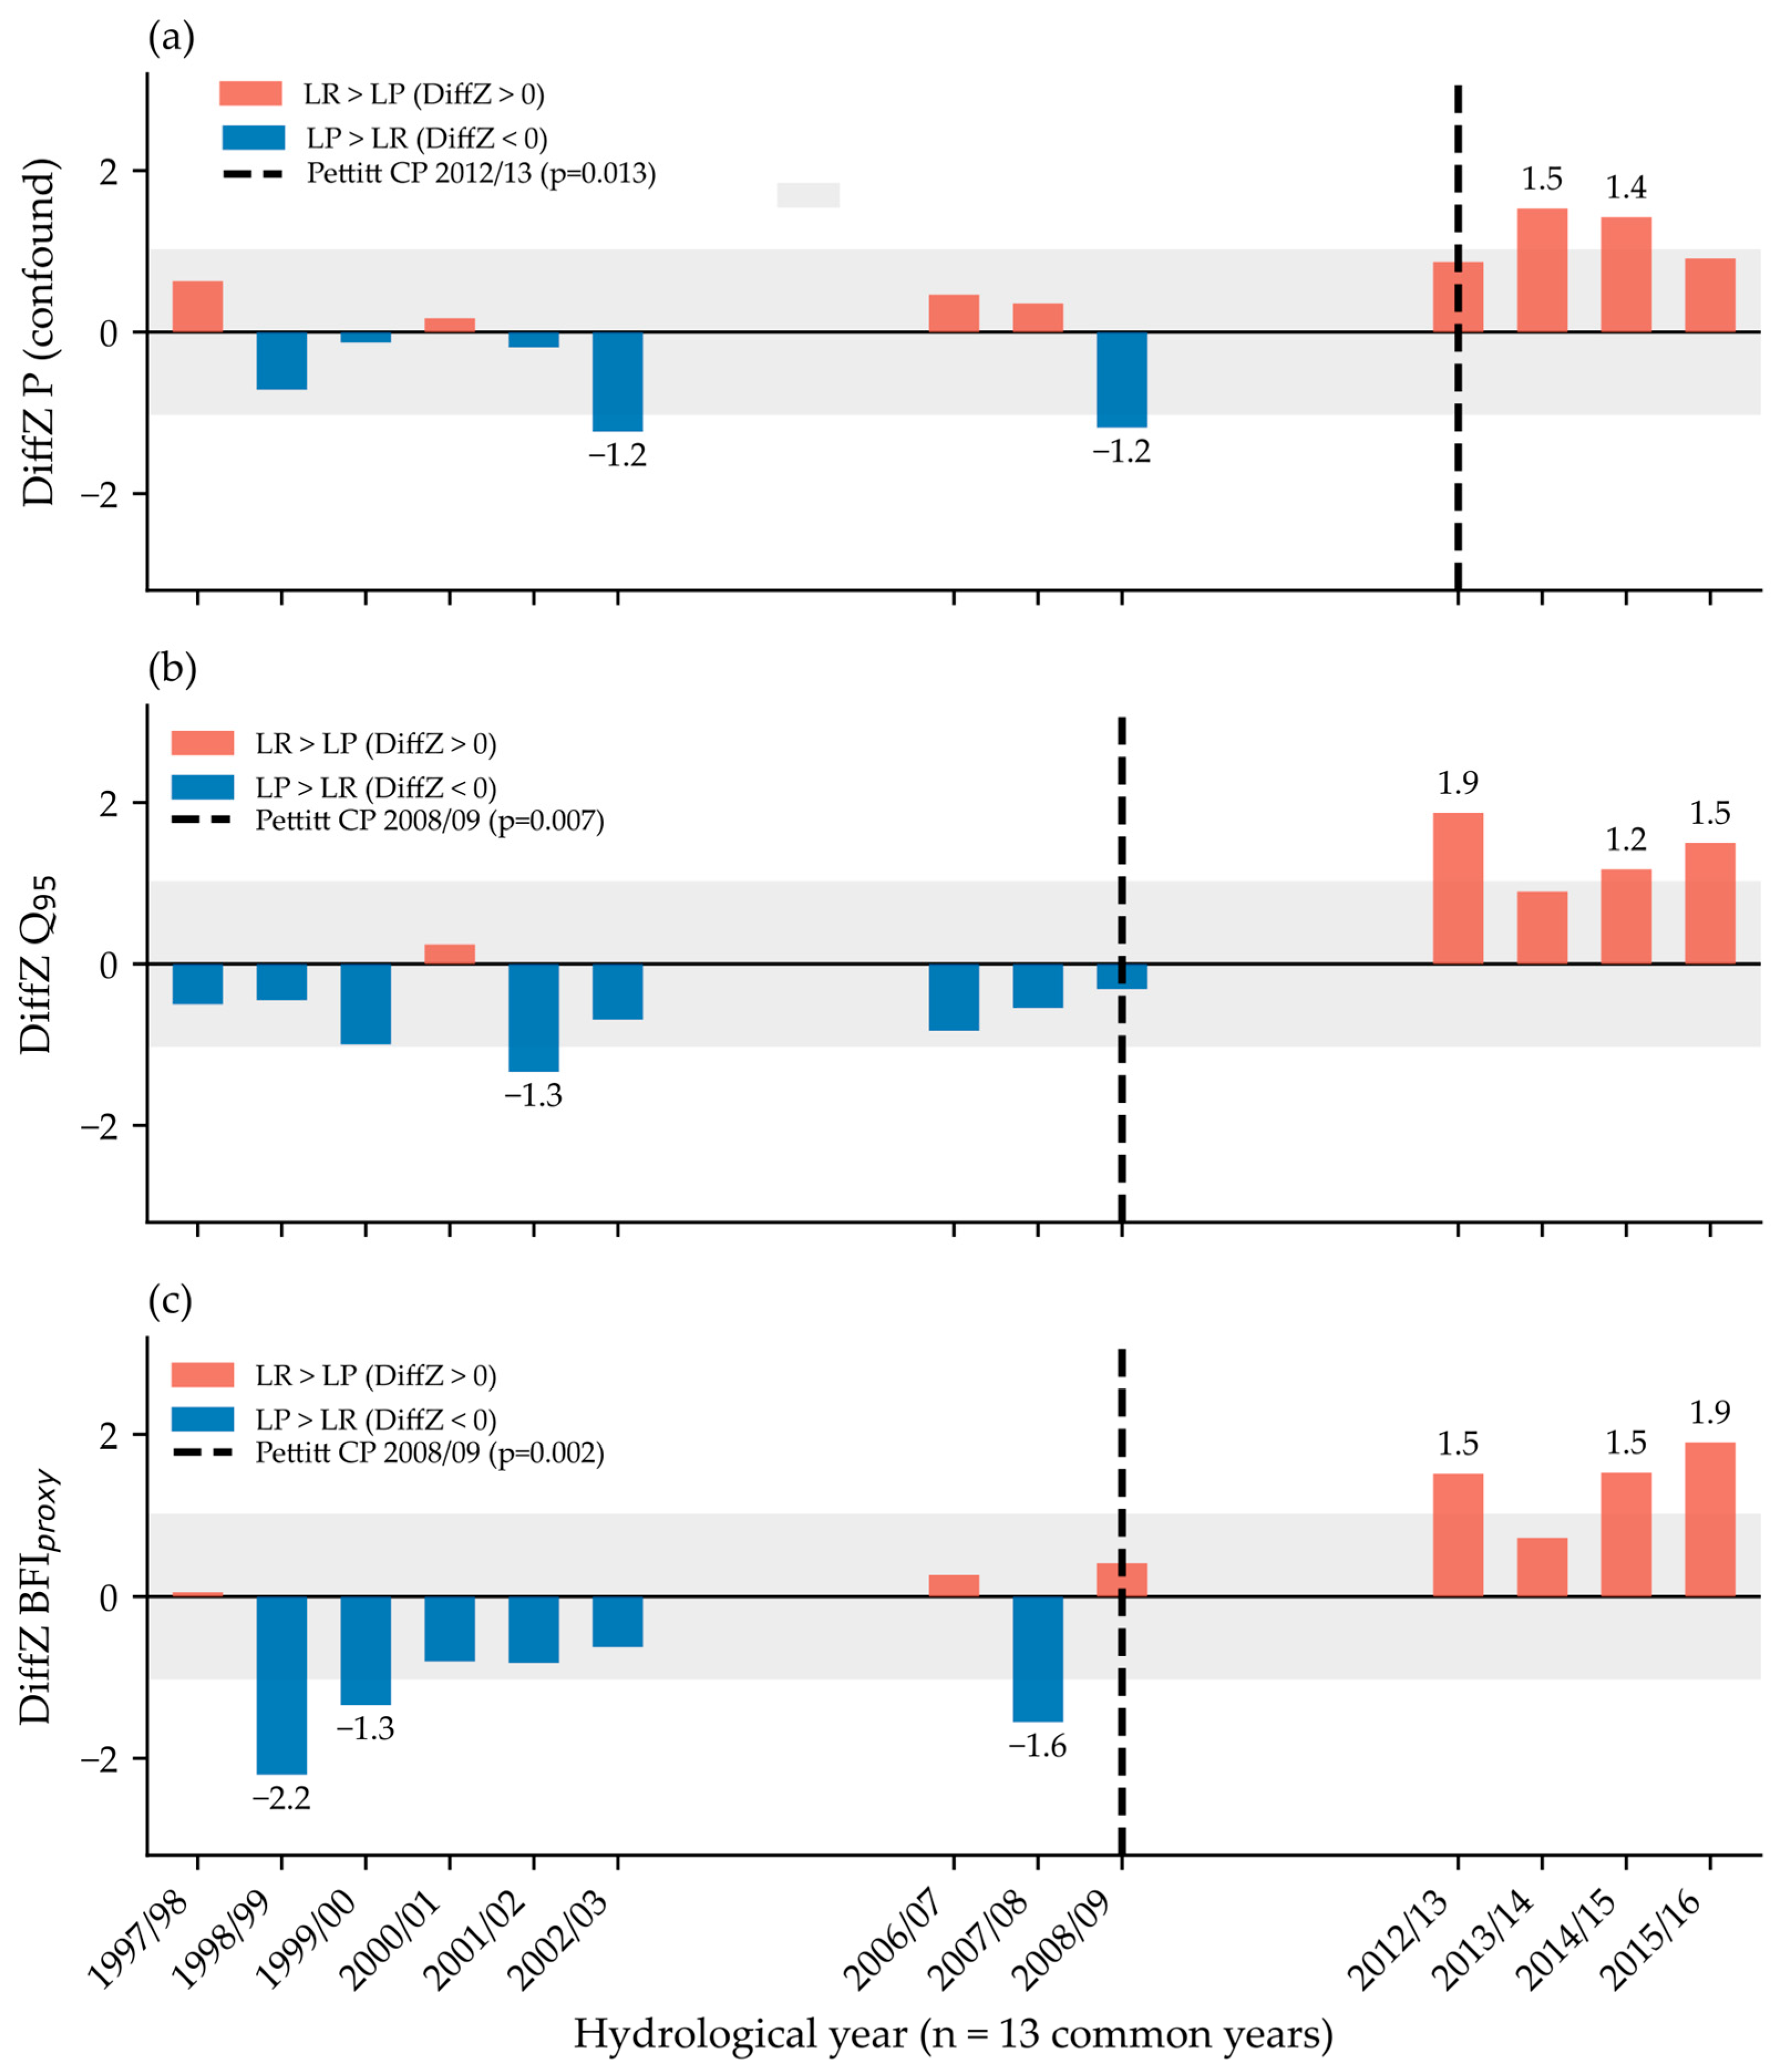
Inter-catchment differences in standardized anomalies (DiffZ = ZLR − ZLP) are presented in Table 4 and Figure 8 for P, Q95, BFIproxy, and low-flow duration over the 13 hydrological years with simultaneously valid observations in both catchments. Overall, all three indices exhibited a similar temporal pattern, with predominantly negative DiffZ values during the first decade of the common record and predominantly positive values after approximately 2008–2012. DiffZQ95 was negative in eight common years between 1997/98 and 2008/09, whereas all common years after 2012/13 exhibited positive values (Figure 8). The Pettitt test identified a near-significant change point in 2008/09 (K = 36, p = 0.07), with median values shifting from −0.62 to +1.17. Similarly, DiffZ in BFIproxy shifted from predominantly negative to strongly positive anomalies after 2012/13, with a significant Pettitt change point in 2008/09 (K = 38, p = 0.002) and median values increasing from −0.81 to +1.52. The DiffZ P series also showed a temporal transition during the same period, with median values shifting from −0.13 before 2012/13 to +1.17 afterward (Table 4).

4. Discussion

This study identified divergent long-term low-flow trajectories in two experimental catchments in the Chilean Coastal Range (Los Pinos, LP, 91 ha; La Reina, LR, 34 ha) under contrasting forest management histories. At LP, several low-flow indicators showed declining conditions during the latter part of the record, including reductions in Q95, Qmin7d, and BFIproxy, together with an increase in the duration of below-threshold flows. In contrast, LR exhibited increasing Q95, Qmin7d, and BFIproxy, decreasing flow variability, and reductions in the duration and frequency of below-threshold events. Although not every index showed a statistically significant trend in both catchments, the combined evidence indicates a persistent divergence in low-flow behavior. Relationship between Q95 and 20% of mean discharge highlights fundamental differences in flow-regime regulation. At LP, Q95 represented approximately 54% of mean daily runoff, indicating relatively sustained baseflow conditions. At LR, Q95 represented only approximately 11% of mean daily runoff, reflecting a more variable regime with substantially lower flows relative to average discharge. Accordingly, a fixed fraction of mean flow would impose different levels of low-flow severity on the two catchments and could bias inter-catchment comparisons of event duration and frequency.
The standardized inter-catchment analysis further showed that the relative behavior of Q95 and BFIproxy shifted during the monitoring period. However, a concurrent change in inter-catchment precipitation anomalies indicates that differential hydroclimatic forcing cannot be excluded as a contributor to the observed divergence. Annual and seasonal precipitation totals, rainy-day frequency, and maximum dry-spell duration showed no significant monotonic trends, whereas maximum 5-day precipitation declined significantly at LP and annual PET increased at LR. Accordingly, the observed low-flow trajectories are consistent with the contrasting management histories of the catchments, but they cannot be attributed to forest management alone.

4.1. Interpretation of Low-Flow Trends in the Context of Forest Management

The long-term trajectory observed at LR is broadly consistent with the conceptual post-harvest evolution described by Coble et al. [33], although the mechanisms responsible for these changes cannot be resolved with the available observations. Unlike the pattern reported by Coble et al., however, the first years following the 1999/2000 clearcut were characterized by persistent low-flow conditions rather than enhanced low-flow availability. Low-flow duration remained elevated during the initial post-harvest years before progressively declining over the remainder of the monitoring period. One possible explanation is that harvesting temporarily altered catchment hydrological functioning during the first years after disturbance. However, because no measurements of soil hydraulic properties, groundwater recharge, or subsurface storage were collected, the mechanisms underlying the observed trajectory remain hypothetical [27,48].
From approximately 2002/03 onward, Q95 and BFI at LR increased steadily, and CV declined significantly (Pettitt p = 0.006; change point as early as 2002/03, only three years post-clearcut). Progressive increases in Q95, Qmin7d and BFIproxy, together with declining low-flow duration, are consistent with a gradual improvement in low-flow conditions during the post-harvest period. These temporal patterns may reflect progressive changes in vegetation structure and associated catchment functioning, although the underlying mechanisms were not evaluated directly [13,49]. By the final years of the record, BFIproxy had increased from values close to 0 to 0.19–0.27, while low-flow episodes became infrequent after 2012/13, indicating substantially improved low-flow conditions relative to the beginning of the monitoring period. This trajectory is consistent with the streamflow trajectories documented by [18] in former Eucalyptus plantations undergoing native forest restoration in south-central Chile, where low-flow increased by 28%–87% during the restoration period and remained elevated thereafter. Although the underlying processes may differ between studies, both records show a progressive improvement in low-flow conditions following major changes in forest cover.
At LP, the observed decline in low-flow indices is less straightforwardly consistent with silvicultural activity. The four partial harvesting events each affected less than 4.6% of the catchment, a level below the 6% cumulative threshold that [47] identified as the minimum needed to generate statistically detectable changes in dry-season mean flows. Moreover, the Pettitt change points in Q95 (2006/07, p = 0.054) and low-flow duration (2007/08, p = 0.038) preceded the first documented harvesting intervention by three to four years. An alternative explanation is a reduction provided by the hydroclimatic analyses, which identified a significant decline in maximum 5-day precipitation (Pmax5d) at LP despite the absence of significant trends in annual or seasonal precipitation totals [50,51]. Because multi-day precipitation events are an important source of seasonal catchment recharge in temperate pluvial environments [52] a reduction in their magnitude may be consistent with declining low-flow conditions. Similar relationships between prolonged hydroclimatic drying and reduced low-flow availability have been documented in other catchments of the Chilean Coastal Range during the 2010–2017 megadrought [5,48]. Nevertheless, the available data do not allow for discrimination between climatic influences, the cumulative effects of repeated small harvests, or the interaction of both processes.
The inter-catchment DiffZ analysis further supports the presence of divergent low-flow trajectories between LP and LR. DiffZ series for Q95, BFIproxy, low-flow duration, and event frequency all exhibited coherent temporal shifts, indicating that LR evolved from relatively greater low-flow stress than LP during the first half of the monitoring period to comparatively more favorable low-flow conditions after approximately 2012. The consistency in both direction and timing across multiple independent indices strengthens confidence that this divergence reflects a persistent change rather than isolated variability. However, the DiffZ of annual precipitation also shifted during the same period (p = 0.011), indicating that the relative precipitation regime between the two catchments also changed during the same period [50,51]. Consequently, the observed divergence in Q95, Qmin7d, BFIproxy, low-flow duration, and event frequency should be interpreted within the context of both contrasting forest management histories and increasingly differential hydroclimatic forcing, rather than being attributed exclusively to either factor.

4.2. Limitations and Future Research Directions

Several limitations constrain the interpretation of these results. First and most importantly, the non-paired design—with LP and LR separated by 85 km, operating under different mean precipitation regimes, and lacking a shared pre-disturbance calibration period—prevents formal attribution of low-flow changes to specific silvicultural events. The catchments also differ substantially in drainage area, with LP being approximately 2.6 times larger than LR. Differences in catchment area and associated drainage organization may influence runoff response times, storage integration, and the expression of low-flow variability. Although discharge was normalized by catchment area, this normalization does not remove differences in hydrological functioning associated with catchment scale. It could provide an additional line of evidence for evaluating relative temporal changes between catchments, but its interpretation assumes broadly comparable regional climatic variability, an assumption only partially supported by the inter-annual precipitation correlation between sites (r = 0.59, p = 0.034). Future studies in this region should prioritize the establishment of properly paired or multi-catchment designs with a common meteorological network spanning the inter-site distance.
Second, LR has only two valid hydrological years preceding the 1999/2000 clearcut, an insufficient pre-disturbance reference period for robust change attribution. Moreover, the 1998/99 hydrological year—the driest in the LR record—is one of only two pre-clearcut observations, indicating that the baseline may not adequately represent the natural range of hydroclimatic variability. Consequently, the apparent magnitude of the long-term increase in Q95, Qmin7d, and BFIproxy should be interpreted cautiously because it references a short pre-disturbance period that may not adequately represent the natural range of hydrological variability [52,53]. Therefore, while the post-harvest trajectory is consistent with progressive hydrological response reported in other forested catchments [47], the available record does not support a robust before–after quantification of the response magnitude. Finally, the hydroclimatic analyses identified a significant shift in inter-catchment precipitation anomalies after approximately 2012. Consequently, climatic forcing cannot be assumed to have remained spatially uniform throughout the study period, further limiting causal attribution of the observed hydrological divergence.
Third, the site-specific low-flow thresholds used in the duration and frequency analysis (LP: 1.30 mm d−1; LR: 0.20 mm d−1) reflect the contrasting mean flow regimes of the two catchments and are not directly comparable in absolute terms. Absolute duration values should not be compared between LP and LR; only within-catchment temporal trends and the DiffZ comparison are valid across-catchment inferences. Future studies could evaluate alternative threshold definitions and compare their sensitivity across catchments. However, because fixed proportions of mean discharge may represent different positions within the flow-duration curve, percentile-based thresholds remain preferable for comparative analyses of low-flow characteristics. Fourth, the 21-year record, while long by Chilean standards for experimental catchments, covers only one full P. radiata rotation at LR (standard rotation: ∼21 years). The second partial harvest at LR in 2017/18 (∼23% of catchment area) falls outside the analytical period, and its hydrological effects on the evolving low-flow regime remain unknown. Monitoring LR through the second rotation will be essential to test whether the observed trajectory is sustained or reversed as the second-rotation stand develops and its ET demand increases.
Future research should prioritize three directions. First, installation of additional meteorological stations at intermediate elevations between LP and LR would allow for spatial interpolation of the precipitation field and assessment of whether the DiffZp change is a genuine gradient signal or a measurement artifact [40,50]. Second, soil hydraulic measurements (saturated hydraulic conductivity, bulk density, organic matter content) at comparable positions in both catchments would allow for mechanistic evaluation of whether the observed changes in BFIproxy are associated with changes in soil hydraulic properties and catchment storage processes capacity [51,52,54]. Third, the record should be extended through the next silvicultural cycle at LR, currently underway following the 2017/18 partial harvest. Q95, BFIproxy, low-flow duration, and event frequency return to conditions similar to those observed immediately after harvesting [55], providing a direct test of the proposed successional low-flow framework in Southern Hemisphere plantation catchments, where long-term observations remain scarce.

4.3. Implications for Forest Management and Catchment Hydrology

The contrasting trajectories observed in LP and LR reinforce the growing consensus that low-flow responses to forest management are highly context dependent. Rather than exhibiting a universal response to plantation establishment or harvesting, the two catchments followed markedly different trajectories despite their geographic proximity. This finding is consistent with recent syntheses emphasizing that antecedent site conditions, harvesting intensity, catchment characteristics, and concurrent hydroclimatic variability jointly influence post-harvest streamflow responses [15,26,33].
The significant shift detected in the inter-catchment precipitation anomaly (DiffZ precipitation) further highlights the challenges of separating forest management effects from hydroclimatic forcing in long observational records. Increasing differences in precipitation inputs after approximately 2012 likely contributed to the divergence in low-flow indicators observed between LP and LR. Similar interactions between land-cover change and climatic variability have been reported in other long-term experimental catchments, where forest disturbance and hydroclimatic variability jointly influenced streamflow trajectories [26,47,52,54]. These findings emphasize that attribution studies based solely on streamflow observations should be interpreted cautiously when concurrent climatic changes occur.
Despite these limitations, the present study provides one of the few long-term observational records from experimental plantation catchments in southern Chile, spanning an entire Pinus radiata rotation. Long-term datasets of this type remain scarce in both Chile and the Southern Hemisphere but are essential for evaluating delayed hydrological responses, testing conceptual models of post-harvest recovery, and improving the representation of forest management effects in catchment-scale hydrological assessments [26,27,52].

5. Conclusions

This study analyzed 21 consecutive hydrological years from two experimental catchments in southern Chile to evaluate long-term low-flow dynamics under contrasting forest management histories. The results revealed divergent trajectories between the catchments. At LR, low-flow indicators (Q95, Qmin7d, and BFIproxy) increased progressively while low-flow duration and event frequency declined over time. In contrast, LP exhibited gradual deterioration of low-flow conditions despite only limited harvesting activity. These contrasting responses indicate that long-term low-flow evolution differed substantially between the two catchments.
Although the temporal evolution at LR is broadly consistent with conceptual models of post-harvest hydrological recovery described in previous studies, the observational design does not permit formal attribution of these changes to forest management alone. The significant divergence in inter-catchment precipitation anomalies after approximately 2012 indicates that hydroclimatic variability also contributed to the observed differences. Consequently, the contrasting low-flow trajectories are best interpreted as the combined outcome of forest management history and evolving climatic forcing rather than evidence attributable exclusively to either factor.
Despite these limitations, this study provides one of the longest continuous hydrological records available from experimental plantation catchments in southern Chile, spanning an entire Pinus radiata rotation. Such long-term observations remain scarce but are essential for understanding delayed hydrological responses, evaluating interactions between forest management and hydroclimatic variability, and improving evidence-based management of plantation landscapes under a changing climate. Continued monitoring through subsequent harvesting rotations, combined with improved meteorological and soil observations, will be necessary to further disentangle climatic and land-use controls on low-flow dynamics.

Author Contributions

Conceptualization, F.B., A.P., H.P. and A.I.; methodology, A.P. and H.P.; formal analysis, A.P., H.P.; investigation, F.B., A.P. and A.I.; resources, F.B. and A.I.; data curation, A.P., H.P.; writing—original draft preparation, F.B., A.P.; writing—review and editing, F.B., A.P. and A.I.; supervision, F.B., A.P. and A.I.; funding acquisition, F.B., A.P. and A.I. All authors have read and agreed to the published version of the manuscript.

Funding

This research was supported by internal funds from the Hydrology Laboratory of the Universidad Austral de Chile. No external funding was received for this study.

Data Availability Statement

The data used in this research can be requested by e-mail to alberto.paredes@uach.cl.

Acknowledgments

During the preparation of this work the authors used ChatGPT (OpenAI, GPT-5) to improve the English style and clarity of the text. After using this tool, the authors reviewed and edited the content as needed and takes full responsibility for the content of the published article.

Conflicts of Interest

Author Francisco Balocchi was employed by the company Centro de Investigaciones Bioforest Spa. The remaining authors declare that the research was conducted in the absence of any commercial or financial relationships that could be construed as a potential conflict of interest.

Abbreviations

The following abbreviations are used in this manuscript:
BFIproxyNormalized low-flow index proxy (Q95/(Qanntal/365))
CMIP6Coupled Model Intercomparison Project Phase 6
CPChange point
CVCoefficient of variation in daily runoff
DiffZStandardized inter-catchment anomaly difference (Z_LR − Z_LP)
ERA5ECMWF Reanalysis version 5
ETEvapotranspiration
FAOFood and Agriculture Organization of the United Nations
FDCFlow duration curve
LAILeaf area index
LPLos Pinos (experimental catchment, 91 ha, 39°48′ S)
LRLa Reina (experimental catchment, 34 ha, 40°34′ S)
MKMann–Kendall (trend test)
PPrecipitation (mm d−1 or mm yr−1)
PETPotential evapotranspiration (mm d−1 or mm yr−1)
QRunoff/discharge (mm d−1 or mm yr−1)
Q95Low-flow index: daily discharge exceeded 95% of the time (from annual FDC)
Qmin7d7-day minimum runoff (annual minimum of the 7-day centered moving-average discharge)
RAExtraterrestrial radiation (MJ m−2 d−1)
RCDryDry-season runoff coefficient (QDry/PDry, December–March)
r1Lag-1 autocorrelation coefficient
SDStandard deviation
SenTheil–Sen slope estimator
PTotal precipitation during each hydrological year.
PwetTotal precipitation accumulated from May to November.
PDryTotal precipitation accumulated from December to March.
Rainy daysNumber of days with daily precipitation ≥ 1 mm.
Pmax5dLargest precipitation total accumulated over any consecutive 5-day period within each hydrological year.

Appendix A

Table A1. Establishment years and landcover surfaces in Los Pinos and La Reina catchments.
CatchmentLand-Cover/Stand TypeCatchment Area (%)Establishment Year(S)/Management History
Los Pinos (LP)Native forest66.6Pre-existing native forest
Pinus radiata14.61976, 1984, 1987, 1992, 1998, 2013, 2017, 2018
Eucalyptus nitens9.62010, 2014, 2018
Eucalyptus globulus4.92007, 2017
Other/recently harvested area3.5Not specified
La Reina (LR)Pinus radiata plantation (original cover)79.4Established in 1977
Eucalyptus nitens42.1Reforested in June–July 2000
Pinus radiata37.3Reforested in June–July 2000
New harvesting cycleBegan in early 2017

References

  1. Reek, J.E.; Zohner, C.M.; Smith, G.R.; Cook-Patton, S.C.; Frenne, P.D.; Odorico, P.D.; Floriancic, M.G.; Jackson, R.B.; Jones, J.A.; Kirchner, J.W.; et al. More than mitigation: The role of forests in climate adaptation. Science 2026, 391, 669–679. [Google Scholar] [CrossRef] [PubMed]
  2. Zhang, B.; Lan, K.; Yang, F.; Xu, Y.; Piotto, D.; Ashton, M.; Yao, Y. Innovative reforestation mosaics on marginal land in ntica biome can the globally important Mata Atla create climate and economic co-benefits. One Earth 2025, 8, 101306. [Google Scholar]
  3. Xiong, J.; Yang, Y. Climate Change and Hydrological Extremes. Curr. Clim. Change Rep. 2025, 11, 1. [Google Scholar] [CrossRef]
  4. Allan, R.P.; Barlow, M.; Byrne, M.P.; Cherchi, A.; Douville, H.; Fowler, H.J.; Gan, T.Y.; Pendergrass, A.G.; Rosenfeld, D.; Swann, A.L.S.; et al. Advances in understanding large-scale responses of the water cycle to climate change. Ann. N. Y. Acad. Sci. 2020, 1472, 49–75. [Google Scholar] [CrossRef] [PubMed]
  5. Garreaud, R.; Boisier, J.P.; Alvarez-garreton, C.; Christie, D.A.; Carrasco-escaff, T.; Vergara, I.; Chávez, R.O.; Aldunce, P.; Camus, P.; Suazo-álvarez, M.; et al. Hyperdroughts in central Chile: Drivers, impacts, and projections. Hydrol. Earth Syst. Sci. 2025, 29, 5347–5369. [Google Scholar] [CrossRef]
  6. Alvarez-garreton, C.; Boisier, J.P.; Garreaud, R.; Seibert, J.; Vis, M. Progressive water deficits during multiyear droughts in basins with long hydrological memory in Chile Progressive water deficits during multiyear droughts in basins with long hydrological memory in Chile. Hydrol. Earth Syst. Sci. 2021, 25, 429–444. [Google Scholar] [CrossRef]
  7. Boisier, J.P.; Alvarez-garreton, C.; Marinao, R.; Galleguillos, M. Increasing water stress in Chile evidenced by novel datasets of water availability, land use and water use. EGUsphere 2024. preprint. [Google Scholar]
  8. Salazar, Á.; Thatcher, M.; Goubanova, K.; Bernal, P.; Gutiérrez, J.; Squeo, F. CMIP6 precipitation and temperature projections for Chile. Clim. Dyn. 2024, 62, 2475–2498. [Google Scholar]
  9. Del Pozo, A.; Catenacci-Aguilera, G.; Acosta-Gallo, B. Consequences of Land Use Changes on Native Forest and Agricultural Areas in Central-Southern Chile during the Last Fifty Years. Land 2024, 13, 610. [Google Scholar] [CrossRef]
  10. Alvarez-garreton, C.; Lara, A.; Boisier, J.P.; Galleguillos, M. The Impacts of Native Forests and Forest Plantations on Water Supply in Chile. Forests 2019, 10, 473. [Google Scholar] [CrossRef]
  11. Zúñiga, F.; Dec, D.; Valle, S.R.; Thiers, O.; Paulino, L.; Martínez, O.; Seguel, O.; Casanova, M.; Pino, M.; Horn, R.; et al. The waterlogged volcanic ash soils of southern Chile. A review of the “Ñadi” soils. Catena 2019, 173, 99–113. [Google Scholar] [CrossRef]
  12. Casanova, M.; Salazar, O.; Seguel, O.; Luzio, W. The Soils of Chile; Springer: Berlin/Heidelberg, Germany, 2013. [Google Scholar]
  13. Birkinshaw, S.J.; Bathurst, J.C.; Robinson, M. 45 years of non-stationary hydrology over a forest plantation growth cycle, Coalburn catchment, Northern England. J. Hydrol. 2014, 519, 559–573. [Google Scholar] [CrossRef]
  14. Archer, D.R. The use of flow variability analysis to assess the impact of land use change on the paired Plynlimon. J. Hydrol. 2007, 347, 487–496. [Google Scholar] [CrossRef]
  15. Brown, A.E.; Zhang, L.; McMahon, T.A.; Western, A.W.; Vertessy, R.A. A review of paired catchment studies for determining changes in water yield resulting from alterations in vegetation. J. Hydrol. 2005, 310, 28–61. [Google Scholar] [CrossRef]
  16. Bosch, J.M.; Hewlett, J. A review of catchment experiments to determine the effect of vegetation changes on water yield and evapotranspiration. J. Hydrol. 1982, 55, 3–23. [Google Scholar] [CrossRef]
  17. Burt, T.P.; Howden, N.J.K.; Mcdonnell, J.J.; Jones, J.A.; Hancock, G.R. Seeing the climate through the trees: Observing climate and forestry impacts on stream flow using a 60-year record. Hydrol. Process. 2015, 29, 473–480. [Google Scholar] [CrossRef]
  18. Lara, A.; Jones, J.; Little, C.; Vergara, N. Streamflow response to native forest restoration in former Eucalyptus plantations in south central Chile. Hydrol. Process. 2021, 35, e14270. [Google Scholar] [CrossRef]
  19. Ma, S.; Zhou, S.; Yu, B.; Song, J. Deforestation-induced runoff changes dominated by forest-climate feedbacks. Sci. Adv. 2024, 10, eadp3964. [Google Scholar] [CrossRef] [PubMed]
  20. Van Meerveld, I.; Seibert, J. Reforestation effects on low flows: Review of public perceptions and scientific evidence. WIREs Water 2024, 12, e1760. [Google Scholar] [CrossRef]
  21. Zhao, M.; Boll, J.; Brooks, E.S. Evaluating the effects of timber harvest on hydrologically sensitive areas and hydrologic response. J. Hydrol. 2021, 593, 125805. [Google Scholar] [CrossRef]
  22. Zhang, L.; Zhao, F.F.; Brown, A.E. Predicting effects of plantation expansion on streamflow regime for catchments in Australia. Hydrol. Earth Syst. Sci. 2012, 16, 2109–2121. [Google Scholar] [CrossRef]
  23. Zhang, M.; Wei, X.; Sun, P.; Liu, S. The effect of forest harvesting and climatic variability on runoff in a large watershed: The case study in the Upper Minjiang River of Yangtze River basin. J. Hydrol. 2012, 464–465, 1–11. [Google Scholar] [CrossRef]
  24. Brown, A.E.; Western, A.W.; Mcmahon, T.A.; Zhang, L. Impact of forest cover changes on annual streamflow and flow duration curves. J. Hydrol. 2013, 483, 39–50. [Google Scholar] [CrossRef]
  25. Banton, O.; St-pierre, S.; Banton, G.; Laures, N.; Triganon, A. A Review of the Key Impacts of Deforestation and Wildfires on Water Resources with Regard to the Production of Drinking Water. Hydrology 2025, 12, 271. [Google Scholar] [CrossRef]
  26. Balocchi, F.; Galleguillos, M.; Rivera, D.; Stehr, A.; Arumi, J.L.; Pizarro, R.; Garcia-Chevesich, P.; Iroumé, A.; Armesto, J.J.; Hervé-Fernández, P.; et al. Forest hydrology in Chile: Past, present, and future. J. Hydrol. 2023, 616, 128681. [Google Scholar] [CrossRef]
  27. Coble, A.A.; Barnard, H.; Du, E.; Johnson, S.; Jones, J.; Keppeler, E.; Kwon, H.; Link, T.E.; Penaluna, B.E.; Reiter, M.; et al. Long-term hydrological response to forest harvest during seasonal low flow: Potential implications for current forest practices. Sci. Total Environ. 2020, 730, 138926. [Google Scholar] [CrossRef] [PubMed]
  28. Soto-schönherr, S.; Iroumé, A. How much water do Chilean forests use? A review of interception losses in forest plot studies. Hydrol. Process. 2016, 30, 4674–4686. [Google Scholar] [CrossRef]
  29. Picchio, R.; Jourgholami, M.; Zenner, E.K. Effects of Forest Harvesting on Water and Sediment Yields: A Review Toward Better Mitigation and Rehabilitation Strategies. Curr. For. Rep. 2021, 7, 214–229. [Google Scholar] [CrossRef]
  30. Iroumé, A.; Palacios, H.; Bathurst, J.; Huber, A. Runoff and peakflows after clearcutting and the establishment of a new plantation in an experimental catchment, southern Chile. Bosque 2010, 31, 117–128. [Google Scholar] [CrossRef]
  31. Bathurst, J.C.; Fahey, B.; Iroumé, A.; Jones, J. Forests and floods: Using field evidence to reconcile analysis methods. Hydrol. Process. 2020, 34, 3295–3310. [Google Scholar] [CrossRef]
  32. Hersbach, H.; Bell, B.; Berrisford, P.; Hirahara, S.; Horányi, A.; Muñoz-Sabater, J.; Nicolas, J.; Peubey, C.; Radu, R.; Schepers, D.; et al. The ERA5 global reanalysis. Q. J. R. Meteorol. Soc. 2020, 146, 1999–2049. [Google Scholar] [CrossRef]
  33. Allen, R.G.; Pereira, L.S.; Raes, D.; Smith, M. Crop Evapotranspiration: Guidelines for Computing Crop Water Requirements; FAO: Rome, Italy, 1998. [Google Scholar]
  34. Filoso, S.; Bezerra, M.O.; Weiss, K.C.B.; Palmer, M.A. Impacts of Forest Restoration on Water Yield: A Systematic Review. PLoS ONE 2017, 12, e0183210. [Google Scholar] [CrossRef] [PubMed]
  35. Mcmillan, H. Linking hydrologic signatures to hydrologic processes: A review. Hydrol. Process. 2020, 34, 1393–1409. [Google Scholar] [CrossRef]
  36. Robinson, M.; Cognard-Plancq, A.; Cosandey, C.; David, J.; Durand, P.; Führer, H.-W.; Hall, R.; Hendriques, M.O.; Marc, V.; McCarthy, R.; et al. Studies of the impact of forests on peak flows and baseflows: A European perspective. For. Ecol. Manag. 2003, 186, 85–97. [Google Scholar] [CrossRef]
  37. Basso, M.; Baartman, J.; Martins, M.; Keizer, J.; Vieira, D. Predicting post-fire hydrological and erosive catchment response during rainfall events. A comparison of OpenLISEM and MOHID Land models. J. Hydrol. 2024, 636, 131258. [Google Scholar] [CrossRef]
  38. Mcmillan, H.; Coxon, G.; Araki, R.; Salwey, S.; Kelleher, C.; Zheng, Y.; Knoben, W.; Gnann, S.; Seibert, J.; Bolotin, L. When good signatures go bad: Applying hydrologic signatures in large sample studies. Hydrol. Process. 2023, 37, e14987. [Google Scholar] [CrossRef]
  39. Mcmillan, H.K. A review of hydrologic signatures and their applications. Wiley Interdiscip. Rev. Water 2021, 8, e1499. [Google Scholar]
  40. Álvarez, J.; Allen, H.L.; Albaugh, T.J.; Stape, J.L.; Bullock, B.P.; Song, C. Factors influencing the growth of radiata pine plantations in Chile. Forestry 2012, 86, 13–26. [Google Scholar] [CrossRef]
  41. Mcmillan, H. Forest streamflow driven by soils, topography and previous rains. Nat. Water 2026, 4, 4–6. [Google Scholar] [CrossRef]
  42. Ahmed, N.; Wang, G.; Booij, M.J.; Xiangyang, S.; Hussain, F.; Nabi, G. Separation of the Impact of Landuse/Landcover Change and Climate Change on Runoff in the Upstream Area of the Yangtze River, China. Water Resour. Manag. 2022, 36, 181–201. [Google Scholar]
  43. Yang, Q.; Li, Z.; Han, Y.; Gao, H. Responses of base flow to ecological construction and climate change in different geomorphological types in the middle yellow river, China. Water 2020, 12, 304. [Google Scholar] [CrossRef]
  44. Hamed, K.H. Trend detection in hydrologic data: The Mann-Kendall trend test under the scaling hypothesis. J. Hydrol. 2008, 349, 350–363. [Google Scholar] [CrossRef]
  45. Hu, Z.; Liu, S.; Zhong, G.; Lin, H.; Zhou, Z. Modified Mann-Kendall trend test for hydrological time series under the scaling hypothesis and its application. Hydrol. Sci. J. 2020, 65, 2419–2438. [Google Scholar] [CrossRef]
  46. Hussain, M.; Mahmud, I. pyMannKendall: A python package for non parametric Mann Kendall family of trend tests. J. Open Source Softw. 2019, 4, 39–41. [Google Scholar] [CrossRef]
  47. Hussain, M.M.; Mahmud, I.; Bari, S.H. pyHomogeneity: A Python Package for Homogeneity Test of Time Series Data. J. Open Res. Softw. 2023, 11, 13. [Google Scholar] [CrossRef]
  48. Deng, S.; Zhang, M.; Hou, Y.; Jiang, Z.; Li, Q.; Liu, S. Non-stationary streamflow responses to forest harvesting vary along topographic gradients in a sub-alpine watershed of Southwest China. J. Hydrol. 2025, 663, 134262. [Google Scholar]
  49. Iroumé, A.; Jones, J.; Bathurst, J.C. Forest operations, tree species composition and decline in rainfall explain runoff changes in the Nacimiento experimental catchments, south central Chile. Hydrol. Process. 2021, 35, e14257. [Google Scholar] [CrossRef]
  50. Ryberg, K.R.; Hodgkins, G.A.; Dudley, R.W. Change points in annual peak streamflows: Method comparisons and historical change points in the United States. J. Hydrol. 2020, 583, 124307. [Google Scholar] [CrossRef]
  51. Tian, P.; Lu, H.; Feng, W.; Guan, Y.; Xue, Y. Large decrease in streamflow and sediment load of Qinghai–Tibetan Plateau driven by future climate change: A case study in Lhasa River Basin. Catena 2020, 187, 104340. [Google Scholar] [CrossRef]
  52. Macchioli Grande, M.; Kaffas, K.; Verdone, M.; Borga, M.; Cocozza, C.; Dani, A.; Errico, A.; Fabiani, G.; Gourdol, L.; Klaus, J.; et al. Seasonal meteorological forcing controls runoff generation at multiple scales in a Mediterranean forested mountain catchment. J. Hydrol. 2024, 639, 131642. [Google Scholar] [CrossRef]
  53. Penna, D. Controls on runoff processes in forested catchments worldwide. Nat. Water 2026, 4, 102–114. [Google Scholar] [CrossRef]
  54. Addor, N.; Nearing, G.; Prieto, C.; Newman, A.J.; le Vine, N.; Clark, M.P. A Ranking of Hydrological Signatures Based on Their Predictability in Space. Water Resour. Res. 2018, 54, 8792–8812. [Google Scholar] [CrossRef]
  55. Heudorfer, B.; Haaf, E.; Stahl, K.; Barthel, R. Index-Based Characterization and Quantification of Groundwater Dynamics. Water Resour. Res. 2019, 55, 5575–5592. [Google Scholar] [CrossRef]
Figure 1. (A) Location of the study area within Chile (black box). (B) Location of the Los Pinos and La Reina catchments in regional context. (C,D) Details of the Los Pinos and La Reina catchments, showing their boundaries and the discharge gauging structure.
Forests 17 00876 g001
Figure 2. Summarizes the temporal evolution of forest management operations in (a) La Reina and (b) Los Pinos catchments, including annual harvested area and cumulative managed area throughout the study period.
Forests 17 00876 g002
Figure 3. Annual hydroclimatic variables for catchments LP and LR over the study period (1997/98–2017/18): (a) annual precipitation (P); (b) annual potential evapotranspiration (PET). Dashed lines show the Theil–Sen monotonic trend.
Forests 17 00876 g003
Figure 4. Hydroclimatic indices for Los Pinos (LP, blue) and La Reina (LR, red), 1997/98–2017/18: (a) Pwet and Pdry indices; (b) number of rainy days (p ≥ 1.0 mm d−1) and maximum dry-spell length (consecutive days with p < 1.0 mm); and (c) maximum 5-day precipitation total (P5dmax). Dashed lines denote the Theil-Sen trend; dash–dot vertical lines mark Pettitt change points with p ≤ 0.10.
Forests 17 00876 g004
Figure 5. Annual hydroclimatic variables for catchments LP and LR over the study period (1997/98–2017/18): (a) annual runoff (Q); (b) annual runoff coefficient (Q/P). Dashed lines show the Theil–Sen monotonic trend.
Forests 17 00876 g005
Figure 6. Annual hydrological flow signatures for LP and LR: (a) low-flow index Q95; (b) annual 7-day minimum runoff (Qmin7d); (c) BFIproxy and (d) CV. Dashed lines show Theil–Sen trends. Dotted vertical lines mark Pettit change points with p ≤ 0.10. Semi-transparent red boxes denote no-data periods.
Forests 17 00876 g006
Figure 7. Annual low-flow duration (bars, left axis) and event frequency (markers, right axis) for (a) LP and (b) LR, using site-specific thresholds (LP: 1.30 mm/d; LR: 0.20 mm/d; see text). (c) Standardized anomaly differences (DiffZ = Z_LR − Z_LP) for duration (bars) and frequency (diamonds), the only valid inter-catchment comparison.
Forests 17 00876 g007
Figure 8. Standardized anomaly differences (DiffZ = Z_LR−Z_LP) over the 13 common hydrological years: (a) DiffZ of PQ95; (b) DiffZ of PQ95; and (c) DiffZ of the BFI_proxy. Red bars: LR > LP; blue: LP > LR; black dashed line: Pettit change points with p ≤ 0.10.
Forests 17 00876 g008
Table 1. Catchment characteristics and mean hydroclimatic statistics for LP and LR. Values are means ± standard deviations.
CharacteristicsLP (Los Pinos)LR (La Reina)
Catchment area (ha)9134
Management historyMosaic partial harvestingClearcut + reforestation
Location39°48′ S 40°34′ S
Analytical period (Valid years)1997/98–2017/18 (19)1997/98–2017/18 (15)
Mean annual P (mm yr−1)2219 ± 5252572 ± 463
Mean annual Q (mm yr−1)1331 ± 3061514 ± 560
Mean annual RC (Q/P)0.607 ± 0.0950.579 ± 0.188
Mean annual PET (mm yr−1)800 ± 33859 ± 38
Table 2. Hydroclimatic and hydrological indices computed in this study. All indices are derived from daily discharge and precipitation records.
GroupIndexDefinitionUnits
Hydroclimatic indicesAnnual
Precipitation (P)
Total precipitation during each hydrological year.mm yr−1
Wet-season P (Pwet)Total precipitation accumulated from May to November.mm yr−1
Dry-season Precipitation (PDry)Total precipitation accumulated from December to March.mm yr−1
Rainy daysNumber of days with daily precipitation ≥ 1 mm.Days yr−1
Maximum 5-day precipitation (Pmax5d)Largest precipitation total accumulated over any consecutive 5-day period within each hydrological year.mm
Maximum dry-spell duration (Dry-spell)Longest sequence of consecutive days with precipitation < 1 mm.Days
Low-Flow indicesQ95Daily runoff exceeded 95% of the time; annual FDC with Weibull plotting position P = m/(N + 1) ×100%mm d−1
Qmin7dAnnual minimum of the 7-day centered moving-average dischargemm d−1
BFIproxyQ95/(Qannual/365): Q95 normalized by mean daily runoffdimensionless (0–1)
CVCoefficient of variation in daily discharge within each valid hydrological yeardimensionless
RCdryDry-season runoff coefficient: Qdry/Pdry (December–March)dimensionless
DurationNumber of days per year when Q fell below a site-specific threshold (LP: 1.30 mm d−1; LR: 0.20 mm d−1)days yr−1
FrequencyNumber of distinct low-flow events per year (consecutive days below threshold count as one event)events yr−1
Table 3. Summary of Mann–Kendall (Hamed–Rao modification when |r1| > 0.1; original otherwise) trend test results and Pettitt change-point detection for the 12 hydrometeorological indices.
VariableLP: MK (p/Sen β) and Pettitt CPLP Mean ± SDLR: MK (p/Sen β) and Pettitt CPLR Mean ± SD
Hydroclimatic
indices
Annual P (mm yr−1)0.401 ns/−22; no CP2219 ± 5250.857 ns/+23; no CP2572 ± 463
Annual PET (mm yr−1)0.529 ns/+1.3; no CP800 ± 330.023 */+4.6; no CP859 ± 38
Pwet (mm yr−1)0.624 ns/−6.4; no CP1560 ± 3810.48 ns/30; no CP1766 ± 421
Pdry (mm yr−1)0.675 ns/−2; no CP260 ± 1140.84 ns/3.2; no CP344 ± 167
P5dmax (mm yr−1)0.08 †/−7; 2007/08 *229 ± 810.7 ns/−2.5; no CP288 ± 70
D rainy0.62 ns/−0.2; no CP146 ± 150.62 ns/0.6; no CP139 ± 12
Dsmax (days yr−1)0.5 ns/0.2; no CP22 ± 70.65 ns/0.2; no CP23 ± 4
Low-flow magnitude
Q95 (mm d−1)0.097 †/−0.043; CP 2006/07 (†)1.47 ± 0.43p = 0.032 */+0.036; no CP (p = 0.291)0.36 ± 0.27
Qmin7d (mm d−1)0.117 ns/−0.045; CP 2010/11 (*)1.39 ± 0.40p = 0.041 */+0.025; no CP (p = 0.291)0.26 ± 0.21
BFIproxe0.036 */−0.009; CP 2005/06 (†)0.41 ± 0.10p = 0.012 */+0.009; CP 2012/13 (p = 0.007 **)0.08 ± 0.07
CV0.624 ns/+0.002; no CP0.62 ± 0.12p = 0.008 **/−0.048; CP 2002/03 (p = 0.006 **)1.31 ± 0.28
Seasonal context
Dry-season RC0.441 ns/+0.0241.31 ± 0.67p = 0.038 */+0.0200.84 ± 1.7
Low-flow duration and frequency
Duration (days yr−1)0.127 ns/+1.8; CP 2007/08 (*)18 ± 28p = 0.032 */−1.7; CP 2012/13 (p = 0.064 †)38 ± 62
Frequency (events yr−1)0.215 ns/+0.14; CP 2007/08 (†)3 ± 5p = 0.038 */−0.31; CP 2012/13 (p = 0.066 †)4 ± 4
Significance codes: ** p ≤ 0.01, * p ≤ 0.05, † p ≤ 0.10, ns not significant.
Table 4. Standardized anomaly differences (DiffZ = Z_LR − Z_LP) over the 13 common hydrological years with simultaneously valid observations at both catchments.
YearDiffZ PDiffZ Q95DiffZ BFIproxy
1997/980.63−0.50.05
1998/990.71−0.45−2.2
1999/00−0.13−0.1−1.34
2000/010.170.24−0.8
2001/02−0.19−1.34−0.82
2002/03−1.23−0.69−0.6
2006/070.46−0.830.27
2007/080.35−0.54−1.55
2008/09−1.18−0.310.41
2012/130.871.871.52
2013/141.530.90.73
2014/151.421.171.53
2015/160.911.51.9
Pettitt CP2012/13 (p = 0.013 †)2008/09 (p = 0.075 †)2008/09 (p = 0.002 **)
Median before/after−0.13/1.17−0.62/1.17−0.81/1.52
Significance codes: ** p ≤ 0.01, † p ≤ 0.10.
Disclaimer/Publisher’s Note: The statements, opinions and data contained in all publications are solely those of the individual author(s) and contributor(s) and not of MDPI and/or the editor(s). MDPI and/or the editor(s) disclaim responsibility for any injury to people or property resulting from any ideas, methods, instructions or products referred to in the content.