


Abstract
Tree regeneration density and species diversity foretell future forest resilience in the face of changing climate, disturbance regimes, and pest and pathogen outbreaks. However, studies characterizing regeneration composition patterns and their multiple interacting drivers, particularly at regional scales, are scarce. Here, we characterize tree regeneration and associated driving factors for the Northwoods ecoregion, encompassing northern Michigan, Wisconsin, and Minnesota, USA. With data from the USDA Forest Service Forest Inventory and Analysis, we modeled current species richness and density of tree regeneration (stems taller than 30.48 cm (hardwoods) or 15.24 cm (conifers) and <2.54 cm diameter at 1.37 m height) as a function of climate, stand composition, ownership, harvest history, and deer use for the six most common forest groups in the Northwoods. By forest group, we also analyzed recent 20-year changes in tree regeneration richness, total density, and density of key species. Our results suggest tree regeneration abundance and richness are generally associated positively with canopy diversity, recent harvesting, and total annual precipitation; negatively with temperature and canopy basal area; and have few significant associations with deer use and ownership. Although species richness has increased over the past two decades, total abundance and abundance of several key species (such as Acer saccharum Marsh. and Quercus rubra L.) have declined, while subcanopy species (e.g., Amelanchier species Medik.) have proliferated, suggesting potential shifts in stand dynamics including future composition and ecosystem services. Our results suggest that harvest may be a viable tool to promote a wider range of regenerating tree species via increasing understory light availability. Declining regeneration of key ecological species at a regional scale confirms managers’ concerns of insufficient regeneration and highlights the potential for future forest compositional change.
1. Introduction
Tree species composition and diversity contribute to forest resilience in the face of myriad stressors, including invasive pests and pathogens, changing management paradigms, and altered disturbance regimes fomented by climate [1,2]. While canopy trees play a major role in determining current forest resilience, future resilience depends, in part, on the composition of the regeneration layer via its impact on subsequent canopy recruitment. Regeneration dynamics in tandem with changing disturbance regimes are likely to play a key role in shaping future stand dynamics for many forests [3]. Changes in regeneration, therefore, may portend canopy changes to come. Indeed, canopy tree composition shifts have already been detected at broad scales in the western US [4]. In recent decades, availability of the USDA Forest Service Forest Inventory and Analysis dataset (FIA) has enabled regional to national analyses of patterns and drivers of tree regeneration, many indicating shifting species composition and declining abundance [5,6,7,8], greatly enhancing the feasibility of assessment at broader scales. Understanding landscape-level patterns and drivers of tree regeneration density and diversity can increase the efficacy of management in guiding forests to adapt to future conditions and maintain ecosystem health and function.
Although continental tree species richness is determined by a combination of evolutionary history and climate [9,10], with diversity generally decreasing with latitude [11,12], regional analyses generally yield insights more applicable to management or conservation objectives. For example, local climate demonstrably influences forest regeneration demographics [9,10,13] and can yield effects opposite of continental patterns (e.g., negative or bimodal associations between diversity and temperature [14,15]). Drivers also vary widely in their effects across regions, which could be obscured by analyses at inappropriate scales; for example, patterns of wildfire in the United States are diverging, with increasing mesophication in the eastern US [16] vs. increasing intensity of wildfire in the west [17]. Therefore, regional analyses yield key insight to dominant drivers of forest regeneration, thus informing potential adaptive forest management strategies at an appropriate scale.
Issues of changing regeneration compositions and densities are particularly poignant in the Northwoods (Laurentian Mixed Forest Province 212 [18]), a densely forested region covering northern Michigan, Wisconsin, and Minnesota with significant cultural, economic, and ecological value. Spanning the temperate to boreal transition zone, many forests are currently maturing after new forests established following widespread exploitive logging from the 1850s–1920s [19,20]. The region has faced significant regeneration challenges in recent decades, with concerning low densities of many canopy-dominant species (such as A. saccharum Marsh. [21,22], Thuja occidentalis L. [23], Quercus spp. L. [24], and Tsuga canadensis (L.) Carrière [25,26]). Recent reports of low density and shifting composition of tree regeneration in this region [7,27] may therefore portend challenges to future forest resilience. Understanding how key regional factors, including site quality, land-use change, and biotic stressors, drive forest regeneration composition and diversity has important implications for regional forest management and conservation.
Local and regional patterns of soil nutrients and water in the Northwoods strongly impact forest communities and therefore tree regeneration patterns [28,29]. For lowland forests in the Northwoods, diversity and abundance of regeneration are affected by several soil hydrology parameters, including period of inundation and water sources [29]. For upland forests in the Northwoods, post-glacial landforms drive a broad range of nutrient and water availability, driven by differences in soil texture, which drives forest community distribution; as water and nutrient availability increase, forests generally shift from Pinus to Quercus to A. saccharum dominated forest types [29]. Tree density and richness are generally highest at intermediate water and nutrient availability and lowest at the extremes; dense canopies with deeply shaded understories limit poor light-competing species on nutrient-rich/mesic sites [15,30,31], while drought-prone soils limit species to only the most drought tolerant on nutrient-poor/xeric sites [32]. Characterizing the fundamental influence of soil on sites is critical to understand patterns of tree regeneration in the Northwoods.
Against the backdrop of abiotic growing conditions, land use change over the past two centuries has drastically influenced disturbance regimes in the Northwoods with ongoing effects. Prior to European colonization, fire played an important disturbance role in all but the most wet-mesic forests [33]. Following colonization, catastrophic, intense fires became widespread due to high slash fuels loads from exploitive harvesting and land clearing in the late 19th century, which led to successful fire suppression policies in the 1920s [19]. The exploitive harvests were replaced by silvicultural management characterized by varying harvest intensities, tailored to specific goals and forest types. However, the overall shift towards less intense, partial harvesting has produced greater forest homogeneity, species changes, and an increasing preponderance of later successional forests and possibly lower diversity [20,34,35]. However, studies indicate that tree regeneration richness and diversity may increase in the short- to medium-term (e.g., <20 years) following harvest [36,37].
Also driven by land-use change and human development are drastic shifts in biotic stressors. Restrictive hunting laws and creation of high-quality habitat have drastically increased ungulate populations world-wide over recent decades. Extreme herbivory pressure has suppressed regeneration density and shifted regeneration species composition [38,39,40]; however, impacts of high herbivory pressure from white tailed deer (Odocoileus virginiana Zimm.) on regeneration diversity in the Northwoods are incompletely understood [21,41,42]. Simultaneously, non-native invasive pests and pathogens have decreased regional canopy-viable species pools. In the Northwoods, pests and pathogens include beech bark disease, hemlock wooly adelgid, emerald ash borer, Dutch elm disease, and oak wilt [43]. While the near-term dynamics of catastrophic pest and pathogen outbreaks may include proliferation of the affected species the understory, in the longer term, species representation and overall diversity likely decrease in both the canopy and the understory [43].
Understanding the convergence of these drivers on regeneration dynamics, which few studies have done at a regional scale, can yield valuable insights to inform forest management and conservation in the Northwoods. In particular, although the ecological theories underpinning these relationships are well understood, a better understanding of the relative importance of these drivers in shaping regeneration outcomes can inform landscape-level management and planning for the Northwoods. Using the USDA Forest Service Forest Inventory and Analysis (FIA) data, we analyze plot-level spatial and temporal patterns, along with associated drivers, of tree regeneration species richness (referred to as richness for brevity) and abundance (or density) for key forest groups in the Northwoods forests of Wisconsin, Minnesota, and Michigan. Forest type groups are a proxy for the underlying soil qualities, including nutrient and water availability and drainage, which drive the localized potential species pool. By analyzing patterns among forest type groups, we can assess how drivers interact with fundamental growing conditions to impact tree regeneration. Specifically, we hypothesize:
H1.
Tree regeneration richness and abundance will associate positively with temperature, precipitation, canopy diversity, and recent harvests; negatively with deer use; and will be highest on sites of intermediate quality.
H2.
Regeneration richness and abundance will be highest on forest type groups of intermediate soil and nutrient availability.
H3.
Over the 20-year analysis period, regeneration compositional shifts and declines in total abundance and richness will be consistent with recent, multi-decadal effects of elevated deer populations, invasive pests and pathogens, fire suppression, and management history.
2. Materials and Methods
2.1. Study Region
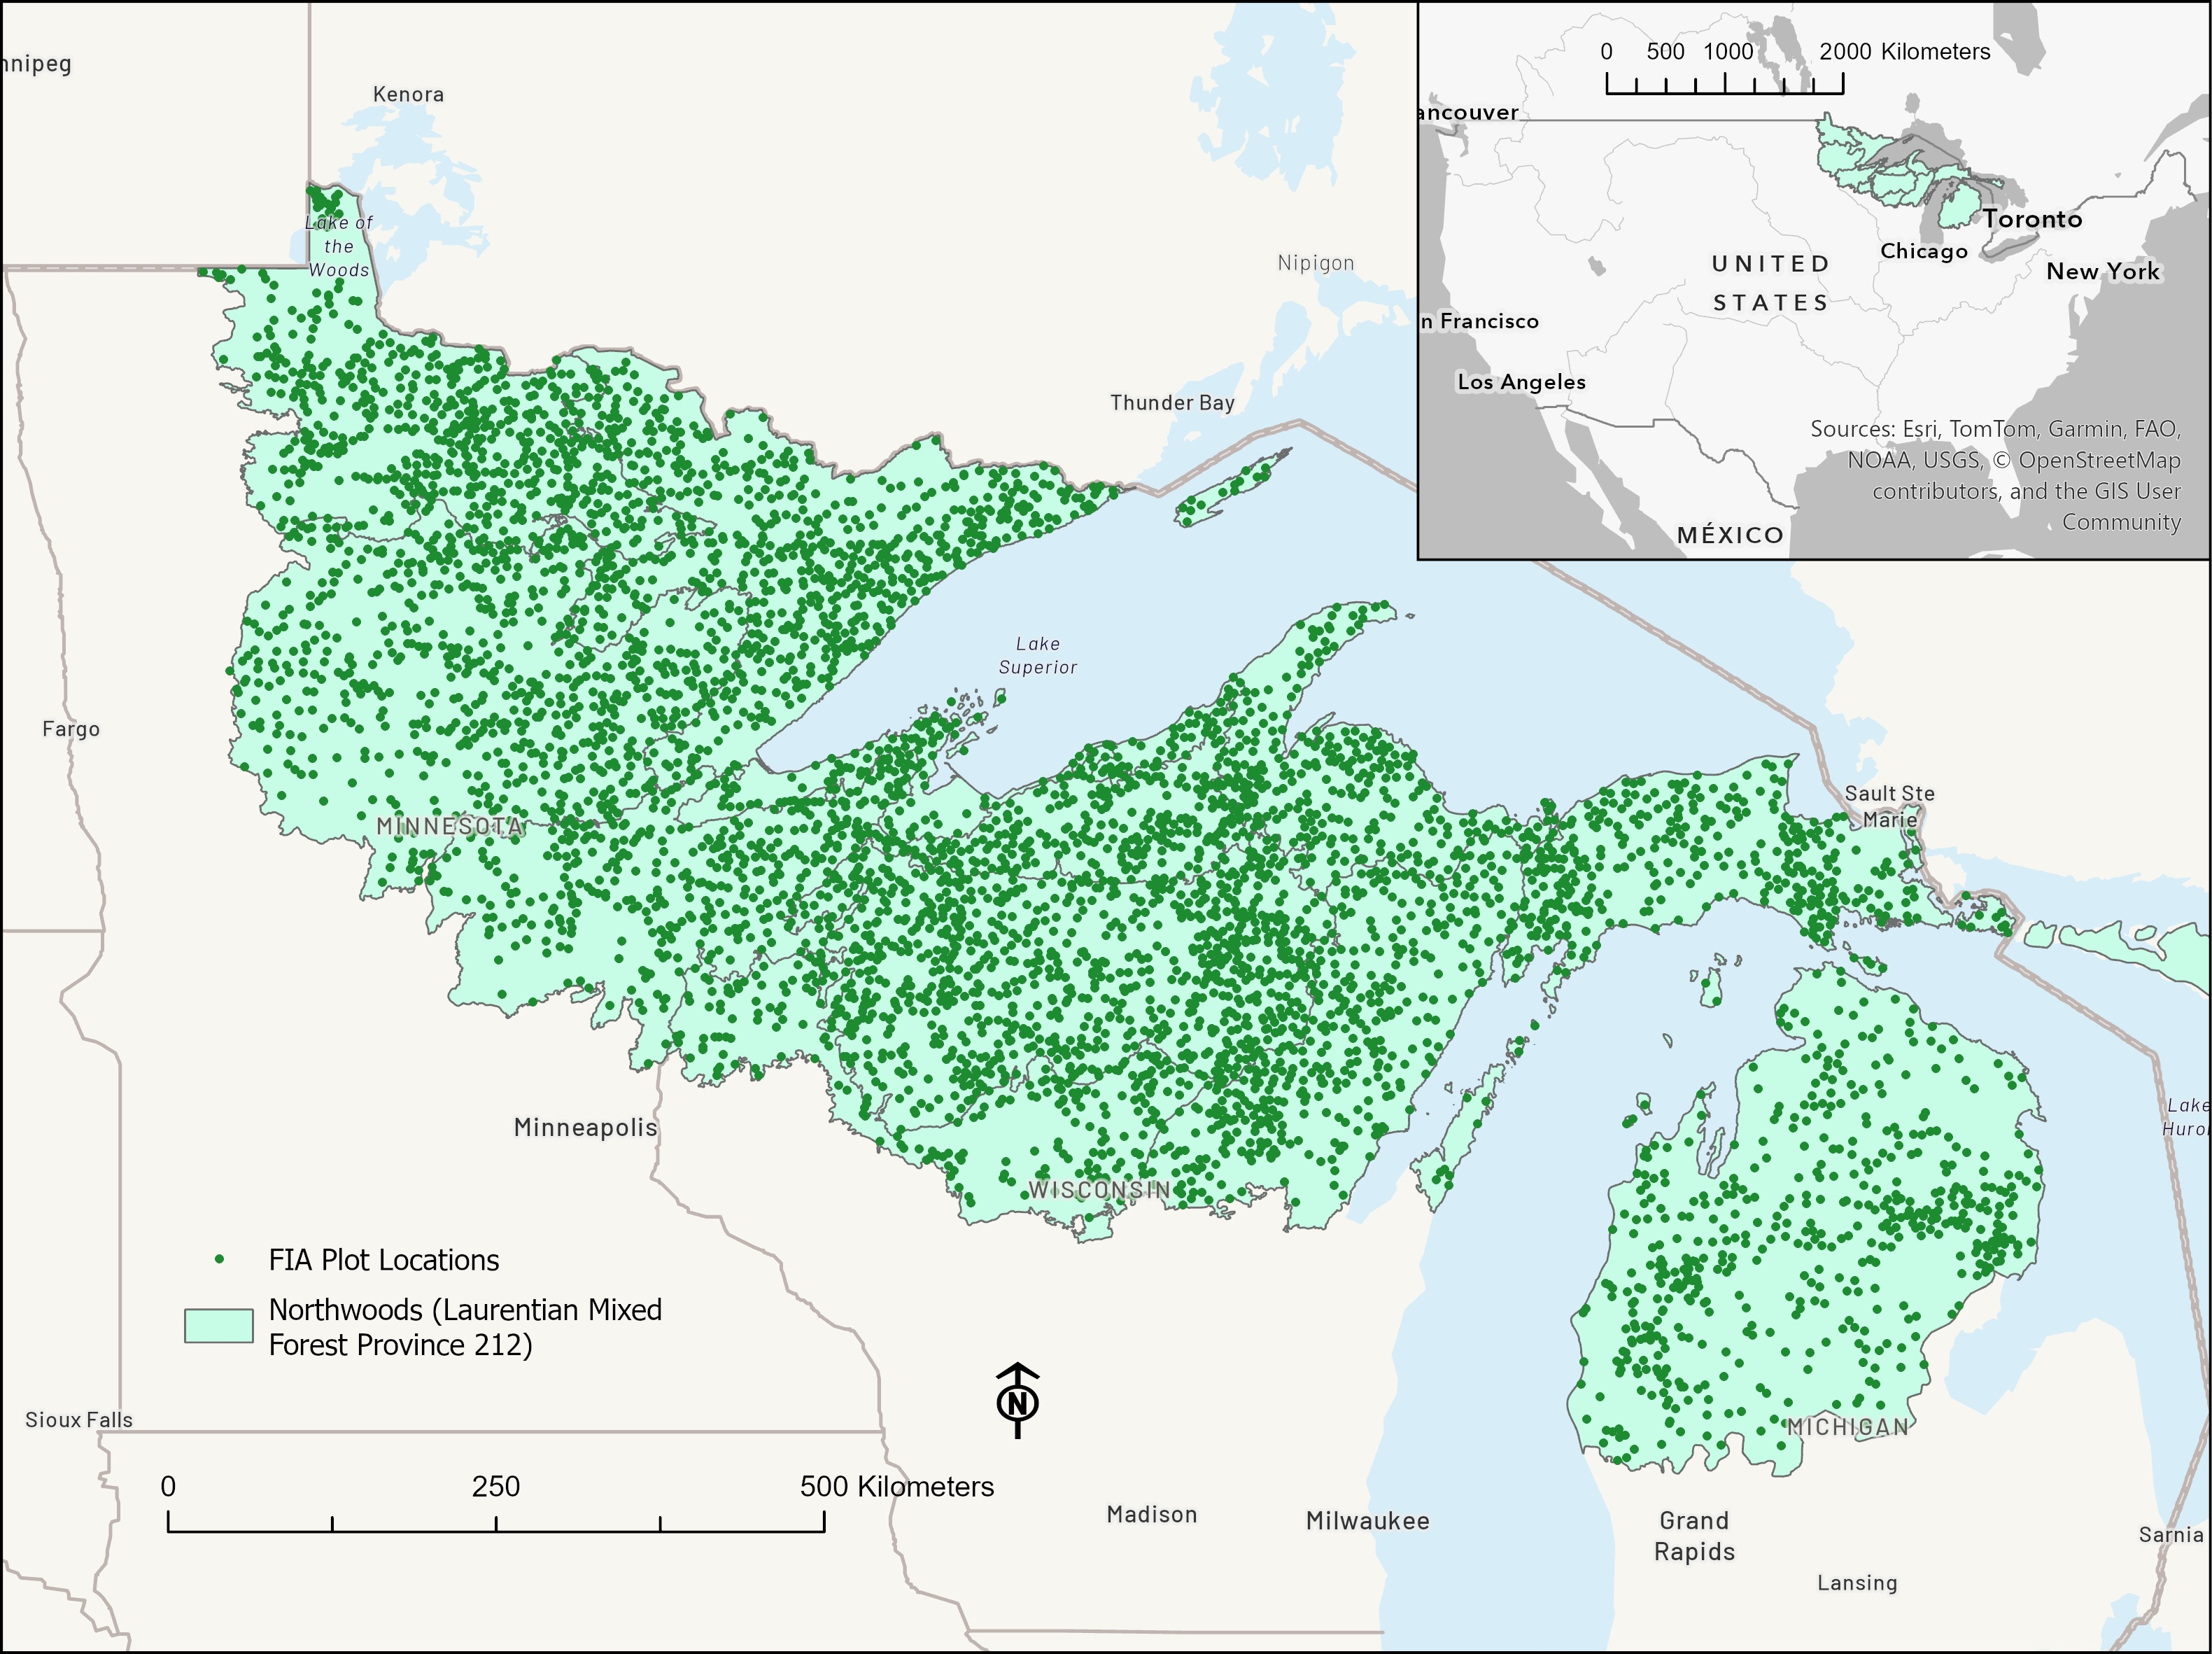
The Northwoods, also known as the Laurentian Mixed Forest Province 212, are a densely forested region in northern Michigan, Wisconsin, and Minnesota (Figure 1). Entirely glaciated during the Pleistocene, the Northwoods contains lakes, morainic hills, drumlins, eskers, and outwash plains, with some areas of elevated bedrock ridges and “mountains”. This region is mostly of low relief with rolling hills, ranging in elevation from 176 to 730 m. Common upland forest types include northern hardwoods dominated by maple (Acer spp. L.), aspen/birch (Populus spp. L./Betula spp. L.), spruce/fir (Picea spp. Dietr./Abies spp. Mill.), and pines (red, white, jack) (Pinus resinosa Aiton, Pinus strobus L., and Pinus banksiana Lamb.), and lowland forests dominated by conifer (northern white cedar (Thuja occidentalis L.), black spruce (Picea mariana Mill.), and/or tamarack (Larix laricina Du Roi)) and hardwood (elm (Ulmus spp. L.), ash (Fraxinus spp. L.), and/or cottonwood (Populus deltoides W. Bartram ex Marshall)) (https://research.fs.usda.gov/programs/fia (accessed on 27 April 2022)).
Figure 1.
Map of the study region and FIA plot locations (fuzzed).
2.2. Forest Inventory Data
USDA Forest Service FIA plots are spatially stratified with one plot randomly placed plot per ~2400 hectares, covering an area of 0.406 ha. In the eastern region, each plot is resurveyed every ~5 years following a standardized protocol implemented annually since ~2000. Each plot contains different sized sub-plots for different tree size classes. For this analysis, we use regeneration to refer to stems > 30.48 cm (hardwood species) or >15.24 cm (coniferous species) tall and <2.54 cm diameter at 1.37 m tall (all species), measured in four 2.1 m radius circular sub-plots (54 m2 total per plot) [44].
2.3. Modeling Tree Regeneration Abundance and Species Richness
All analyses were conducted using R (version 4.2.2). We used rFIA to extract FIA data [45]. Using the most recently completed FIA inventory (2012–2019) for all plots in the Northwoods, we filtered data to retain plots that were 100% forested by a single forest type for the three most recent inventories to ensure uniform knowledge of recent (<10 years) harvesting history. Of the plots meeting those conditions, we analyzed the six most common forest groups (n = 5186). While we considered analyzing patterns at the forest type level, preliminary analysis indicated forest types of the same group behaved similarly, and many forest types had low sample sizes (Table 1). We often included forest type as a predictor within forest group models. Information on FIA tree species present in the plots can be found in Appendix A.
Table 1.
Summary information, by forest type and group, of FIA plot count (n), plots harvested (n harv), mean plot-level abundance (abun) and species richness (SR), and total species richness (across all plots).
We calculated per-plot tree species richness and abundance; the latter we modeled as a count (per plot) and discuss as density (stems ha−1).
2.3.1. Characterizing Spatial Trends
To characterize spatial patterns of plot-level richness and abundance, we calculated Moran’s I [46], assuming a flat x-y coordinate plane to estimate the inverse distance matrix. For visualization, we interpolated data points to a raster grid with resolution 900 km2; with study area of 254,269 km2, we have approximately 1 plot per 50 km2. We used the gstat function from the gstat package [47] in combination with the interpolate function from the raster package [48] to estimate plot-level average species richness and abundance per raster cell.
2.3.2. Assessing Current Patterns and Associated Drivers
We analyzed how tree regeneration richness and abundance vary across forest groups and how they vary with key drivers, including harvest, to shape richness and abundance within forest type groups. Across these models, we used the following framework. For all abundance models, we used a generalized linear modeling framework with a negative binomial distribution, implemented with the glm.nb function from the MASS package [49]. For all richness models, we aimed to characterize richness independent of sampling intensity (e.g., abundance). The relationship between diversity and abundance was non-linear (asymptotic); therefore, we used a generalized additive modeling framework with a Poisson distribution, implemented with the gam function from the mgcv package [50], and included abundance as a non-linear predictor, fit with a shrinkage version of cubic regression splines. Across all models unless otherwise stated, continuous predictors were mean centered and divided by two standard deviations to enable comparison of categorical and continuous predictors [51,52], and model assumptions were verified using the DHARMa package [53] and gam.check (mgcv package).
To characterize differences among forest groups, we modeled richness and abundance as a function of forest group (plus abundance for the richness model, which we mean-centered but did not otherwise standardize). We calculated estimated marginal means and pairwise contrasts using the emmeans function from the emmeans package [54].
To characterize the associations with drivers, we modeled richness and abundance for each forest type as a function of first- and second-order effects of climate (mean annual temperature and precipitation), soil characteristics (Drainage Index), and FIA-derived stand-specific parameters, including forest type, deer use, stand age, site index, canopy Shannon Index, basal area, recent harvest history, and ownership group (Table 2).
Table 2.
Current FIA tree regeneration abundance and richness and model predictors, based on FIA plots which are 100% forested, are single condition, have at least three inventories, and are in the six most common forest type groups. Models were conducted separately by forest group, but summarized here together for brevity; additional summaries available in Appendix B, Table A2.
For non-FIA predictor variables, we chose data with coarser resolution given uncertainty of exact FIA plot locations. We used 30-year climate normals for mean annual precipitation and temperature (4 km resolution; PRISM Climate Group, Oregon State University, https://prism.oregonstate.edu, data created November 2021, accessed 8 December 2021). To characterize soil, the Drainage Index (DI) reflects the long-term amount of water that soil supplies to plants under natural conditions and is determined primarily by a soil’s taxonomic subgroup classification [55]. We extracted the USDA Natural Resources Conservation Service (NRCS) Soil Survey Geographic Database (SSURGO; available online https://sdmdataaccess.sc.egov.usda.gov) map unit key (MUKEY) for each plot location using the SDA_spatialQuery function from the soilDB package [56]; we assigned 286 plots with missing data (due to SSURGO sampling limitations and issues from fuzzed plot locations) the closest measured MUKEY. We then matched each plot MUKEY with its DI.
For FIA-derived predictors, we aimed to select variables which capture understory growing conditions (e.g., basal area as a proxy for light availability, site index as an indicator of site quality, deer use as measure of herbivory, and stage as a measure of successional stage), local seed pool diversity (canopy Shannon Index), and potential management objectives (e.g., ownership group and history of recent harvest). The Shannon index is a common diversity metric which incorporates both species richness and evenness [57], making it a more suitable proxy for potential regeneration seed and sprouting diversity than canopy richness alone. FIA browse index (ordinal, 1–5) is a metric of the amount of ungulate browse pressure exerted on regeneration; white-tailed deer (Odocoileus virginianus Zimmerman) are the dominant browsing species in the region and we therefore refer to the browsing index as an index of deer use. Since the FIA browse index was only available for a subset of FIA plots (n = 364), we used inverse distance interpolation (gstat and interpolation functions) to model and extract browsing index for all plots (Appendix B, Figure A1). For ownership, we lumped all federally owned lands together (Forest Service and others). Uncommon (n < 15 plots) forest types were lumped together into a generic forest type group or combined with the most common forest type if still fewer than 10 plots. We additionally included stand origin (natural vs. planted) for pines; the sample size was insufficient for all other forest groups.
Bivariate plots and theoretical expectations indicated potential non-linear relationships between BA, precipitation, and/or temperature for most forest groups; we compared inclusion of a quadratic term for those predictors, dropping second-order terms which were not significant (p > 0.05) and did not decrease AIC. We generated a null model, including only an intercept (plus abundance for the richness model), for AIC comparison.
To further characterize how harvest characteristics influence current tree regeneration for the subset of plots with any recorded harvest (n = 1274), we modeled current species richness and density as a function of pre-harvest characteristics (tree regeneration species richness or density), harvest intensity (basal area removal), and timing, plus forest type (Table 3). Note: although we limited the harvest variable in the previous model to characterize whether a recent (~<10 years) harvest had occurred to ensure equal detection likelihood, this analysis also includes plots with earlier harvests recorded (>10 years ago). We used AIC to compare models against an intercept-only (plus abundance for richness) model. To address categorical sample size issues, we again lumped uncommon (<10 plots) forest types together, either into a lumped forest type group (if n > 10) or with the most common forest type.
Table 3.
Current FIA tree regeneration abundance and richness and model predictors, based on FIA plots which are 100% forested, are single condition, have at least three inventories, are in the six most common forest type groups, and have a recorded harvest. Models were conducted separately by forest group, but summarized here together for brevity; additional summaries available in Appendix B, Table A3.
2.3.3. Temporal Trends
We characterized temporal changes in species richness, abundance, and abundance of the ten most common species by forest group based on occurrences in most recent inventory. For our 5186 plots, we used all available annual inventories, but used forest group at the time of inventory; consequently, 713 out of 5186 plots (14%) were assigned to different forest groups over time (or inventories were excluded if a plot was assigned to a forest group omitted from our analysis). For individual species models, we only included plots which had at least one recorded occurrence in any size class in any inventory to avoid structural zeros. For all models, we standardized continuous predictors (mean centered and divided by one standard deviation).
Given our repeated measures dataset, all models were mixed effects models with random effects for slope and intercept by plot. Total abundance and individual species abundance were modeled as a function of time using glmmTMB [58] with a negative binomial distribution. Richness was modeled as a function of time and abundance (fit with a shrinkage version of cubic regression splines using the gamm4 package [51]) with a Poisson distribution. We again used the DHARMa package and gam.check to verify model assumptions.
3. Results
3.1. Spatial and Forest Group Variation in Tree Regeneration Abundance and Richness
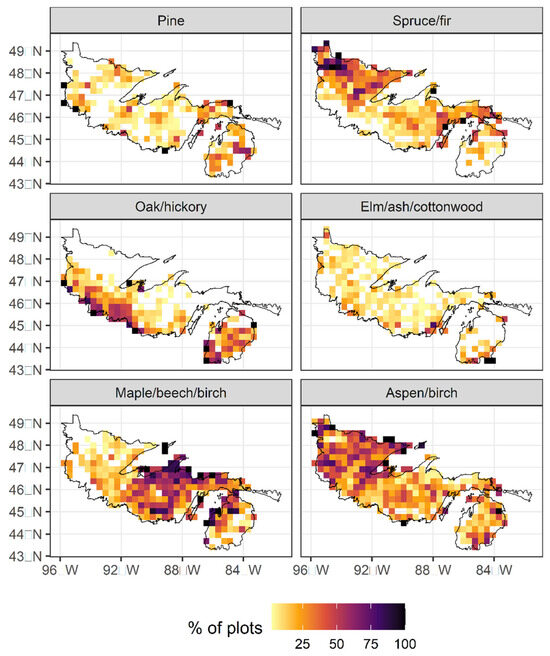
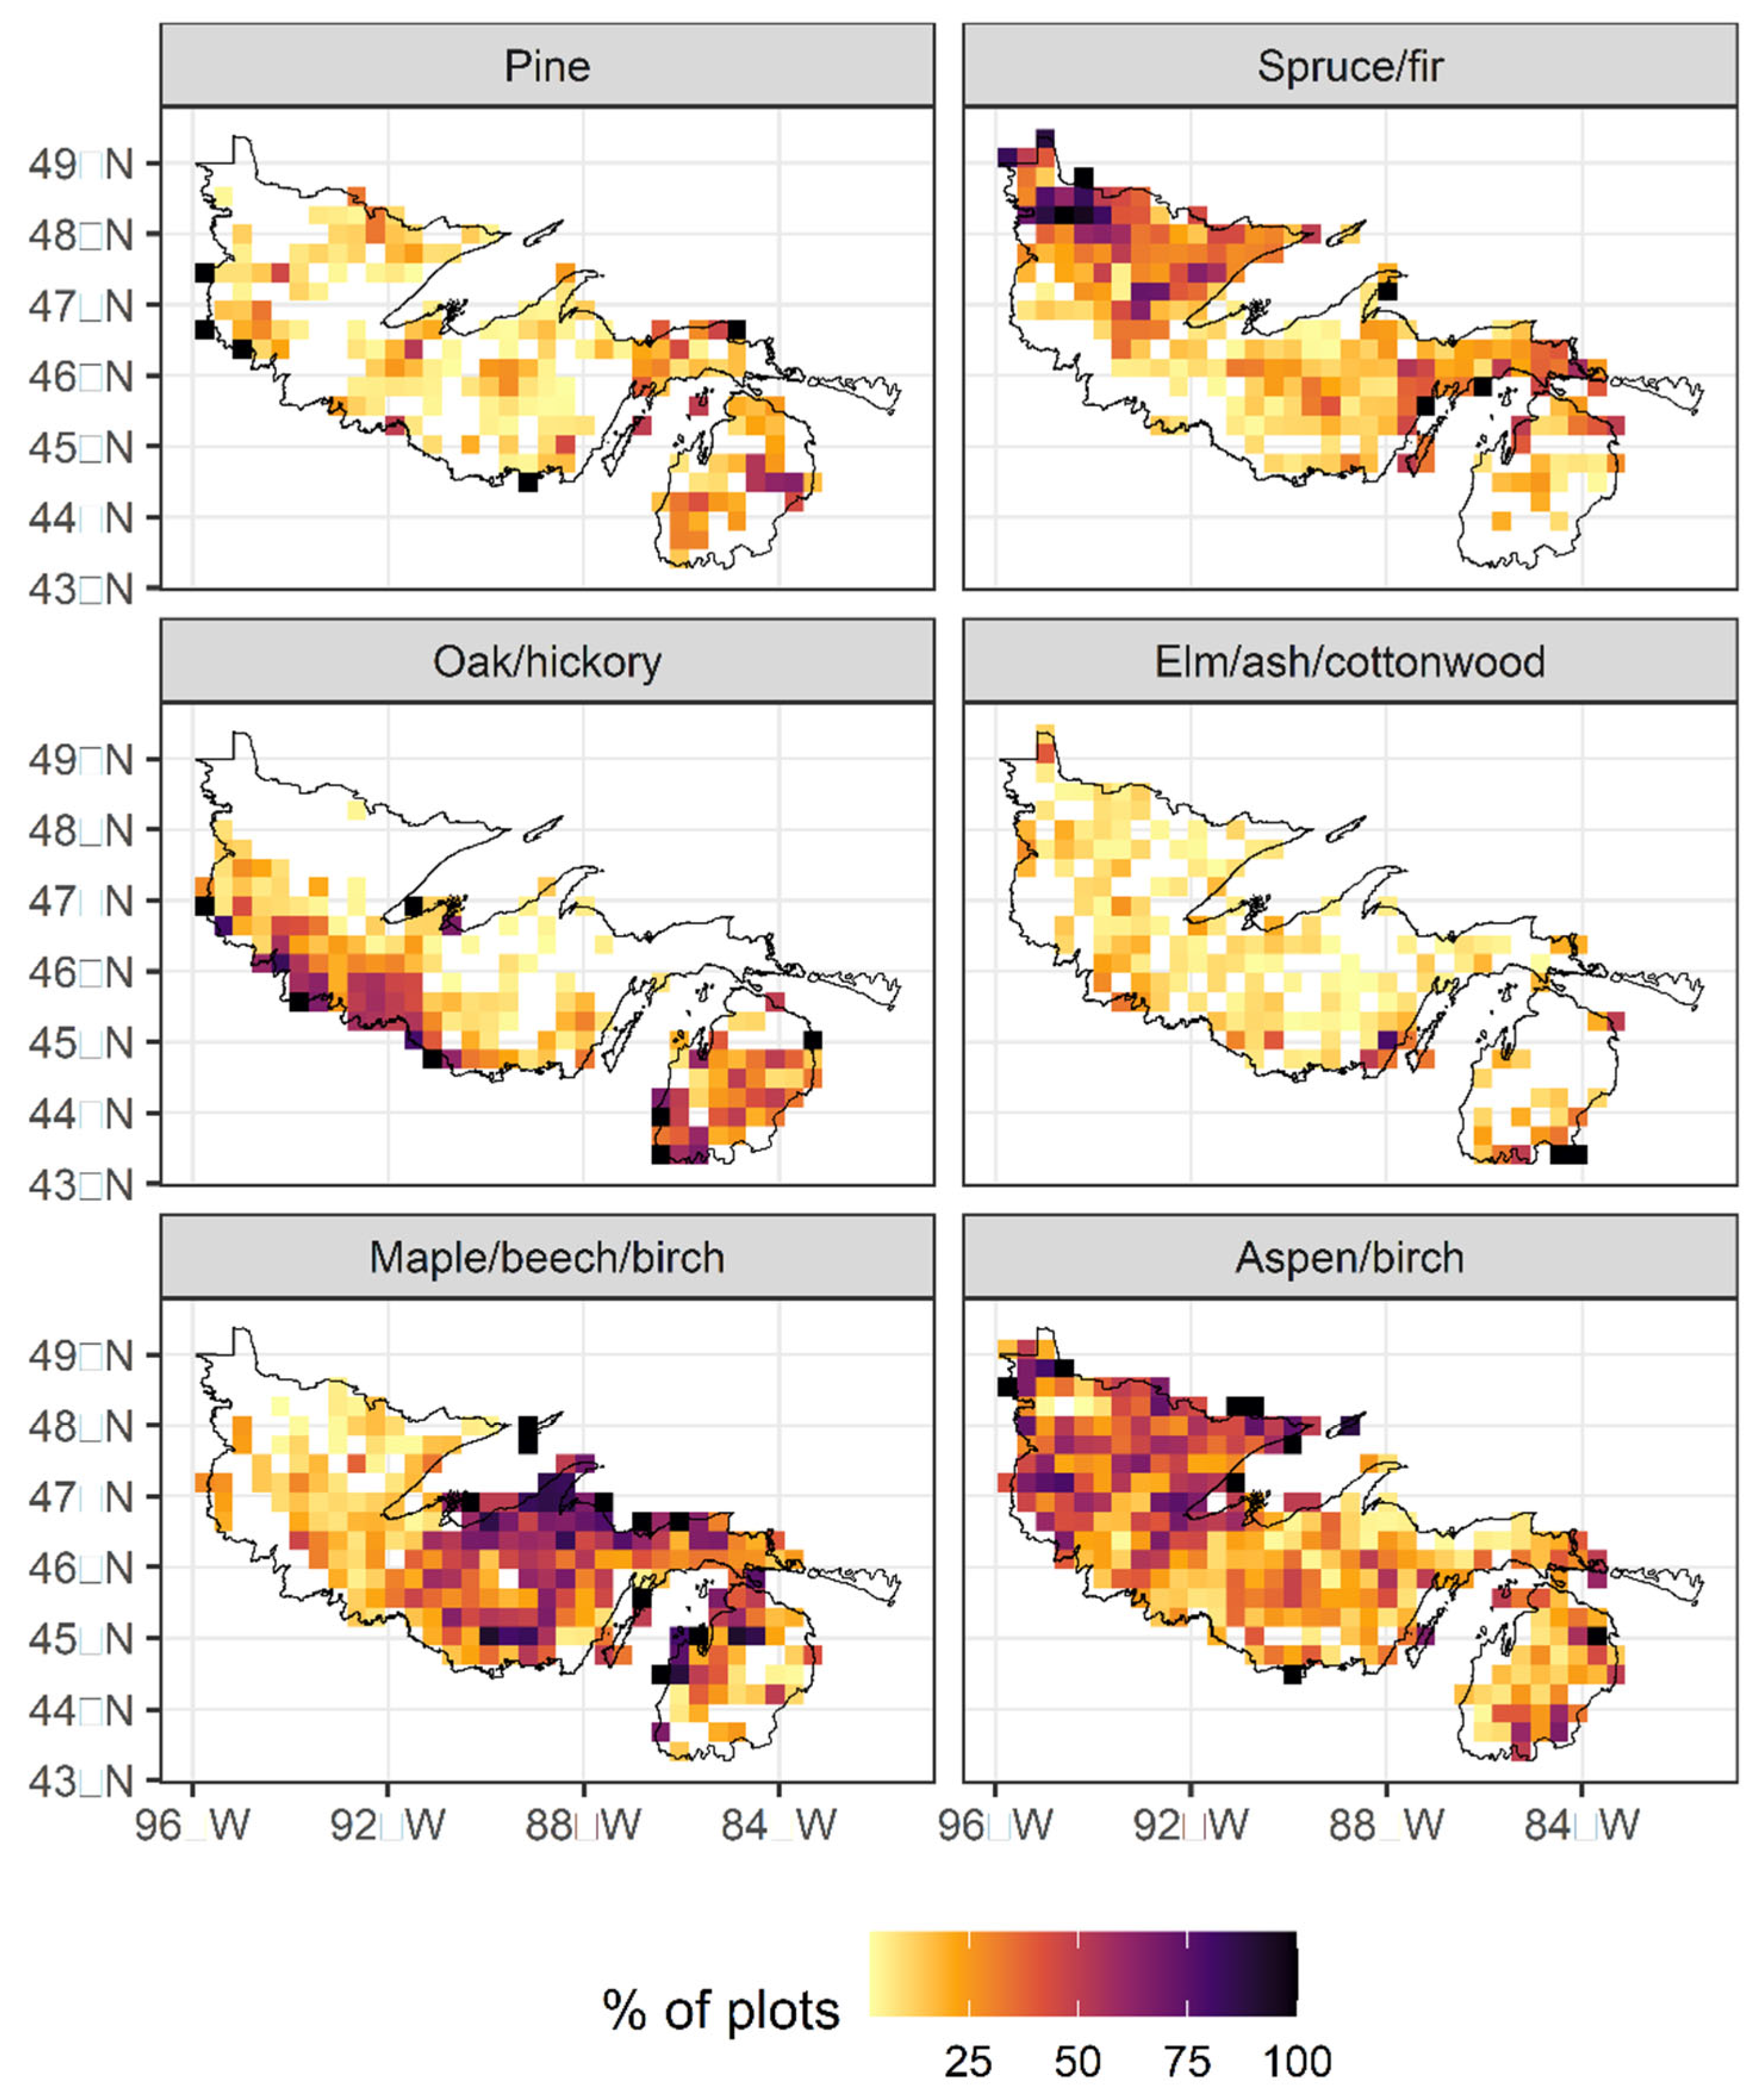
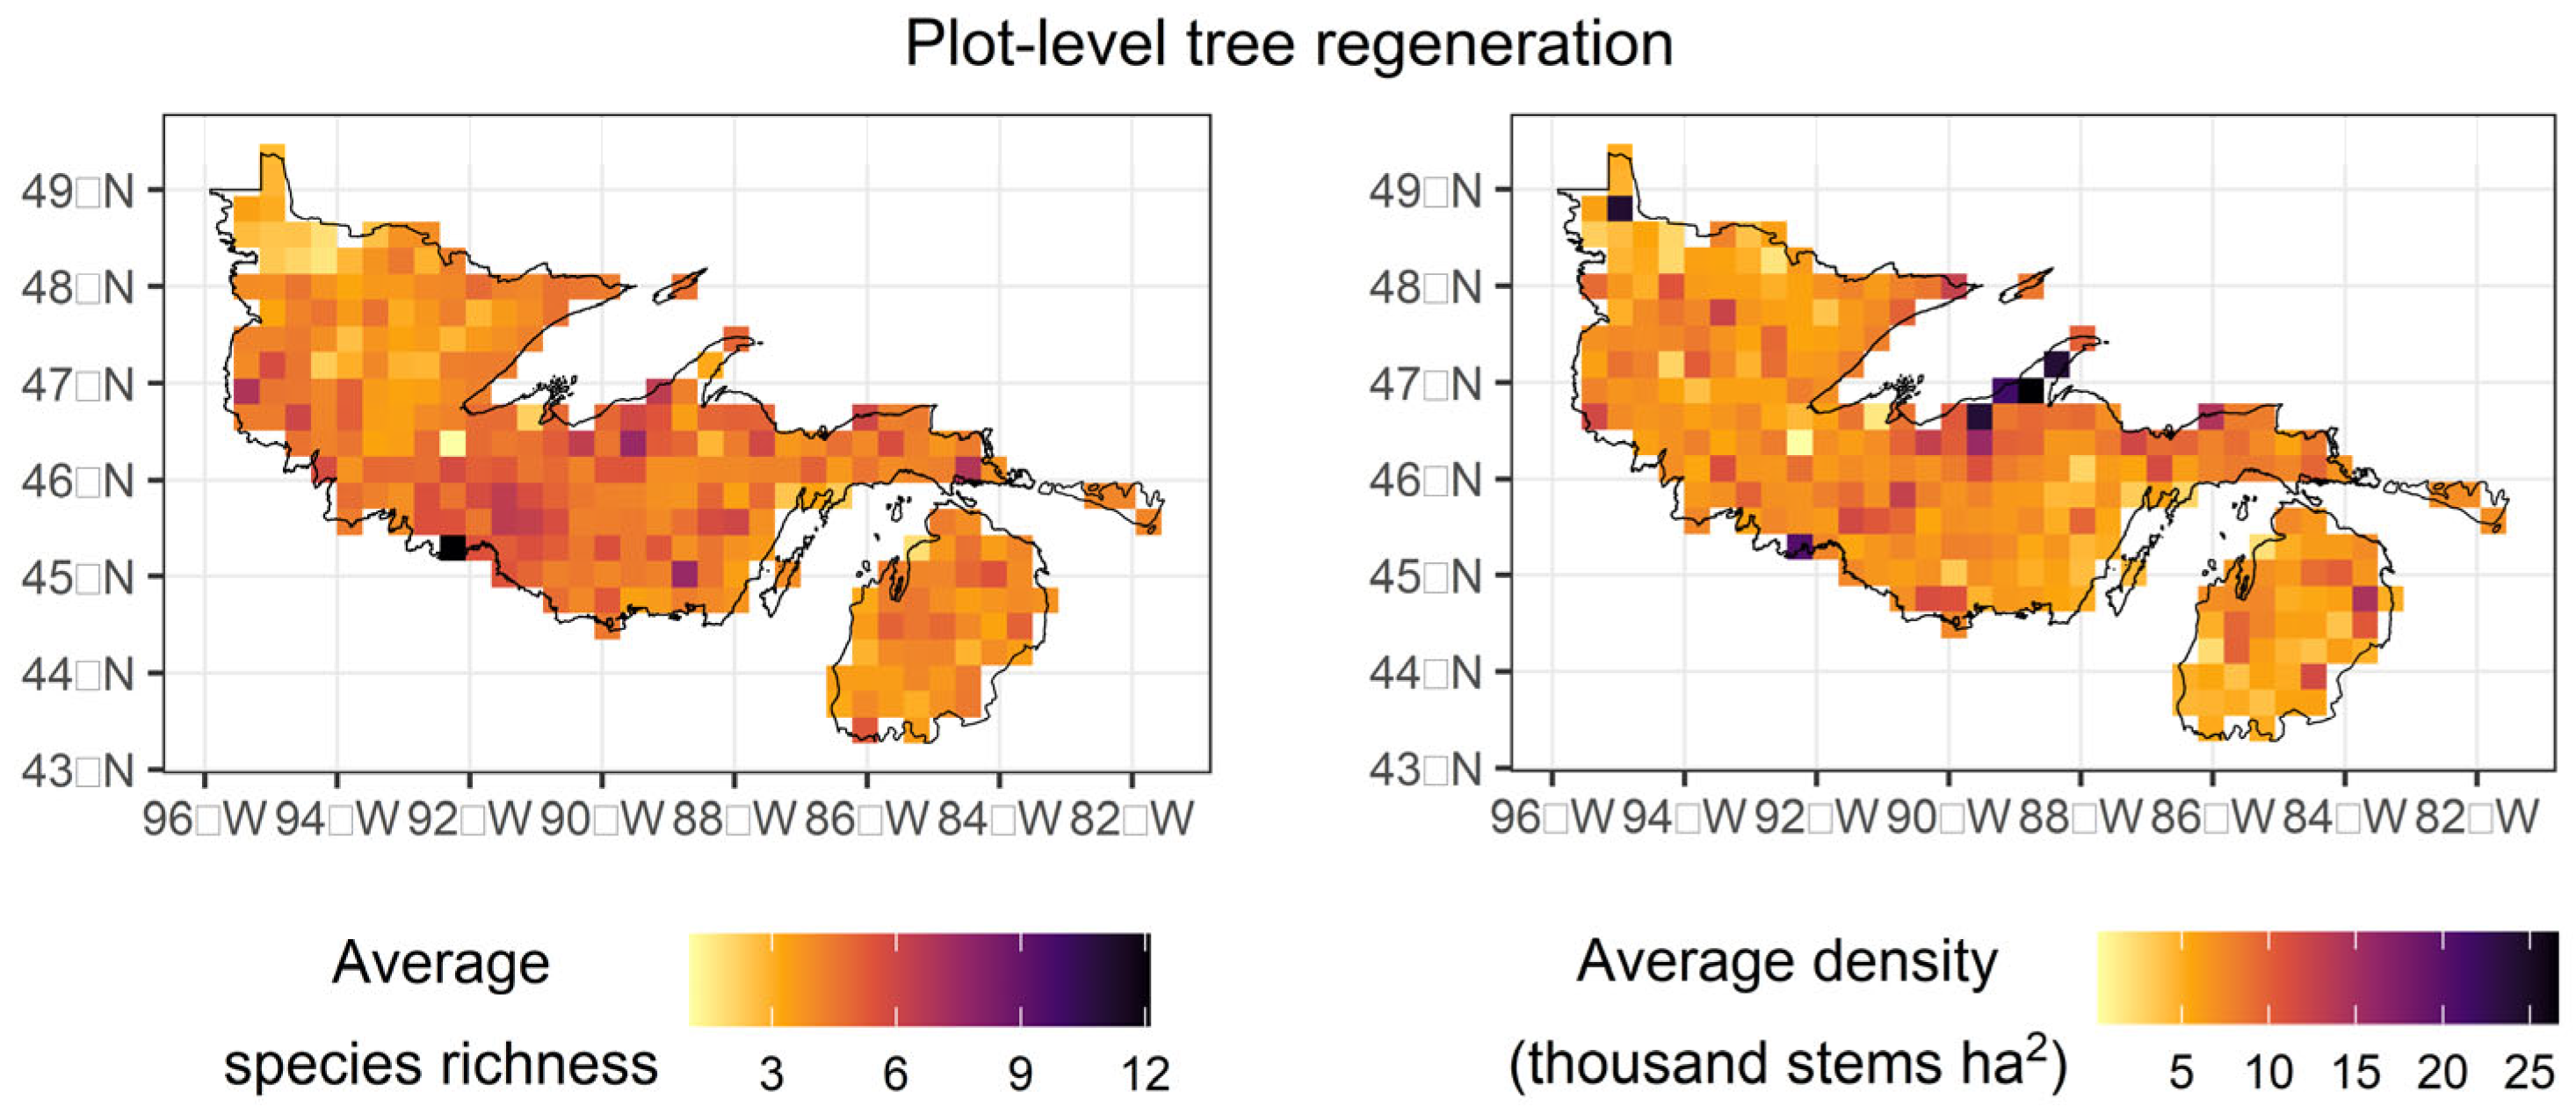
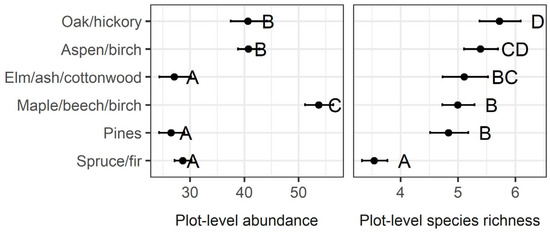
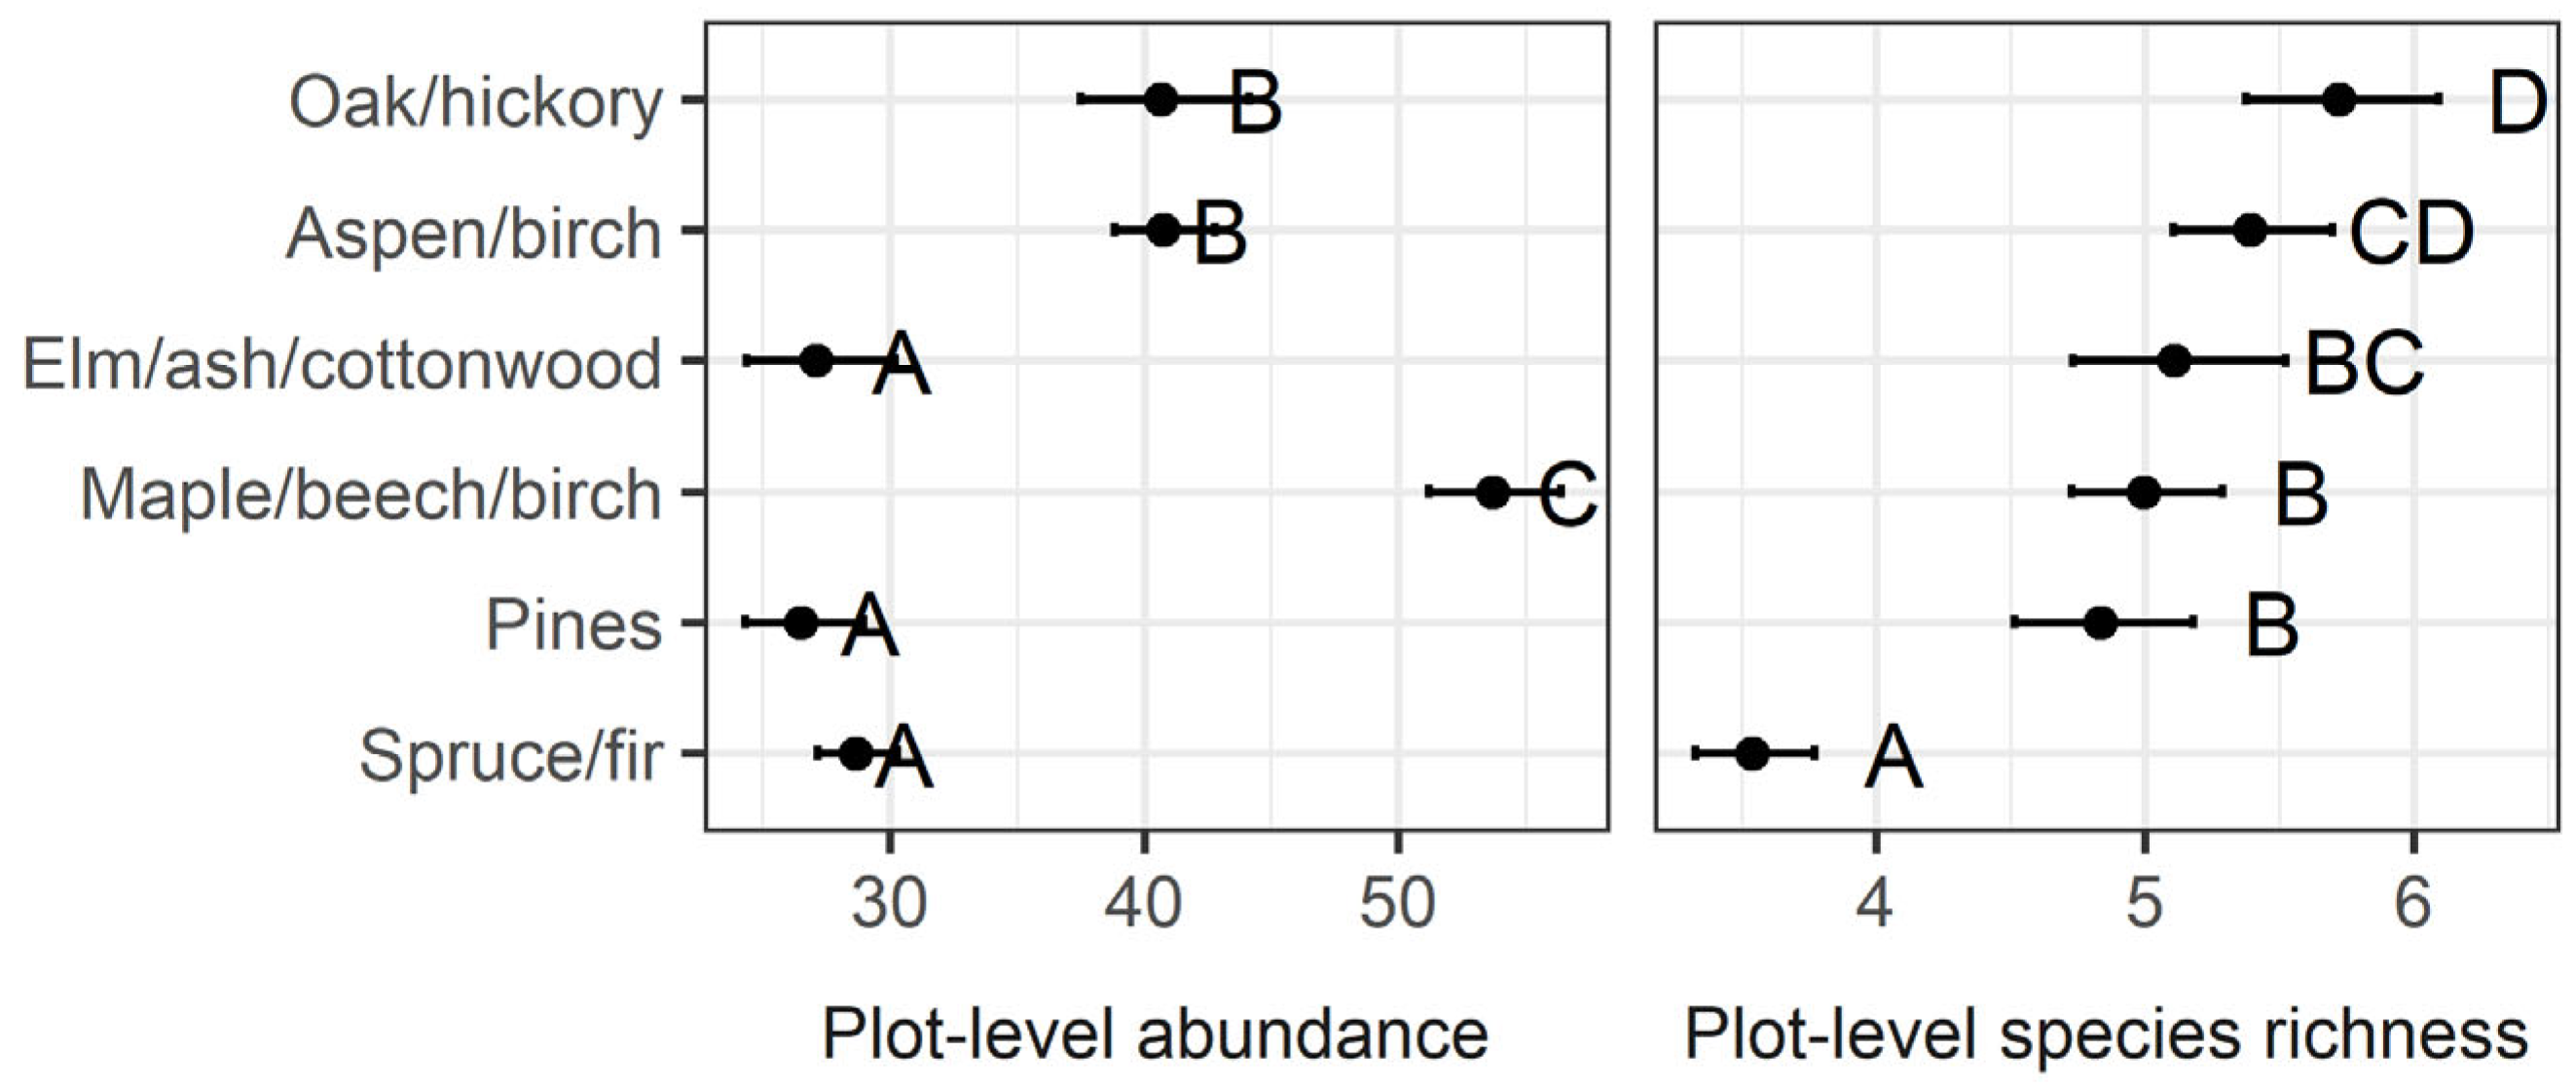
Of the 5186 plots in our analysis, aspen/birch and maple/beech/birch plots were most common (1424 and 1412, respectively), followed by spruce/fir (1117), oak/hickory (502), pines (441), and elm/ash/cottonwood (289). Forest group spatial distributions varied, with aspen/birch and spruce/fir more common in the north–west, oak/hickory in the south, and maple/beech/birch in the northern central (Figure 2). Across all six forest groups, tree regeneration stem abundance was modestly spatially autocorrelated (Moran’s I = 0.04, p-value < 0.0001), as was plot-level species richness (Moran’s I = 0.02, p-value < 0.0001); areas of higher abundance and richness are found in the western Upper Peninsula of Michigan and northern Wisconsin (Figure 3). Abundance and richness varied markedly among forest type groups (Figure 4). When keeping abundance constant, average plot-level species richness was generally highest in oak-hickory and aspen forests and lowest in spruce/fir forests. Maple/beech/birch forests had the highest abundance among the six most common forest groups, followed by oak/hickory and aspen, and then the three remaining forest type groups.
Figure 2.
Maps indicating the percentage of plots per raster cell which are categorized as each of the six forest groups.
Figure 3.
Interpolated (30 × 30 km resolution) average plot-level species richness and density for tree regeneration for 5186 FIA plots for our study area. Note: color scales vary by image.
Figure 4.
Marginal means of plot-level (54 m2) abundance (counts) and species richness, as predicted by forest group (plus abundance for the species richness model), sorted by rank order of plot species richness estimates; within each plot, groups with the same letter are not significantly different from one another (p > 0.05). Note: x axes vary by plot.
3.2. Determinants of Tree Regeneration Abundance and Richness
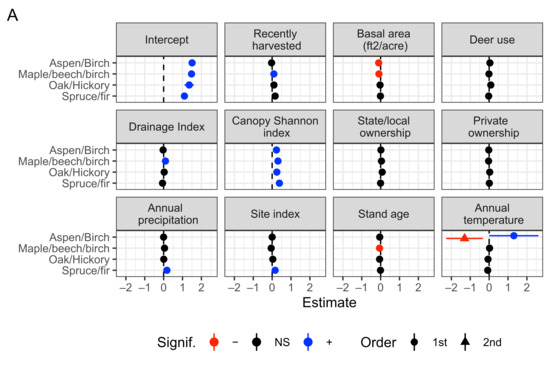
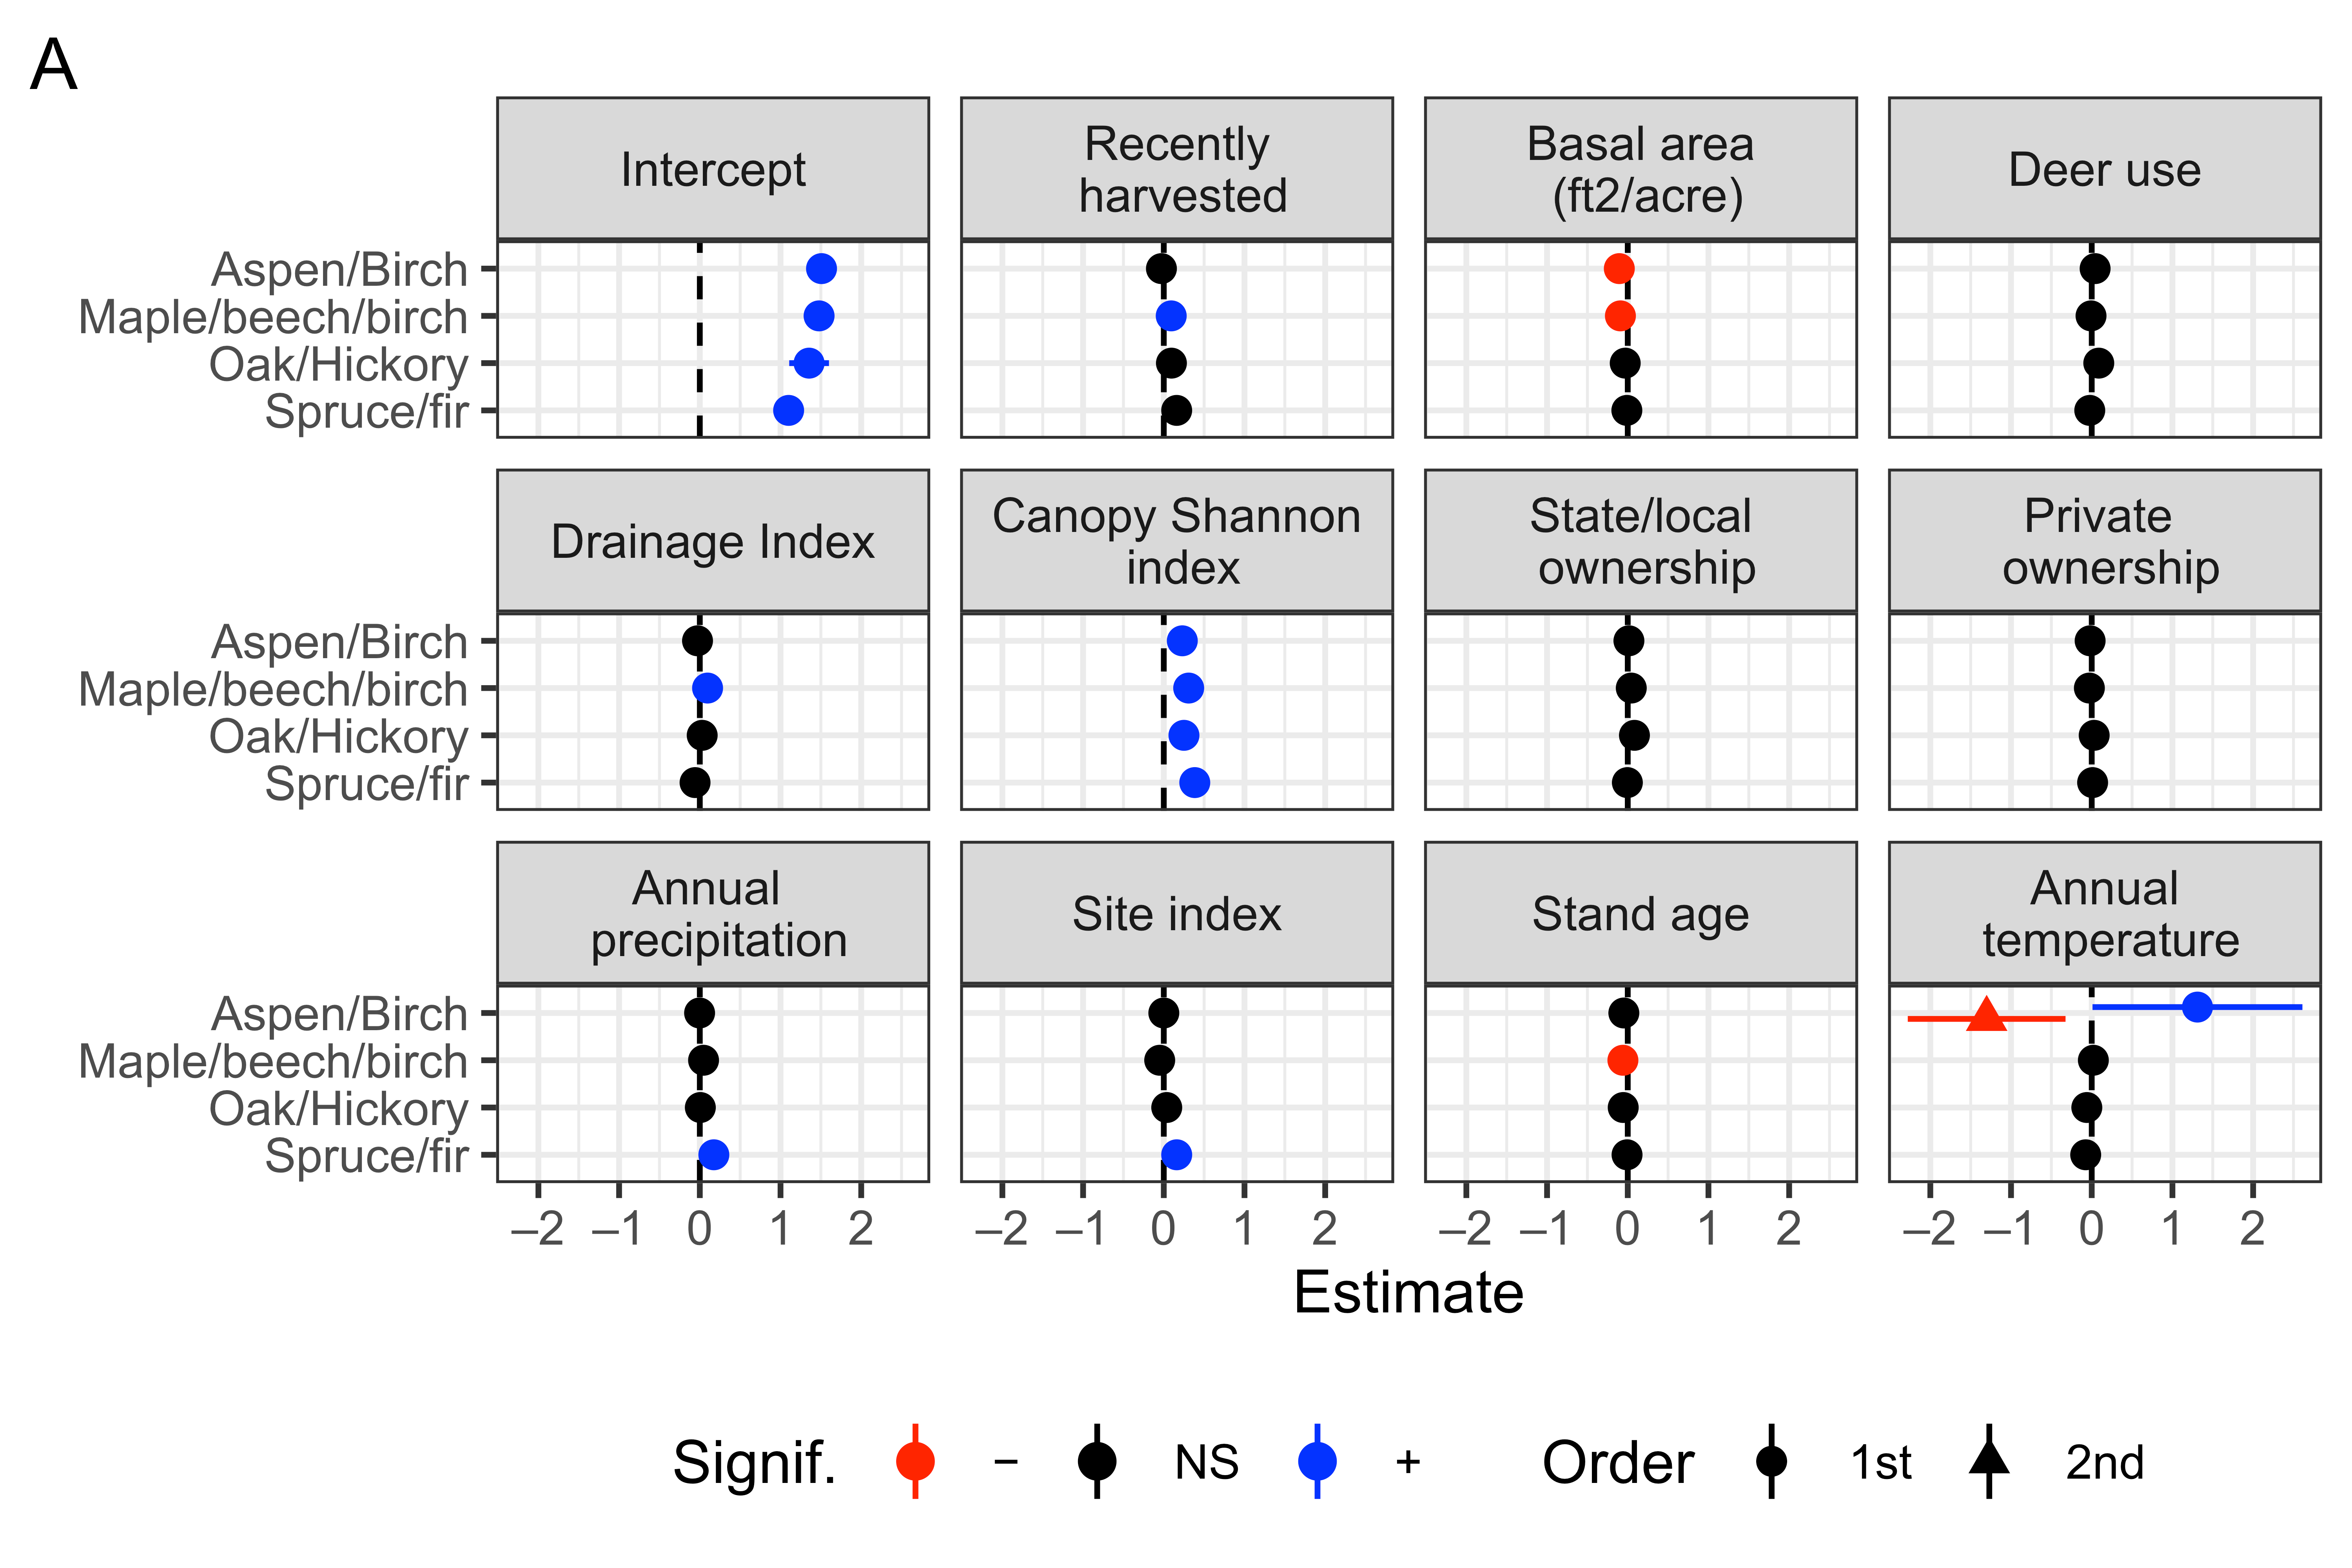
For richness, full models were selected by AIC comparison over the null models for the four most common forest type groups (Appendix B, Table A4). For those four, tree regeneration species richness associated positively with canopy Shannon index across all models (Figure 5A). Few other predictors were significant across multiple forest groups, including no significant associations for deer use and ownership. Maple/beech/birch tended to have higher regeneration species richness in recently harvested stands with lower basal area on sites that have greater long-term soil wetness (DI) and younger stand age. Aspen/birch regeneration richness was higher on stands with lower basal area with intermediate annual temperature, and spruce/fir stands had higher richness on more productive sites (higher site index). Regeneration richness in pines and elm/ash/cottonwood (the two least common forest groups) were best predicted by the null model (Appendix B, Table A4).
Figure 5.
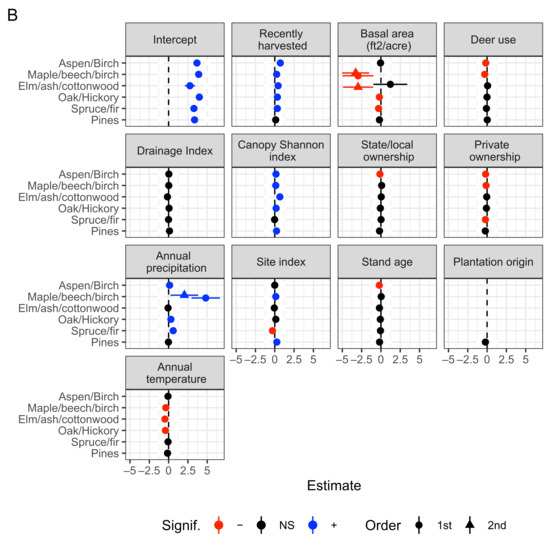
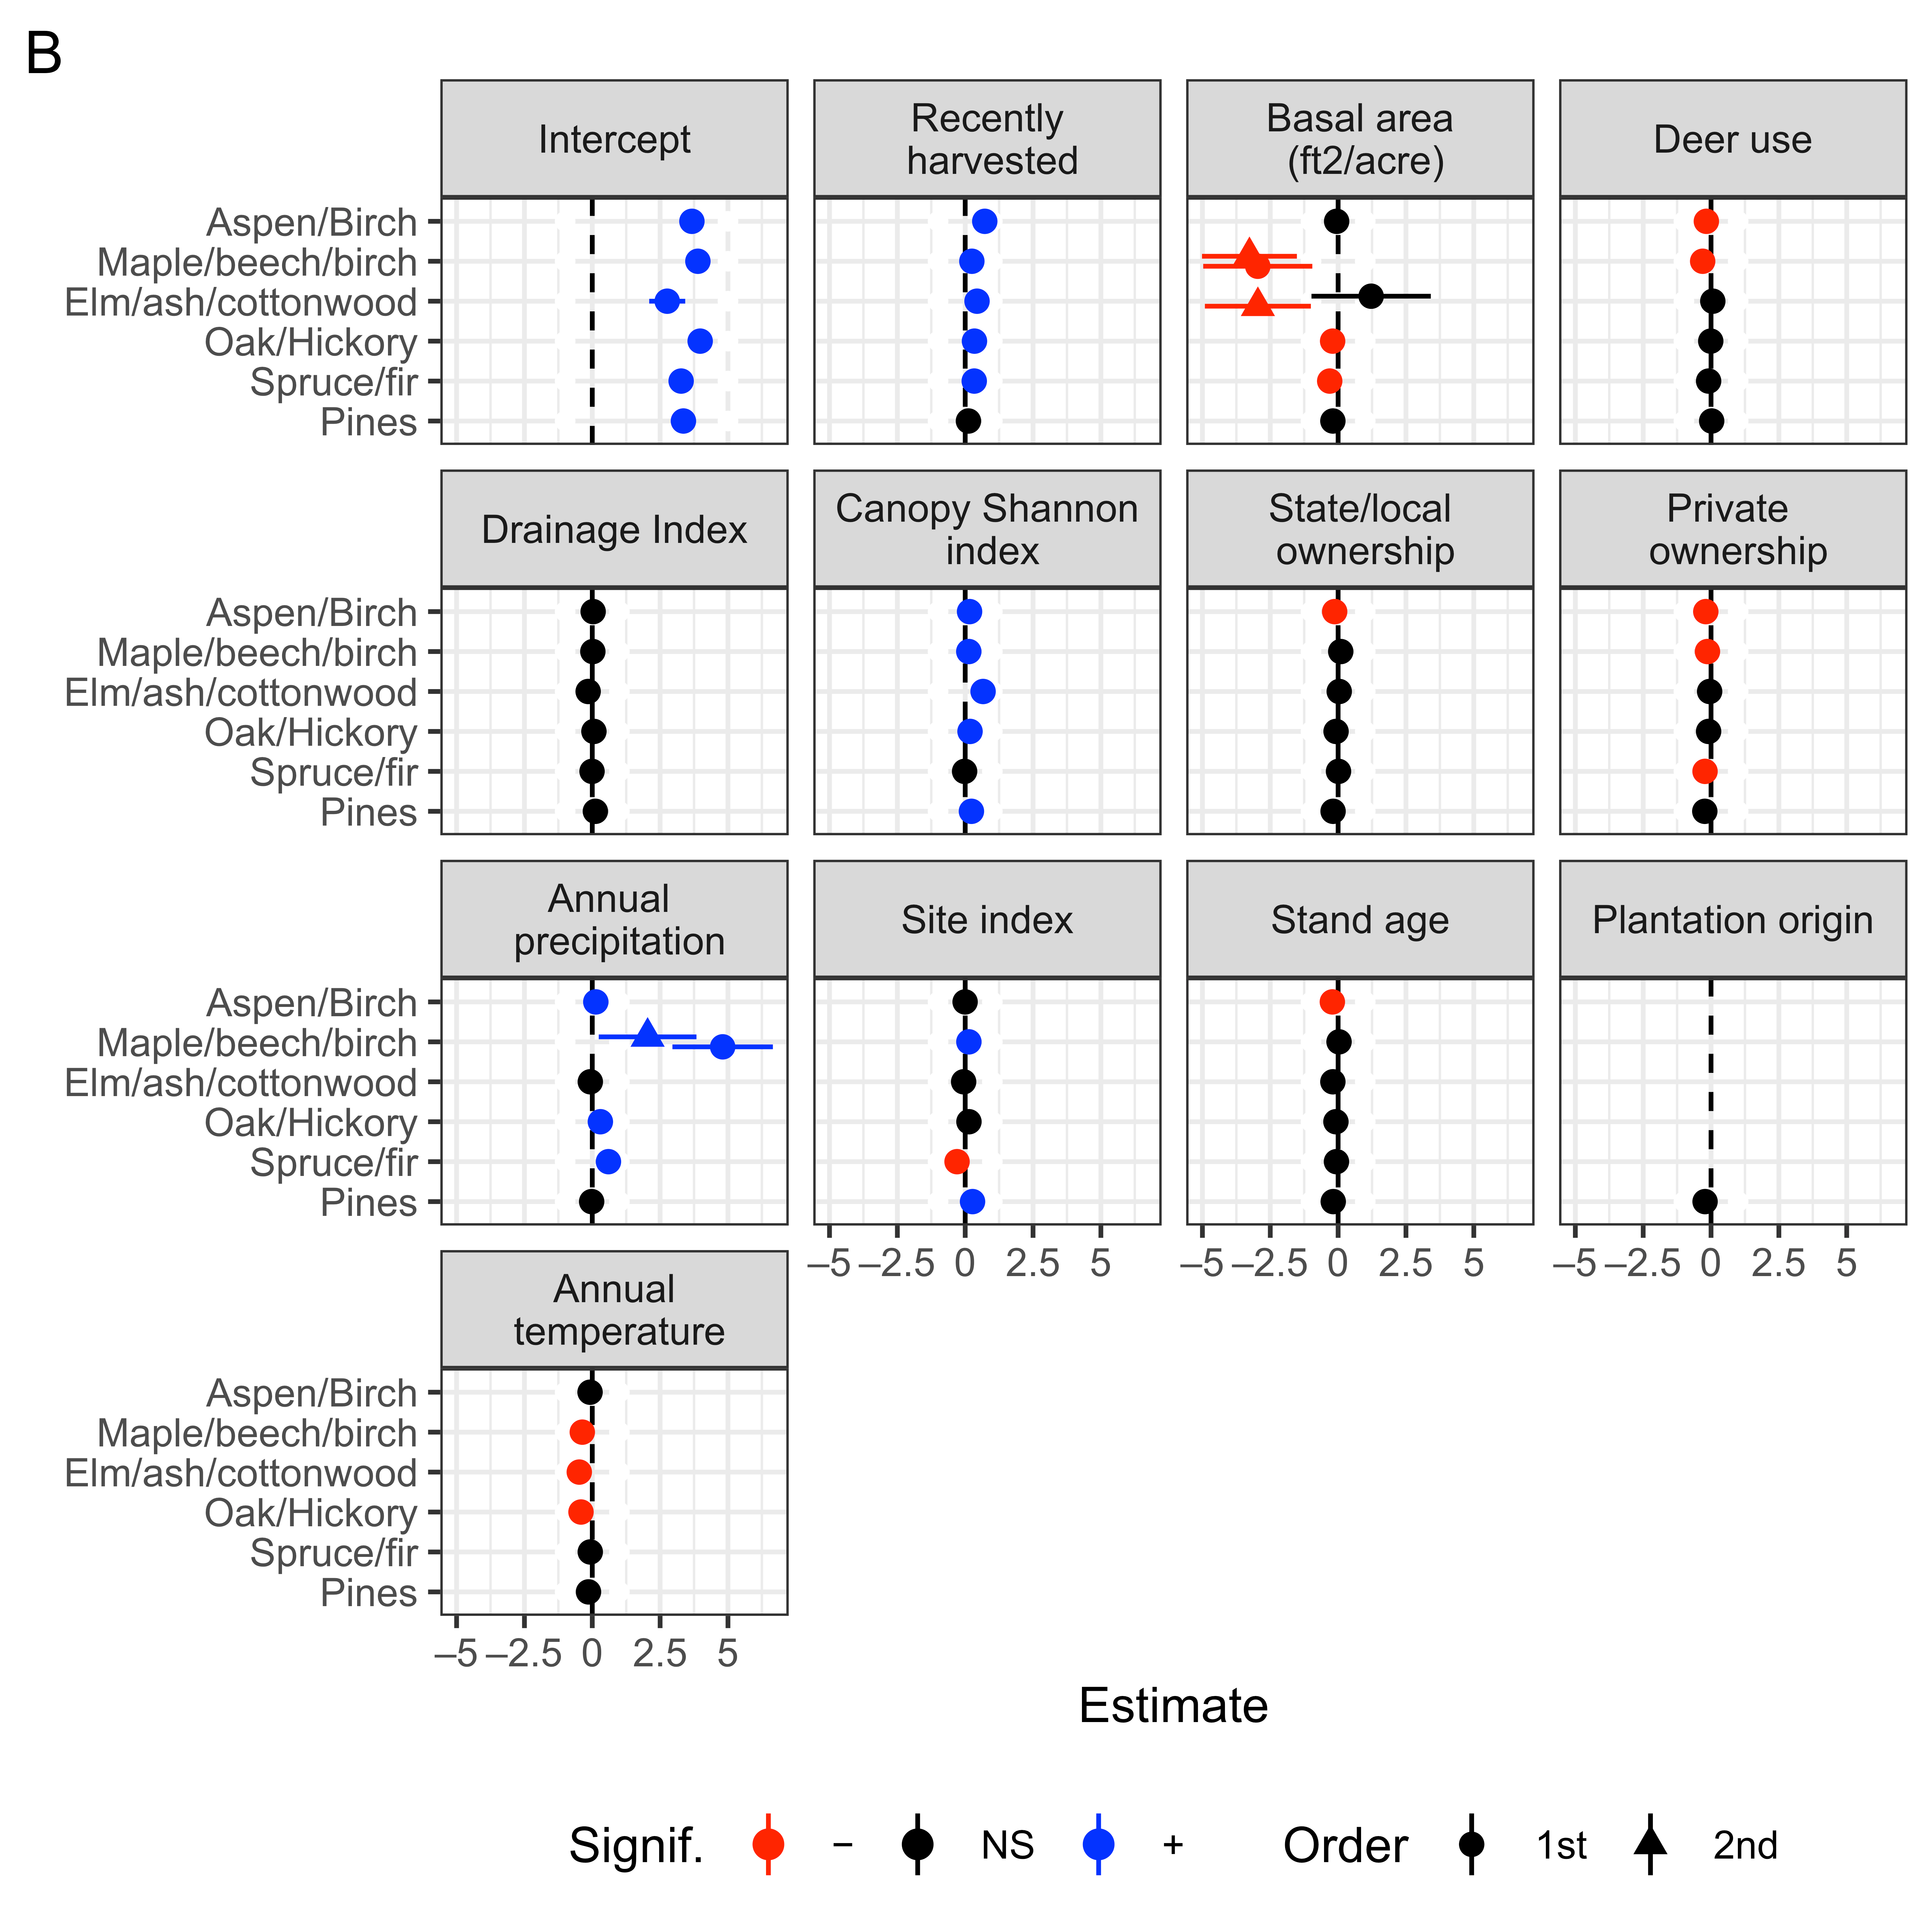
Linear model parameter estimates, with 95% confidence interval error bars, for models of regeneration species richness (A) and abundance (B). Richness models for elm/ash/cottonwood and pines were best fit by an intercept and abundance-only model which we exclude for brevity, along with estimates for forest types (generally not significant); see Appendix B, Table A5 and Table A6 for full set of predictor estimates. The intercepts include federally owned forests of natural regeneration origin (for pines) with no recent history of harvest. Note: although predictors have been standardized to enable direct comparison of effect sizes, parameters with second-order terms are not directly comparable to parameters with only first-order terms.
For abundance (Figure 5B), all forest group full models had lower AIC values compared to null models (Appendix B, Table A4). As with species richness, there were consistent positive relationships with canopy diversity and little variation was explained by the Drainage Index. Additional trends emerged; abundance was generally higher in stands with a recent history of harvest, greater annual precipitation, lower annual temperature, and less deer use. Compared to federally owned stands, tree regeneration was less abundant in privately owned stands. Site index had opposing effects on regeneration abundance: positive for maple/beech/birch and pines and negative for spruce fir. Lastly, stand age negatively related to abundance in aspen/birch stands.
3.3. Harvest Impacts on Regeneration
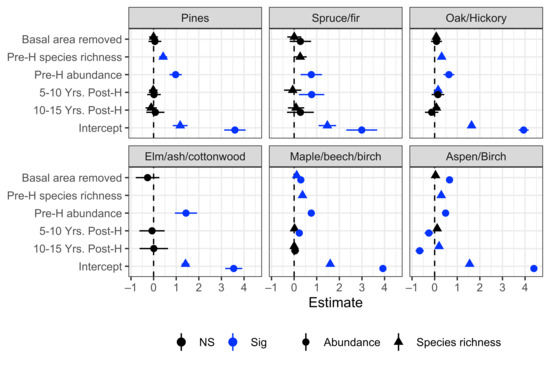
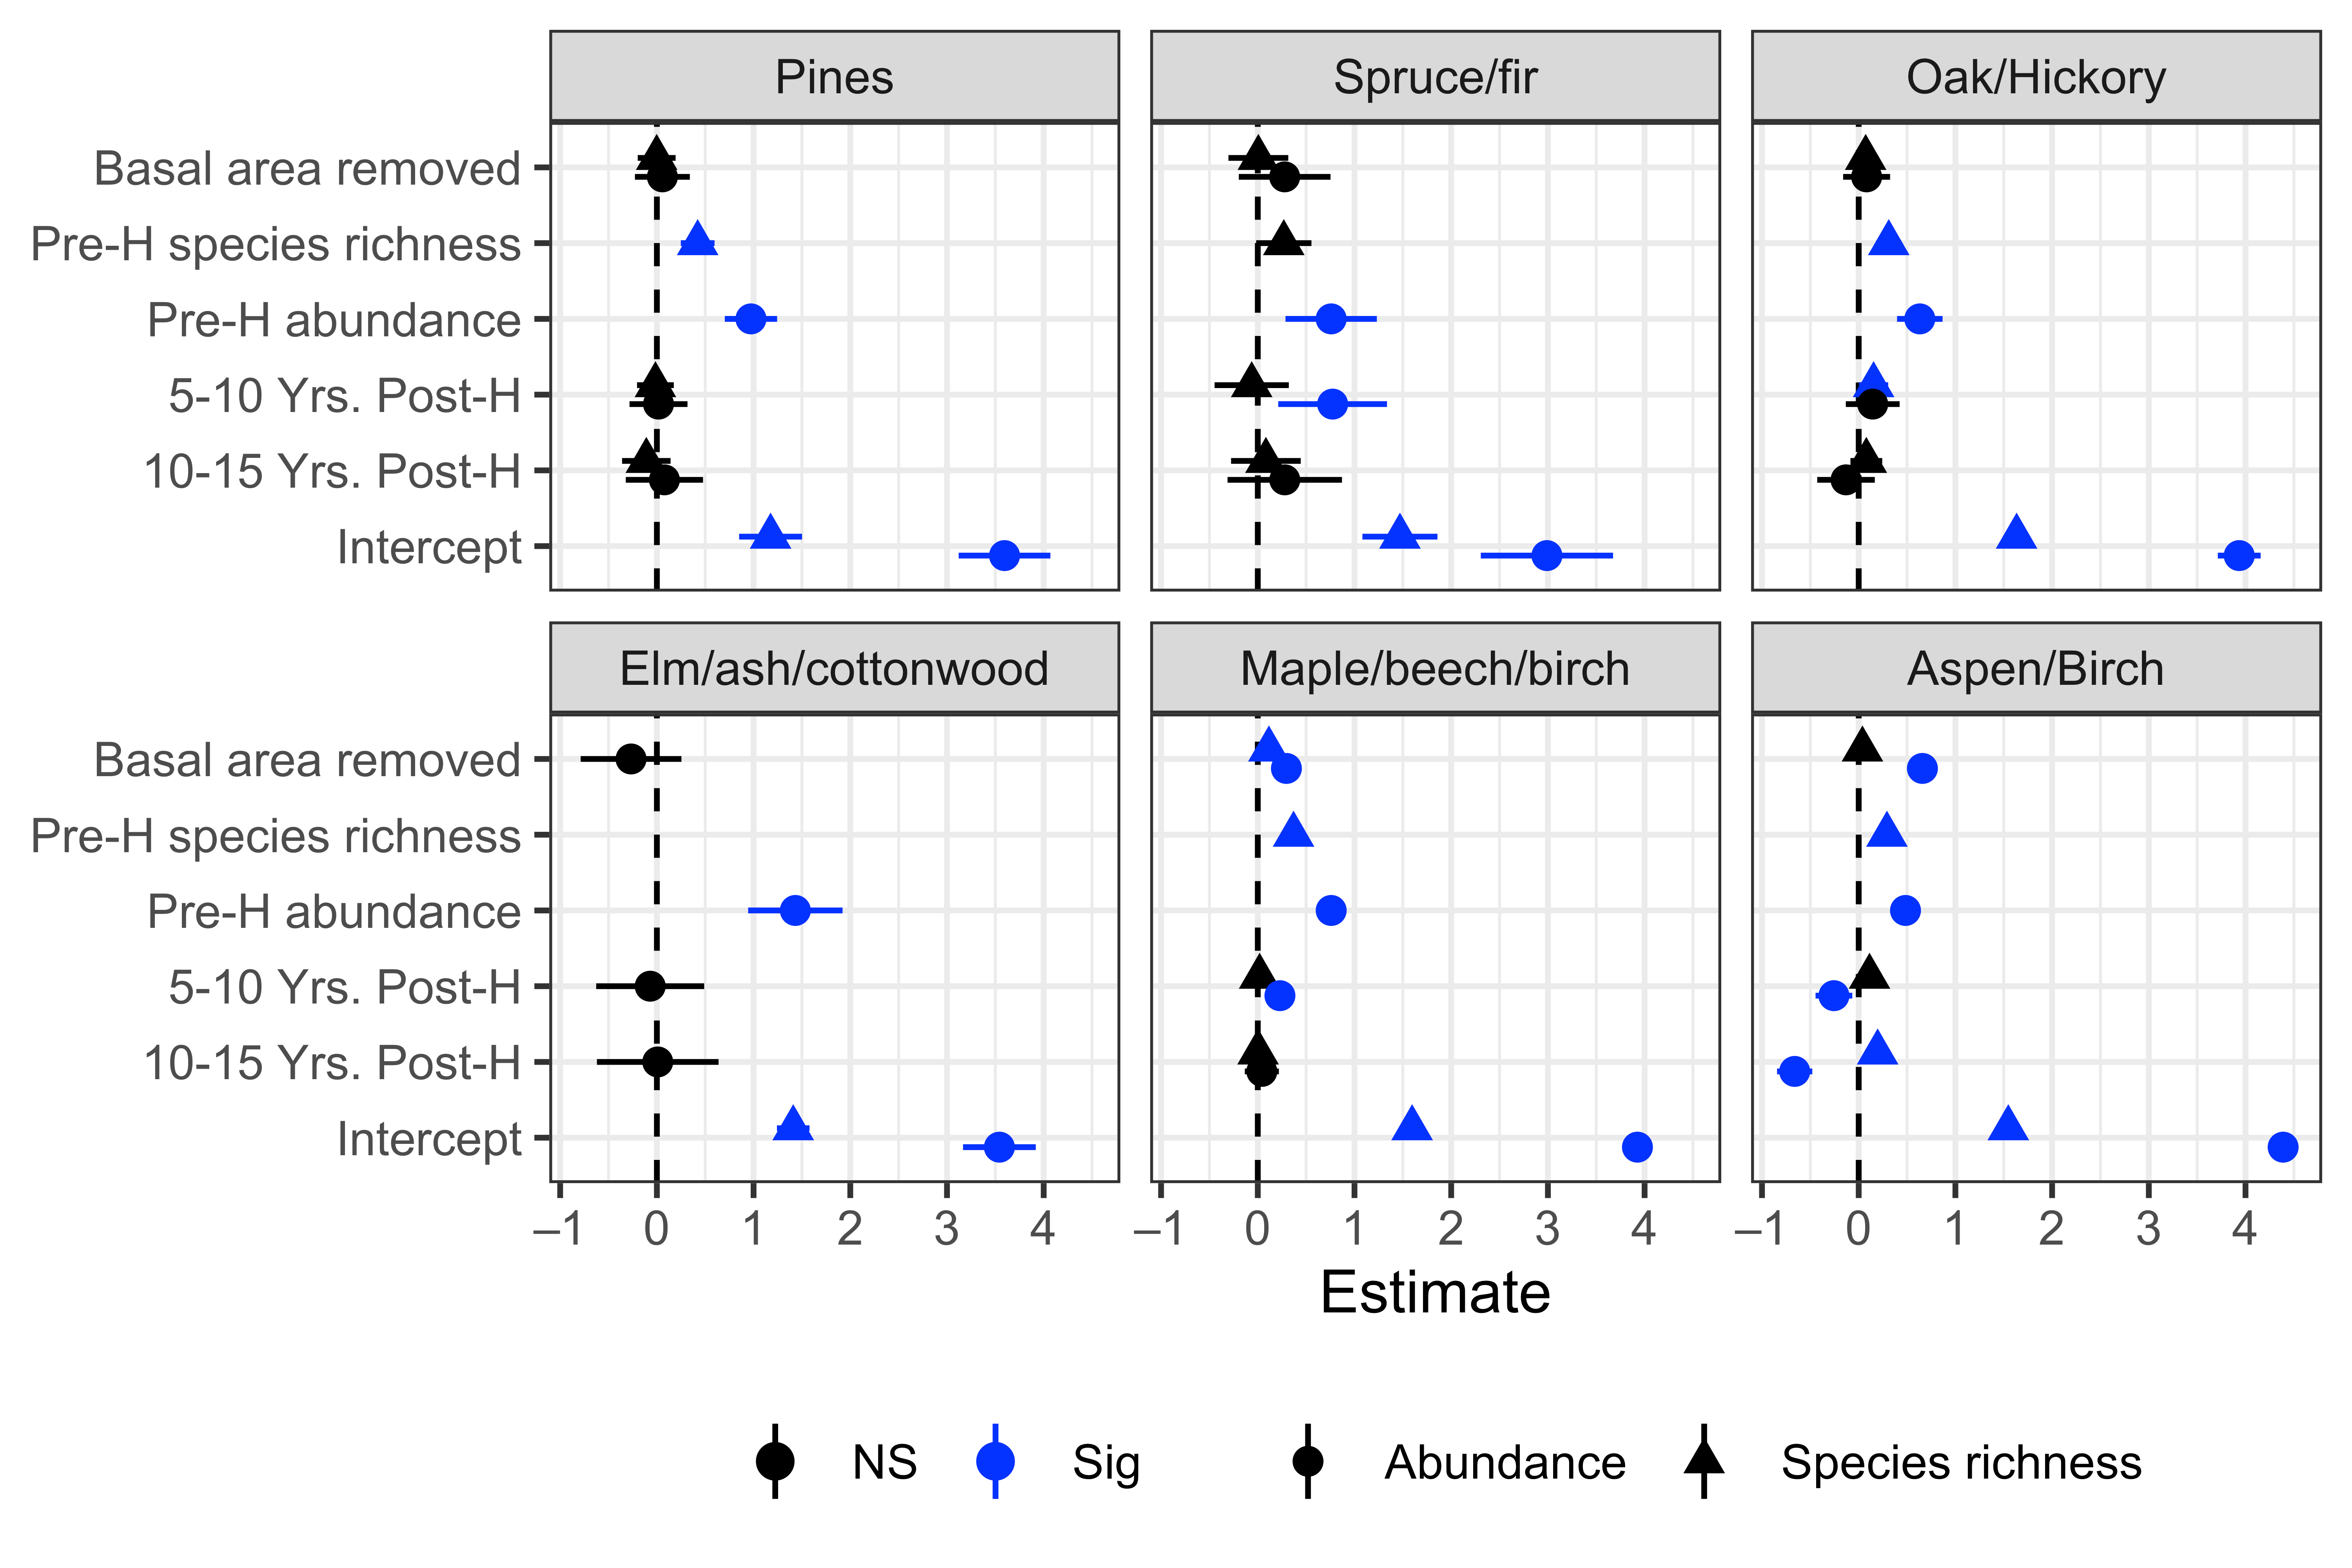
AIC comparison selected the full model for all forest group models of abundance and for all forest group models of richness except elm/ash/cottonwood (Appendix B, Table A7). Pre-harvest richness and abundance associated positively with current post-harvest richness and abundance, respectively (Figure 6). Greater harvest intensity (as measured by basal area removed) positively associated with both abundance and richness in maple/beech/birch plots and with abundance for aspen/birch plots. Among plots which have been harvested, time since harvest was positively associated with species richness only for oak/hickory; however, significant associations were more common for abundance. For spruce/fir and maple/beech/birch forests, plots with a harvest 5–10 years ago had higher average abundance than plots harvested less than five years ago, but that trend did not hold for plots harvested >10 years ago, with their abundance being similar to plots harvested less than five years ago. For aspen/birch, abundance was greatest in plots which were harvested most recently and was lower in plots which were harvested longer ago (for both harvests occurring 5–10 years ago and >10 years ago, compared to plots harvested less than five years ago).
Figure 6.
Parameter estimates with 95% confidence interval error bars for models of regeneration species richness and abundance in recently harvested plots as a function of harvest characteristics; AIC comparison selected the null model for the elm/ash/cottonwood species richness model. Predictors have been standardized, enabling direct comparison of effect sizes within each model. Plots which had a harvest 0–5 years ago are included in the intercept. Estimates for forest type are omitted for brevity; the full table of parameter values can be found in Appendix B, Table A8 and Table A9. Note: not all predictors are included in all models.
3.4. Temporal Trends in Species Richness and Abundance
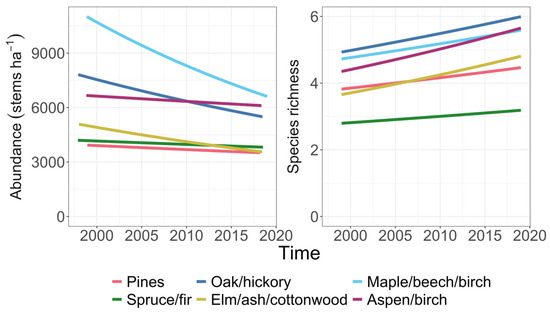
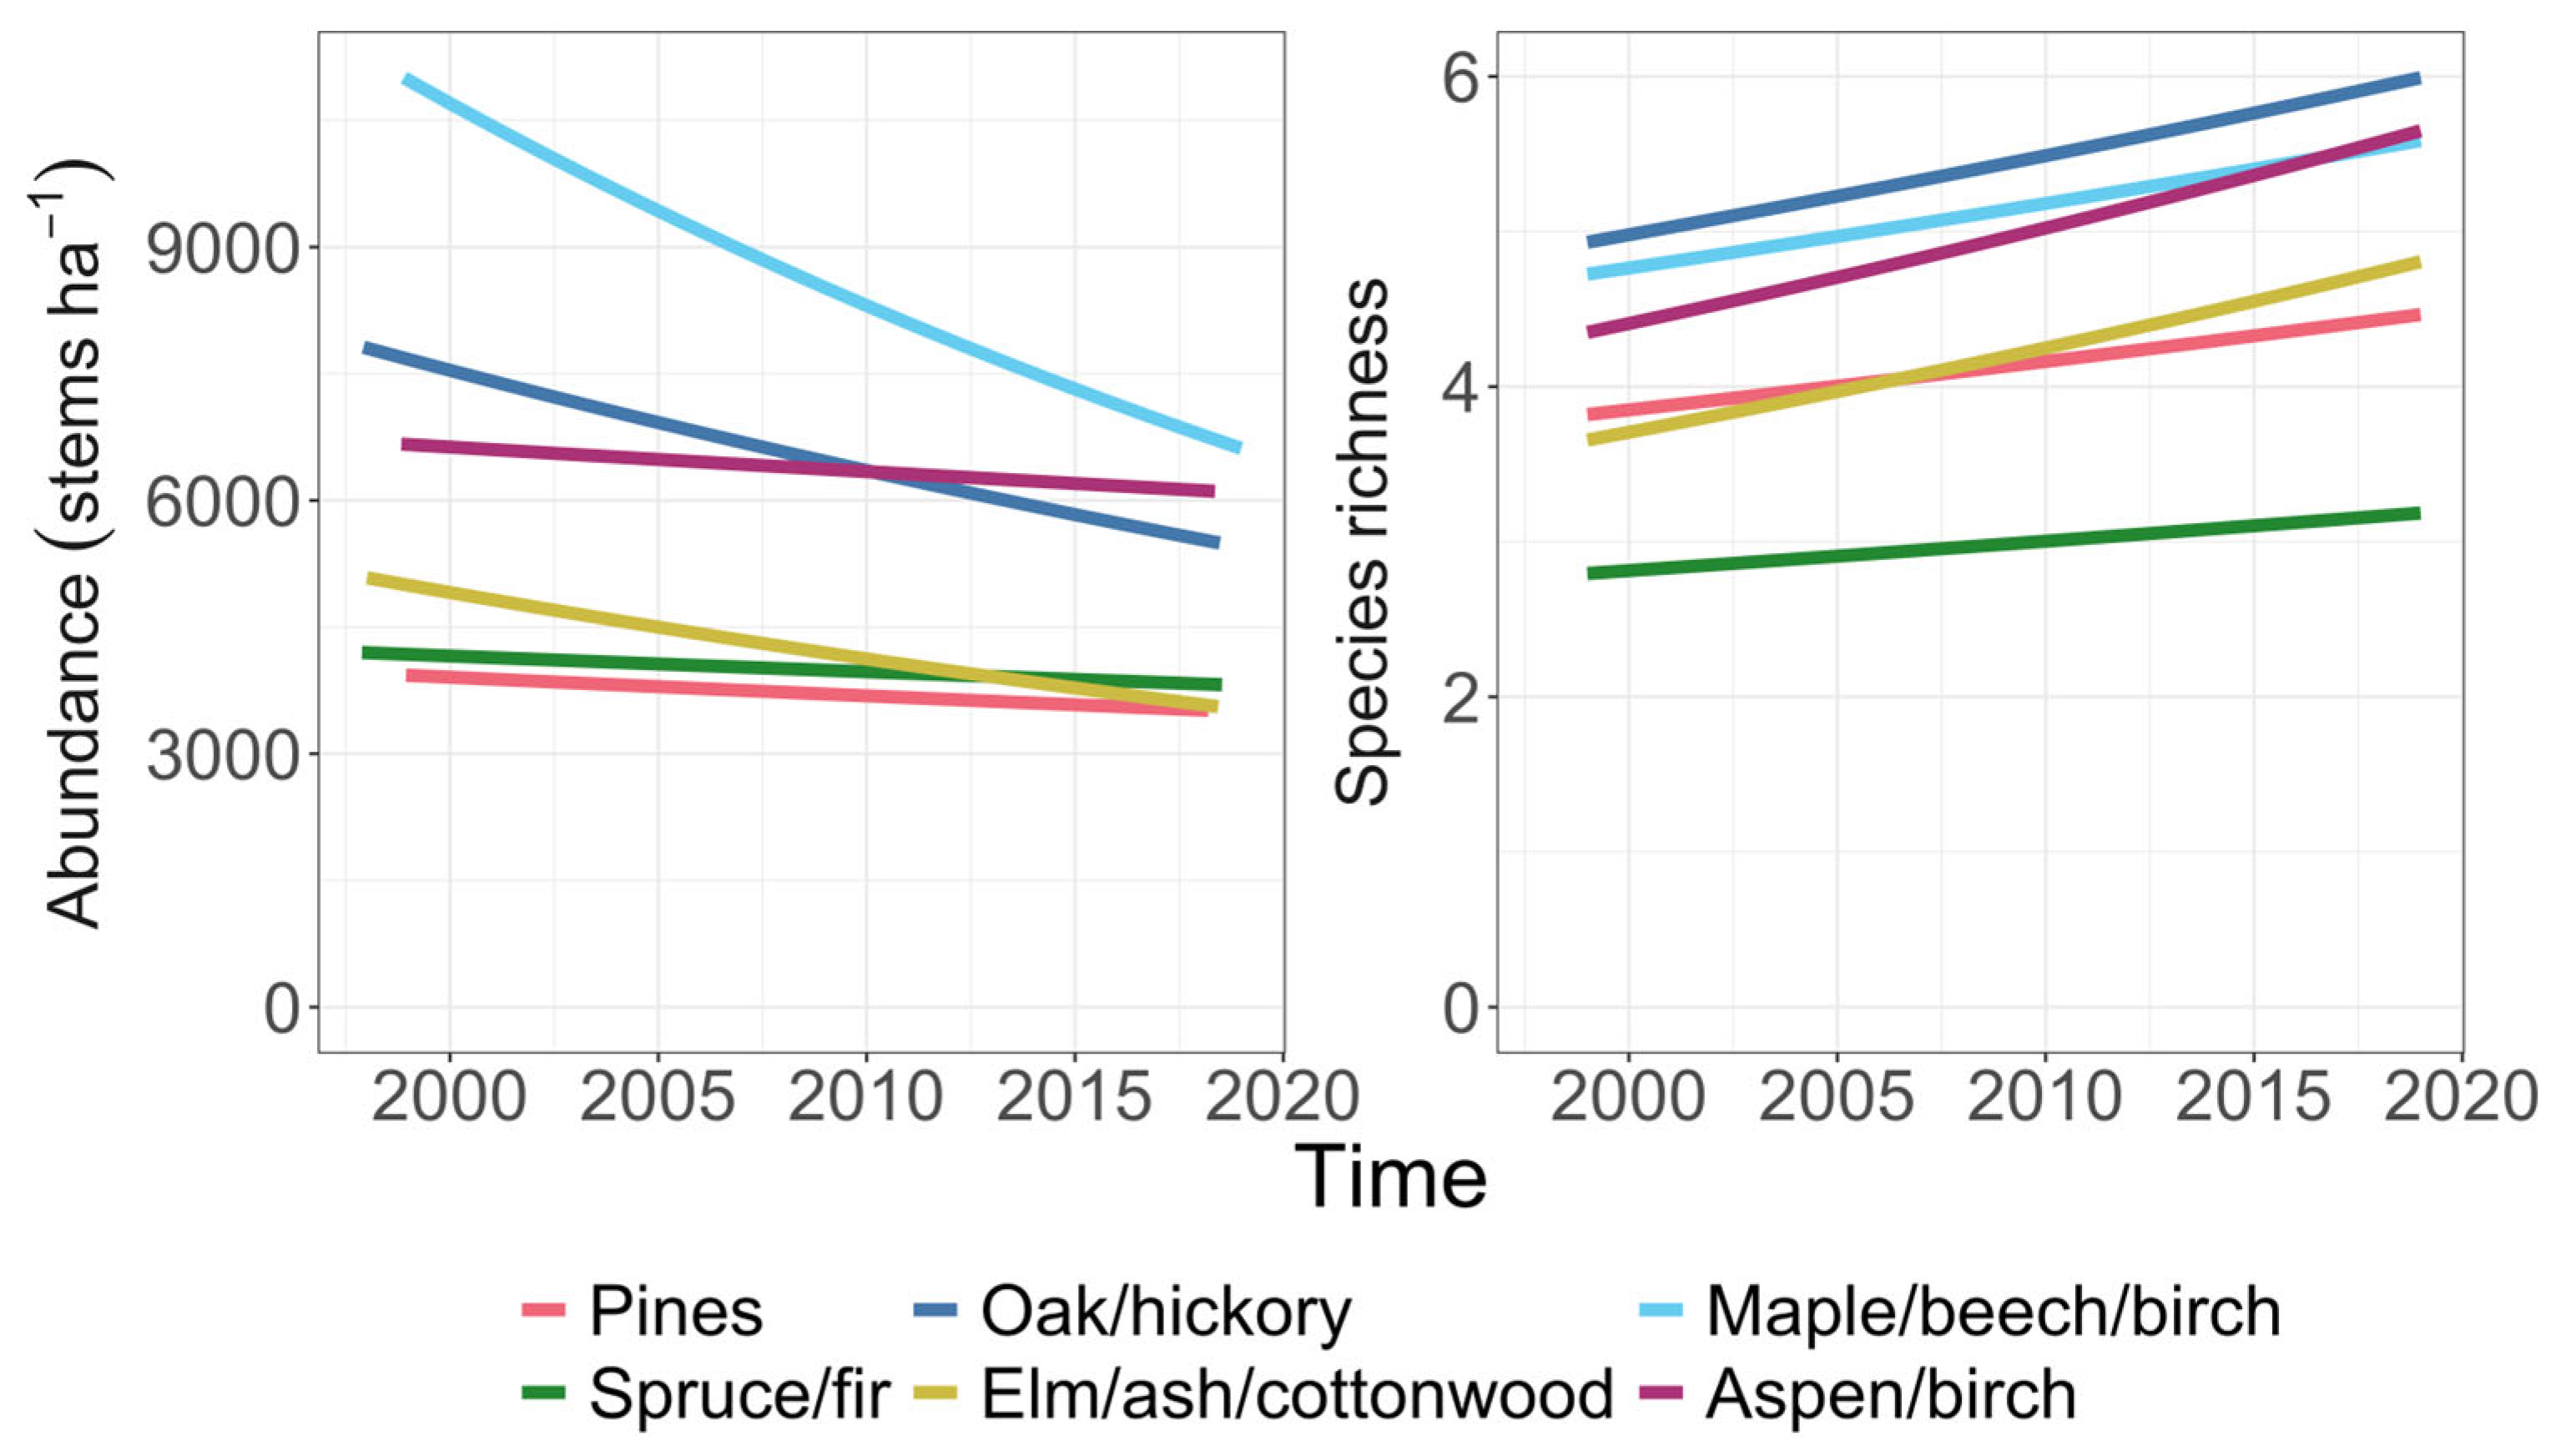
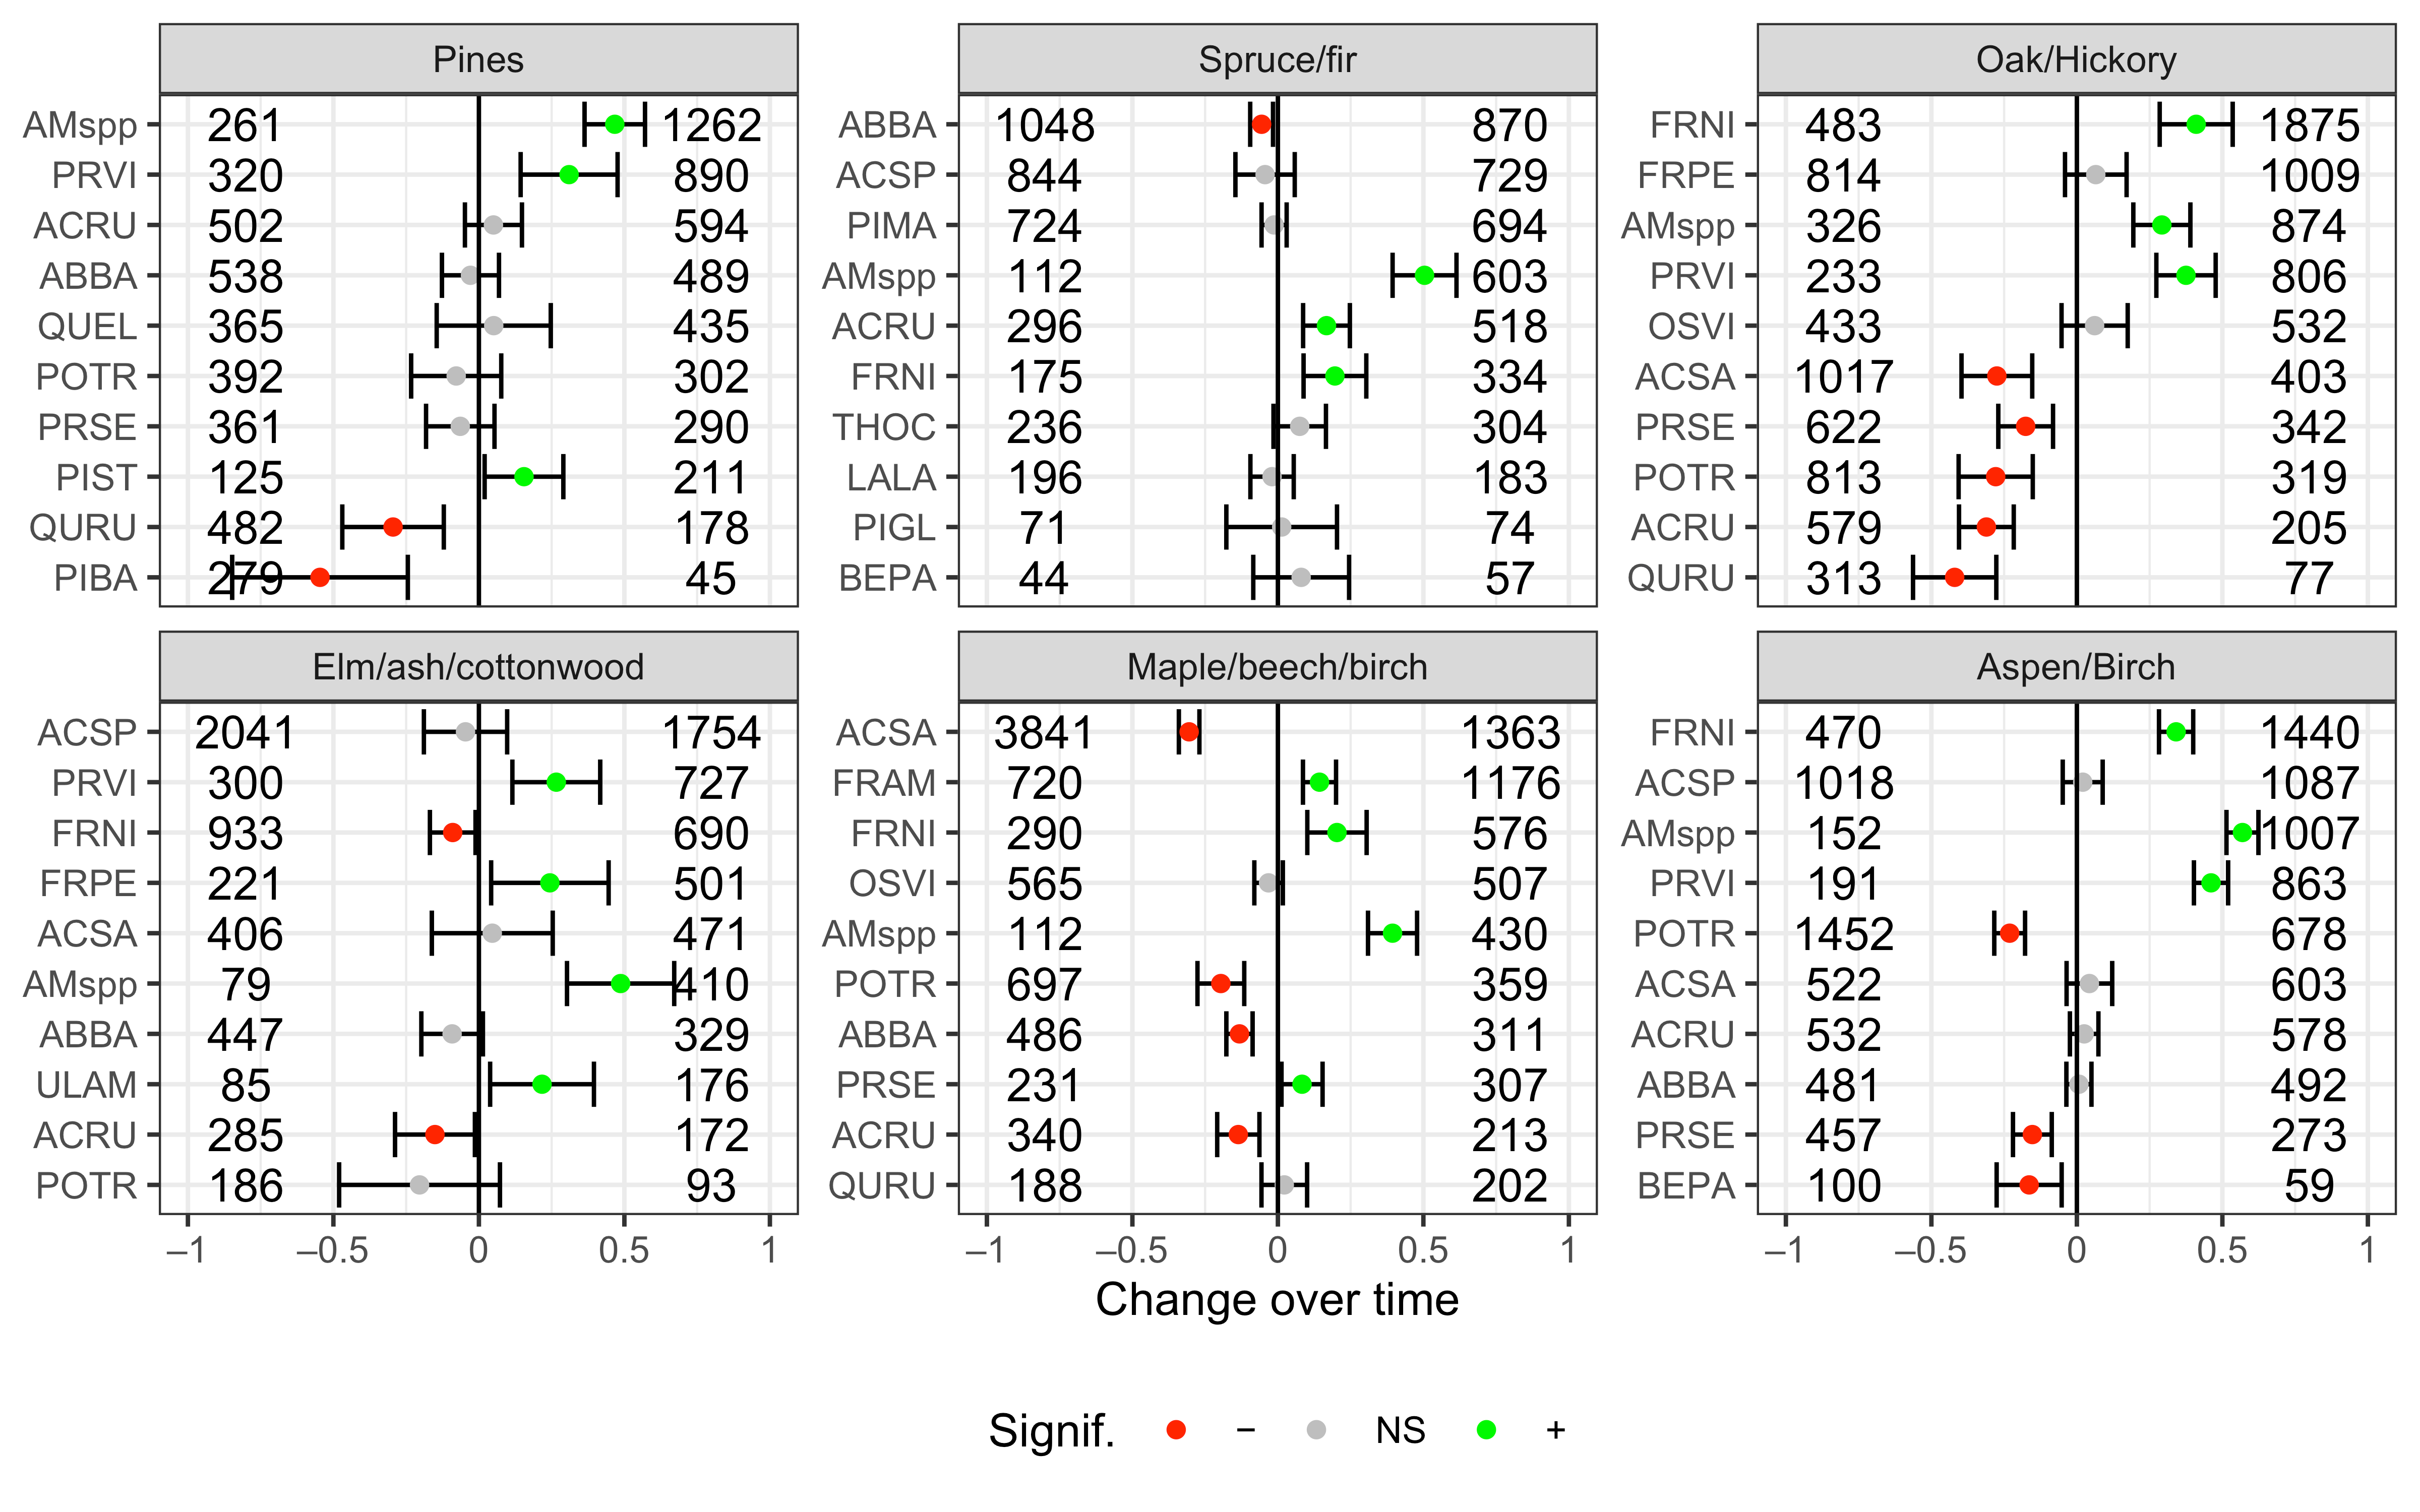
From 1999 to 2019, total abundance of tree regeneration declined significantly in five of the six forest groups, with the greatest slope for maple–beech–birch and the least change (not significant) for pines (Figure 7). In contrast, species richness (independent of abundance) increased significantly for all forest groups (Figure 7). Many individual species densities changed (both negatively and positively) within forest groups (Figure 8). For every forest group except elm/ash/cottonwood, at least one numerically important namesake species declined in abundance: Abies balsamea in spruce/fir, Acer species in maple/beech/birch, Populus tremuloides and Betula papyrifera in aspen/birch, and Q. rubra in oak/hickory. Notably, no namesake species are in the top five most abundant regeneration species for elm/ash/cottonwood and oak/hickory forests. Across all forest groups, species that are in the subcanopy as adults have been increasing in density and were often among the densest species in 2019, including Amanchelier species, A. spicatum, and Prunus virginiana. Fraxinus species, impacted by emerald ash borer (Agrilus planipennis), are in the top five species for four of the six forest groups (all except pines and spruce/fir).
Figure 7.
For tree regeneration, model estimates of abundance (stems ha−1) and plot-level species richness over time (abundance held constant at forest group-specific mean values) created with ggpredict. Slope estimates were not significant for abundance over time for pines; all other slopes were significantly different from zero (p < 0.05; model estimates can be found in Appendix B, Table A10 and Table A11).
Figure 8.
Estimated slope for models of species regeneration abundance as a function of time (mean centered and divided by the standard deviation) for the six forest groups, sorted in order of descending 2019 modeled density. Text labels on the left show model-estimated density in 2000 (stems/ha), and on the right for 2019, calculated using ggpredict. Black lines show 95% confidence intervals. Slopes which are significantly negative are shown in red; significantly positive in green; and non-significant in gray. Full scientific names of species shown can be found in Appendix A, and model estimates can be found in Appendix B, Table A12).
4. Discussion
4.1. Overview
Promoting tree diversity is essential for bolstering forest resilience and functioning as disturbances are increasingly diverging from their historical regimes, including pests and pathogens, climate change, and herbivory pressure. For the Northwoods ecoregion, our results suggest temperate tree regeneration density and diversity vary markedly among forest groups. Within groups, regeneration is primarily driven by canopy characteristics—including basal area, recent harvest disturbance, and species composition, which aligns with existing literature [36,37]. Abundance, and to a lesser degree richness, were positively associated with precipitation, as we hypothesized [H1], but surprisingly had a negative association with temperature. Factors such as site productivity, Drainage Index, deer use, were less clearly associated, though some of these factors are measured at coarser scales and may be influenced by the fuzzed FIA plot locations used; many of these variables, particularly deer use, are well known regeneration drivers [38,39,40], and the absence of consistent associations likely derive from issues of data availability and scale. Tree regeneration richness and subcanopy species density have increased over the past two decades, while total regeneration density and densities of key ecological and economic species have declined, patterns which align with recent literature [7,27]; these trends suggest shifts in potential ecosystem services and functioning that are obscured by broader trends in species richness. Our findings highlight the potential that management actions, including carefully selected harvest regimes and residual compositions, could be used to promote regeneration abundance and diversity. These results join a relatively recent body of literature exploring regional patterns of tree regeneration and associated drivers [5,59] and highlight the need for regional-scale forest planning.
4.2. Factors Affecting Tree Regeneration Richness and Abundance
Canopy diversity and density are known drivers of tree regeneration abundance and diversity, with greater canopy diversity generally promoting greater tree regeneration diversity [5,30,59] and high basal area limiting both abundance and diversity [21,27,60]. Our results support these findings and part of our hypothesis [H1], with canopy variables generally being the most consistent predictors across forest groups. The positive relationships between canopy diversity and abundance were more surprising and lack precedence in the literature for tree regeneration, though tree diversity has been linked to greater biomass of graminoids and herbaceous plants [61]. Overstory diversity may enhance regeneration abundance via diverse seedlings more completely filling the full breadth of heterogeneous regeneration resource/niche spaces or through more evenly distributing mast production (thus seedlings) across years due to inter-species masting asynchrony. It is also possible that both overstories and understories simply reflect the number/identities that any one site’s environment (site resource availability and climate) can support. Additional analysis is needed to confirm these postulated mechanisms.
Plots with a recent harvest generally had higher abundance than those without recent harvest in alignment with our hypothesis [H1] (Figure 5B), likely largely due to increased understory light [62,63]. Our results further suggest that more intensive harvest (removing a greater BA) may yield greater benefits for some forest types, though across all forest types, pre-harvest conditions also have a large impact on post-harvest composition. Based on analysis of the current composition of plots, plots which were harvested more recently tend to have higher abundance than those which were harvested longer ago for aspen/birch forests; further analysis of harvested plots which tracks inventories over time could expound on this observed trend. This trend likely emerges because rapid growth following clear-cut in aspen stands leads to rapid regeneration recruitment into larger size classes followed swiftly by shading of the understory, preventing further regeneration establishment and recruitment. For other forest types, there was less variation among plots based on years since harvest. Our results support potential for harvests to support increased tree regeneration abundance, which can help promote recruitment in the face of inhibiting factors such as deer browsing [63].
We found limited support for the effects of some regionally varying drivers, including soils and deer browsing pressure, leaving us unable to support parts of our first hypothesis [H1]. Positive associations with stand productivity (site index) and soil water availability (Drainage Index) for both abundance and richness were surprising, possibly suggesting resource availability did not rise to the level of inducing greater competition and rather supported higher biomass and more species. However, abundance was negatively associated with site index for spruce/fir forests, a potential indication of additional resources causing greater competition in that group. Although there was little evidence of a bimodal relationship between productivity (SI) and species richness within forest groups, patterns across upland forest groups suggest forests associated with intermediate fertility sites have highest richness, though not abundance, in partial support of our hypothesis [H2]. In the Northwoods region, on upland sites, maple/beech/birch sites generally occupy the most fertile soils, pines the poorest soils, with oak-hickory forests intermediate [29]. When holding abundance constant across forest groups, oak/hickory had the highest species richness, although maple/beech/birch had the greatest abundance.
Deer browsing, a known driver of tree regeneration composition [38,39] and inhibitor of regeneration abundance [22,27], was only significantly associated with abundance for the two most common forest groups, and not at all for richness, providing only moderate support of our hypothesis [H1]. This finding is consistent with prior research showing that deer diminish density and shift relative composition but not total richness in maple/beech/birch forests in Michigan [30]. The coarse index of deer browsing used in FIA surveys and relatively scarcity of that data among FIA plots may contribute to the lack of significant associations with abundance in other forest groups.
Contrary to the inconsistent effects of other regionally varying drivers, climate emerged as a consistent predictor of tree regeneration characteristics, though not always conforming to our hypothesis [H1]. Positive associations of annual precipitation with abundance (and richness for spruce/fir) conform to global observations [12], while the unimodal relationship for aspen/birch matches the regional trend identified in [5]. However, negative associations of abundance with temperature alone for maple/beech/birch, elm/ash/cottonwood, and oak/hickory were surprising and lacking established explanation for the Northwoods, though this pattern has been observed in canopies of conifer forests [14]. For oak/hickory, this pattern may result from the south–east to north–west distribution of oak/hickory along the southerly edge of the Northwoods (Figure 2), confounding temperature with longitude and potential compositional/competitive shifts. For maple/beech/birch and elm/ash/cottonwood, warmer temperatures driving higher overall productivity and denser canopies may result in greater understory light limitation. When we consider temperature and precipitation together, the combination of higher temperatures and lower precipitation leads to greater water deficits. Patterns for many species indicated the combination of higher temperatures and lower precipitation led to lower regeneration abundance, suggesting regeneration is limited by drought. Alternatively, deer preference for regions of warmer temperatures and less snow (lower precipitation) suggests abundance vs. precipitation/temperature associations could be indirect rather than causal. Nevertheless, if relationships with temperature and precipitation remain constant, projected increases in temperatures and decreases in summer precipitation [64] could result in declines of tree regeneration abundance and potentially richness, particularly for forest groups sensitive to drought either via species composition or current water availability. Our results highlight that global patterns may not always directly translate to regional expectations and underscore the need for region-specific analyses.
4.3. Changes in Regeneration Abundance and Richness over the Last Two Decades
Temporal patterns support, at a regional scale, the concerns managers and scientists have been expressing about low density regeneration in ecologically and economically valuable forest groups and largely support our hypotheses. We found partial support for our hypothesis [H3], in that abundance has declined and species composition has shifted; however, we were surprised to find that richness had increased over the analytical period. Our findings suggest, if patterns continue, potential shifts in forest canopy composition and/or insufficient regeneration to sustain forest structure and productivity into the future; further monitoring and analysis is needed to confirm if changes are merely short-term. This finding is important context for snapshot in time analyses; for example, Ref. [7] projected that most FIA plots were sufficiently stocked with leading (i.e., namesake) species in the canopy, but if temporal trends continue, those plots may soon be considered not well stocked. Declines in overall abundance were greatest for maple/beech/birch and oak/hickory forests, and the species with the largest percent change (i.e., largest negative slopes) were A. saccharum and Q. rubrum, respectively. Striking and unexpected were the consistent increases in the density of understory tree/shrub species Amelanchier species, P. virginiana, and A. spicatum, across forest types. However, this pattern is consistent with global increases in shrub layer density, potentially attributable to increased overstory disturbance [42] or long-term selective deer browsing pressure, the latter being supported by declining abundance of browse-preferred species (e.g., Acer and Quercus). The contrast of increasing richness with declining abundance (total and individual species) emphasizes the need for management based on functional metrics of diversity or species composition management goals [27].
4.4. Caveats and Future Directions
Several caveats are important to consider when interpreting our model results. Firstly, some predictors are less precisely quantified than others. For example, we had limited and coarse deer use estimates, broad ownership categories, and spatial inaccuracy for spatially extracted values due to fuzzed FIA location information (particularly DI). Comparing relative strengths of predictors should be tempered by differential data precision and accuracy. Likewise, small, fixed-area FIA plots likely underestimate true species richness (i.e., saturation) of the forest stand they represent. Although we accounted for this by including stem abundance as a model predictor, having a widespread dataset to be able to assess stand-level species richness would provide more refined results and would be more directly applicable to management (for example, stand-level estimates of tree regeneration species richness of maple/beech/birch stands in northern Michigan [20] are higher than plot-level estimates presented here). Additionally, because we do not use FIA weighting factors, estimated values represent mean densities and changes within plots rather than estimates of landscape-level average densities and changes.
Our results point to several areas for further research to inform forest management. First, additional analyses could explore drivers of temporal shifts of species desirable to management to extrapolate future potential trends, including more refined measures of climate. Species-specific guidance can also direct harvest regimes which are most beneficial in recruiting diverse species to the canopy [27]. Secondly, efforts to correlate FIA data with stand-scale data (which could be used to obtain saturated samples of species richness) could further refine goals for stand-level species richness; small FIA plot sizes enable wide-scale recommendations, but do not necessarily translate to stand-level recommendations, e.g., species richness at the stand scale.
5. Conclusions
We found partial support for most of our hypotheses, with some intriguing exceptions. As predicted by our first hypothesis, canopy and precipitation characteristics were associated with tree regeneration patterns in the manner predicted, though surprisingly temperature was negatively associated with abundance. For other drivers, such as deer use, site quality, and ownership, associations with tree regeneration were inconsistent, likely due to data limitations. In partial support of our second hypothesis, holding abundance constant, tree regeneration species richness was greatest for forest groups typically found on mid-quality sites; however, regeneration abundance was greatest in maple/beech/birch forest type stands, which are characteristically on high-quality sites. Lastly, in support of our third hypothesis, dominant forest types in the Northwoods exhibited significant declines in tree regeneration abundance and changes in species composition over the past two decades. Inconsistent with our third hypothesis, tree regeneration species richness has increased in the last two decades, which may reflect slowly changing species composition. Declines in many namesake/dominant tree species and increases of many subcanopy species undesirable for management partially characterizes the nature of these changes.
Should current trends in regeneration become apparent in the future canopy, the landscape of the Northwoods may change significantly. As managers, conservationists, and landowners look to the future, our results suggest that canopy composition plays a large role in determining regeneration outcomes. Management aimed at increasing understory heterogeneity while maintaining canopy species diversity may prove useful in promoting desired tree regeneration outcomes.
Author Contributions
Conceptualization, C.R.H., D.R.P., and M.B.W.; methodology, C.R.H., D.R.P., and M.B.W.; formal analysis, C.R.H.; writing—original draft preparation, C.R.H.; writing—review and editing, C.R.H., D.R.P., and M.B.W.; visualization, C.R.H. All authors have read and agreed to the published version of the manuscript.
Funding
The stipend for C.H. was provided through the generous support of the Bailey Conservation Fellowship by Essel and Menakka Bailey.
Data Availability Statement
The original data presented in the study are openly available in FigShare at https://doi.org/10.6084/m9.figshare.32573442.
Acknowledgments
Thank you to Essel and Mennaka Bailey for their generous fellowship which supported Catherine Henry. We appreciate valuable insight from Patrick Doran, Andrew Finley, and Emily Clegg on this manuscript.
Conflicts of Interest
The authors declare no conflicts of interest.
Appendix A
Table A1.
For tree species regeneration, the species abbreviation code, scientific name, common name, and number of plot occurrences for seedling layer, canopy layer, and combined seedling + canopy layer, across all six forest groups and for all eligible plot occurrences (e.g., from 1999 to 2019, where 100% forested, and in one of the top six forest groups). Bolded codes indicate that a species was in the top ten most abundant tree regeneration species for at least one forest group.
Appendix B
Details on species richness and abundance models.
Table A2.
Number of plots (n plots) and current composition summaries, based on the most recent inventory available for each plot (2012 to 2019). Summary values, by group and all plots combined, include total species recorded (n species); mean, minimum, and maximum of tree regeneration abundance (thousand trees per hectare, TPH); and unadjusted plot-level average species richness for FIA plots in the Northwoods, by forest group and across all forest groups combined.
Table A3.
Mean, standard deviation (SD), minimum, and maximum for harvest characteristics for 1274 stands with at least one recorded harvest. The number of plots in each forest type, which was an additional predictor, is included in Table 1 for brevity.
Table A4.
AIC values for candidate models, by forest group, for models of tree regeneration species richness and abundance for 5186 FIA plots.
Table A5.
Model parameter estimates (estimate, standard error, and p-value for linear predictors; chi-squared and p-value for smoothed parameters) for drivers of tree regeneration species richness, by forest group; coefficients with a significant parameter estimate (p < 0.05) are bolded.
Table A6.
Linear model parameter estimates for drivers of tree regeneration abundance for each forest group; coefficients with a significant parameter estimate (p < 0.05) are bolded.
Table A7.
AIC comparison for models of harvest characteristics on tree regeneration species richness and abundance; lower AIC value is bolded.
Table A8.
Parameter estimates (estimate, standard error, and p-value for linear predictors; chi-squared (italicized) and p-value for smoothed parameters) for association of harvest characteristics with tree regeneration richness; significant coefficients (p < 0.05) are bolded.
Table A9.
Parameter estimates for association of harvest characteristics with tree regeneration abundance; coefficients with a significant parameter estimate (p < 0.05) are bolded.
Table A10.
Model estimates for total abundance over time, for each forest group; coefficients with significant estimates (p < 0.05) are bolded.
Table A11.
Model estimates (estimate, standard error and p-value for linear predictors; chi-squared and p-value for smoothed parameters) for total species richness over time, for each forest group; coefficients with significant estimates (p < 0.05) are bolded.
Table A12.
Model estimates for individual species over time, including estimates at years 2000 and 2019; parameter estimates significantly different from zero (p < 0.05) are bolded.
Figure A1.
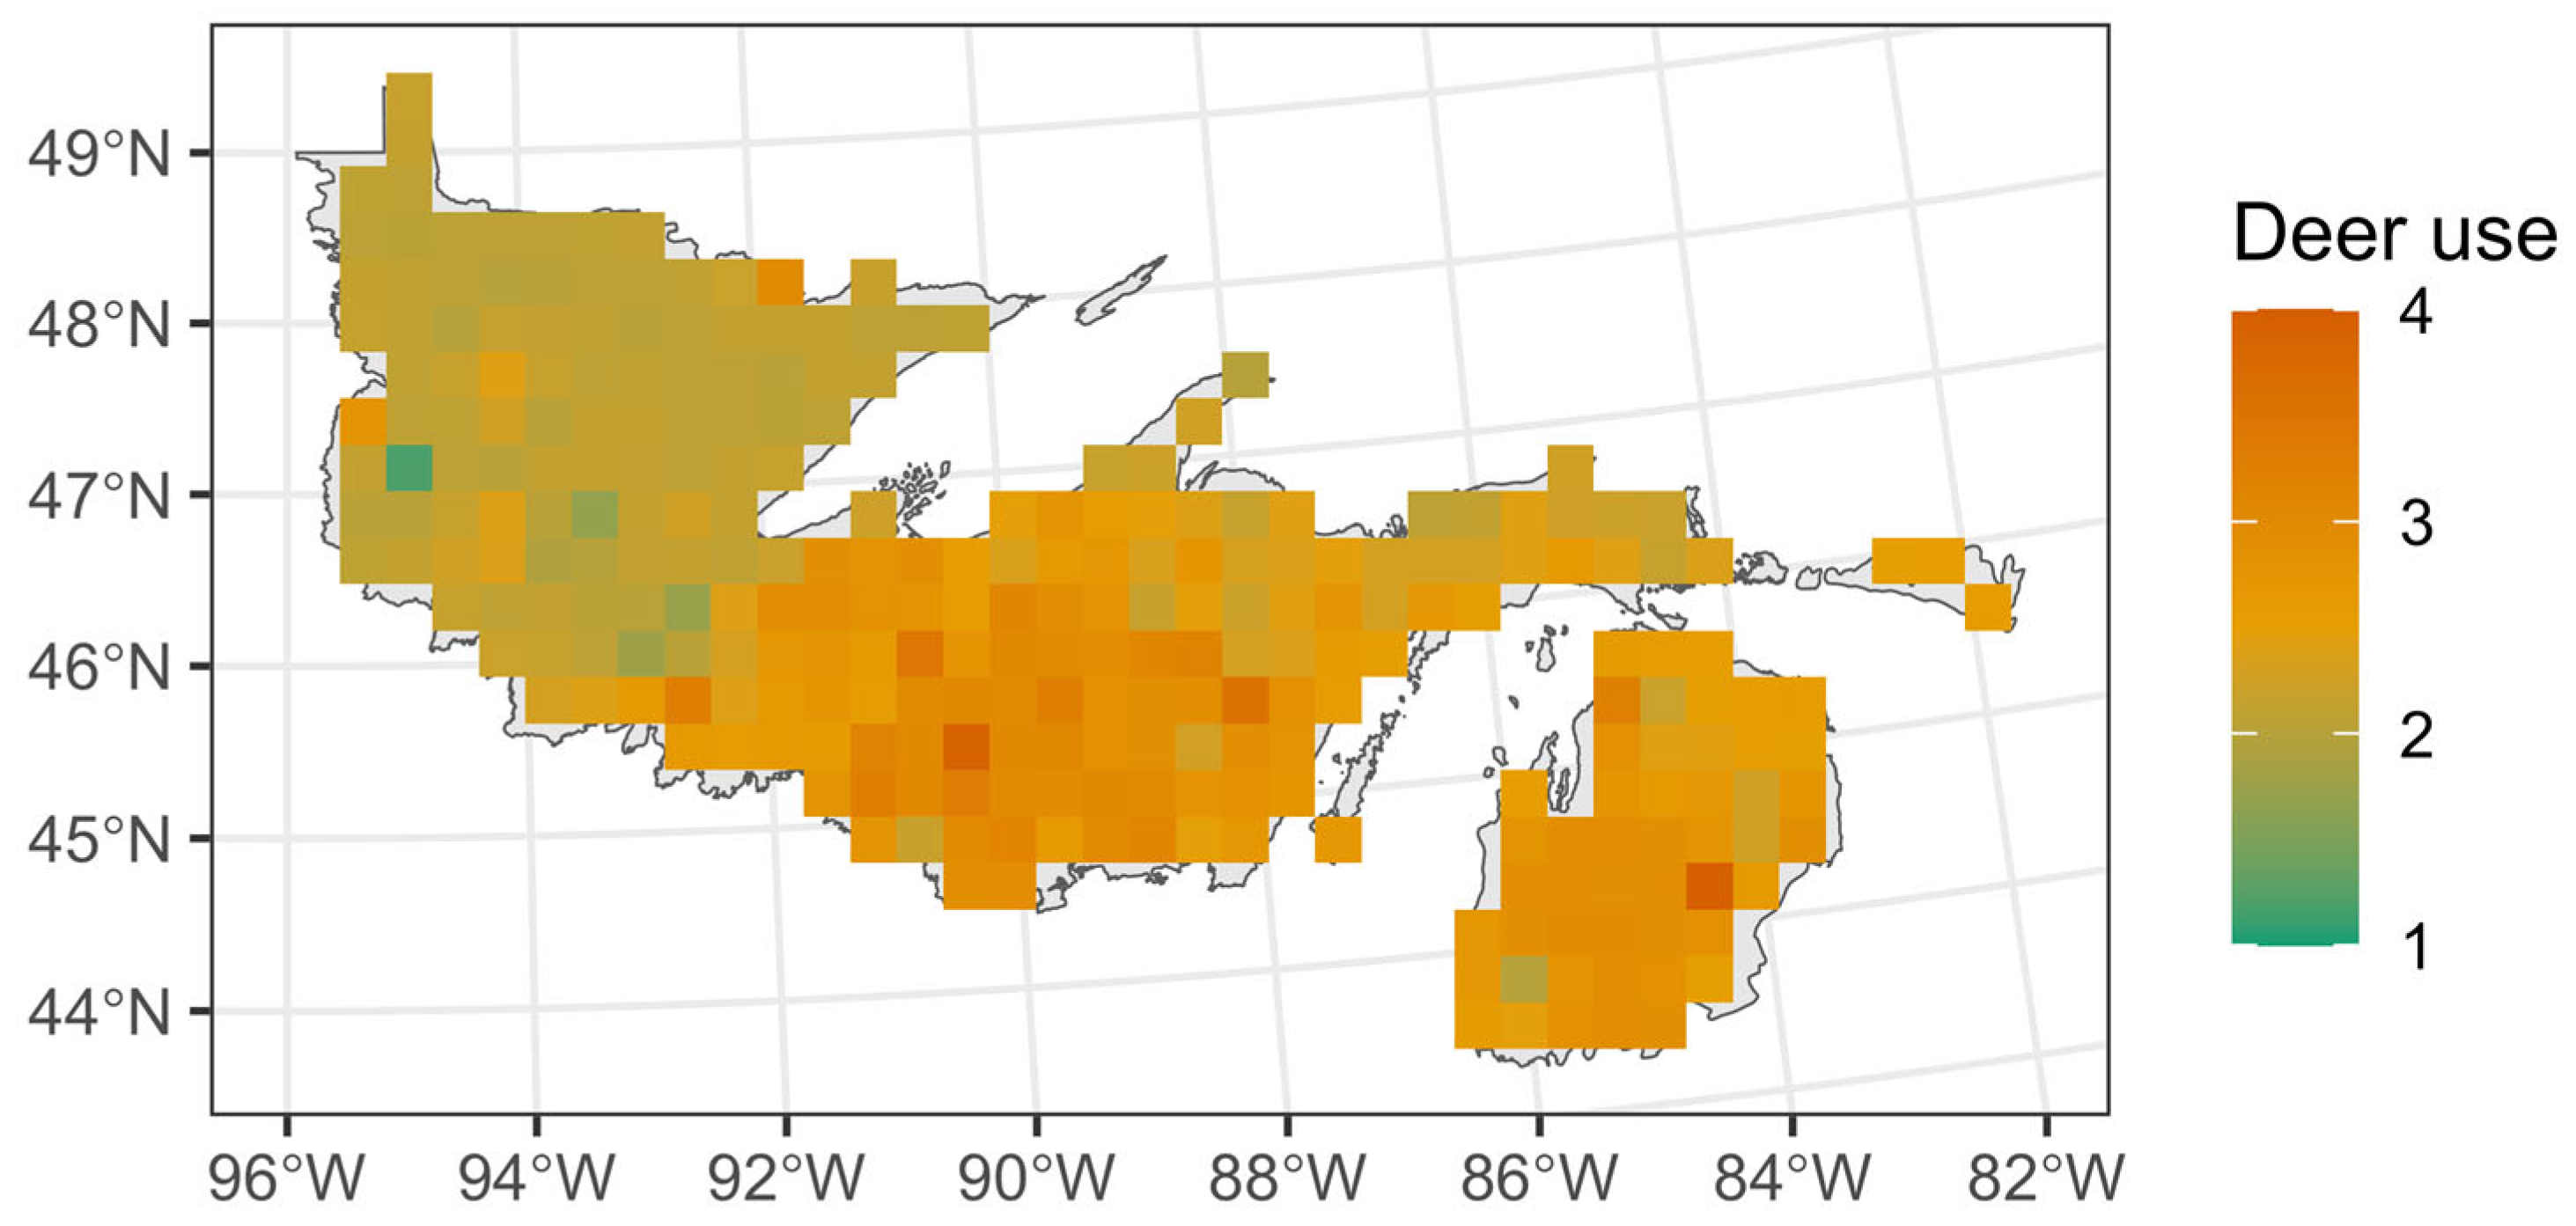
Modeled estimates of deer use (browsing index, scale from 1 to 5) for the Northwoods region, based on data collected at 364 FIA plots.
References
- Thompson, I.; Mackey, B.; McNulty, S.; Mosseler, A. Forest Resilience, Biodiversity, and Climate Change; Technical Series no. 43; Secretariat of the Convention on Biological Diversity: Montreal, QC, Canada, 2009; 67p. [Google Scholar]
- Dollinger, C.; Rammer, W.; Suzuki, K.F.; Braziunas, K.H.; Keller, T.T.; Kobayashi, Y.; Mohr, J.; Mori, A.S.; Turner, M.G.; Seidl, R. Beyond resilience: Responses to changing climate and disturbance regimes in temperate forest landscapes across the Northern Hemisphere. Glob. Change Biol. 2024, 30, e17468. [Google Scholar] [CrossRef] [Scilit] [PubMed]
- Dollinger, C.; Rammer, W.; Mori, A.S.; Turner, M.G.; Seidl, R. Disentangling Compound Effects of Changing Disturbance and Regeneration Across Temperate Forest Landscapes. Glob. Ecol. Biogeogr. 2025, 34, e70140. [Google Scholar] [CrossRef] [Scilit]
- Stanke, H.; Finley, A.O.; Domke, G.M.; Weed, A.S.; MacFarlane, D.W. Over half of western United States’ most abundant tree species in decline. Nat. Commun. 2021, 12, 451. [Google Scholar] [CrossRef] [Scilit] [PubMed]
- Bose, A.K.; Weiskittel, A.; Wagner, R.G.; Kuehne, C. Assessing the factors influencing natural regeneration patterns in the diverse, multi-cohort, and managed forests of Maine, USA. J. Veg. Sci. 2016, 27, 1140–1150. [Google Scholar] [CrossRef] [Scilit]
- Miller, K.M.; McGill, B.J. Compounding human stressors cause major regeneration debt in over half of eastern US forests. J. Appl. Ecol. 2019, 56, 1355–1366. [Google Scholar] [CrossRef] [Scilit]
- Vickers, L.A.; McWilliams, W.H.; Knapp, B.O.; D’Amato, A.W.; Dey, D.C.; Dickinson, Y.L.; Kabrick, J.M.; Kenefic, L.S.; Kern, C.C.; Larsen, D.R.; et al. Are Current Seedling Demographics Poised to Regenerate Northern US Forests? J. For. 2019, 117, 592–612. [Google Scholar] [CrossRef] [Scilit]
- Miller, K.M.; Perles, S.J.; Schmit, J.P.; Matthews, E.R.; Weed, A.S.; Comiskey, J.A.; Marshall, M.R.; Nelson, P.; Fisichelli, N.A. Overabundant deer and invasive plants drive widespread regeneration debt in eastern United States national parks. Ecol. Appl. 2023, 33, e2837. [Google Scholar] [CrossRef] [Scilit] [PubMed]
- Pausas, J.G.; Austin, M.P. Patterns of plant species richness in relation to different environments: An appraisal. J. Veg. Sci. 2001, 12, 153–166. [Google Scholar] [CrossRef] [Scilit]
- Qian, H.; Wiens, J.J.; Zhang, J.; Zhang, Y. Evolutionary and ecological causes of species richness patterns in North American angiosperm trees. Ecography 2015, 38, 241–250. [Google Scholar] [CrossRef] [Scilit]
- von Humboldt, A. Ansichten Der Natur, Mit Wisseschaftlichen Erlauterungen; J. G. Cotta: Stuttgart, Germany, 1877. [Google Scholar]
- Keil, P.; Chase, J.M. Global patterns and drivers of tree diversity integrated across a continuum of spatial grains. Nat. Ecol. Evol. 2019, 3, 390–399. [Google Scholar] [CrossRef] [Scilit] [PubMed]
- Dey, D.C.; Knapp, B.O.; Battaglia, M.A.; Deal, R.L.; Hart, J.L.; O’hAra, K.L.; Schweitzer, C.J.; Schuler, T.M. Barriers to natural regeneration in temperate forests across the USA. New For. 2019, 50, 11–40. [Google Scholar] [CrossRef] [Scilit]
- Crowther, T.W.; Glick, H.B.; Covey, K.R.; Bettigole, C.; Maynard, D.S.; Thomas, S.M.; Smith, J.R.; Hintler, G.; Duguid, M.C.; Amatulli, G.; et al. Mapping tree density at a global scale. Nature 2015, 525, 201–205. [Google Scholar] [CrossRef] [Scilit] [PubMed]
- Bose, A.K.; Weiskittel, A.; Wagner, R.G. A three decade assessment of climate-associated changes in forest composition across the north-eastern USA. J. Appl. Ecol. 2017, 54, 1592–1604. [Google Scholar] [CrossRef] [Scilit]
- Nowacki, G.J.; Abrams, M.D. The Demise of Fire and “Mesophication” of Forests in the Eastern United States. BioScience 2008, 58, 123–138. [Google Scholar] [CrossRef] [Scilit]
- Westerling, A.L. Increasing western US forest wildfire activity: Sensitivity to changes in the timing of spring. Philos. Trans. R. Soc. B Biol. Sci. 2016, 371, 20150178. [Google Scholar] [CrossRef] [Scilit] [PubMed]
- Cleland, D.T.; Freeouf, J.A.; Keys, J.E.; Nowacki, G.J.; Carpenter, C.A.; McNab, W.H. Ecological Subregions: Sections and Subsections for the Conterminous United States; General Technical Report WO-76D; U.S. Department of Agriculture, Forest Service: Washington, DC, USA, 2007.
- Dickmann, D.I.; Leefers, L.A. The Forests of Michigan; University of Michigan Press: Ann Arbor, MI, USA, 2016. [Google Scholar]
- Henry, C.R.; Walters, M.B. Tree species size class patterns portend compositional shifts and low resilience in managed northern hardwood forests. Ecosphere 2023, 14, e4621. [Google Scholar] [CrossRef] [Scilit]
- Henry, C.R.; Walters, M.B.; Finley, A.O.; Roloff, G.J.; Farinosi, E.J. Complex drivers of sugar maple (Acer saccharum) regeneration reveal challenges to long-term sustainability of managed northern hardwood forests. For. Ecol. Manag. 2021, 479, 118541. [Google Scholar] [CrossRef] [Scilit]
- Matonis, M.S.; Walters, M.B.; Millington, J.D.A. Gap-, stand-, and landscape-scale factors contribute to poor sugar maple regeneration after timber harvest. For. Ecol. Manag. 2011, 262, 286–298. [Google Scholar] [CrossRef] [Scilit]
- White, M.A. Long-term effects of deer browsing: Composition, structure and productivity in a northeastern Minnesota old-growth forest. For. Ecol. Manag. 2012, 269, 222–228. [Google Scholar] [CrossRef] [Scilit]
- Dey, D.C. Sustaining Oak Forests in Eastern North America: Regeneration and Recruitment, the Pillars of Sustainability. For. Sci. 2014, 60, 926–942. [Google Scholar] [CrossRef] [Scilit]
- Alverson, W.S.; Lea, M.V.; Waller, D.M. A 20-year experiment on the effects of deer and hare on eastern hemlock regeneration. Can. J. For. Res. 2019, 49, 1329–1338. [Google Scholar] [CrossRef] [Scilit]
- Alverson, W.S.; Riege, D.A.; Waller, D.M. Losing the slow race: How deer hinder growth, survival, and regeneration of juvenile hemlocks (Tsuga canadensis). For. Ecol. Manag. 2024, 553, 121466. [Google Scholar] [CrossRef] [Scilit]
- Walters, M.B.; Henry, C.R.; Farinosi, E.J.; Roloff, G.J.; Donovan, M.L.; Hartman, J.P. Sapling Stocking Targets for Multiple Management Goals in Northern Hardwood Forests: How Do Stands Measure Up? J. For. 2022, 120, 395–419. [Google Scholar] [CrossRef] [Scilit]
- Host, G.E.; Pregitzer, K.S. Geomorphic influences on ground-flora and overstory composition in upland forests of northwestern lower Michigan. Can. J. For. Res. 1992, 22, 1547–1555. [Google Scholar] [CrossRef] [Scilit]
- Burger, T.L.; Kotar, J. A Guide to Forest Communities and Habitat Types of Michigan; University of Wisconsin-Madison, Department of Forestry Ecology and Management: Madison, WI, USA, 2003. [Google Scholar]
- Henry, C.R. Pattern and Process of Tree Regeneration and Recruitment in Managed Northern Hardwood Forests; Michigan State University: East Lansing, MI, USA, 2022. [Google Scholar]
- Catovsky, S.; Bazzaz, F.A. Feedbacks between canopy composition and seedling regeneration in mixed conifer broad-leaved forests. Oikos 2002, 98, 403–420. [Google Scholar] [CrossRef] [Scilit]
- Cornwell, W.K.; Grubb, P.J. Regional and local patterns in plant species richness with respect to resource availability. Oikos 2003, 100, 417–428. [Google Scholar] [CrossRef] [Scilit]
- Cleland, D.T.; Crow, T.R.; Saunders, S.C.; Dickmann, D.I.; Maclean, A.L.; Jordan, J.K.; Watson, R.L.; Sloan, A.M.; Brosofske, K.D. Characterizing historical and modern fire regimes in Michigan (USA): A landscape ecosystem approach. Landsc. Ecol. 2004, 19, 311–325. [Google Scholar] [CrossRef] [Scilit]
- Schulte, L.A.; Mladenoff, D.J.; Crow, T.R.; Merrick, L.C.; Cleland, D.T. Homogenization of northern U.S. Great Lakes forests due to land use. Landsc. Ecol. 2007, 22, 1089–1103. [Google Scholar] [CrossRef] [Scilit]
- Hurtt, G.C.; Frolking, S.; Fearon, M.G.; Moore, B.; Shevliakova, E.; Malyshev, S.; Pacala, S.W.; Houghton, R.A. The underpinnings of land-use history: Three centuries of global gridded land-use transitions, wood-harvest activity, and resulting secondary lands. Glob. Change Biol. 2006, 12, 1208–1229. [Google Scholar] [CrossRef] [Scilit]
- Raymond, P.; Royo, A.A.; Prévost, M.; Dumais, D. Assessing the single-tree and small group selection cutting system as intermediate disturbance to promote regeneration and diversity in temperate mixedwood stands. For. Ecol. Manag. 2018, 430, 21–32. [Google Scholar] [CrossRef] [Scilit]
- Jaeger, R.; Delagrange, S.; Aubin, I.; Joanisse, G.; Raymond, P.; Rivest, D. Increasing the intensity of regeneration treatments decreased beta diversity of temperate hardwood forest understory 20 years after disturbance. Ann. For. Sci. 2022, 79, 39. [Google Scholar] [CrossRef] [Scilit]
- Côté, S.D.; Rooney, T.P.; Tremblay, J.-P.; Dussault, C.; Waller, D.M. Ecological Impacts of Deer Overabundance. Annu. Rev. Ecol. Evol. Syst. 2004, 35, 113–147. [Google Scholar] [CrossRef] [Scilit]
- Ramirez, J.I.; Jansen, P.A.; Poorter, L. Effects of wild ungulates on the regeneration, structure and functioning of temperate forests: A semi-quantitative review. For. Ecol. Manag. 2018, 424, 406–419. [Google Scholar] [CrossRef] [Scilit]
- Harris, L.B.; Pastore, M.A.; D’aMato, A.W. Effects of browsing by white-tailed deer on tree regeneration vary by ontogeny and palatability in forests of the northeastern USA. For. Ecol. Manag. 2025, 593, 122906. [Google Scholar] [CrossRef] [Scilit]
- Patton, S.R.; Russell, M.B.; Windmuller-Campione, M.A.; Frelich, L.E. White-tailed deer herbivory impacts on tree seedling and sapling abundance in the Lake States Region of the USA. Ann. For. Sci. 2021, 78, 91. [Google Scholar] [CrossRef] [Scilit]
- Royo, A.A.; Carson, W.P. On the formation of dense understory layers in forests worldwide: Consequences and implications for forest dynamics, biodiversity, and succession. Can. J. For. Res. 2006, 36, 1345–1362. [Google Scholar] [CrossRef] [Scilit]
- Lovett, G.M.; Weiss, M.; Liebhold, A.M.; Holmes, T.P.; Leung, B.; Lambert, K.F.; Orwig, D.A.; Campbell, F.T.; Rosenthal, J.; McCullough, D.G.; et al. Nonnative forest insects and pathogens in the United States: Impacts and policy options. Ecol. Appl. 2016, 26, 1437–1455. [Google Scholar] [CrossRef] [Scilit] [PubMed]
- Bechtold, W.A.; Patterson, P.L. The Enhanced Forest Inventory and Analysis Program–National Sampling Design and Estimation Procedures; USDA Forest Service, Southern Research Station: Asheville, NC, USA, 2005. [Google Scholar]
- Stanke, H.; Finley, A.O.; Weed, A.S.; Walters, B.F.; Domke, G.M. rFIA: An R package for estimation of forest attributes with the US Forest Inventory and Analysis database. Environ. Model. Softw. 2020, 127, 104664. [Google Scholar] [CrossRef] [Scilit]
- Moran, P.A.P. Notes on Continuous Stochastic Phenomena. Biometrika 1950, 37, 17. [Google Scholar] [CrossRef] [Scilit]
- Pebesma, E.J. Multivariable geostatistics in S: The gstat package. Comput. Geosci. 2004, 30, 683–691. [Google Scholar] [CrossRef] [Scilit]
- Hijmans, R.J.; Van Etten, J. raster: Geographic Analysis and Modeling with Raster Data, R Package Version 2.0-12; R Foundation: Vienna, Austria, 2012. [Google Scholar]
- Venables, W.N.; Ripley, B.D. Modern Applied Statistics with S; Springer Science & Business Media: Berlin/Heidelberg, Germany, 2013. [Google Scholar]
- Wood, S. mgcv: Mixed GAM Computation Vehicle with Automatic Smoothness Estimation, R Package Version 1.8; R Foundation: Vienna, Austria, 2022. [Google Scholar]
- Wood, S.; Scheipl, F. gamm4: Generalized Additive Mixed Models Using mgcv and lme4, R Package Version 0.1-6; R Foundation: Vienna, Austria, 2011. [Google Scholar]
- Gelman, A.; Hill, J. Data Analysis Using Regression and Multilevel/Hierarchical Models; Cambridge University Press: Cambridge, UK, 2007. [Google Scholar]
- Hartig, F. DHARMa: Residual Diagnostics for Hierarchical (Multi-Level/Mixed) Regression Models, R Package Version 0.4.6; R Foundation: Vienna, Austria, 2022. [Google Scholar]
- Lenth, R.V. emmeans: Estimated Marginal Means, Aka Least-Squares Means, R Package Version 1.5.2-1; R Foundation: Vienna, Austria, 2020. [Google Scholar]
- Schaetzl, R.J.; Krist, F.J.; Stanley, K.; Hupy, C.M. The Natural Soil Drainage Index: An Ordinal Estimate of Long-Term Soil Wetness. Phys. Geogr. 2009, 30, 383–409. [Google Scholar] [CrossRef] [Scilit]
- Beaudette, D.; Skovlin, J.; Roecker, S.; Brown, A. soilDB: Soil Database Interface, R Package Version 2.6.10; R Foundation: Vienna, Austria, 2021. [Google Scholar]
- Shannon, C.E. A mathematical theory of communication. Bell Syst. Tech. J. 1948, 27, 379–423. [Google Scholar] [CrossRef] [Scilit]
- Mollie, E.B.; Kristensen, K.; Koen, J.; Magnusson, A.; Casper, W.B.; Nielsen, A.; Hans, J.S.; Mächler, M.; Benjamin, M.B. glmmTMB Balances Speed and Flexibility Among Packages for Zero-inflated Generalized Linear Mixed Modeling. R J. 2017, 9, 378–400. [Google Scholar] [CrossRef] [Scilit]
- Tinya, F.; Márialigeti, S.; Bidló, A.; Ódor, P. Environmental drivers of the forest regeneration in temperate mixed forests. For. Ecol. Manag. 2019, 433, 720–728. [Google Scholar] [CrossRef] [Scilit]
- Springer, A.; Dech, J.P. Regeneration of black ash (Fraxinus nigra Marsh.) in hardwood swamps of the Great Lakes—St. Lawrence Forest Region. For. Chron. 2021, 97, 343–358. [Google Scholar] [CrossRef] [Scilit]
- Ampoorter, E.; Baeten, L.; Vanhellemont, M.; Bruelheide, H.; Scherer-Lorenzen, M.; Baasch, A.; Erfmeier, A.; Hock, M.; Verheyen, K. Disentangling tree species identity and richness effects on the herb layer: First results from a German tree diversity experiment. J. Veg. Sci. 2015, 26, 742–755. [Google Scholar] [CrossRef] [Scilit]
- Valladares, F.; Niinemets, Ü. Shade Tolerance, a Key Plant Feature of Complex Nature and Consequences. Annu. Rev. Ecol. Evol. Syst. 2008, 39, 237–257. [Google Scholar] [CrossRef] [Scilit]
- Walters, M.B.; Farinosi, E.J.; Willis, J.L.; Gottschalk, K.W. Managing for diversity: Harvest gap size drives complex light, vegetation, and deer herbivory impacts on tree seedlings. Ecosphere 2016, 7, e01397. [Google Scholar] [CrossRef] [Scilit]
- Swanston, C.; Brandt, L.A.; Janowiak, M.K.; Handler, S.D.; Butler-Leopold, P.; Iverson, L.; Thompson, F.R., III; Ontl, T.A.; Shannon, P.D. Vulnerability of forests of the Midwest and Northeast United States to climate change. Clim. Change 2018, 146, 103–116. [Google Scholar] [CrossRef] [Scilit]

Disclaimer/Publisher’s Note: The statements, opinions and data contained in all publications are solely those of the individual author(s) and contributor(s) and not of MDPI and/or the editor(s). MDPI and/or the editor(s) disclaim responsibility for any injury to people or property resulting from any ideas, methods, instructions or products referred to in the content. |
© 2026 by the authors. Licensee MDPI, Basel, Switzerland. This article is an open access article distributed under the terms and conditions of the Creative Commons Attribution (CC BY) license.