1. Introduction
Land-use change is one of the main drivers of biodiversity loss and ecosystem transformation worldwide [
1]. The conversion of native forests into agricultural systems alters both aboveground and belowground communities, affecting ecosystem processes that are essential for long-term sustainability [
2]. Among terrestrial ecosystems, forests represent important reservoirs of biodiversity, and soil plays a central role by supporting biological activity, nutrient cycling, and ecosystem functioning [
3]. Consequently, soil microbial communities have become a priority in ecosystem monitoring because of their fundamental contribution to biogeochemical processes and their sensitivity to environmental disturbances [
4].
Human activities have increasingly modified soil biological activity through the expansion of agricultural systems, generating significant impacts on vegetation and ecosystem functioning [
5,
6,
7,
8]. In Mexico, the conversion of forested areas into coffee plantations represents one of the most important land-use changes in mountainous regions, with potential consequences for soil microbial communities and nutrient dynamics [
9]. These transformations influence biogeochemical cycles, alter microbial community composition, and may affect soil health and ecosystem stability [
9,
10,
11].
Previous studies have shown that forest conversion to agricultural systems can modify the abundance and diversity of soil microorganisms [
10]. However, despite increasing evidence regarding the effects of land-use change on vegetation and fauna, the responses of soil microbial communities and their predicted functional potential remain insufficiently understood, particularly in coffee production systems [
12].
Pine–oak forests are among the most representative forest ecosystems in Mexico and support a high diversity of organisms across multiple trophic levels. In many mountainous regions, including the Sierra Norte de Puebla, portions of these forests have been transformed into agricultural production systems, particularly coffee plantations. Such transitions modify vegetation cover, nutrient dynamics, and soil environmental conditions, potentially influencing the composition and functioning of soil microbial communities [
13].
Microbial abundance and diversity provide valuable information regarding biological activity and ecosystem complexity [
6,
7,
8,
9,
10,
11,
12,
13]. Furthermore, microbial communities are associated with the capacity of ecosystems to maintain ecological processes and respond to environmental disturbances [
4,
5,
6,
7]. In recent years, next-generation sequencing (NGS) technologies have been widely adopted to obtain comprehensive information on microbial communities, including non-cultivable microorganisms that represent the majority of environmental diversity [
13]. These DNA-based approaches generate datasets that describe the taxonomic composition and functional potential of ecological communities, allowing a more complete assessment of ecosystem responses to land-use change.
We hypothesized that the conversion of pine–oak forest to coffee cultivation would be associated with differences in soil microbial abundance, taxonomic composition, and soil fertility, whereas broadly predicted functional profiles would remain largely comparable, consistent with the concept of functional redundancy described for soil microbiomes.
Accordingly, the objective of this study was to compare soil microbial abundance, diversity, community composition, predicted functional potential, and soil fertility between adjacent pine–oak forest and coffee plantation sites in the Sierra Norte de Puebla, Mexico. By combining conventional microbiological analyses, soil fertility assessments, and metagenomic sequencing, this study aimed to improve understanding of how differences in land use are associated with belowground biodiversity and predicted microbial functional profiles in forest landscapes. These findings may contribute to the early identification of soil characteristics associated with different land-use conditions and support the development of more sustainable coffee management strategies.
2. Materials and Methods
2.1. Study Area
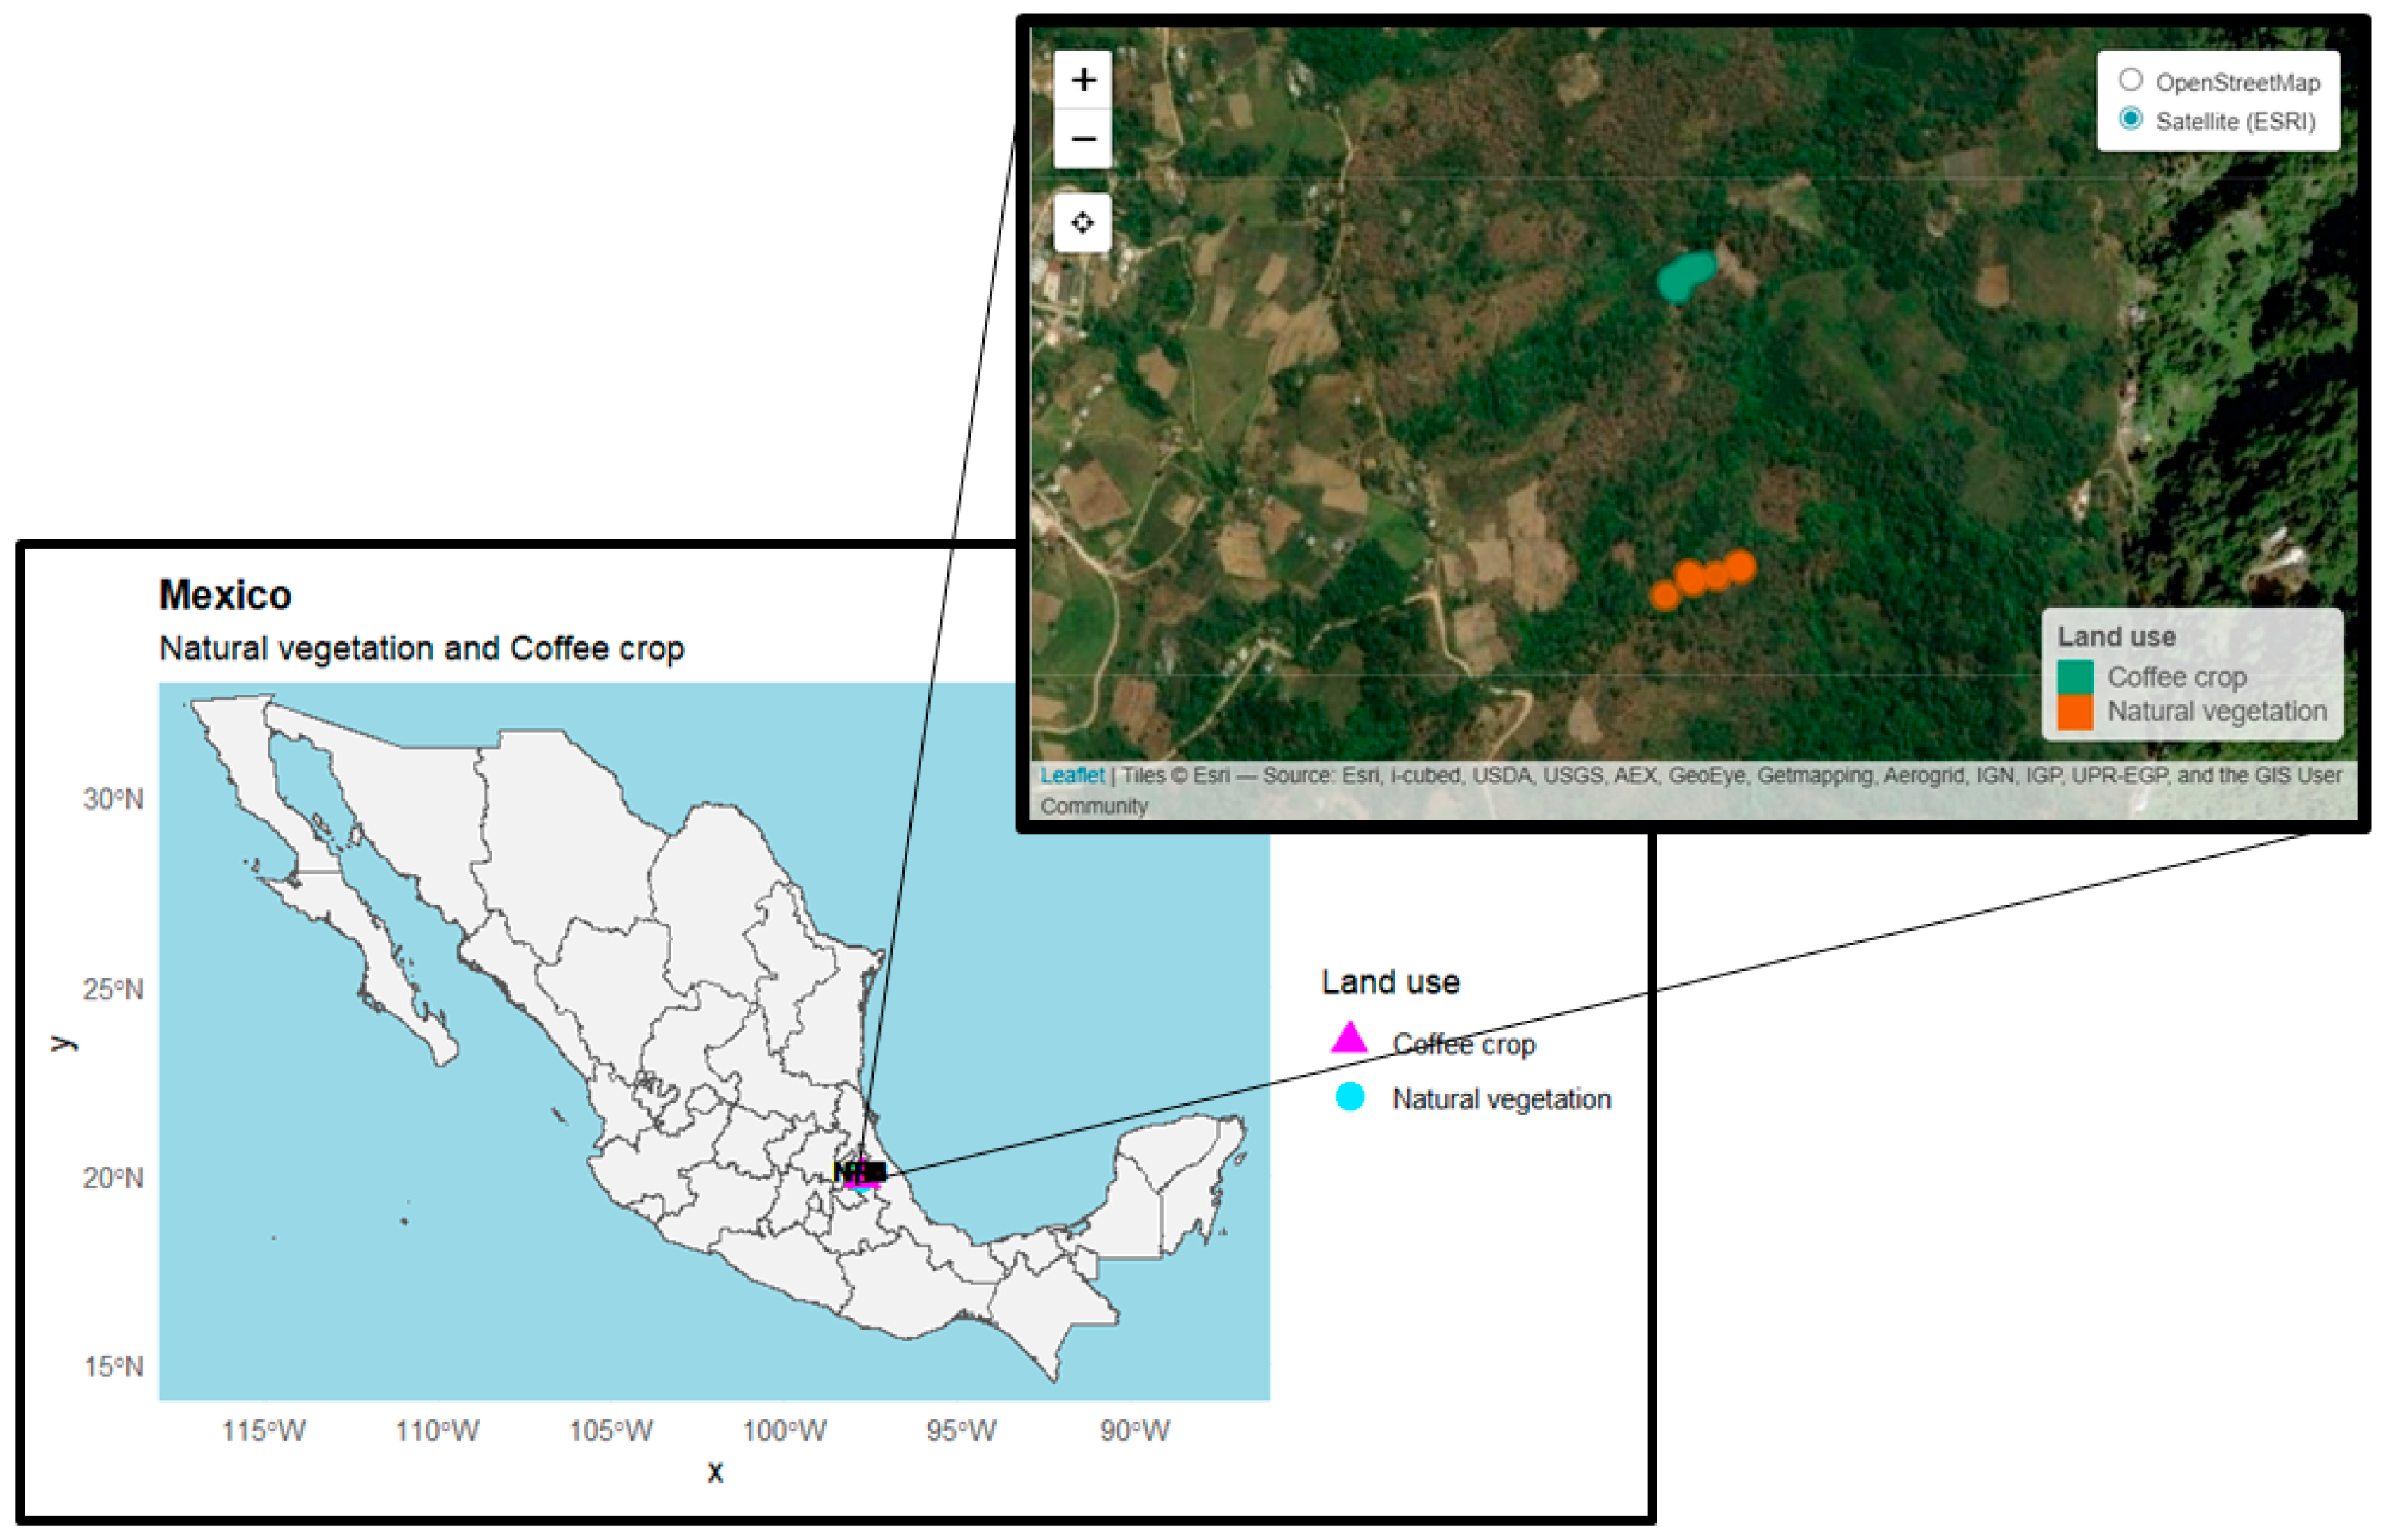
The study was conducted in the municipality of San Esteban Cuautempan, locality of Tlapacholoya, located in the Sierra Norte de Puebla, Mexico (
Figure 1). According to the CONABIO edaphological map (eda251mgw), both the pine–oak forest and coffee plantation sampling sites are located on the same soil mapping unit, classified as an Orthic Luvisol with a fine-textured profile and a deep lithic phase. Since the coffee plantation was established following the conversion of the adjacent pine–oak forest, both sites share the same soil type, thereby minimizing edaphic variability and allowing comparisons to primarily reflect the effects of land-use change.
This region forms part of the Sierra Madre Oriental and is characterized by the presence of several vegetation types, including oak forest, oak–pine forest, pine forest, pine–oak forest, and montane cloud forest [
14]. The forest sampling site corresponded to a pine–oak forest representative of the temperate vegetation present in the region.
In recent decades, portions of these forests have been transformed into agricultural production systems, including coffee plantations, resulting in changes in vegetation cover and land use. Two adjacent sites representing contrasting land-use conditions were selected using Geographic Information System (GIS) tools. The first site corresponded to a pine–oak forest considered natural vegetation, where six soil samples were collected following a zigzag sampling pattern to adequately represent the spatial variability associated with the irregular topography of the site. The second site corresponded to a coffee plantation established after the removal of the original vegetation, where six soil samples were collected using a random sampling approach distributed across the upper, middle, and lower portions of the slope. Sampling locations were selected according to terrain accessibility while maintaining representative spatial coverage of the plantation. The plantation, cultivated with a mixture of
Coffea arabica cvs. Caturra, Bourbon, Garnica, Oro Azteca, and Criollo, was established three years prior to sampling. The coffee plantation was managed using local agricultural practices, including manual tillage with hand tools. As part of the routine annual fertilization program, each coffee plant received approximately 140 g of urea together with a balanced NPK (18-18-18) fertilizer applied once per year. Weed control was performed manually without the use of herbicides, and no pesticides were applied during the study period. Pruning was limited to the periodic removal of old or damaged branches. This study design allowed the comparison of soil microbial communities and soil fertility between the two land-use systems. The coordinates of the sampling points are listed in
Table 1.
Each soil sample was collected from the 0–30 cm soil profile using a soil auger. This depth was selected to represent the surface soil, where microbial communities are strongly influenced by vegetation, root activity, and land-use management practices. Soil samples were collected directly from the field under their natural moisture conditions before midday. Samples were placed in hermetically sealed plastic bags and transported in a cooler containing reusable ice packs for approximately 5 h. Upon arrival at the laboratory, the samples were stored at 4 °C and processed the following day to preserve their physicochemical and microbiological integrity [
15].
From each land-use system, six individual soil samples were collected. These samples were used differently depending on the subsequent analyses. Conventional microbiological analyses were performed using independent biological samples, whereas metagenomic sequencing and soil fertility analyses were conducted using one composite sample prepared by homogenizing the six individual samples collected from each site.
2.2. Determination of Microbial Content
To evaluate cultivable microbial populations, microbial abundance was determined using the viable count method with serial decimal dilutions. Conventional microbiological analyses were performed using three independent biological replicates collected within each land-use system. Selective culture media were used according to the target microorganisms: nutrient agar for bacteria, Czapek agar for actinobacteria, and potato dextrose agar (PDA) supplemented with Bengal pink for fungi and yeasts [
16].
For each biological replicate, soil suspensions were serially diluted to 10−5 for bacteria and actinobacteria and 10−3 for fungi and yeasts. Subsequently, 100 µL of the appropriate dilution was spread onto five technical replicate Petri dishes containing the corresponding selective medium using a Drigalski spatula. The inoculated plates were incubated at 27 °C for 72 h, after which visible colony-forming units (CFUs) were counted. Colony counts from the five technical replicate plates were averaged to obtain a single value for each biological replicate. Microbial abundance was expressed as log10 CFU g−1 of fresh soil. Microbial counts were log10-transformed prior to statistical analysis to satisfy ANOVA assumptions, and comparisons between land-use systems were performed separately for each microbial group using the biological replicates as the experimental units.
2.3. Metagenomic Analysis
For the metagenomic analysis, the six individual soil samples collected from each land-use system were thoroughly homogenized in a sterile container for approximately 30 min to produce a single composite sample representative of each site. This approach was adopted to obtain a representative sample of each land-use system by minimizing local spatial heterogeneity among sampling points.
After homogenization, sterile aluminum straws were inserted into each composite sample to collect approximately 250 mg of soil, which was transferred into sterile 2 mL microcentrifuge tubes. Subsequently, 200 µL of DNA/RNA Shield™ (Zymo Research, Orange, CA, USA) was added to each tube [
17]. The tubes containing the soil samples were maintained at room temperature until DNA extraction.
DNA extraction was performed using the E.Z.N.A.® Soil DNA Kit (Omega Bio-Tek, Norcross, GA, USA) following the manufacturer’s instructions. DNA concentration was quantified using a Qubit® fluorometer with the DNA BR® Assay Kit (Thermo Fisher Scientific, Austin, TX, USA). The quality of the extracted DNA was verified by BGI Hong Kong Tech Solution NGS Lab before library preparation and sequencing using the DNBseq platform.
Accordingly, the metagenomic data were interpreted as representative of each studied land-use system and were used to describe differences in taxonomic composition and predicted functional potential between the two sites. Because metagenomic sequencing was performed on one composite sample per land-use system, these results were interpreted descriptively and not used to support statistical inference at the metagenomic level.
2.4. Analysis Using MG-RAST
Sequence visualization and initial quality assessment were performed using FastQC version 0.11.9. Subsequently, the paired-end sequence files generated by the DNBseq platform were uploaded to the MG-RAST server (version 4.0.3) for downstream analyses [
18]. Because the sequencing provider had already performed the primary quality filtering, MG-RAST applied an additional quality control step prior to taxonomic and functional annotation. Taxonomic assignments were performed against the RefSeq database using the representative hit option with a minimum identity threshold of 60%, a minimum alignment length of 15, and an e-value cutoff of 1 × 10
−5. Functional annotation was subsequently conducted using the COG and KEGG databases available within the MG-RAST platform, and comparative analyses were performed using the corresponding visualization and statistical tools.
2.5. Taxonomic and Abundance Analysis
After sequence pairing and removal of human genome sequences, reads were taxonomically classified using the RefSeq database at the domain, phylum, class, order, and family levels [
19]. Taxonomic profiles highlighting bacteria, eukaryotes, archaea, and viruses were generated. The Krona extension was used to visualize the genera present in each sample [
20].
2.6. Metabolic Profile and Metabolic Pathway Analysis
For metabolic profiling, Clusters of Orthologous Groups (COG), KEGG Orthology (KO), non-supervised orthologous groups (NOG), and subsystem databases were used to generate pie charts and heatmaps. COG was used to categorize genes according to broad functional roles and evolutionary relationships. KEGG Orthology was employed to associate genes with specific metabolic pathways, while NOG provided broader functional annotation of homologous sequences.
To construct integrated molecular interaction networks and compare homologous sequences, the Cytoscape extension was employed and enriched with information obtained from the COG, KO, and NOG databases [
21].
Subsystems and KEGG Orthology (KO) annotations were subsequently used to characterize predicted metabolic pathways. The KEGG Mapper extension was employed to illustrate metabolic functions associated with each land-use condition [
22].
The information above was used to obtain the correlation analysis of organism families using Plotly.js (version 2.13.3).
2.7. Subsystem and Server-Based Bioinformatic Analysis
Sample reads were uploaded to the MG-RAST server for gene prediction and functional annotation. Subsystem-based classifications were visualized using Krona within the MG-RAST platform [
23].
Sequence data were further analyzed under Ubuntu 20.04 using terminal-based bioinformatic workflows. Quality assessment was performed using FastQC version 0.11.9 [
24]. Metagenome assembly was conducted using MEGAHIT version 1.2.9 with the parameters –min-contig-len 1000 and –presets meta-large. Taxonomic annotation was performed using Kraken2 version 2.1.2 with the Standard and PlusPF-16 databases [
25,
26]. Read abundance estimation was carried out using Bracken with the Standard and Plus databases [
27].
The resulting datasets were visualized using Microsoft Excel, Rstudio version 4.2.1, and Python version 3.11.0 with the Plotly.js package version 2.13.3.
2.8. Soil Fertility Evaluation
Soil fertility parameters were evaluated to determine whether land-use change was associated with alterations in nutrient availability and soil chemical properties. Composite soil samples from each land-use condition were prepared by homogenizing the six sampling points collected within each site. A total of 300 g of soil from each composite sample was air-dried, homogenized, and sieved through a 2 mm mesh prior to analysis. Each composite sample was analyzed in triplicate, and the values presented in
Table 2 correspond to the mean of the three analytical determinations. Because soil fertility analyses were performed on one composite sample per land-use system, the results are presented as descriptive values representative of each site rather than as biological replicates suitable for inferential statistical comparisons.
Nitrate (NO3−) and ammonium (NH4+) concentrations were determined by steam distillation using a FOSS Kjeltec™ 8400 Analyzer. Available phosphorus (P) was quantified using the Olsen method based on the molybdenum blue colorimetric reaction, and absorbance was measured with a Shimadzu UV-1900 UV–Vis spectrophotometer. Total nitrogen (Nt) was determined by the Kjeldahl method using a FOSS Kjeltec™ 8400 Analyzer following acid digestion, steam distillation, and titration.
Exchangeable calcium (Ca), magnesium (Mg), iron (Fe), copper (Cu), manganese (Mn), and zinc (Zn) were quantified using a PerkinElmer PinAAcle 900T Atomic Absorption Spectrophotometer, whereas potassium (K) and sodium (Na) were measured by atomic emission spectrometry. Boron (B) concentration was determined using the Azomethine-H method using the Shimadzu UV-1900 UV–Vis spectrophotometer [
28].
3. Results
3.1. Microbiological Study
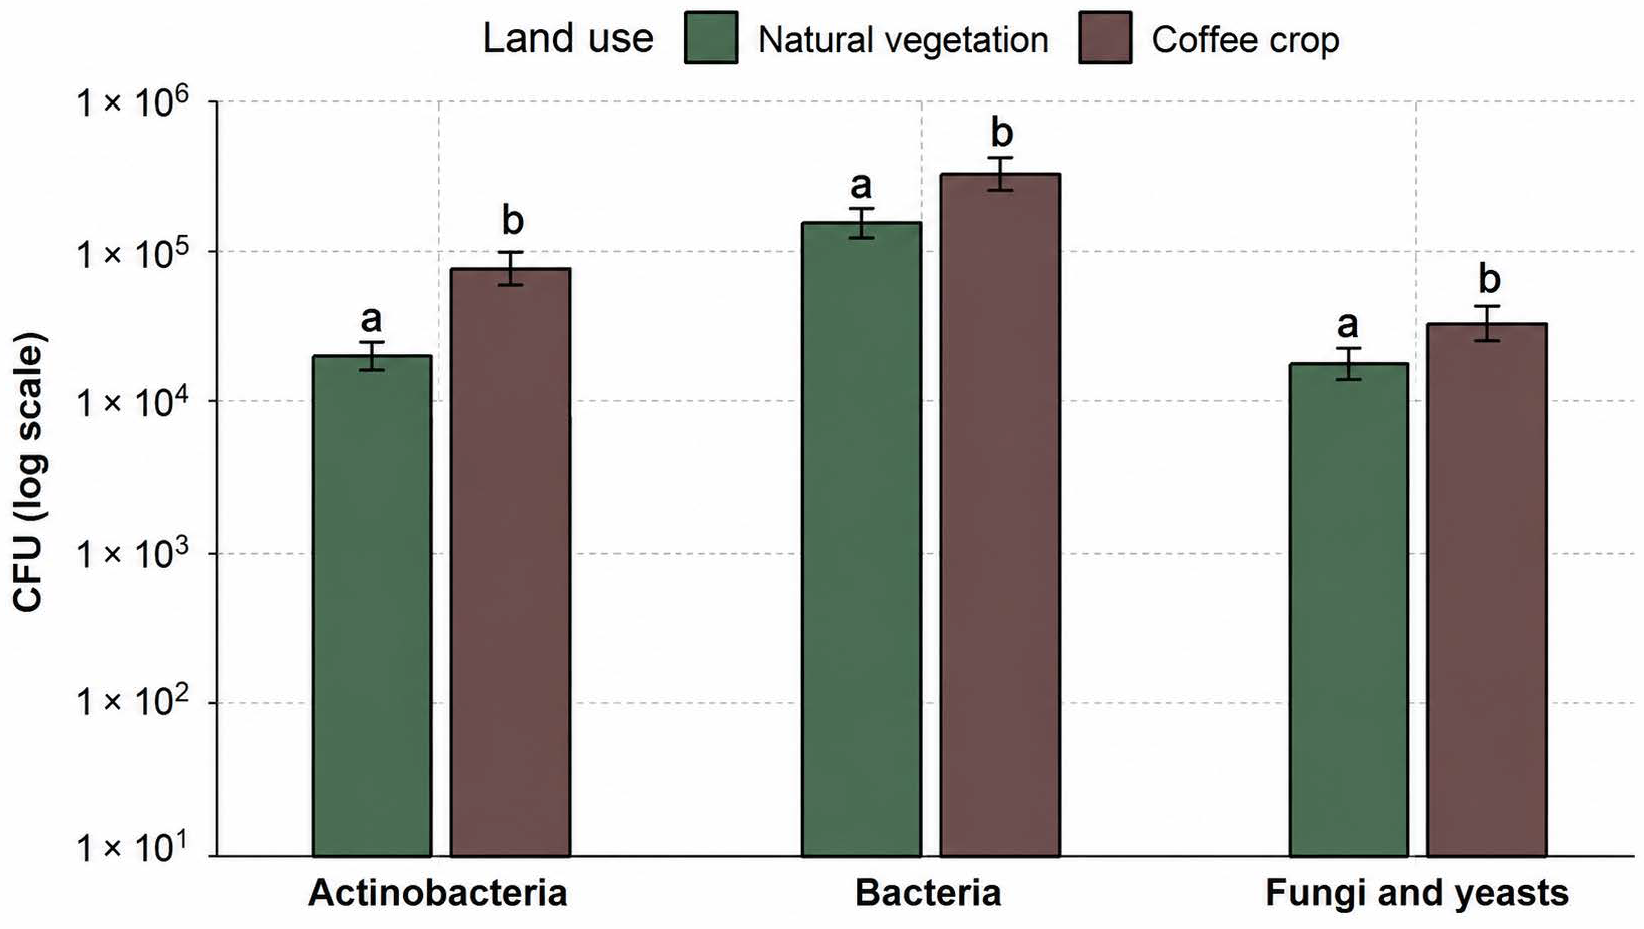
According to the results, the abundance of cultivable microorganisms was consistently higher in the disturbed condition corresponding to the coffee plantation (
Figure 2). In both land-use systems, bacterial populations predominated, followed by actinobacteria and fungi–yeasts. Statistical analyses of the conventional microbiological counts revealed significantly greater abundances of cultivable bacteria, actinobacteria, and fungi–yeasts in coffee plantation soils than in pine–oak forest soils (
p < 0.05). Overall, the highest cultivable microbial abundances were observed in the coffee plantation condition (
Figure 2).
3.2. Metagenomic Study
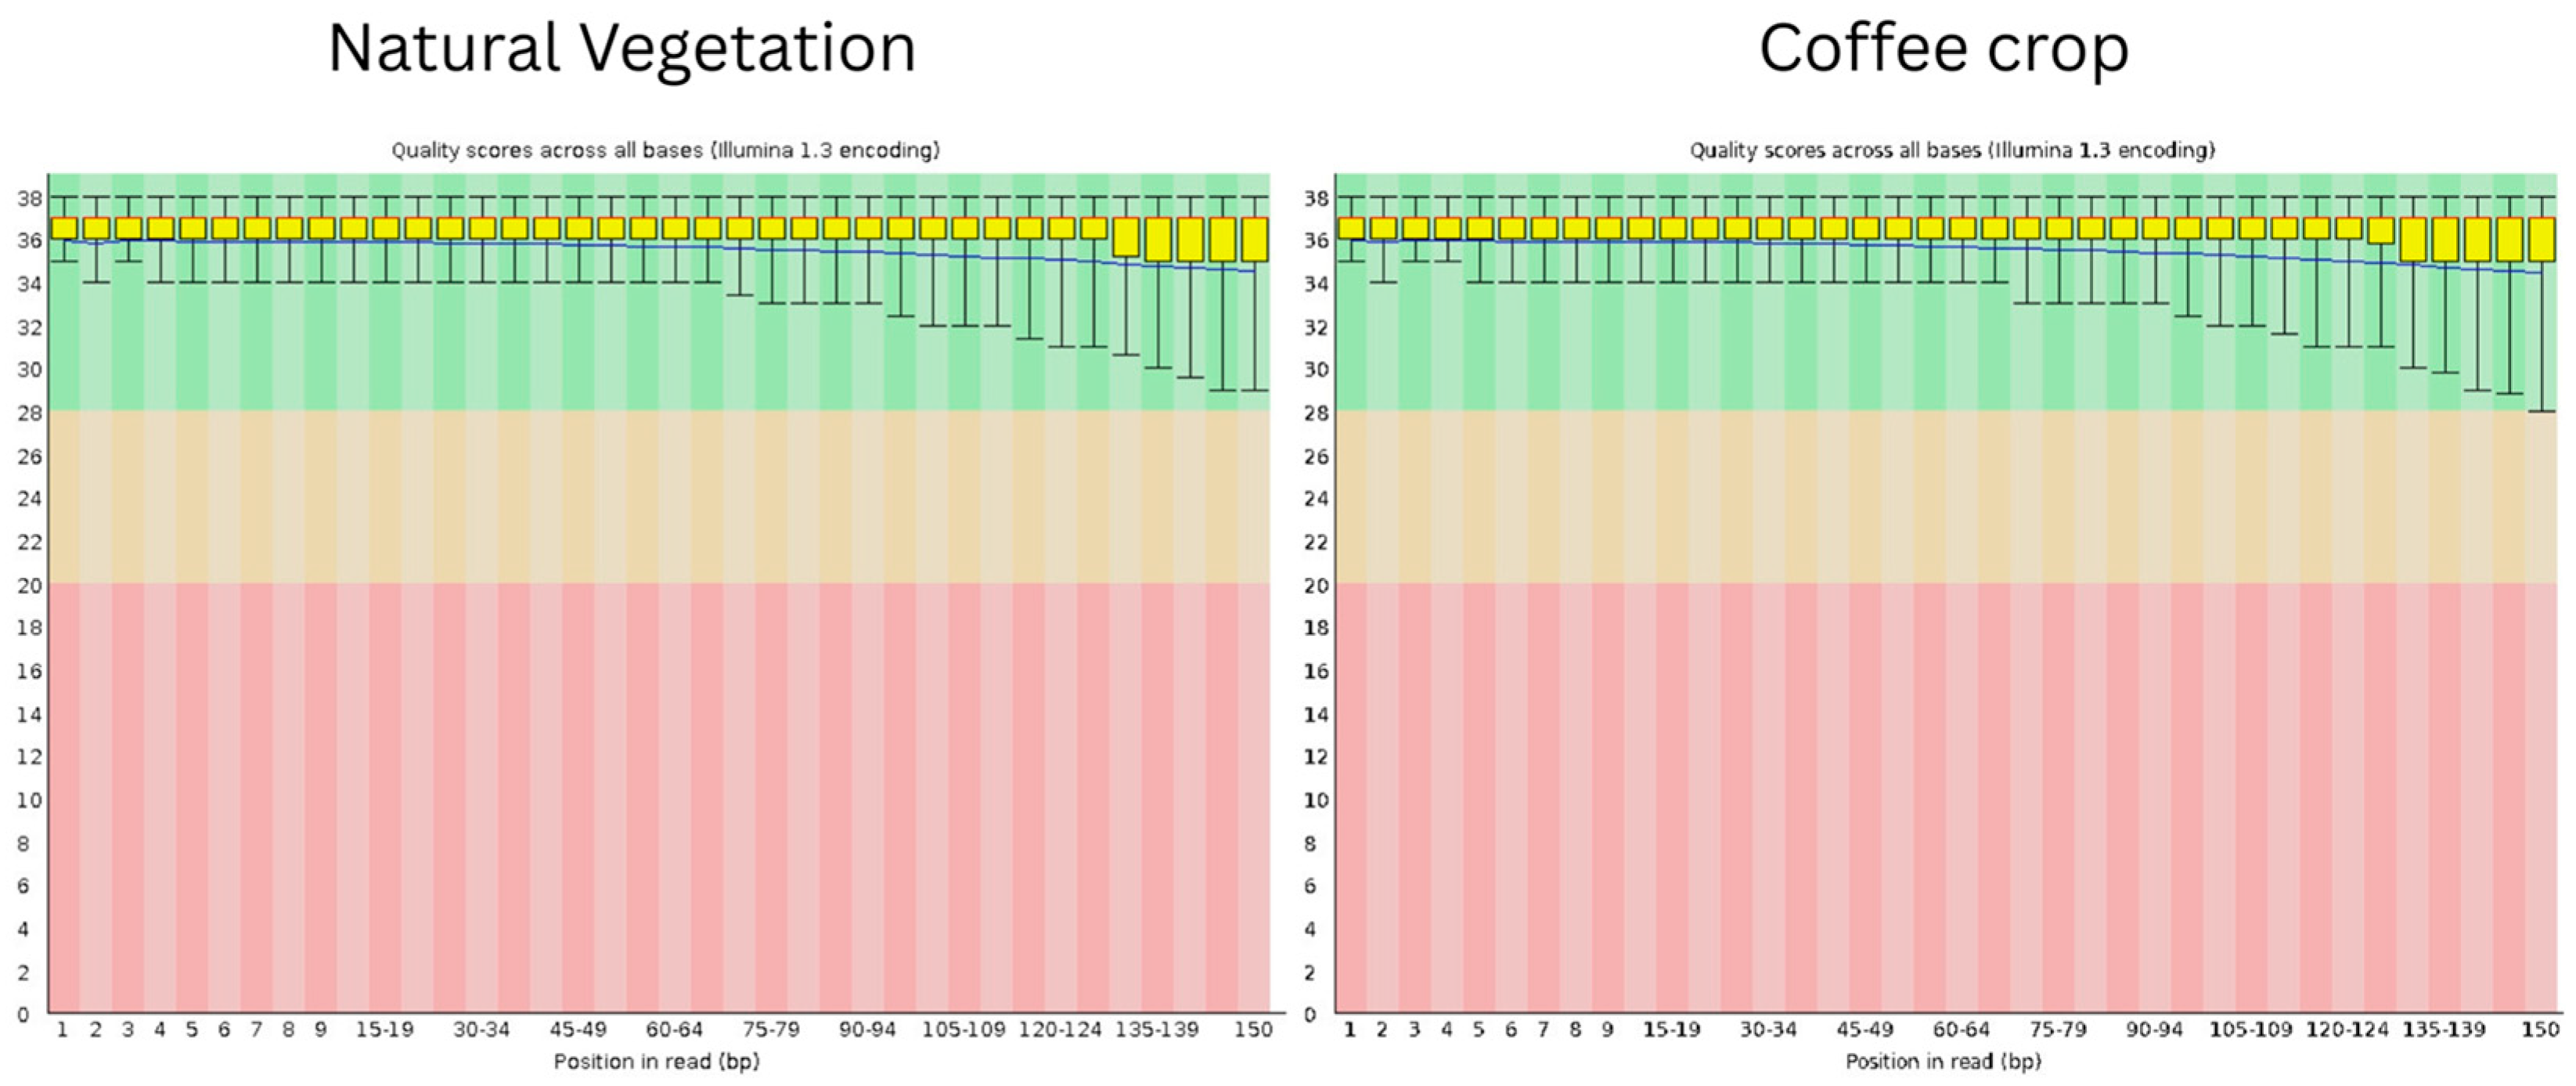
Quality assessment using FastQC indicated that the obtained sequences exhibited high overall quality, with Phred scores consistently above 30 (Q30; error probability ≤ 0.001 [
29] across most base positions for both land-use systems (
Figure 3)). A slight decrease in quality was observed toward the 3′ end of the reads; however, quality values remained within the high-quality range, indicating reliable sequencing output.
Both land-use systems exhibited consistently high sequencing quality throughout the reads (approximately Q35–38), indicating low sequencing error rates. In both samples, a slight decline in quality was observed toward the end of the reads, which was more pronounced in the coffee plantation sample and is characteristic of high-throughput sequencing datasets.
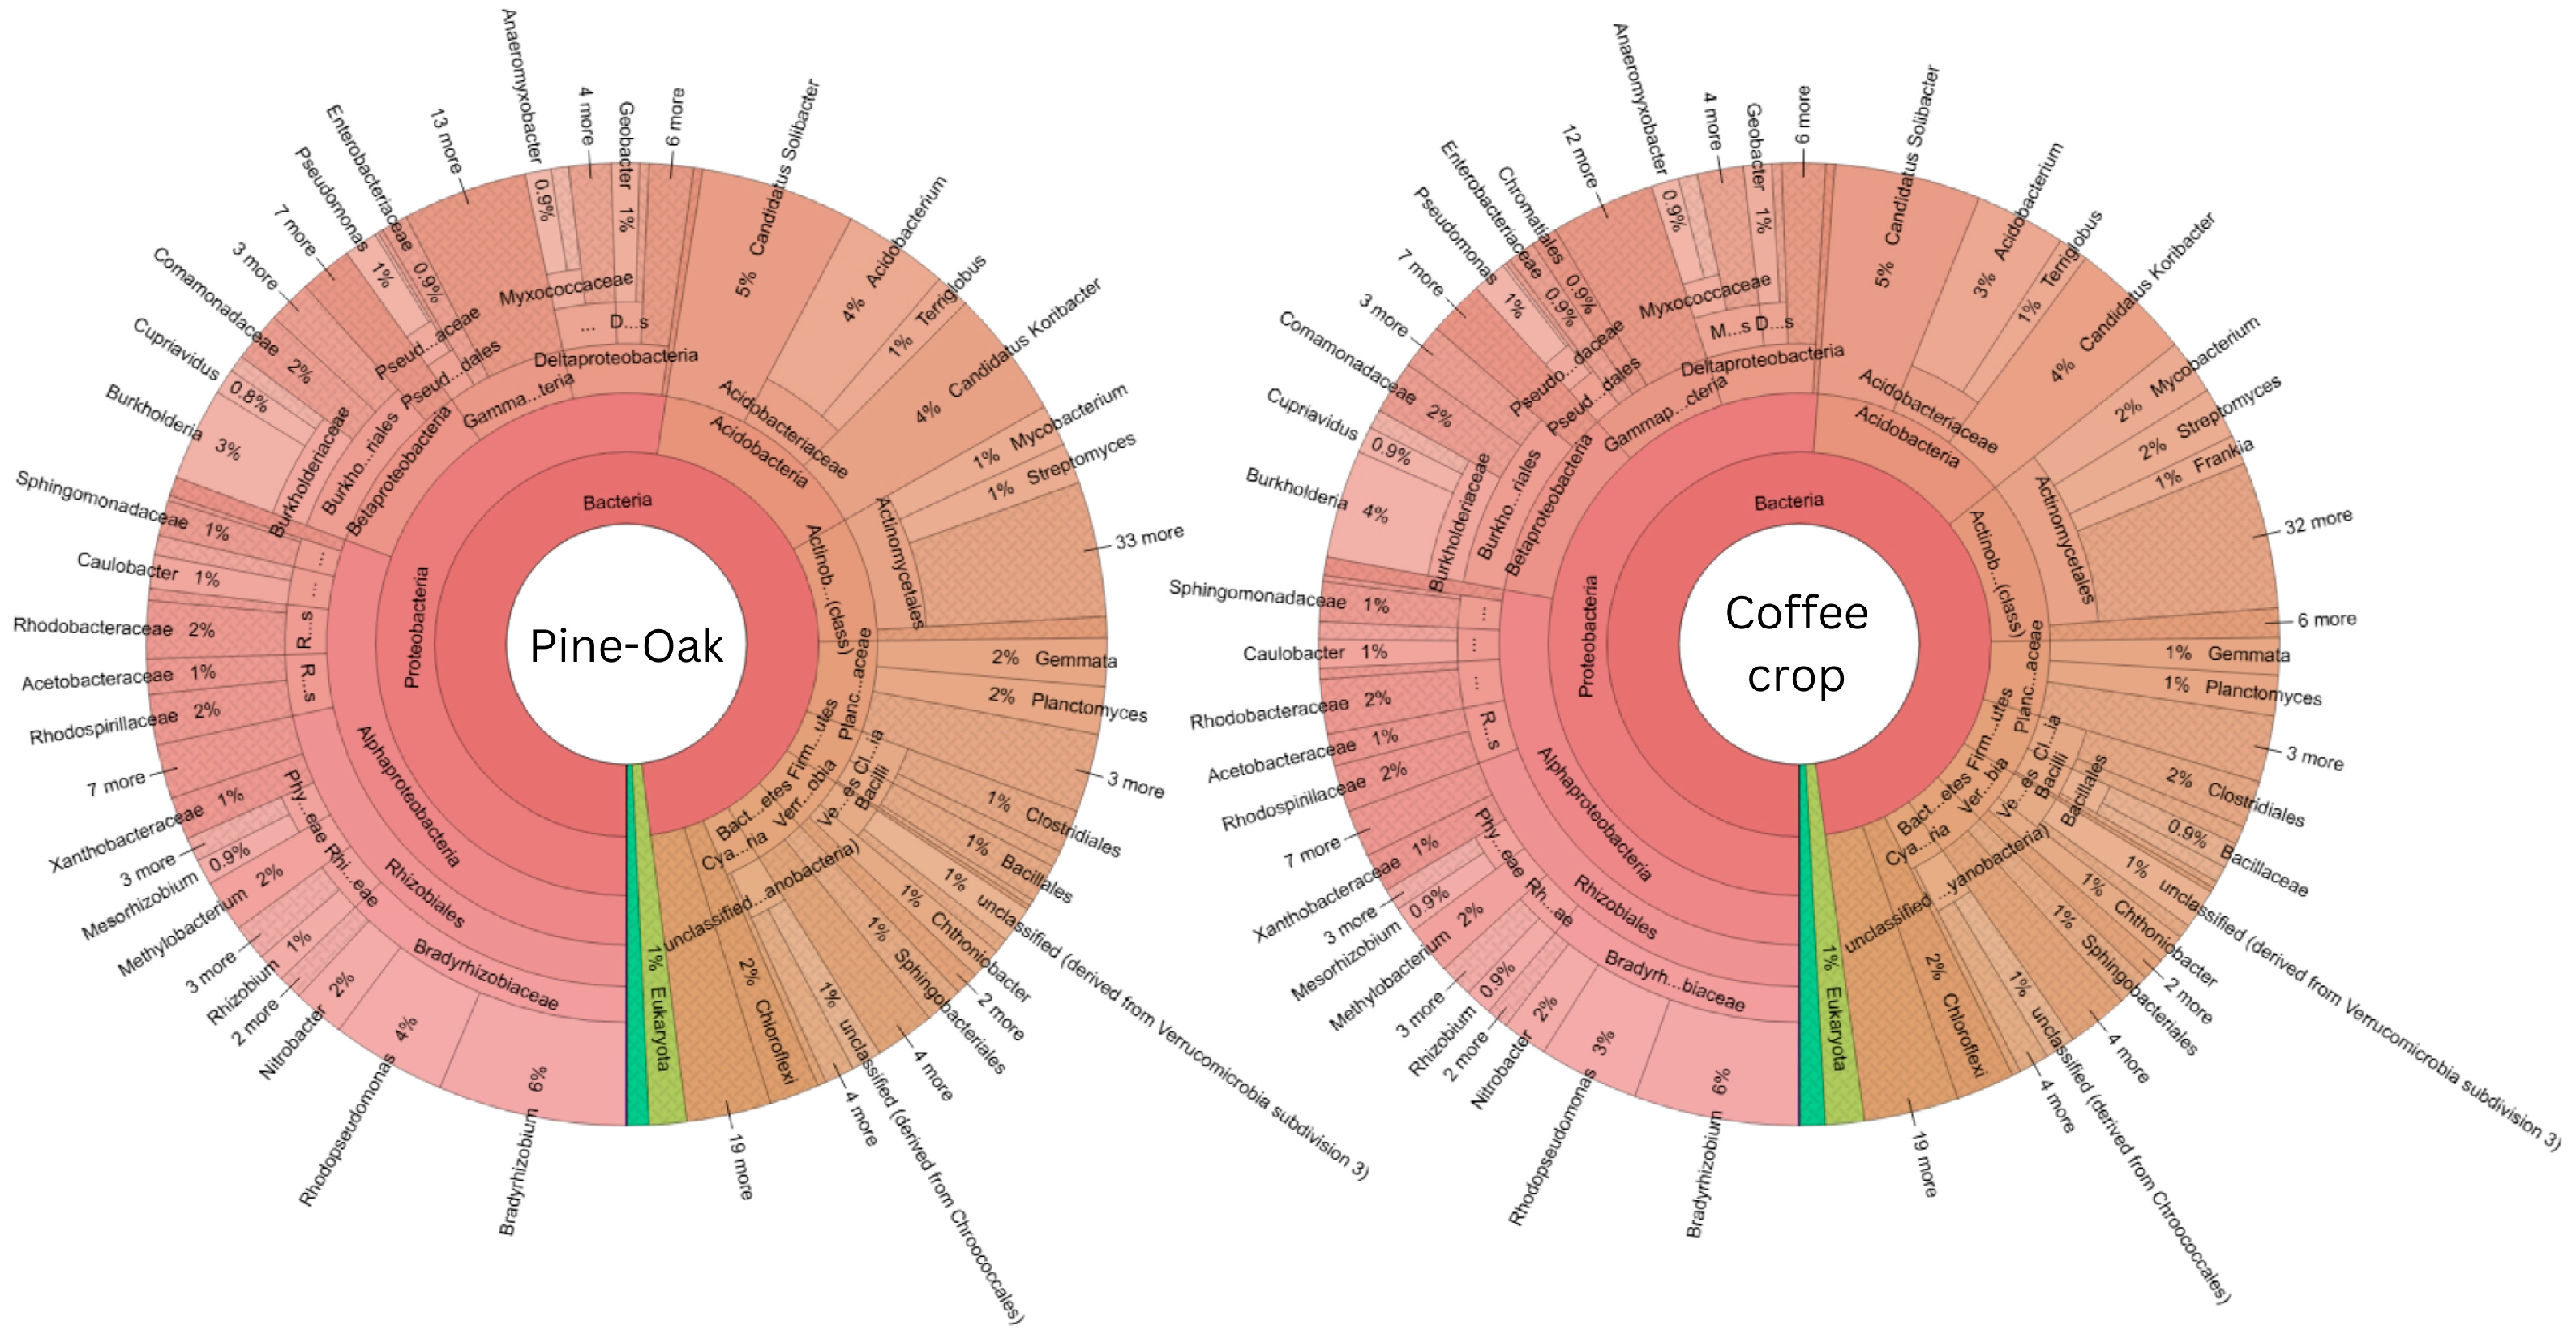
Global abundance analysis revealed a total of 22,781,738 sequences for the pine–oak forest soil and 22,632,699 sequences for the coffee plantation soil (
Figure 4).
Figure 4.
Hierarchical taxonomic profiles of soil microbial communities from pine–oak forest and coffee plantation sites derived from metagenomic sequencing.
Figure 4.
Hierarchical taxonomic profiles of soil microbial communities from pine–oak forest and coffee plantation sites derived from metagenomic sequencing.
3.2.1. Alpha Diversity and Rarefaction Analysis
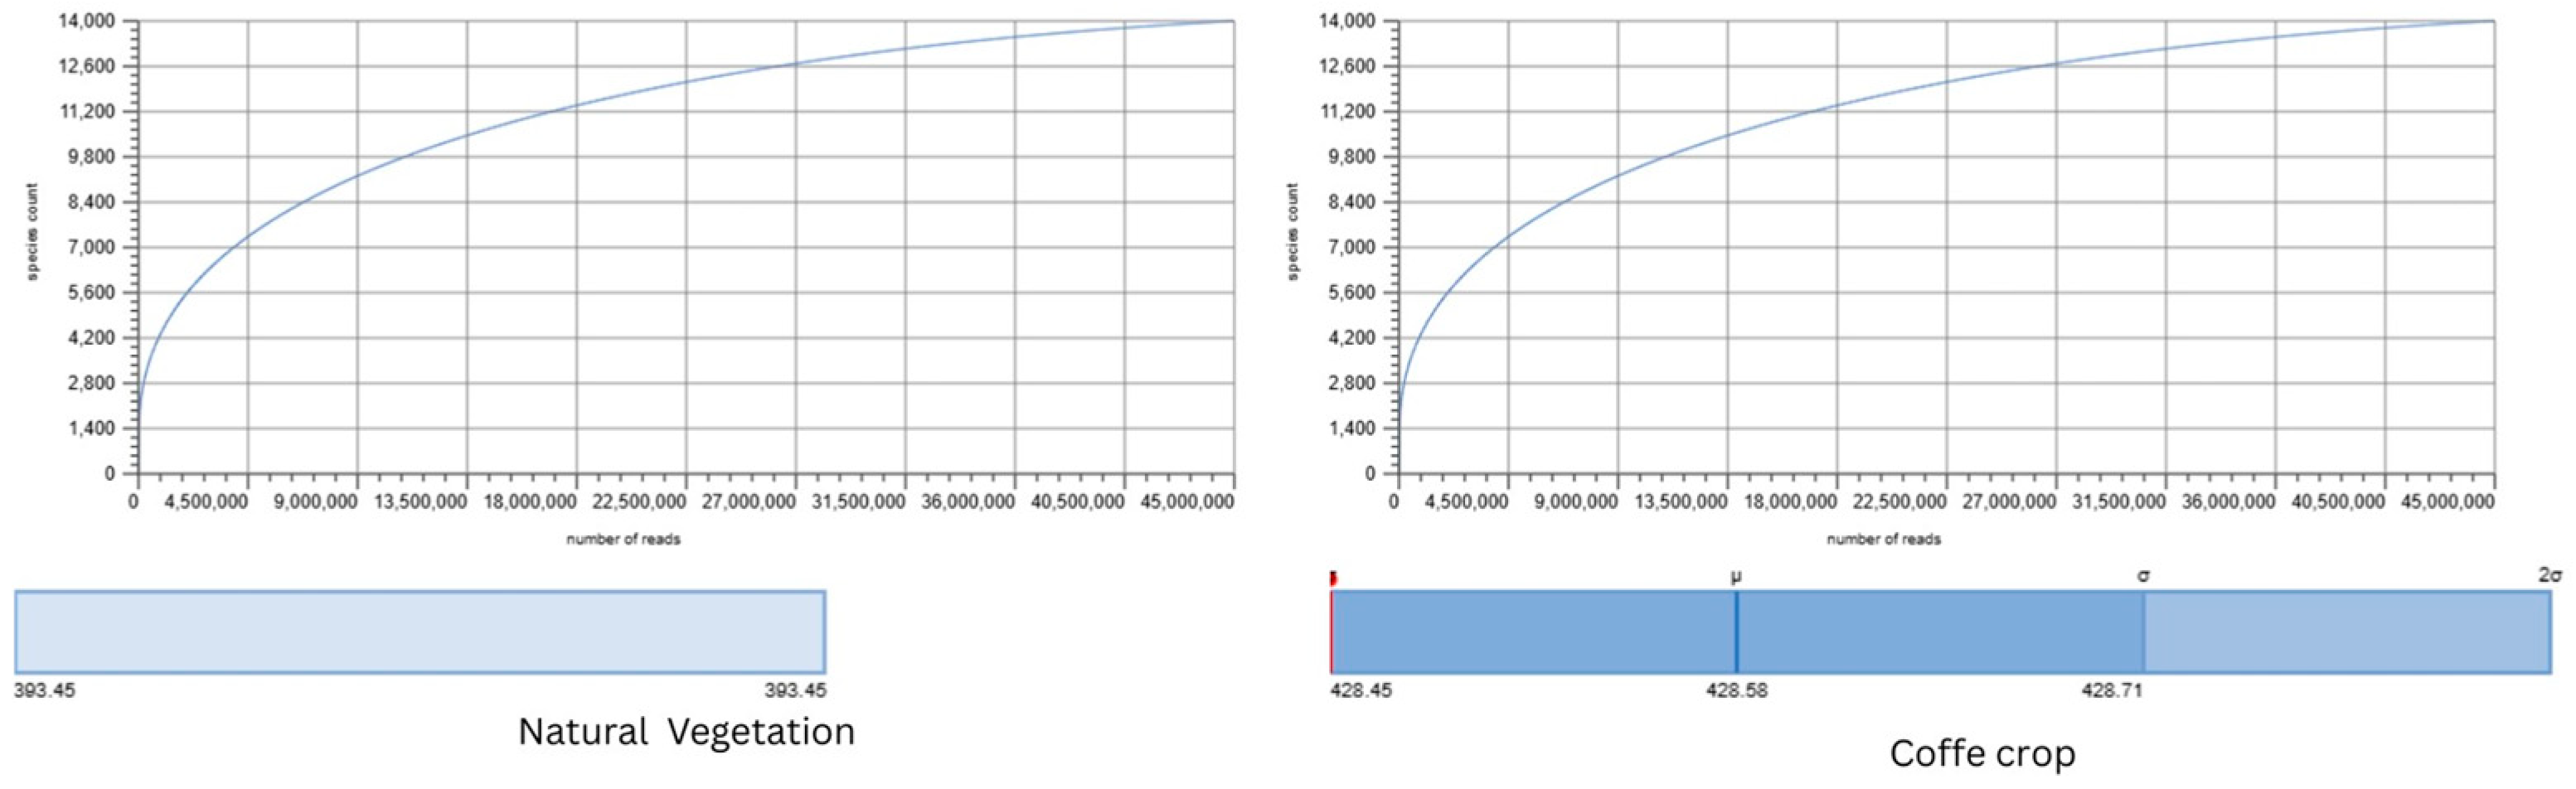
Alpha-diversity analysis identified 393 taxa in the pine–oak forest soil and 428 taxa in the coffee plantation soil, indicating approximately 8.9% greater taxonomic richness in the coffee plantation. Rarefaction curves generated by MG-RAST exhibited highly similar patterns between both land-use systems and approached approximately 14,000 species annotations at the highest sequencing depth (
Figure 5). Although neither curve reached a complete asymptote, both showed a progressive reduction in slope with increasing sequencing effort, indicating that sequencing depth was sufficient to recover a substantial proportion of the microbial diversity present in both soils. Overall, the rarefaction profiles support comparable sampling coverage between the pine–oak forest and coffee plantation soils despite differences in taxonomic composition.
Figure 5.
Alpha-diversity and rarefaction analysis of soil microbial communities from pine–oak forest and coffee plantation soils based on metagenomic sequencing. Rarefaction curves (upper panels) show the accumulation of species annotations as a function of sequencing depth, whereas the lower panels indicate the observed taxonomic richness for each land-use system obtained from MG-RAST analyses.
Figure 5.
Alpha-diversity and rarefaction analysis of soil microbial communities from pine–oak forest and coffee plantation soils based on metagenomic sequencing. Rarefaction curves (upper panels) show the accumulation of species annotations as a function of sequencing depth, whereas the lower panels indicate the observed taxonomic richness for each land-use system obtained from MG-RAST analyses.
3.2.2. Bacteria
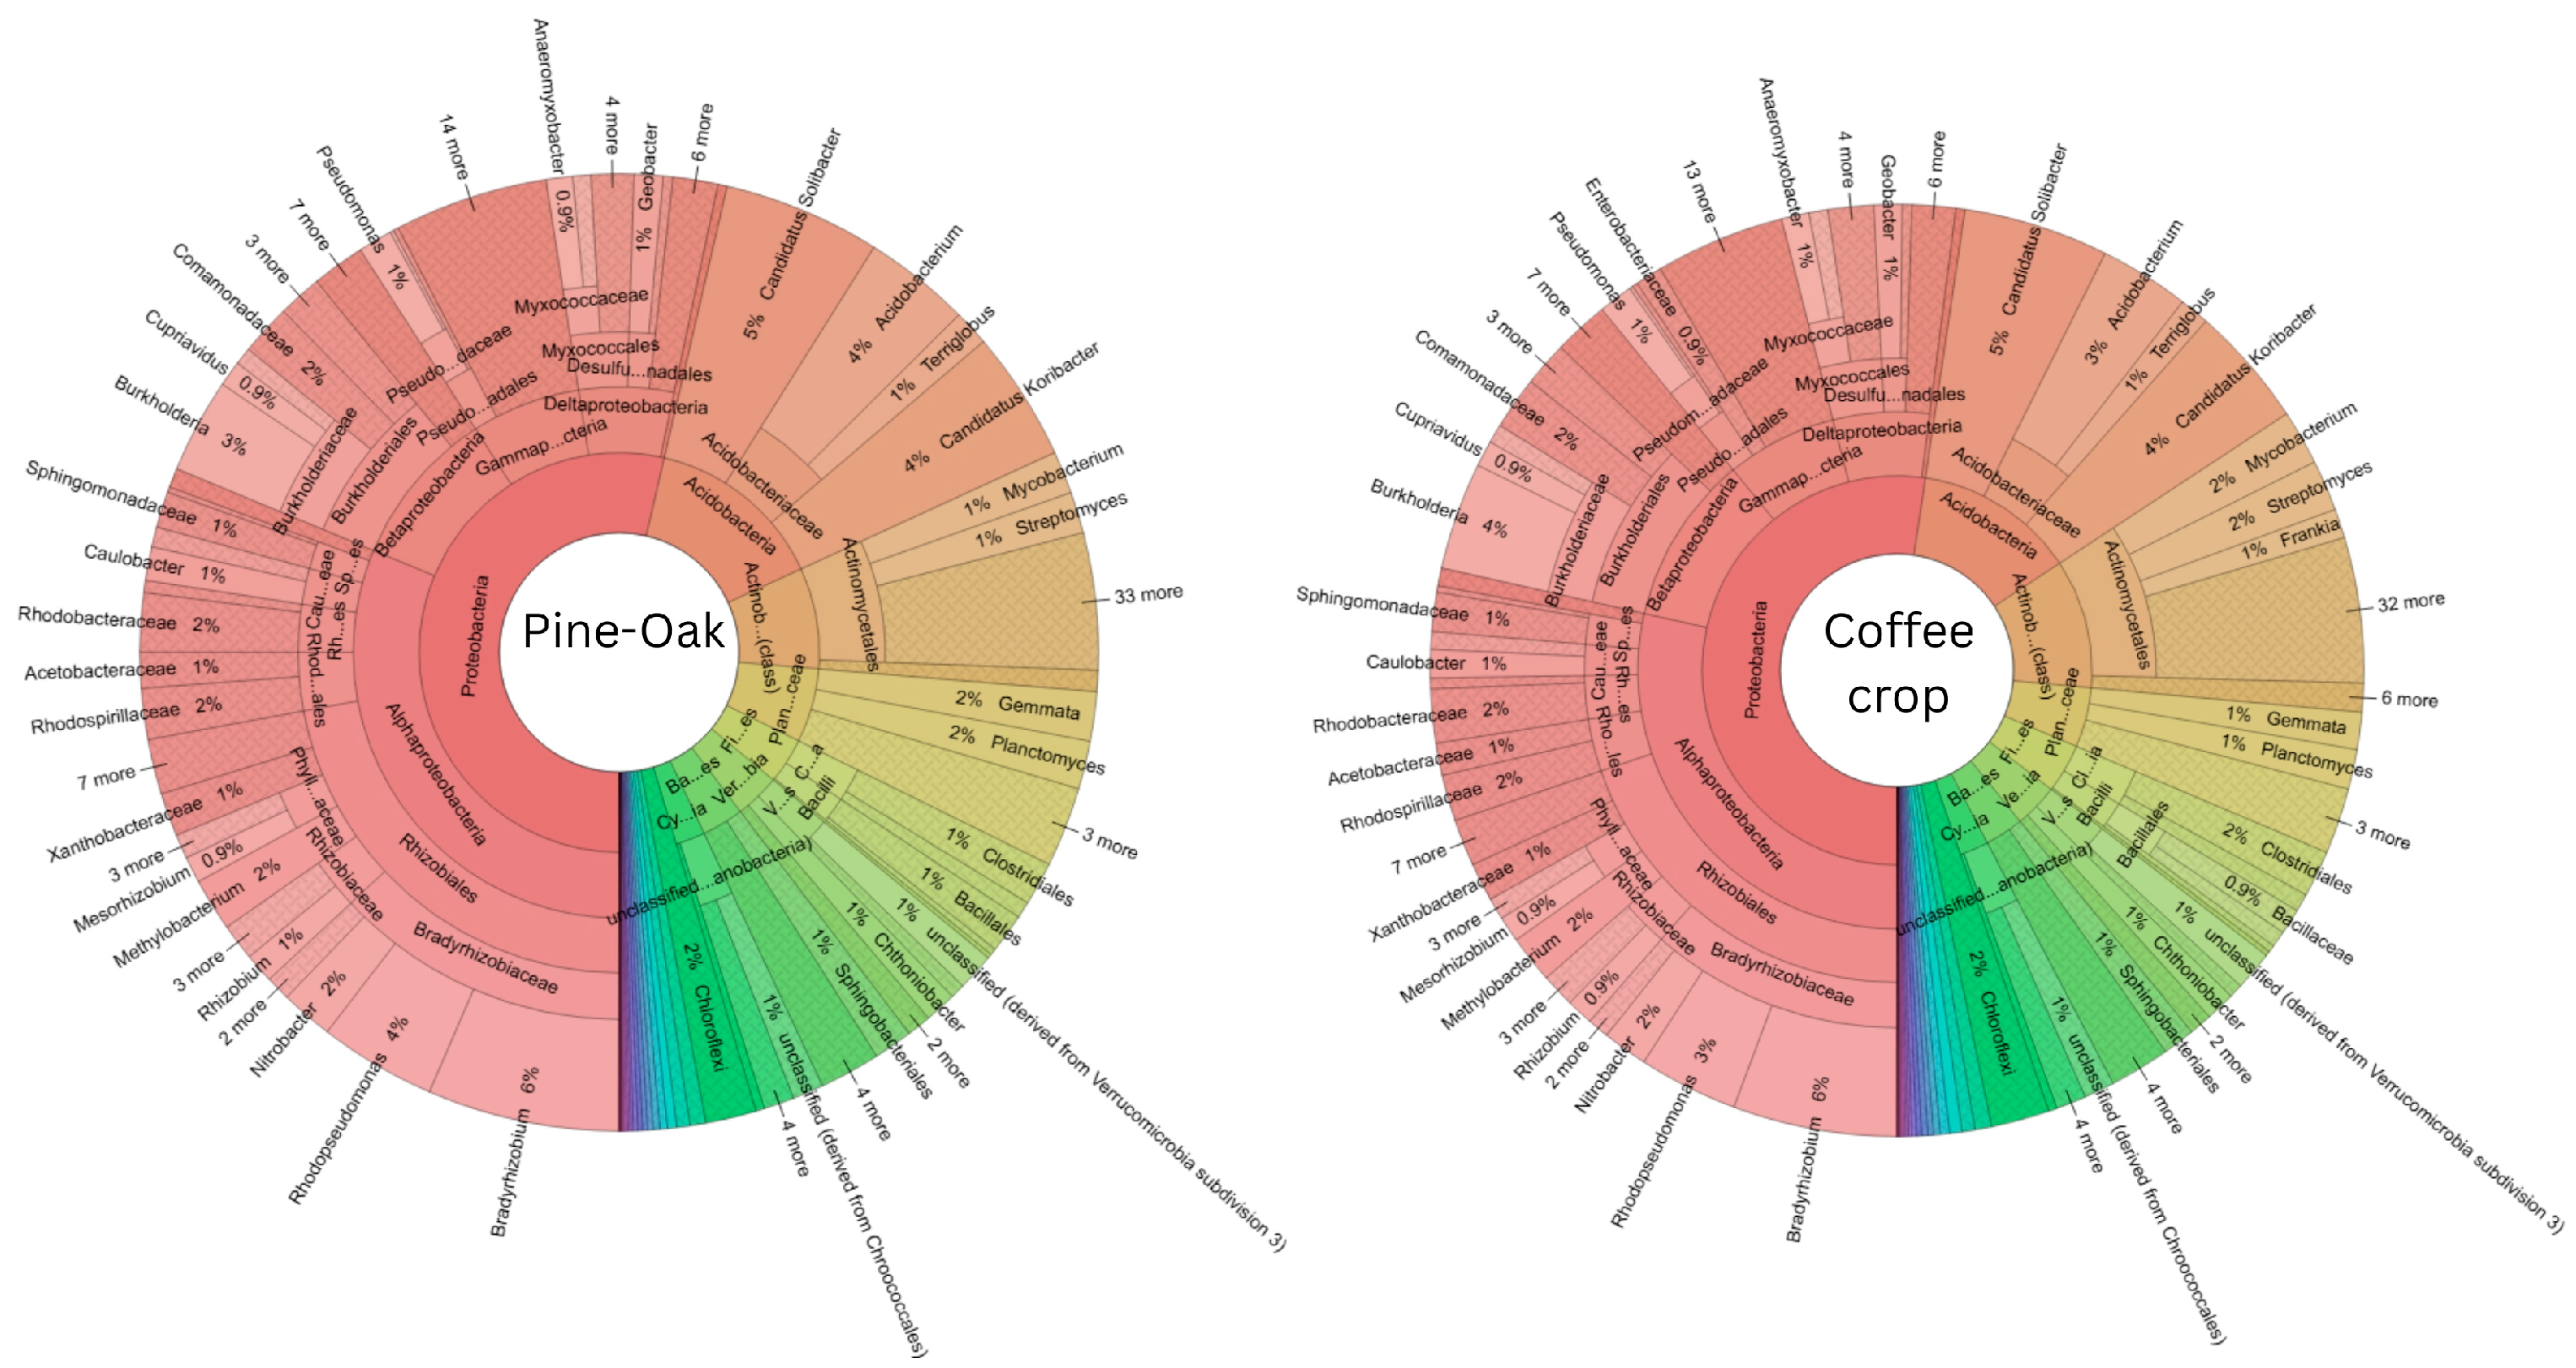
In the bacterial domain analysis, the pine–oak forest soil exhibited a total abundance of 22,324,876 sequences, whereas the coffee plantation soil contained 22,140,851 sequences.
The pine–oak forest exhibited broad bacterial taxonomic representation, with Proteobacteria, Acidobacteria, Actinobacteria, Chloroflexi, and Planctomycetes among the dominant groups (
Figure 6). In both land-use systems, Proteobacteria represented the most abundant phylum. Within this group, Bradyrhizobiaceae, particularly the genus
Bradyrhizobium (6%), were strongly represented in both environments.
Rhizobiales, including the genus Mesorhizobium, were slightly more abundant in coffee plantation soils (1%) than in pine–oak forest soils (0.9%). Similarly, Sphingomonadaceae increased from 3% in forest soils to 4% in coffee plantation soils.
A slight increase was also observed for Deinococci (0.5% to 0.6%), Chlorobiaceae (0.4% to 0.5%), Gemmatimonas (0.3% to 0.4%), and Fibrobacter (0.01% to 0.02%) between the two land-use systems. In contrast, Nitrospiraceae (0.3%), Spirochaetales (0.2%), and Aquificales (0.2%) remained relatively stable between land-use systems.
3.2.3. Eukaryota
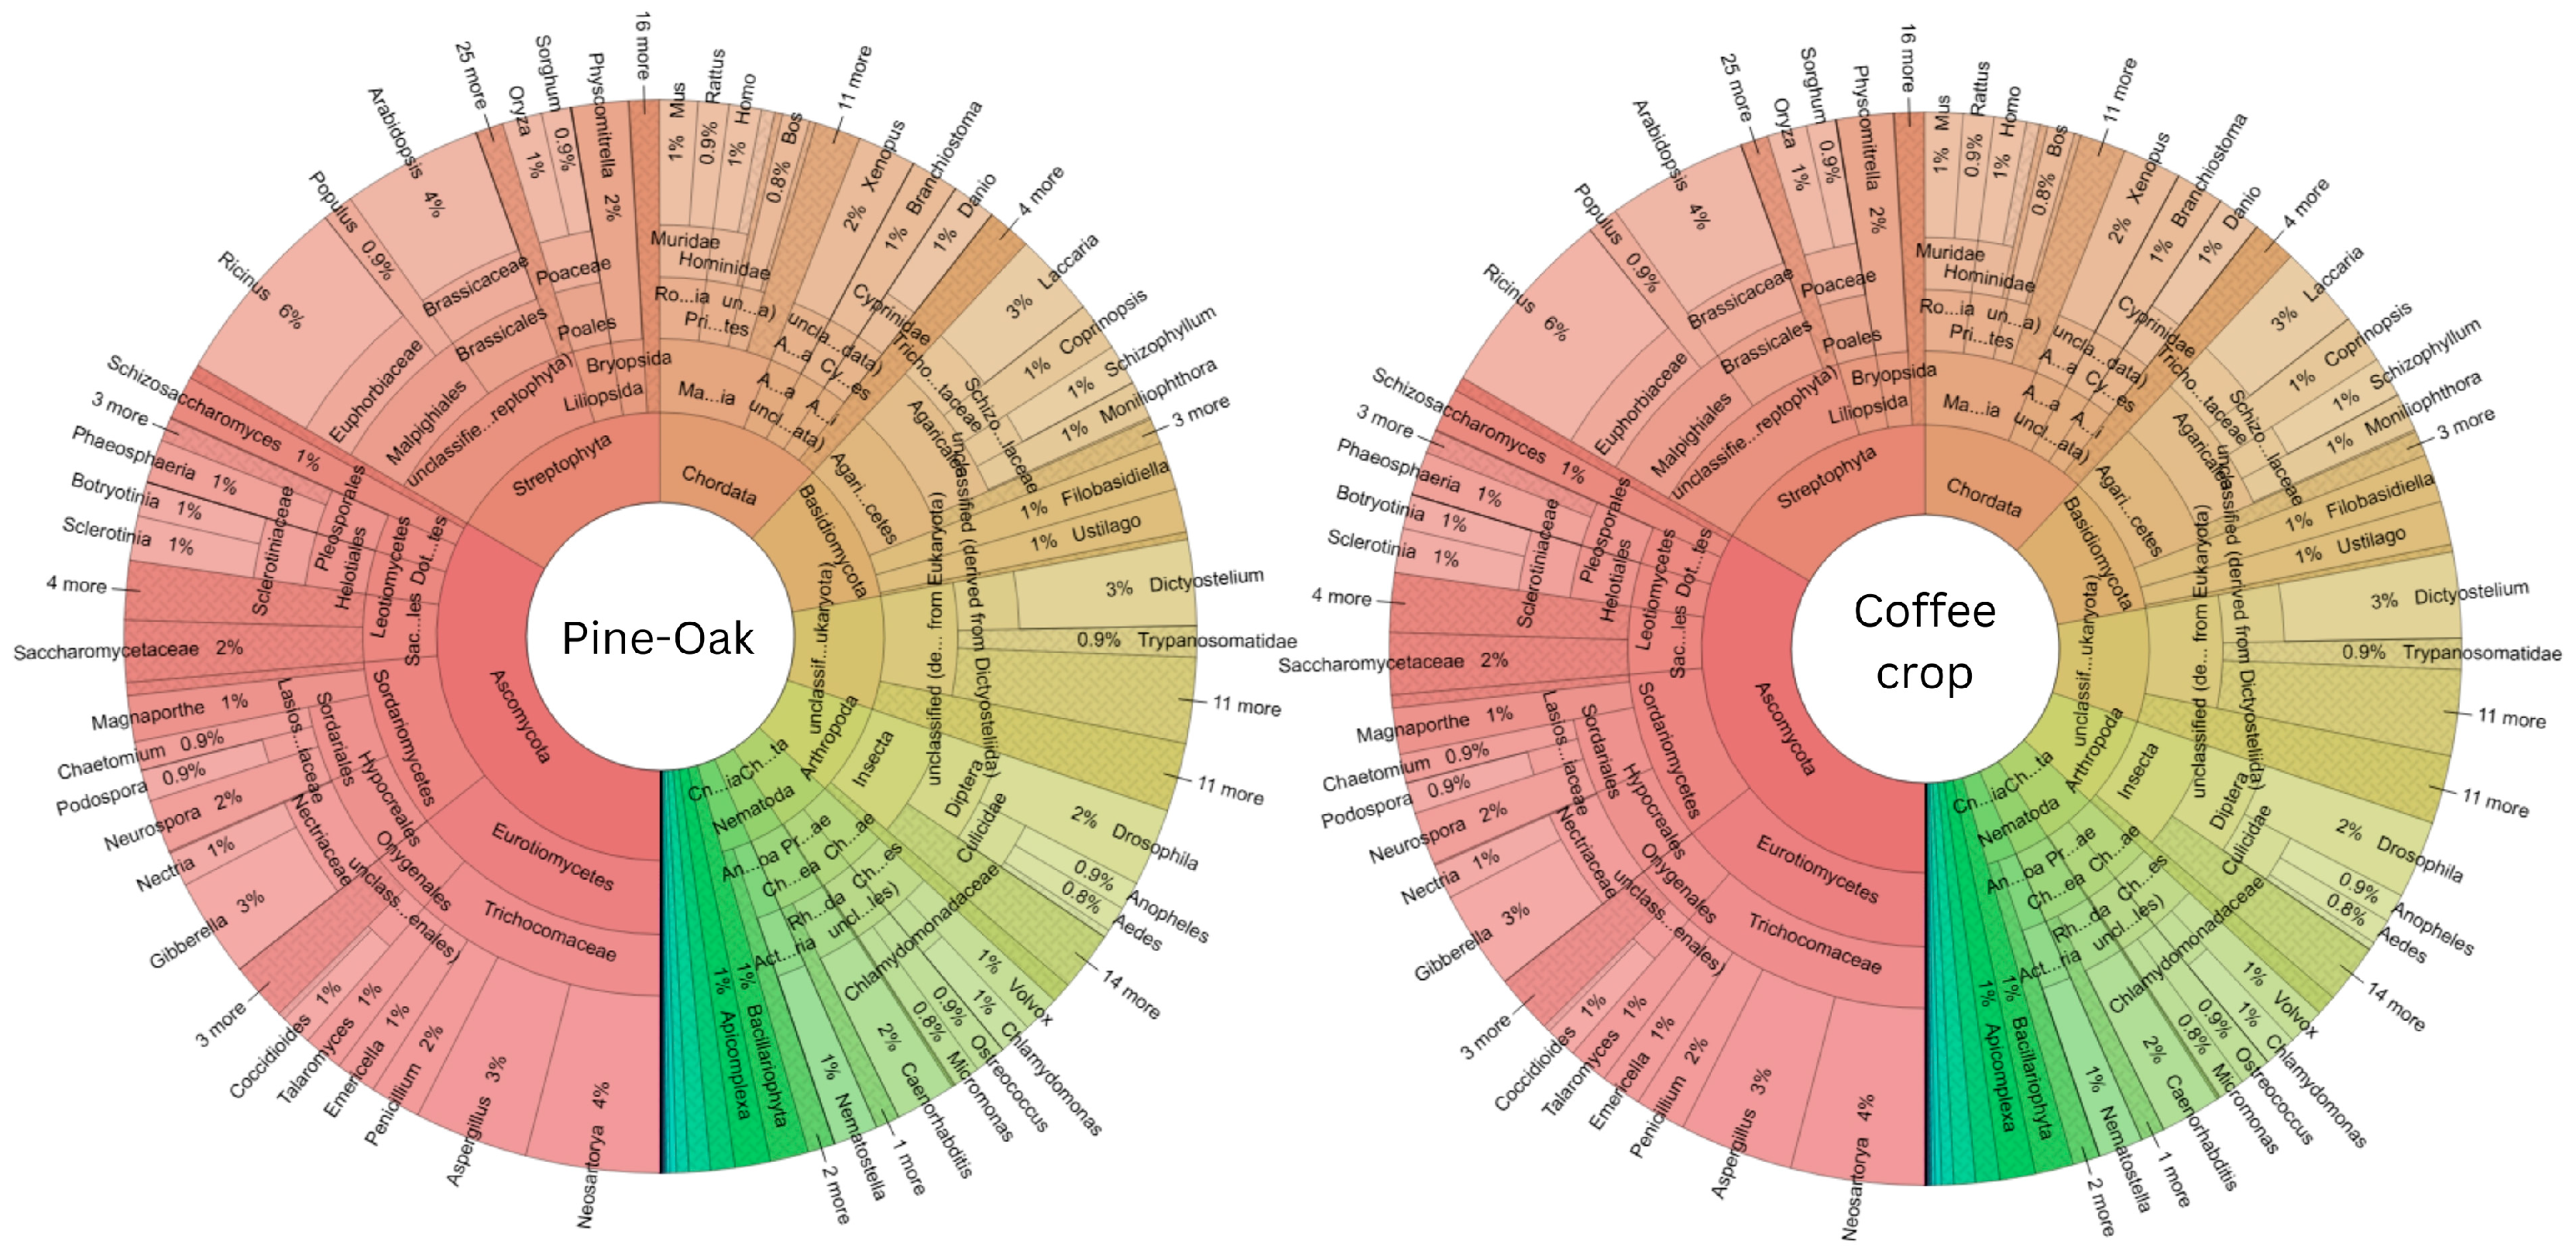
The pine–oak forest soil contained 285,698 eukaryotic sequences, whereas the coffee plantation soil contained 293,762 sequences. Changes in eukaryotic richness and taxonomic composition were observed following the conversion of pine–oak forest to coffee cultivation (
Figure 7).
Eukaryotes represented approximately 1% of the total metagenomic dataset in both land-use systems. The most abundant groups in forest soils included Echinodermata (0.7% vs. 0.6% in coffee plantation), Placozoa (0.6% vs. 0.5%), Entoprocta (0.4% vs. 0.3%), and Euglena (0.007% vs. 0.003%).
Hypsibius and Urechis, both detected at 0.0004% in forest soils, were not identified in coffee plantation soils. Conversely, Microsporidia (0.1%), Blastocladiomycota (0.02%), and Glomeromycetes (0.02%) exhibited similar relative abundances in both land-use systems.
3.2.4. Archaea
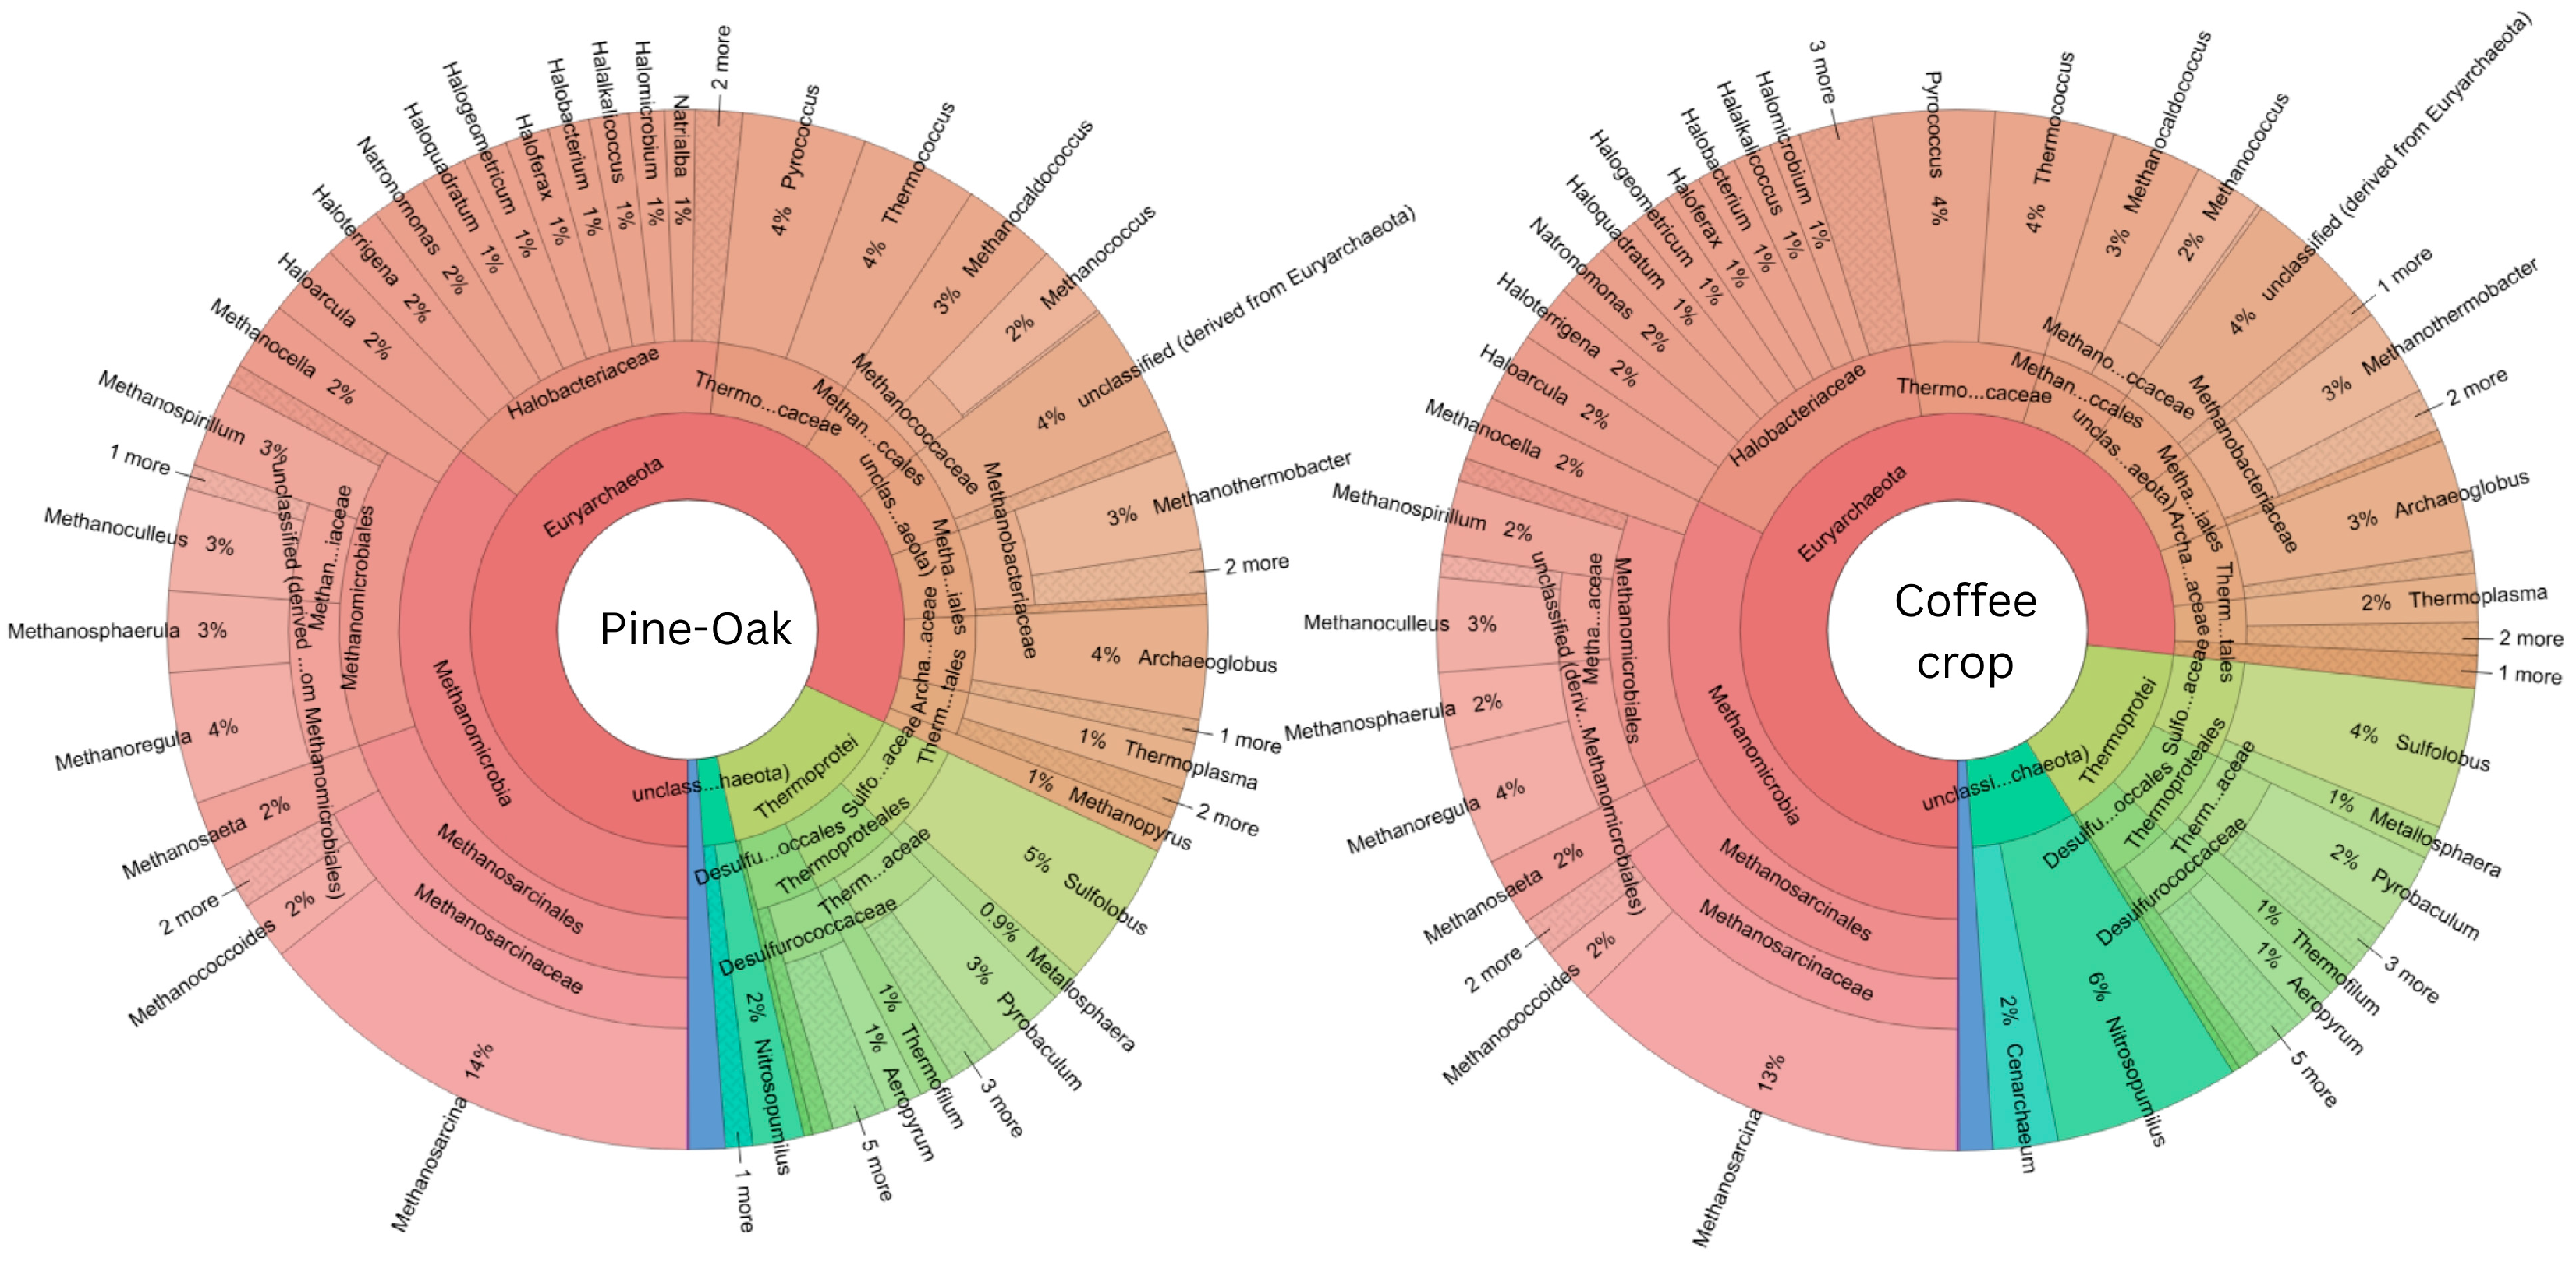
A total of 166,370 archaeal sequences were detected in pine–oak forest soils, whereas coffee plantation soils contained 191,950 sequences. Changes in archaeal abundance and taxonomic composition were observed between the two land-use systems (
Figure 8).
Archaea represented 0.7% of the metagenome in forest soils and 0.8% in coffee plantation soils. Methanomicrobiota was more abundant in coffee plantation soils (32%) than in forest soils (30%). Likewise, Methanosarcinales increased from 14% in forest soils to 15% in coffee plantation soils.
Halarchaeum exhibited a higher relative abundance in coffee plantation soils, increasing from 0.05% in pine–oak forest soils to 0.8% in coffee plantation soils. In contrast, Thermococci and Methanococcales were slightly more abundant in pine–oak forest soils (4%) than in coffee plantation soils (3%).
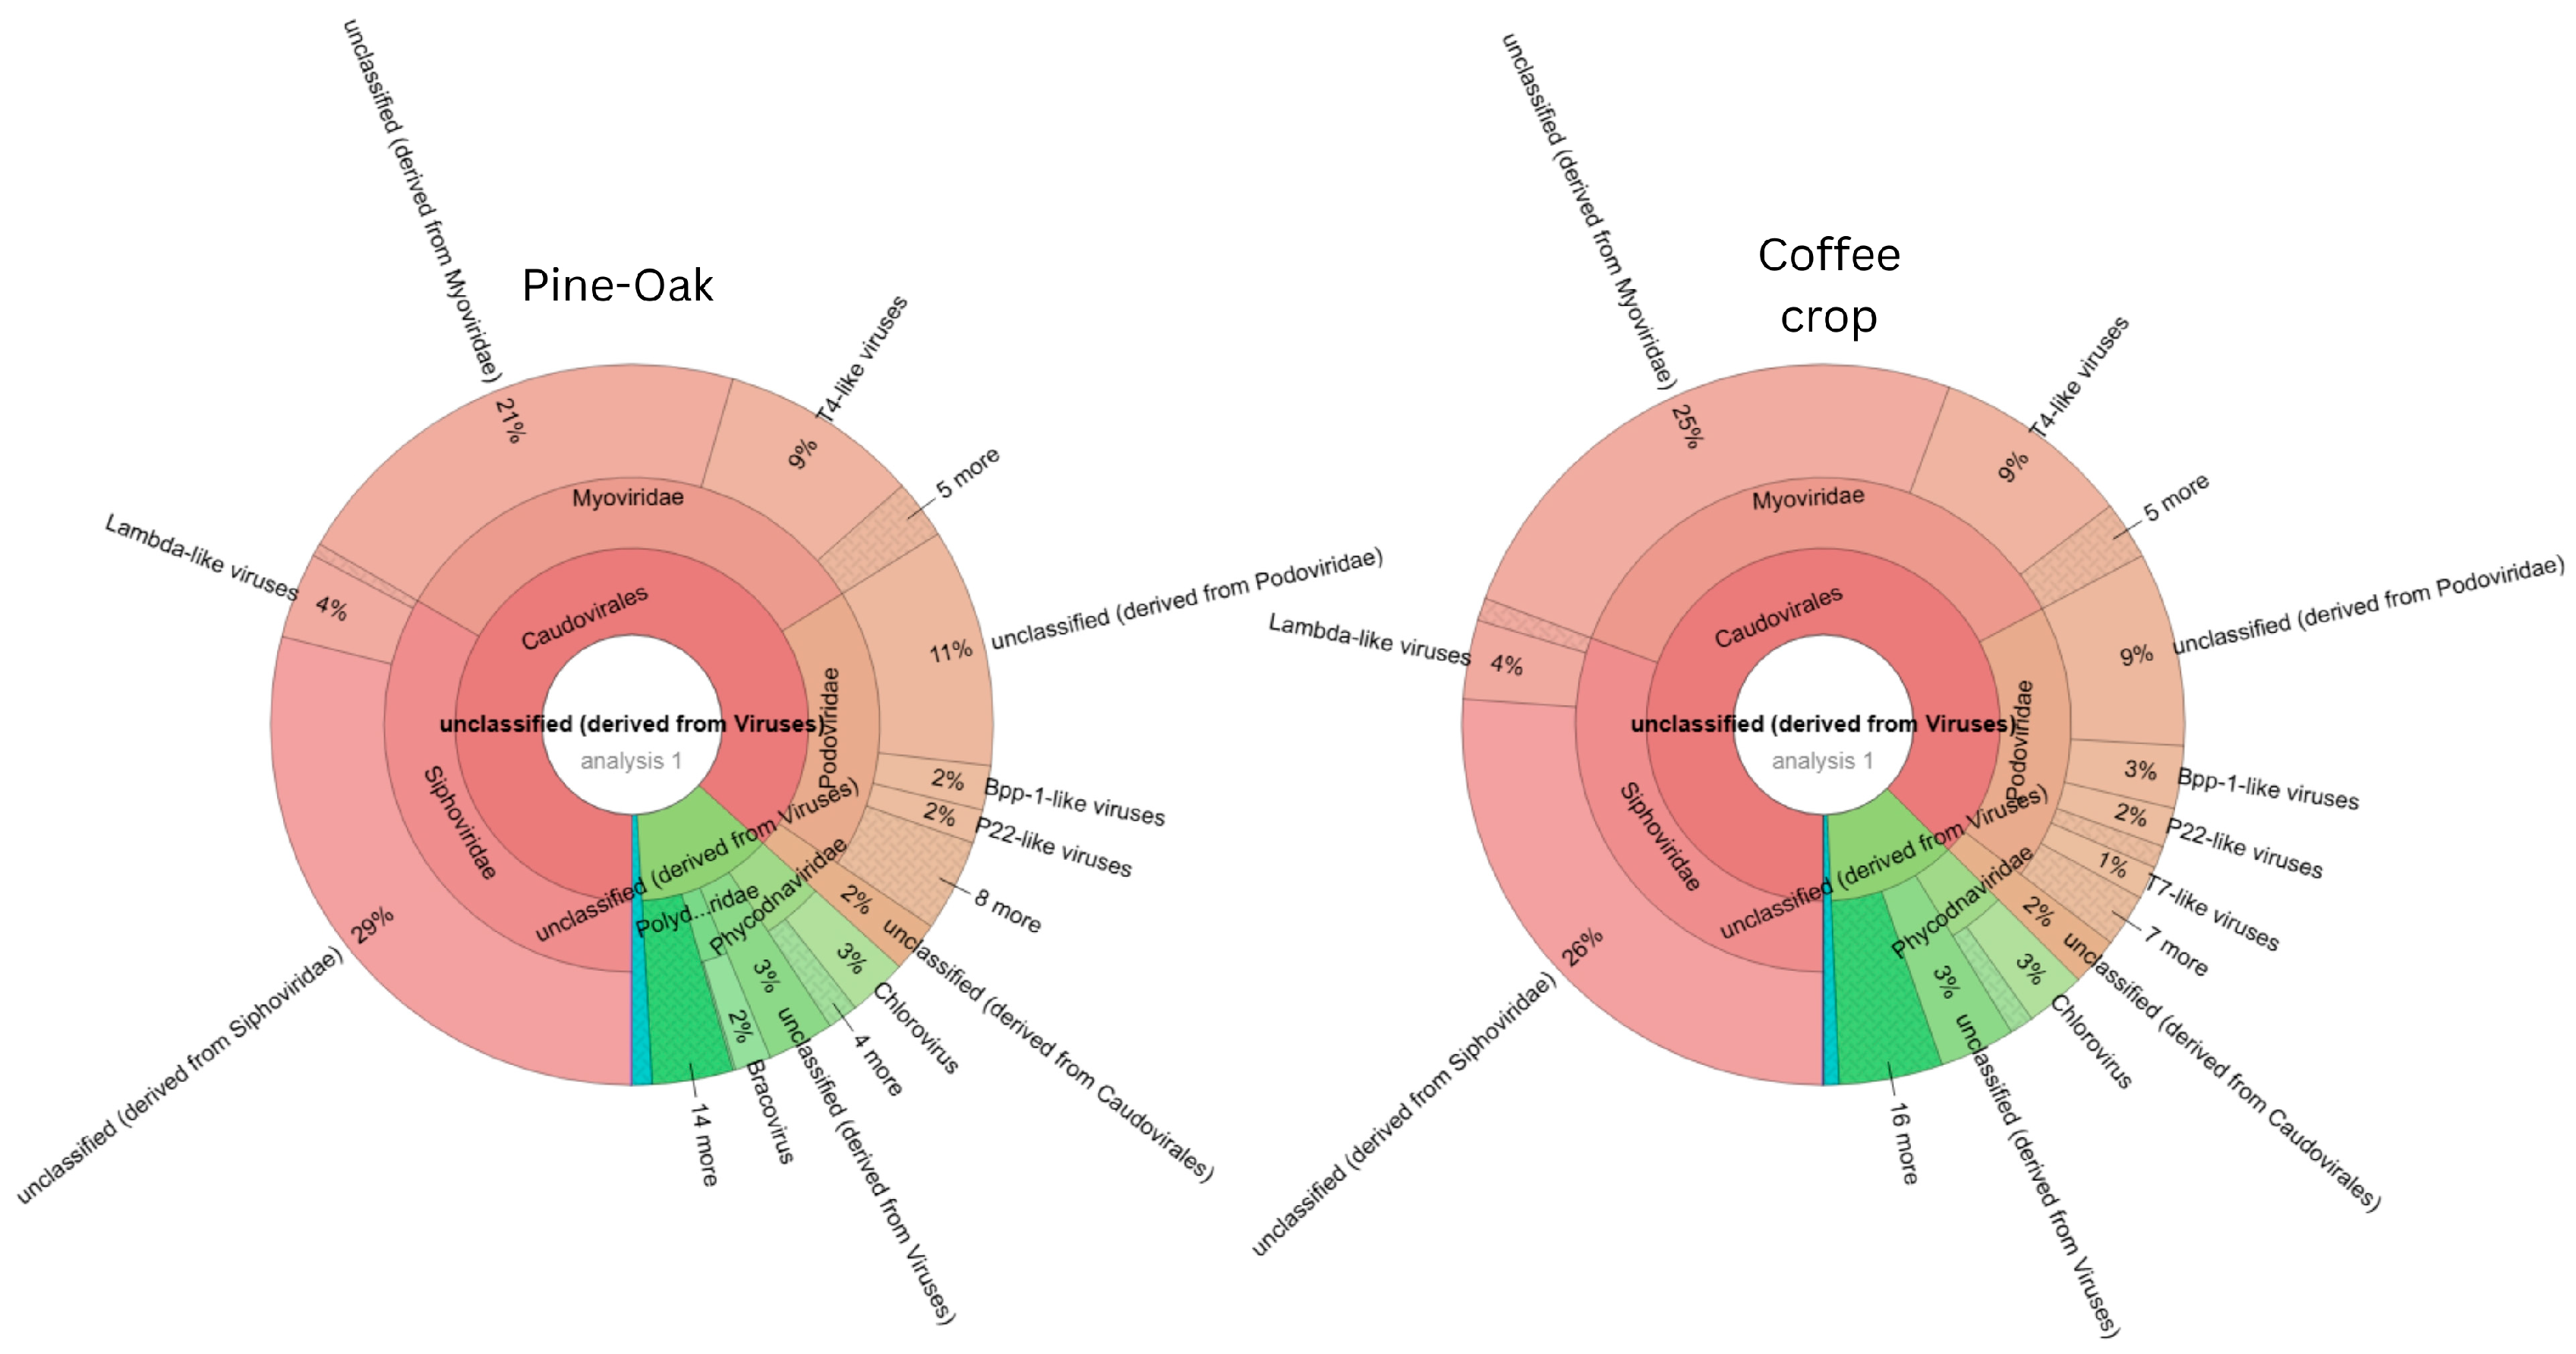
3.2.5. Viruses
The viral analysis identified 4361 sequences in both pine–oak forest and coffee plantation soils. Although viral abundance was similar between land-use systems, differences in taxonomic composition were detected (
Figure 9).
Viruses represented approximately 0.02% of the metagenome in forest soils and 0.03% in coffee plantation soils. Caudovirales was the dominant viral order in both environments, accounting for 26% of viral sequences in forest soils and 27% in coffee plantation soils.
Podoviridae were more abundant in forest soils (11%) than in coffee plantation soils (9%), whereas Herpesvirales increased from 0.5% in forest soils to 0.7% in coffee plantation soils. Enteroviruses were not detected in forest soils but were identified at low abundance (0.02%) in coffee plantation soils.
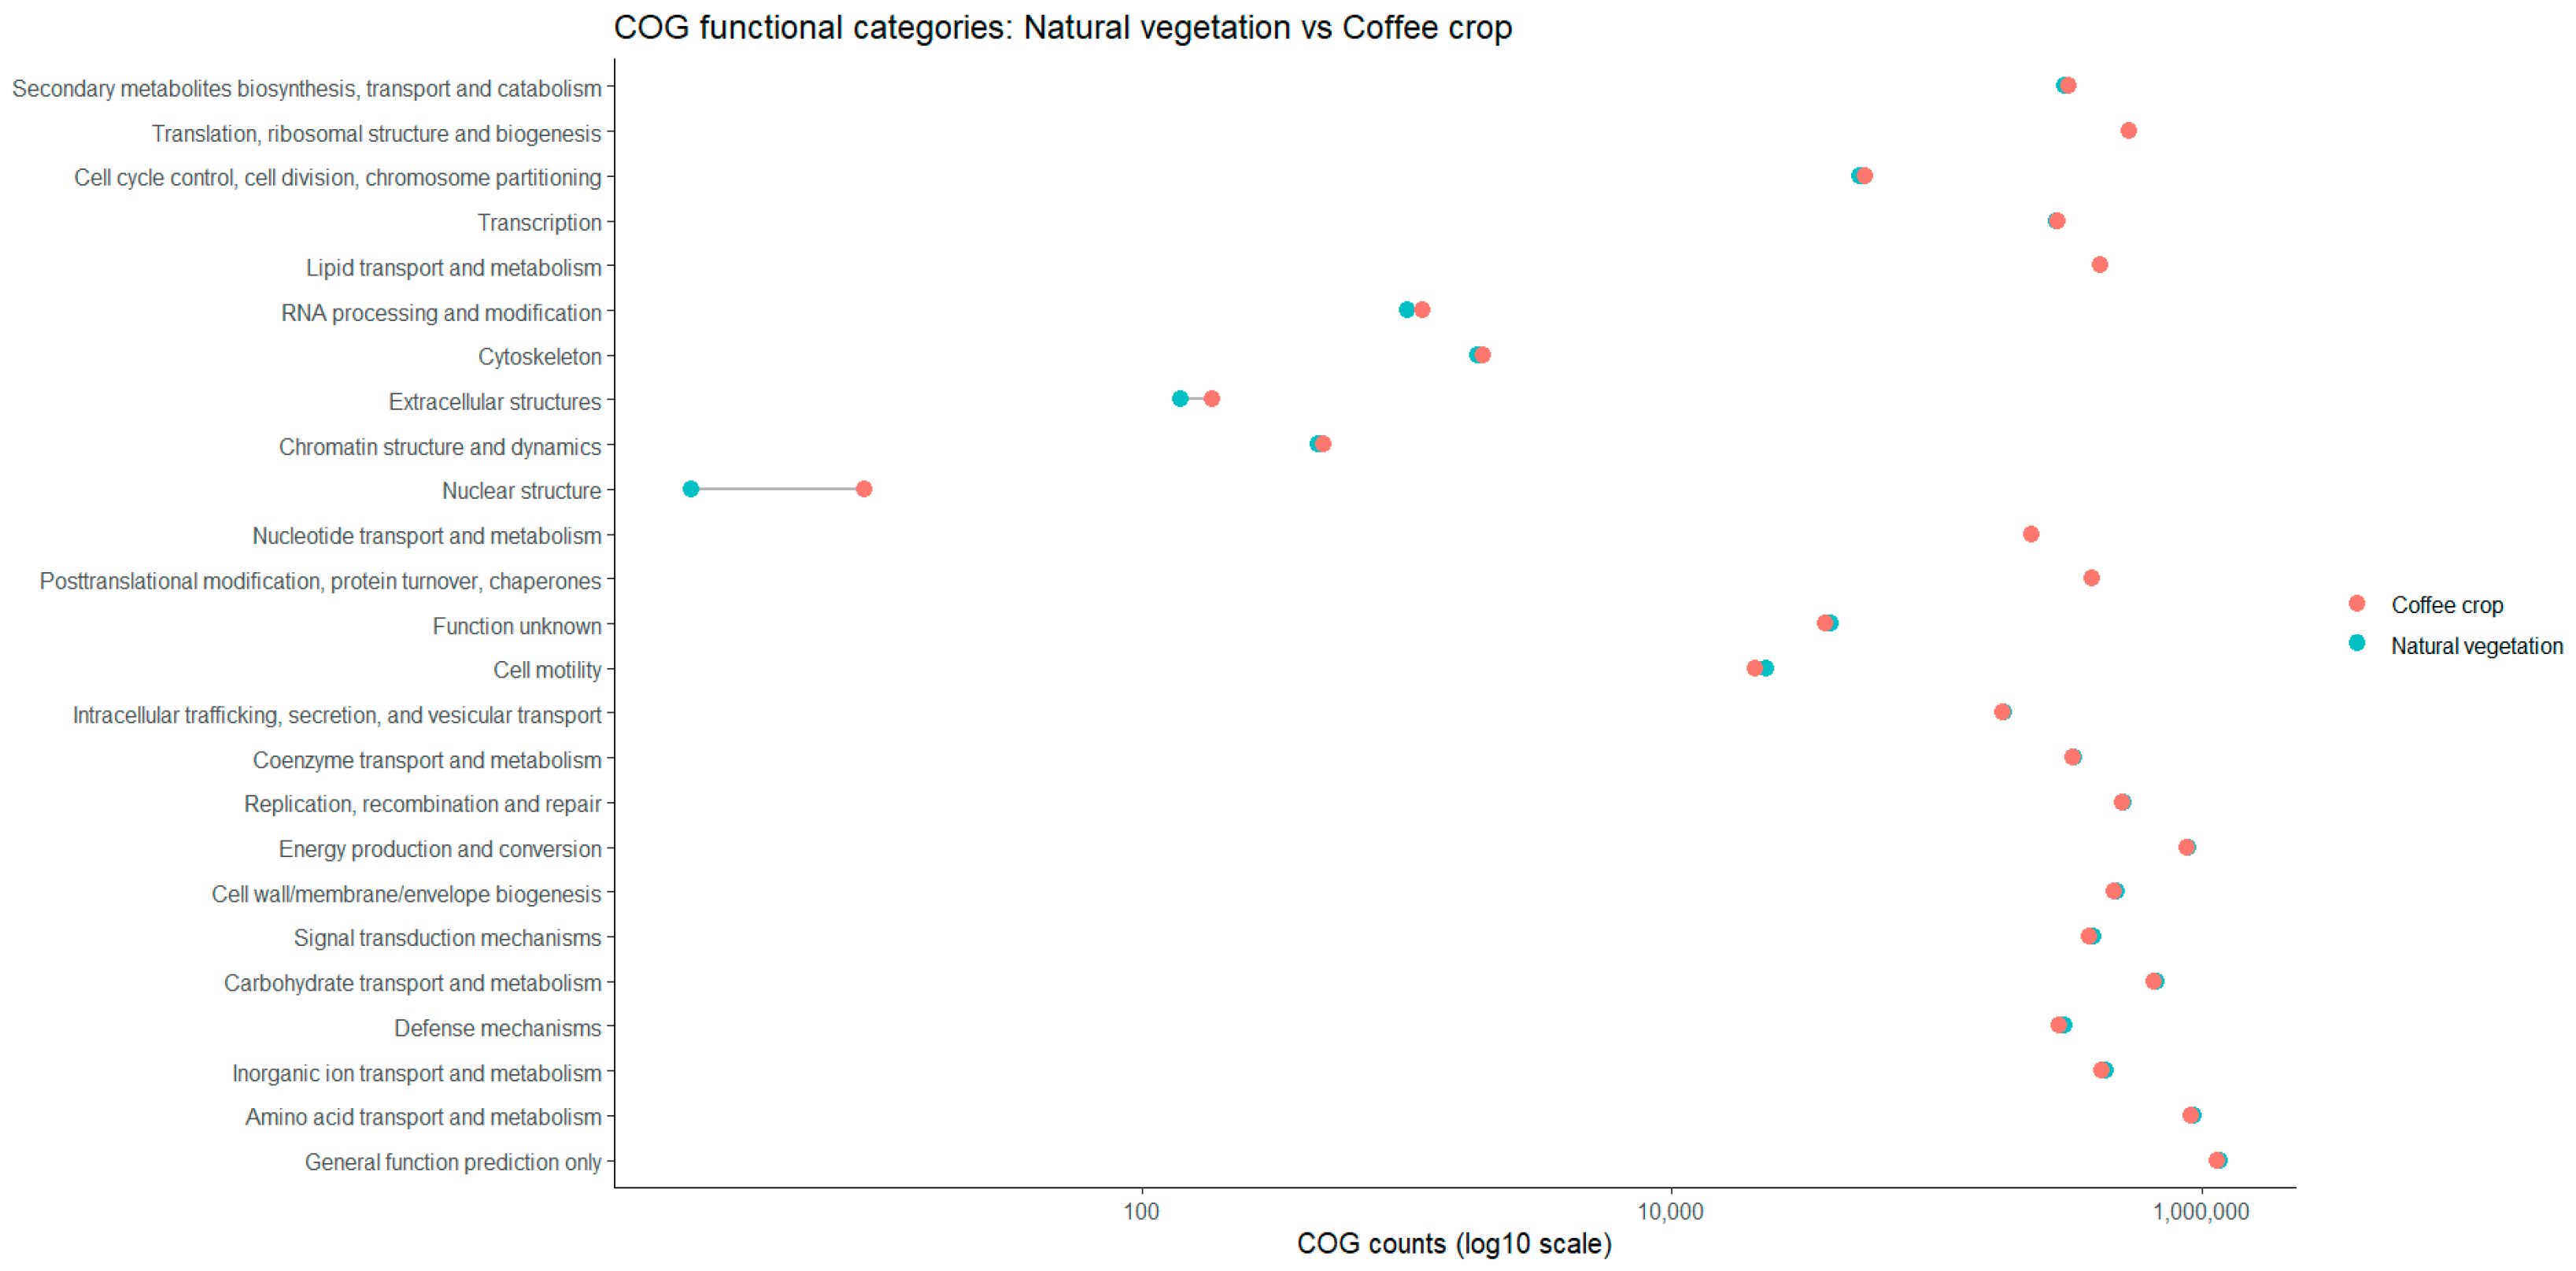
3.3. Metabolic Profile Analysis
Metabolic profiling demonstrated that despite the taxonomic differences observed between pine–oak forest and coffee plantation soils, both land-use systems retained similar broad functional profiles across the major COG categories.
The pine–oak forest soil exhibited greater representation of functional categories associated with metabolism and poorly characterized functions, particularly within the categories Metabolism, Cellular Processes and Signaling, and Poorly Characterized functions. Conversely, coffee plantation soils exhibited greater representation of categories associated with Information Storage and Processing, including transcription, replication, and translation-related functions (
Figure 10).
In both land-use systems, the most abundant categories corresponded to amino acid metabolism and transport, energy production and conversion, carbohydrate metabolism and transport, inorganic ion transport and metabolism, transcription, and DNA replication, recombination, and repair. Coffee plantation soils exhibited greater representation of genes associated with defense mechanisms, intracellular transport and secretion, secondary metabolite biosynthesis, and cell envelope biogenesis.
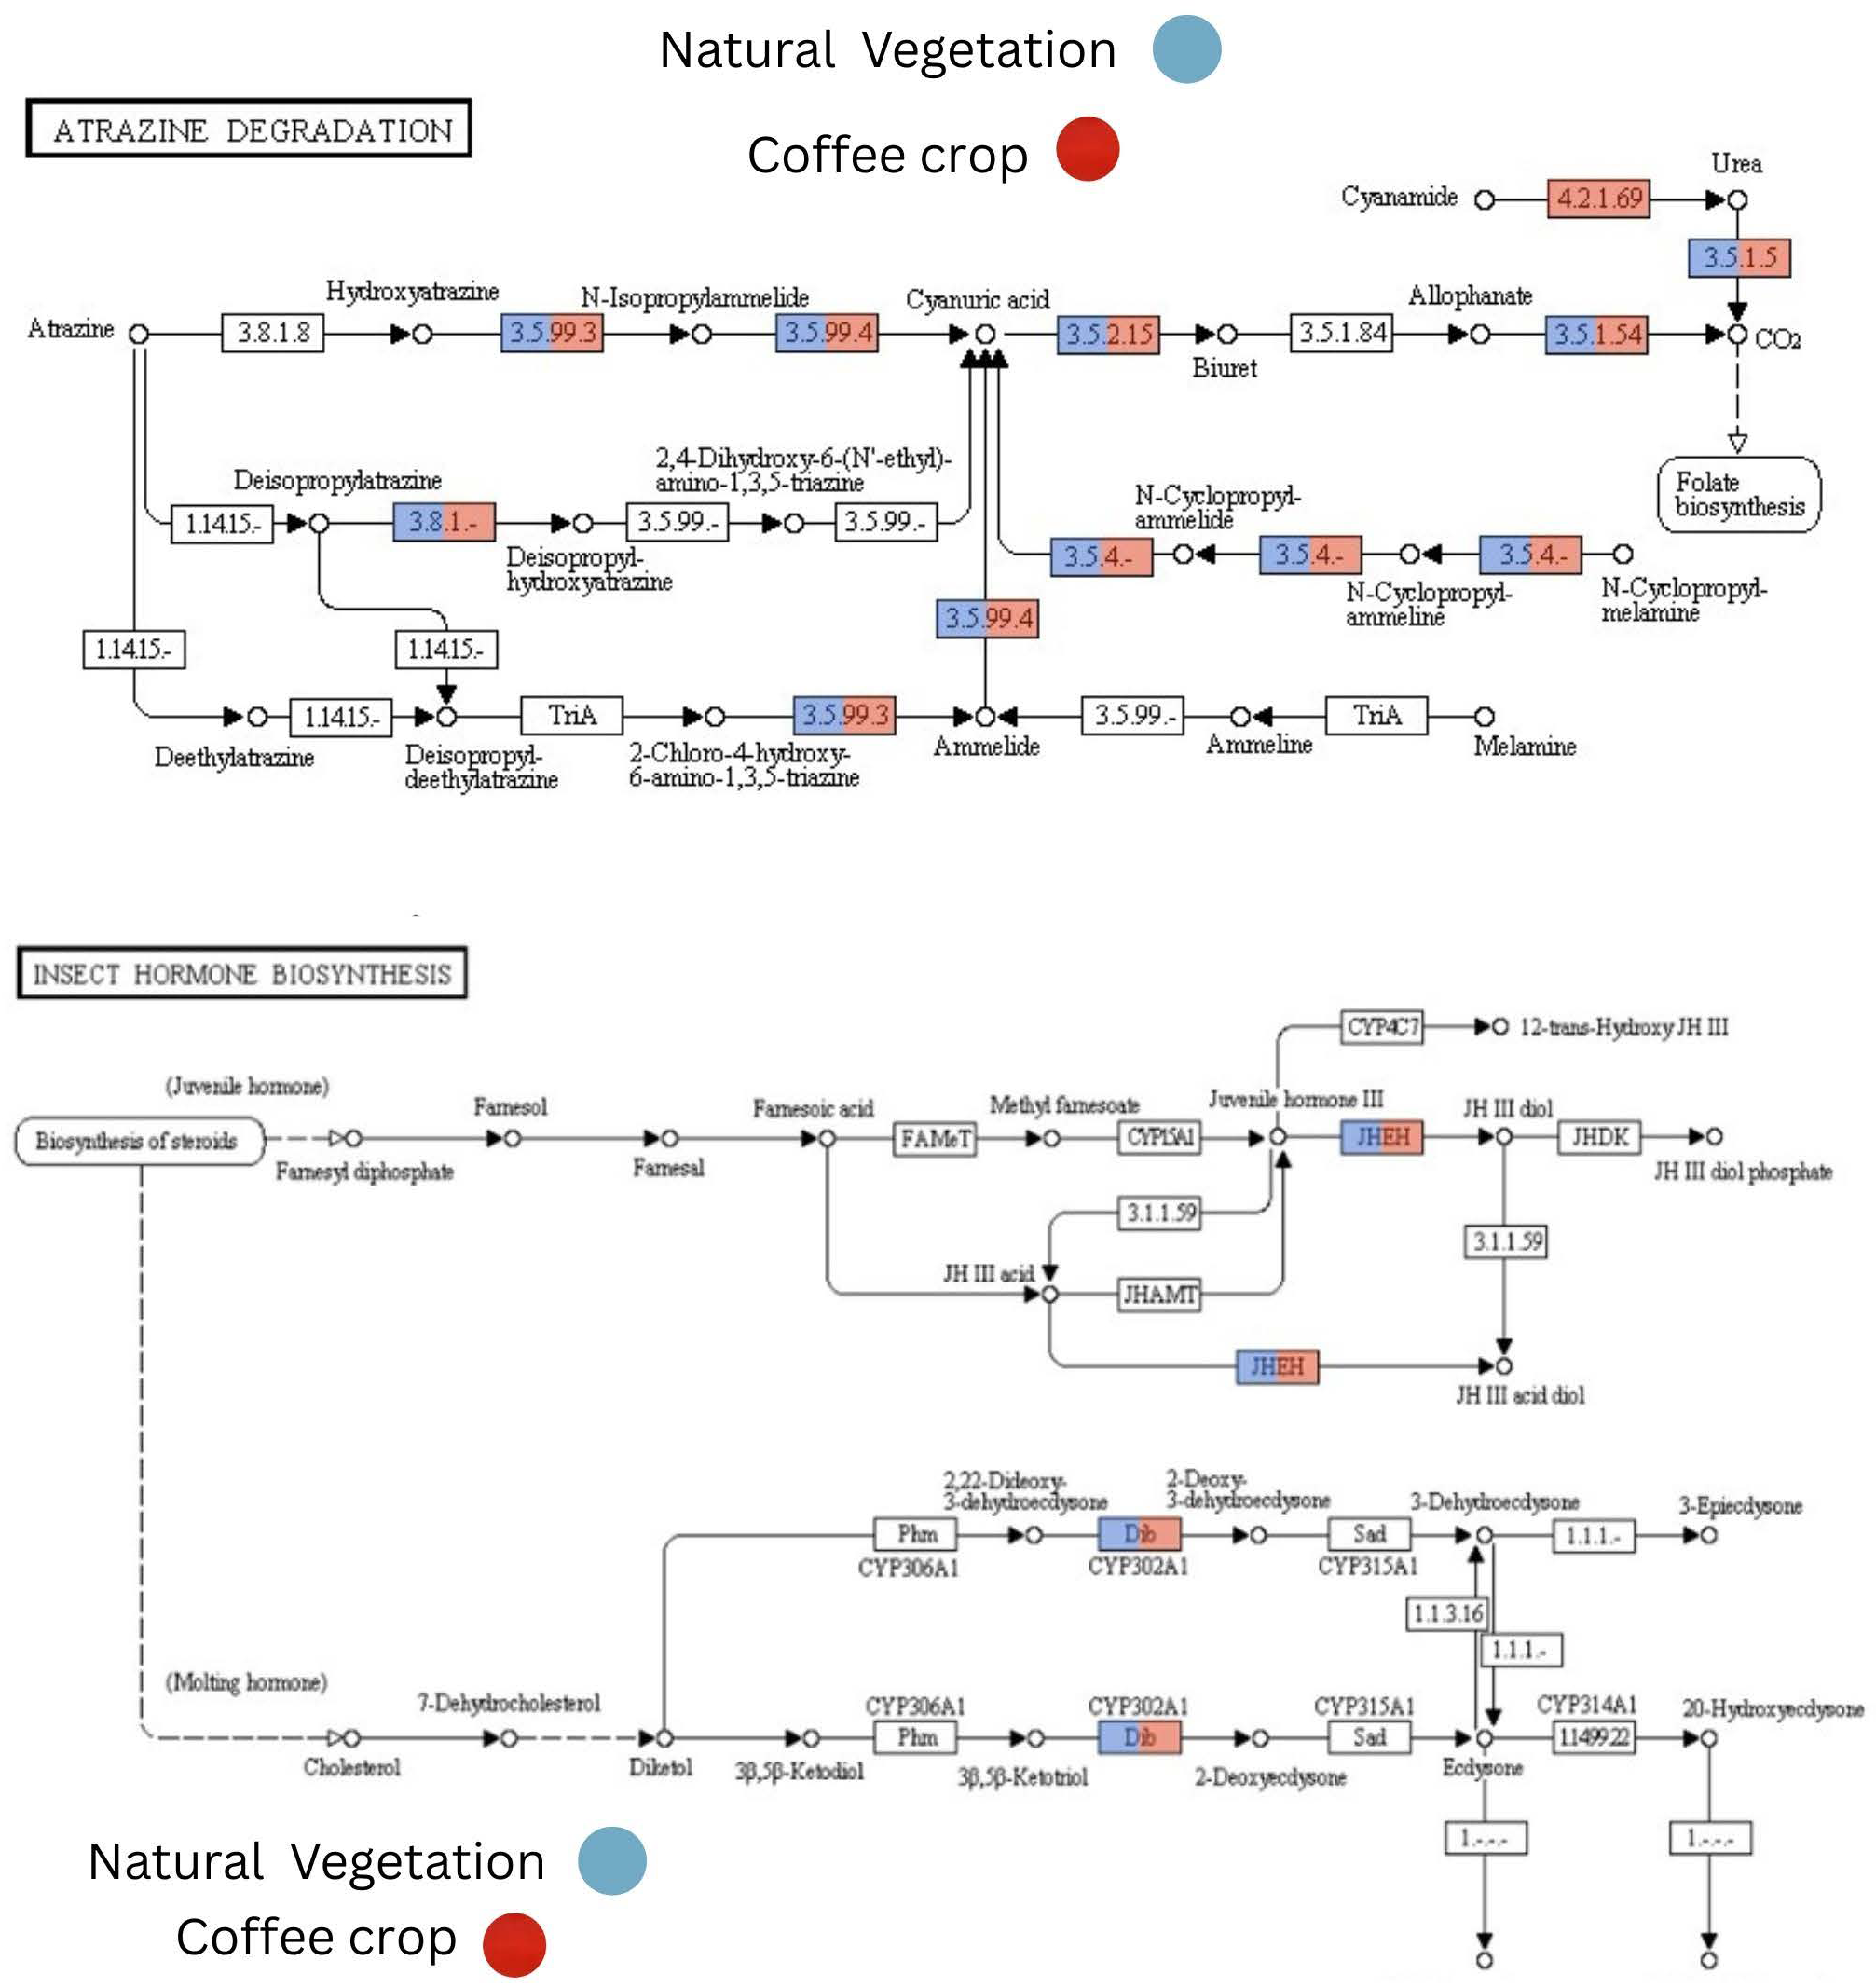
3.4. KEGG Orthology (KO) Analysis
KEGG Orthology analysis revealed that pine–oak forest soils exhibited greater representation of functions associated with Cellular Processes, Environmental Information Processing, and Human Diseases categories. In contrast, coffee plantation soils exhibited greater representation of functions associated with Genetic Information Processing, Metabolism, and Organismal Systems.
Representative KEGG pathway maps were used to illustrate differences in the predicted functional representation of selected metabolic pathways between the pine–oak forest and coffee plantation soils (
Figure 11). These pathways highlight examples of functional differences identified through KEGG annotation rather than an exhaustive comparison of all metabolic functions.
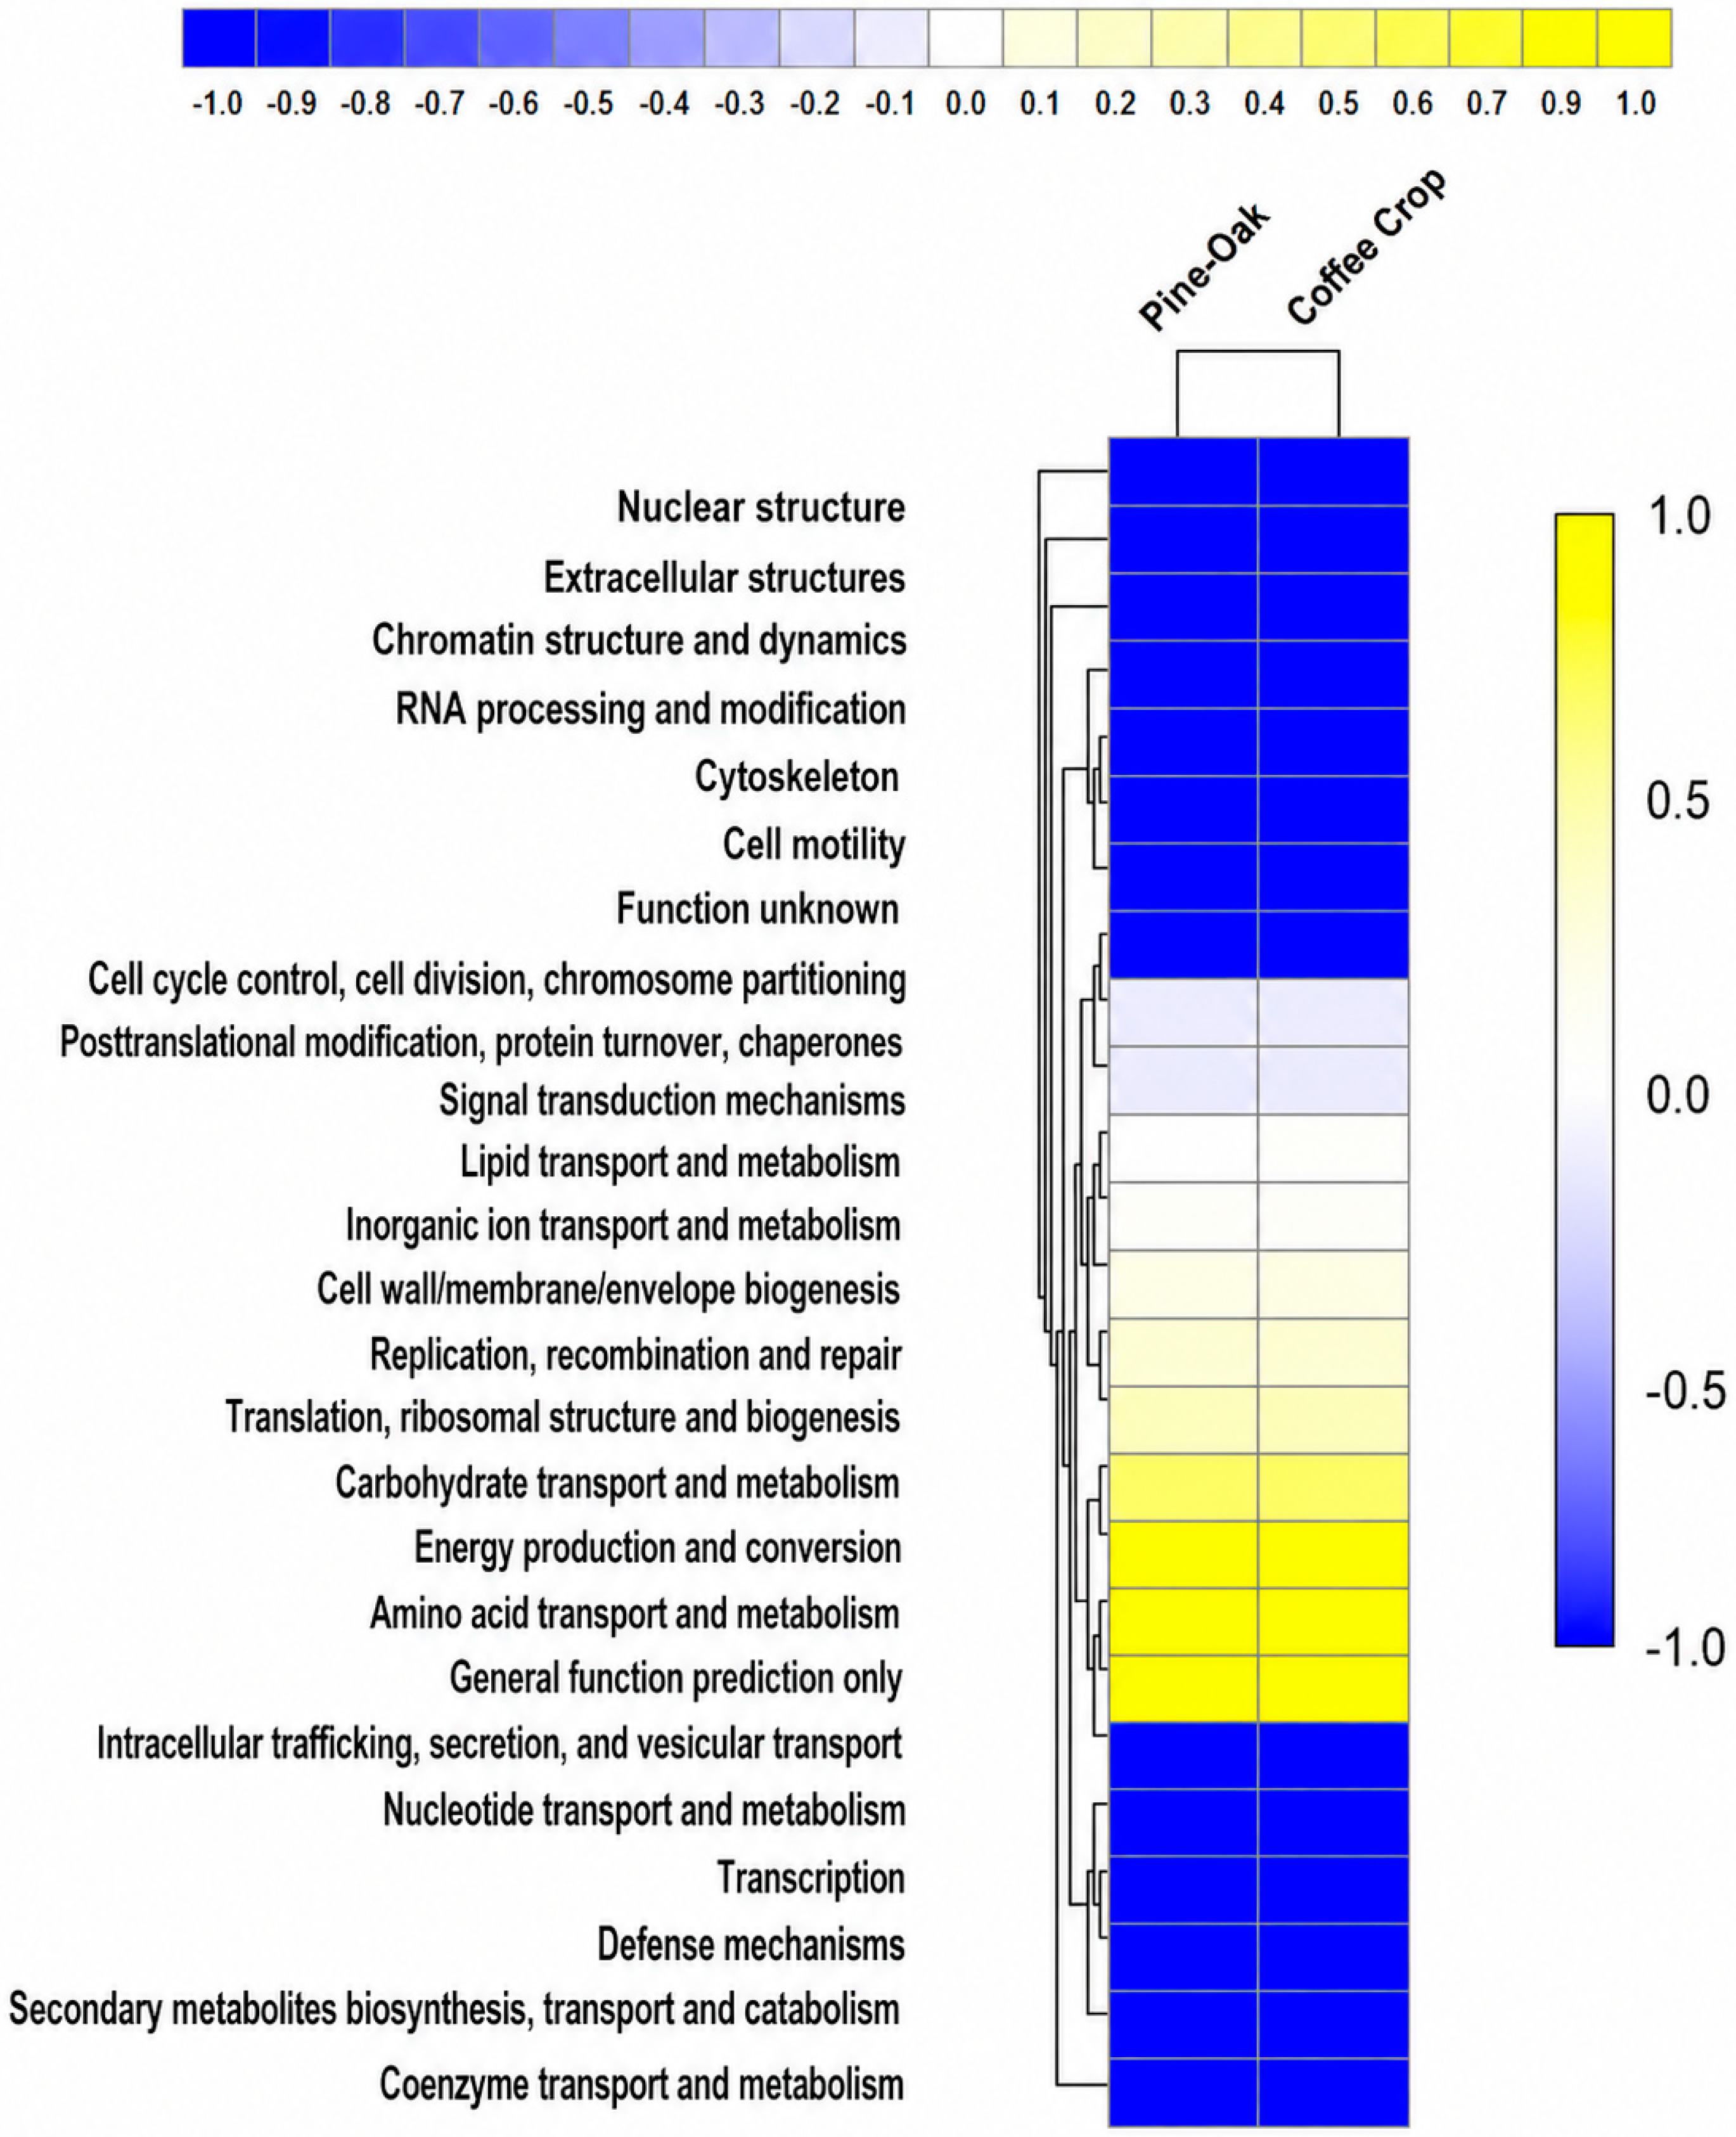
3.5. Functional Profile Analysis
Heatmap analysis of COG-based functional profiles revealed relatively similar patterns between pine–oak forest and coffee plantation soils (
Figure 12). Color gradients represented relative variation in functional representation across categories, with blue tones corresponding to lower values and yellow tones corresponding to higher values.
Although minor differences among categories were observed, both land-use systems maintained broadly comparable functional organization across the major COG groups [
30].
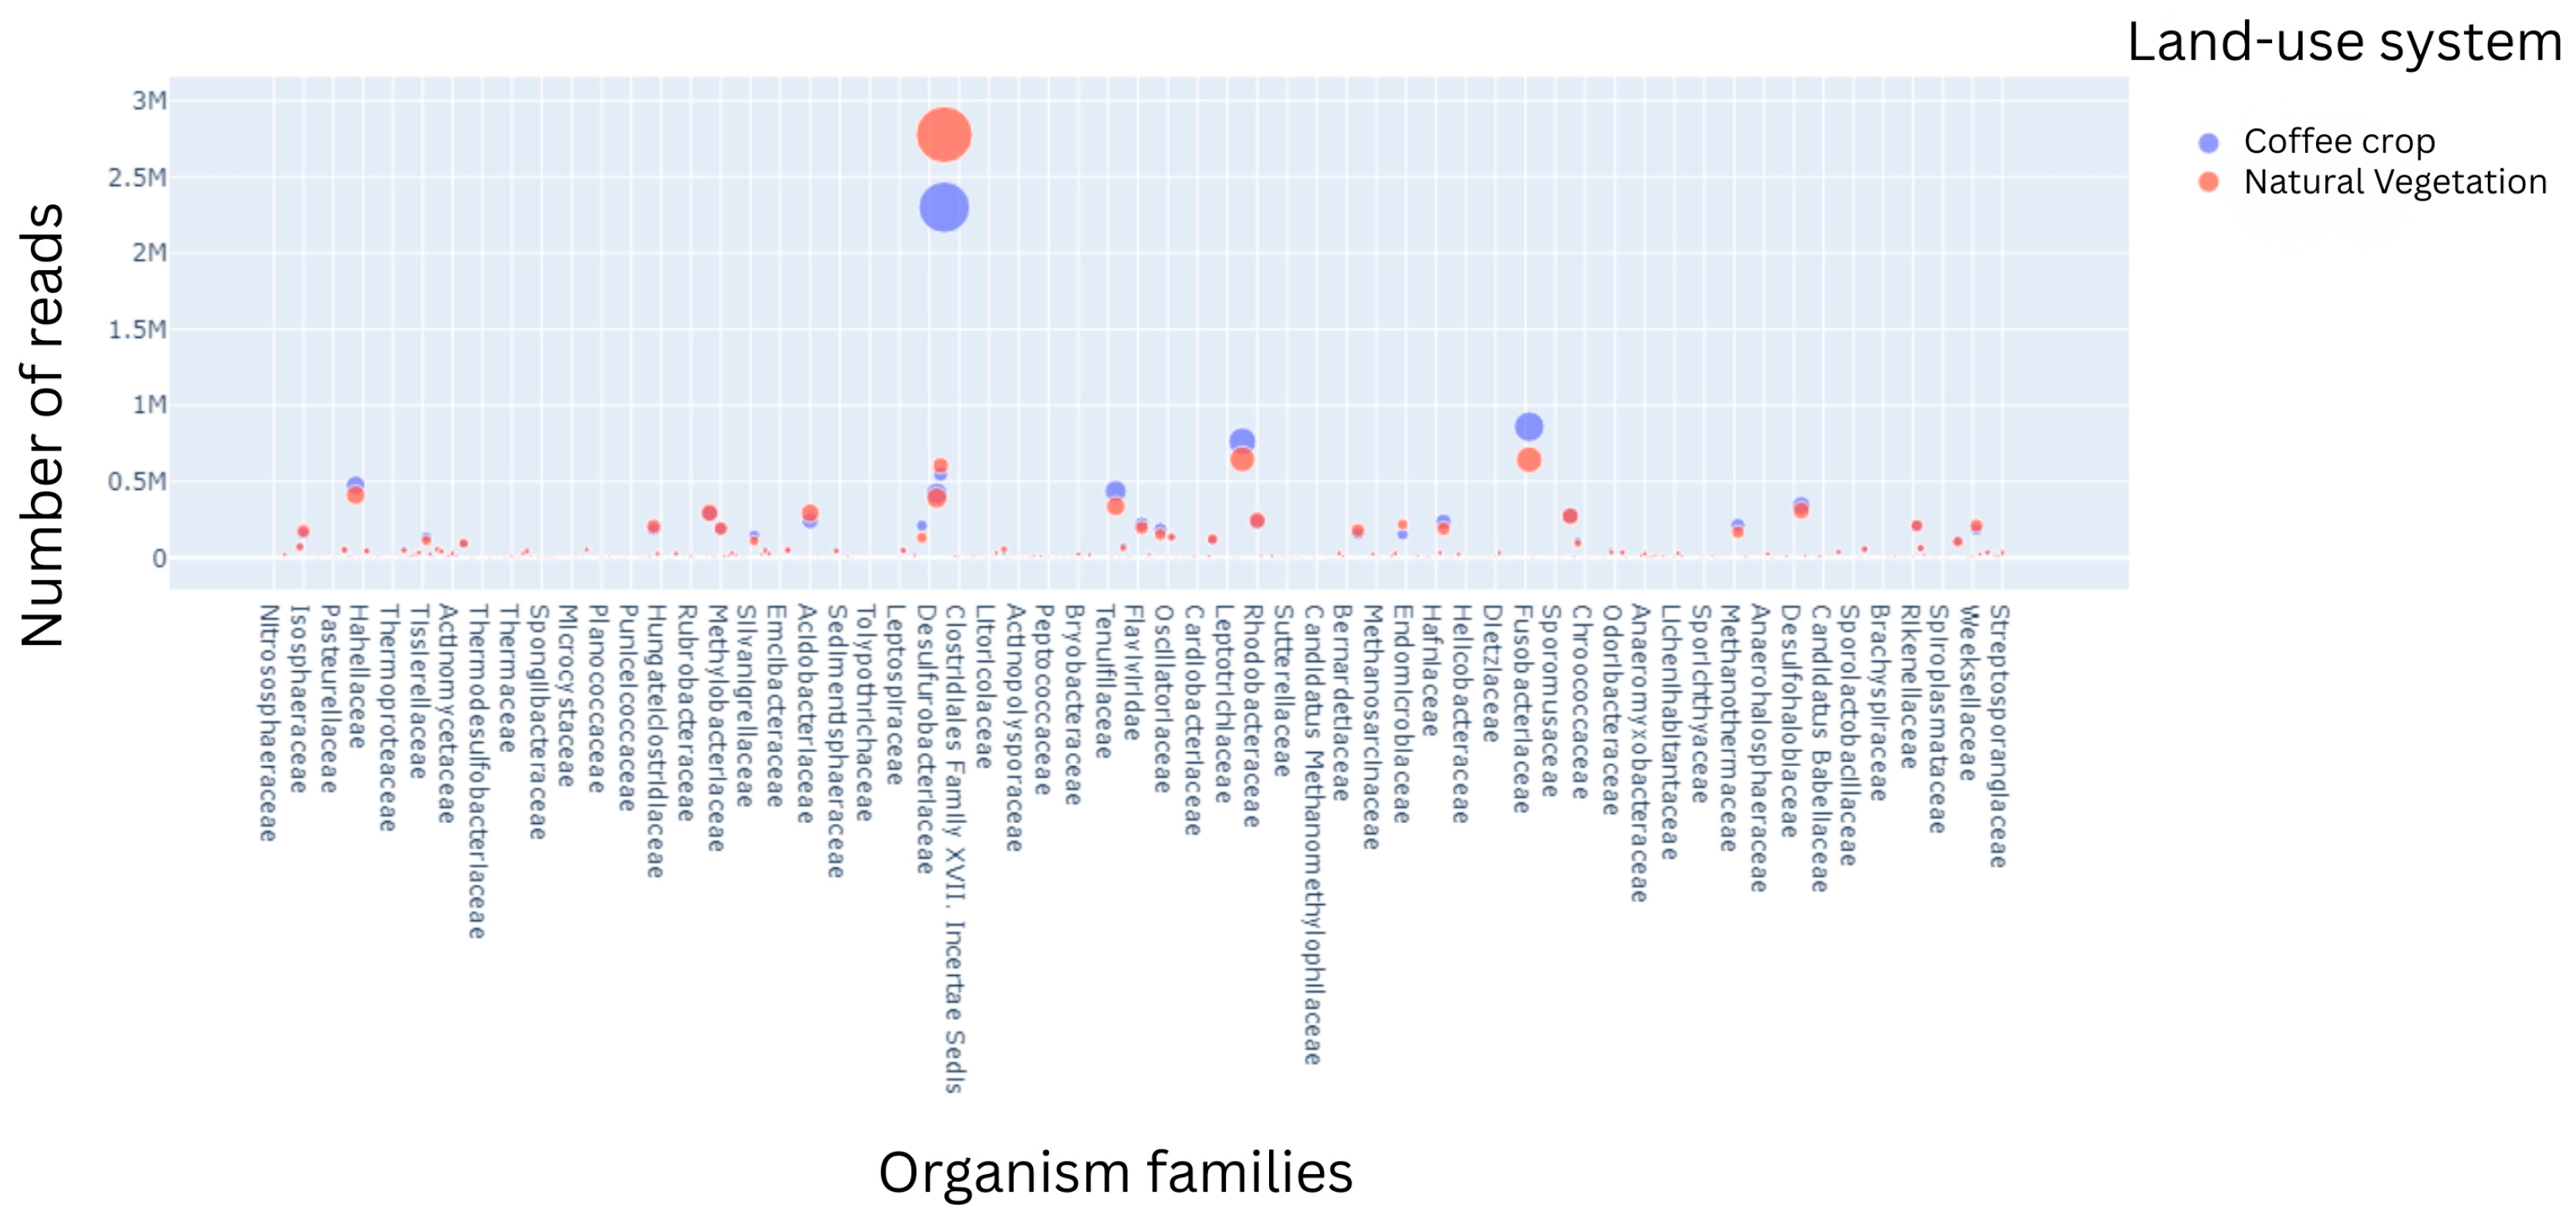
The relative abundance of annotated organism families was compared between pine–oak forest and coffee plantation soils using a bubble plot, in which circle size represents the relative abundance of each annotated family (
Figure 13).
3.6. Soil Fertility Analysis
Soil fertility parameters for both land-use systems are presented in
Table 2. Coffee plantation soils generally exhibited higher concentrations of inorganic nitrogen and available phosphorus than pine–oak forest soils, whereas organic matter content was greater in forest soils.
Available phosphorus increased from 1.5 mg kg−1 in pine–oak forest soils to 2.6 mg kg−1 in coffee plantation soils. Similarly, nitrate nitrogen increased from trace concentrations to 4 mg kg−1, whereas ammonium nitrogen increased from 4 to 15 mg kg−1 in coffee plantation soils compared with the pine–oak forest site.
Exchangeable magnesium and manganese also exhibited greater concentrations in coffee plantation soils, whereas exchangeable sodium, iron, and organic matter were higher in forest soils. Total nitrogen remained relatively similar between land-use systems.
Overall, coffee plantation soils exhibited lower organic matter together with higher concentrations of inorganic nitrogen, phosphorus, and several exchangeable nutrients than pine–oak forest soils.
4. Discussion
Agricultural expansion is a common phenomenon in many countries [
10]. This practice promotes accelerated mineralization of soil organic matter, and this management alters the biodiversity of different bacterial communities and faunal groups, such as nematodes, with a stronger response observed in fungi [
31,
32]. Soil microbial communities are responsible for soil nutrient cycling and are constantly influenced by anthropogenic alterations in productive environments. Although it has been demonstrated that soil microorganisms (bacteria and fungi) and microfauna (nematodes and protozoa) respond positively to soil amendment applications (such as gypsum and organic matter), few experiments have simultaneously investigated the responses of all these organisms throughout the entire soil profile [
10,
31,
32]. In the present study, the largest microbial populations were represented in the following order: bacteria > actinobacteria > fungi and yeasts (
Figure 2). Several studies describe that bacteria play essential roles in metabolic processes and biotechnological applications, and that these microorganisms are the most abundant, especially at contaminated sites [
33,
34,
35,
36]. Therefore, the present study supports the observation that bacteria are the most abundant microorganisms in both agricultural disturbed soils and non-perturbed soils.
Optimal management strategies are essential to maintain soil quality and ensure the long-term sustainability of agricultural production [
37,
38,
39,
40]. Land-use change has been widely associated with changes in soil fertility over recent decades, raising concerns regarding agricultural productivity and ecosystem stability [
41,
42]. Therefore, understanding bacterial community dynamics across different land-use systems is critical [
43]. In the present study, the conversion of pine–oak forest to a three-year-old coffee plantation modified microbial community composition, as reflected by differences in taxonomic structure and relative abundance among microbial groups (
Figure 3 and
Figure 6). In addition to the bacterial and archaeal communities, metagenomic analyses identified sequences assigned to eukaryotic taxa such as
Echinodermata and
Placozoa through taxonomic annotation against the RefSeq database. The detection of sequences assigned to these taxa reflects the presence of environmental DNA within the sampled soils and does not necessarily indicate that living representatives of these organisms inhabit the study sites. Environmental DNA transported through water movement, organic debris, or other natural ecological processes represents one possible explanation for these observations. However, alternative factors, including limitations of reference databases, sequence similarity among conserved genomic regions, or uncertainties in taxonomic assignment of low-abundance sequences, may also contribute to these observations.
Previous studies have reported that agricultural disturbance often reduces microbial biodiversity while increasing microbial biomass, depending on soil type, management intensity, and organic inputs [
31,
32,
44]. In the present study, coffee plantation soils exhibited higher microbial abundance than pine–oak forest soils, which may reflect the higher concentrations of inorganic nitrogen (NH
4+-N and NO
3−-N) and available phosphorus observed in this land-use system (
Table 2), together with differences in management practices between the two sites. Because the coffee plantation was established only three years before sampling, the observed differences in microbial abundance and soil fertility likely represent the early stages of soil ecosystem adjustment.
The higher archaeal abundance observed in coffee plantation soils is particularly noteworthy. Archaea have been shown to be closely associated with key biogeochemical processes, especially under nutrient-limited conditions such as phosphorus deficiency [
45]. The higher archaeal abundance observed in coffee plantation soils may reflect differences in soil physicochemical conditions and nutrient availability associated with agricultural management, particularly with respect to the higher concentrations of inorganic nitrogen (NH
4+-N and NO
3−-N) and available phosphorus measured in this study (
Table 2).
Similarly, eukaryotic microorganisms exhibited higher abundance in coffee plantation soils. Soil eukaryotes, including fungi, protozoa, and nematodes, are sensitive indicators of soil quality and respond rapidly to environmental changes [
46]. The differences observed in eukaryotic community composition suggest that the two land-use systems differed in trophic structure and ecological niches, potentially reflecting the contrasting environmental and management conditions associated with each system.
Omics-based analyses of soil eukaryotes have gained increasing relevance because biological and biochemical indicators often respond more rapidly to subtle environmental changes than traditional physical and chemical soil properties [
47]. Enzyme activities, eukaryotic communities, and nematode assemblages are widely recognized as sensitive indicators of soil quality [
46].
Functional profiling based on COG, KO, and subsystem analyses revealed that although taxonomic composition differed between land-use types, broadly predicted functional profiles inferred from gene annotations were largely comparable between the two land-use systems. Pine–oak forest soils exhibited a greater representation of metabolic and poorly characterized functional categories, indicating broad predicted functional capabilities. In contrast, coffee plantation soils showed a greater representation of functions associated with genetic information processing and metabolism, reflecting differences in the distribution of predicted functional categories between the two land-use systems. These findings are consistent with previous studies showing that differences in soil properties and management practices can influence microbial community composition without necessarily resulting in major differences in predicted functional potential [
44,
45,
46,
47,
48]. The broadly comparable predicted functional profiles observed between the two land-use systems may be consistent with the concept of functional redundancy described for soil microbiomes, whereby distinct microbial communities retain similar predicted functional capabilities despite differences in taxonomic composition. This pattern may reflect differences in nutrient availability measured in this study (
Table 2). The increased representation of genes associated with defense mechanisms and transport processes may indicate microbial communities adapted to the environmental and management conditions of the coffee plantation (
Figure 10). In contrast, pine–oak forest soils exhibited lower representation of these functional categories while maintaining broadly comparable predicted functional profiles (
Figure 10). Overall, the results indicate differences in the predicted functional potential of the soil microbiome between the pine–oak forest and coffee plantation sites, primarily involving functions associated with metabolism, transport, and cellular adaptation.
COG-based functional annotation indicated that pine–oak forest soils contained a broad reservoir of predicted functional potential, particularly associated with metabolic processes. In contrast, coffee plantation soils exhibited a greater representation of functions related to genetic information processing pathways. These findings suggest that the two land-use systems differed in the distribution of predicted functional categories rather than exhibiting a complete restructuring of the predicted functional potential of the soil microbiome.
Environmental genomic approaches enable the inference of ecological and functional patterns from gene annotations without directly measuring gene expression or fitness-related traits and are particularly valuable for evaluating microbial responses across contrasting land-use systems.
The heatmap of predicted functional categories showed broadly comparable predicted functional profiles between the two land-use systems despite differences in microbial community composition. Because these functional profiles were inferred from gene annotations, they represent predicted functional potential rather than direct measurements of functional activity. Accordingly, these results should be interpreted as evidence of similar predicted functional profiles rather than direct confirmation that microbial functions or ecosystem processes were maintained under field conditions. Environmental genomic approaches therefore provide valuable tools for identifying potential functional differences among microbial communities and improving our understanding of ecosystem responses to contrasting land-use conditions [
49].
Although previous studies have reported that forest-to-agriculture conversion may reduce microbial biomass and carbon-related processes [
50], the present study identified broadly comparable predicted functional profiles despite differences in microbial community composition between pine–oak forest and coffee plantation soils.
Overall, the integration of conventional microbiological techniques with metagenomic and bioinformatic analyses provided a comprehensive assessment of differences in soil microbial communities and predicted functional potential between the two studied land-use systems.
Soil fertility analyses revealed clear differences in nutrient availability between pine–oak forest and coffee plantation soils. Coffee plantation soils exhibited higher concentrations of inorganic nitrogen (NO
3−–N and NH
4+–N) and available phosphorus than pine–oak forest soils, whereas total nitrogen remained relatively stable between the two land-use systems. Similar nutrient patterns have been reported in agricultural systems subjected to fertilization and organic residue inputs [
41,
42].
The slightly lower organic matter content observed in coffee plantation soils compared with pine–oak forest soils is consistent with previous studies reporting lower soil organic carbon following forest-to-agriculture conversion, which has been associated with reduced litter inputs and enhanced microbial decomposition [
9,
36]. Nevertheless, both land-use systems retained relatively high organic matter contents, suggesting that the young coffee plantation may still preserve favorable soil conditions, particularly under perennial crop management [
39,
40].
Exchangeable macronutrients exhibited contrasting patterns between the two land-use systems. Exchangeable potassium and magnesium were more abundant in coffee plantation soils, whereas exchangeable calcium remained higher in pine–oak forest soils (
Table 2). These differences may reflect the early effects of agricultural management and differences in nutrient availability between the two land-use systems. Because potassium and magnesium are essential for microbial metabolism and plant growth, their greater availability, together with the higher concentrations of inorganic nitrogen and available phosphorus observed in coffee plantation soils, may have contributed to the higher microbial abundance observed in this land-use system [
32].
Micronutrient concentrations, including iron, manganese, zinc, copper, and boron, were detected in both land-use systems, with differences likely reflecting the contrasting environmental conditions and management practices associated with each system. The acidic soil pH recorded in both environments is known to influence micronutrient solubility and bioavailability, which may, in turn, influence microbial community composition and predicted functional potential [
46,
47]. Because micronutrient concentrations were determined from representative composite soil samples, these values should be interpreted as descriptive measurements rather than statistically replicated estimates.
Overall, the soil fertility results indicate differences in nutrient availability between the two studied land-use systems without evidence of a generalized decline in soil chemical quality. Instead, the two land-use systems exhibited contrasting nutrient distributions, with coffee plantation soils showing higher concentrations of readily available inorganic nutrients. These differences may contribute to the higher microbial abundance observed in the coffee plantation while remaining consistent with the broadly comparable predicted functional profiles identified through gene annotations. These findings suggest that integrated soil management practices may help maintain favorable soil chemical conditions while supporting microbial communities with broadly comparable predicted functional potential [
38,
39].
The findings reported here are limited to the environmental and management conditions evaluated in this young coffee plantation. Although they provide valuable insights into differences in soil microbial communities and their predicted functional potential between the two land-use systems, additional studies including multiple independent sites and biological replicates are needed to determine the consistency of these patterns across different coffee-growing regions and management systems.



 ,
,