Article

Two-Way Information Disclosure and Community-Based Forest Ecotourism Performance: Evidence from Agritourism Operators Around Giant Panda National Park, China

1
School of Tourism, Shanghai Normal University, Shanghai 200234, China
2
Northwest Academy of Forest Inventory, Planning and Design, National Forestry and Grassland Administration, Xi’an 710048, China
3
College of Economics and Management, South China Agricultural University, Guangzhou 510642, China
*
Author to whom correspondence should be addressed.
Forests 2026, 17(7), 845; https://doi.org/10.3390/f17070845
Submission received: 11 June 2026 / Revised: 13 July 2026 / Accepted: 15 July 2026 / Published: 17 July 2026
(This article belongs to the Section Forest Economics, Policy, and Social Science)

Abstract

Community-based forest ecotourism is an important livelihood pathway for communities around protected forests, but household agritourism operators often face ecological regulations, seasonal demand and heterogeneous tourist expectations. These conditions increase information asymmetry and make service matching difficult. This study examines how two-way information disclosure affects business performance in community-based forest ecotourism. Drawing on social penetration theory, we test a chained mechanism linking two-way information disclosure to operational performance. Based on 780 valid questionnaires from agritourism operators and core family managers around Giant Panda National Park, China, this study measures information disclosure practices, service responsiveness, operator-side perceptions of tourist responses and self-reported business performance. The results show that seller- and buyer-side information disclosure significantly enhance perceived identification. Seller information disclosure has relatively stable effects on customer orientation, perceived quality and operational performance, whereas buyer information disclosure mainly works through perceived identification. Perceived quality, perceived value and satisfaction act as partial transmission channels. Heterogeneity analysis shows stronger effects among low-income and newly established operators. The findings provide micro-level evidence for reducing expectation mismatch and strengthening sustainable livelihood capacity in forest protected-area communities.

1. Introduction

Forest-protected areas support biodiversity conservation, water regulation and national ecological security while also providing space for nature education, recreation and ecotourism. The relationship between protected-area tourism and community livelihoods extends beyond a simple chain of resource attraction, tourist consumption and income growth; rather, it is shaped by conservation rules, community assets, visitor behavior, market accessibility and local governance capacity [1,2]. In recent decades, ecotourism has been widely recognized as a feasible pathway to reconcile biodiversity conservation with local livelihood improvement. However, the extant literature repeatedly indicates whether ecotourism can deliver tangible conservation incentives and community economic benefits hinges on coordinated development of community participation, benefit distribution, tourist administration, operational capacity and institutional governance [3,4]. With the continuous advancement of China’s national park institutional reform and ecological product value realization mechanism, peripheral communities of protected forests have transformed from passive recipients of ecological regulation into key suppliers of forest ecotourism services, local cultural display carriers and pivotal implementers of community livelihood transformation. Communities adjacent to Giant Panda National Park are endowed with composite natural resources such as forests, mountain valleys, river basins and rare wildlife habitats alongside indigenous cultural resources. Household-run agritourism businesses not only satisfy tourists’ demands for accommodation, catering and immersive nature experience but also function as critical micro links connecting forest conservation, visitor experience and community revenue generation [5,6].
Community ecotourism involves more than catering and lodging. Operators must comply with ecological redline management, wildlife habitat protection, wildfire prevention and safety rules while responding to diverse tourist needs. The construction of Giant Panda National Park has exerted prominent impacts on surrounding communities reliant on natural resources and ecotourism, driving local households to restructure development strategies amid restricted traditional resource exploitation, ecological compensation policies, alternative livelihood options and eco-friendly business opportunities [7,8]. Prior to consumption, tourists struggle to obtain full information regarding agritourism operators’ actual facility conditions, geographic accessibility, catering quality, outdoor route risks, pricing composition and in-park behavioral codes. Similarly, operators cannot accurately perceive tourists’ consumption budgets, travel motivations, activity preferences, dietary taboos and evaluation criteria. Insufficient information exchange between two parties easily triggers expectation mismatch, service disputes, pricing conflicts and disappointing travel experience, which further impede tourist satisfaction, word-of-mouth spread and business profitability. Distinguished from general physical commodity transactions, tourism products feature experiential consumption, off-site purchase and pre-consumption quality uncertainty, thereby aggravating information asymmetry problems [9,10,11]. Accordingly, adequate, moderate and credible two-way information disclosure between operators and tourists constitutes a crucial entry point for unpacking the formation mechanism of operational performance for community forest ecotourism around protected areas.
Prior studies have provided valuable evidence on forest ecotourism resource evaluation, tourist satisfaction, destination image, community participation, ecological compensation and conservation effectiveness. However, relatively less attention has been paid to the micro-level information interaction between agritourism proprietors and tourists, especially in household-operated ecotourism businesses located around forest-protected areas. In household-operated agritourism, tourist experience is shaped not only by forest landscapes and facilities but also by interactions before, during and after consumption. The abundant tourism and hospitality literature has validated the causal linkage among service quality, perceived value and satisfaction; tourists’ comprehensive trade-off between acquired service benefits and incurred expenses determines their satisfaction judgment and subsequent behavioral intentions [12,13,14]. Within ecotourism contexts, natural-cultural experience, infrastructure and service factors collectively affect tourist satisfaction and loyalty [15], while perceived value influences satisfaction and recommendation intentions across functional, economic and socio-emotional dimensions [16,17]. Seller-side information disclosure mitigates tourists’ uncertainty over service standards and ecological compliance rules, whereas buyer-side information disclosure facilitates operators’ demand identification and customized service adjustment; jointly, the two information disclosure modes lay foundational conditions for stable ecotourism transaction relationships. Incorporating this micro-interactive logic can help explain why geographically proximate agritourism operators with similar resource endowments may still differ in tourist feedback, repeat visitation and operating performance.
Most agritourism homestays surrounding Giant Panda National Park operate on small-scale, family-based and seasonal business models, implying hardware investment and natural resource endowment alone cannot guarantee stable operational returns. Against this backdrop, operators’ credible disclosure of service limitations, ecological constraints and potential travel risks together with tourists’ full expression of consumption preferences and evaluation benchmarks serve as core micro-mechanisms determining service matching efficiency, travel experience quality and final business outcomes. This interactional setting is consistent with social penetration theory, which proposes that reciprocal information sharing promotes mutual understanding and identification [18,19]. Therefore, this study defines two-way information disclosure beyond pre-transaction information notification, framing it as a key precondition for expectation calibration, customized service matching and performance transformation in community forest ecotourism adjacent to protected areas.
Compared with existing research on forest ecotourism and community participation, this study makes three marginal contributions to the extant literature. First, it shifts the research focus from conventional resource-endowment assessment, tourist satisfaction evaluation and destination-image analysis to information interaction between household agritourism operators and tourists, demonstrating that community ecotourism performance is also shaped by disclosure quality rather than only by natural resources and visitor arrivals. Second, this study extends social penetration theory to forest ecotourism research, elaborating how information exchange fosters mutual perceived identification in short-term tourist–consumer interactions and sequentially drives service responsiveness, quality judgment, value assessment and final business outcomes. Third, empirical evidence sourced from agritourism operators around Giant Panda National Park responds to practical dilemmas of peripheral communities balancing ecological supervision limits, household operational constraints and market competition, providing micro-level decision-making references for local livelihood promotion and targeted governance of national park ecotourism.
Based on the above research background, the following three core research questions are proposed: (1) in community forest ecotourism near protected areas, do seller information disclosure and buyer information disclosure positively facilitate perceived identification between operators and tourists?; (2) do perceived identification, customer orientation, perceived quality, perceived value and satisfaction form a chained mediating path linking two-way information disclosure to business performance?; and (3) does the influencing mechanism of information disclosure differ significantly across operators with disparate annual revenue levels and business tenure? By answering these questions, this research unpacks the formative logic of community ecotourism performance from a micro-interaction perspective and delivers practical governance suggestions for sustainable industrial development around Giant Panda National Park.

2. Theoretical Foundation and Research Hypotheses

2.1. Two-Way Information Disclosure

Information asymmetry persists between homestay operators and tourists regarding service conditions, ecological compliance restrictions, consumption preferences and evaluation criteria within protected-area community ecotourism. Information economics theory argues that unbalanced information possession across transaction parties triggers adverse selection, distorted market signals and lowered trading efficiency, while credible information disclosure alleviates market uncertainty effectively [9,20,21]. In this paper, two-way information disclosure refers to reciprocal communication between operators and tourists about service conditions, prices, preferences, travel motivations, ecological restrictions and evaluation criteria. Such communication is expected to reduce expectation gaps and service friction. It highlights reciprocal information exchange rather than one-sided commercial promotion by operators to eliminate misunderstanding, rationalize consumption expectation and boost service matching efficiency. For homestay operators near Giant Panda National Park, seller information disclosure (SD) covers accommodation and catering standards, pricing rules, geographic accessibility, service scope limitation, credit commitments, travel safety hazards and ecological protection regulations; buyer information disclosure (BD) refers to tourists’ explicit expression of consumption budget, companion composition, dietary restrictions, activity inclination, travel purposes and satisfaction evaluation criteria. Given the dual attributes of consumption value and ecological compliance embedded in protected-area ecotourism, information disclosure not only improves tourist experience but also facilitates implementation of wildfire prevention, wildlife conservation, visitor behavioral management and orderly community operation. Thus, two-way information disclosure constitutes the logical starting point connecting ecological regulation, service coordination and business performance.

2.2. From Information Exchange to Perceived Identification

Social penetration theory constitutes the core theoretical framework for the empirical model. The theory states interpersonal relationships evolve from superficial information exchange to in-depth mutual comprehension and identity recognition, which fits the analytical context of short-term operator–tourist interactions shaping perceived identification in ecotourism scenarios [18,19]. Despite transient contact between tourists and homestay proprietors, high interaction intensity of ecotourism enables trust building, demand screening and service negotiation within limited staying periods. Accordingly, this research treats information disclosure as the initiation of relational penetration and perceived identification (PI) as the core psychological outcome after bilateral information sharing. Perceived identification does not require complete value consistency. It refers to mutual understanding of each party’s needs, constraints and evaluation standards. Such understanding may reduce defensiveness and transaction conflict. Prior studies confirm reciprocal information disclosure accelerates trust and mutual understanding during interpersonal encounters, and short-term service contact can be interpreted as situational relational penetration [19,22]. Hence, SD and BD are set as two independent antecedent variables of PI, with corresponding hypotheses specified as below:
H1. 
Seller information disclosure (SD) has a positive effect on perceived identification (PI).
H2. 
Buyer information disclosure (BD) has a positive effect on perceived identification (PI).

2.3. From Perceived Identification to Service Matching, Quality Judgment and Value Evaluation

Following mutual perceived identification, information advantages are translated into tangible service behaviors via customer orientation (CO), defined as operators’ proactive willingness to introduce service items, customize matched arrangements and resolve consumer complaints based on clarified tourist demands. The literature on market orientation and customer orientation verifies that businesses with stronger demand identification and response capacity achieve superior service assessment and operational returns [23,24]. Within service contexts, customer orientation manifests as active demand inquiry, detailed service interpretation and dispute settlement, indirectly shaping tourists’ perceived quality, destination impression and satisfaction [25,26]. With clear knowledge of tourists’ budgets, travel motivations and personalized preferences, operators can provide customized accommodation, catering and outdoor experience arrangements, which may subsequently be reflected in tourists’ feedback on service quality and consumption value. In this study, perceived quality (PQ) reflects perceived service reliability, demand fulfillment and overall service standards from the operator-reported survey, rather than tourists’ direct psychological evaluation. Perceived value (PV) reflects value-related responses concerning price-quality matching, communication effectiveness and mutual understanding. Classic SERVQUAL framework identifies reliability, responsiveness, assurance, empathy and tangibility as five core dimensions of service quality, and existing research confirms that service quality and perceived value jointly determine tourist satisfaction and post-consumption behavioral intentions [14,27,28]. For protected-area agritourism homestays, favorable PQ and PV are more likely to arise from considerate customized arrangements and realistic service commitments rather than luxurious hardware facilities alone. Recent ecotourism research further validates natural-culture experience, infrastructure and customized service jointly drive tourist satisfaction, revisit intention and positive word-of-mouth, while multi-dimensional perceived value determines satisfaction and loyalty inclination [16,17]. In the empirical part, PQ, PV and SAT are measured through operators’ reports rather than direct tourist responses. Based on the above theoretical reasoning, subsequent hypotheses are proposed:
H3. 
Seller information disclosure (SD) has a positive effect on customer orientation (CO).
H4. 
Perceived identification (PI) has a positive effect on customer orientation (CO).
H5. 
Seller information disclosure (SD) has a positive effect on perceived quality (PQ).
H6. 
Perceived identification (PI) has a positive effect on perceived quality (PQ).
H7. 
Customer orientation (CO) has a positive effect on perceived quality (PQ).
H8. 
Buyer information disclosure (BD) has a positive effect on perceived value (PV).
H9. 
Perceived identification (PI) has a positive effect on perceived value (PV).
H10. 
Perceived quality (PQ) has a positive effect on perceived value (PV).

2.4. From Satisfaction to Business Performance

Satisfaction (SAT) is operationalized in this study as operators’ reported perception of tourists’ aggregate post-consumption satisfaction, rather than as tourists’ direct psychological evaluation. Operational performance (OP) is measured via revenue growth, rising repeat customer volume and accumulated favorable customer comments. Given the small-scale household operation mode of sample homestays, word-of-mouth communication and repeat patronage dominate business revenue, making SAT a vital intermediate variable that links service experience feedback with tangible operational gains. Tourist satisfaction is determined comprehensively by service quality-price matching, emotional reward, social interaction, natural-cultural experience and pre-travel expectation realization [13,15]. This study assumes that CO, PQ and PV significantly elevate SAT, which further improves OP; meanwhile, SD, BD and CO may impose direct impacts on OP. Corresponding research hypotheses are listed as follows:
H11. 
Customer orientation (CO) has a positive effect on satisfaction (SAT).
H12. 
Perceived quality (PQ) has a positive effect on satisfaction (SAT).
H13. 
Perceived value (PV) has a positive effect on satisfaction (SAT).
H14. 
Seller information disclosure (SD) has a positive effect on operational performance (OP).
H15. 
Buyer information disclosure (BD) has a positive effect on operational performance (OP).
H16. 
Customer orientation (CO) has a positive effect on operational performance (OP).
H17. 
Satisfaction (SAT) has a positive effect on operational performance (OP).
In summary, this research establishes a chained empirical framework initiating from two-way information disclosure, passing through intermediate variables of PI, CO, PQ, PV and SAT, and terminating at OP to depict the formation mechanism of community forest ecotourism operational performance near protected areas.

3. Materials and Methods

3.1. Study Area

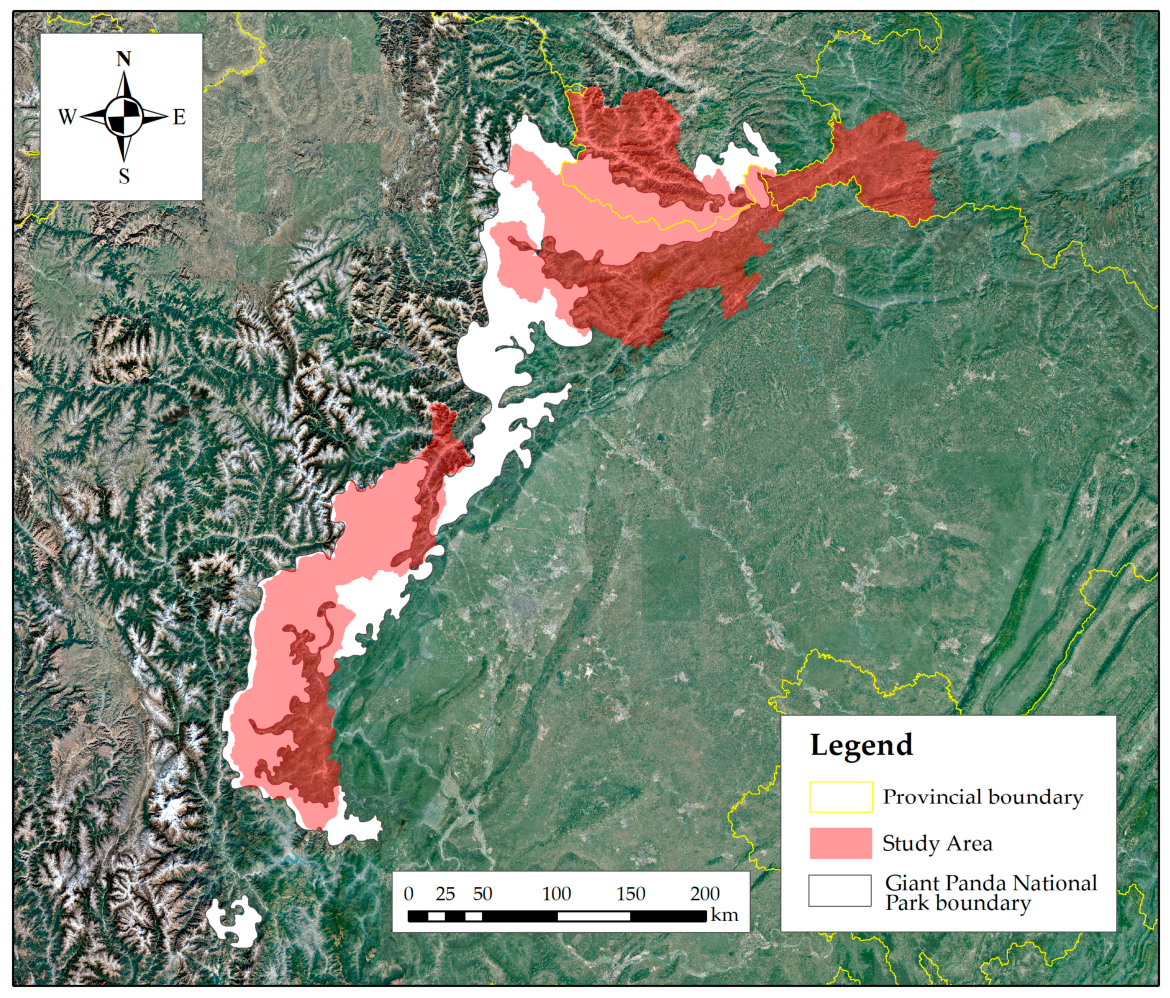
Giant Panda National Park functions as a core ecological security barrier and biodiversity conservation hotspot in China, whose surrounding communities have long developed ecotourism dependent on native forests, mountain terrain, river resources and flagship wildlife species. Distinguished from ordinary rural tourism destinations, ecotourism businesses adjacent to the national park feature strong natural-resource reliance and strict ecological regulation constraints: on the one side, forest scenery, wild animal watching, nature education and eco-exploration constitute core travel incentives; on the other side, operators must strike dynamic balance among protected-area administration, ecological risk prevention, community daily governance and tourist experience optimization. Existing studies on Giant Panda National Park document prominent practical dilemmas including local livelihood restructuring, eco-friendly job cultivation and policy adaptation amid stringent conservation requirements [7,8]. This study selects key entrance communities of the Giant Panda National Park and adjacent ecotourism communities across Sichuan, Shaanxi and Gansu provinces as research sites, as shown in Figure 1.
Specifically, the study areas are mainly located in the entrance service zones, nature education and exhibition sites, and surrounding ecotourism service belts of the national park. These areas share common characteristics including farmhouse hospitality operations, visitor reception, community participation and eco-experience services. The detailed sample distribution is presented in Table 1.

3.2. Data Collection

Questionnaire surveys targeted household agritourism proprietors or core family management members running homestays around Giant Panda National Park. Communities were purposively selected from entrance service zones, nature-education sites and surrounding ecotourism service belts in the eight counties listed in Table 1. Eligible respondents were owners or core family managers who were directly involved in daily operation and could answer questions on service interaction and business performance. Operators were approached through community contacts and on-site visits; unavailable or non-consenting businesses were excluded, and only one questionnaire was retained per business. The questionnaire covered two-way information disclosure, customer orientation, perceived tourist responses on quality, value and satisfaction, and self-reported changes in operational performance. Before formal filling, investigators introduced research objectives, questionnaire rules and anonymous data processing standards to all respondents and collected questionnaires after obtaining informed consent. Questionnaires with excessive missing values, consistent single-option filling, logical contradictions or abnormal completion duration were eliminated during preliminary screening, leaving a final dataset of 780 valid observations.
All raw questionnaire data, latent variable scores and empirical output tables are archived in standardized Excel documents for data traceability; each latent variable is calculated as arithmetic average of three corresponding Likert measurement items. Descriptive statistics, correlation matrix calculation, path regression, heterogeneity grouping and robustness checks are all computed based on the consolidated dataset. To reduce common method bias and careless responses, participation was anonymous, items from different constructs were interspersed rather than grouped, and questionnaires with excessive missing data, invariant responses, logical contradictions or abnormal completion times were excluded [29]. Structural Equation Modeling (SEM) and staged regression are adopted to verify multi-variable chained relationships, accompanied by standard reliability-validity test, common method deviation diagnosis and robustness examination to enhance empirical credibility [30]. The sample size of 780 is adequate for SEM estimation with eight latent constructs and 24 observed indicators and also supports subgroup heterogeneity analysis and robustness checks.

3.3. Variable Measurement

All core constructs are measured via five-point Likert scales, ranging from 1 (strongly disagree or extremely low level) to 5 (strongly agree or extremely high level). Eight latent variables are designed in total, each matched with three observable measurement items, forming 24 core indicators as displayed in Table 2. SD measures operators’ information transparency on business status, cost pricing, service credit, travel risks and ecological compliance clauses; BD quantifies tourists’ active disclosure of payment capacity, consumption preference and travel motivation; PI and CO measure operators’ perceived mutual recognition and customer-oriented behavior, whereas PQ, PV and SAT capture operators’ reports of tourists’ quality, value and satisfaction responses. OP captures operators’ perceived improvement in annual revenue, repeat customer volume and positive feedback, rather than audited financial performance. PQ, PV and SAT are therefore proxy measures of tourist responses rather than direct measures of tourists’ psychological states. This proxy approach was used because matched tourist surveys were not consistently available across the dispersed household businesses. Latent variable scores are aggregated by averaging respective three measurement items, and standardized scores are applied in SEM path estimation to unify dimensional metrics across constructs.
The empirical analysis follows the logical chain: Information Disclosure → Perceived Identification → Customer Orientation → Perceived Quality and Value → Satisfaction → Operational Performance. Analytical procedures are specified as: (1) descriptive statistical analysis on sample distribution and latent variable characteristics; (2) scale reliability and convergent validity verification via Cronbach’s α, KMO, Bartlett’s sphericity test, composite reliability (CR) and average variance extracted (AVE); (3) Harman single-factor test to diagnose common method bias and Fornell–Larcker criterion for discriminant validity; (4) SEM path coefficient estimation and significance test; and (5) multi-group heterogeneity regression, alternative dependent variable substitution, control-variable addition and competing model comparison for robustness validation. SD and BD are defined as exogenous constructs, while PI, CO, PQ, PV, SAT and OP serve as endogenous variables. Recognizing OP is simultaneously affected by geographic accessibility, seasonal visitor fluctuation, household labor endowment, online platform exposure and historical word-of-mouth stock, this research focuses on identifying the phased transmission mechanism of information disclosure rather than constructing a full-factor performance prediction equation.

4. Results

4.1. Descriptive Statistics

Descriptive statistics were first calculated for the eight latent variables to examine the overall distribution of information disclosure, service response, operator-reported perceptions of tourist responses and operational performance. As shown in Table 3, all variables range from 1 to 5, indicating that the five-point Likert scale was fully used by respondents. The absolute values of skewness and kurtosis are within an acceptable range, suggesting that the latent variable scores do not show severe distributional distortion and are suitable for subsequent reliability, validity and path analyses.
CO, PQ and SAT have relatively higher mean values, indicating stronger customer-oriented behavior and more favorable operator-reported perceptions of tourist quality and satisfaction responses. By contrast, BD, PV and OP have lower mean scores, implying notable room for improvement in tourists’ active demand expression, bilateral value matching and the conversion of service experience into operating returns. This statistical feature is consistent with the inherent operational characteristics of small-scale, family-owned and season-sensitive homestay businesses surrounding Giant Panda National Park and further demonstrates that optimizing information disclosure and service matching constitutes a key approach to improve the overall quality of local forest ecotourism.

4.2. Reliability, Convergent Validity and Common Method Bias

Reliability and validity test results show that the Cronbach’s α coefficient of each latent variable exceeds 0.800, proving satisfactory internal consistency of all subscales (Table 4). The overall Cronbach’s α of the full questionnaire is 0.735, reaching the acceptable threshold. It should be noted that the whole questionnaire covers multiple theoretical dimensions ranging from information exchange and relational identification to service evaluation and business outcome; these constructs belong to different conceptual domains, so a lower overall α relative to individual dimension α values does not indicate defective measurement but reflects the relative independence of each latent variable. The overall KMO value is 0.732, and Bartlett’s sphericity test is statistically significant at the 1% level, confirming the dataset is suitable for factor analysis. All latent variables have high CR values and AVE above 0.500, which supports favorable convergent validity of the measurement model, alongside high standardized factor loadings for individual measurement items. Given all data are collected via a single questionnaire survey, Harman’s single-factor test is used to assess common method bias. The first unrotated factor explained 14.20% of the variance, suggesting that no single factor dominated the covariance structure. However, Harman’s test cannot eliminate all forms of single-source bias, so the results should still be interpreted with appropriate caution. Combined with sample size and item quantity, no excessive variance concentration occurs, verifying each variable retains independent informational content.

4.3. Correlations and Discriminant Validity

Pearson correlation results show that the correlations among latent variables are generally weak. Most correlation coefficients remain at low levels, which proves two-way information disclosure, relational identification, service orientation, quality-value judgment, satisfaction and business performance have consistent positive statistical correlations without severe multicollinearity or variable overlap. Specifically, seller information disclosure (SD) is weakly positively correlated with perceived identification (PI) and customer orientation (CO), while buyer information disclosure (BD) has a weak positive correlation with PI. It preliminarily confirms that two-way information disclosure can correspondingly promote subsequent relational identification and service-related variables yet bears limited explanatory power. In accordance with the Fornell–Larcker criterion for discriminant validity, the square roots of AVE values on the diagonal are significantly higher than correlation coefficients in corresponding rows and columns, indicating satisfactory discriminant validity across all latent variables. Although all variables constitute an integrated influence chain, they maintain the following clear conceptual boundaries: SD and BD function as upstream information input variables; PI and CO are intermediate variables reflecting relationship development and service response; perceived quality (PQ), perceived value (PV), and satisfaction (SAT) represent downstream operator-reported evaluations, while operational performance (OP) represents perceived operational improvement. Low overall correlation coefficients further verify that OP is jointly affected by natural resource endowment, location accessibility, seasonal passenger flow, platform exposure and accumulated reputation apart from information disclosure, which justifies the adoption of path analysis to identify the staged transmission effect rather than simple linear regression.
Table 5 and Table 6 demonstrate no serious overlap among research variables, which supports subsequent path analysis to distinguish the links of information disclosure, relational identification, service response, quality-value evaluation and business performance. Meanwhile, low pairwise correlation coefficients reveal that community forest ecotourism performance cannot be determined by single perceptual factor but is subject to multiple confounding factors including resource condition, geographic accessibility, seasonal visitor volume, online platform exposure and historical reputation.

4.4. Model Fit and Path Coefficients

The structural equation model fitting results (Table 7) show CMIN/DF = 2.914, RMSEA = 0.050, CFI = 0.987, IFI = 0.987, and NFI = 0.979. All fitting indices reach acceptable or excellent standards, which proves the proposed chained theoretical model fits sample covariance well. Nevertheless, favorable overall model fitness does not mean every path has strong explanatory power, nor can information disclosure independently determine business performance. Combined with low correlation coefficients in Table 5, this study focuses on explaining the theoretical mechanism and staged influence of information disclosure rather than constructing a high-precision prediction model for operational performance.
Path estimates (Table 8) indicate that two-way information disclosure has statistically significant but modest effects on PI, suggesting that its clearest role is to support mutual understanding and expectation coordination. Specifically, SD significantly affects PI, CO and PQ; operators’ transparent disclosure of service items, pricing rules, credit commitments, safety risks and ecological protection requirements helps tourists better understand service constraints and park management rules, thereby improving subsequent service evaluations. By contrast, BD significantly predicts PI but has insignificant direct effects on PV and OP, which implies tourists’ demand disclosure mainly serves as the precondition of mutual recognition instead of directly generating economic benefits. The largest supported paths were BD → PI (β = 0.129), SD → CO (β = 0.116) and SD → PI (β = 0.109), whereas PI → PQ, BD → PV, BD → OP and CO → OP were not significant. Thus, the results support a staged and conditional mechanism rather than a uniformly strong causal chain.
Path analysis further reveals that the performance-related effect of two-way information disclosure follows a segmented transitional logic rather than a fully continuous transmission process. SD improves PI, CO, PQ and OP by releasing transparent operational information, whereas BD only significantly improves PI and does not directly affect PV or OP. Among downstream variables, PQ, PV and SAT provide partial but important channels through which information advantages are transformed into experiential evaluation and business outcomes. Therefore, two-way information disclosure should be understood as a relational coordination mechanism that reduces expectation mismatch and supports service matching, rather than as an independent or sufficient determinant of operational performance in protected-area community ecotourism.

4.5. Heterogeneity Analysis, Robustness Checks and Model Comparison

Grouped heterogeneity regression shows that the effects of information disclosure and satisfaction differ among operators with disparate operational foundations (Table 9). SD and SAT are significant at the 5% level within the low annual-income group; SD is statistically significant for operators with short business tenure. By contrast, all direct paths lose statistical significance for high-income and long-tenure samples. Such findings indicate the marginal contribution of information disclosure to performance is more prominent for newly established and small-income operators, whereas performance gaps among mature businesses are mainly determined by brand accumulation, superior geographic location and long-term reputational stock beyond the research framework.
Robustness tests are conducted via the following two approaches: first, OP is reconstructed by averaging OP1 (economic revenue growth) and OP2 (repeat customer increase) as an alternative dependent variable; second, control variables including operator age, education years, operating years and annual revenue are added into the baseline model. As shown in Table 10, SD and SAT remain statistically significant at the 5% level in both robustness specifications, while BD and CO cannot maintain stable significance. This indicates that SD and SAT are the most consistent predictors in the tested specifications, although their coefficients remain modest. Competing model comparison confirms the complete chained benchmark Model D outperforms other simplified models with lower AIC and higher CFI, which verifies incorporating PI, CO, PQ, PV and SAT greatly improves overall model explanatory power (Table 11).
Heterogeneity and robustness results jointly confirm SD and SAT have stable explanatory effects on OP, whereas the direct impacts of BD and CO are unstable. Subgroup results verify that SD works better for low-income and newly founded operators, who rely more heavily on transparent information disclosure to reduce transaction misunderstanding and improve customer responses. The better fit of Model D indicates that the mediating constructs improve the representation of the proposed mechanism.

5. Discussion and Theoretical Implications

5.1. Interpretation of Main Findings

This study examines two-way information disclosure as a micro-level mechanism linking ecological constraints, tourist experience and operator-reported performance in community forest ecotourism. Unlike general rural tourism and standardized hotel industries, homestay operators surrounding Giant Panda National Park need to abide by rigorous management rules including wildfire prevention, wildlife habitat protection and visitor code administration while providing basic catering and accommodation services. The empirical findings confirm that information disclosure primarily functions to calibrate pre-consumption expectations and realize bilateral mutual understanding: operators reduce tourists’ uncertainty by fully disclosing service limits, pricing composition and ecological risk regulations; meanwhile, tourists’ personalized demand disclosure facilitates operators to implement targeted service matching. In this sense, two-way information disclosure should not be understood merely as a marketing tool, but as a low-cost governance mechanism through which protected-area communities coordinate ecological regulations, visitor behavior and household livelihood adaptation.
Perceived identification (PI) and customer orientation (CO) provide partial intermediate links through which information disclosure may be translated into service-related outcomes, although the transmission process is not fully significant across all hypothesized paths. The empirical data show both SD and BD can significantly boost PI, proving information exchange helps build mutual understanding between operators and tourists; PI exerts marginally positive effects on CO, which indicates mutual recognition is conducive to operators carrying out demand-oriented service behaviors. Nevertheless, incomplete significant paths reveal that information advantages cannot spontaneously translate into operating profits without reliable service delivery, high-quality travel experience and favorable external operating conditions. This conclusion coincides with classic service value theories, which hold that promised information can only be converted into tangible business gains after being reflected in perceived quality and value [12,14,16].
Satisfaction (SAT) maintains a stable positive influence on operational performance (OP), although the correlation between the two constructs remains low. The significant SAT → OP path is verified in the baseline model and robustness checks, suggesting that satisfaction is an important antecedent of income growth, repeat visitation and positive customer responses. However, the weak correlation coefficient also indicates that operational performance is jointly shaped by geographic location, business scale, visitor source structure, seasonality and online platform exposure. Therefore, performance improvement for homestays around national parks cannot simply rely on price reduction or hardware upgrading. Instead, standardized disclosure of pricing rules, service boundaries and ecological requirements may help stabilize tourists’ value judgments and support the gradual conversion of satisfaction into repeat consumption and positive word-of-mouth.
Heterogeneous operating conditions lead to differentiated marginal returns brought by information disclosure optimization. Seller information disclosure (SD) generates more obvious performance promotion effects among low-income and newly opened homestays whose profit growth heavily relies on transparent information communication to cut information friction and consumer disputes. For mature long-running operators, information disclosure is still essential, yet its profit-promoting effect needs to be matched with brand construction and service process optimization. These heterogeneous effects support targeted assistance. Management agencies should prioritize standardized disclosure guidance for newly established and small-scale operators, which face higher communication costs and weaker market access.
It is worth noting that the relatively low path coefficients observed in this research do not deny the practical value of two-way information disclosure but reflect the complicated composition of influencing factors on homestay operating benefits. The relatively small coefficients should therefore be interpreted as evidence of a limited but meaningful coordination effect, rather than as evidence that information disclosure is the dominant determinant of operational performance. Different from chain hotels and large scenic spot operators, sample homestays are restricted by household labor constraints, dramatic seasonal passenger volatility, uneven online platform exposure, differentiated geographic accessibility and strict ecological supervision policies. Information disclosure mainly realizes expectation alignment and conflict mitigation, and its economic benefits accumulate gradually with the improvement of service experience instead of bringing immediate profit surge. Hence the core contribution of this paper lies in revealing the microscopic interaction mechanism rather than fully explaining all performance discrepancies among sample operators.

5.2. Theoretical Implications

Previous studies of forest protected areas have emphasized community participation, conservation outcomes and livelihood effects [1,2,3,4,5,6,7,8], while tourism service research has established the quality–value–satisfaction relationship [12,13,14,15,16,17]. This study connects these two streams by placing two-way information disclosure upstream of service evaluation and by showing that its effects are modest and mainly transmitted through identification and operator-reported experiential responses. When operators truthfully announce accommodation conditions, charging standards, potential travel risks and relevant ecological protection clauses, tourist misunderstandings over park peripheral services can be effectively reduced and service matching efficiency improved. Accordingly, the operation of community forest ecotourism is not merely the commercial development of natural resources, but a lasting coordination process covering service capacity, consumption expectation and ecological regulatory requirements between both transaction parties.

6. Management Implications

6.1. Policy Implications for Park and Government Authorities

First, competent authorities should compile a unified information disclosure checklist for community ecotourism around forest protected areas, covering accommodation standards, catering specifications, pricing composition, traffic information, safety hazards, fire prevention rules, wildlife protection norms, service commitments and complaint channels. Operators can release relevant information through online booking pages, physical price tags, in-house prompt cards and on-site explanations to avoid post-arrival expectation gaps caused by insufficient pre-travel information.
Second, apart from providing daily catering and accommodation, homestay operators near Giant Panda National Park act as important information bridges linking tourists with local natural resources and indigenous culture. Park administrative departments should organize regular training covering ecological interpretation, communication skills, pricing explanation, risk reminding and dispute settlement, enabling operators to transform official ecological management requirements into easy-to-understand service descriptions for visitors, which is consistent with existing research conclusions on community capacity building [4]. Based on the heterogeneity results, park authorities should prioritize standardized disclosure templates and ecological communication materials for novice and small-scale homestays. National park regulators can combine tourist feedback, homestay operating status and ecological protection targets to build a coordinated governance system balancing biodiversity conservation and resident income growth.

6.2. Practical Guidance for Homestay Operators

Online travel platforms and homestay operators can set optional pre-booking forms to collect tourists’ information including travel budget, dietary restrictions, companion composition and travel preferences. Sufficient buyer information disclosure (BD) helps operators arrange accommodation, catering and outdoor routes in advance to reduce on-site service mismatch; meanwhile, information collection should follow the principles of moderation and privacy protection and avoid excessive collection of irrelevant personal information.
Homestay operators shall regularly sort out tourist complaints, review feedback, repeat customer data and income changes to identify omitted information items and defective service links. Local communities can build experience sharing platforms to realize inter-firm experience spillover and overall service upgrade. Mature operators are encouraged to combine standardized information disclosure with brand development, eco-education operation and online reputation maintenance, forming a virtuous cycle between individual income growth and the improvement of the national park’s overall destination image.

7. Conclusions

Taking agritourism homestay operators around Giant Panda National Park as the research object, this study constructs and empirically tests a staged chained influence model of two-way information disclosure on community forest ecotourism performance. The results show that both seller information disclosure (SD) and buyer information disclosure (BD) significantly enhance perceived identification (PI), indicating that bilateral information exchange first promotes expectation adjustment and mutual understanding between operators and tourists. Subsequently, customer orientation (CO), perceived quality (PQ), perceived value (PV), and satisfaction (SAT) form sequential intermediate links through which information disclosure may affect operational performance (OP). However, the inconsistent significance of all paths shows that the influence chain is phased and conditional rather than fully continuous. Overall, SD and operator-reported SAT show the most consistent, though modest, positive associations with OP, whereas BD and CO do not show stable direct associations.
Theoretically, this study introduces social penetration theory into forest protected-area ecotourism research and confirms that even short-term consumption interactions between tourists and operators can generate perceived identification through information exchange. Such identification may further support service response, tourist responses and self-reported operational improvement. Practically, the development of community ecotourism around national parks cannot rely solely on natural resource endowment or tourist volume. Transparent and appropriate two-way information disclosure can reduce pre-transaction information asymmetry, improve service matching efficiency and help transform satisfaction into repeat visits and positive reviews. More importantly, it provides a feasible micro-governance approach for balancing ecological regulation, visitor experience and household livelihood improvement in forest protected-area communities.
This research still has several limitations. First, research samples are limited to homestay businesses surrounding Giant Panda National Park, so research conclusions cannot be arbitrarily generalized to other types of forest reserves, suburban forest parks and large-scale tourism enterprises. Second, PQ, PV and SAT are operator-reported proxies for tourist responses, and all constructs were collected from the same respondent. Future studies should combine matched tourist surveys with objective income, platform ratings and repeat-visit records to reduce single-source bias and improve measurement objectivity. Third, cross-sectional questionnaire data cannot identify dynamic causal relationships over time, and follow-up longitudinal tracking surveys or experimental design can be adopted to verify the applicability of the information disclosure mechanism in diverse ecotourism scenarios.


Author Contributions

Conceptualization, Z.Z. and W.D.; methodology, Z.Z.; investigation, Z.Z., S.Y. and G.Z.; data curation, Z.Z. and S.Y.; formal analysis, Z.Z., J.S. and W.D.; writing—original draft preparation, Z.Z.; writing—review and editing, Z.Z., J.S., W.D. and G.Z.; supervision, J.S., W.D. and G.Z. All authors have read and agreed to the published version of the manuscript.

Funding

This research was funded by General Program of Guangdong Basic and Applied Basic Research Foundation, funding number 2023A1515010917, and Young Scientists Fund of the National Social Science Fund of China, funding number 23CGL046.

Institutional Review Board Statement

Ethical review and approval were waived for this study because the survey was anonymous, non-interventional and did not collect personally identifiable or sensitive personal information. The study was conducted in accordance with the ethical principles for social science questionnaire research.

Data Availability Statement

The raw questionnaire data and hand-drawn cognitive map data generated and analyzed during this study are not publicly available due to privacy restrictions and relevant institutional regulations. The datasets used in the current study can be obtained from the corresponding author upon reasonable request.

Acknowledgments

The authors thank the agritourism operators and community managers around Giant Panda National Park who participated in the questionnaire survey.

Conflicts of Interest

The authors declare no conflicts of interest.

References

  1. Stone, M.T.; Nyaupane, G.P. Protected areas, tourism and community livelihoods linkages: A comprehensive analysis approach. J. Sustain. Tour. 2016, 24, 673–693. [Google Scholar] [CrossRef] [Scilit]
  2. Stone, M.T.; Stone, L.S.; Nyaupane, G.P. Theorizing and contextualizing protected areas, tourism and community livelihoods linkages. J. Sustain. Tour. 2022, 30, 2495–2509. [Google Scholar] [CrossRef] [Scilit]
  3. Samal, R.; Dash, M. Ecotourism, biodiversity conservation and livelihoods: Understanding the convergence and divergence. Int. J. Geoherit. Parks 2023, 11, 1–20. [Google Scholar] [CrossRef] [Scilit]
  4. Giampiccoli, A.; Glassom, D. Community-based tourism in protected areas: Elaborating a model from a South African perspective. Adv. Hosp. Tour. Res. 2021, 9, 106–131. [Google Scholar] [CrossRef] [Scilit]
  5. Ma, B.; Yin, R.; Zheng, J.; Wen, Y.; Hou, Y. Estimating the social and ecological impact of community-based ecotourism in giant panda habitats. J. Environ. Manag. 2019, 250, 109506. [Google Scholar] [CrossRef] [Scilit] [PubMed]
  6. Zhou, W.; Zheng, B.; Zhang, Z.Q.; Song, Z.J.; Duan, W. The role of eco-tourism in ecological conservation in giant panda nature reserve. J. Environ. Manag. 2021, 295, 113077. [Google Scholar] [CrossRef] [Scilit] [PubMed]
  7. Shen, J.; Song, Z.; Duan, W.; Zhang, Y. Exploring local challenges and adaptation strategies in the establishment of National Parks in giant panda habitats. Glob. Ecol. Conserv. 2021, 30, e01764. [Google Scholar] [CrossRef] [Scilit]
  8. Li, C.; Hou, R.; Bao, Z.; Wu, W.; Owens, J.R.; Bi, W.; Xu, Q.; Gu, X.; Xiang, Z.; Qi, D. Measuring ecosystem services and ecological sensitivity for comprehensive conservation in Giant Panda National Park. Conserv. Biol. 2024, 38, e14215. [Google Scholar] [CrossRef] [Scilit] [PubMed]
  9. Akerlof, G.A. The market for “lemons”: Quality uncertainty and the market mechanism. Q. J. Econ. 1970, 84, 488–500. [Google Scholar] [CrossRef] [Scilit]
  10. Ye, X.; Fu, Y.K.; Wang, H.; Zhou, J. Information asymmetry evaluation in hotel E-commerce market: Dynamics and pricing strategy under pandemic. Inf. Process. Manag. 2023, 60, 103117. [Google Scholar] [CrossRef] [Scilit]
  11. Wang, M.Y.; Chou, L.C. Evaluating information asymmetry effects on hotel pricing: A comparative analysis before and during the COVID-19 pandemic in the Taiwan’s market. Humanit. Soc. Sci. Commun. 2024, 11, 74. [Google Scholar] [CrossRef] [Scilit]
  12. Zeithaml, V.A. Consumer perceptions of price, quality, and value: A means-end model and synthesis of evidence. J. Mark. 1988, 52, 2–22. [Google Scholar] [CrossRef] [Scilit]
  13. Baker, D.A.; Crompton, J.L. Quality, satisfaction and behavioral intentions. Ann. Tour. Res. 2000, 27, 785–804. [Google Scholar] [CrossRef] [Scilit]
  14. Cronin, J.J., Jr.; Brady, M.K.; Hult, G.T.M. Assessing the effects of quality, value, and customer satisfaction on consumer behavioral intentions in service environments. J. Retail. 2000, 76, 193–218. [Google Scholar] [CrossRef] [Scilit]
  15. Carvache-Franco, M.; Carvache-Franco, W.; Pérez-Orozco, A.; Víquez-Paniagua, A.G.; Carvache-Franco, O. Satisfaction factors that predict loyalty in ecotourism: A study of foreign tourism in Costa Rica. Land 2022, 11, 125. [Google Scholar] [CrossRef] [Scilit]
  16. Carrascosa-López, C.; Carvache-Franco, M.; Carvache-Franco, W. Perceived value and its predictive relationship with satisfaction and loyalty in ecotourism: A study in the Posets-Maladeta Natural Park in Spain. Sustainability 2021, 13, 7860. [Google Scholar] [CrossRef] [Scilit]
  17. Regalado-Pezúa, O.; Carvache-Franco, M.; Carvache-Franco, O.; Carvache-Franco, W. Perceived value and its relationship to satisfaction and loyalty in cultural coastal destinations: A study in Huanchaco, Peru. PLoS ONE 2023, 18, e0286923. [Google Scholar] [CrossRef] [Scilit] [PubMed]
  18. Altman, I.; Taylor, D.A. Social Penetration: The Development of Interpersonal Relationships; Holt, Rinehart and Winston: New York, NY, USA, 1973. [Google Scholar]
  19. Carpenter, A.; Greene, K. Social penetration theory. In The International Encyclopedia of Interpersonal Communication; Berger, C.R., Roloff, M.E., Eds.; Wiley: Hoboken, NJ, USA, 2015. [Google Scholar] [CrossRef] [Scilit]
  20. Spence, M. Job market signaling. Q. J. Econ. 1973, 87, 355–374. [Google Scholar] [CrossRef] [Scilit]
  21. Stiglitz, J.E. The contributions of the economics of information to twentieth century economics. Q. J. Econ. 2000, 115, 1441–1478. [Google Scholar] [CrossRef] [Scilit]
  22. Brody, N.; Blackburn, K.; LeFebvre, L. The great reconnection: Examining motives for relational reconnection and investigating social penetration as a predictor of well-being. J. Soc. Pers. Relatsh. 2024, 41, 1679–1702. [Google Scholar] [CrossRef] [Scilit]
  23. Saxe, R.; Weitz, B.A. The SOCO scale: A measure of the customer orientation of salespeople. J. Mark. Res. 1982, 19, 343–351. [Google Scholar] [CrossRef] [Scilit]
  24. Narver, J.C.; Slater, S.F. The effect of a market orientation on business profitability. J. Mark. 1990, 54, 20–35. [Google Scholar] [CrossRef] [Scilit]
  25. Xia, Y.; Ha, H.Y. Does customer orientation matter? Direct and indirect effects in a service quality-sustainable restaurant satisfaction framework in China. Sustainability 2021, 13, 1051. [Google Scholar] [CrossRef] [Scilit]
  26. Yi, H.T.; Lee, M.; Park, K. Service orientation and customer performance: Triad perspectives of sales managers, sales employees, and customers. Behav. Sci. 2022, 12, 373. [Google Scholar] [CrossRef] [Scilit] [PubMed]
  27. Parasuraman, A.; Zeithaml, V.A.; Berry, L.L. SERVQUAL: A multiple-item scale for measuring consumer perceptions of service quality. J. Retail. 1988, 64, 12–40. [Google Scholar]
  28. Rather, R.A. Customer experience and engagement in tourism destinations: The experiential marketing perspective. J. Travel Tour. Mark. 2020, 37, 15–32. [Google Scholar] [CrossRef] [Scilit]
  29. Podsakoff, P.M.; MacKenzie, S.B.; Lee, J.Y.; Podsakoff, N.P. Common method biases in behavioral research: A critical review of the literature and recommended remedies. J. Appl. Psychol. 2003, 88, 879–903. [Google Scholar] [CrossRef] [Scilit] [PubMed]
  30. Hair, J.F.; Black, W.C.; Babin, B.J.; Anderson, R.E. Multivariate Data Analysis, 8th ed.; Cengage Learning: Andover, UK, 2018. [Google Scholar]
Figure 1. Study area.
Forests 17 00845 g001
Table 1. Sample distribution statistics.
Administrative RegionValid Sample SizePercentage (%)
Wenchuan County, Aba Prefecture, Sichuan, China8310.64
Pingwu County, Mianyang City, Sichuan, China10213.08
Qingchuan County, Guangyuan City, Sichuan, China9111.67
Yingjing County, Ya’an City, Sichuan, China11214.36
Baoxing County, Ya’an City, Sichuan, China8811.28
Tianquan County, Ya’an City, Sichuan, China9712.44
Ningqiang County, Hanzhong City, Shaanxi, China10813.85
Wen County, Longnan City, Gansu, China9912.69
Table 2. Measurement items of latent variables.
Latent VariableAbbr.Observable ItemAbbr.
Seller Information DisclosureSDBusiness status disclosureSD1
Pricing and cost disclosureSD2
Service credit disclosureSD3
Buyer Information DisclosureBDDisposable budget disclosureBD1
Personal consumption preference disclosureBD2
Travel purpose and motivation disclosureBD3
Perceived IdentificationPIInterpersonal characteristic identificationPI1
Consumption preference identificationPI2
Service evaluation standard identificationPI3
Customer OrientationCOProactive service introductionCO1
Customized demand matchingCO2
Practical trouble settlementCO3
Perceived QualityPQOverall demand fulfillment perceptionPQ1
Service reliability perceptionPQ2
Comprehensive service level perceptionPQ3
Perceived ValuePVPrice–quality matching perceptionPV1
Bilateral mutual understanding perceptionPV2
Effective communication perceptionPV3
SatisfactionSATSatisfaction against ideal expectationSAT1
Satisfaction against pre-travel anticipationSAT2
Satisfaction against peer destination benchmarkSAT3
Operational PerformanceOPAnnual operating revenue improvementOP1
Growth of repeat tourist customersOP2
Accumulation of positive customer feedbackOP3
Table 3. Descriptive statistics of latent variables.
VariableMeanSDMinMaxSkewnessKurtosis
SD3.1441.06615−0.094−0.842
BD2.7291.076150.143−0.878
PI2.9391.07115−0.007−0.854
CO3.3231.05915−0.253−0.695
PQ3.2491.10815−0.218−0.902
PV2.8601.084150.080−0.964
SAT3.2331.07115−0.147−0.843
OP2.8121.059150.122−0.805
Table 4. Reliability and convergent validity test.
VariableCronbach’s αKMOBartlett χ2Sig.CRAVE
SD0.8480.73986.633***0.9080.767
BD0.8540.7341024.858***0.9110.774
PI0.8490.7241013.159***0.9090.769
CO0.8510.7321003.729***0.9090.770
PQ0.8710.7411160.143***0.9210.795
PV0.8560.7351040.179***0.9120.776
SAT0.8480.731989.534***0.9080.767
OP0.8410.729942.123***0.9040.759
Total0.7350.7328469.689***--
Note: *** stands for p < 0.01.
Table 5. Pearson correlation matrix.
VariableSDBDPICOPQPVSATOP
SD10.0820.1200.1240.0910.039−0.0000.091
BD0.08210.1380.0100.0540.0660.0130.045
PI0.1200.13810.0810.0560.092−0.0050.047
CO0.1240.0100.08110.0760.0530.0720.075
PQ0.0910.0540.0560.07610.0720.107−0.013
PV0.0390.0660.0920.0530.07210.0920.084
SAT−0.0000.013−0.0050.0720.1070.09210.083
OP0.0910.0450.0470.075−0.0130.0840.0831
Table 6. Fornell–Larcker discriminant validity test.
VariableSDBDPICOPQPVSATOP
SD0.8760.0820.1200.1240.0910.039−0.0000.091
BD0.0820.880.1380.0100.0540.0660.0130.045
PI0.1200.1380.8770.0810.0560.092−0.0050.047
CO0.1240.0100.0810.8770.0760.0530.0720.075
PQ0.0910.0540.0560.0760.8920.0720.107−0.013
PV0.0390.0660.0920.0530.0720.8810.0920.084
SAT−0.0000.013−0.0050.0720.1070.0920.8760.083
OP0.0910.0450.0470.075−0.0130.0840.0830.871
Note: Diagonal values stand for square root of AVE; off-diagonal values represent correlation coefficients between latent variables.
Table 7. Model fit indicators.
IndicatorValueEvaluation Standard
CMIN/DF2.9141–3 indicates good fitness
RMSEA0.050<0.08 indicates acceptable fitness; close to 0.05 indicates optimal fitness
NFI0.979>0.90 indicates good fitness
RFI0.951>0.90 indicates good fitness
IFI0.987>0.90 indicates good fitness
TLI0.968>0.90 indicates good fitness
CFI0.987>0.90 indicates good fitness
AIC84.276Smaller value denotes better fitting
CAIC231.534Smaller value denotes better fitting
Table 8. Path coefficient test results.
Pathβt-ValueSig.
SDPI0.1093.082***
BDPI0.1293.646***
SDCO0.1163.249***
PICO0.0671.874*
SDPQ0.0782.167**
PIPQ0.0421.162-
COPQ0.0631.739*
BDPV0.0511.422-
PIPV0.0812.243**
PQPV0.0651.824*
COSAT0.0611.701*
PQSAT0.0972.708***
PVSAT0.0822.296**
SDOP0.082.237**
BDOP0.0371.043-
COOP0.0591.630-
SATOP0.0782.184**
Note: *** stands for p < 0.01, ** stands for p < 0.05, * stands for p < 0.10; - denotes statistically insignificant, consistent with subsequent tables.
Table 9. Grouped heterogeneity regression results.
GroupVariableβt-ValueSignificance
High Annual-Income Group (N = 390)SD0.0611.19-
BD0.0450.873-
CO0.0791.54-
SAT0.0290.566-
Low Annual-Income Group (N = 390)SD0.1052.06**
BD0.0210.408-
CO0.0380.736-
SAT0.1152.265**
Long-Operating Tenure Group (N = 420)SD0.0420.848-
BD0.0290.599-
CO0.0541.101-
SAT0.0731.496-
Short-Operating Tenure Group (N = 360)SD0.1282.442**
BD0.0551.056-
CO0.0711.338-
SAT0.0721.369-
Note: ** stands for p < 0.05, - denotes statistically insignificant, consistent with subsequent tables.
Table 10. Robustness check results.
Model TypeVariableβt-ValueSignificance
Alternative Dependent Variable ModelSD0.0832.311**
BD0.0481.357-
CO0.0431.193-
SAT0.0742.071**
Model with Added Control VariablesSD0.0752.269**
BD0.0260.793-
CO0.0531.63-
SAT0.0662.059**
Note: ** stands for p < 0.05, - denotes statistically insignificant, consistent with subsequent tables.
Table 11. Competing model comparison.
Modelχ2CMIN/DFRMSEAAICCFI
Model A486.37227.0210.181522.3720.824
Model B211.50814.1010.112253.5080.927
Model C87.3947.2830.078135.3940.968
Model D29.1412.9140.05084.2760.987
Note: Model A = direct-effect-only model; Model B = partial service mediator model; Model C = satisfaction single-mediator model; Model D = complete chained research model.
Disclaimer/Publisher’s Note: The statements, opinions and data contained in all publications are solely those of the individual author(s) and contributor(s) and not of MDPI and/or the editor(s). MDPI and/or the editor(s) disclaim responsibility for any injury to people or property resulting from any ideas, methods, instructions or products referred to in the content.