


Abstract
The net primary productivity (NPP) of the spatiotemporal variation in vegetation directly reflects ecosystem function, and landscape pattern evolution is a key spatial correlate of its differentiation. Clarifying this relationship is critical for regional ecological management. We focused on the upper and middle Yangtze River, using 2000–2020 land use and NPP data to analyze how overall landscape patterns are differentially associated with NPP across vegetation types and identify key landscape pattern characteristics associated with NPP. Our results show the following: (1) Based on 4102 grid cells at a 10 km × 10 km spatial grain and an 8:2 random train–test split validation procedure, XGBoost outperformed all other machine learning models, achieving a test set coefficient of determination (R2) of 0.78. (2) Over the study period, 89.58% of the region showed an increased Normalized Difference Vegetation Index (NDVI), with extensive grassland and shrubland conversion to forest. Regional average NPP increased by 51.57 g C m−2 yr−1. (3) Associations between landscape patterns and NPP differed across vegetation types. Number of patches (NP) was most strongly associated with forest and overall NPP, largest patch index (LPI) showed the closest linkage with shrubland NPP, and proportion of like adjacency (PLADJ) correlated most strongly with grassland NPP. Integrating vegetation evolution trends and vegetation-specific associations between landscape patterns and NPP, we propose that future ecological restoration and territorial spatial governance can adopt targeted landscape optimization strategies based on key correlated landscape indicators to support sustainable improvement of regional ecosystem productivity.
1. Introduction
Unsustainable land use change impairs terrestrial net primary productivity (NPP), threatening biodiversity and human well-being that depends on ecosystem services [1]. NPP quantifies net organic carbon fixed by vegetation via photosynthesis, serving as a core indicator of ecosystem carbon sequestration capacity and functional status. It underpins global material and energy cycling and is widely used to monitor ecosystem responses to environmental changes [2,3]. Most studies have focused on quantitative changes in land use types as the primary driver of NPP dynamics, documenting their effects through altered hydrology, carbon storage, and microclimate [4,5,6]. However, this narrow focus on land use quantity has largely ignored the spatial configuration of landscapes, which is a critical dimension that can significantly alter ecological processes and NPP even when the total area of each land use type remains unchanged.
Identifying key landscape pattern characteristics associated with NPP remains a central focus in landscape ecology [7]. Landscape patterns integrate natural processes and anthropogenic disturbances across scales, and their spatial configuration directly regulates resource availability and species interactions [8,9]. Landscape metrics provide quantitative measures of landscape pattern and configuration, enabling rigorous analysis of how spatial structure shapes ecosystem functioning [10,11]. In the Yangtze River Basin, two decades of rapid urbanization and large-scale ecological restoration have created unprecedented landscape heterogeneity. The Grain for Green Program is a major example of such restoration. These changes have led to highly complex and spatially variable NPP responses [12,13]. Most previous studies have explored landscape–NPP relationships using Pearson correlation and multiple linear regression [14,15]. However, these relationships are inherently nonlinear, scale dependent, and vegetation specific [16], characteristics that cannot be adequately represented by linear models. Linear models also cannot disentangle synergistic or antagonistic interaction effects among landscape metrics [17], nor can they produce robust variable importance rankings in the presence of strong multicollinearity [18,19,20]. These limitations explain why previous studies have failed to consistently identify key driving metrics.
Tree-based machine learning methods provide a powerful framework to address these limitations. They capture nonlinear ecological responses, complex interaction effects, and spatial heterogeneity. All of these are critical for understanding how landscape patterns affect NPP [21]. Importantly, these models produce robust variable importance rankings even when predictors are highly correlated [22], allowing us to reliably disentangle the relative contributions of different landscape metrics to NPP dynamics. However, despite these advances, existing machine learning studies of NPP drivers have almost exclusively focused on climate, topography, and human activities, while largely neglecting landscape patterns that directly reflect the spatial organization of vegetation [23,24,25]. More critically, existing studies rarely evaluate vegetation-specific responses of NPP to landscape configuration using nonlinear frameworks, despite the fact that different vegetation types exhibit distinct structural and functional traits that mediate their responses to landscape change. This gap is especially pronounced in the Yangtze River Basin, where coexisting forests, shrublands, and grasslands are undergoing rapid landscape transformation driven by both ecological restoration and urbanization.
The Yangtze River Basin supports fragile ecosystems and complex human–land interactions. Its stability underpins ecological security across the basin and the entire nation [26]. The region has a highly complex topography and climate. It also shows strong spatial heterogeneity in ecosystem types [27]. The region is one of China’s most densely populated areas. Intensive urban expansion and resource exploitation have transformed its landscapes over recent decades [28,29]. Severe ecosystem degradation affected parts of the upper and middle reaches by the early 2000s. This degradation threatens national food and ecological security [30]. Large-scale ecological restoration projects followed. These projects include natural forest protection and grain for green initiatives [31]. These projects have not only restored vegetation cover but have also reshaped landscape configuration and vegetation spatial connectivity [32]. They have created new drivers of NPP dynamics [33]. Systematically identifying key landscape metrics associated with NPP changes is now essential to support the maintenance of ecological balance in the region.
While climatic and topographic drivers of NPP have been extensively documented in the existing literature, the independent effects of landscape spatial configuration remain less well understood, especially regarding vegetation-specific differences in how landscape pattern shapes productivity. Building on previous findings, we propose two research hypotheses: first, aggregation and fragmentation metrics explain more NPP variability than compositional diversity metrics; second, the strength and pattern of landscape–NPP associations differ substantially among forest, shrubland, and grassland vegetation types. Given this, we focus on the upper and middle Yangtze River and use 2000–2020 land use and NPP data to address three core scientific questions: (1) characterize spatiotemporal changes in vegetation cover and landscape patterns and NPP across different vegetation types; (2) compare six machine learning models to identify the most robust approach for disentangling nonlinear landscape productivity relationships; (3) reveal vegetation-specific landscape pattern characteristics associated with NPP and rank the relative importance of different landscape metrics. Our findings advance the mechanistic understanding of how landscape pattern shapes ecosystem productivity and provide targeted guidance for landscape optimization and ecological restoration in the Yangtze River Basin.
2. Materials and Methods
2.1. Study Area
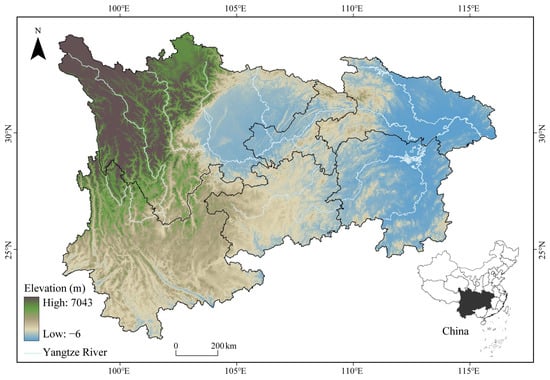
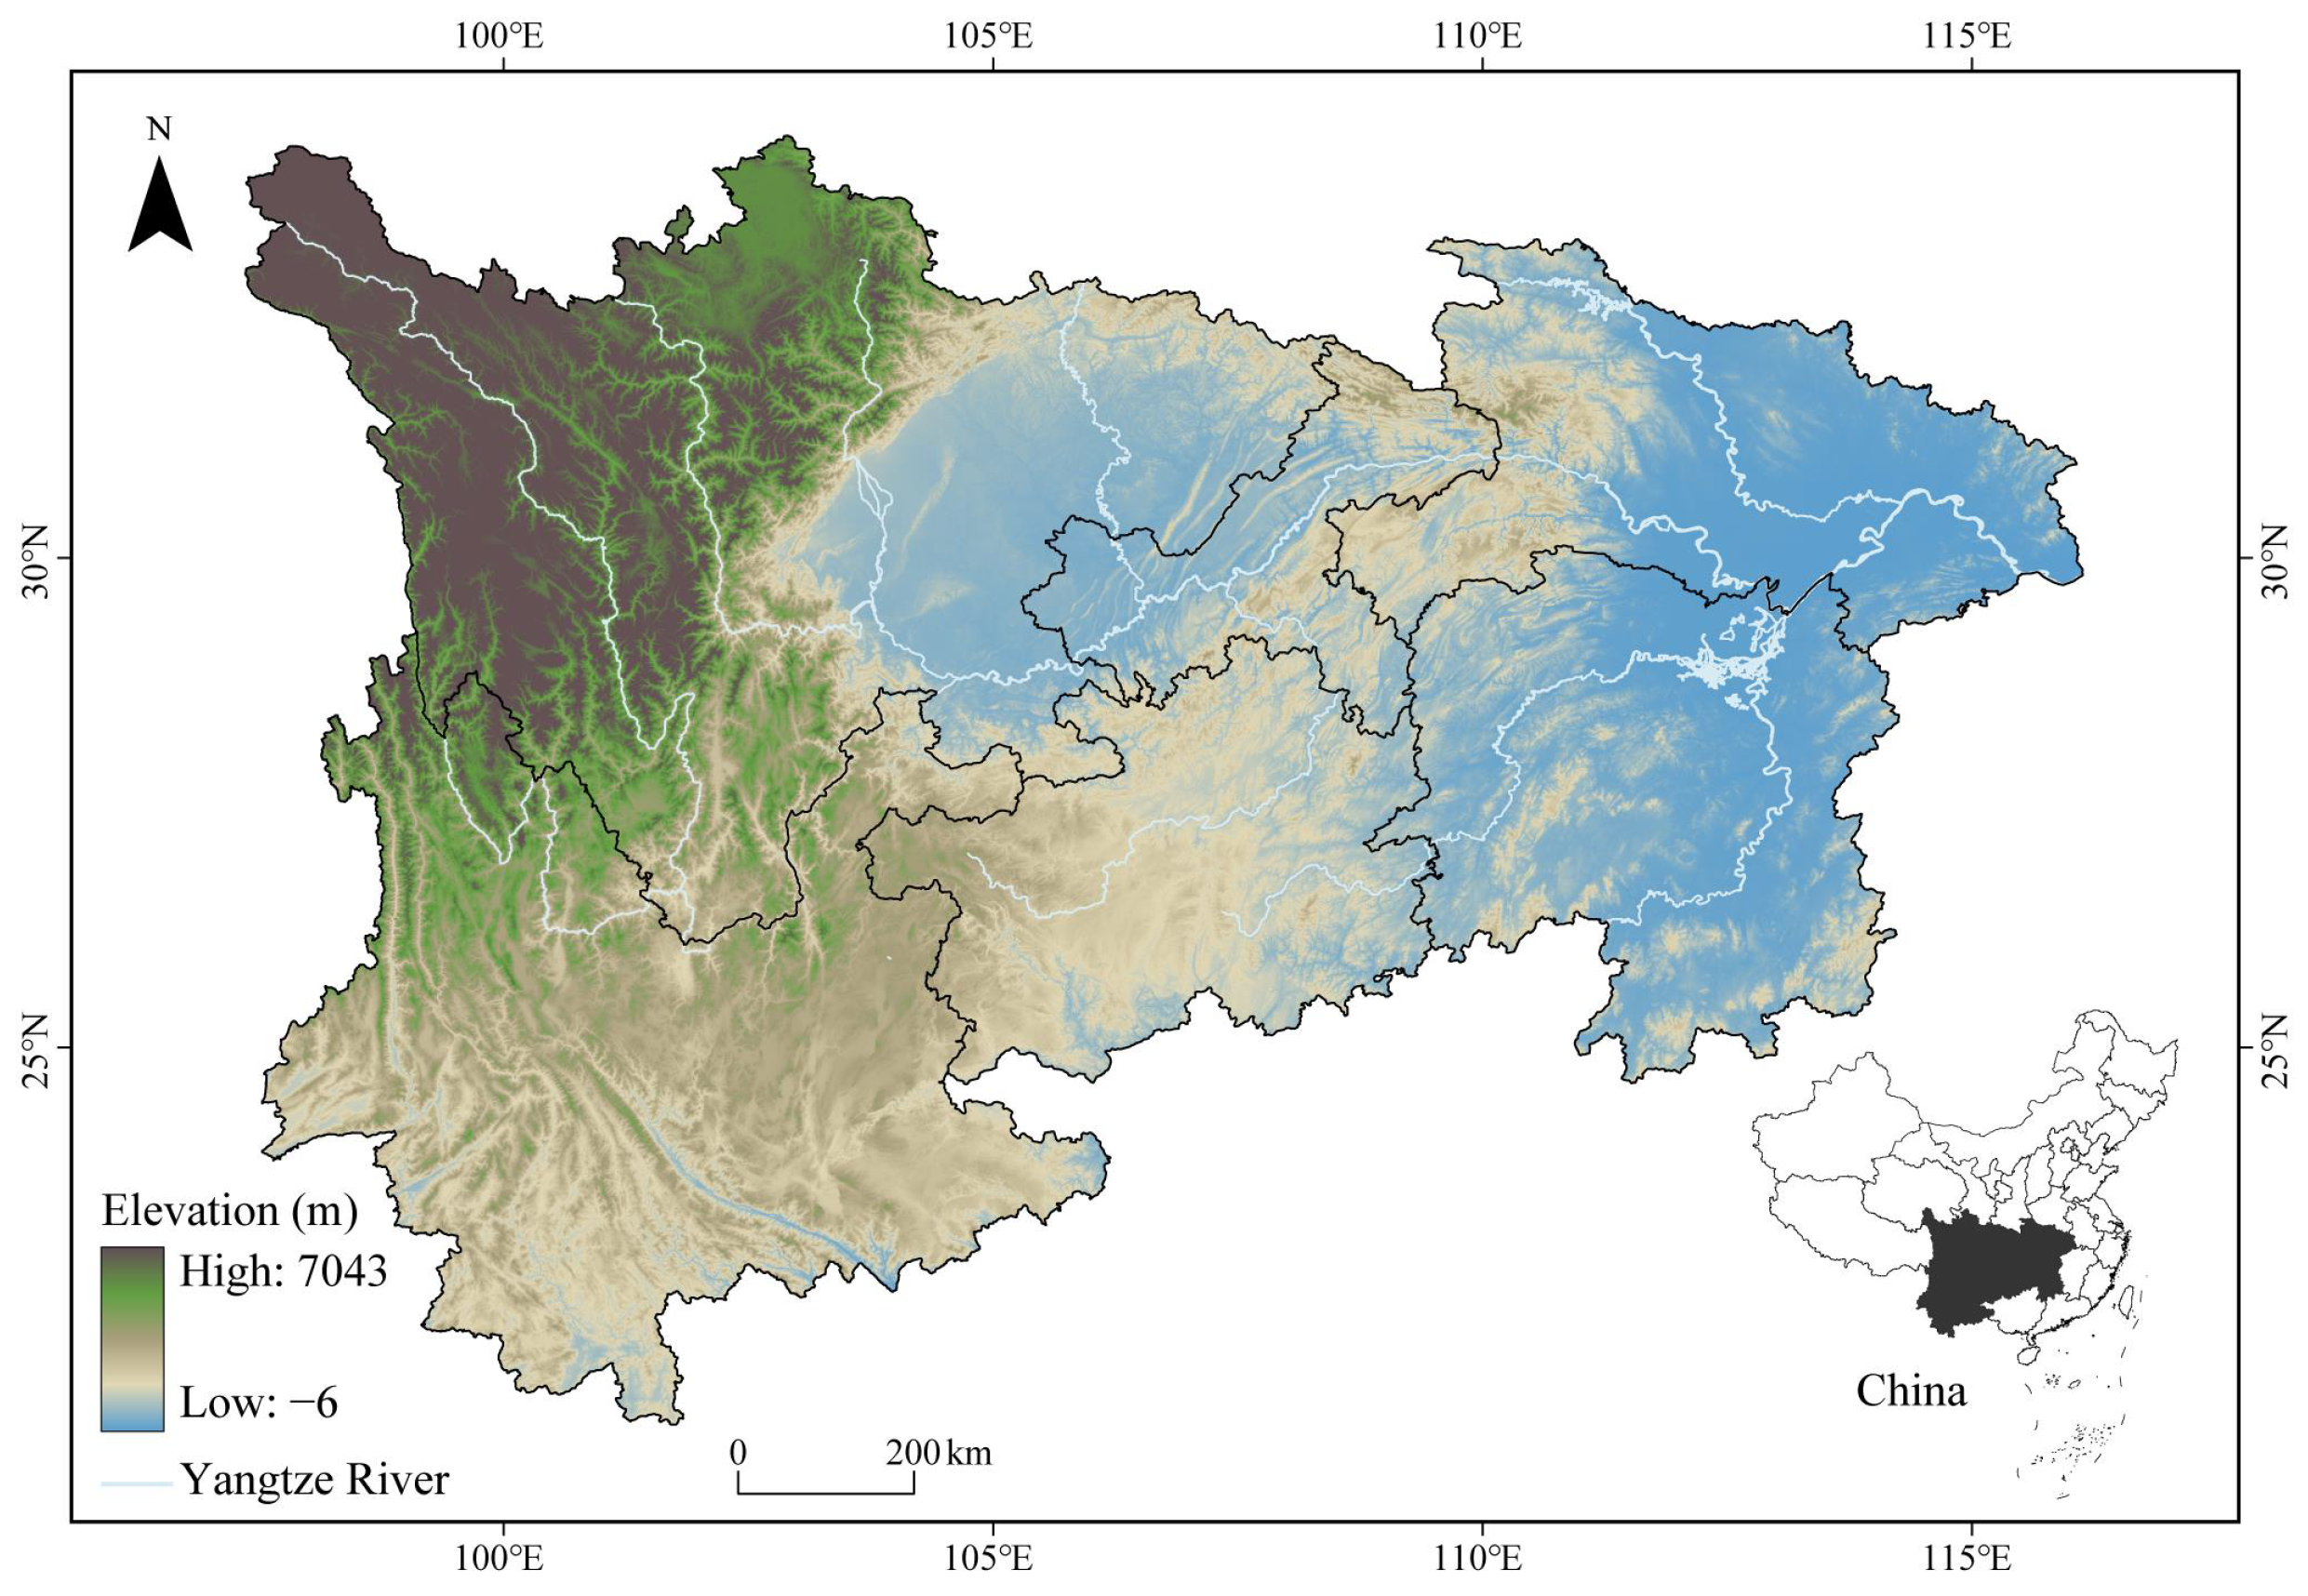
The Yangtze River originates from the Qinghai–Tibet Plateau and stretches 6300 km. Our study focuses on its upper and middle reaches, covering six provinces and municipalities: Sichuan, Chongqing, Hubei, Hunan, Yunnan, and Guizhou (Figure 1). The region spans 97°20′ E to 116°20′ E and 21°10′ N to 34°17′ N, with a total area of approximately 1.8 million km2. Most of the region has a subtropical monsoon climate. Annual precipitation decreases from 1800 mm in the southeast to 250 mm in the northwest, and the mean annual temperature is 13.3 °C. Vegetation is dominated by subtropical evergreen broad-leaved forests, and major land use types include forestland, cropland, and grassland. The ecosystem is highly sensitive to environmental changes. Since the launch of the Grain for Green Program pilot, 92,400 km2 of farmland has been converted to forest in the study area. These afforestation efforts have reduced soil erosion and improved regional hydrological conditions [31]. These concurrent changes in vegetation cover and landscape pattern make the region an ideal natural laboratory to investigate the relationships between landscape patterns and ecosystem productivity.
Figure 1.
Location of the study area in the upper and middle Yangtze River. The study area includes Sichuan, Chongqing, Hubei, Hunan, Yunnan, and Guizhou provinces. The black area in the inset shows the study area’s location within China.
2.2. Sources of Data
We obtained annual land use data from 2000 to 2020 from the Landsat-derived land cover product of China. This product has an overall accuracy of 79.31% and outperforms most commonly used land use datasets [34]. We obtained annual Normalized Difference Vegetation Index (NDVI) data from the same period. NDVI is a widely used metric of vegetation abundance and vigor. The data were provided by the Resource and Environment Science and Data Center of the Chinese Academy of Sciences (http://www.resdc.cn). We also obtained annual net primary productivity (NPP) data matching the same time period from the National Forestry and Grassland Administration of China (http://www.dsac.cn). This NPP dataset was generated using the Carnegie–Ames–Stanford Approach (CASA) model based on MODIS remote sensing data. It has been extensively calibrated and validated against field measurements across multiple vegetation types in China and is widely adopted for regional ecological research [35].
We preprocessed all raw datasets in ArcGIS Pro 3.1.6 to ensure consistent spatial resolution, extent, and projection. We resampled and spatially registered all layers to the Albers Equal Area coordinate system and clipped them to the study area boundary at a 500 m pixel size. This resolution closely matches the native resolution of the MODIS-derived NPP and Landsat-based land cover datasets, minimizing information distortion from resampling, and it represents a widely adopted standard for regional NPP and landscape pattern studies in the Yangtze River Basin to support comparability with published research, while appropriately balancing fine heterogeneity capture and computational feasibility for landscape metric calculation.
2.3. Analysis of Vegetation Cover Changes
We quantified vegetation cover dynamics using two complementary approaches. First, we calculated Fractional Vegetation Cover (FVC) from NDVI data. FVC eliminates soil background interference and provides a more accurate measure of vegetation abundance than raw NDVI. This allows us to directly link vegetation changes to landscape pattern evolution and NPP dynamics. The calculation formula is as follows:
We used the nonparametric Mann–Kendall (MK) trend test in MATLAB 2024 to examine long-term changes in NDVI and FVC time series. Statistical significance was assessed at the p < 0.05 level using the Z-test. Second, we constructed land use transition matrices to quantify the direction and magnitude of vegetation type conversions between 2000 and 2020.
2.4. Selection and Calculation of Landscape Metrics
We calculated landscape metrics using Fragstats 4.2, focusing exclusively on landscape-level rather than class-level metrics. This choice aligns with our analytical framework of constructing separate NPP models for each vegetation type. Using landscape-level metrics allows us to examine how the overall spatial configuration of the entire landscape affects NPP across different vegetation types and effectively isolates the independent effect of landscape spatial arrangement from the effect of vegetation area quantity. Class-level metrics, by contrast, would be highly collinear with the area proportion of the corresponding vegetation type, making it impossible to distinguish whether NPP changes are driven by the area of a given vegetation type or by its internal spatial configuration. This design avoids confounding between compositional quantity and spatial configuration and matches our core goal of identifying key overall landscape pattern characteristics associated with NPP.
From over 110 available indices, we selected eight representative metrics spanning four core dimensions of landscape pattern: area-edge, shape, aggregation, and diversity. These include number of patches (NP), largest patch index (LPI), landscape shape index (LSI), contagion index (CONTAG), proportion of like adjacency (PLADJ), interspersion and juxtaposition index (IJI), aggregation index (AI), and Shannon’s diversity index (SHDI) (Table 1). These metrics were chosen to comprehensively characterize landscape pattern and configuration while minimizing redundancy. Area-edge metrics describe patch size distribution and landscape dominance; the shape metric quantifies patch edge complexity; aggregation metrics capture spatial clustering and interspersion of patches; and the diversity metric reflects landscape pattern heterogeneity. All selected indices have been widely validated as key predictors of ecosystem productivity and vegetation dynamics in previous regional studies [32,36]. We used a grid-based approach to link landscape metrics to NPP, dividing the study area into 4102 cells of 10 km × 10 km for metric calculation. This grid size was selected to align with the characteristic spatial scale at which landscape patterns modulate ecosystem processes in mountainous watersheds, capturing the dominant structural heterogeneity that shapes vegetation productivity dynamics [7]. It also matches the native resolution of our land use and NPP datasets, striking a pragmatic balance that avoids excessive information loss from overly coarse aggregation and spurious noise from overly fine partitioning. Furthermore, this grain size is widely adopted in existing regional studies on landscape patterns and ecosystem productivity in the Yangtze River Basin, ensuring comparability with published findings [37].
Table 1.
Selected landscape pattern indices.
2.5. Construction of Machine Learning Models
We used supervised regression to quantify the relationship between landscape metrics and NPP, with eight landscape metrics as predictors and annual NPP as the continuous response variable. We selected six algorithms covering ensemble, distance-based, and single-tree approaches to ensure a comprehensive comparison of model performance. These included four tree-based ensemble models: Random Forest (RF), Extreme Gradient Boosting (XGBoost), Gradient Boosting Regression (GBR), and CatBoost, as well as the nonparametric K-Nearest Neighbors (KNN) and baseline Classification and Decision Tree (DT). This selection includes several widely used approaches for modeling nonlinear ecological relationships and allows us to evaluate the relative performance of different modeling frameworks for landscape–NPP analysis [38]. All models were implemented in Python 3.10 using the Scikit-learn, XGBoost, and CatBoost libraries [39]. A fixed random seed was applied to all stochastic procedures, including dataset splitting and model initialization, to ensure full reproducibility of the results, and the parameters of each model followed standard settings commonly adopted in relevant ecological studies. Considering that the primary objective of this study was to identify associations between landscape metrics and NPP rather than to develop a transferable spatial prediction model, a conventional random partitioning strategy was adopted for model training and validation. We randomly split the dataset into training and test sets in an 8:2 ratio to balance model training sufficiency and generalization reliability [40].
We evaluated model performance using three standard metrics: coefficient of determination (R2), root mean square error (RMSE), and mean absolute error (MAE). Higher R2 values combined with lower RMSE and MAE values indicate better predictive performance. To identify the most robust approach for quantifying landscape–NPP relationships, we compared the performance of all six models. The performance comparison results are summarized in Table 2: XGBoost achieved the highest test set R2 (0.78) and the lowest RMSE (0.42), outperforming all other models. We, therefore, selected XGBoost as the optimal algorithm for subsequent variable importance analysis.
Table 2.
Performance of different machine learning models.
Variable importance was calculated based on the gain metric, which reflects the average contribution of each feature to reducing model prediction loss. To enable cross-vegetation-type comparison of relative importance, we normalized the importance scores within each vegetation-type model by dividing each score by the maximum importance value in that model (maximum = 1.0). To improve ecological interpretability, we further synthesized the eight individual landscape metrics into three broader landscape dimensions for subsequent analysis: fragmentation (NP, LSI), aggregation and connectivity (LPI, CONTAG, PLADJ, IJI, AI), and compositional heterogeneity (SHDI). This analysis quantified the relative contributions of different landscape metrics to NPP prediction and identified key indices associated with NPP in forests, grasslands, and shrublands.
3. Results
3.1. Dynamic Changes in Vegetation Cover
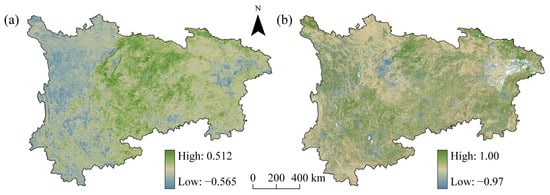
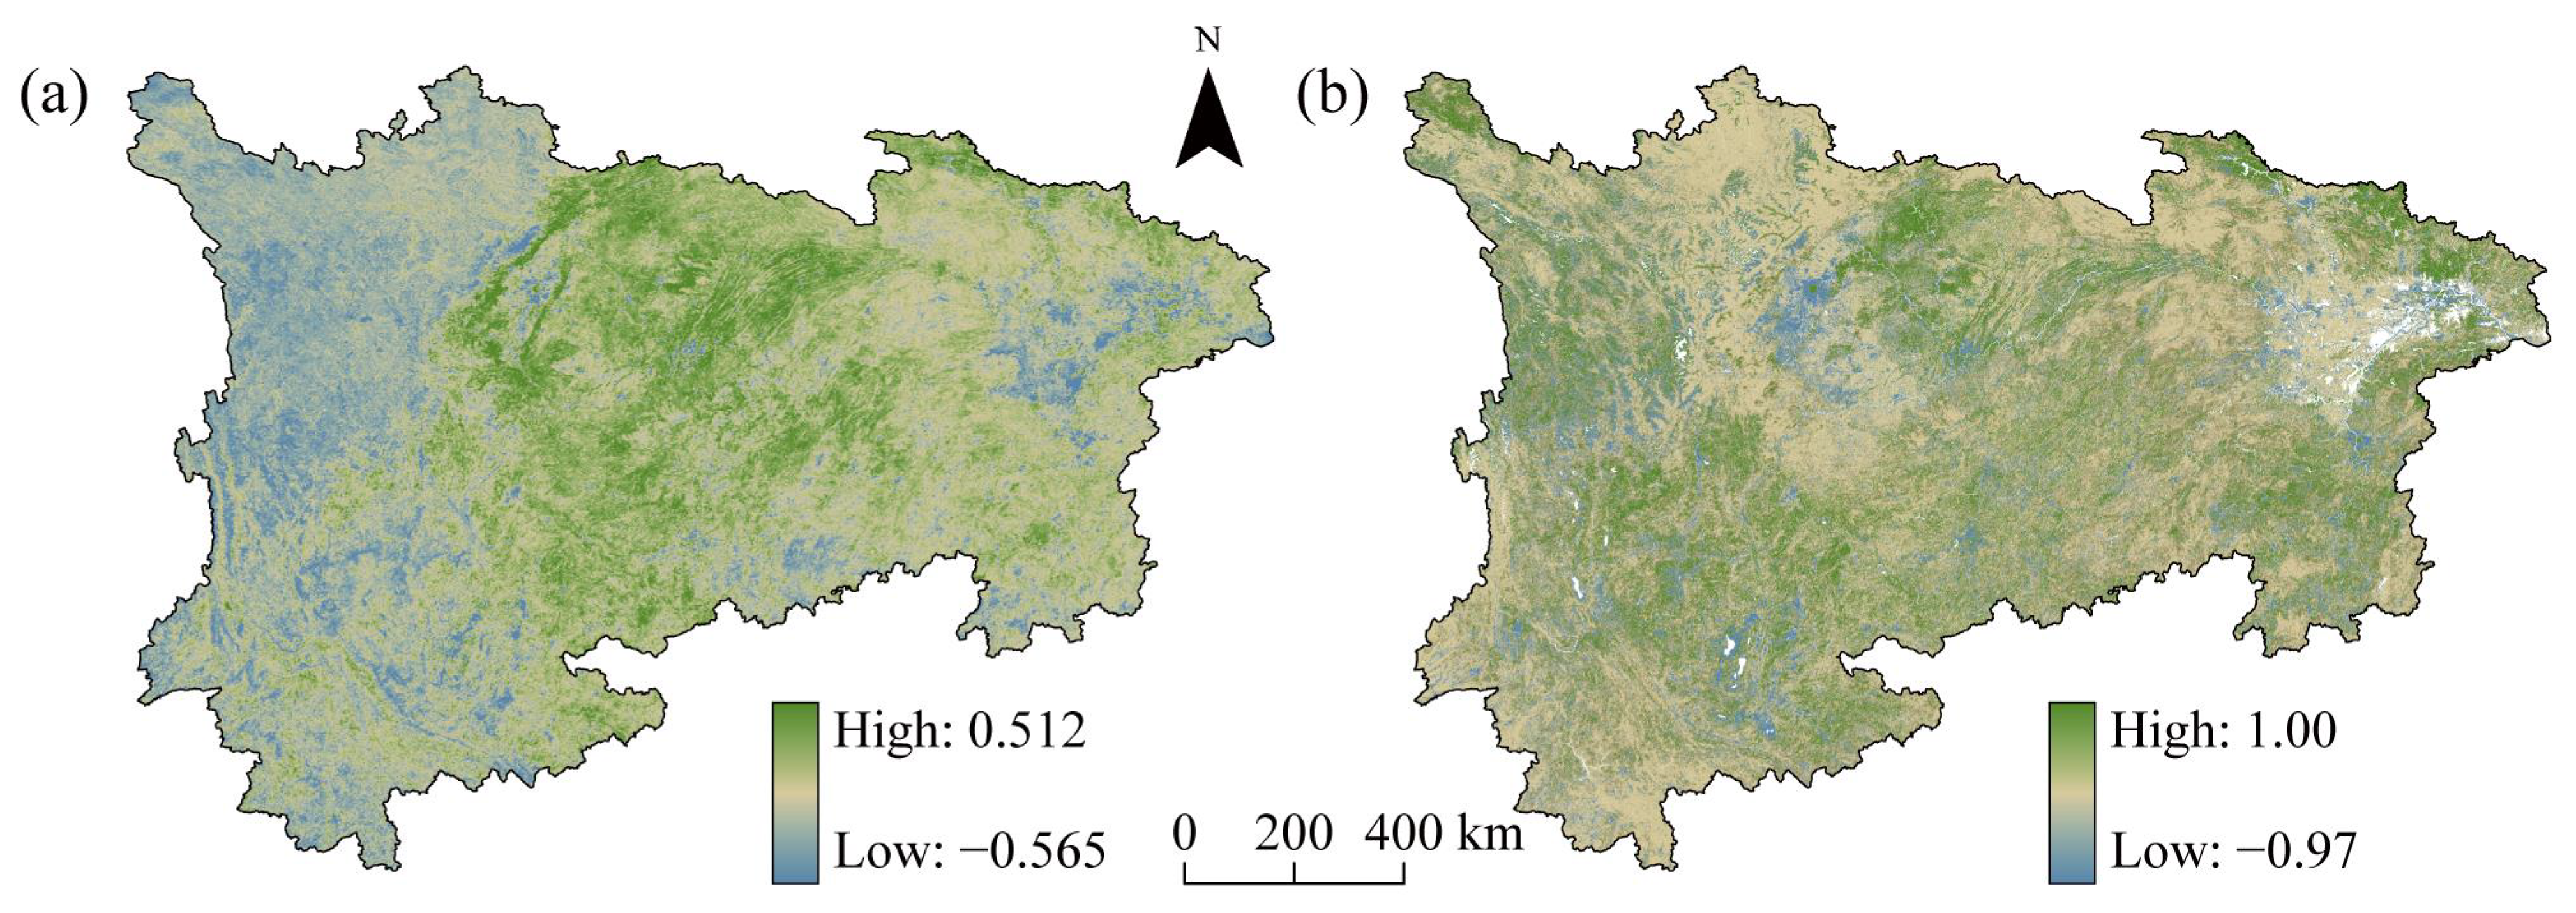
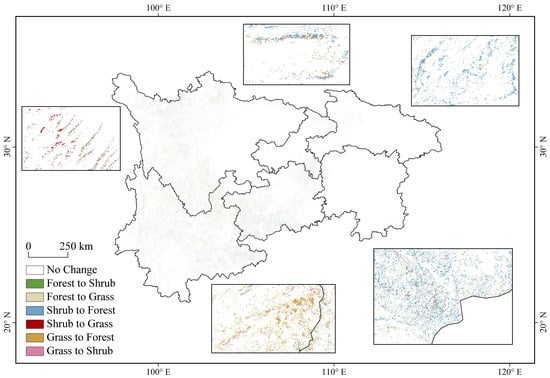
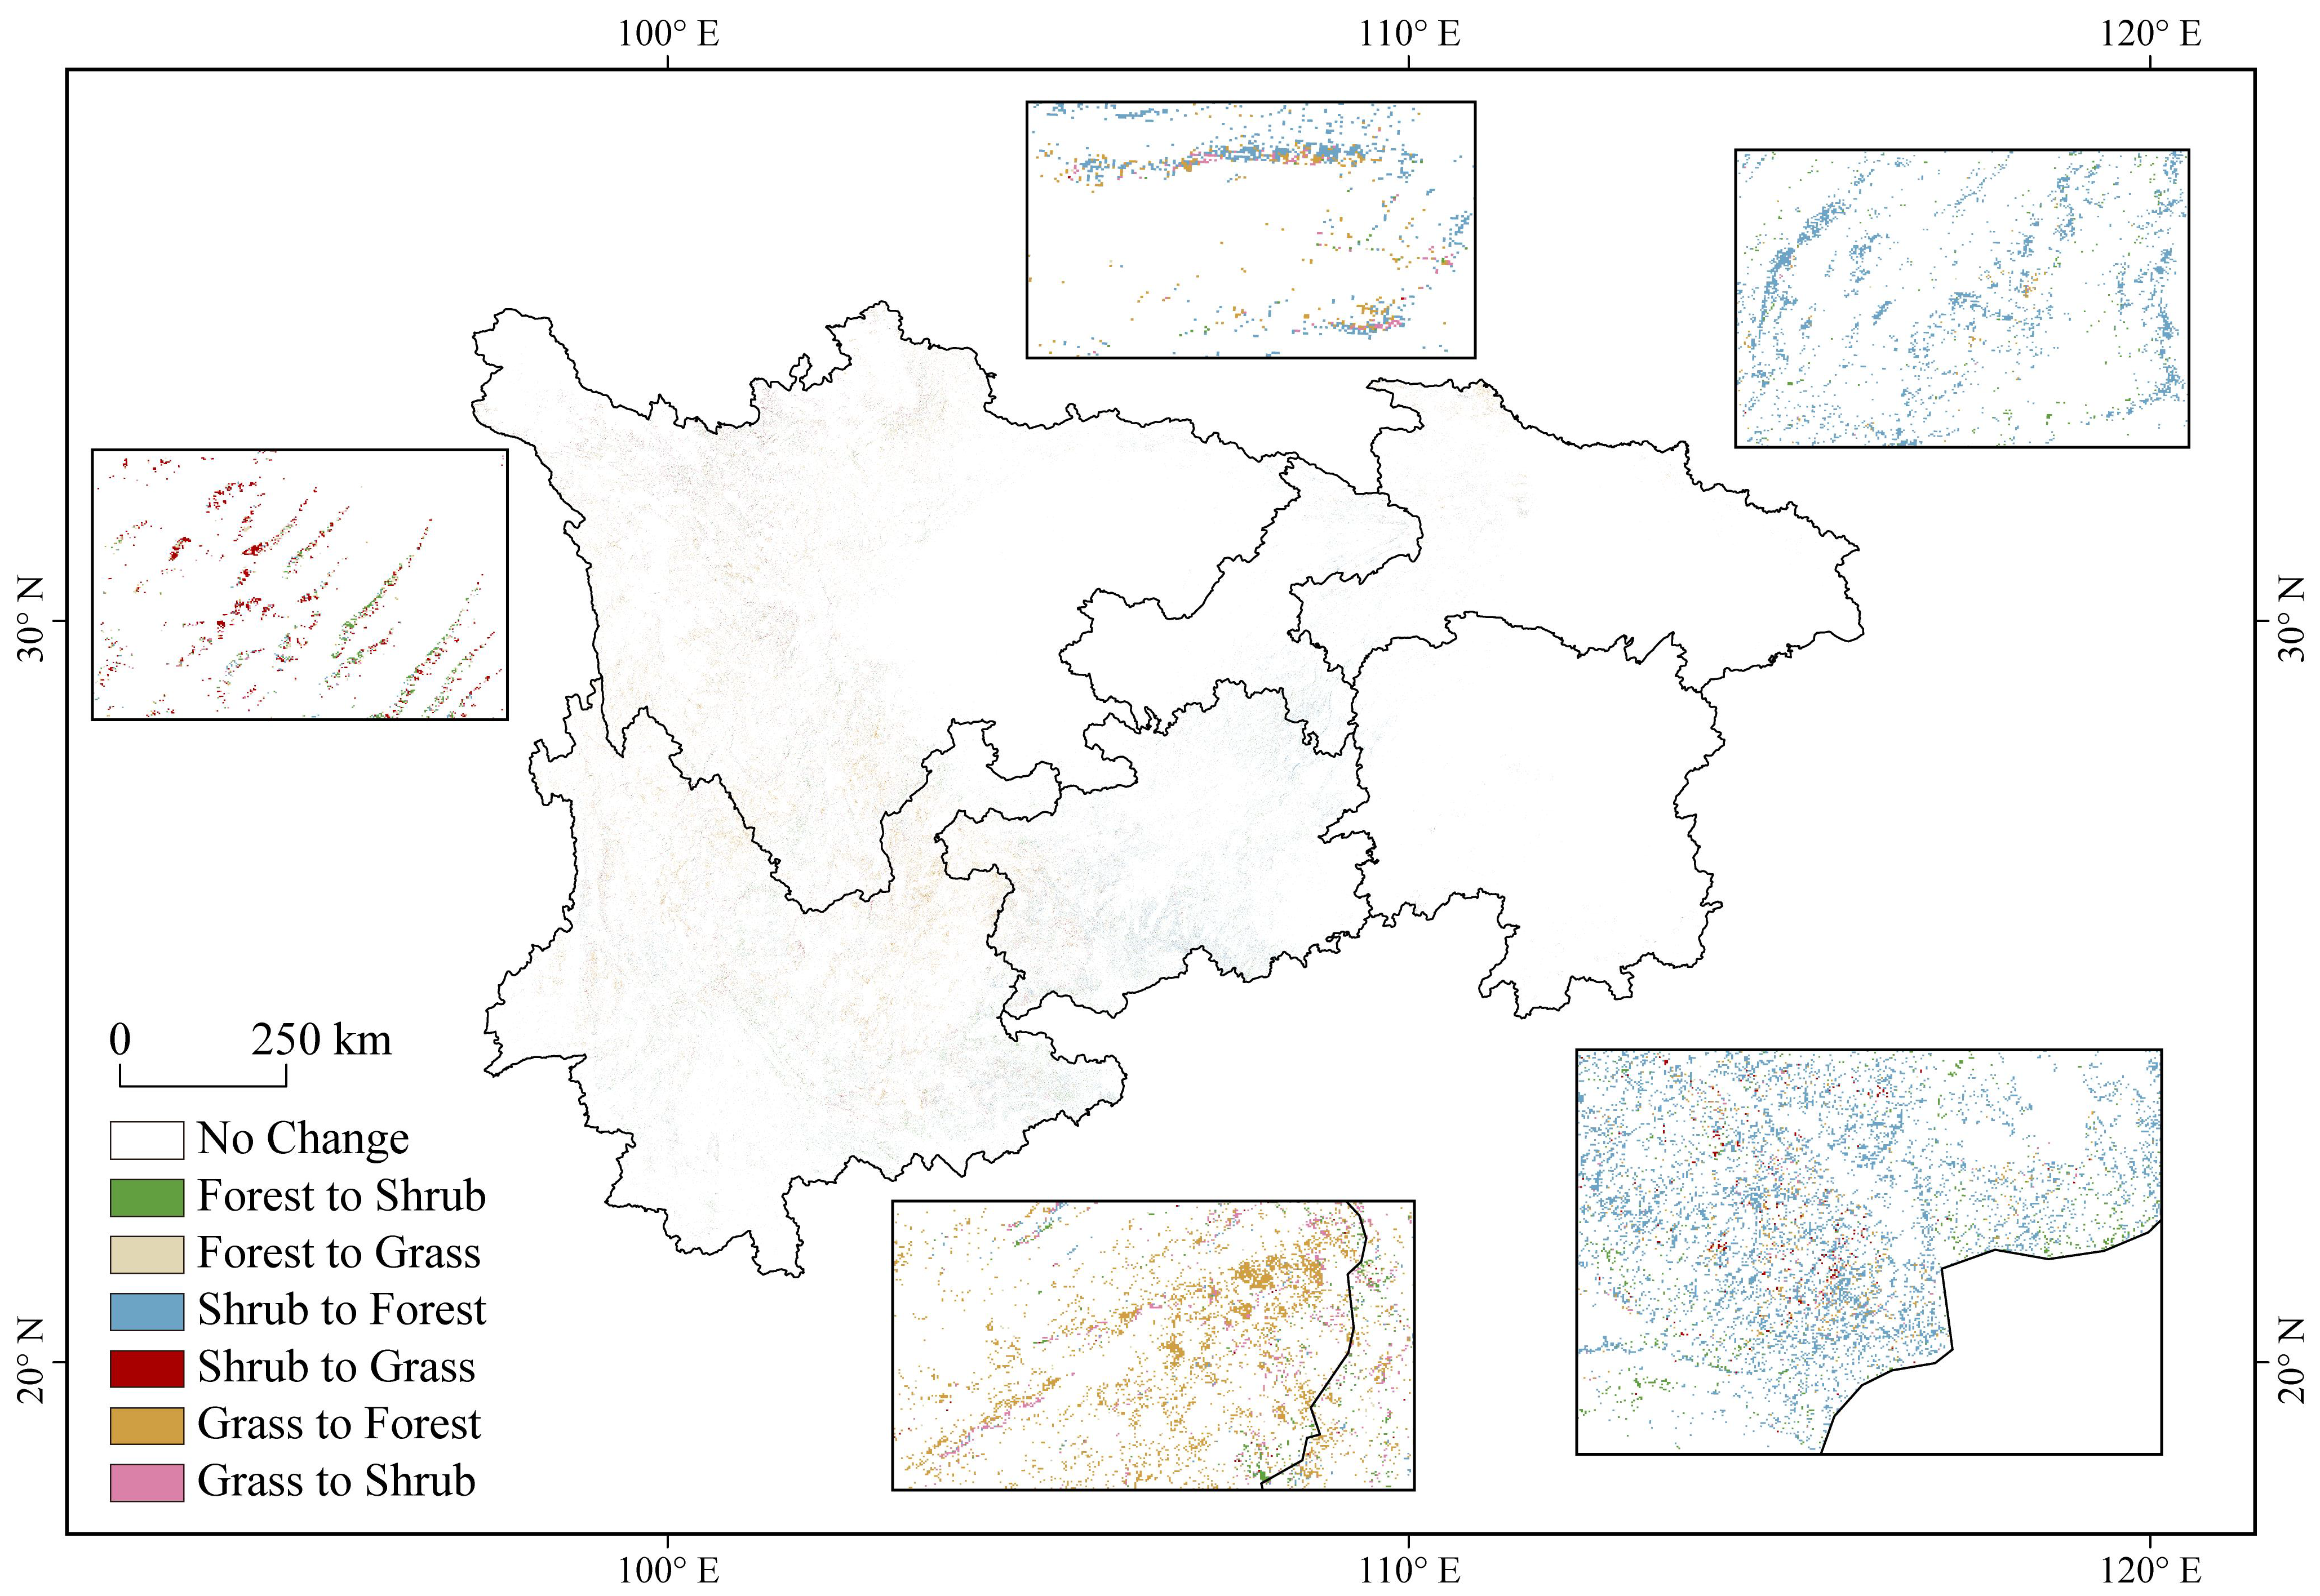
NDVI in the upper and middle Yangtze River exhibited significant spatial heterogeneity during 2000–2020 (Figure 2a). Overall, 89.58% of the study area showed an increasing trend in NDVI, with 47.34% showing a statistically significant increase (p < 0.05). Increasing trends were concentrated in the western and eastern mountainous and hilly regions. Decreasing trends were primarily observed in the central plain and basin core areas. NDVI remained relatively stable in the plateau and karst transition zones. The spatial pattern of FVC changes was highly consistent with that of NDVI (Figure 2b), with 47.34% of the area showing a significant increase in vegetation cover. This consistent pattern of vegetation cover change provides a foundation for analyzing subsequent landscape reorganization and NPP dynamics. Vegetation-type conversion analysis (Figure 3) showed that grassland-to-forest conversion was the dominant change, accounting for 37.95% of the total converted area. Shrubland-to-forest conversion was the second most common change, representing 28.39% of the total converted area. Together, these two conversion types accounted for 66.34% of all vegetation transitions. The remaining 33.66% included other minor land use changes.
Figure 2.
NDVI and FVC changes across the study area (2000–2020). Green represents high change values, and blue represents low change values for NDVI (a) and FVC (b).
Figure 3.
Vegetation type transitions across the study area between 2000 and 2020. Colors denote various land cover conversion types, and white shows areas with no change.
Table 3 summarizes the temporal changes in the eight landscape metrics from 2000 to 2020. Number of patches (NP) decreased from 2000 to 2005 and increased thereafter. AI showed a continuous decreasing trend over the study period. LPI decreased initially and then increased, reaching a maximum of 50.39 in 2020. PLADJ showed a steady decreasing trend. LSI fluctuated upward, peaking at 187.22 in 2020. CONTAG showed a slight overall decrease from 55.71 to 55.35, with a minimum in 2015. IJI increased from 2000 to 2010 and then declined. SHDI remained stable between 1.13 and 1.14 throughout the study period.
Table 3.
Landscape metrics in the study area from 2000 to 2020.
3.2. Spatiotemporal Variation Characteristics of NPP Under Different Vegetation Types
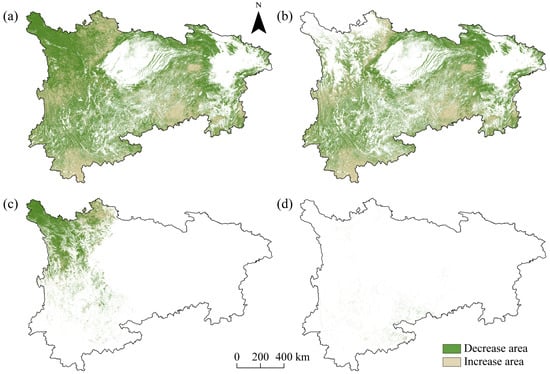
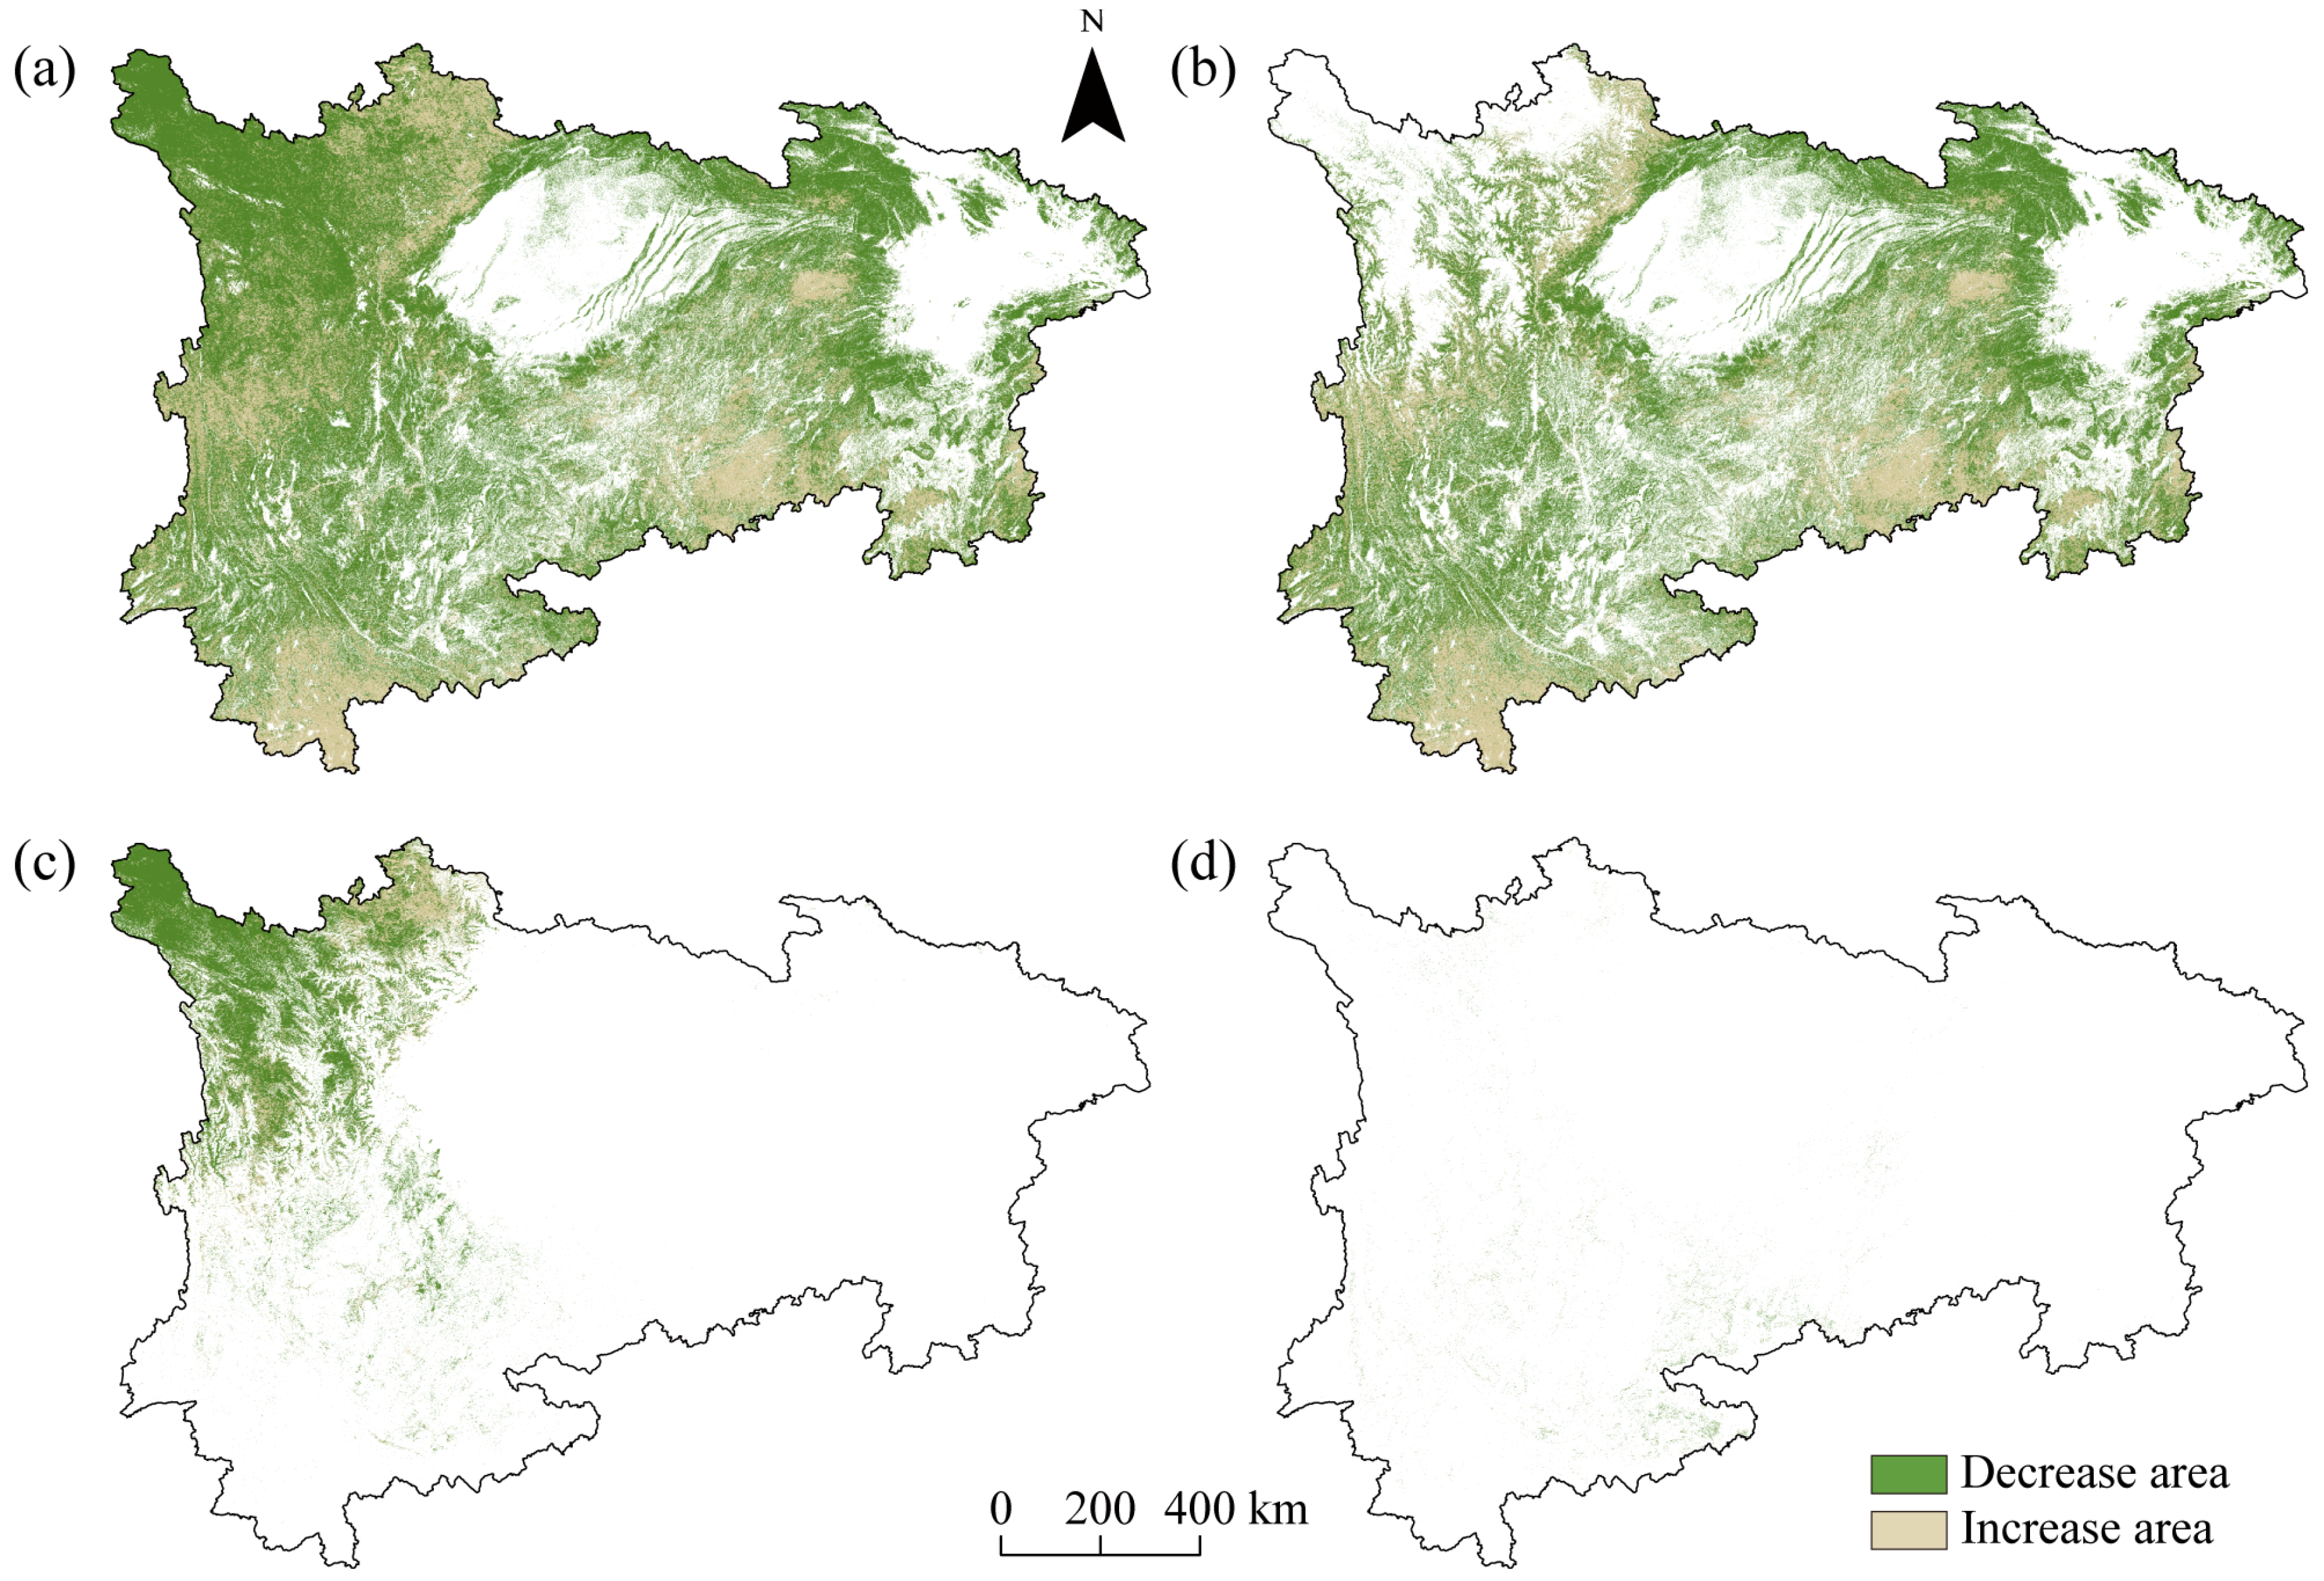
Detailed changes in mean and total NPP across different vegetation types are summarized in Table 4. Regional average NPP increased steadily from 599.52 g C m−2 yr−1 in 2000 to 651.09 g C m−2 yr−1 in 2020, representing a net increase of 51.57 g C m−2 yr−1 (8.60%). Total regional NPP rose by 52.65 Tg C (8.45%) over the same period, while total vegetation area remained stable at approximately 1.03–1.04 million km2. The spatial distribution of NPP change areas across the study area is shown in Figure 4. Spatially, NPP increases were concentrated in southern river valleys, plateaus, and karst mountain regions. Significant NPP decreases were limited to western high-altitude plateaus and isolated mountain edge areas. Most other regions showed stable NPP levels. Forests, the dominant vegetation type, showed the most pronounced NPP gains. However, a different trend emerged during 2015–2020. Mean forest NPP decreased from 762.26 to 737.35 g C m−2 yr−1, whereas shrubland and grassland NPP increased from 405.36 to 436.92 g C m−2 yr−1 and from 276.64 to 282.80 g C m−2 yr−1, respectively. Average forest NPP increased by 50.56 g C m−2 yr−1, and total forest NPP rose by 54.37 Tg C. Forest area expanded by 2.18% over the study period. Forest NPP increases were widespread across most of the study area, with the strongest gains in regions targeted by large-scale ecological restoration projects. Minor decreases were observed in a few high-altitude western regions. In stark contrast to forests, shrublands and grasslands exhibited distinct NPP response trajectories. Average NPP increased by 12.60% for shrublands and 5.48% for grasslands, but total NPP declined slightly for both vegetation types. Grassland NPP increases were concentrated in western high-altitude regions, while decreases occurred in lowland agricultural transition zones. Shrubland NPP showed scattered increases in marginal areas and remained stable or declined slightly elsewhere. Overall, forests were the only vegetation type that showed simultaneous increases in both area and per-unit productivity, driving the overall regional NPP growth. Shrublands and grasslands showed improved per-unit productivity but declining total NPP due to area loss.
Table 4.
Changes in mean and total NPP in the study area from 2000 to 2020.
Figure 4.
Spatial distribution of NPP change areas in the upper and middle Yangtze River from 2000 to 2020. Overall vegetation (a); forest (b); grassland (c); shrubland (d). Green represents areas of NPP decrease, and light brown represents areas of NPP increase. White areas denote regions not covered by the corresponding vegetation type, which are not included in the NPP change analysis.
3.3. Variable Importance of Landscape Metrics
Based on the selected XGBoost model, we quantified the relative predictive importance of different landscape metrics for NPP variation. The normalized variable importance scores for each vegetation type are presented in Table 5. At the overall landscape scale, fragmentation dimension metrics showed the strongest association with NPP, with NP being the top-ranked individual predictor. However, the relative importance of different landscape dimensions varied significantly across vegetation types, revealing distinct sensitivities to landscape configuration.
Table 5.
Normalized variable importance scores of landscape metrics across different vegetation types.
For forests, fragmentation was the landscape dimension most strongly associated with NPP dynamics, with NP accounting for more than twice the predictive importance of any other metric. Aggregation and connectivity metrics had secondary importance, while compositional heterogeneity had the weakest influence. For shrublands, aggregation and connectivity were the most important landscape dimensions, with LPI being the dominant individual metric. Fragmentation metrics had moderate importance, and compositional heterogeneity had the least influence. For grasslands, aggregation and connectivity were also the dominant landscape dimensions, but PLADJ rather than LPI was the most critical individual metric. Compositional heterogeneity had secondary importance, while fragmentation had the weakest influence. Overall, no single landscape metric or dimension could universally explain NPP dynamics across all vegetation types. Forest NPP showed the strongest association with landscape fragmentation, shrubland NPP correlated most closely with the size of dominant patches, and grassland NPP was most strongly linked to the spatial aggregation of similar patches.
4. Discussion
4.1. Dynamic Conversion and Differentiation of Vegetation in the Study Area
Vegetation type changes and landscape pattern evolution were highly consistent across the study area from 2000 to 2020. Regions with significant NDVI and FVC increases were concentrated in mountainous and hilly areas, and their spatial distribution closely matched landscape pattern changes. The initial decrease and subsequent increase in NP likely reflect two distinct phases of ecological restoration. Early implementation of the Grain for Green Program reduced patch numbers by consolidating degraded land. Later conversion of grassland and shrubland to forest increased patch numbers as new forest patches formed. These landscape changes are closely associated with the overall improvement in regional vegetation cover [41,42]. Consistent with previous research, NDVI and FVC showed continuous decreasing trends in the central Sichuan Basin urban agglomerations [43], indicating vegetation degradation and declining ecological quality. Most previous studies attributed this to the direct conversion of natural vegetation to construction land. Our analysis of LSI, which increased to 187.22, further suggests that vegetation degradation in these areas is related not only to direct land conversion but also to declining landscape connectivity alongside urban expansion. NDVI remained relatively stable in the Northwestern Yunnan Plateau, Central Guizhou Karst Mountains, and Middle Nanling Mountains, consistent with findings from the environmentally similar Kherlen River Basin [44]. The lack of significant changes in SHDI and CONTAG suggests that these regions are constrained by topographic conditions and ecological carrying capacity, leading to slower responses to anthropogenic disturbances.
Previous studies have identified land use change as the dominant driver of regional NPP dynamics [45], but few have examined the effects of vegetation type spatial reorganization and associated landscape pattern changes. Our results suggest that conversion of grassland and shrubland to forest, rather than simple increases in vegetation cover, shows the strongest association with sustained NPP improvement in the region. This likely reflects the stronger competitive advantages and more stable community dynamics of forest ecosystems in areas with high topographic relief. The expansion of forest area corresponds to increases in both per-unit area NPP and total regional NPP across the study area. The observed increase in LPI further indicates that forests have strengthened their dominant position in the regional landscape. Forests generally have higher leaf area index, greater carbon sequestration capacity, and more stable community structure than grasslands and shrublands [46,47,48]. Their increasing dominance is, therefore, consistent with the observed pattern of regional NPP growth [49]. In stark contrast, grasslands and shrublands showed increased per-unit NPP but decreased total NPP.
An additional noteworthy pattern is that mean forest NPP declined between 2015 and 2020, whereas shrubland and grassland NPP continued to increase. This divergence may reflect increasing climatic stress, including regional warming and more frequent drought events reported in parts of the Yangtze River Basin during recent years. In addition, as restored forests gradually mature, productivity growth may slow because a larger proportion of assimilated carbon is allocated to maintenance respiration rather than biomass accumulation. By contrast, shrublands and grasslands often respond more rapidly to short-term environmental improvements and resource availability, which may explain their continued productivity increases.
This divergent pattern reveals significant vegetation-specific ecological heterogeneity in productivity responses to landscape change. It also suggests that regional NPP dynamics are primarily associated with changes in the area of high-productivity vegetation types rather than internal productivity changes within individual types. The decreasing trend in PLADJ and fluctuating IJI indicate that forest expansion has not been entirely contiguous. Instead, it has been accompanied by increasing landscape heterogeneity and fragmentation. This finding contrasts with some previous studies that suggested increasing forest aggregation in the Yangtze River Basin [32]. Excessive fragmentation can impair material cycling, population dispersal, and ecosystem stability, potentially offsetting some of the NPP gains from forest expansion [50]. These findings have important implications for ecological restoration and territorial spatial governance in the Yangtze River Basin. Future efforts should not only focus on expanding forest area but also on optimizing the spatial configuration of forest patches. Promoting reasonable aggregation and connectivity among patches can avoid excessive structural complexity from disorderly expansion, leading to coordinated improvements in landscape stability and ecological function.
4.2. Mechanisms Linking Landscape Pattern Changes to NPP Across Vegetation Types
Our results demonstrate that landscape configuration is significantly associated with NPP dynamics, but the relative predictive importance of different landscape dimensions varies dramatically across vegetation types. The superior performance of XGBoost over traditional linear models confirms that landscape–NPP relationships are highly nonlinear and involve complex interactions among metrics [39]. This finding challenges the common assumption of linear relationships in many previous studies. While Pearson correlation analysis may identify multiple significantly correlated landscape metrics [14,51], it tends to amplify the statistical significance of highly correlated indices, leading to results with limited ecological interpretability [52]. Most previous studies have only identified general landscape–NPP relationships at the regional scale [53,54]. Our vegetation-specific analysis reveals that no single landscape dimension or metric can universally explain NPP dynamics across all vegetation types, and the ecological mechanisms underlying these associations need to be interpreted in combination with vegetation functional traits and regional environmental contexts. These results highlight the context-dependent nature of landscape–NPP associations, as similar changes in individual metrics may correspond to different ecological outcomes for different vegetation types. This explains the inconsistent results reported in previous studies that did not distinguish between vegetation types. Machine learning approaches, which can comprehensively model nonlinear and interaction effects, are, therefore, better suited to capture these vegetation-specific responses. This vegetation-specific perspective has important implications for ecological restoration. It allows the development of targeted landscape optimization strategies rather than one-size-fits-all approaches.
Fragmentation-related metrics, particularly NP, showed strong associations with overall regional NPP dynamics. NP has been widely recognized as a key indicator of landscape change in the Yangtze River Basin [55]. Our study found that it showed the strongest association with both overall vegetation NPP (importance = 0.82) and forest NPP (importance = 0.85). This is because forest ecosystems are particularly sensitive to edge effects, and changes in patch number regulate forest productivity by modifying edge habitat proportions, microclimatic conditions, and resource capture efficiency. An increase in patch number creates more edge habitats, which alter microclimatic conditions, light availability, and soil nutrient cycling, thereby potentially altering the growth conditions of interior forest habitats [56,57]. However, the ecological effects of fragmentation are context-dependent. In our study area, the observed increase in NP was not associated with a decline in forest NPP. This is because the increase in patch number primarily resulted from the formation of new forest patches through grassland and shrubland conversion, rather than the subdivision of existing mature forest patches. Most of these newly established patches are in the early successional stage with high productivity growth potential, and their formation increases both patch count and regional vegetation productivity, offsetting any negative edge effects of fragmentation. Therefore, simply reducing the patch number should not be a universal management goal for ecological restoration. In the early stages of restoration, increased patch number may actually reflect successful vegetation establishment rather than degradation. In contrast, patch shape complexity (LSI) had relatively low importance for NPP across all vegetation types. This suggests that patch shape primarily affects NPP indirectly through its influence on hydrological and microclimatic processes, rather than being a direct driver of productivity [58,59].
Landscape connectivity, represented by LPI, PLADJ, and IJI, showed the strongest association with NPP dynamics for grasslands and shrublands. For grasslands, PLADJ was the most important metric, reflecting the critical role of patch aggregation for grassland productivity. Grassland ecosystems rely heavily on spatial connectivity for seed dispersal, nutrient cycling, and pollination. Higher patch aggregation is thought to facilitate the movement of resources and organisms between patches, which may explain its positive association with overall productivity [60]. Therefore, grassland restoration should prioritize improving patch connectivity and spatial continuity rather than simply increasing patch number. Fragmented grassland patches often suffer from dispersal limitation and resource isolation, which prevent them from achieving their full productivity potential. In contrast, NP showed a relatively weak association with grassland NPP, indicating that a simple increase in patch number is not strongly linked to higher grassland productivity. This difference in sensitivity between forests and grasslands highlights the context-dependent nature of landscape metric effects. For forests, increased patch number generally indicates degradation, but for grasslands, it may reflect either natural expansion or anthropogenic disturbance such as grazing or land use conversion [61]. Such processes often lead to a reduction in patch size without a synchronous enhancement of ecological functions, making it difficult for an increase in patch number to exert a significant impact on grassland NPP. This indicates that an increase in the number of grassland patches should not be directly regarded as a signal of ecological improvement. It should be evaluated in combination with its underlying formation mechanism. For shrublands, LPI was the most important connectivity metric. Shrublands typically occur in ecologically fragile areas or successional transition stages, where the size of dominant patches regulates productivity mainly through core habitat stability and ecological succession continuity. Large, continuous shrub patches can maintain intact community structure and successional dynamics, buffer drought stress and anthropogenic disturbances from edge habitats, and provide stable refugia for species persistence and biomass accumulation, which corresponds to higher NPP [62]. In contrast, scattered small patches are more vulnerable to external interference and are prone to reverse succession, making it difficult to sustain stable productivity. Therefore, shrubland restoration should focus on maintaining and expanding large core patches rather than creating numerous small, isolated patches.
IJI had the lowest importance for both grasslands and shrublands. This is because IJI primarily reflects the intermixing of different patch types, while the productivity of grasslands and shrublands is mainly related to the internal structure and connectivity of patches of the same dominant vegetation type [63,64,65]. These ecosystems are relatively insensitive to the degree of interspersion with other vegetation types.
Landscape pattern heterogeneity, represented by SHDI and CONTAG, showed relatively weak associations with NPP across all vegetation types. This suggests that in the upper and middle Yangtze River Basin, NPP dynamics are primarily associated with changes in landscape configuration rather than compositional diversity. However, it should be noted that moderate heterogeneity may still play an important role in maintaining biodiversity and ecosystem stability, even if it does not directly affect productivity. Overall, our results reveal three distinct association patterns across vegetation types: forest NPP is most strongly associated with fragmentation, grassland NPP with patch aggregation, and shrubland NPP with core patch size. This vegetation-specific heterogeneity in landscape responses provides a new framework for understanding landscape–NPP relationships and designing more effective ecological restoration strategies. Specifically, restoration practices should prioritize the integrity and spatial continuity of dominant patches for shrublands and grasslands, while focusing on reducing excessive fragmentation for forest ecosystems.
4.3. Limitations of the Study
This study still has the following limitations that need to be clarified. First, the present analytical framework identifies statistical associations between landscape patterns and NPP rather than direct causal relationships, because environmental covariates such as climate, topography, and human activities were not explicitly incorporated. Second, the use of random train–test partitioning may have led to optimistic estimates of model performance due to spatial autocorrelation, and future studies should consider spatially explicit validation approaches. Third, because landscape–NPP relationships are scale-dependent, the conclusions obtained at the 10 km spatial grain may vary under different spatial scales. Meanwhile, the gain-based variable importance reflects the contribution of each predictor to model prediction performance, which is not equivalent to the strength of underlying ecological mechanisms. This analysis alone cannot demonstrate causal relationships, quantify the direction of ecological responses, or identify functional thresholds between landscape patterns and NPP. Finally, uncertainties associated with land-cover classification accuracy, MODIS spatial resolution constraints, CASA-derived NPP estimation, and error propagation may have influenced the results. Future studies integrating multi-scale analysis, uncertainty quantification, and mechanistic interpretation approaches could further improve the robustness of landscape–NPP research.
5. Conclusions
This study analyzed the spatiotemporal dynamics of vegetation cover, landscape patterns, and NPP in the upper and middle Yangtze River Basin from 2000 to 2020 and explored the relationships between landscape patterns and NPP under different vegetation types using machine learning methods. The results showed that landscape configuration was significantly associated with NPP dynamics, but the strength and pattern of associations varied considerably among vegetation types. Forest NPP showed the closest association with fragmentation, grassland NPP was mainly linked to patch aggregation and connectivity, while shrubland NPP correlated most strongly with the size and stability of dominant patches. In addition, the associations between landscape patterns and NPP exhibited strong nonlinear characteristics, indicating that machine learning methods are effective for capturing complex ecological statistical relationships. Future ecological restoration efforts in the upper and middle Yangtze River Basin should, therefore, adopt vegetation-specific landscape optimization strategies, with greater emphasis on reducing forest fragmentation, improving grassland connectivity, and maintaining stable core shrubland patches.
Author Contributions
C.Z. and D.Z. contributed to the conception and design of this study. C.Z., Y.F., and H.L. prepared the materials, collected data, and analyzed the data. D.Z. secured funding and organized the fieldwork. The initial draft of the manuscript was written by C.Z., with all authors providing critical feedback on earlier versions. All authors have read and agreed to the published version of the manuscript.
Funding
This study is supported in part by the Graduate Research and Innovation Project of Lishui University (YKY25009) and the 14th Five-Year Plan Second Batch of Provincial Undergraduate Teaching Reform Project (JGBA2024551).
Data Availability Statement
The original contributions presented in this study are included in the article. Further inquiries can be directed to the corresponding author.
Acknowledgments
Thanks to the anonymous reviewers for the constructive and valuable comments and the editors for their assistance in refining this article.
Conflicts of Interest
The authors declare no conflicts of interest.
References
- Kaenchan, P.; Guinée, J.; Gheewala, S.H. Assessment of ecosystem productivity damage due to land use. Sci. Total Environ. 2018, 621, 1320–1329. [Google Scholar] [CrossRef] [Scilit] [PubMed]
- Guo, E.; Liu, X.; Zhang, J.; Wang, Y.; Wang, C.; Wang, R.; Li, D. Assessing spatiotemporal variation of drought and its impact on maize yield in Northeast China. J. Hydrol. 2017, 553, 231–247. [Google Scholar] [CrossRef] [Scilit]
- Kong, R.; Zhang, Z.; Hu, J.; Yan, D.; Song, W.; Li, X.; Zhang, H.; Tian, J. The tibetan plateau’s looming trade-off attribution and future trajectories of vegetation growth versus water yield. Forests 2026, 17, 181. [Google Scholar] [CrossRef] [Scilit]
- Wang, X.; Zhang, P.; Liu, L.; Li, D.; Wang, Y. Effects of Human Activities on Hydrological Components in the Yiluo River Basin in Middle Yellow River. Water 2019, 11, 689. [Google Scholar] [CrossRef] [Scilit]
- Liu, J.; Sleeter, B.M.; Zhu, Z.; Loveland, T.R.; Sohl, T.; Howard, S.M.; Key, C.H.; Hawbaker, T.; Liu, S.; Reed, B.; et al. Critical land change information enhances the understanding of carbon balance in the United States. Glob. Change Biol. 2020, 26, 3920–3929. [Google Scholar] [CrossRef] [Scilit] [PubMed]
- Lin, N.; Li, J.; Jiang, R.; Li, X.; Liu, S. Quantifying the spatiotemporal variation of NPP of different land cover types and the contribution of its associated factors in the songnen plain. Forests 2023, 14, 1841. [Google Scholar] [CrossRef] [Scilit]
- Wu, S.; Zhou, S.; Chen, D.; Wei, Z.; Dai, L.; Li, X. Determining the contributions of urbanisation and climate change to NPP variations over the last decade in the Yangtze River Delta, China. Sci. Total Environ. 2014, 472, 397–406. [Google Scholar] [CrossRef] [Scilit] [PubMed]
- Jia, Y.; Tang, L.; Xu, M.; Yang, X. Landscape pattern indices for evaluating urban spatial morphology—A case study of Chinese cities. Ecol. Indic. 2019, 99, 27–37. [Google Scholar] [CrossRef] [Scilit]
- Zhang, J.; Zhao, X.; Guo, J.; Zhao, Y.; Huang, X.; Long, M. Spatio-temporal evolution and driving factors of landscape pattern in a typical hilly area in southern china: A case study of yujiang district, jiangxi province. Forests 2023, 14, 609. [Google Scholar] [CrossRef] [Scilit]
- Chen, C.; Zhao, G.; Zhang, Y.; Bai, Y.; Tian, P.; Mu, X.; Tian, X. Linkages between soil erosion and long-term changes of landscape pattern in a small watershed on the Chinese Loess Plateau. CATENA 2023, 220, 106659. [Google Scholar] [CrossRef] [Scilit]
- Kang, J.; Yang, J.; Qing, Y.; Lu, W. Landscape ecological risk assessment of saihanba under the change in forest landscape pattern. Forests 2024, 15, 700. [Google Scholar] [CrossRef] [Scilit]
- Yang, H.; Zhong, X.; Deng, S.; Xu, H. Assessment of the impact of LUCC on NPP and its influencing factors in the Yangtze River basin, China. CATENA 2021, 206, 105542. [Google Scholar] [CrossRef] [Scilit]
- Shao, S.; Yang, Y. Analysis of change process of NPP dominated by human activities in Northwest Hubei, China, from 2000 to 2020. Environ. Sci. Pollut. Res. 2024, 31, 19831–19843. [Google Scholar] [CrossRef] [Scilit] [PubMed]
- Xu, C.; Li, C. Correlation between Landscape Pattern and Net Primary Productivity of Vegetation: A Case Study in the Arid and Semi-Arid Regions of Northwest China. Land 2023, 12, 2004. [Google Scholar] [CrossRef] [Scilit]
- Zhao, X.; Zhou, W.; Tian, L.; He, W.; Zhang, J.; Liu, D.; Yang, F. Effects of land-use changes on vegetation net primary productivity in the Three Gorges Reservoir Area of Chongqing. Acta Ecol. Sin. 2018, 38, 7658–7668. [Google Scholar]
- Xue, S.; Ma, B.; Wang, C.; Li, Z. Identifying key landscape pattern indices influencing the NPP: A case study of the upper and middle reaches of the Yellow River. Ecol. Model. 2023, 484, 110457. [Google Scholar] [CrossRef] [Scilit]
- Zhang, W.; Wang, L.; Xiang, F.; Qin, W.; Jiang, W. Vegetation dynamics and the relations with climate change at multiple time scales in the Yangtze River and Yellow River Basin, China. Ecol. Indic. 2020, 110, 105892. [Google Scholar] [CrossRef] [Scilit]
- Tran, D.X.; Pearson, D.; Palmer, A.; Lowry, J.; Gray, D.; Dominati, E.J. Quantifying spatial non-stationarity in the relationship between landscape structure and the provision of ecosystem services: An example in the New Zealand hill country. Sci. Total Environ. 2022, 808, 152126. [Google Scholar] [CrossRef] [Scilit] [PubMed]
- Wu, J.; Han, P.; Yu, J.; Jarvie, S.; Zhang, Y.; Zhang, Q. Edge grassland provide a stronger thermal buffer against core grassland in the agro-pastoral ecotone of Inner Mongolia. Ecol. Indic. 2023, 154, 110762. [Google Scholar] [CrossRef] [Scilit]
- Hao, R.; Yu, D.; Liu, Y.; Liu, Y.; Qiao, J.; Wang, X.; Du, J. Impacts of changes in climate and landscape pattern on ecosystem services. Sci. Total Environ. 2017, 579, 718–728. [Google Scholar] [CrossRef] [Scilit] [PubMed]
- Chen, L.; Zhou, J.; Guo, L.; Bian, X.; Xu, Z.; Chen, Q.; Wen, S.-H.; Wang, K.; Liu, Y.-R. Global Distribution of Mercury in Foliage Predicted by Machine Learning. Environ. Sci. Technol. 2024, 58, 15629–15637. [Google Scholar] [CrossRef] [Scilit] [PubMed]
- Gregorutti, B.; Michel, B.; Saint-Pierre, P. Correlation and variable importance in random forests. Stat. Comput. 2017, 27, 659–678. [Google Scholar] [CrossRef] [Scilit]
- Wang, M.; Sun, K.; Jia, J.; Wu, F.; Gao, Y. Climate Change Drove the Decline in Yangtze Estuary Net Primary Production Over the Past Two Decades. Environ. Sci. Technol. 2024, 58, 19305–19314. [Google Scholar] [CrossRef] [Scilit] [PubMed]
- Zhang, Y.; Zhao, W.; Yang, J. Spatiotemporal Dynamics of Vegetation Net Primary Productivity (NPP) and Multiscale Responses of Driving Factors in the Yangtze River Delta Urban Agglomeration. Sustainability 2025, 17, 6119. [Google Scholar] [CrossRef] [Scilit]
- Xie, L.; Li, Y.; Zhang, Z.; Siddique, K.H.M.; Song, X. Exploring the combined effects of drought and drought-flood abrupt alternation on vegetation using interpretable machine learning model and r-vine copula function. Agric. For. Meteorol. 2025, 370, 110568. [Google Scholar] [CrossRef] [Scilit]
- Yang, X.; Meng, F.; Fu, P.; Zhang, Y.; Liu, Y. Spatiotemporal change and driving factors of the Eco-Environment quality in the Yangtze River Basin from 2001 to 2019. Ecol. Indic. 2021, 131, 108214. [Google Scholar] [CrossRef] [Scilit]
- Sun, H.; Wang, H.; Hu, X. Synergetic Network Evolution of Mineral Exploitation on the Water Environment in the Yangtze River Economic Belt. Nat. Resour. Res. 2020, 29, 3581–3598. [Google Scholar] [CrossRef] [Scilit]
- Dai, X.; Wang, L.; Huang, C.; Fang, L.; Wang, S.; Wang, L. Spatio-temporal variations of ecosystem services in the urban agglomerations in the middle reaches of the Yangtze River, China. Ecol. Indic. 2020, 115, 106394. [Google Scholar] [CrossRef] [Scilit]
- Chen, D.; Jiang, P.; Li, M. Assessing potential ecosystem service dynamics driven by urbanization in the Yangtze River Economic Belt, China. J. Environ. Manag. 2021, 292, 112734. [Google Scholar] [CrossRef] [Scilit] [PubMed]
- Gao, J. Delineating Ecological Protection Redlines to Promote Ecological Protection in the Yangtze River Economic Belt. Environ. Prot. 2016, 44, 21–24. [Google Scholar] [CrossRef]
- Liu, Z.; Wang, B.; Zhao, Y.; Niu, X. Monitoring and evaluation of the effects of Grain for Green Project in the upper and middle reaches of China’s Yangtze River. Chin. J. Appl. Ecol. 2018, 29, 2463–2469. [Google Scholar] [CrossRef] [PubMed]
- Yang, H.; Zhong, X.; Deng, S.; Nie, S. Impact of LUCC on landscape pattern in the Yangtze River Basin during 2001–2019. Ecol. Inform. 2022, 69, 101631. [Google Scholar] [CrossRef] [Scilit]
- Wallin, D.O.; Swanson, F.J.; Marks, B. Landscape Pattern Response to Changes in Pattern Generation Rules: Land-Use Legacies in Forestry. Ecol. Appl. 1994, 4, 569–580. [Google Scholar] [CrossRef] [Scilit]
- Yang, J.; Huang, X. The 30 m annual land cover dataset and its dynamics in China from 1990 to 2019. Earth Syst. Sci. Data 2021, 13, 3907–3925. [Google Scholar] [CrossRef] [Scilit]
- Wang, Z.; Dong, C.; Dai, L.; Wang, R.; Liang, Q.; He, L.; Wei, D. Spatiotemporal evolution and attribution analysis of grassland NPP in the Yellow River source region, China. Ecol. Inform. 2023, 76, 102135. [Google Scholar] [CrossRef] [Scilit]
- Wang, H.; Zhang, D.; Liu, S.; Ye, S.; Jin, X.; Wu, J. Regional proximity effects of landscape pattern evolution: Evidence from 325 county-level areas in the middle reaches of the Yangtze River, China. Sci. Total Environ. 2023, 903, 166134. [Google Scholar] [CrossRef] [Scilit] [PubMed]
- Zhang, F.; Zhang, Z.; Kong, R.; Chang, J.; Tian, J.; Zhu, B.; Jiang, S.; Chen, X.; Xu, C.-Y. Changes in Forest Net Primary Productivity in the Yangtze River Basin and Its Relationship with Climate Change and Human Activities. Remote Sens. 2019, 11, 1451. [Google Scholar] [CrossRef] [Scilit]
- Xu, M.; Hu, C.; Najjar, R.G.; Herrmann, M.; Briceno, H.; Barnes, B.B.; Roger Johansson, J.O.; English, D. Estimating estuarine primary production using satellite data and machine learning. Int. J. Appl. Earth Obs. Geoinf. 2022, 110, 102821. [Google Scholar] [CrossRef] [Scilit]
- Prokhorenkova, L.; Gusev, G.; Vorobev, A.; Dorogush, A.V.; Gulin, A. CatBoost: Unbiased Boosting with Categorical Features. In Proceedings of the Advances in Neural Information Processing Systems; Bengio, S., Wallach, H., Larochelle, H., Grauman, K., Cesa-Bianchi, N., Garnett, R., Eds.; Curran Associates, Inc.: Red Hook, NY, USA, 2018; Volume 31. [Google Scholar]
- Yu, Z.; Bu, C.; Li, Y. Machine learning for ecological analysis. Chem. Eng. J. 2025, 507, 160780. [Google Scholar] [CrossRef] [Scilit]
- Mitchell, M.G.E.; Wu, D.; Johansen, K.; Maron, M.; McAlpine, C.; Rhodes, J.R. Landscape structure influences urban vegetation vertical structure. J. Appl. Ecol. 2016, 53, 1477–1488. [Google Scholar] [CrossRef] [Scilit]
- Li, G.; Sun, S.; Han, J.; Yan, J.; Liu, W.; Wei, Y.; Lu, N.; Sun, Y. Impacts of Chinese Grain for Green program and climate change on vegetation in the Loess Plateau during 1982–2015. Sci. Total Environ. 2019, 660, 177–187. [Google Scholar] [CrossRef] [Scilit] [PubMed]
- Peng, W.; Kuang, T.; Tao, S. Quantifying influences of natural factors on vegetation NDVI changes based on geographical detector in Sichuan, western China. J. Clean. Prod. 2019, 233, 353–367. [Google Scholar] [CrossRef] [Scilit]
- Yu, S.; Du, W.; Zhang, X.; Hong, Y.; Liu, Y.; Hong, M.; Chen, S. Spatiotemporal Changes in NDVI and Its Driving Factors in the Kherlen River Basin. Chin. Geogr. Sci. 2023, 33, 377–392. [Google Scholar] [CrossRef] [Scilit]
- Mao, R.; Xing, L.; Wu, Q.; Song, J.; Li, Q.; Long, Y.; Shi, Y.; Huang, P.; Zhang, Q. Evaluating net primary productivity dynamics and their response to land-use change in the loess plateau after the “Grain for Green” program. J. Environ. Manag. 2024, 360, 121112. [Google Scholar] [CrossRef] [Scilit] [PubMed]
- Tang, X.; Zhao, X.; Bai, Y.; Tang, Z.; Wang, W.; Zhao, Y.; Wan, H.; Xie, Z.; Shi, X.; Wu, B.; et al. Carbon pools in China’s terrestrial ecosystems: New estimates based on an intensive field survey. Proc. Natl. Acad. Sci. USA 2018, 115, 4021–4026. [Google Scholar] [CrossRef] [Scilit] [PubMed]
- Lu, F.; Hu, H.; Sun, W.; Zhu, J.; Liu, G.; Zhou, W.; Zhang, Q.; Shi, P.; Liu, X.; Wu, X.; et al. Effects of national ecological restoration projects on carbon sequestration in China from 2001 to 2010. Proc. Natl. Acad. Sci. USA 2018, 115, 4039–4044. [Google Scholar] [CrossRef] [Scilit] [PubMed]
- Blüthgen, N.; Simons, N.; Jung, K.; Prati, D.; Renner, S.; Boch, S.; Fischer, M.; Hölzel, N.; Klaus, V.; Kleinebecker, T.; et al. Land use imperils plant and animal community stability through changes in asynchrony rather than diversity. Nat. Commun. 2016, 7, 10697. [Google Scholar] [CrossRef] [Scilit] [PubMed]
- Riutta, T.; Malhi, Y.; Kho, L.K.; Marthews, T.R.; Huaraca Huasco, W.; Khoo, M.; Tan, S.; Turner, E.; Reynolds, G.; Both, S.; et al. Logging disturbance shifts net primary productivity and its allocation in Bornean tropical forests. Glob. Change Biol. 2018, 24, 2913–2928. [Google Scholar] [CrossRef] [Scilit] [PubMed]
- Liu, Z.; Long, Y.; Wang, G.; Yang, C.; Qian, J. Assessing Post-Disturbance Net Primary Productivity (NPP) Recovery in Vegetation Disturbance Patches on the Northwestern Sichuan Plateau to Inform Sustainable Ecosystem Management. Sustainability 2026, 18, 4125. [Google Scholar] [CrossRef] [Scilit]
- Xie, Q.; Ren, J. Climate-Driven Dynamics of Landscape Patterns and Carbon Sequestration in Inner Mongolia: A Spatiotemporal Analysis from 2000 to 2020. Atmosphere 2025, 16, 790. [Google Scholar] [CrossRef] [Scilit]
- Zhou, Y.; Yue, D.; Guo, J.; Chen, G.; Wang, D. Spatial correlations between landscape patterns and net primary productivity: A case study of the Shule River Basin, China. Ecol. Indic. 2021, 130, 108067. [Google Scholar] [CrossRef] [Scilit]
- Tian, X.; Huang, Y.; Hu, W.; Li, G.; Li, C.; Yang, R.; Fu, C.; Lei, W. Evaluation of the impact of ecological poplar retreat on the net primary productivity of Lake Wetland. Ecol. Eng. 2025, 212, 107528. [Google Scholar] [CrossRef] [Scilit]
- Chi, Y.; Shi, H.; Zheng, W.; Wang, E. Archipelagic landscape patterns and their ecological effects in multiple scales. Ocean Coast. Manag. 2018, 152, 120–134. [Google Scholar] [CrossRef] [Scilit]
- Li, N.; Wang, G.; Liu, G.; Lin, Y.; Sun, X. The ecological implications of land use change in the Source Regions of the Yangtze and Yellow Rivers, China. Reg. Environ. Change 2013, 13, 1099–1108. [Google Scholar] [CrossRef] [Scilit]
- Hua, R.; Ye, G.; De Giuli, M.; Zhou, R.; Bao, D.; Hua, L.; Niu, Y. Decreased species richness along bare patch gradient in the degradation of Kobresia pasture on the Tibetan Plateau. Ecol. Indic. 2023, 157, 111195. [Google Scholar] [CrossRef] [Scilit]
- Jiang, P.; Cheng, L.; Li, M.; Zhao, R.; Huang, Q. Analysis of landscape fragmentation processes and driving forces in wetlands in arid areas: A case study of the middle reaches of the Heihe River, China. Ecol. Indic. 2014, 46, 240–252. [Google Scholar] [CrossRef] [Scilit]
- Yao, G.; Li, H.; Wang, N.; Du, H.; Zhang, L.; Liu, C.; Chen, Y. Pattern of cooling benefits from ecospaces during urbanization: A case study of the Yangtze River Economic Belt. Sci. Total Environ. 2024, 932, 172974. [Google Scholar] [CrossRef] [Scilit] [PubMed]
- Sadeghi, S.H.; Moradi Dashtpagerdi, M.; Moradi Rekabdarkoolai, H.; Schoorl, J.M. Sensitivity analysis of relationships between hydrograph components and landscapes metrics extracted from digital elevation models with different spatial resolutions. Ecol. Indic. 2021, 121, 107025. [Google Scholar] [CrossRef] [Scilit]
- Zhang, C.; Chen, W.; Huang, F.; He, L.; Li, H. Dynamic simulation of functional connectivity and identification of conservation priorities for grassland in China’s Poyang Lake considering ecological processes. Ecol. Indic. 2023, 149, 110163. [Google Scholar] [CrossRef] [Scilit]
- Song, Y.; Xu, M.; Xu, T.; Zhao, X.; Yue, Y.; Yu, H.; Zhang, M.; Wang, L. Changes in plant community assembly from patchy degradation of grasslands and grazing by different-sized herbivores. Ecol. Appl. 2023, 33, e2803. [Google Scholar] [CrossRef] [Scilit] [PubMed]
- Browning, D.M.; Laliberte, A.S.; Rango, A. Temporal dynamics of shrub proliferation: Linking patches to landscapes. Int. J. Geogr. Inf. Sci. 2011, 25, 913–930. [Google Scholar] [CrossRef] [Scilit]
- Lucie, L.; Aude, E.; Elodie, F.; Sébastien, R.; Benjamin, C.; Maube, B.; Cendrine, M. Landscape structure influences grassland productivity through plant functional diversity. Agric. Ecosyst. Environ. 2023, 357, 108650. [Google Scholar] [CrossRef] [Scilit]
- Liu, Y.; Zhou, R.; Wen, Z.; Khalifa, M.; Zheng, C.; Ren, H.; Zhang, Z.; Wang, Z. Assessing the impacts of drought on net primary productivity of global land biomes in different climate zones. Ecol. Indic. 2021, 130, 108146. [Google Scholar] [CrossRef] [Scilit]
- Ratajczak, Z.; D’Odorico, P.; Nippert, J.B.; Collins, S.L.; Brunsell, N.A.; Ravi, S. Changes in spatial variance during a grassland to shrubland state transition. J. Ecol. 2017, 105, 750–760. [Google Scholar] [CrossRef] [Scilit]

Disclaimer/Publisher’s Note: The statements, opinions and data contained in all publications are solely those of the individual author(s) and contributor(s) and not of MDPI and/or the editor(s). MDPI and/or the editor(s) disclaim responsibility for any injury to people or property resulting from any ideas, methods, instructions or products referred to in the content. |
© 2026 by the authors. Licensee MDPI, Basel, Switzerland. This article is an open access article distributed under the terms and conditions of the Creative Commons Attribution (CC BY) license.