Article

The Global Scientific Trends and Knowledge Structure of Deforestation Research (1974–2025): A Bibliometric Analysis


by
Mangala Jayarathne
1,2,*,
Takehiro Morimoto
3,
Manjula Ranagalage
4 and
Yuji Mureyama
3
1
Graduate School of Science and Technology, University of Tsukuba, 1-1-1, Tennodai, Tsukuba 305-8572, Japan
2
Department of Geography, University of Kelaniya, Dalugama, Kelaniya 11600, Sri Lanka
3
Institute of Life and Environmental Sciences, University of Tsukuba, 1-1-1, Tennodai, Tsukuba 305-8572, Japan
4
Department of Environmental Management, Faculty of Social Sciences and Humanities, Rajarata University of Sri Lanka, Mihintale 50300, Sri Lanka
*
Author to whom correspondence should be addressed.
Forests 2026, 17(7), 798; https://doi.org/10.3390/f17070798 (registering DOI)
Submission received: 26 May 2026 / Revised: 1 July 2026 / Accepted: 4 July 2026 / Published: 7 July 2026
(This article belongs to the Section Forest Ecology and Management)

Abstract

Deforestation remains a crucial Anthropocene challenge, driving biodiversity loss, carbon emissions, and socio-ecological disruption. Despite extensive study, the long-term structure, thematic evolution, and collaborative patterns of deforestation research remain insufficiently synthesized. This bibliometric analysis examines 5091 publications from WoS and Scopus (1974–2025), using RStudio (version 4.5.2 (31 October 2025)), VOSViewer (version 1.6.20), and Excel to analyze publication trends, citation patterns, thematic clusters, and collaboration networks. Results show rapid growth after 2000, with citation peaks in 2010 and 2020. Major thematic clusters include deforestation, climate change, agriculture, governance, REDD+, and remote sensing. Environmental Research Letters is the most influential journal; Fearnside, P., is the leading author, and the UC system is a top institution. The USA and Brazil lead nationally, with the Amazon, Congo Basin, and Southeast Asia as primary geographic foci, reflecting persistent North–South collaboration dynamics. Limitations include reliance on English-language publications and title-only search criteria, which may underrepresent non-Anglophone research. Future research should expand to multiple languages, incorporate gray literature, and examine the policy impacts of deforestation-free supply chain regulations, such as the EUDR. This review underscores deforestation science as a growing, multidisciplinary field that requires the integration of social and ecological sciences, AI, and geospatial tools, alongside stronger research-policy linkages and enhanced capacity in forest-affected regions.

1. Introduction

Deforestation represents one of the most critical socio-ecological challenges of the Anthropocene, with profound implications for biodiversity conservation, climate regulation, and human well-being [1,2,3]. Earth’s forests are shrinking, and most are already below safe levels, with the overall trend still negative, even though the pace of forest loss has slowed [4]. The world’s forest cover is estimated at 4.14 billion hectares, which is 32% of Earth’s land surface, and 1300 million people depend directly on forests [5,6,7]. The deforestation rate was estimated at 10.9 million hectares per year from 2015 to 2025, down from 13.6 million hectares per year from 2000 to 2015 and 17.5 million hectares per year from 1990 to 2000 [1,5,7,8]. Currently, estimates indicate that global forest cover has fallen to approximately 59%, well below the planetary boundary threshold of 75%, and that every major biome has transgressed its representative safety limit [7].
The recent adoption of the European Union Deforestation-Free Products Regulation (EUDR) has intensified the policy demand for increased scientific evidence to support implementation, monitoring, and compliance. The EUDR extends due-diligence obligations from wood and paper products to a wider range of commodities, including cattle, palm oil, soy, coffee, cocoa, and rubber, which are major drivers of global deforestation [9,10]. However, as Corona et al. (2023) have observed, significant knowledge gaps remain regarding the role of scientific research in tracking deforestation and forest degradation within this new regulatory context [9,10,11].
Despite the exponential growth of deforestation research since the 1970s, no comprehensive bibliometric study has systematically mapped the intellectual architecture of this field across a 50-year horizon (1974–2025). Existing syntheses are predominantly narrative reviews concentrated within specific disciplines or confined to particular regions or time windows. Critically, no prior study has simultaneously examined publication dynamics, thematic cluster evaluation, citation influence networks, and international collaboration patterns within a single, unified bibliometric framework applied across the entire field of deforestation science.
First, this study uses a purpose-designed query focused on deforestation as a unified research domain, rather than treating it as a secondary theme within broader forest or land-use searches. Second, it spans the longest time window yet applied—52 (1974–2025)—capturing the field’s foundational period, its policy acceleration phase post-Rio 1992, and its current data-intensive era. Third, it triangulates three complementary analytical platforms (RStudio (version 4.5.2 (31 October 2025)) Bibliometrix/Biblioshiny, VOSViewer (version 1.6.20), and MS Excel) to cross-validate thematic and network findings. Fourth and most distinct along Global North–South divisions and analytical dimension, absent from all prior forest bibliometric studies identified in our review.
Deforestation is among the most epistemically complex challenges in environmental science [12,13]; it intersects ecology, agriculture, economics, indigenous land rights, climate modeling, governance studies, and remote-sensing technology [12,13,14]. This disciplinary breadth means that no single researcher, institute, or journal community holds a complete view of the field’s intellectual landscape [15]. Bibliometric analysis addresses this problem directly; it is the only method that can objectively and reproducibly map the structure, evolution, and social organization of a research field at scale, without the selection biases inherent in narrative review. For deforestation specifically, bibliometrics enables us to ask which geographic and thematic areas have attracted disproportionate scientific attention, whether the distribution of knowledge production mirrors or exacerbates the geographic concentration of forest loss, and how citation influence has shared research agendas over time. These are questions that any amount of substantive expertise alone cannot answer; they require systematic, quantitative analysis of the literature as a whole.
This study employs bibliometric analysis to map the structural evaluation, thematic landscape, and collaborative dynamics of global deforestation research from 1974 to 2025, addressing four specific research questions: (i) How has the volume and citation structure of deforestation research evolved over five decades? (ii) What patterns of scholar productivity and influence characterize the field in terms of leading contributors, institutions, and countries? (iii) Which thematic clusters and imagining topics define the intellectual trajectory? (iv) How do international collaboration networks reflect geographical inequalities and research capacity gaps, and what do these patterns hold for forest science and policy? By identifying where scientific capacity is concentrated and where critical gaps remain, this analysis can directly inform research prioritization and support emerging policy frameworks such as the EUDR, providing a replicable evidence base that helps funding bodies and policymakers align research investments with conservation needs.

2. Materials and Methods

2.1. Data Collection and Refinement

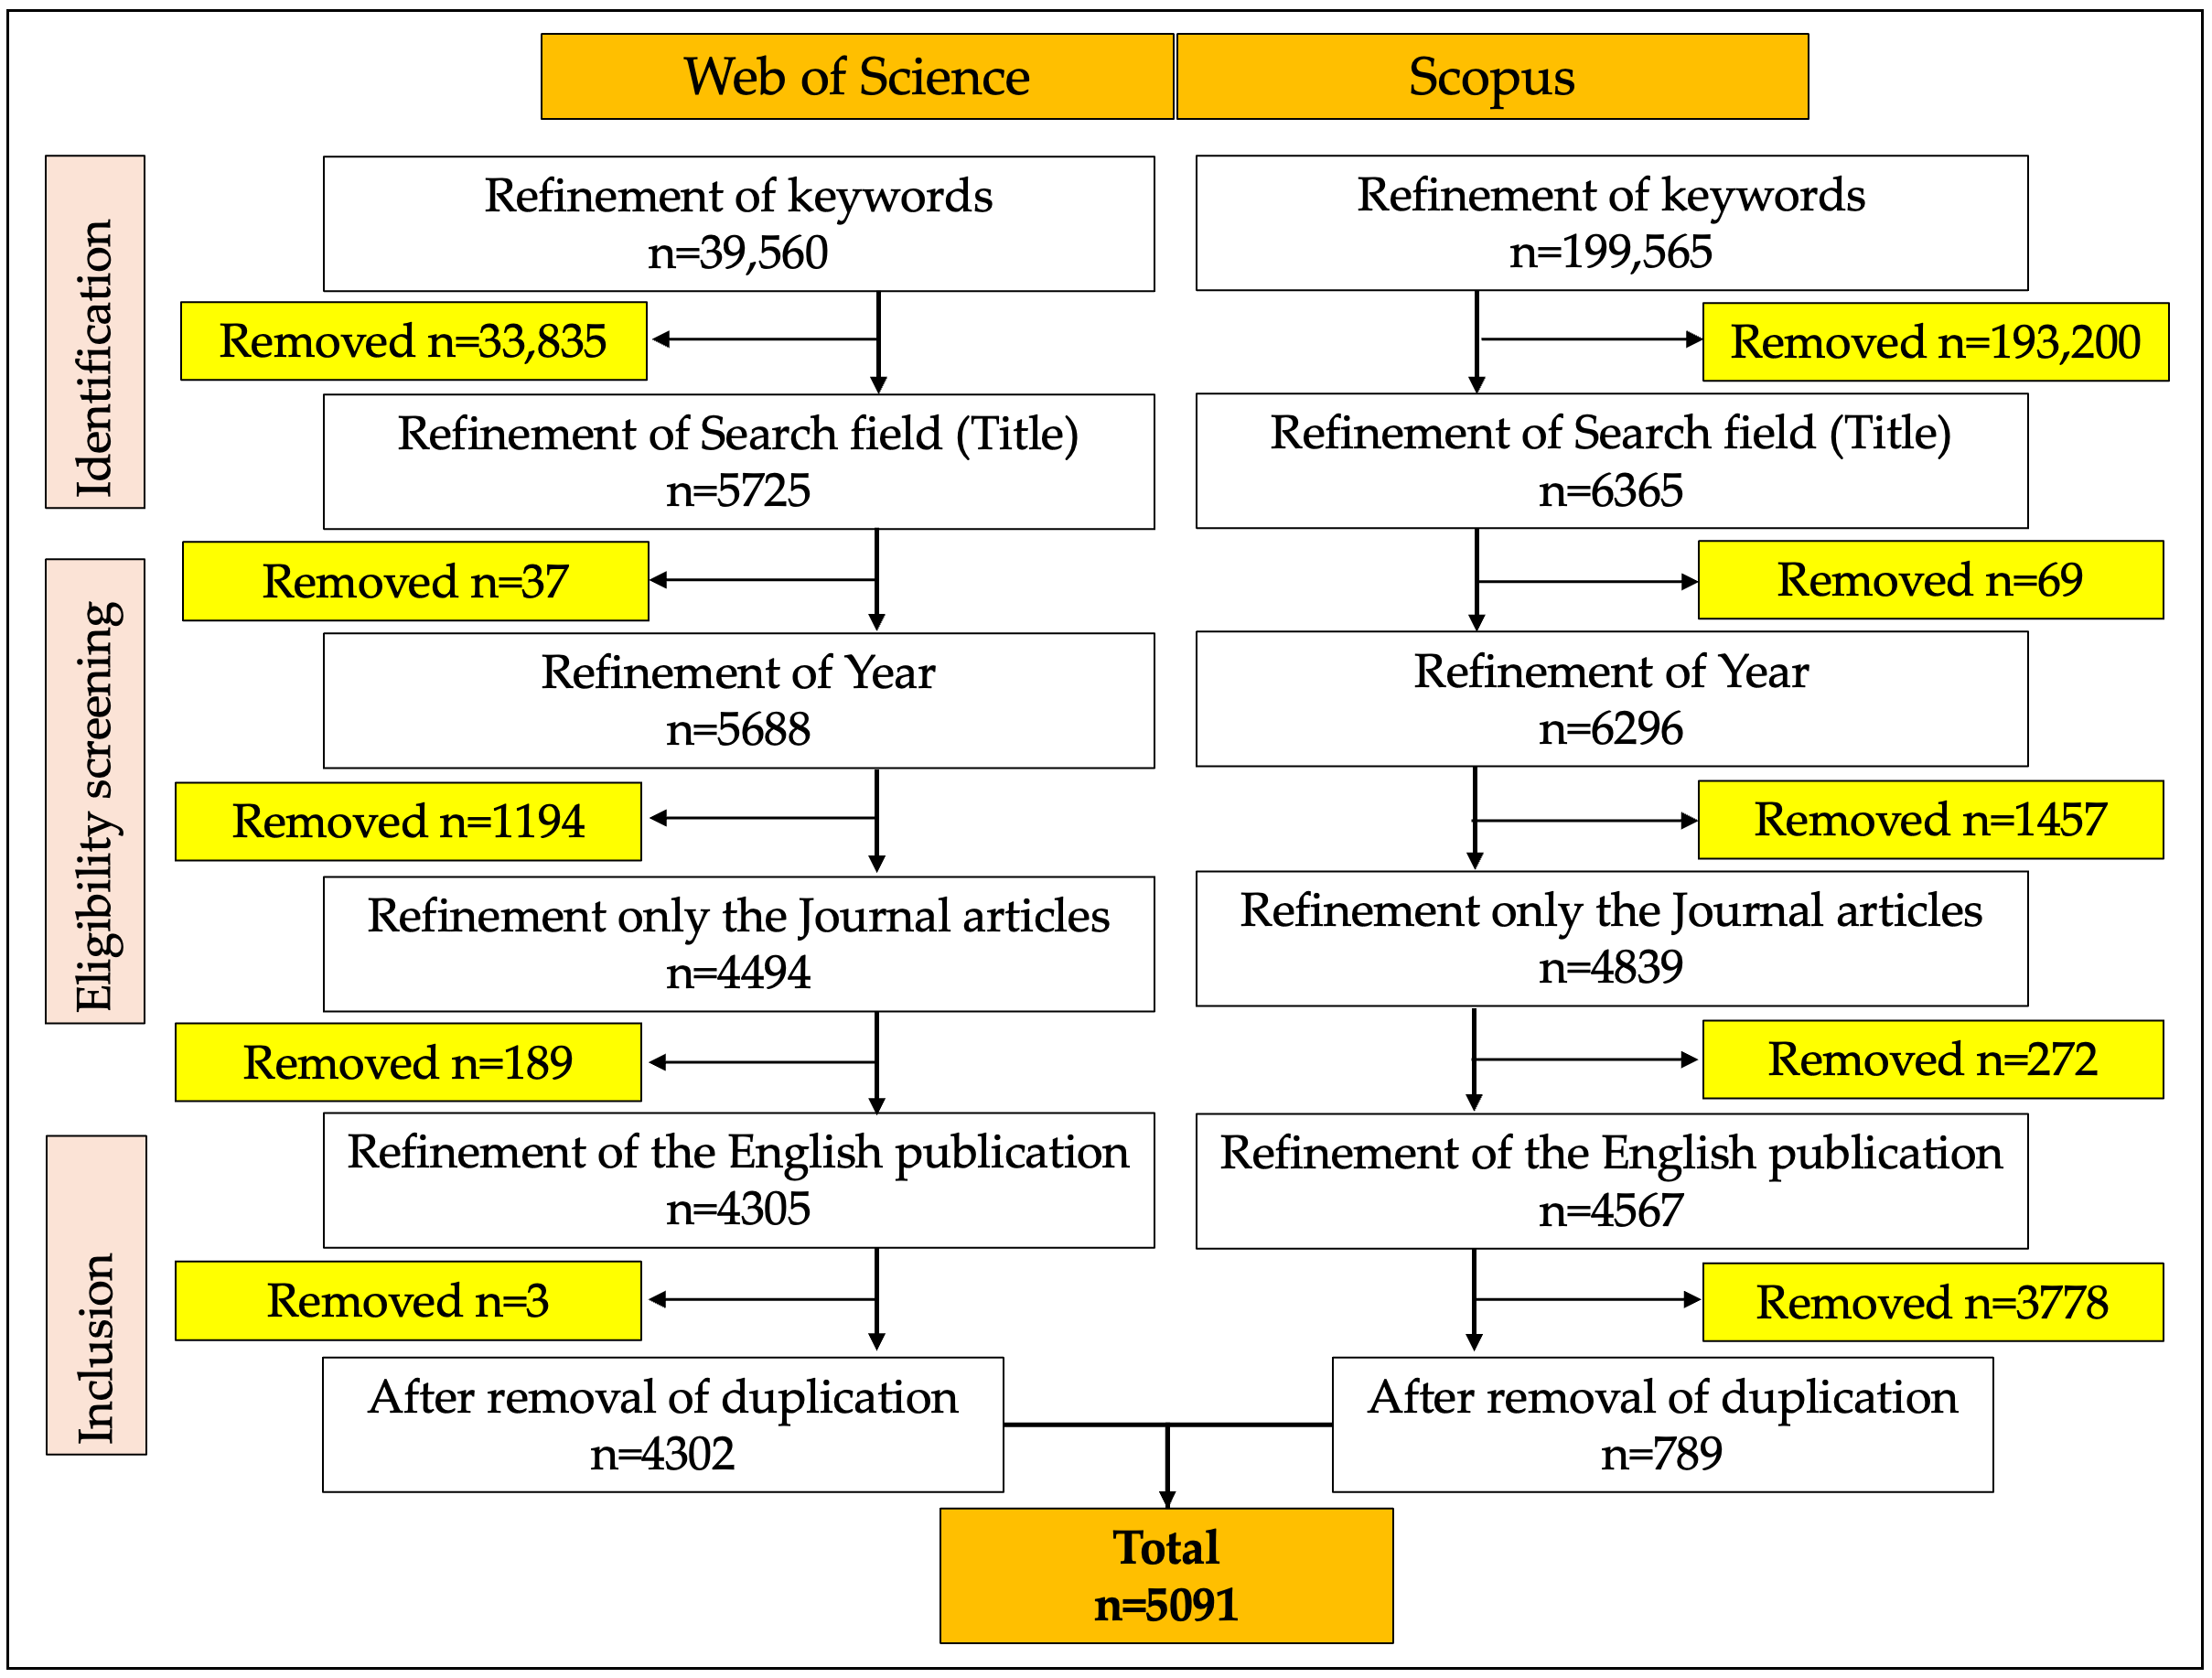
Web of Science and Scopus are the leading proprietary bibliometric databases for academic research [16,17,18]. The WoS collection, which covers data series from 1974 to 2025, stands out for its wide variety of articles and includes the authors and bibliographic citations for each [19]. The Scopus database has historical content dating back to 1788; it is an authoritative database of references and abstracts that covers peer-reviewed research across the sciences, engineering, medicine, and sociology [19,20]. In bibliometric analysis, data refinement is the most important part. Data refinement, also known as data preprocessing or cleaning, is a critical yet often neglected stage in bibliometric analysis, with direct implications for the validity and reliability of subsequent findings [21]. Figure 1 presents the PRISMA flow diagram, which documents the systematic process to ensure transparency and reproducibility [17]. The inclusion criteria for this study are presented in Table 1, which summarizes the search criteria used for data retrieval. Also, (i) non-article document types, including reviews, conference papers, editorials, and book chapters; (ii) records with insufficient metadata for bibliometric analysis; and (iii) duplicate records identified during cross-database merging applied for exclusion criteria.
The initial search used deforest* OR “forest cover loss” OR “forest degradation” as keywords, retrieving 239,125 articles across WoS (39,560) and Scopus (199,565) in all fields. Although terms such as “forest conservation”, “tree cover loss”, and “tropical forest loss” constitute legitimate synonyms in the deforestation literature [22], they were deliberately excluded, based on a methodological trade-off between recall and precision. An exploratory sensitivity search using these omitted terms confirmed that while they increased the number of retrieved records, a substantial proportion of the additional publications focused primarily on forest management, conservation planning, or land-cover monitoring rather than on deforestation per se, reducing specificity without proportionately improving relevance. Retaining only the core terms ensured that the retrieved corpus remained focused on deforestation as the primary research object. We acknowledge that this strategy may undercount contributions from remote sensing, land-use science, and agroforestry, and we explicitly note this as a limitation of the present study. Expanding the keyword set to include synonymous terms across multiple fields is therefore recommended as a priority for future, more exhaustive systematic reviews. In the first-stage refinement, the search was further restricted to the “title” field to maximize precision and ensure that retrieved articles address deforestation as their principal focus rather than referencing it incidentally in abstracts or keywords [23,24]. The results were 12,090 from WoS (5725) and 6365 from Scopus. We used a long time frame for this form, from 1974 to 2025 (five decades), and the search returned 11,984 total results across both databases. The year 1974 was selected as the temporal starting point because pre-1974 records were sparse and inconsistent, with only 27 articles and 90 total citations across both databases identified between 1901 and 1973. Additionally, 1974 marks the onset of consistent annual indexing in WoS and Scopus and coincides with heightened international environmental awareness following the 1972 Stockholm Conference and the launch of Landsat-1, the first satellite dedicated to Earth surface monitoring [25,26,27]. Data refinement was limited to “journal articles” in both databases to maintain comparability of citation metrics across the corpus, consistent with standard bibliometric practice [28], yielding 9333 articles from WoS (4494) and Scopus (4839).
Furthermore, the study was restricted to English-only publications (8873 articles across both databases) to ensure linguistic consistency in keyword analysis and co-citation mapping [29]. Finally, WoS was used as the primary data source, with Scopus as the secondary source, and duplicate articles were removed from both databases after all refinements; 5091 articles were included in the analysis.

2.2. Data Processing and Analysis

A wide array of advanced tools and software applications is available for performing bibliometric evaluations, and selecting the right techniques involves important methodological considerations [28]. For harmonization of the WoS and Scopus databases, duplicate records were identified and removed using RStudio (version 4.5.2 (31 October 2025)). Merging and deduplication were performed using the convert2df() and mergeDbSources() functions as follows:
[web_data<-convert2df(“WOS.txt”)
Scopus_data<-convert2df(“Scopus.csv”,dbsource=“scopus”,format = “csv”)
combined<-mergeDbSources(web_data,Scopus_data,remove.duplicated = T)
write.csv(combined,”combined.csv”)],
which detects duplicates primarily through DOI matching, with title-based fuzzy matching applied to records lacking a DOI [28]. After deduplication, the refined database was saved as a CSV file and cross-checked for accuracy [28]. Figure 1 PRISMA-compliant record-flow diagram clearly tracing record counts from initial database retrieval through each refinement and deduplication step to the final analytical crops.
Among the most frequently used programs for this analysis were Biblioshiny (the graphical interface for the R package bibliometrix), VOSviewer, and MS Excel [28,30]. The descriptive statistics, co-citation networks, bibliometric coupling, co-authorship relations, co-occurrence network, thematic mapping, and science mapping were conducted using these tools and software to address research trends and future direction in deforestation [30].

3. Results

3.1. Evolution and Trajectory of Research Articles on Deforestation

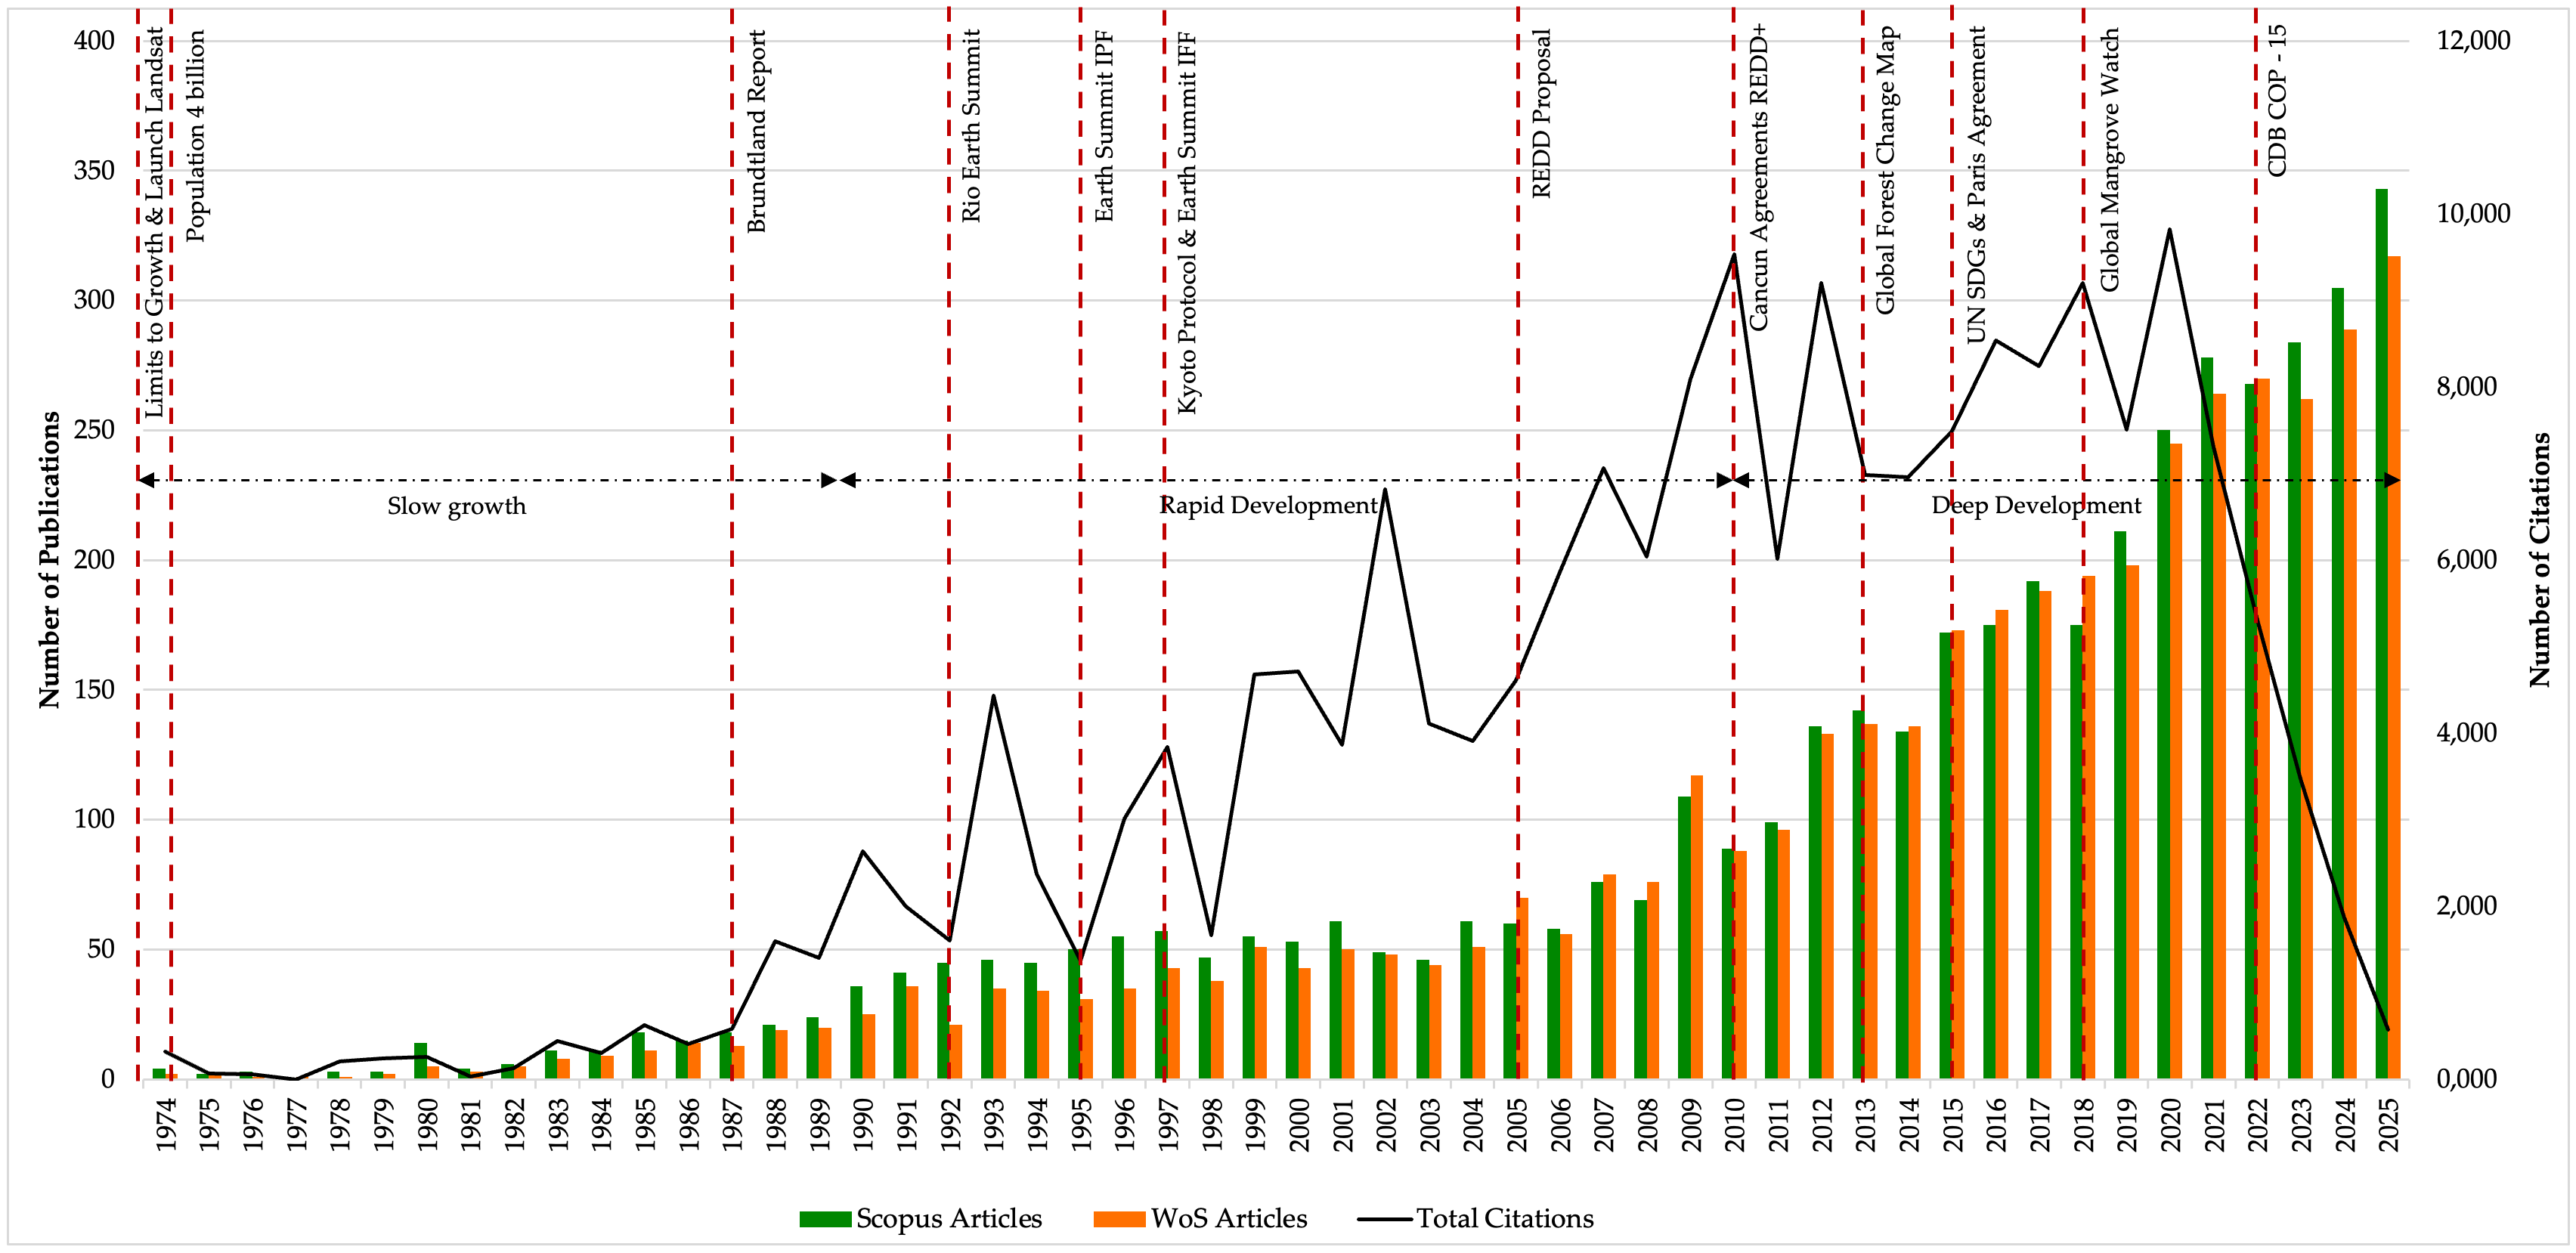
The annual number of articles and total citations effectively traces the temporal trends and developmental trajectory of a research field [31]. Based on the annual publication volume, total citations, and the slopes of the fitted growth models shown in Figure 2, the evolution of this research can be segmented into three distinct stages. Initially slow growth (1974–1990) stage: Publications remained minimal in both WoS and Scopus, with fewer than 50 articles per year, reflecting the early emergence of deforestation as a topic following key milestones such as the Stockholm Conference (1972) and the Brundtland Report (1987). Rapid development (1991–2010) with an accelerating output stage: A marked acceleration in publication output is evident, coinciding with major policy events, including the Kyoto protocol, REDD+ framework negotiations, and Rio+20. Annual output began exceeding 100 publications. The deep development (2011–2025) features an exponential growth stage: The most dramatic growth phase, with annual publication surpassing 300–350 articles by 2024 to 2025, driven by SGD adoption (2015), the Paris Agreement (2015), the Glasgow Climate Pact (COP26, 2021), and CBAM (2023) [32]. Most articles were published in 2025 in both Scopus and WoS, with the highest individual publication count recorded in Scopus. Total annual citations peaked in 2020 (nearly 10,000) and 2010, respectively, and fluctuated irregularly throughout the study period, often linked to major global events, as shown in Figure 2. However, the decline in total citations from 2021 to 2025 is an artifact caused by indexing delays in both databases, as publications have not yet been fully indexed.
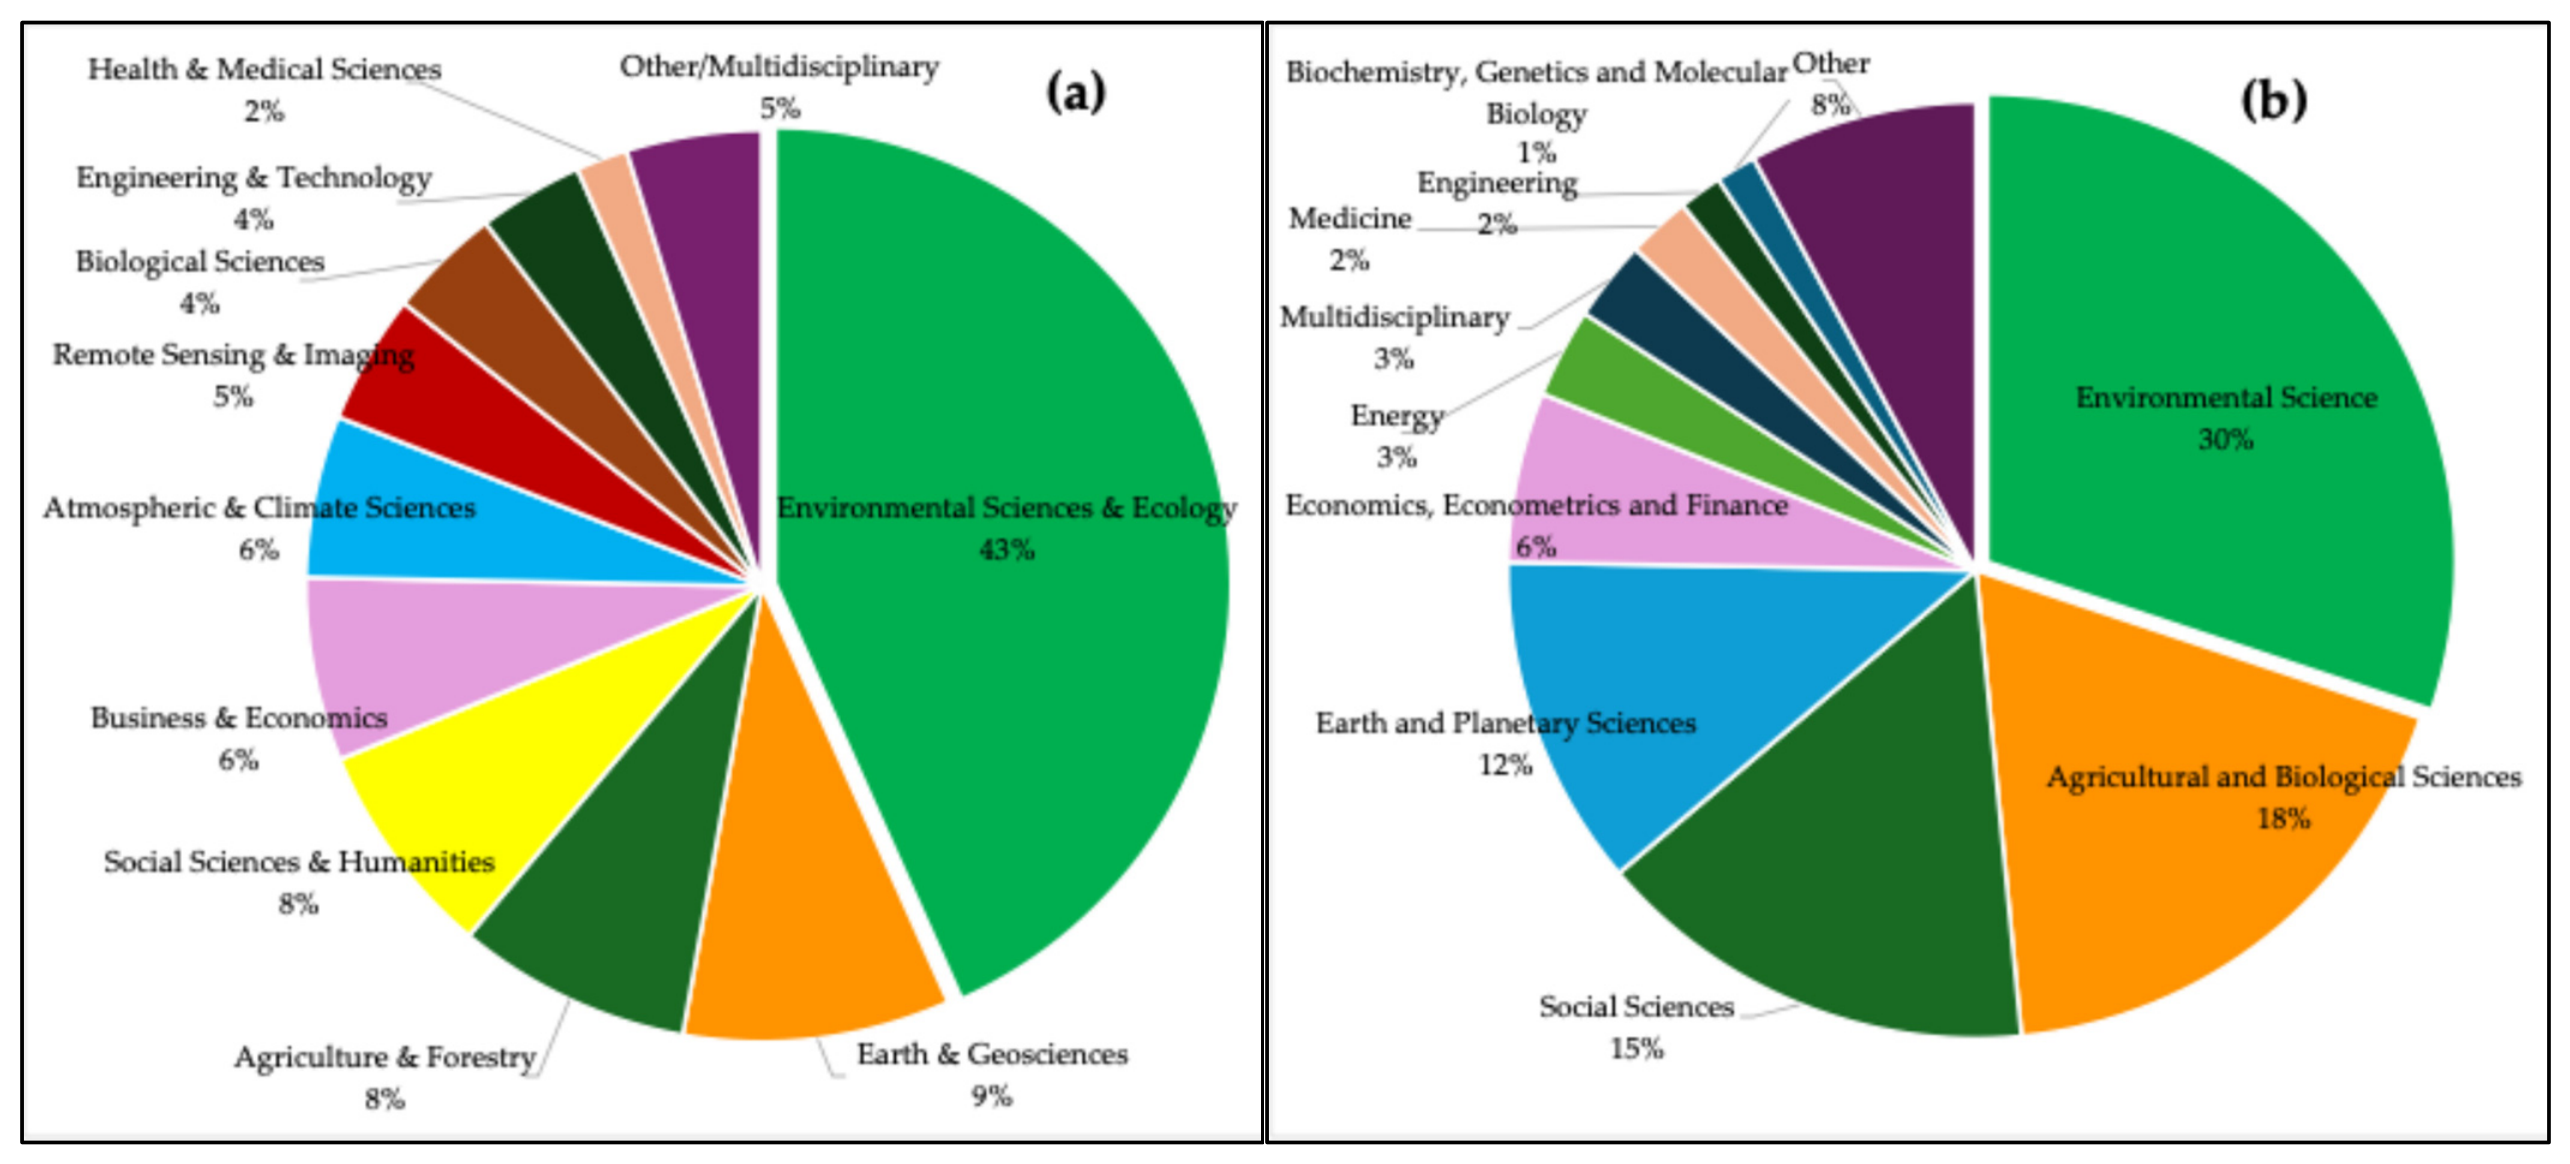
All articles in WoS and Scopus are categorized into 11 subject areas. In both databases, over 30% of articles are related to environmental science. The second priority is agriculture, with 8% in WoS and 18.4% in Scopus, respectively; the third is the social sciences and humanities, with over 8% in both databases. Deforestation impacts critical areas such as health and medicine, engineering, energy, biological sciences, and remote-sensing technology. Figure 3 shows the percentage distribution of subject areas in WOS and Scopus, with environmental science dominating, followed by Agriculture and Social Sciences, while the remaining disciplines, including health, engineering, and remote sensing, reflect the Field’s multidisciplinary impact.
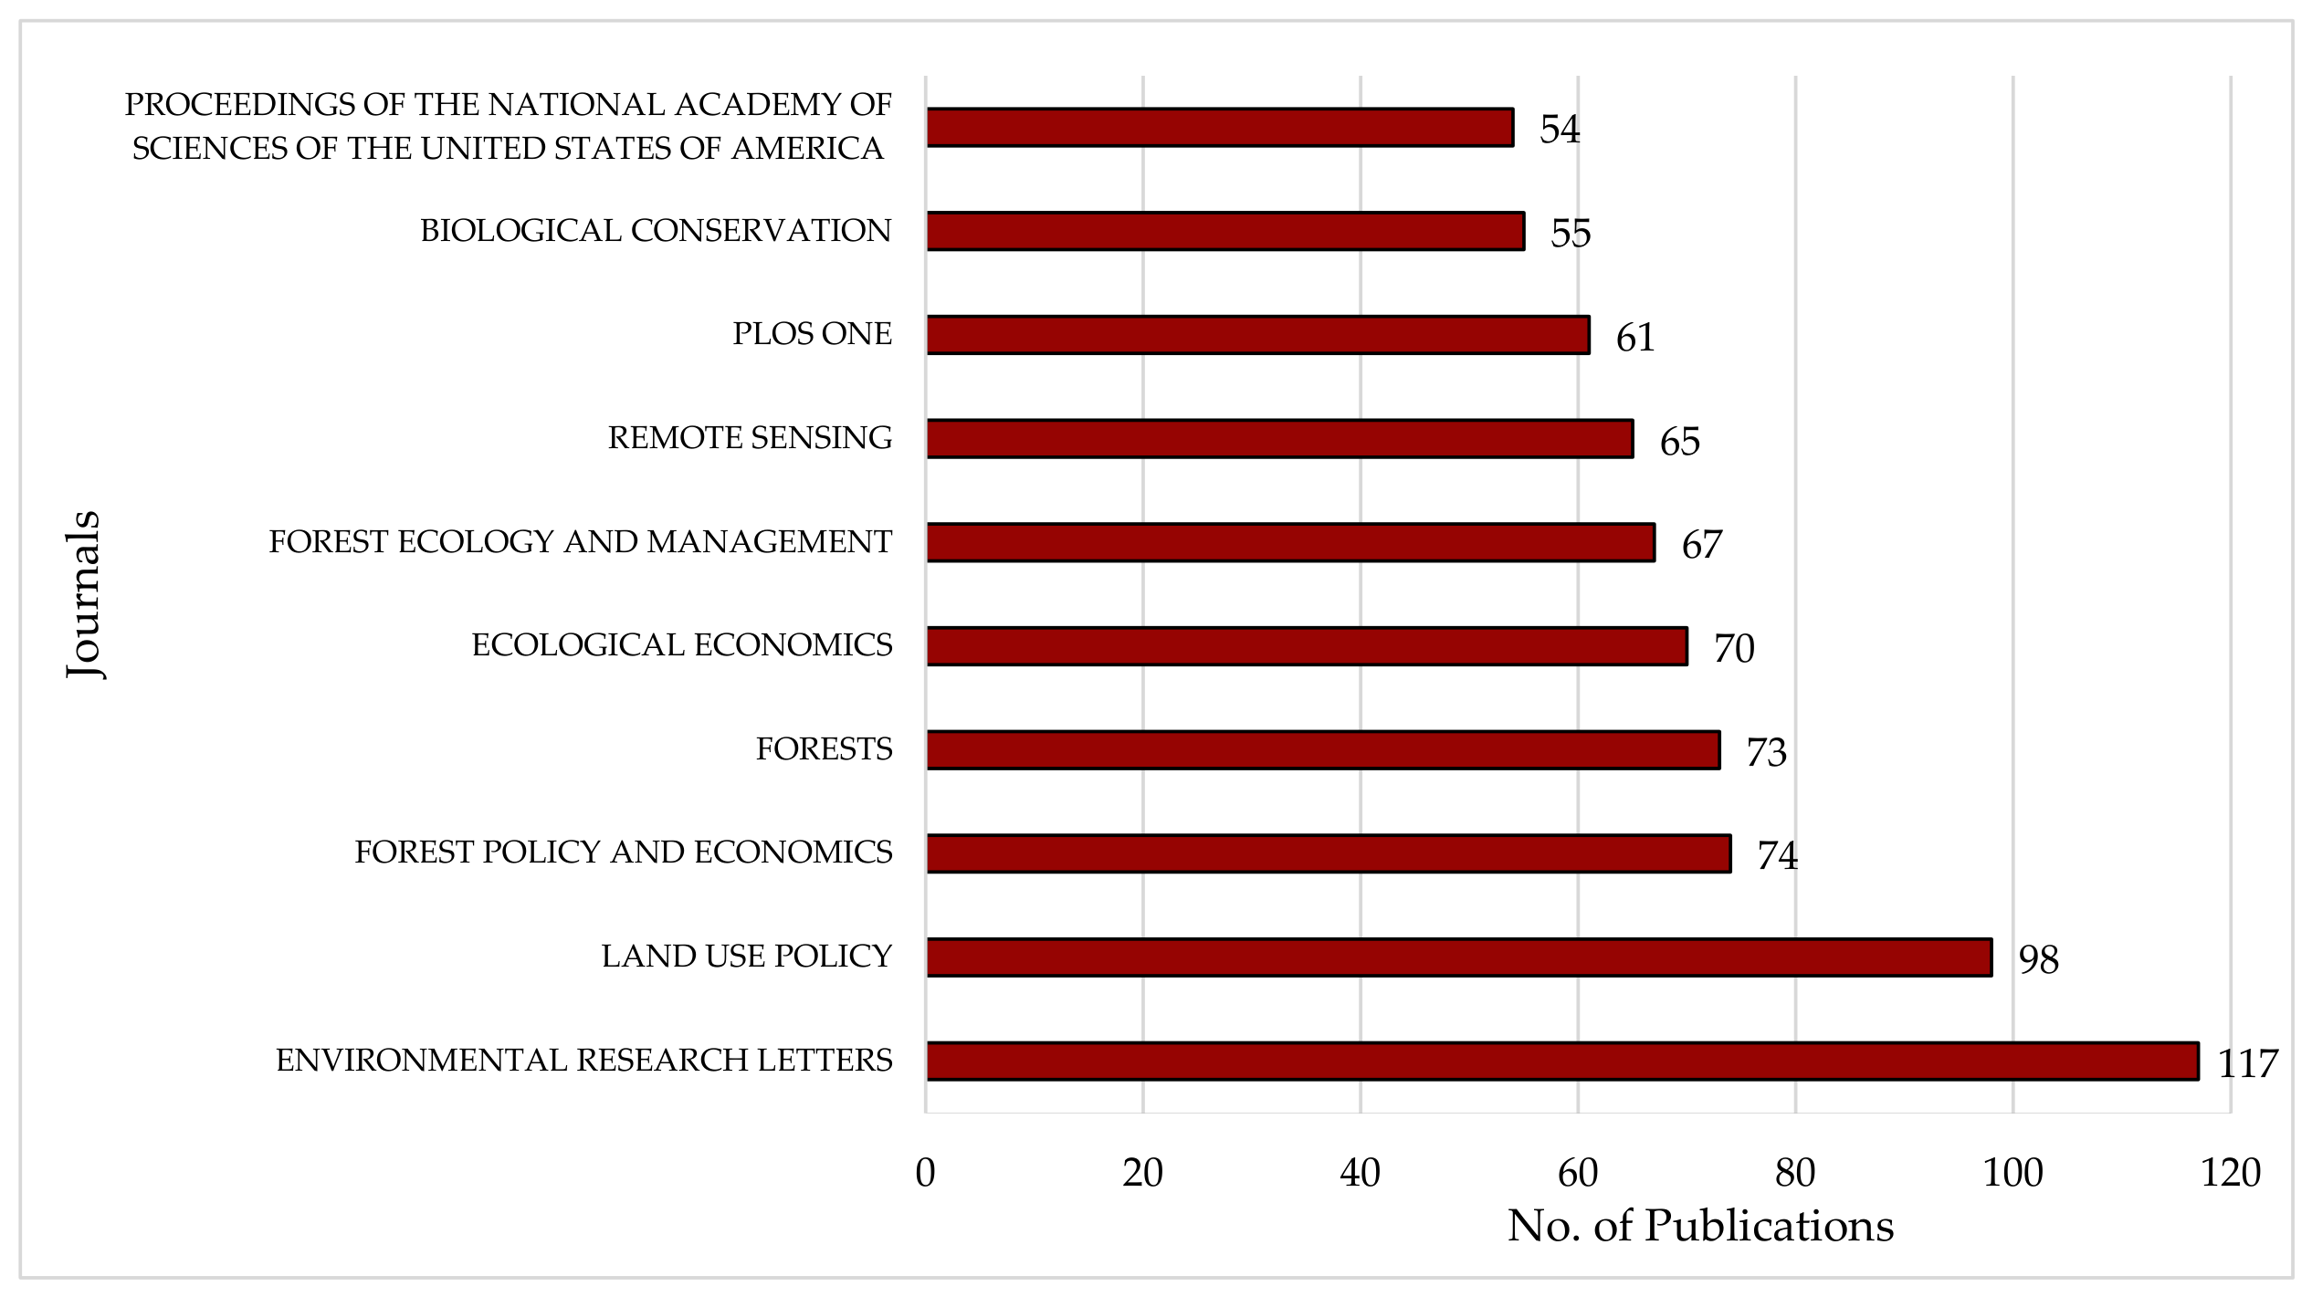
Across the various publication outlets, the analysis in Figure 4 identifies the leading journal with the most articles on deforestation. The journal Environmental Research Letters is the best publisher, with 117 publications, and is an open-access, interdisciplinary journal covering environmental policy, land-use change, and climate forest–interactions. Secondly, the journal Land Use Policy published 98 articles on deforestation, underscoring the strong policy–governance dimension of deforestation research. The journals Forest Policy and Economics, Forests, and Ecological Economics have published over 70 articles. The leading publishers in deforestation research include five from Elsevier; two from MDPI; and three from POLS, the National Academy of Sciences (USA), and IOP Publishing, reflecting the field’s multidisciplinary nature, with Elsevier and MDPI making particularly high-impact contributions over the long term.

3.2. Keyword Analysis on Deforestation

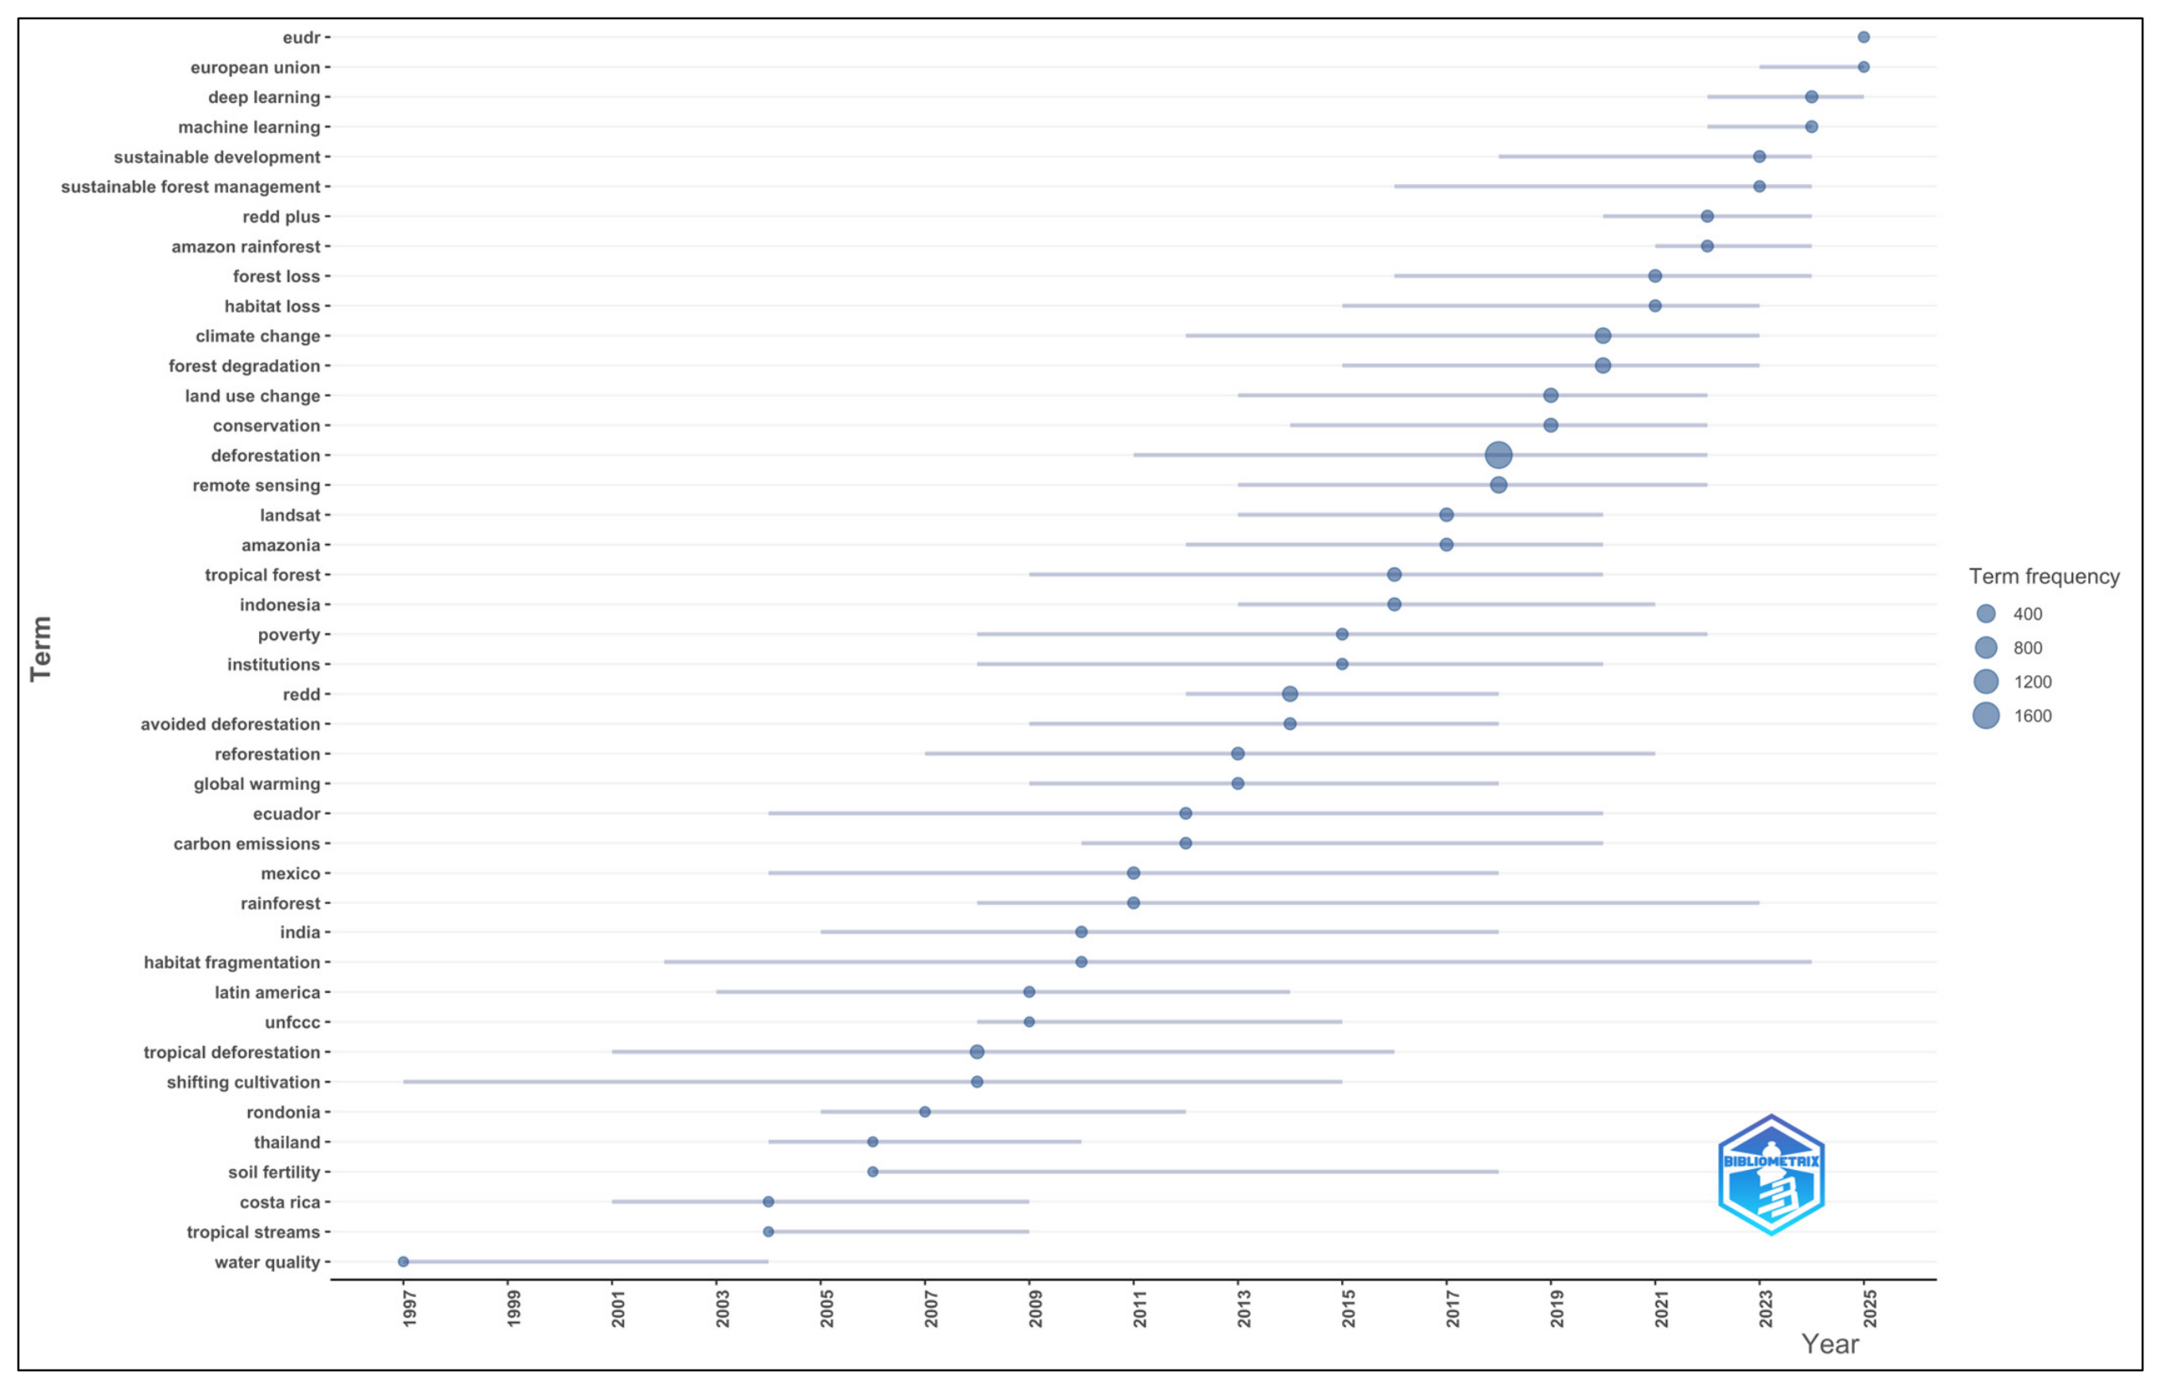
The keywords serve as signposts, offering a quick summary to direct the information within the core [32]. Furthermore, keyword analysis can reveal research hotspots and future trends in deforestation research. In this study, based on the author’s keywords, Figure 5 illustrates the trending topics on deforestation. The result shows that the core themes, with frequencies of “deforestation (1678), remote sensing (250), climate change (194), and land use change (119)”, confirm that monitoring, climate impacts, and land-use dynamics are central, with Landsat underscoring satellite-based observation as the field’s backbone. REDD+, UNFCCC, and sustainable forest management dominate, reflecting the field’s policy orientation, while avoided deforestation underscores engagement with carbon-offset and climate frameworks. Amazonia, Indonesia, and Latin America dominate, confirming the Amazon and Southeast Asia as the most-studied frontiers, while Costa Rica, Mexico, India, and Thailand indicate wider but uneven geographic coverage [33,34]. As emerging terms, machine learning, deep learning, and EUDR reflect recent methodological and policy shifts, while the absence of Africa, Congo Basin, biodiversity, and restoration signals persistent gaps. Figure 6 provides a wide range of relationships of these keywords.
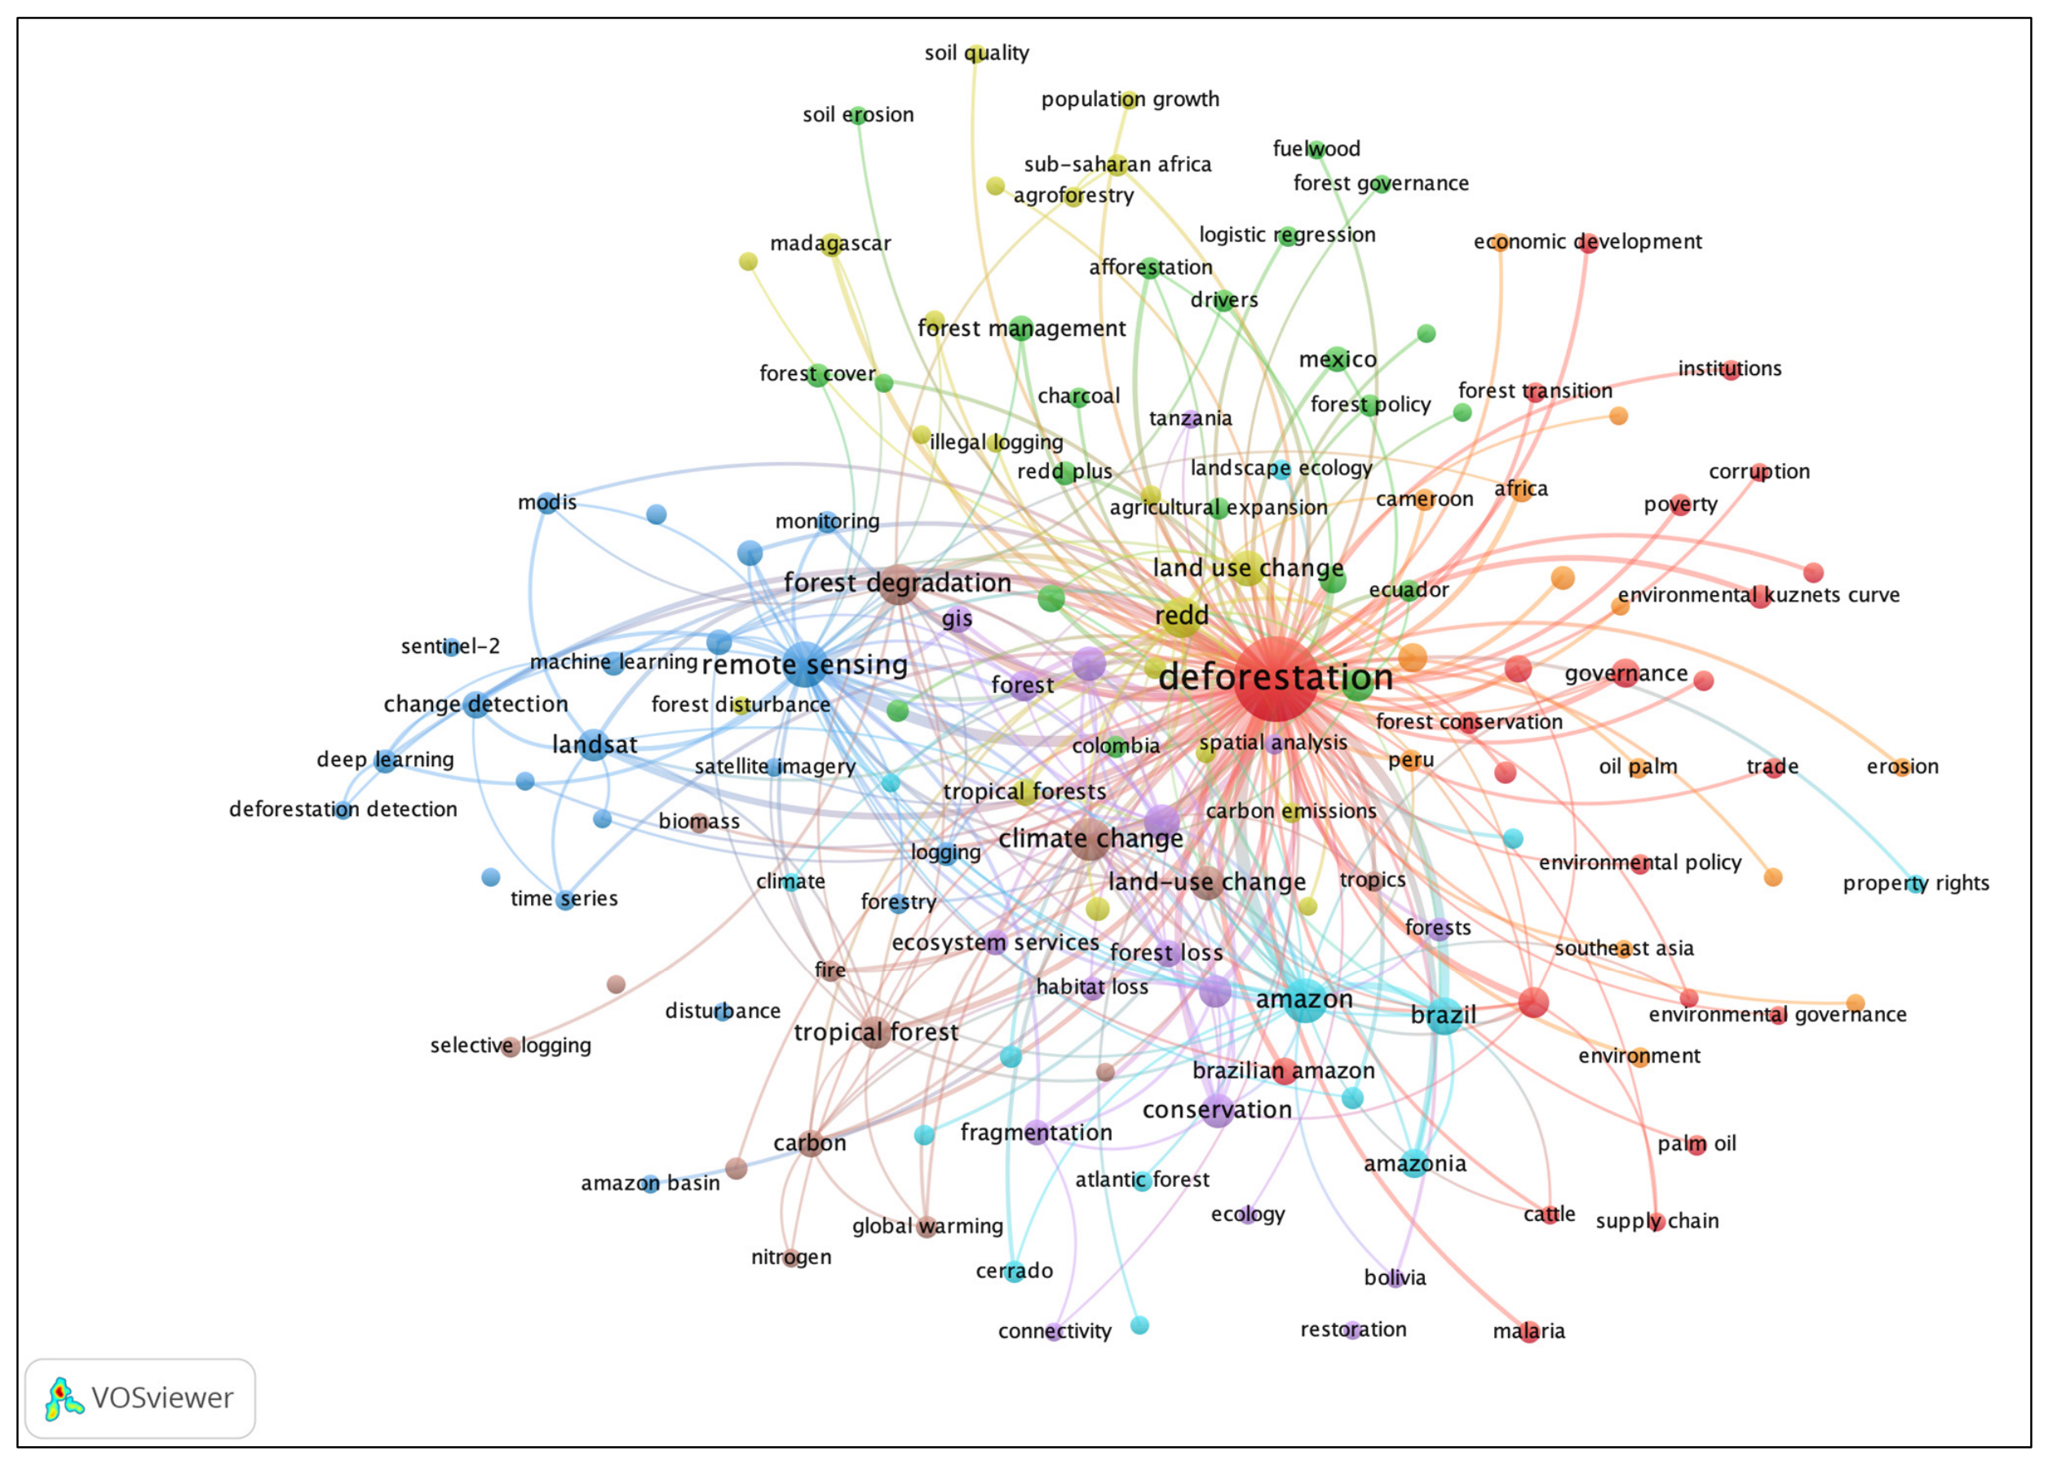
Figure 6 presents a co-occurrence analysis of author keywords in deforestation from 1974 to 2025. Out of the 8741 keywords, 145 met the minimum occurrence threshold of 15. The analysis yielded a total link strength of 6859 and identified 8 clusters. The largest cluster (red) centers on “Deforestation”, and its 23 associated items linking it to themes such as “agriculture”, “Brazilian Amazon”, and “governance”. The second-largest cluster (blue) with 22 items, focuses on “remote sensing”, highlighting the methodological tools for detecting and quantifying deforestation. A third significant cluster (brown) addresses “climate change” and its 21 related items, emphasizing the consequences of forest loss. An additional cluster (yellow) is dedicated to “REDD+” and related environmental conservation strategies.
The intellectual architecture of deforestation research is organized around diagnosing drivers, notably agricultural expansion, logging, and cattle ranching, and mapping locations, with the Amazon and Brazil as primary case studies, and remote sensing as the core methodology. While the climate–carbon dimension is well-established, it remains peripheral to the central focus on drivers and monitoring. The governance cluster, centered on REDD+ and ecosystem services, signals increasing attention paid to institutional failures, such as corruption and illegal logging. When compared with the thematic evolution (Figure 5), the keywords’ occurrence network (Figure 6) confirms that contemporary deforestation research is not merely diagnostic but also generative: it actively develops monitoring technologies and policy frameworks to address climate and ecological impact.

3.3. The Analysis of the Main Researcher

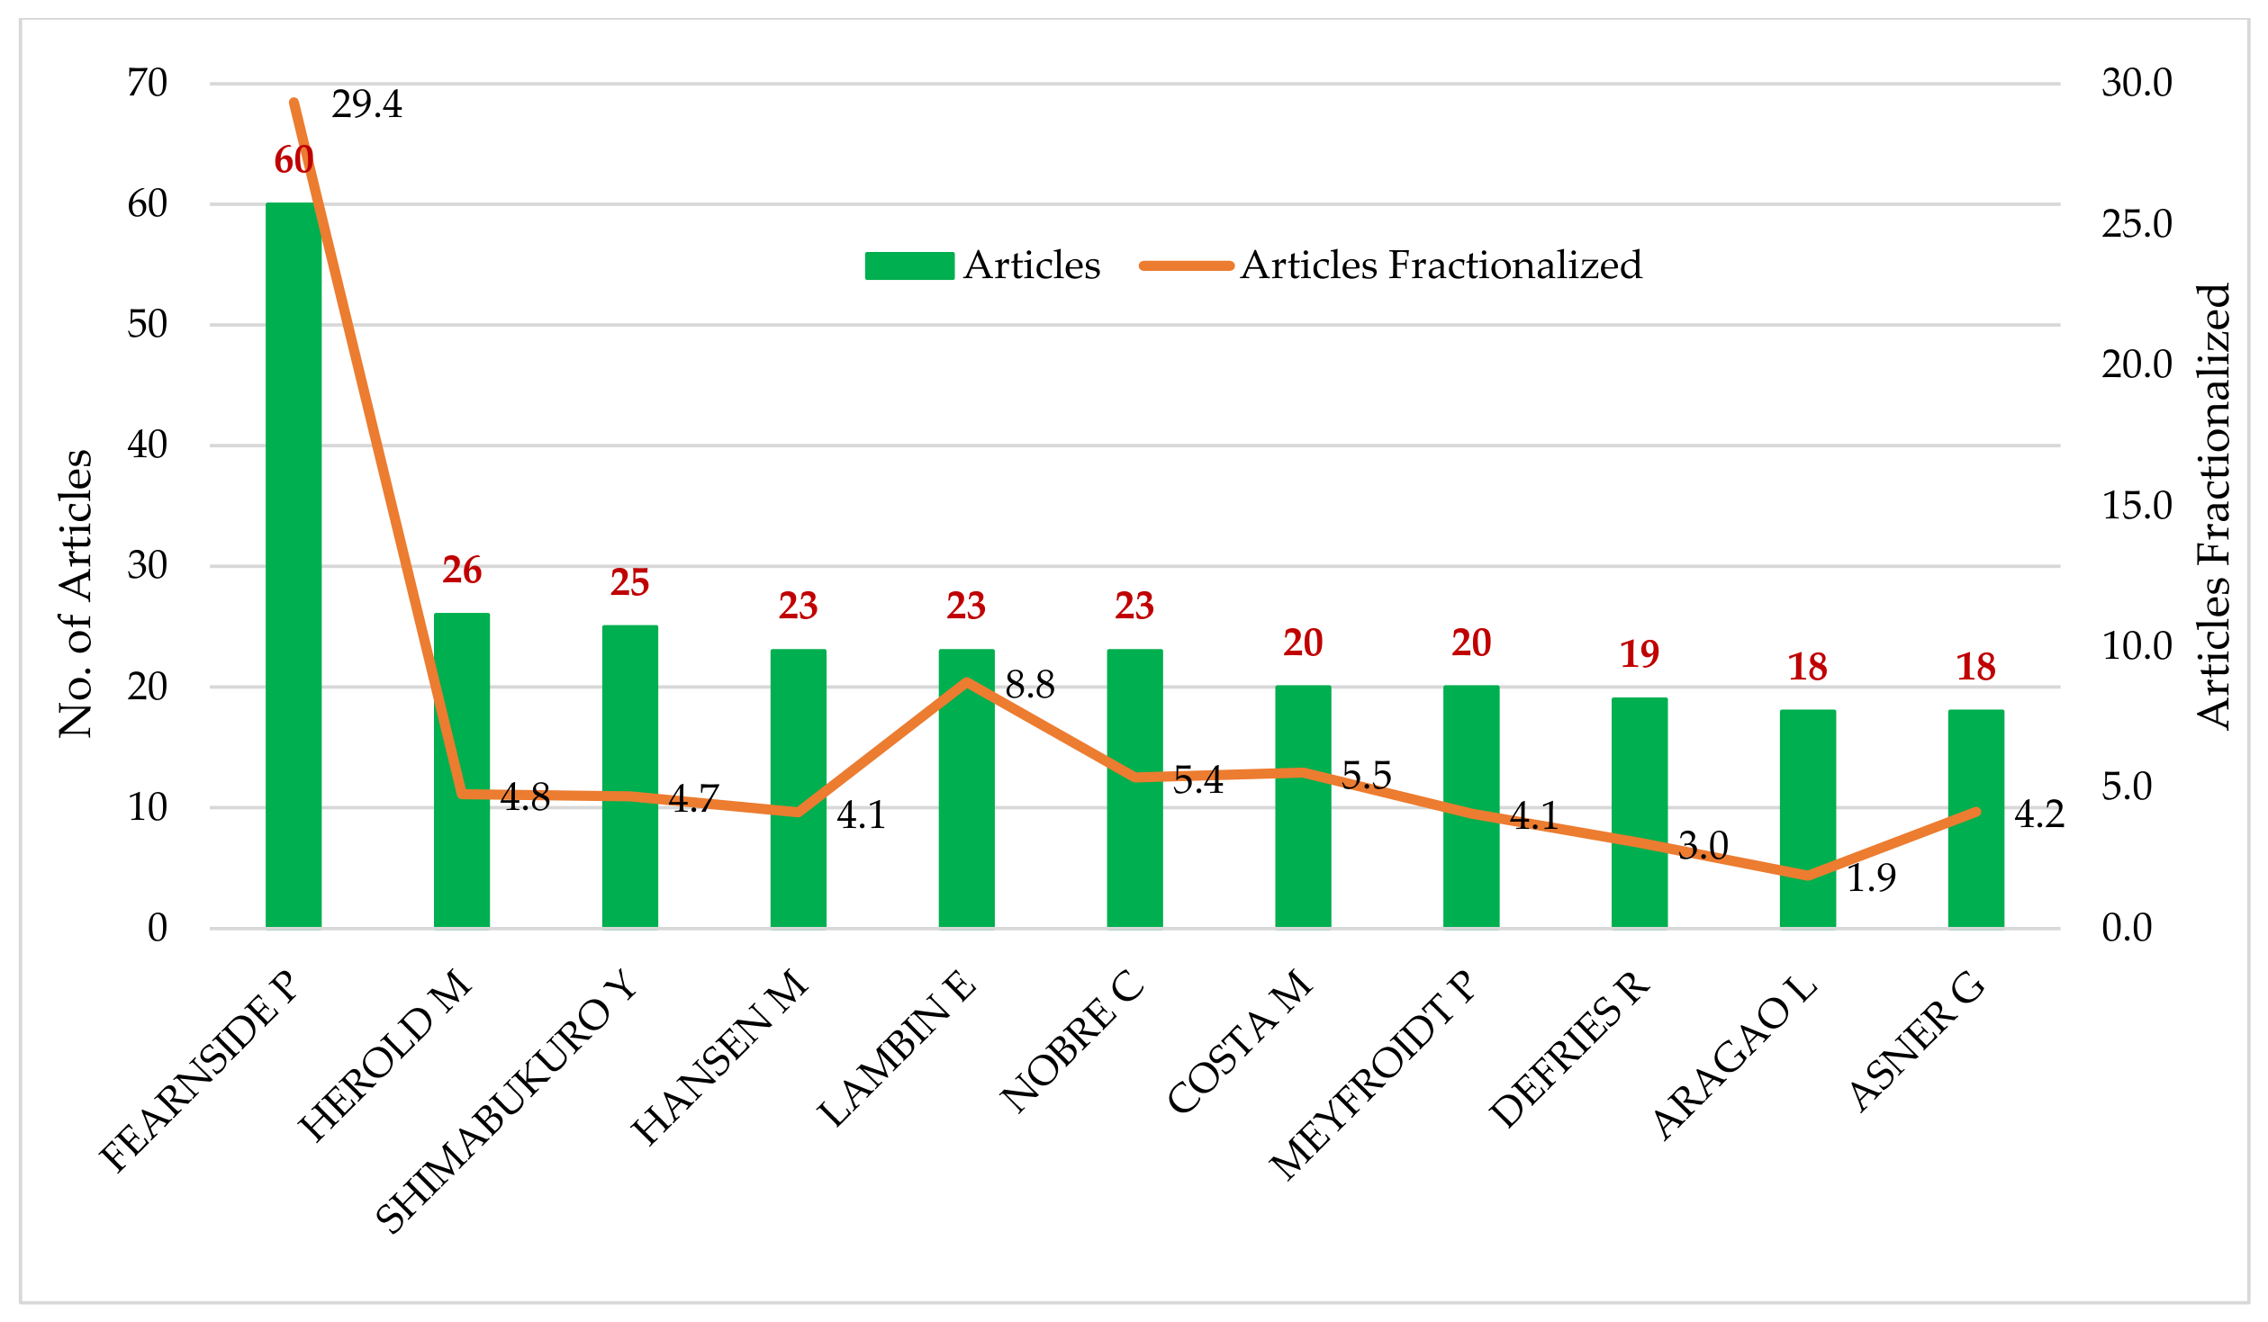
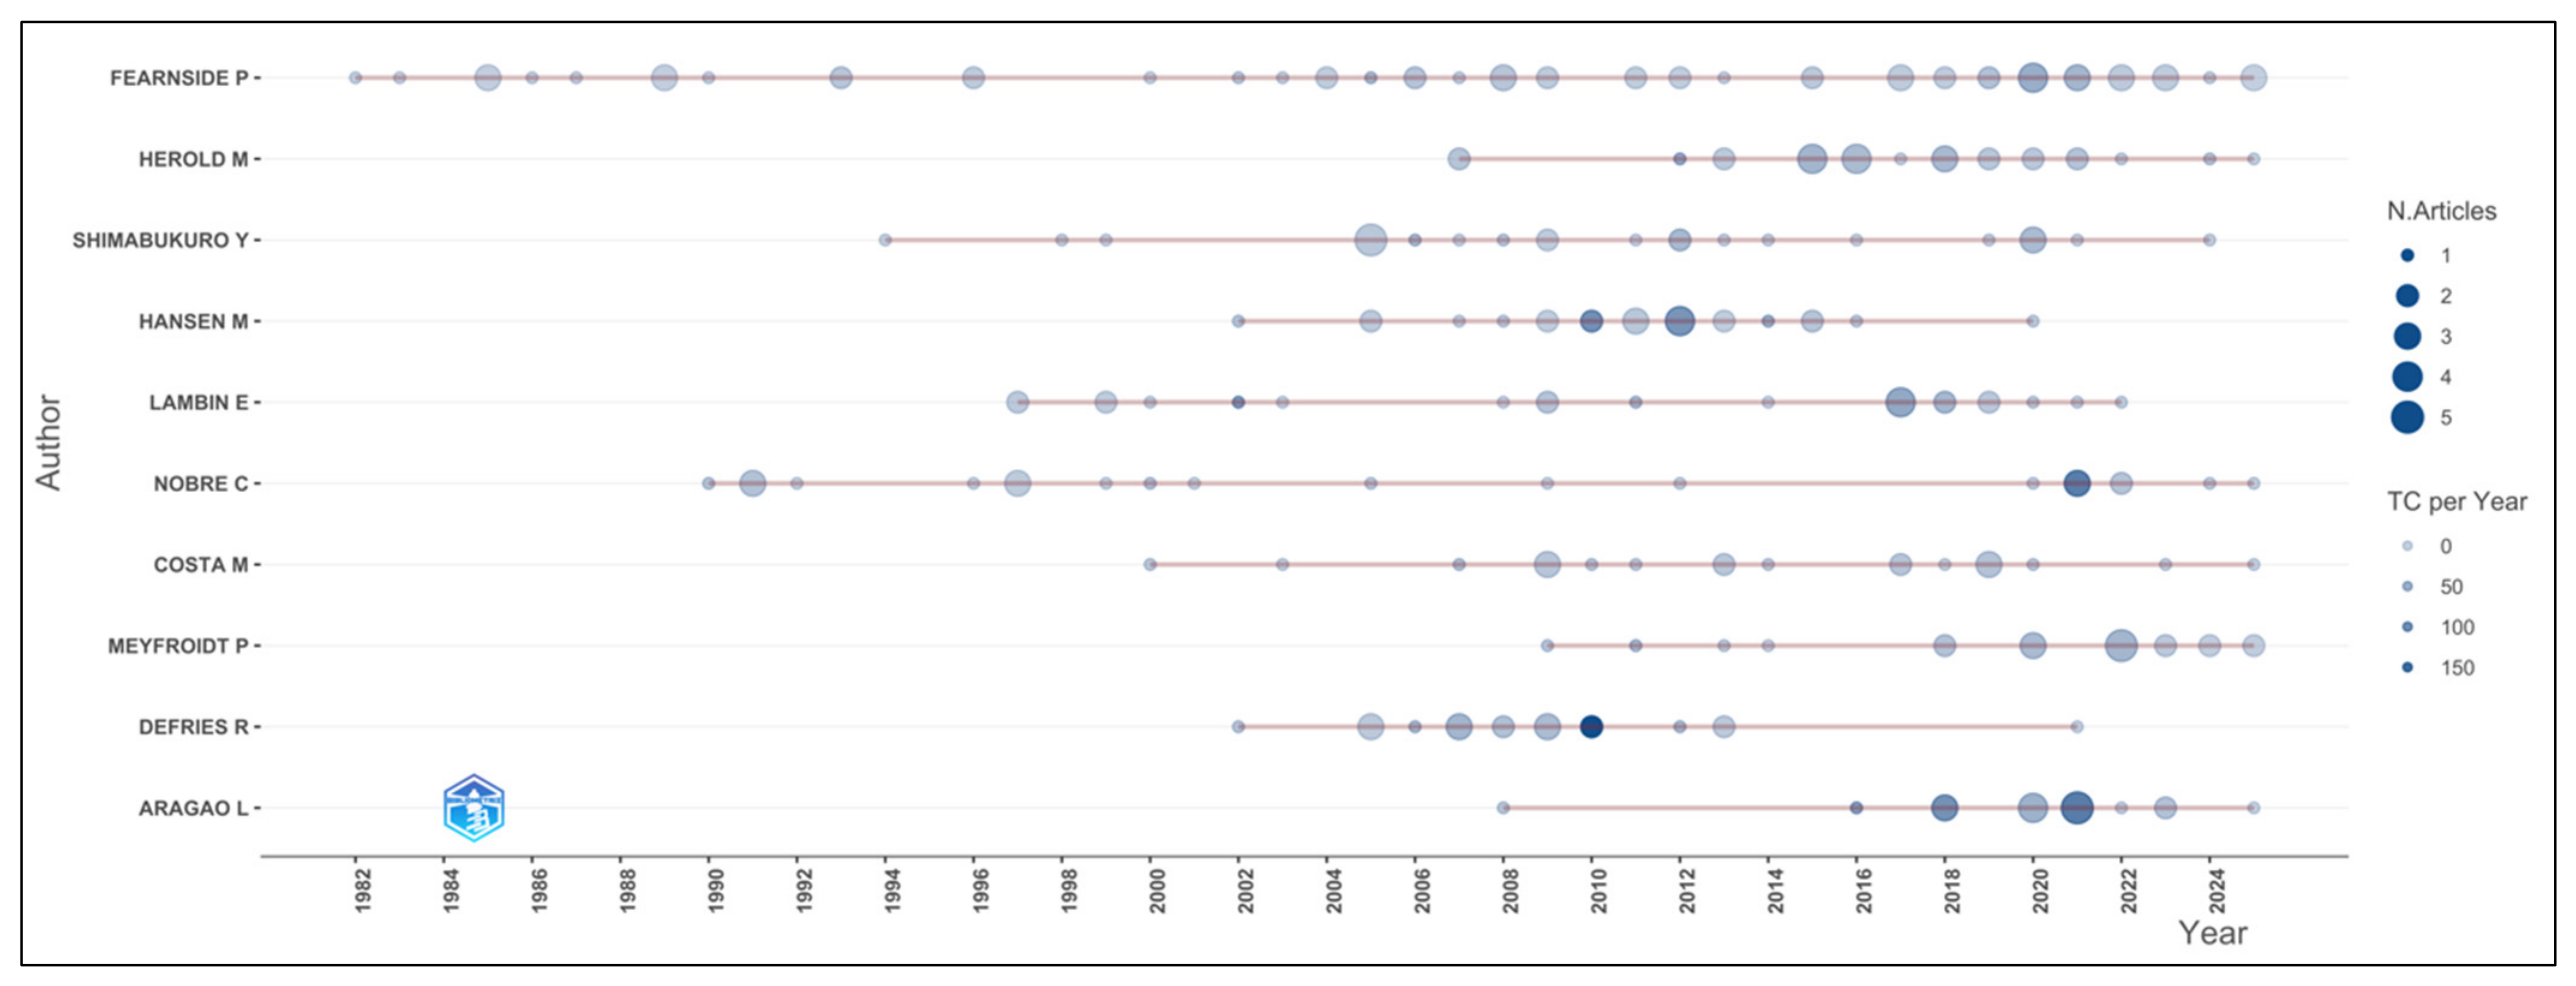
In the field of deforestation research from 1974 to 2025, 12,865 authors have been identified; among them, 9655 published one article, 2373 published 2–3 articles, 739 published 4–9 articles, and 95 published 10–24 articles. The top three authors are Fearnside, P.; Herold, M.; and Shimabukuro, Y., and they published 60, 26, and 25 articles, respectively. According to Figure 7, Fearnside, P., has a long publication history on deforestation from 1982 to 2025, spanning 42 years, with his highest annual output in 2020, at about four articles. Further, after 2017, he has consistently published two or more articles per year, except in 2024 (one article), and he is a research professor of ecology in Brazil. Among the top ten researchers, eight published 20 or more articles, and two published 18. In a year, the highest number of publications was done by Aragao, L., in 2021 (five articles), and the highest citation count was achieved by Defries, R., in 2010 (citations: 150). Moreover, among the top ten researchers, five are from Brazil, two are from the USA, two are from Belgium, and one is from The Netherlands.
Figure 8 illustrates the top authors and their article counts, with fractionalization. The authors with the highest fractionalized article counts in deforestation research from 1974 to 2025 are Fearnside, P. (29.4), Lambin, E. (8.8), and Costa, M. (5.5), respectively. It suggests that Fearnside, P., primarily works solo or with small teams, while other researchers in deforestation collaborate in large international teams.

3.4. Institutional Collaboration Analysis on Deforestation

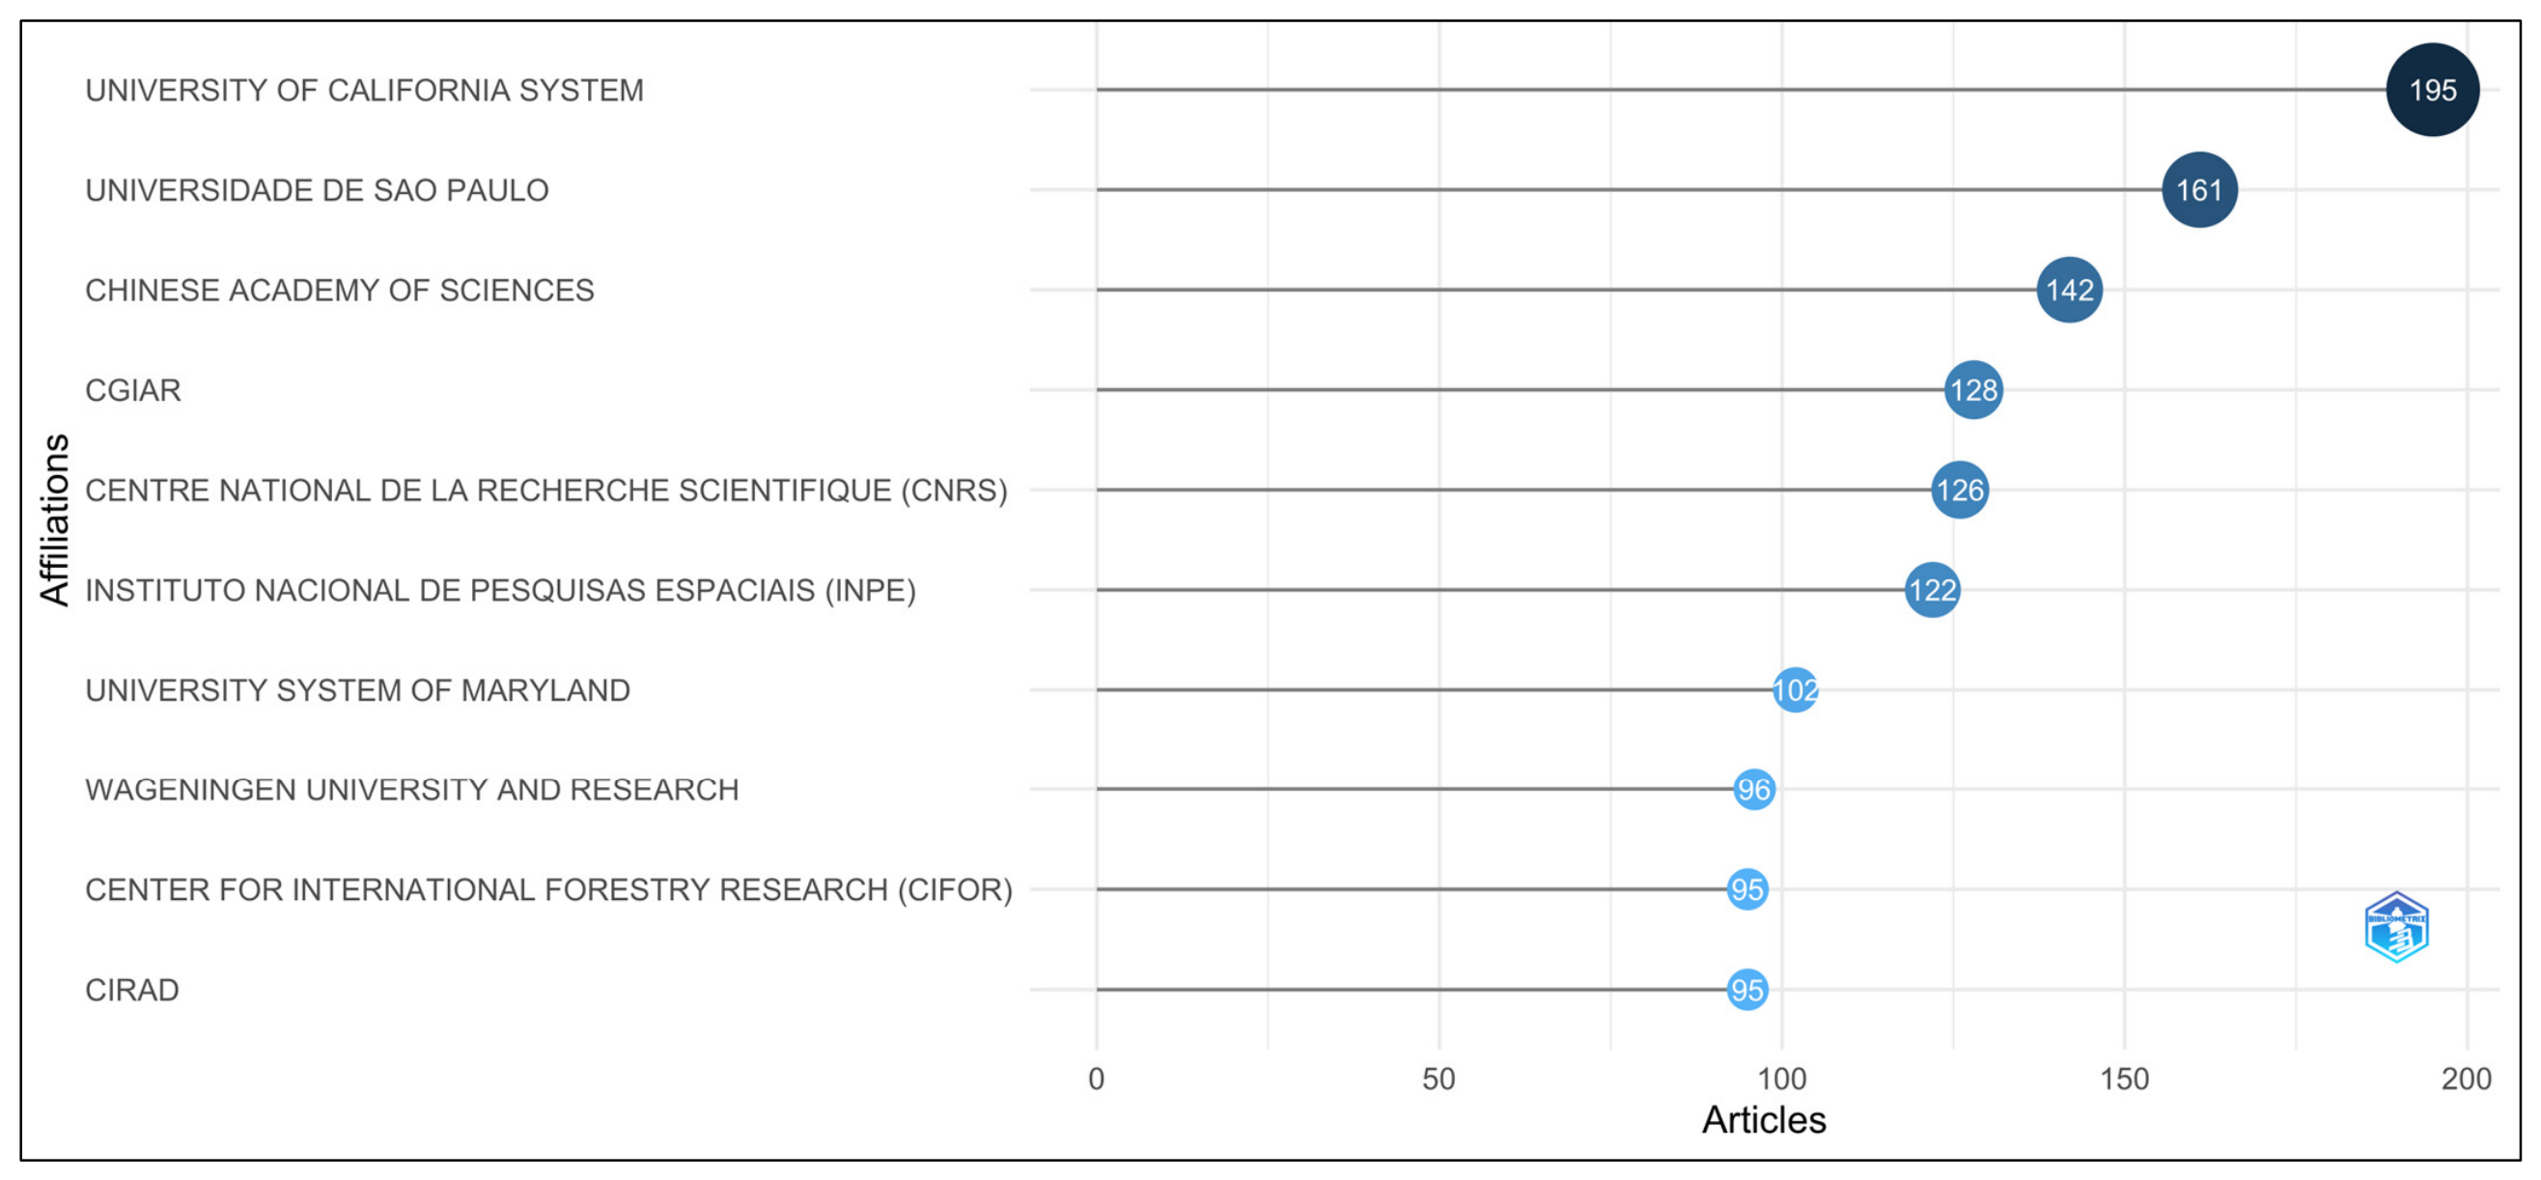
The increasing complexity of scientific problems often outstrips the expertise and resources of individual researchers, necessitating collaboration among research institutes [35]. Analyzing these collaborations identifies leading institutions and provides a roadmap for others to boost their influence by engaging with these key players. Figure 9 illustrates the top 10 institutional affiliations contributing to deforestation research.
The University of California system leads with 195 publications, highlighting the dominance of large multi-campus research systems. This is followed by Universidade de São Paulo (161 publications), underscoring Brazil’s central role in deforestation scholarship, particularly given its geographic and political relevance to the Amazon region. The Chinese Academy of Sciences ranks third (142 publications), reflecting China’s expanding global engagement in environmental and land-use research. International and policy-oriented organizations feature prominently. The CGIAR (Consultative Group on International Agriculture Research) (128 publications) and the Center for International Forestry Research (95 publications) demonstrate the importance of applied research networks in addressing tropical forest governance and land-use transitions. European scientific institutions, such as the Center National de la Recherche Scientifique (126 publications) and Wageningen University and Research (96 publications), further confirm the strong involvement of the Global North in advancing theoretical and methodological approaches to deforestation research.
Brazilian space and environmental monitoring capacity is reflected in the presence of the Instituto Nacional da Pesquisas Espaciais (122 publications), underscoring the critical role of remote sensing and satellite-based forest monitoring in the literature. Similarly, the University System of Maryland (102 publications) underscores the significance of geospatial forest-change research aligned with global forest-monitoring initiatives.
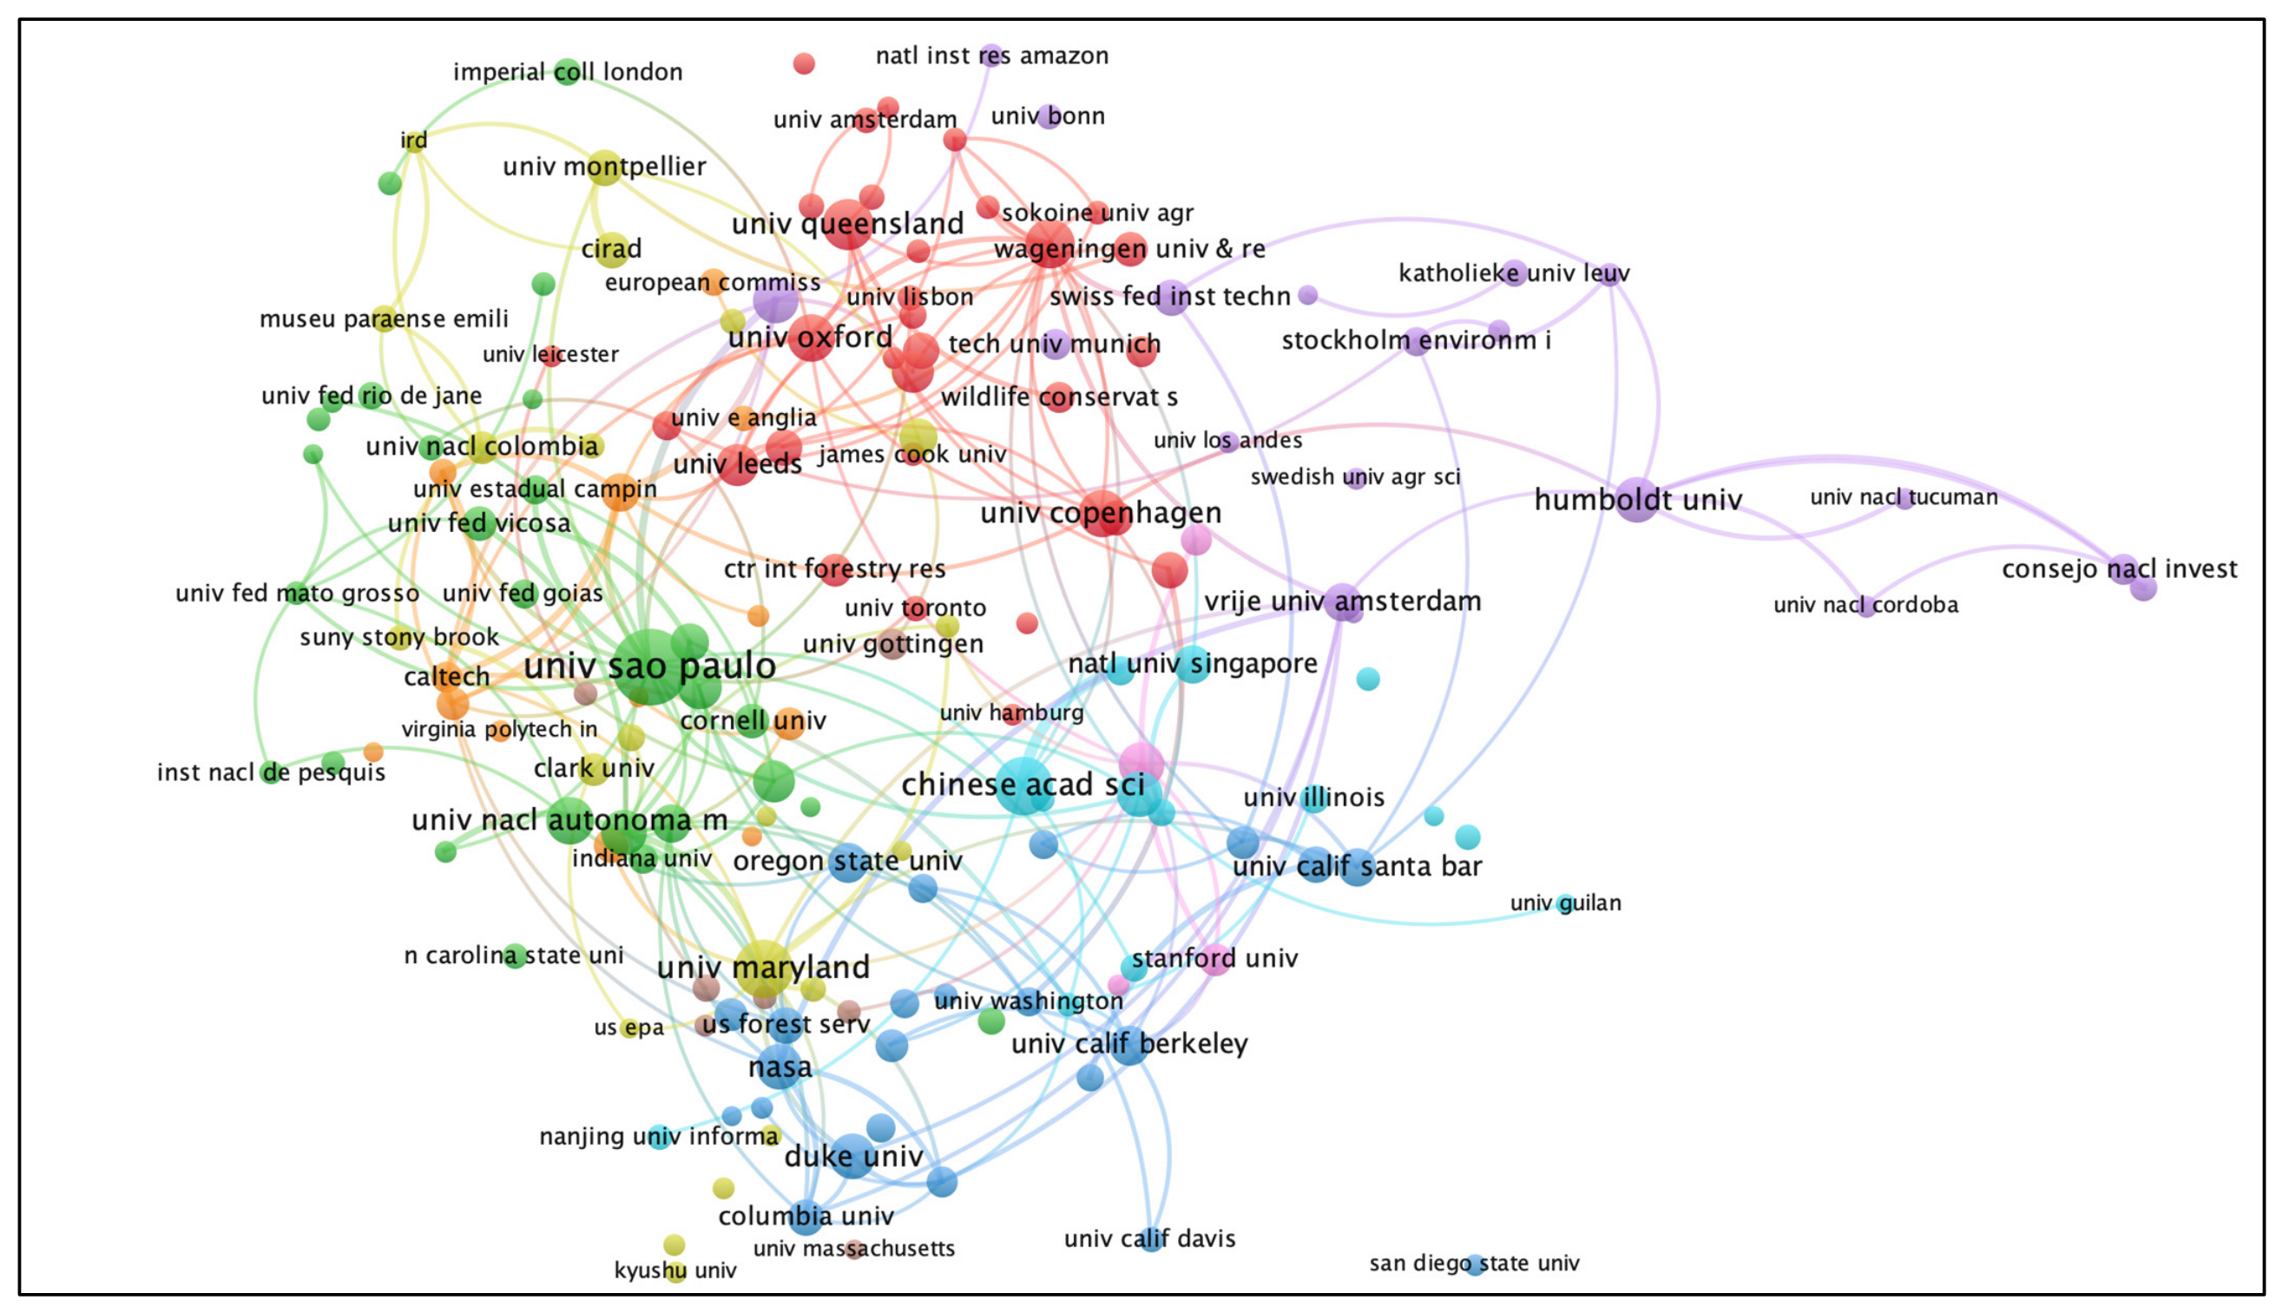
The institutional collaboration network, including co-authorship with the institutional affiliations, is shown in Figure 10. The highest number of co-authored documents (118) is associated with Universidade da São Paulo (green cluster), which is mainly connected to the National Autonomous University of Mexico, Universidade Federal da Viçosa, and Indiana University. The Chinese Academy of Sciences (light blue cluster) and the University of Maryland (yellow cluster) have the second- and third-highest numbers of co-authorships. In the red cluster, the University of Oxford, the University of Queensland, the University of Copenhagen, and Wageningen University and Research are prominently represented. Duke University, Columbia University, and NASA are notable in the blue cluster.
However, the most productive institutions reflect a mix of large multi-campus systems, tropical forest nations, and international research networks. Further, the co-authorship network reveals a hub-and-spoke structure, with Global North institutions as central hubs. A persistent mismatch exists between deforestation pressure (Amazon, Congo, and Mekong) and research capacity. Addressing these inequalities requires targeted capacity-building in underrepresented regions.

3.5. Geographical Hotspots and Institutional International Collaboration Analysis

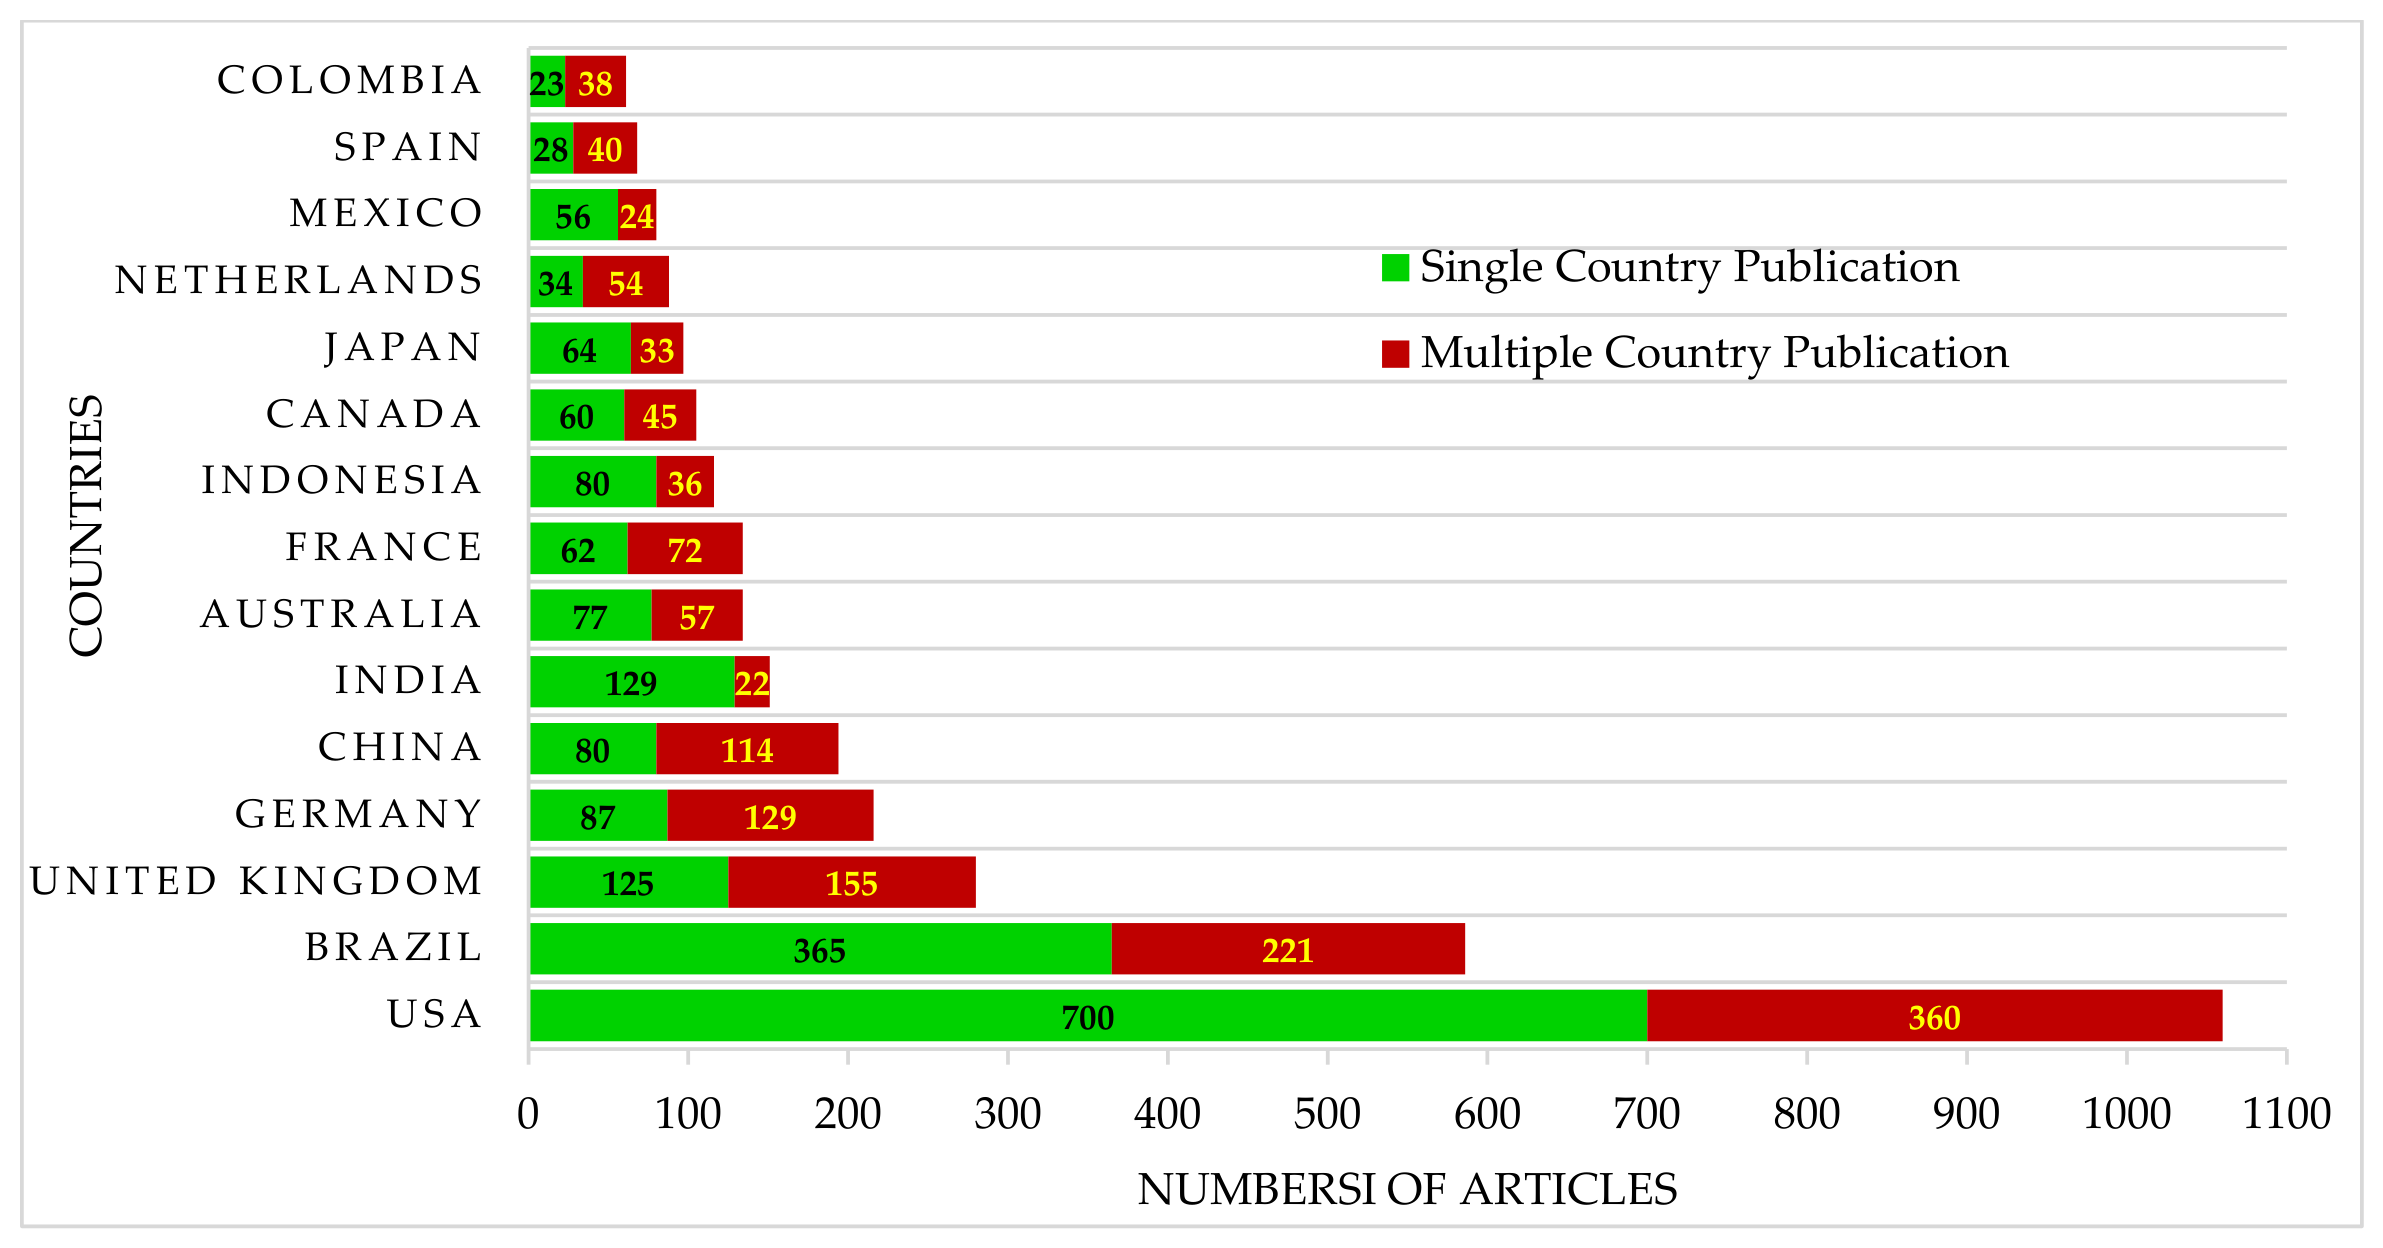
The geographical hotspot distribution of publications on deforestation reveals stark disparities in scholarly output across countries. Figure 11 presents the number of single-country and multiple-country publications on deforestation. The USA leads overall scientific output with 700 single-country and 360 multi-country publications (~1060 total), establishing it as the undisputed global leader in deforestation research. Brazil ranks second with 365 single-country and 221 multi-country publications (~586 total), reflecting its dual role as both a major deforestation hotspot and a significant knowledge producer. The UK (125 single; 155 multi-country) and Germany (97 single; 129 multi-country) show a distinctive pattern where multi-country publications exceed or nearly match single-country outputs.
Brazil and Indonesia (90 single; 35 multi-country) are the only two active frontline nations in deforestation among the top producers, revealing a significant mismatch between where deforestation occurs and where research is produced. India (129 single; 22 multi-country), China (90 single; 114 multi-country), Australia (79 single; 57 multi-country), and France (62 single; 72 multi-country) represent active contributions, though with varying collaboration orientations. However, India, Japan, Canada, and Indonesia show considerably higher single-country than multi-country publications.
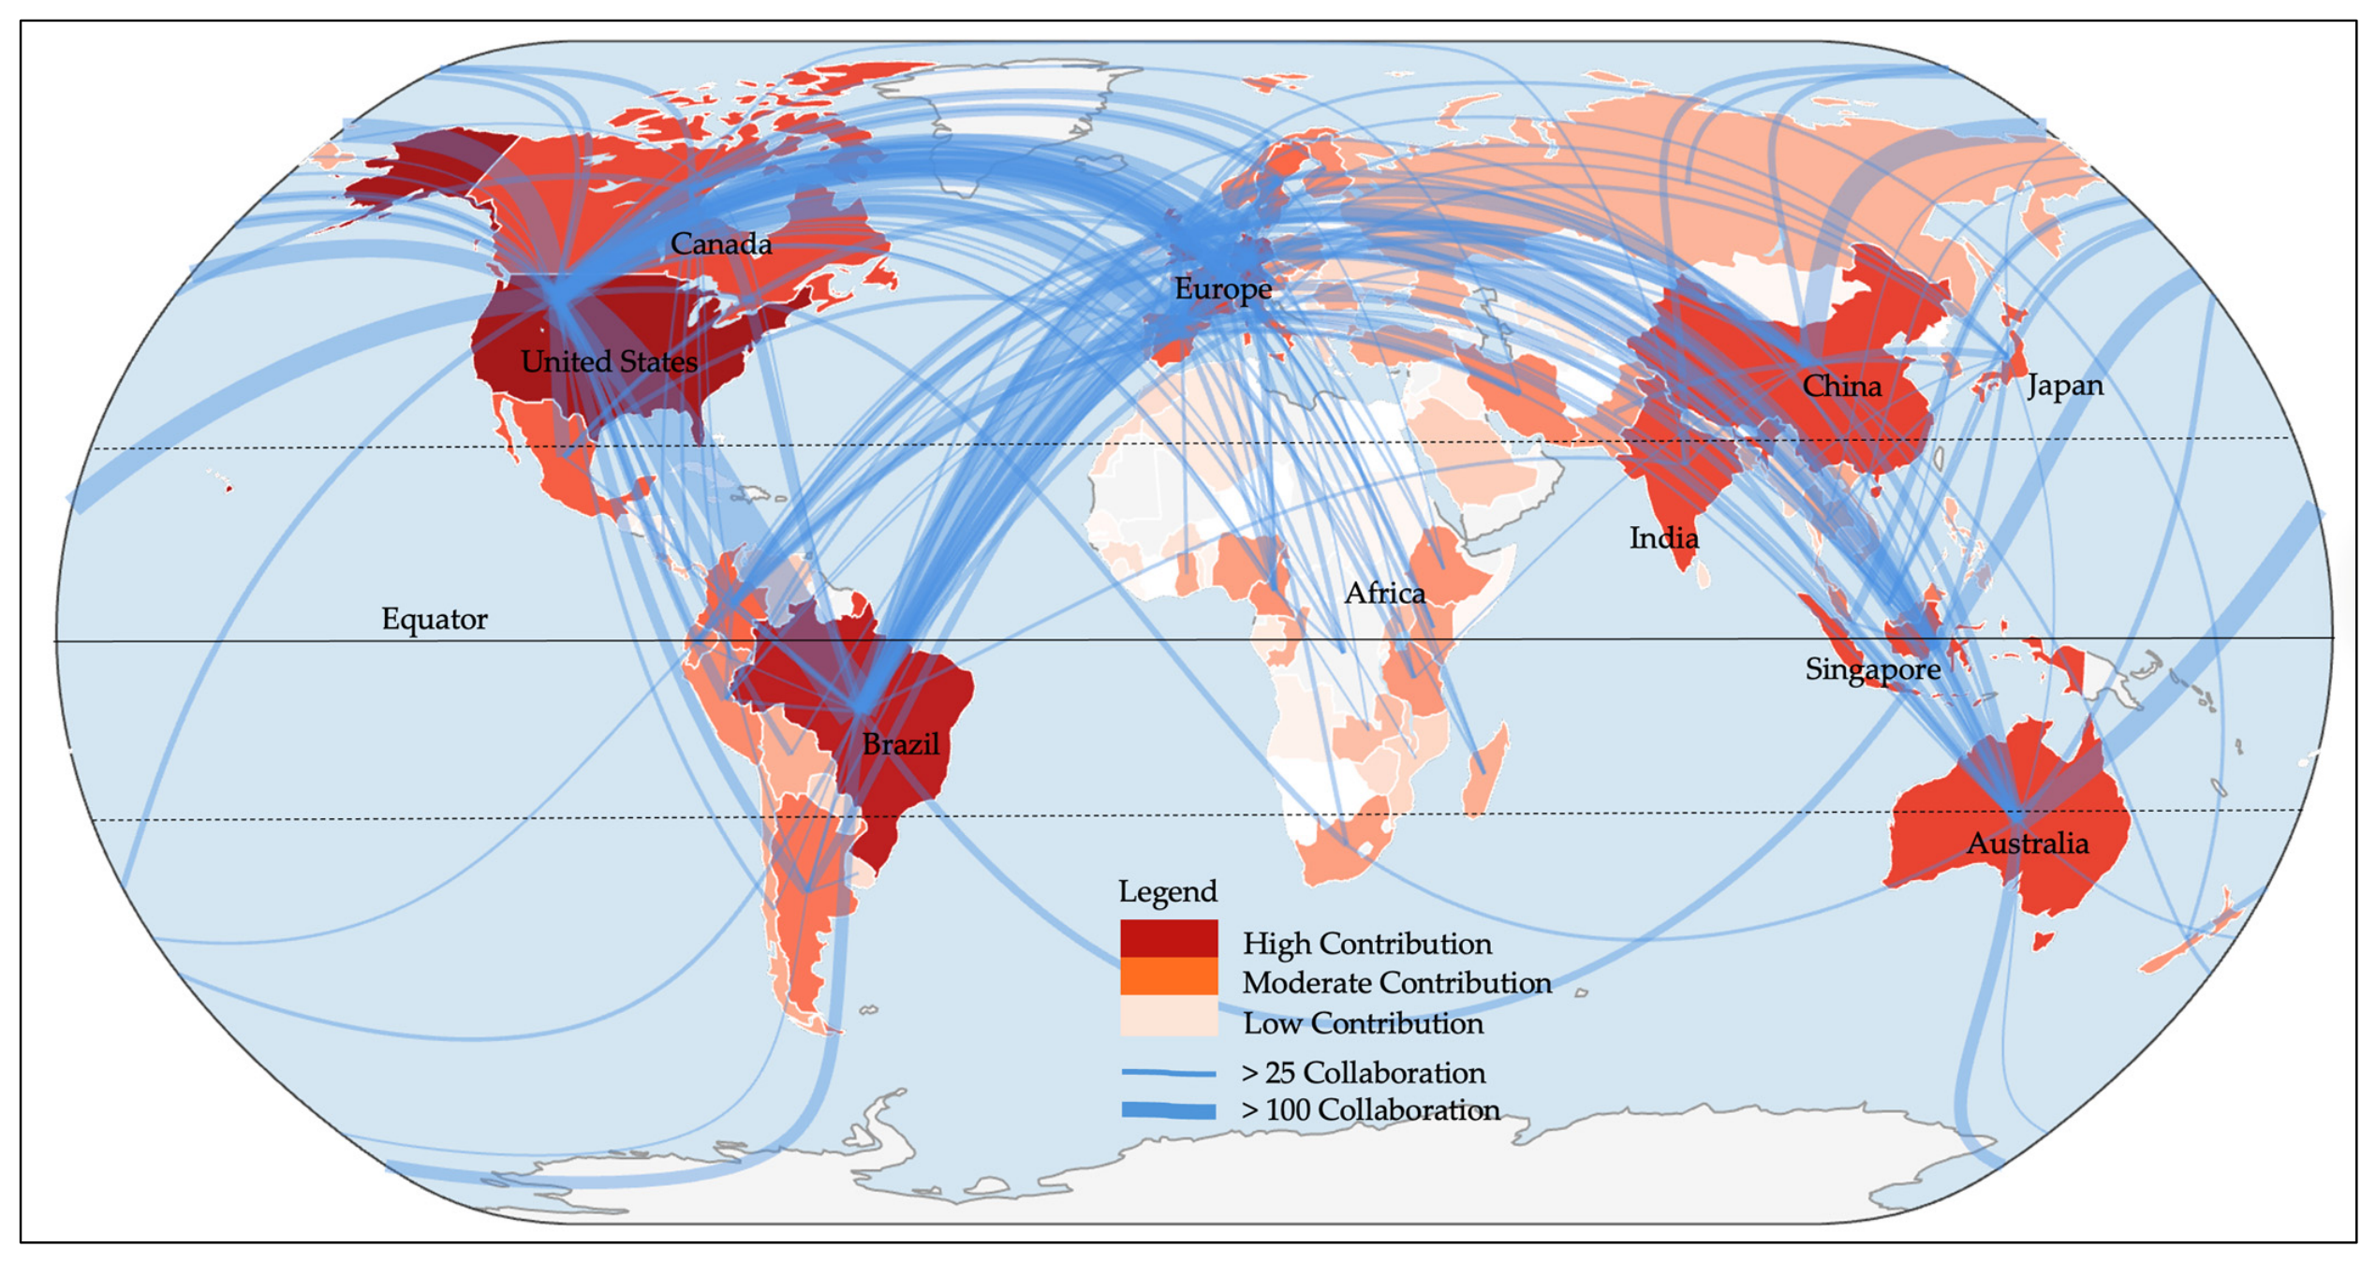
According to Figure 12, the USA and Brazil have a strong relationship, with a frequency of over 250 and a deep red color; the USA and the UK have a frequency of 136; and Brazil and the UK have a frequency of 120. The USA’s main roles in deforestation were with China, Canada, Australia, and Germany, with document frequencies of 75, 73, 70, and 66, respectively. However, these countries are among the core nodes of the global collaboration network, consistent with the analysis of publication output.
Figure 12. The country’s collaboration world map on deforestation from 1974 to 2025. (The minimum number of mid-edge collaborations is 6 in Bibliometric (biblioshiny).)
Forests 17 00798 g012
The majority of African, Central Asian, and Pacific nations appear in low-contribution shading, confirming their near-absence from deforestation research output despite significant forest cover and active deforestation pressures. According to collaboration intensity, thick dark blue lines (>100 collaborations) connect the USA–Brazil, USA–UK, USA–Australia, and USA–Europe corridors, identifying these as the dominant global bilateral research partnerships. Thinner lines (>25 collaborations) extend across a broader network linking Europe, Asia-Pacific, and Latin America. However, this structural inequality shapes research priorities and governance solutions, marginalizing frontline nations in the fight against deforestation.

4. Discussion

4.1. Temporal Evolution of Deforestation Research

This bibliometric analysis maps the global research landscape of deforestation science over 52 years (1974–2025), based on systematic retrieval of publications from the WoS and Scopus databases. The temporal distribution of publications (Figure 2) reveals three distinct phases of scholarly development, each shaped by the convergence of ecological awareness, technological capacity, and international policy commitments.
The slow-growth phase (1974–1990) reflects the earliest institutionalization of deforestation as a scientific concern. The 1972 United Nations Conference on the Human Environment in Stockholm marked the first global recognition of environmental degradation as a shared political challenge [25]. In the same year, the launch of the Landsat 1 (ERTS-1) satellite inaugurated the era of space-based forest monitoring, enabling systematic observation of land-cover change from orbit [26,36,37]. The book Limits to Growth demonstrated through computational modeling that exponential resource consumption, including forest exploitation, was ecologically unsustainable [38]. The 1980 UNEP report on tropical forest resources drew international attention to the accelerating loss of tropical forests [39]. The Brundtland Commission’s report, “Our Common Future” (1987), provided the foundation for sustainable development policy that would anchor subsequent forest governance debates [40]. Publication volumes during this period remained low, reflecting the field’s emergence rather than its maturity.
The rapid development phase (1991–2010) was catalyzed by the 1992 Rio Earth Summit, which produced Agenda 21 and the Forest Principles, the first globally negotiated framework for sustainable forest management [41]. The subsequent Intergovernmental Panel on Forests (IPF, 1995–1997) and Intergovernmental Forum on Forests (IFF, 1997–2000) deepened international deliberation on the underlying causes of deforestation, indigenous forest knowledge, and criteria for sustainable management [42,43,44]. The 1997 Kyoto Protocol introduced land-use change and forestry (LULUCF) as a recognized carbon-accounting category, formally connecting deforestation to climate-mitigation science [45]. Simultaneously, the proliferation of medium- and high-resolution satellite platforms, including MODIS (1999) and advanced Landsat missions, transformed the methodological toolkit of deforestation research, enabling large-scale time-series analysis that was previously impossible [27]. These technological advances directly drove the expansion of remote sensing as the most methodologically prominent strand of deforestation science, as observed in the keyword analysis.
The deep development phase (2011–2025) represents the most intensive period of growth in both publication volume and citation impact. The Cancun agreements (2010) [41] formalized REDD+ as a market-based mechanism for reducing emissions from deforestation and forest degradation in developing countries, thereby generating a substantial body of policy evaluation and governance research [46,47]. The publication of Hansen et al.’s (2013) high-resolution global forest cover change dataset in science fundamentally transformed the empirical basis of the field [11,27,48]. At the same time, Global Mangrove Watch provides an open-access monitoring capability for a previously underserved forest ecosystem [49]. The adoption of the Sustainable Development Goals (2015), the Paris Agreement (2015), and the Kunming-Montreal Global Biodiversity Framework (2022), which set targets for halting biodiversity loss and conserving 30% of land and ocean by 2030, have collectively sustained research momentum and ensured that deforestation remains a central focus of global environmental science and policy [41,50,51,52]. More recently, terms such as deep learning, machine learning, and EUDR have gained prominence, signaling the growing integration of artificial intelligence and supply-chain policy into deforestation research. This trend opens new avenues for future studies, particularly at the intersection of advanced monitoring technologies and regulatory frameworks.

4.2. Thematic Dominance and Research Gaps

The thematic structure of deforestation science reflects a field shaped primarily by remote-sensing methodologies and climate governance frameworks. Remote-sensing dominates because deforestation is inherently spatially explicit; it can be detected, quantified, and monitored from satellite imagery across multiple spatial and temporal scales, making it amenable to the kind of large-area, reproducible analysis that high-impact journals favor [27]. The centrality of Amazon, Brazil, and tropical deforestation in the keyword analysis confirms a well-documented geographic concentration: the Brazilian Amazon has served as a paradigmatic case study of tropical forest loss for over four decades, supported by INPE’s pioneering PRODES monitoring system [53].
Despite this thematic density, significant gaps are evident. Reforestation and restoration appear as low-frequency, recently emerging terms, suggesting that the field has invested disproportionately in documenting forest loss relative to recovery dynamics, a gap increasingly acknowledged in the restoration ecology literature [54]. Social drivers of deforestation, including smallholder agriculture, land tenure insecurity, and governance failures, remain underrepresented relative to biophysical and remote-sensing themes, despite growing evidence that sociopolitical factors are primary determinants of deforestation outcomes in many regions [55]. The Congo basin, dry tropical forests, and Mekong countries, all experiencing accelerating forest loss, are similarly underrepresented as research geographies, reflecting a structural mismatch between where deforestation is most acute and where significant capacity is most concentrated [56]. However, deforestation research has matured into a multidisciplinary field, with strong clusters in remote sensing, climate-carbon policy, and governance; significant gaps persist in geographic coverage, thematic breadth, and research capacity. Addressing these gaps is essential to support evidence-based policymaking and sustainable forest management worldwide.

4.3. Causal Drivers of Deforestation in the Literature

The bibliometric corpus revealed that the treatment of drivers of deforestation is uneven. Agricultural expansion, particularly of soy, cattle, palm oil, coffee, cocoa, rubber, and sugarcane, is now widely recognized as the dominant proximate driver of tropical deforestation, accounting for an estimated 73% of global tropical forest loss [57]. Cattle ranching alone accounts for the majority of Amazon deforestation, driven by global demand for beef and leather [58]. Infrastructure expansion, roads, hydroelectric dams, and mining operations function as a critical indirect driver by opening previously inaccessible forest frontiers to agricultural colonization [59]. Climate change is increasingly recognized as both a consequence and an accelerant of forest loss, operating through drought-induced dieback and elevated fire frequency, particularly in the Eastern Amazon [60]. In Southeast Asia, forest conversion to industrial plantations is a major driver [61]. Non-agricultural activities, such as mining and mangrove clearance for aquaculture, are poorly documented [1].
The bibliometric analysis suggested that while REDD+ and climate–carbon themes dominate the policy-facing literature, commodity-driven deforestation, particularly the role of global supply chains, consumer demand in high-income countries, and international finance, remains comparatively underrepresented as a primary research object [62]. Furthermore, the EU Deforestation Regulation (EUDR) has been critiqued for not adequately addressing underlying drivers, such as poverty, and for failing to include policies in the Global South. This constitutes a significant thematic gap, as effective forest governance increasingly requires engaging the demand-side drivers embedded in international trade rather than focusing exclusively on production-side dynamics in tropical countries [61,63].

4.4. Collaboration Networks and Global Inequalities

The collaboration network analysis reveals a pronounced hub-and-spoke structure in global deforestation science. The United States dominates, with 1060 total publications, attributable to the concentration of world-ranking research universities; federal agencies, including NASA, the US Forest Service, and the Smithsonian Institution; and sustained federal investment in earth system science [64,65]. Brazil ranks second, driven by INPE’s globally recognized satellite monitoring program and Amazon’s status as the world’s most studied deforestation system [53,66,67]. The United Kingdom’s third-place position reflects the international reach of institutions such as Cambridge, Oxford, and the Center for Ecology and Hydrology, as well as the UK’s historical research ties with tropical forest nations through development partnerships and the Commonwealth networks [68,69].
However, the network map exposes a structural inequality: African nations, despite containing 16% of global forest area and experiencing significant deforestation pressure, particularly in the Congo Basin, appear overwhelmingly as low-contribution, peripheral nodes, with few bilateral collaboration links. This pattern is consistent with broader critiques of knowledge–production asymmetries in global environmental science, in which countries most directly affected by ecological crises are frequently marginalized as research producers [68,70,71]. Constrained research infrastructure, limited access to subscription databases, insufficient research and development funding, and the systematic exclusions of non-English publications from major indices collectively sustain this asymmetry [68,72].
The dominance of Global North institutions as network hubs shapes research priorities, governance solutions, and the communities rendered visible in deforestation science [68,70,71]. Future research must foster equitable South–South partnerships, build capacity in underrepresented regions (Congo Basin, Mekong), address epistemic inequalities, ensure equitable access to AI tools, and strengthen the policy–science interface through inclusive publishing and sustained funding for locally led research.

4.5. Implications for Forest Science and Policy

This finding carries direct implications for how deforestation research is funded, organized, and translated into policy. Research funders and intergovernmental bodies should prioritize capacity-building investments in scientifically underrepresented but ecologically critical regions, particularly Central Africa and Mainland Southeast Asia. The international collaboration program should move beyond the hub-and-spoke model and towards genuine South–South and triangular partnerships that build independent research capacity in forest-frontline nations [73]. The integration of social and biophysical sciences, including indigenous land tenure, political ecology, and behavioral economics, is essential to address the complex human environment interactions that drive forest loss [55]. Leveraging machine learning and artificial intelligence for near-real-time deforestation detection represents a rapidly expanding frontier that should be systematically incorporated into national monitoring systems [74]. Finally, bridging the research–policy interface requires not only producing relevant evidence but also ensuring that it reaches the governance actors, national forest agencies, commodity supply-chain regulators, and multilateral bodies capable of translating it into enforceable action. Promoting interdisciplinary, locally led research is equally critical to supporting sustainable forest management worldwide.

5. Conclusions

This study presented the first comprehensive bibliometric analysis of deforestation research as a unified scientific field spanning 52 years (1974–2025) across 5091 publications retrieved from the WoS and Scopus. Our analysis reveals what narrative reviews have not previously made explicit: the intellectual architecture, collaboration inequalities, thematic evolution, and structural gaps that define the current state of deforestation science.
Three contributions stand out from this analysis. First, the field has undergone a quantitative transformation across three phases, from descriptive ecology (1974–1990), through climate-governance integration (1991–2010), to data-intensive, SDG-aligned science (2011–2025), each producing a distinct thematic signature traceable in the bibliometric record. Second, scientific leadership is concentrated in the USA, Brazil, the United Kingdom, Germany, and Australia, while the Democratic Republic of Congo, Myanmar, and Bolivia, among the world’s most active deforestation frontiers, generate negligible research output. This persistent inequality mirrors broader asymmetries in knowledge production within global environmental science. Third, thematic analysis reveals that while remote sensing, climate-carbon policy, and governance (Particularly REDD+ and EUDR) dominate the literature, restoration ecology, social drivers of deforestation, and supply chain governance have remained significantly understudied. This gap limits the field’s capacity to inform holistic, evidence-based forest policy.
Finally, this study provides an empirical, data-driven foundation for understanding the evolution, structure, and inequalities of global deforestation research. By identifying where scientific capacity is concentrated and where critical gaps remain, it provides a replicable evidence base that helps funding bodies and policymakers align research investments with conservation needs. Addressing the identified gaps, namely geographic, thematic, and structural, is essential to support evidence-based policymaking and sustainable forest management worldwide.

Author Contributions

Conceptualization, M.J., T.M., M.R., and Y.M.; methodology, M.J. and M.R.; software, M.J. and M.R.; validation, M.J., T.M., M.R., and Y.M.; formal analysis, M.J.; investigation, M.J. and M.R.; resources, M.J.; data curation, M.J. and M.R.; writing—original draft preparation, M.J.; writing—review and editing, T.M., M.R., and Y.M.; visualization, M.J.; supervision, T.M., M.R., and Y.M.; project administration, M.J. and T.M.; funding acquisition, T.M. and Y.M. All authors have read and agreed to the published version of the manuscript.

Funding

This research was funded by the Japanese Science and Technology Agency through Support for Pioneering Research Initiated by the Next Generation (JST SPRING) (Grant Number-JPMJSP2124), and the University of Tsukuba, operating funds (Japan).

Data Availability Statement

University of Tsukuba, Japan, Web of Science and Scopus databases, downloaded according to the keywords (deforest* OR “forest cover loss” OR “forest degradation”) on 13 February 2025, at 7.00 a.m., and on the same day, at 02.00 p.m., respectively.

Acknowledgments

The authors would like to express their sincere gratitude to the Research A-to-Z group for the comprehensive training on VOSviewer and Bibliometric analysis in RStudio. Additionally, we would like to thank the University of Tsukuba for providing access to the Wed of Science database and funding from the JST SPRING Scholarship.

Conflicts of Interest

The authors declare no conflicts of interest.

Abbreviations

AIartificial intelligence
CBDConvention on Biological Diversity
CBAMCarbon Border Adjustment Mechanism
CGIARConsultative Group on International Agriculture Research
COPConference of the Parties
CSVComma-Separated Value
EUDREuropean Union Deforestation-free Products Regulation
INPE’sInstituto Nacional Pesquisas Espaciais (National Institute for Space Research-Brazil)
IPF/IFFIntergovernmental Panel on Forest/Intergovernmental Forum on Forests
MSMicrosoft
NASANational Aeronautics and Space Administration
PRISMAPreferred Reporting Items for Systematic Reviews and Meta-Analysis
PRODESProgram for Satellite Monitoring of the Brazilian Amazon Forest
REDDReducing Emissions from Deforestation and Forest Degradation
REDD+Reducing Emissions from Deforestation and Forest Degradation (Plus Conservation)
LULUCFLand Use, Land-Use Change, and Forestry
SDGsSustainable Development Goals
UKUnited Kingdom
UNUnited Nations
UCUniversity of California
USAUnited States of America
WoSWeb of Science

References

  1. West, C.; Rabeschini, G.; Singh, C.; Kastner, T.; Lima, M.B.; Dermawan, A.; Croft, S.; Persson, U.M. The global deforestation footprint of agriculture and forestry. Nat. Rev. Earth Environ. 2025, 6, 325–341. [Google Scholar] [CrossRef]
  2. Pendrill, F.; Gardner, T.A.; Meyfroidt, P.; Persson, U.M.; Adams, J.; Azevedo, T.; Lima, M.G.B.; Baumann, M.; Curtis, P.G.; De Sy, V.; et al. Disentangling the numbers behind agriculture-driven tropical deforestation. Science 2022, 377, eabm9267. [Google Scholar] [CrossRef] [PubMed]
  3. Aleixandre-Benavent, R.; Aleixandre-Tudó, J.L.; Castelló-Cogollos, L.; Aleixandre, J.L. Trends in global research in deforestation: A bibliometric analysis. Land Use Policy 2018, 72, 293–302. [Google Scholar] [CrossRef]
  4. Sakschewski, B.; Caesar, L.; Andersen, L.; Bechthold, M.; Bergfeld, L.; Beusen, A.; Billing, M.; Bodirsky, B.L.; Botsyun, S.; Dennis, D.; et al. A Scientific Assessment of the State of the Planet; Potsdam Institute for Climate Impact Research: Potsdam, Germany, 2025. [Google Scholar] [CrossRef]
  5. Food and Agriculture Organization of the United Nations. The State of the World’s Forests 2024; FAO: Rome, Italy, 2024. [Google Scholar] [CrossRef]
  6. Guimarães, U.S.; Rodrigues, T.B.; Vieira, A.C.; Hung, E.M.; Soja, M.J.; Eriksson, L.E.; Ulander, L.M. Deep learning models to map deforestation based on Sentinel-1 coherent features in the southern border of the Amazon. Sci. Remote Sens. 2025, 12, 100279. [Google Scholar] [CrossRef]
  7. Food and Agriculture Organization of the United Nations. Global Forest Resources Assessment 2025; FAO: Rome, Italy, 2025. [Google Scholar] [CrossRef]
  8. Food and Agriculture Organization of the United Nations. Global Forest Resources Assessment 2020; FAO: Rome, Italy, 2020. [Google Scholar] [CrossRef]
  9. Corona, P.; Di Stefano, V.; Mariano, A. Knowledge gaps and research opportunities in the light of the European Union Regulation on deforestation-free products. Ann. Silvic. Res. 2023, 48, 87–89. [Google Scholar] [CrossRef]
  10. Köthke, M.; Lippe, M.; Elsasser, P. Comparing the former EUTR and upcoming EUDR: Some implications for private sector and authorities. For. Policy Econ. 2023, 157, 103079. [Google Scholar] [CrossRef]
  11. Freitas Beyer, J.; Köthke, M.; Lippe, M. Assessing the suitability of available global forest maps as reference tools for EUDR-compliant deforestation monitoring. Remote Sens. 2025, 17, 3012. [Google Scholar] [CrossRef]
  12. Williams, M. Deforesting the Earth: From Prehistory to Global Crisis; University of Chicago Press: Chicago, IL, USA, 2003. [Google Scholar]
  13. Yasuda, Y.; Kitagawa, H.; Nakagawa, T. The earliest record of major anthropogenic deforestation in the Ghab Valley, northwest Syria: A palynological study. Quat. Int. 2000, 73–74, 127–136. [Google Scholar] [CrossRef]
  14. Armesto, J.J.; Manuschevich, D.; Mora, A.; Smith-Ramirez, C.; Rozzi, R.; Abarzúa, A.M.; Marquet, P.A. From the Holocene to the Anthropocene: A historical framework for land cover change in southwestern South America in the past 15,000 years. Land Use Policy 2010, 27, 148–160. [Google Scholar] [CrossRef]
  15. Donthu, N.; Kumar, S.; Mukherjee, D.; Pandey, N.; Lim, W.M. How to conduct a bibliometric analysis: An overview and guidelines. J. Bus. Res. 2021, 133, 285–296. [Google Scholar] [CrossRef]
  16. Walters, W.H. Comparing conventional and alternative mechanisms of discovering and accessing the scientific literature. Proc. Natl. Acad. Sci. USA 2025, 122, e2503051122. [Google Scholar] [CrossRef] [PubMed]
  17. Shahzad, K.; Khan, S.A.; Latif, M.; Javeed, A.M.D.; Iqbal, A. Big data analytics in healthcare: Current practices, innovations, and future prospects. J. Big Data 2025, 12, 88. [Google Scholar] [CrossRef]
  18. Zhang, X.; Estoque, R.C.; Xie, H.; Murayama, Y.; Ranagalage, M. Bibliometric analysis of highly cited articles on ecosystem services. PLoS ONE 2019, 14, e0210707. [Google Scholar] [CrossRef] [PubMed]
  19. Islam, M.A.; Khatun, M.B.; Rahman, M.H. Visualization of Scopus and WoS data (2000–2024) on forced, child, and contract marriage: A bibliometric analysis. SN Soc. Sci. 2025, 5, 146. [Google Scholar] [CrossRef]
  20. Cascajares, M.; Alcayde, A.; Salmerón-Manzano, E.; Manzano-Agugliaro, F. The bibliometric literature on Scopus and WoS: The medicine and environmental sciences categories as a case study. Int. J. Environ. Res. Public Health 2021, 18, 5851. [Google Scholar] [CrossRef] [PubMed]
  21. Nowakowska, M. A comprehensive approach to preprocessing data for bibliometric analysis. Scientometrics 2025, 130, 5191–5225. [Google Scholar] [CrossRef]
  22. Hosonuma, N.; Herold, M.; De Sy, V.; De Fries, R.S.; Brockhaus, M.; Verchot, L.; Angelsen, A.; Romijn, E. An assessment of deforestation and forest degradation drivers in developing countries. Environ. Res. Lett. 2012, 7, 044009. [Google Scholar] [CrossRef]
  23. Rao, H.H.; Guo, F.; Tian, J. Improving search strategies in bibliometric studies on machine learning in renal medicine. Int. Urol. Nephrol. 2025, 57, 1987–1988. [Google Scholar] [CrossRef] [PubMed]
  24. Zupic, I.; Čater, T. Bibliometric methods in management and organization. Organ. Res. Methods 2015, 18, 429–472. [Google Scholar] [CrossRef]
  25. United Nations. Report of the United Nations Conference on the Human Environment—A/CONF.48/14/Rev.1; United Nations: Stockholm, Sweden, 1972. [Google Scholar]
  26. Goodrick, M.E. An Early Analysis of ERTS-1 Data. 1972. Available online: http://docs.lib.purdue.edu/larstech/106 (accessed on 12 March 2026).
  27. Hansen, M.C.; Potapov, P.V.; Moore, R.; Hancher, M.; Turubanova, S.A.; Tyukavina, A.; Thau, D.; Stehman, S.V.; Goetz, S.J.; Loveland, T.R.; et al. High-resolution global maps of 21st-century forest cover change. Science 2013, 342, 850–853. [Google Scholar] [CrossRef] [PubMed]
  28. Aria, M.; Cuccurullo, C. bibliometrix: An R-tool for comprehensive science mapping analysis. J. Informetr. 2017, 11, 959–975. [Google Scholar] [CrossRef]
  29. Clua-Espuny, J.-L.; Molto-Balado, P.; Lucas-Noll, J.; Panisello-Tafalla, A.; Muria-Subirats, E.; Clua-Queralt, J.; Queralt-Tomas, L.; Reverté-Villarroya, S.; Investigators EBRICTUS Research. Early diagnosis of atrial fibrillation and stroke incidence in primary care: Translating measurements into actions—A retrospective cohort study. Biomedicines 2023, 11, 1116. [Google Scholar] [CrossRef] [PubMed]
  30. Van Eck, N.J.; Waltman, L. Software survey: VOSviewer, a computer program for bibliometric mapping. Scientometrics 2010, 84, 523–538. [Google Scholar] [CrossRef] [PubMed]
  31. Chen, C. CiteSpace II: Detecting and visualizing emerging trends and transient patterns in scientific literature. J. Am. Soc. Inf. Sci. Technol. 2006, 57, 359–377. [Google Scholar] [CrossRef]
  32. Xie, J.; Zhang, G.; Li, Y.; Yan, X.; Zang, L.; Liu, Q.; Chen, D.; Sui, M.; He, Y. A bibliometric analysis of forest gap research during 1980–2021. Sustainability 2023, 15, 1994. [Google Scholar] [CrossRef]
  33. Parker, D.; Tosiani, A.; Yazid, M.; Sari, I.L.; Kartika, T.; Kustiyo; Firmansyah, R.; Said, Z.; Wijaya, A.; Potapov, P.; et al. Land in limbo: Nearly one-third of Indonesia’s cleared old-growth forests are left idle. Proc. Natl. Acad. Sci. USA 2024, 121, e2318029121. [Google Scholar] [CrossRef] [PubMed]
  34. Ferreira, A. Amazon deforestation: Drivers, damages, and policies. Land Use Policy 2026, 160, 107810. [Google Scholar] [CrossRef]
  35. Jayarathne, M.; Morimoto, T.; Ranagalage, M. Bibliometric analysis of highly cited publications on mangrove sustainability. Forests 2026, 17, 240. [Google Scholar] [CrossRef]
  36. Loveland, T.R.; Anderson, M.C.; Huntington, J.L.; Irons, J.R.; Johnson, D.M.; Rocchio, L.E.; Woodcock, C.E.; Wulder, M.A. Seeing our planet anew: Fifty years of Landsat. Photogramm. Eng. Remote Sens. 2022, 88, 429–437. [Google Scholar] [CrossRef]
  37. Woodcock, C.E.; Allen, R.; Anderson, M.; Belward, A.; Bindschadler, R.; Cohen, W.; Gao, F.; Goward, S.N.; Helder, D.; Helmer, E.; et al. Free access to Landsat imagery. Science 2008, 320, 1011. [Google Scholar] [CrossRef] [PubMed]
  38. Meadows, D.H.; Meadows, D.L.; Randers, J.; Behrens, W.W. The Limits to Growth: A Report for the Club of Rome’s Project on the Predicament of Mankind; Universe Books: New York, NY, USA, 1972. [Google Scholar]
  39. Food and Agriculture Organization of the United Nations; United Nations Environment Programme. Tropical Forest Resources Assessment Project: Forest Resources of Tropical Asia; FAO: Rome, Italy, 1981; Available online: http://www.fao.org/docrep/007/ad908e/AD908E01.htm (accessed on 12 March 2026).
  40. World Commission on Environment and Development. Our Common Future; Oxford University Press: Oxford, UK, 1987. [Google Scholar]
  41. United Nations. Transforming Our World: The 2030 Agenda for Sustainable Development. Resolution A/RES/70/1; United Nations: New York, NY, USA, 2015. [Google Scholar]
  42. Rosendal, G.K. Overlapping international regimes: The case of the Intergovernmental Forum on Forests (IFF) between climate change and biodiversity. Int. Environ. Agreem. 2001, 1, 447–468. [Google Scholar] [CrossRef]
  43. International Institute for Sustainable Development. Summary of the Fourth Session of the Intergovernmental Panel on Forests: 11–21 February 1997. Earth Negotiations Bulletin. 1997. Available online: https://enb.iisd.org/events/4th-session-csd-intergovernmental-panel-forests/summary-report-11-21-february-1997 (accessed on 12 March 2026).
  44. United Nations Economic and Social Council. Report on the Fourth Session of the Intergovernmental Forum on Forests; United Nations: New York, NY, USA, 2000. [Google Scholar]
  45. United Nations. Kyoto Protocol to the United Nations Framework Convention on Climate Change; United Nations: New York, NY, USA, 1998. [Google Scholar]
  46. Bayrak, M.M.; Marafa, L.M. Ten years of REDD+: A critical review of the impact of REDD+ on forest-dependent communities. Sustainability 2016, 8, 620. [Google Scholar] [CrossRef]
  47. Angelsen, A.; Martius, C.; De Sy, V.; Duchelle, A.E.; Larson, A.M.; Thuy, P.T. Transforming REDD+: Lessons and New Directions; CIFOR: Bogor, Indonesia, 2018. [Google Scholar]
  48. Tropek, R.; Sedláček, O.; Beck, J.; Keil, P.; Musilová, Z.; Šímová, I.; Storch, D. Comment on “High-resolution global maps of 21st-century forest cover change”. Science 2014, 344, 981. [Google Scholar] [CrossRef] [PubMed]
  49. Bunting, P.; Rosenqvist, A.; Lucas, R.M.; Rebelo, L.M.; Hilarides, L.; Thomas, N.; Hardy, A.; Itoh, T.; Shimada, M.; Finlayson, C.M. The global mangrove watch—A new 2010 global baseline of mangrove extent. Remote Sens. 2018, 10, 1669. [Google Scholar] [CrossRef]
  50. Pan, H.; Liu, G.; Muller, J.-P.; Sun, Z.; Yao, Y.; Chang, Y.; Xiong, Z.; Zhang, Y. Comprehensive assessment of sustainable development of terrestrial ecosystem based on SDG 15—A case study of Guilin City. Remote Sens. 2025, 17, 63. [Google Scholar] [CrossRef]
  51. Ma, Z.; Hu, C.; Huang, J.; Li, T.; Lei, J. Forests and forestry in support of Sustainable Development Goals (SDGs): A bibliometric analysis. Forests 2022, 13, 1960. [Google Scholar] [CrossRef]
  52. Convention on Biological Diversity. Decision 15/4: Kunming-Montreal Global Biodiversity Framework; CBD: Montreal, QC, Canada, 2022; Available online: www.cbd.int (accessed on 5 June 2026).
  53. Souza, C.M.; Shimbo, J.Z.; Rosa, M.R.; Parente, L.L.; Alencar, A.; Rudorff, B.F.; Hasenack, H.; Matsumoto, M.; Ferreira, L.G.; Souza-Filho, P.W.M.; et al. Reconstructing three decades of land use and land cover changes in Brazilian biomes with Landsat archive and Earth Engine. Remote Sens. 2020, 12, 2735. [Google Scholar] [CrossRef]
  54. Chazdon, R.L.; Brancalion, P.H.S.; Laestadius, L.; Bennett-Curry, A.; Buckingham, K.; Kumar, C.; Moll-Rocek, J.; Vieira, I.C.G.; Wilson, S.J. When is a forest a forest? Forest concepts and definitions in the era of forest and landscape restoration. Ambio 2016, 45, 538–550. [Google Scholar] [CrossRef] [PubMed]
  55. Meyfroidt, P.; de Bremond, A.; Ryan, C.M.; Archer, E.; Aspinall, R.; Chhabra, A.; Camara, G.; Corbera, E.; DeFries, R.; Díaz, S.; et al. Ten facts about land systems for sustainability. Proc. Natl. Acad. Sci. USA 2022, 119, e2109217118. [Google Scholar] [CrossRef] [PubMed]
  56. Tyukavina, A.; Hansen, M.C.; Potapov, P.; Parker, D.; Okpa, C.; Stehman, S.V.; Kommareddy, I.; Turubanova, S. Congo Basin forest loss is dominated by increasing smallholder clearing. Sci. Adv. 2018, 4, eaat2993. [Google Scholar] [CrossRef] [PubMed]
  57. Curtis, P.G.; Slay, C.M.; Harris, N.L.; Tyukavina, A.; Hansen, M.C. Classifying drivers of global forest loss. Science 2018, 361, 1108–1111. [Google Scholar] [CrossRef] [PubMed]
  58. Barona, E.; Ramankutty, N.; Hyman, G.; Coomes, O.T. The role of pasture and soybean in deforestation of the Brazilian Amazon. Environ. Res. Lett. 2010, 5, 024002. [Google Scholar] [CrossRef]
  59. Laurance, W.F.; Clements, G.R.; Sloan, S.; O’connell, C.S.; Mueller, N.D.; Goosem, M.; Venter, O.; Edwards, D.P.; Phalan, B.; Balmford, A.; et al. A global strategy for road building. Nature 2014, 513, 229–232. [Google Scholar] [CrossRef] [PubMed]
  60. Aragão, L.E.O.C.; Anderson, L.O.; Fonseca, M.G.; Rosan, T.M.; Vedovato, L.B.; Wagner, F.H.; Silva, C.V.J.; Silva Junior, C.H.L.; Arai, E.; Aguiar, A.P.; et al. 21st-century drought-related fires counteract the decline of Amazon deforestation carbon emissions. Nat. Commun. 2018, 9, 536. [Google Scholar] [CrossRef] [PubMed]
  61. Feurer, M.; Markovic, J.; Starke, M.; Wilkes-Allemann, J.; Wolf, O. Drivers of deforestation and forest degradation between 1990 and 2023—A global meta-analysis. Environ. Sci. Policy 2025, 173, 104242. [Google Scholar] [CrossRef]
  62. Lambin, E.F.; Gibbs, H.K.; Heilmayr, R.; Carlson, K.M.; Fleck, L.C.; Garrett, R.D.; le Polain de Waroux, Y.; McDermott, C.L.; McLaughlin, D.; Newton, P.; et al. The role of supply-chain initiatives in reducing deforestation. Nat. Clim. Change 2018, 8, 109–116. [Google Scholar] [CrossRef]
  63. Pendrill, F.; Persson, U.M.; Godar, J.; Kastner, T.; Moran, D.; Schmidt, S.; Wood, R. Agricultural and forestry trade drives a large share of tropical deforestation emissions. Glob. Environ. Change 2019, 56, 1–10. [Google Scholar] [CrossRef]
  64. Haunschild, R.; Bornmann, L.; Marx, W. Climate change research in view of bibliometrics. PLoS ONE 2016, 11, e0160393. [Google Scholar] [CrossRef] [PubMed]
  65. Aji, K.B.; Salouw, E.; Darajat, I.R.; Irdana, N.; Sushartami, W. Mangrove ecotourism research progress, trends, and updates: A bibliometric analysis based on the Scopus and Web of Science databases. GeoJ. Tour. Geosites 2024, 52, 49–64. [Google Scholar] [CrossRef]
  66. Doblas, J.; Reis, M.S.; Mermoz, S.; Almeida, C.A.; Koleck, T.; Messias, C.G.; Soler, L.; Bouvet, A.; Sant’aNna, S.J.S. DETER-RT: The new INPE-TropiSCO deforestation monitoring system in the Amazon biome. Int. Arch. Photogramm. Remote Sens. Spat. Inf. Sci. 2024, XLVIII-3, 127–133. [Google Scholar] [CrossRef]
  67. Padovezi, A.; Ludvig, A.; Weiss, G.; Chazdon, R.L.; Rogelja, T.; Adams, C.; Secco, L. Unraveling Brazil’s approach: Policy and governance gaps for social innovation in forest and landscape restoration. Land Use Policy 2025, 155, 107583. [Google Scholar] [CrossRef]
  68. Carrasco, J.I.; Akbaritabar, A.; Godin, M.; Vargas-Silva, C. Prioritizing global equity in migration research. Humanit. Soc. Sci. Commun. 2026, 13, 16. [Google Scholar] [CrossRef]
  69. Dams, J. The fourth age of research. Nature 2013, 497, 557–560. [Google Scholar] [CrossRef]
  70. Nightingale, A.J. Commoning for inclusion? Commons, exclusion, property, and socio-natural becomings. Int. J. Commons 2019, 13, 16. [Google Scholar] [CrossRef]
  71. Burgess, R.; Hansen, M.; Olken, B.A.; Potapov, P.; Sieber, S. The political economy of deforestation in the tropics. Q. J. Econ. 2012, 127, 1707–1754. [Google Scholar] [CrossRef]
  72. Gupta, S. Invasion science and the global spread of SARS-CoV-2. Trends Ecol. Evol. 2020, 35, 641–642. [Google Scholar] [CrossRef]
  73. Glick, P.; Stein, B.A.; Hall, K.R. Toward a Shared Understanding of Climate-Smart Restoration on America’s National Forests: A Science Review and Synthesis; National Wildlife Federation: Washington, DC, USA, 2021; Available online: www.nwf.org/ClimateSmartRestoration (accessed on 12 March 2026).
  74. Kattenborn, T.; Leitloff, J.; Schiefer, F.; Hinz, S. Review on convolutional neural networks (CNN) in vegetation remote sensing. ISPRS J. Photogramm. Remote Sens. 2021, 173, 24–49. [Google Scholar] [CrossRef]
Figure 1. PRISMA flow diagram of data refinement on deforestation publication in the WoS and Scopus databases from 1974 to 2025.
Forests 17 00798 g001
Figure 2. Number of publications, total citations, and major events on deforestation in the WoS and Scopus databases from 1974 to 2025.
Forests 17 00798 g002
Figure 3. Percentage of journal article publications in (a) WoS and (b) Scopus databases on deforestation from 1974 to 2025.
Forests 17 00798 g003
Figure 4. Number of articles in the top 10 journals on deforestation, based on WoS and Scopus databases (1974–2025).
Forests 17 00798 g004
Figure 5. Trending topics on the author’s keywords on deforestation (main configuration field is the author’s keywords, time span is 1974 to 2025, word minimum frequency is 8, and number of words per year is 2).
Forests 17 00798 g005
Figure 6. Co-occurrence network (authors’ keywords) related to deforestation research in WoS and Scopus databases, based on publications from 1974 to 2025. Note: A minimum number of occurrences value 15 was applied to publications, resulting in 145 out of 8741 keywords being distributed among 8 clusters. The bubble size represents the total number of articles, the line thickness indicates the strength of the linkage, and the color represents the cluster to which each article belongs.
Forests 17 00798 g006
Figure 7. Number of articles over time related to deforestation studies for the top ten authors, based on WoS and Scopus articles (1974–2025) (N = numbers; TC = total citations).
Forests 17 00798 g007
Figure 8. Top authors in deforestation research based on total and fractionalized article counts in WoS and Scopus databases (1974 to 2025).
Forests 17 00798 g008
Figure 9. Number of publications by top 10 institutional affiliations in deforestation research, from 1974 to 2025.
Forests 17 00798 g009
Figure 10. Co-authorship network on the institutional affiliations in deforestation in WoS and Scopus databases from 1974 to 2025. Note: A minimum number of occurrences value, 10, was applied to publications, resulting in 151 out of 5225 keywords distributed among 8 clusters. The bubble size represents the total number of articles, the line thickness indicates the strength of the linkage, and the color represents the cluster to which each article belongs.
Forests 17 00798 g010
Figure 11. Top 15 countries with single and multiple country publications on deforestation from 1974 to 2025.
Forests 17 00798 g011
Table 1. Data-refining criteria in deforestation publications searching the WoS and Scopus databases from 1974 to 2025.
CriteriaWoS Core Collection and Scopus Databases
Keywords(deforest* OR “forest cover loss” OR “forest degradation”)
Search fieldTitle
Document typeJournal article
YearsFrom 1 January 1974 to 31 December 2025 (52 Years)
LanguageEnglish only
AuthorAnonymously written and undefined documents were excluded.
LocationUniversity of Tsukuba, Japan
Search date and time13 February 2026
(Search time: WoS 9.00 am and Scopus 4.00 pm same day)
Disclaimer/Publisher’s Note: The statements, opinions and data contained in all publications are solely those of the individual author(s) and contributor(s) and not of MDPI and/or the editor(s). MDPI and/or the editor(s) disclaim responsibility for any injury to people or property resulting from any ideas, methods, instructions or products referred to in the content.