


Abstract
Coupled nitrogen (N) and phosphorus (P) cycling in calcareous karst soils, and how it responds to long-term land use and restoration, remains poorly quantified. We compared seven plots on a karst slope platform: three development types (degraded disturbed land, pasture, and fruit orchard) and four restoration types (planted evergreen forest, planted deciduous forest, evergreen–deciduous mixed forest, and naturally restored forest). Gross N transformation rates were measured by 15N isotope dilution, alongside soil properties, available P, microbial biomass N, and enzyme activities. Conservation plots generally had higher soil organic carbon, total N, microbial biomass N, and enzyme activity than development plots; soil organic carbon peaked under naturally restored forest (57.5 g·kg−1) and was lowest in disturbed land (47.9 g·kg−1). Naturally restored forest also showed the highest gross nitrification and total N mineralization, whereas disturbed land had the weakest ammonification, with negative gross rates pointing to N immobilization. Available P (up to 15.9 mg·kg−1) tracked alkaline phosphatase activity, organic carbon, and total N rather than total P. Across the alkaline range (pH 7.2–7.8), random forest models ranked ammonium and enzyme activity, not pH, as the main predictors of N mineralization. Long-term land use and restoration were thus associated with consistent differences in karst soil N and P supply.
1. Introduction
Karst ecosystems are widely distributed in carbonate landscapes and are characterized by shallow soil layers, high rock exposure, alkaline soil conditions, rapid hydrological connectivity, and strong spatial heterogeneity [1,2,3,4]. These features make karst soils highly sensitive to vegetation degradation, land-use change, and ecological restoration. In many karst regions, soil development is constrained by limited parent-material residues and high calcium carbonate content, which can restrict nutrient retention and alter nutrient availability compared with non-karst ecosystems [5,6]. Therefore, understanding how soil nutrient cycling differs among long-term land-use and restoration plots is important for evaluating the recovery of degraded karst ecosystems.
Soil formation and nutrient cycling in karst landscapes are further governed by the combined action of climate and topography on a soluble carbonate substrate. Because carbonate dissolution leaves only a small insoluble residue, pedogenesis proceeds slowly and is strongly modulated by topo-climatic conditions: temperature and precipitation regulate dissolution intensity, chemical weathering, leaching, and the balance between organic-matter production and decomposition, whereas slope gradient and slope position redistribute water, soil, and nutrients downslope and govern both surface and subsurface losses [1,2,3]. These processes generate pronounced gradients in soil depth, moisture, and nutrient status, with thin soils on upper slopes grading into deeper, more developed soils in lower positions [3,4]. Because soil depth and rock exposure constrain rooting volume, water storage, and microbial habitat, the topo-climatically controlled trajectory of pedogenesis cascades to vegetation composition and land-cover characteristics, which, in turn, feed back into litter input, organic-matter accumulation, and nutrient cycling [4,5]. The local pedogenetic context set by climate and topography therefore provides the theoretical backdrop against which land-use and restoration effects on karst soil nutrient cycling must be interpreted [2,6].
Nitrogen (N) and phosphorus (P) are two major nutrients regulating plant productivity and microbial processes in terrestrial ecosystems [7,8]. Global nutrient-addition studies have shown that N and P limitation are both widespread, and that combined N and P enrichment can produce strong positive responses in ecosystem productivity [7]. In calcareous karst soils, P availability is often constrained because phosphate can be immobilized through precipitation or adsorption with calcium-rich minerals [6,8]. Thus, total P content alone may not reflect the P supply available for plants and microorganisms. Soil available P is more likely to be shaped by the interaction among mineral composition, soil pH, organic matter accumulation, microbial demand, and phosphatase activity [9,10,11,12].
Soil N mineralization is a central process linking organic matter turnover with inorganic N supply [13,14]. Through ammonification and nitrification, organic N is transformed into ammonium and nitrate, which are directly available to plants and microorganisms. These processes are controlled by soil organic carbon, total N, microbial biomass, enzyme activity, soil moisture, temperature, and pH [13,14,15,16]. Because N mineralization changes substrate availability and microbial nutrient demand, it may also be associated with P transformation. For example, higher organic matter input can increase microbial activity and phosphatase production, while changes in ammonium and nitrate availability may modify microbial nutrient acquisition and the balance between N and P cycling [10,11,12,17]. However, these relationships may differ strongly among ecosystems because soil properties, vegetation type, and management history jointly regulate N and P availability.
Previous studies in karst regions have mainly focused on soil organic carbon accumulation, total nutrient stocks, vegetation restoration, microbial resource limitation, and net N transformation [18,19,20,21,22,23,24,25]. These studies have shown that karst soils are frequently limited by carbon and phosphorus rather than by nitrogen, and that vegetation restoration can substantially alter soil nutrient status and microbial processes [19,20,21,22,23,24,25]. However, two issues remain insufficiently resolved. First, most studies have not directly quantified gross N mineralization processes under contrasting long-term land-use and restoration types. Net changes in inorganic N can mask simultaneous production and consumption processes [13,26]. Second, the relationship between gross N transformation and P availability in calcareous karst soils remains unclear. This limits our ability to evaluate whether restoration-associated changes in soil organic matter and microbial enzyme activity are linked to both N supply and P availability.
To address these gaps, we investigated seven long-term land-use and restoration types at the Huanjiang Karst Ecosystem Observation and Research Station in Southwest China. These included development-oriented plots, namely degraded disturbed land, pasture, and fruit orchard, and conservation-oriented plots, namely planted evergreen forest, planted deciduous forest, evergreen-deciduous mixed forest, and naturally restored forest. Gross ammonification, nitrification, and total N mineralization were determined using the 15N isotope dilution method. Soil physicochemical properties, inorganic N, available P, microbial biomass N, and extracellular enzyme activities were also measured to assess the associations between N transformation and P availability.
The objectives of this study were to: (1) compare soil nutrient status and enzyme activity within a karst experimental platform; (2) quantify differences in gross ammonification, nitrification, and total N mineralization among these plot types; and (3) evaluate whether variation in gross N mineralization is associated with soil available P and alkaline phosphatase activity. We hypothesized that conservation-oriented restoration plots, especially naturally restored forest, would show higher soil organic carbon, total N, microbial biomass, and enzyme activity than development-oriented plots. We further hypothesized that gross nitrification and total N mineralization would be positively associated with soil available P, with SOC and alkaline phosphatase activity as potential related variables.
2. Materials and Methods
2.1. Overview of the Study Area
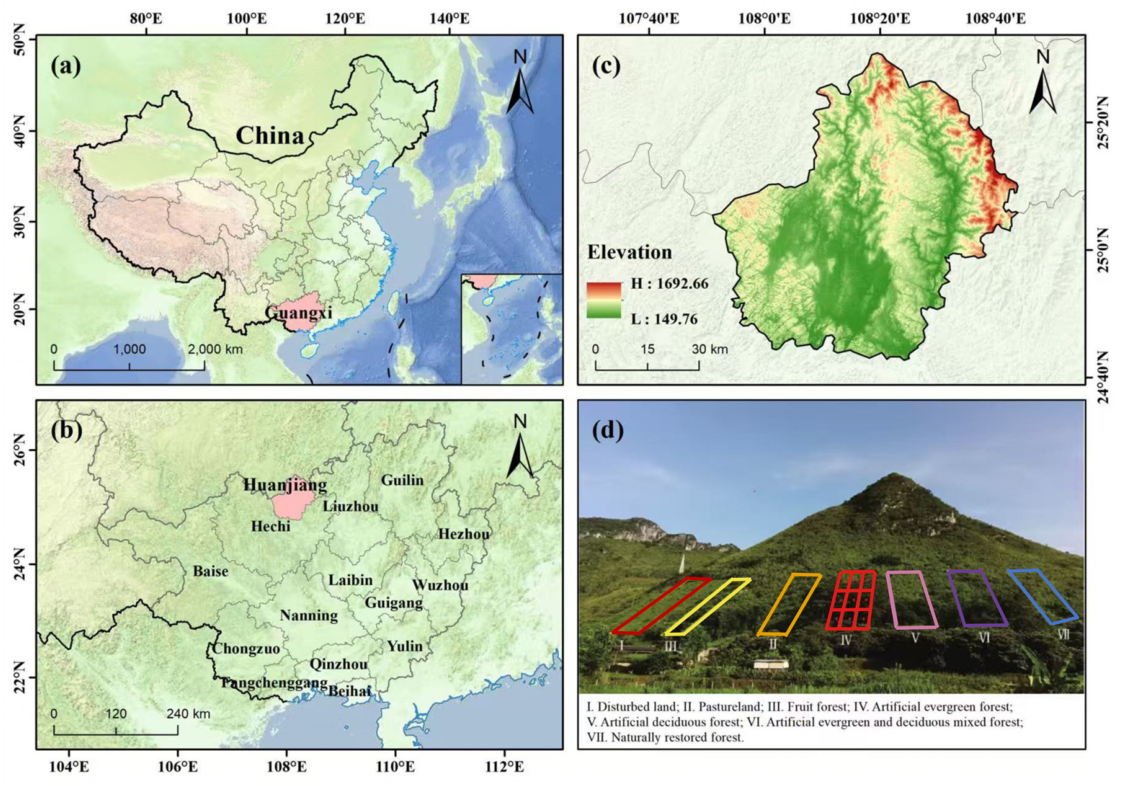
This study was conducted at the Huanjiang Karst Ecosystem Observation and Research Station of the Chinese Academy of Sciences (108°18′–108°19′ E, 24°43′–24°44′ N; mean elevation 228.5–337.8 m), in Huanjiang Maonan Autonomous County, Guangxi Zhuang Autonomous Region, southwestern China, as shown in Fig.1. The region lies just north of the Tropic of Cancer on the southeastern margin of the Yunnan–Guizhou Plateau and has a typical subtropical monsoon climate. The mean July air temperature is about 29 °C and the mean annual air temperature is 15.4–22.4 °C; the frost-free period is about 290 days, the mean annual sunshine duration is about 1451 h, the mean annual solar radiation is 98.89 kJ·cm−2, and the mean annual precipitation is 1400–1500 mm, of which about 70% falls between April and September.
The study area is a karst peak-cluster depression landscape. Prior to 1985, frequent fires and grazing caused severe rocky desertification; this degradation was driven in part by the loss of protective vegetation cover, which intensified surface runoff and soil erosion on the sloped terrain, a common mechanism of rock desertification in karst landscapes [1,2]. In 1985, the residents were relocated, after which vegetation and soil recovered gradually under reduced human disturbance. In 2004, the Slope-Following Cultivation Observation Platform was established on a hillslope of relatively uniform soil and vegetation, where long-term plots of comparable area and slope gradient were laid out to represent contrasting land-use and restoration trajectories [24]. The plots are located on karst hillslopes with a slope gradient of approximately 20–25° (mean ≈ 22°). Across the platform, bedrock exposure is <10%, surface gravel cover is 30%–60%, and the gravel volume fraction of the surface soil is 10%–30%. The soil is an alkaline calcareous soil derived from dolomite weathering; a formal WRB classification was not undertaken, so the soil is described by its parent material and main chemical properties. The soil is an alkaline calcareous (lime) soil developed on dolomite, corresponding to the brown lime soils that are widely mapped across the carbonate terrains of northwest Guangxi in the Chinese genetic soil classification and the second national soil survey [27]. Consistent with soil surveys conducted at this and adjacent peak-cluster depression catchments of the Huanjiang station [28], the soils form a downslope catena in which thin, weakly developed profiles on the upper slope grade into deeper, more strongly developed profiles toward the footslope and depression. Because diagnostic horizons were not quantified against measured criteria, the soils are characterised here by their parent material, regional classification, and field morphology rather than by a formal World Reference Base (WRB) allocation. The mean soil depth increases downslope from approximately 10–30 cm on the upper slope to 50–80 cm on the lower slope.
The seven long-term plots comprised three development-oriented land-use types (degraded disturbed land, pasture, and fruit orchard) and four conservation-oriented restoration types (planted evergreen forest, planted deciduous forest, evergreen–deciduous mixed forest, and naturally restored forest). The conservation-oriented plots were established by artificial afforestation in 2004 (about 16 years before sampling) using native and locally adapted karst tree species, and subsequently received only early-stage tending. The evergreen plantings were dominated by Cyclobalanopsis glauca (syn. Quercus glauca) and Cryptomeria japonica, and the deciduous plantings by Populus lasiocarpa and Zenia insignis, with the mixed forest containing both groups. The pasture was sown with perennial forage grass (Pennisetum sp.), and the fruit orchard was planted with Citrus reticulata; the degraded disturbed land carried sparse shrubs and grasses, including Alchornea trewioides, Ligustrum sinense, and Indigofera atropurpurea. The naturally restored forest, which has regenerated spontaneously since the 1985 relocation, is dominated by Quercus phillyraeoides, Platycarya strobilacea, Lindera communis, Celtis biondii, Cryptocarya chinensis, Symplocos sumuntia, Diospyros siderophylla, Streblus tonkinensis, and Excentrodendron tonkinense, among others. The dominant species and management of each plot are summarized in Table 1.
Table 1.
Historical and management background of the seven long-term land-use and restoration plots.
Figure 1.
Schematic diagram of sampling method. (a) Position of Guangxi Zhuang Autonomous Region within China; (b) location of Huanjiang Maonan Autonomous County within Guangxi; (c) digital elevation model showing the karst peak-cluster depression topography and the Slope-Following Cultivation Observation Platform; (d) field view of the experimental hillslope showing the seven long-term plots (I, degraded disturbed land; II, pasture; III, fruit orchard; IV, planted evergreen forest; V, planted deciduous forest; VI, evergreen–deciduous mixed forest; VII, naturally restored forest).
To characterize the soil, a representative profile was described by genetic horizon at a mid-to-lower slope position on the platform; horizon color was recorded against a Munsell chart, carbonate reaction was tested with dilute HCl, and texture was estimated in the field (Figure 2). The solum was deepest at footslope and depression positions (up to ~200 cm) and thinned upslope, consistent with the downslope increase in soil depth noted above. Six horizons were distinguished (Figure 2): a dark grayish-brown, granular, humus-rich topsoil (0–5 cm; clay loam to silty clay) with the highest organic-matter content and a dense mat of fine roots; a brownish-gray root zone (5–15 cm; clay loam); a brown to yellowish-brown transitional horizon (15–30 cm; subangular blocky, with increasing clay); a yellowish-brown illuvial (argic) subsoil showing clear clay illuviation (30–60 cm; silty clay to clay); a pale yellowish-brown calcic horizon with carbonate nodules that effervesced strongly with dilute HCl (60–100 cm; clay); and a grayish-yellow weathering (C) horizon with increasing dolomite fragments (100–200 cm), in which bedrock was not always reached within the depression. The combination of a clay-illuviated (argic) horizon over a carbonate-nodule (calcic) horizon developed on dolomite is characteristic of the brown lime soils that dominate the carbonate terrains of northwest Guangxi in the Chinese genetic soil classification and the second national soil survey [27]. The downslope sequence observed here from thin, weakly developed soils on the upper slope to deep, clay-enriched profiles at footslope and depression positions reproduces the soil catena documented for dolomite peak-cluster depressions at the Huanjiang station, where pedogenesis grades from weakly developed soils (Entisols and Inceptisols) on the upper slope to clay-illuviated, more strongly developed soils (Semi-alfisols and Alfisols) at lower positions [28], and is consistent with the contrasting calcareous-soil architectures previously reported on dolomite slopes in this region [31]. By analogy with these regional surveys and with established correlation between the Chinese classification systems and international schemes, the deeper footslope and depression profiles are tentatively equivalent to Luvisols (e.g., Calcic or Cutanic Luvisols) and the thin upper-slope soils to Leptosols (Rendzic or Calcaric Leptosols) in the WRB [32]. Because the diagnostic horizons were not quantified against the measured criteria required by the WRB, this allocation is provisional and is provided to aid international comparison rather than as a formal classification.
Figure 2.
Representative soil profile of the study platform: a calcareous (lime) soil developed on dolomite, showing the main genetic horizons with their depth, color, structure, and texture.
2.2. Soil Sampling
In July 2020, seven long-term land-use and restoration plots were selected at the Slope-Following Cultivation Observation Platform of the Huanjiang Karst Ecosystem Observation and Research Station, Chinese Academy of Sciences. These plots included three development-oriented land-use types, namely degraded disturbed land, pasture, and fruit orchard, and four conservation-oriented restoration types, namely planted evergreen forest, planted deciduous forest, evergreen-deciduous mixed forest, and naturally restored forest. These runoff plots are permanent monitoring facilities established at the station for the long-term observation of surface runoff and soil erosion, each hydrologically isolated by solid borders and drained through a runoff-collection system at the footslope; in this study, however, they were used solely as well-characterized land-use/restoration sampling units, and no runoff or soil-erosion data were measured or analyzed. The projected area of each runoff plot was approximately 10 m × 100 m, extending from the footslope to the middle and upper slope positions.
Within each runoff plot, three 10 m × 10 m sampling plots were established at the upper, middle, and lower slope positions. The distance between adjacent sampling plots was not less than 20 m. Within each 10 m × 10 m plot, three sampling points were established. At each sampling point, soil was collected from the 0–10 cm surface layer (after removing the litter layer) using the five-point method within a 3 m × 3 m area, and the subsamples were mixed to form one composite sample. Thus, each land-use/restoration type yielded nine composite soil samples, and a total of 63 soil samples were collected.
Stones and roots were removed within 4 h after sample collection. The soil samples were then passed through a 10-mesh sieve and divided into two portions. One portion was stored at 4 °C for the determination of extracellular enzyme activity, NH4+-N, and NO3−-N. The other portion was air-dried, ground, and passed through 20-mesh and 100-mesh sieves for soil nutrient analyses.
2.3. Determination
2.3.1. Soil Physicochemical Properties, Inorganic Nitrogen, and Enzyme Activities
Soil pH was measured using a pH meter (Leizhi PHS-2F, Leizhi, Shanghai, China) under a soil-to-water ratio of 1:2.5 [33]. Soil organic carbon (SOC) content was determined using the potassium dichromate oxidation–external heating method [34]. Total nitrogen (TN) was determined after semi-micro Kjeldahl digestion, and nitrogen concentration in the digest was measured using a flow injection analyzer (AA3HR, SEAL Analytical, Norderstedt, Germany) [35,36]. Total phosphorus (TP) was determined after NaOH alkali fusion and molybdenum–antimony color development, and absorbance was measured at 880 nm using a UV-visible spectrophotometer (Lambda 60, PerkinElmer, Springfield, IL, USA) [37]. Soil NH4+-N and NO3−-N were extracted with KCl solution, and their concentrations were determined using a flow injection analyzer (AA3HR, SEAL Analytical, Norderstedt, Germany) [38]. Exchangeable calcium (ExCa) and magnesium (ExMg) were extracted with 1 mol·L−1 ammonium acetate solution (pH 7.0) and determined using atomic absorption spectrophotometry [39]. Available phosphorus (AP, Olsen-P) was extracted with NaHCO3 solution and determined using the molybdenum–antimony colorimetric method at 880 nm [40]. Microbial biomass nitrogen (MBN) was determined using the chloroform fumigation-extraction method and calculated using a conversion factor of K-N = 0.45 [36]. Using p-nitrophenyl phosphate disodium (p-NPP) as a substrate, alkaline phosphatase (ALP) activity was determined after incubation under alkaline buffer conditions [41]. The results are expressed in μmol·g−1·h−1. β-1,4-N-acetylglucosaminidase (NAG) and leucine aminopeptidase (LAP) activities were determined using the MUB fluorometric method [41]. One gram of fresh soil was weighed into a 500 mL sterile bottle, and 125 mL of sodium acetate buffer for NAG or sodium bicarbonate buffer for LAP was added to prepare a soil suspension. A 200 μL aliquot of the soil suspension was dispensed into a 96-well microplate, mixed with 50 μL of 200 μmol·L−1 substrate solution, and incubated in the dark at 20 °C for 4 h. The reaction was terminated by adding 10 μL of 1 mol·L−1 NaOH. Fluorescence was measured using a microplate reader (Synergy H4, BioTek, Winooski, VT, USA) at 365 nm excitation and 450 nm emission, and enzyme activities were expressed as μmol·g−1·h−1. Soil bulk density was determined using the ring-knife method [42].
2.3.2. Gross Nitrogen Mineralization Rate
Gross ammonification, gross nitrification, and total nitrogen mineralization rates were determined using the 15N isotope dilution method [43]. A tracer solution (1 mL; 1 mmol·L−1; 99.8 atom% 15NH4Cl or Na15NO3) was added to 7 g of fresh mineral soil, and the samples were incubated at 20 °C. After 2 h of incubation, one subsample was extracted with 35 mL of 2 mol·L−1 KCl solution by shaking for 1 h to determine the initial isotope enrichment and inorganic N concentration. After 26 h of incubation, the remaining subsample was extracted using the same procedure. The concentrations of NH4+ and NO3− in the extracts were determined colorimetrically using a flow injection analyzer (FIU-300; Jasco, Tokyo, Japan). After NH4+ and NO3− were converted to N2O, 15N atom% was determined using gas chromatography–mass spectrometry (GC-MS) [44]. Gross ammonification, gross nitrification, total nitrogen mineralization, NH4+ consumption, and NO3− consumption rates were calculated according to the equations described in [45]. Gross nitrogen transformation rates were expressed as mg N kg−1 dry soil d−1.
2.4. Data Processing
All statistical analyses were performed using R (v4.3.1, R Core Team, Vienna, Austria, 2023) and Origin (v2022, OriginLab, Hampton, MA, USA). Spearman’s rank correlation analysis was used to examine pairwise associations among soil physicochemical properties, nitrogen mineralization rates, and phosphorus availability, and the results were visualized as correlation heatmaps using the “corrplot” package in R [46]. Principal component analysis (PCA) was used to summarize overall differences in soil properties among plot types. Variance partitioning analysis (VPA) was performed using the “vegan” package in R [47] to quantitatively assess the relative contributions of biotic factors (enzyme activity, microbial biomass nitrogen, etc.) and abiotic factors (pH, SOC, TN, etc.) to the variation in soil available phosphorus. To screen soil indicators associated with differences among plot types, Orthogonal Partial Least Squares Discriminant Analysis (OPLS-DA) and Partial Least Squares Discriminant Analysis (PLS-DA) were performed using the MetaboAnalyst 4.0 platform [48]. The models were validated using score plots, Variable Importance in Projection (VIP) plots, and cross-validation. RDA was performed using Origin (v2022) to examine associations between environmental variables (pH, SOC, TN, TP, ExCa, etc.) on soil nitrogen mineralization rates. Before random forest modelling, potential outliers were screened using the Isolation Forest algorithm [49], and four samples were excluded from the random forest analysis. Subsequently, 17 soil physicochemical and biochemical indicators were incorporated into random forest regression models using 5-fold cross-validation [50]. This model was used to evaluate predictive relationships between soil variables and nitrification, ammonification, and total mineralization rates, and feature importance scores were used to rank variables with relatively high predictive importance for nitrogen mineralization.
3. Results
3.1. Soil Physicochemical Properties and Enzyme Activities Among Land-Use/Restoration Plot Types
Soil physicochemical properties and enzyme activities differed among the seven land-use/restoration plot types (Table 2). Conservation-oriented restoration plots generally had significantly higher SOC and TN than development-oriented plots (p < 0.05, Duncan’s test). Specifically, naturally restored forest showed the highest SOC (57.53 ± 3.04 g·kg−1), which was significantly higher than that of all three development-oriented plots (47.91–48.37 g·kg−1) (p < 0.05).
Table 2.
Basic physical and chemical properties of soil under different land use and ecological restoration models.
Total phosphorus (TP) showed a different pattern from SOC and TN. Development-oriented plots generally had higher TP than conservation-oriented plots, while AP did not follow the same trend. AP was relatively high in pasture, planted deciduous forest, and naturally restored forest, but relatively low in degraded disturbed land, fruit orchard, planted evergreen forest, and evergreen-deciduous mixed forest. This indicates that TP and AP showed different patterns among plot types.
The inorganic nitrogen forms also differed among plot types. NH4+-N was relatively high in planted evergreen forest, planted deciduous forest, and evergreen-deciduous mixed forest, whereas fruit orchard and naturally restored forest showed lower NH4+-N values. NO3−-N was highest in planted deciduous forest and was also relatively high in fruit orchard, planted evergreen forest, and evergreen-deciduous mixed forest. Soil pH remained within a weakly alkaline range across all plot types, ranging from 7.23 ± 0.10 in pasture to 7.78 ± 0.16 in naturally restored forest.
Microbial biomass nitrogen (MBN) and extracellular enzyme activities also varied among plot types. MBN was relatively high in pasture, evergreen-deciduous mixed forest, and naturally restored forest, but lower in fruit orchard. Enzyme activities showed plot-specific patterns. ALP was relatively high in planted deciduous forest and evergreen-deciduous mixed forest, while NAG and LAP were generally higher in conservation-oriented restoration plots than in development-oriented plots. These patterns suggest that conservation-oriented restoration plots were associated with improved soil C and N status and higher microbial biochemical activity within this experimental platform.
Principal component analysis (PCA) was performed on 20 soil physicochemical and biochemical parameters to summarize overall variation among plot types (Figure 3). The first two principal components accounted for 47.7% of the total variance, with PC1 contributing 29.0% and PC2 contributing 18.7%. The first six principal components accounted for 83.5% of the total variance. The variables with relatively large positive loadings on PC1 included the soil C/P ratio, N/P ratio, LAP, NAG, and ALP, whereas TP had a relatively large negative loading. This suggests that PC1 mainly reflected variation in nutrient stoichiometry and extracellular enzyme activity. PC2 was mainly associated with ExCa, SOC, the C/N ratio, ammonification rate, and NO3−-N, indicating that this axis represented a gradient related to organic matter accumulation and nitrogen transformation indicators.
Figure 3.
Principal Component Analysis (PCA) of Soil Properties among Different Land Use Types.
Samples from different plot types showed partial separation in the PCA ordination. Degraded disturbed land samples were mainly distributed near the TP vector, consistent with their relatively high TP but lower AP and weaker soil biochemical indicators. Fruit orchard samples showed greater dispersion, suggesting higher within-type variability in soil properties. Among conservation-oriented restoration plots, planted evergreen forest samples were associated with ALP, LAP, NAG, and NH4+-N vectors, while naturally restored forest and evergreen-deciduous mixed forest tended toward the positive direction of PC1. Overall, the PCA results showed that soil physicochemical and biochemical properties differed among the seven land-use/restoration plot types, but the ordination results should be interpreted as exploratory patterns rather than evidence of causal separation. The deviations and Levene’s test results for soil properties under different land use types is shown in Table 3.
Table 3.
Standard deviations and Levene’s test results for soil properties under different land use types.
3.2. Gross Nitrogen Mineralization Rates Among Land-Use/Restoration Plot Types
Gross nitrogen mineralization indicators varied among the land-use/restoration plot types (Figure 4). At the broad group level, development-oriented and conservation-oriented plots showed overlapping variation in gross nitrification and total nitrogen mineralization rates (Figure 4a,e). However, the conservation-oriented plots showed relatively lower within-group variation in gross ammonification rate (Figure 4c), suggesting more consistent ammonification indicators among the restoration plots.
Figure 4.
Characteristics of nitrogen ammonification, nitrification and total mineralization rate under different land use patterns. (a) Soil nitrification rate under two land use types (b) Soil nitrification rate of seven sample groups (I–VII) (c) Soil ammonification rate under two land use types (d) Soil ammonification rate of seven sample groups (I–VII) (e) Total soil nitrogen mineralization rate under two land use types (f) Total soil nitrogen mineralization rate of seven sample groups.
Among the seven specific plot types, gross nitrification showed clear plot-level differences (Figure 4b). The naturally restored forest showed the highest gross nitrification rate, followed by fruit orchard, degraded disturbed land, and evergreen-deciduous mixed forest. In contrast, planted evergreen forest and planted deciduous forest showed relatively low gross nitrification rates. Gross ammonification also differed among plot types (Figure 4d). Negative values were observed in degraded disturbed land, suggesting weak ammonification activity or a possible shift toward immobilization under this plot condition. Other plot types generally showed positive gross ammonification rates, although the magnitude varied among them.
Total nitrogen mineralization generally followed a pattern similar to gross nitrification (Figure 4f). Naturally restored forest and fruit orchard showed relatively high total nitrogen mineralization rates, whereas planted evergreen forest and planted deciduous forest showed lower values. These results indicate that differences in total nitrogen mineralization were largely consistent with variation in gross nitrification among plot types.
Soil available phosphorus (AP) also varied among plot types (Figure 5). Among the development-oriented plots, pasture showed the highest AP level, whereas degraded disturbed land and fruit orchard showed lower AP values. Among the conservation-oriented plots, planted deciduous forest and naturally restored forest showed relatively high AP levels, while planted evergreen forest and evergreen-deciduous mixed forest showed lower values. The relatively large error bar in planted deciduous forest suggests considerable within-type variation in AP.
Figure 5.
Characteristics of available phosphorus accumulation in different land use patterns.
Therefore, the differences in nitrogen transformation indicators should be interpreted together with both mean patterns and within-type variability. Overall, naturally restored forest showed relatively high gross nitrification, total nitrogen mineralization, and AP indicators, whereas degraded disturbed land showed weaker ammonification activity and lower AP. These patterns suggest that nitrogen transformation and phosphorus availability differed among the long-term land-use/restoration plot types within this experimental platform.
3.3. Multivariate Patterns of Soil Properties and Plot-Type Separation
PLS-DA and OPLS-DA were used as complementary exploratory analyses to evaluate whether soil indicators showed separation patterns among the seven land-use/restoration plot types [48] (Figure 6). In the PLS-DA score plot, the first component explained 53.9% of the variation in the independent variables, while the second component explained 18.0%, giving a cumulative explained variation of 71.9% (Figure 6a). Fruit orchard samples tended to separate along the positive direction of the first component, whereas several forest restoration plots showed partial overlap on the negative side of the first component. This pattern suggests that some plot types showed distinguishable soil indicator profiles, although separation among all groups was not complete.
Figure 6.
PLS-DA (a) and OPLS-DA (b) score plots of soil samples from different land-use types.
The OPLS-DA score plot showed a clearer separation pattern for fruit orchard samples along the predictive component (Figure 6b). The first predictive component explained 31.6% of the variation, and the orthogonal component explained 10.3%. Compared with PLS-DA, the OPLS-DA model reduced part of the within-group variation and improved the visualization of between-group separation. However, because OPLS-DA is a supervised classification method, these results should be interpreted as exploratory separation patterns rather than direct evidence of ecological mechanisms.
Permutation tests were used to evaluate model performance (Figure 7). For the PLS-DA model, the R2 intercept was 0.0924 and the Q2 intercept was −0.61 after 200 permutations. For the OPLS-DA model, the R2 intercept was 0.123 and the Q2 intercept was −0.415. The negative Q2 intercepts suggest that the models did not show obvious overfitting in the permutation tests. Therefore, the supervised models captured separation patterns among plot types, but their results were used only as complementary evidence for soil indicator differentiation.
Figure 7.
Permutation test results of PLS-DA (a) and OPLS-DA (b) models.
The VIP analysis was further used to screen variables with relatively high discriminatory importance in the PLS-DA and OPLS-DA models (Figure 8). In both models, microbial biomass nitrogen (MBN) had high VIP values, indicating that MBN contributed strongly to the separation of plot types in the supervised models. Soil C/P ratio, SOC, AP, NO3−-N, and nitrogen mineralization-related indicators also showed relatively high discriminatory importance. These variables are consistent with the observed differences in soil C and N status, phosphorus availability, and nitrogen transformation indicators among plot types.
Figure 8.
Variable Importance in Projection (VIP) scores of PLS-DA (a) and OPLS-DA (b) models.
The VIP rankings should not be interpreted as evidence that these variables causally determined plot-type differences. Rather, they indicate which measured soil indicators contributed most strongly to the supervised classification models. Overall, MBN, SOC, soil C/P ratio, AP, NO3−-N, and selected nitrogen mineralization indicators appeared to be important variables associated with soil property differentiation among the long-term land-use/restoration plots.
3.4. Associations Between Gross Nitrogen Mineralization Rates and Soil Factors
Spearman correlation analysis showed several positive and negative associations among soil physicochemical parameters, enzyme activities, phosphorus availability, and nitrogen mineralization rates [46] (Figure 9). The nitrification rate was positively correlated with the total mineralization rate (r = 0.916), suggesting a close association between these two nitrogen transformation indicators. The ammonification rate was also positively correlated with pH (r = 0.432), suggesting that pH may be associated with variation in ammonification rates. Available phosphorus (AP) was positively correlated with soil organic carbon (SOC) (r = 0.284) and total nitrogen (TN) (r = 0.284), suggesting that AP variation was associated with soil organic matter and nitrogen status. AP showed a positive correlation with alkaline phosphatase activity (ALP, r = 0.652), suggesting a potential association between phosphatase activity and soil P availability. Furthermore, total phosphorus (TP) was positively correlated with SOC (r = 0.354) and TN (r = 0.388), suggesting covariation among soil nutrient pools. Nitrification and ammonification rates were positively correlated with soil ammonium nitrogen (NH4+-N, r = 0.325) and nitrate nitrogen (NO3−-N, r = 0.316), respectively, which is consistent with associations among inorganic N pools and N transformation rates. Overall, soil organic matter, nutrient content, enzyme activity, and pH were associated with variation in phosphorus availability and nitrogen transformation indicators.
Figure 9.
Soil index heat map.
The RDA results showed that the first two axes collectively explained 97.09% of the variation in the three nitrogen mineralization indicators (RDA1 eigenvalue 1.3371, contribution rate 67.47%; RDA2 eigenvalue 0.587, contribution rate 29.62%), indicating that the selected environmental variables accounted for a large proportion of variation in the ordination space (Figure 10).
Figure 10.
The RDA of mineralization indicators and environmental factors.
All three mineralization rate response vectors fall within the negative half-axis of RDA1, but their spatial distributions show some differentiation. The nitrification rate (RDA1 = −2.751, RDA2 = −1.090) and the total mineralization rate (RDA1 = −2.093, RDA2 = −0.808) are nearly coincident (with an angle of only 0.5°), both pointing toward the third quadrant. This suggests that both indicators were aligned with similar environmental gradients, consistent with their strong positive correlation (r = 0.916). The ammonification rate (RDA1 = −1.815, RDA2 = +0.934) leans toward the second quadrant, forming an angle of approximately 48° with the aforementioned two indicators, suggesting that ammonification showed a different association pattern from nitrification and total nitrogen mineralization. ExCa and ExMg were closely aligned with the gross nitrification and total nitrogen mineralization vectors and total mineralization rate, with angles of only 9.4° and 22.7°, respectively, while pH (35.2°) and TN (41.0°) follow closely behind. This pattern may be related to the calcium- and magnesium-rich alkaline background of karst calcareous soils, but the underlying microbial and geochemical processes require further confirmation. The ammonification rate, however, exhibits a distinctly different driving pattern, with the smallest angles observed for TN (7.9°) and TP (20.7°), while ExCa ranks third (39.4°), suggesting that TN and TP were more closely associated with gross ammonification in the RDA ordination.
The NH4+-N vectors (RDA1 = +2.170, RDA2 = +0.918) was nearly opposite to the gross nitrification and total nitrogen mineralization vectors in the RDA ordination (with angles of 178.7° and 178.2°, respectively). This pattern may reflect the balance between NH4+ production and consumption, but it should not be interpreted as direct evidence of a specific biochemical mechanism: Soils with higher gross nitrification rates may have faster NH4+ turnover, maintaining the soil NH4+ pool at a lower steady-state level; conversely, in soils where nitrification is suppressed, NH4+ accumulates due to the lack of rapid conversion pathways. This pattern is consistent with the data shown in Table 2. Natural naturally restored forests exhibit the highest nitrification rate (0.395 mg·kg−1·d−1), yet their NH4+-N content is relatively low (3.41 mg·kg−1), whereas planted evergreen forests have the highest NH4+-N content (4.59 mg·kg−1), yet their nitrification rate was only 0.106 mg·kg−1·d−1.
NAG (130.7°), LAP (137.2°), and ALP (101.2°) were negatively associated with nitrification rates and total mineralization rates in the RDA ordination. This pattern may indicate a possible association between extracellular enzyme activity and substrate limitation, but this interpretation requires further confirmation. High extracellular enzyme activity may reflect greater microbial investment in extracellular enzyme-mediated substrate acquisition. SOC (156.4°) and soil C/N ratios (162.2°) were negatively associated with nitrification rates, suggesting a potential link between organic matter status, C/N balance, and nitrogen mineralization; higher organic carbon availability may be related to microbial nitrogen immobilization, which could influence nitrogen mineralization patterns.
Regarding sample distribution, deciduous forests (light blue) cluster in the second quadrant, consistent with the trends observed for TP and ammonification rates, suggesting that TP was aligned with the ammonification-rate vector in the ordination spaces; Samples from orchard stands (orange) are primarily distributed in the third quadrant, consistent with the direction of the arrows for nitrification rate and total mineralization rate, suggesting that ExCa, ExMg, and pH were associated with the relatively high mineralization indicators observed in orchard plots. Naturally restored forests (light green) are scattered across the fourth quadrant, showing a high degree of overlap with the NAG, LAP, and ALP vectors. This suggests that naturally restored forest was associated with relatively high microbial enzyme activity. However, as mentioned earlier, high enzyme activity may reflect greater extracellular enzyme-mediated organic matter decomposition; the relationship with nitrogen mineralization rates should be interpreted together with substrate quality and other soil properties.
In this study, Random Forest Regressor models were constructed separately for nitrification rate, ammonification rate, and total mineralization rate, and their generalization ability was evaluated using five-fold cross validation [50]. After excluding four samples identified as outliers by the Isolation Forest algorithm [49], 59 samples were included in the random forest analysis. After variable screening, each model retained 12–16 predictors from the initial 17 physicochemical and biochemical indicators. The R2 values for the training sets of all three model groups reached approximately 0.90 (nitrification: 0.899; ammonification: 0.931; total mineralization: 0.898), with cross-validation R2 values of 0.409, 0.399, and 0.420, respectively, indicating moderate predictive performance. The scatter plots of observed versus predicted values for the three models are shown in Figure 11, where the regression lines closely follow the 1:1 reference line, showing good apparent fit in the training sets. Residual diagnostics showed that the prediction errors of the three models were uniformly distributed on both sides of the zero line (Figure 12), with no systematic bias, indicating that the models captured part of the variation in soil nitrogen transformation rates. The lower cross-validation R2 values compared with the training R2 values indicate that model performance should be interpreted cautiously, especially given the relatively small sample size and multiple correlated soil variables. This discrepancy may be related to the limited sample size and collinearity among soil physicochemical indicators.
Figure 11.
Comparison between measured and predicted values of the training dataset for (a) Nitrification rate, (b) Ammonification rate, and (c) N mineralization rate.
Figure 12.
Residual plots of the training dataset for (a) Nitrification rate, (b) Ammonification rate, and (c) N mineralization rate.
3.5. Exploratory Random Forest Analysis of Nitrogen Mineralization Indicators
The feature importance results for the gross nitrification model showed that leucine aminopeptidase (LAP, 23.4%) and ammonium nitrogen (NH4+-N, 21.3%) had relatively high predictive importance, with soil moisture and total nitrogen (TN) contributing to a lesser extent [50] (Figure 13a). As an enzyme involved in organic nitrogen decomposition, the relatively high importance of LAP suggests that enzymatic degradation of organic nitrogen substrates may be associated with variation in gross nitrification rates in karst soils [13,17]. The high predictive importance of NH4+-N is consistent with the association pattern observed in the RDA results, where the NH4+-N vector was nearly opposite to the gross nitrification vector. For example, naturally restored forest had a relatively high gross nitrification rate and relatively low NH4+-N content, whereas planted evergreen forest had higher NH4+-N content and lower gross nitrification rate. This pattern may reflect differences in NH4+ turnover among plot types. These results suggest that gross nitrification rates may be related to both enzymatic substrate supply and NH4+ turnover [13,14].
Figure 13.
Feature importance analysis for the prediction of (a) Nitrification rate, (b) Ammonification rate, and (c) N mineralization rate.
In the gross ammonification model, nitrate nitrogen (NO3−-N, 26.3%) had the highest predictive importance, followed by LAP and β-1,4-N-acetylglucosaminidase (NAG), with exchangeable calcium (ExCa) ranking third [50] (Figure 13b). NO3−-N ranked first in predictive importance in the ammonification model, which is consistent with close associations among nitrogen transformation indicators, especially the strong correlation between gross nitrification and total nitrogen mineralization. The importance of LAP varied among plots, suggesting that gross ammonification may be associated with variation in organic nitrogen substrate availability [13,17]. This is consistent with the relatively high variability of gross ammonification rates observed in some development-oriented plots. The relatively high importance of ExCa is also consistent with the RDA pattern showing an association between ExCa and nitrogen mineralization indicators, suggesting that the calcium-rich alkaline soil environment may be related to variation in nitrogen transformation [6,8].
In the total nitrogen mineralization model, NH4+-N ranked first, with the highest predictive importance of 40.6%, and showed relatively stable importance across the five-fold cross-validation folds [50] (Figure 13c). This suggests that NH4+-N availability was an important predictor of total nitrogen mineralization in the random forest model. Soil moisture and LAP ranked second and third, respectively, suggesting that moisture conditions and proteolytic enzyme activity may be associated with variation in organic nitrogen mineralization [13,17]. The contribution of pH to all three models was relatively limited. Soil pH ranged from 7.23 to 7.78 across the plot types (Table 2), indicating a relatively narrow alkaline range, which may limit its ability to explain differences among plot types in the model. Consequently, microbial and substrate-related variables showed higher predictive importance than pH in the random forest models [50].
Based on the three random forest models, ammonium nitrogen availability and extracellular enzyme activity appeared to be important predictive variables associated with nitrogen transformation in karst soils [13,17,50]. This pattern was generally consistent with differences observed among the land-use/restoration plot types. Conservation-oriented plots, especially naturally restored forest, generally had higher SOC and TN, which may provide more favorable substrate conditions for microbial activity [20,21,22,23,24,25,26]. These plots also showed higher extracellular enzyme activity and microbial biomass indicators and were associated with relatively high gross nitrification rates. In contrast, degraded disturbed land had relatively low SOC and showed lower gross nitrification and gross ammonification indicators. Furthermore, both RDA and random forest analyses suggested negative associations between NAG/LAP activities and mineralization indicators, which may reflect greater microbial investment in extracellular enzyme-mediated substrate acquisition [17,18]. Relatively high extracellular enzyme activity may indicate stronger microbial demand for enzyme-mediated nutrient acquisition under limited substrate availability, but this interpretation requires further confirmation [17,18,19].
4. Discussion
4.1. Restoration-Associated Differences in Soil Carbon, Nitrogen, and Enzyme Activity
The results revealed clear differences in soil nutrient status and biochemical indicators among the seven long-term land-use and restoration plot types. Conservation-oriented restoration plots generally had significantly higher SOC and TN than development-oriented plots (p < 0.05, Duncan’s test). Specifically, naturally restored forest showed the highest SOC (57.53 ± 3.04 g·kg−1), which was significantly higher than that of all three development-oriented plots (47.91–48.37 g·kg−1) (p < 0.05). This pattern is consistent with previous studies reporting that vegetation restoration in karst areas can promote organic matter accumulation and improve soil nutrient status through increased litter input, root turnover, and reduced surface disturbance [51,52,53]. In karst ecosystems, shallow soil layers and high rock exposure can restrict soil development and nutrient retention. As a result, changes in organic matter input may play a particularly important role in soil recovery [51,52].
The higher SOC and TN in conservation-oriented plots may provide a more favorable substrate environment for microbial activity and extracellular enzyme production. Previous studies have shown that soil nitrogen mineralization is influenced by substrate availability, microbial biomass, enzyme activity, soil moisture, temperature, and pH [54,55,56]. In the present study, microbial biomass nitrogen and enzyme activities also differed significantly among plot types (p < 0.05). For example, NAG and LAP activities in conservation-oriented plots (0.05–0.08 and 0.04–0.06 μmol·g−1·h−1, respectively) were significantly higher than those in development-oriented plots (0.03–0.05 and 0.03–0.04 μmol·g−1·h−1) (p < 0.05), suggesting that long-term restoration history may be associated with shifts in microbial nutrient acquisition and soil biochemical functioning [57,58]. However, these patterns should be interpreted as plot-scale associations rather than direct evidence that restoration alone caused the observed changes. Historical disturbance intensity, vegetation composition, and management practices may also have contributed to the differences among plots.
Development-oriented plots, especially degraded disturbed land (SOC = 47.91 ± 3.04 g·kg−1) and fruit orchard (SOC = 48.24 ± 2.33 g·kg−1), showed significantly lower SOC values than the naturally restored forest (57.53 ± 3.04 g·kg−1) (p < 0.05). This pattern may reflect lower organic matter inputs, stronger management disturbance, or weaker vegetation-mediated nutrient accumulation [59,60]. However, pasture showed significantly higher AP (15.87 ± 1.81 mg·kg−1) than degraded disturbed land (8.90 ± 0.63 mg·kg−1) and fruit orchard (10.49 ± 0.95 mg·kg−1) (p < 0.05), indicating that nutrient responses did not follow a simple conservation versus development contrast. Therefore, the ecological interpretation should focus on differences among specific plot types, rather than assuming that all conservation-oriented or development-oriented plots respond in the same way [57,59].
4.2. Gross Nitrogen Mineralization Differed Mainly Through Nitrification-Related Variation
Gross nitrogen mineralization provides insight into nitrogen transformation processes that cannot be fully inferred from net inorganic nitrogen pools. Changes in NH4+-N or NO3−-N concentrations represent the net outcome of concurrent production and consumption processes, and therefore may obscure the underlying turnover dynamics. In contrast, gross mineralization better reflects the balance among organic nitrogen decomposition, ammonium release, and subsequent nitrification [13,45]. In the present study, nitrification rate was strongly and positively correlated with total nitrogen mineralization rate (r = 0.916, p < 0.001), indicating that differences in total mineralization were closely linked to nitrification-related nitrogen turnover [13,14,16].
Naturally restored forest exhibited the highest gross nitrification rate (0.395 mg·kg−1·d−1), which was significantly higher than that of planted evergreen forest (0.106 mg·kg−1·d−1) and planted deciduous forest (0.091 mg·kg−1·d−1) (p < 0.05). In contrast, degraded disturbed land showed significantly lower nitrogen transformation activity (p < 0.05). This pattern is likely associated with the higher SOC, TN, microbial biomass, and enzyme activities observed in the restoration plots [53,54]. These soil properties may provide more favorable substrate and biological conditions for microbial nitrogen transformation [13,17,56]. Nevertheless, the present data do not allow direct identification of the microbial taxa or functional genes responsible for these processes. Therefore, the higher nitrification indicators in naturally restored forest should be interpreted as evidence of greater nitrogen transformation potential under the measured soil conditions, rather than as direct proof of a specific microbial mechanism.
The relatively low or negative gross ammonification rate observed in degraded disturbed land (p < 0.05 compared with naturally restored forest) may reflect weak organic nitrogen mineralization, or a shift toward immobilization under this plot condition. This interpretation is consistent with the significantly lower SOC status of degraded disturbed land (47.91 ± 3.04 g·kg−1) relative to conservation-oriented plots (50.83–57.53 g·kg−1) (p < 0.05) [13,54,55]. However, ammonification is highly sensitive to substrate quality, microbial nitrogen demand, and local soil heterogeneity [17,56].
4.3. Associations Between Nitrogen Transformation and Phosphorus Availability
The relationship between nitrogen mineralization and phosphorus availability is central to the ecological interpretation of this study. In calcareous karst soils, total phosphorus does not necessarily reflect plant-available phosphorus, because phosphate may be immobilized through adsorption or precipitation with calcium-rich minerals [6,61]. This may explain why development-oriented plots had significantly higher TP (1.09–1.15 g·kg−1) than conservation-oriented plots (0.79–0.85 g·kg−1) (p < 0.05), yet did not consistently show higher AP. Therefore, AP is a more relevant indicator for evaluating short-term phosphorus availability in the present soil conditions [9,40].
The significant positive correlation between AP and ALP (r = 0.652, p < 0.001) suggests that phosphatase-mediated organic phosphorus turnover may contribute to phosphorus availability. This interpretation is consistent with previous studies showing that soil phosphatase activity is closely related to microbial nutrient demand and phosphorus cycling [18,58,62]. However, this study did not measure phosphorus fractions, phoD abundance, or microbial community composition. As a result, the observed AP–ALP relationship can only support a potential association between enzyme activity and phosphorus availability. It does not directly demonstrate the biochemical pathway of phosphorus transformation.
The significant positive correlations of AP with SOC (r = 0.284, p < 0.05) and TN (r = 0.284, p < 0.05) further suggest that phosphorus availability may be linked to soil organic matter accumulation and overall nutrient status. Organic matter can provide substrates for microbial activity and enzyme production, while nitrogen availability may influence microbial investment in phosphorus acquisition [56,58]. This interpretation is consistent with the broader ecological understanding that nitrogen and phosphorus cycles are connected through plant and microbial nutrient demand [62,63,64]. In this study, the association between gross nitrogen mineralization and AP should therefore be interpreted as a coupled nutrient pattern, rather than evidence that nitrogen mineralization directly promoted phosphorus release.
Random forest and RDA results further indicated that substrate-related and microbial indicators had relatively high explanatory or predictive importance, whereas pH showed a weaker contribution. This may be partly because soil pH varied within a narrow alkaline range (7.23–7.78) among the plot types, with no significant difference between the overall means of development-oriented (7.51 ± 0.22) and conservation-oriented plots (7.52 ± 0.17) (p > 0.05). In calcareous karst soils, strong buffering capacity may reduce the statistical contribution of pH compared with SOC, inorganic nitrogen, enzyme activity, and microbial biomass [6,65]. Nevertheless, variable importance from random forest analysis and ordination patterns from RDA should be regarded as exploratory evidence [47,50].
Taken together, the patterns can be read along the restoration trajectory of the seven plots, from degraded disturbed land to naturally restored forest. Recovery of woody vegetation most advanced in the naturally restored forest coincided with the highest SOC (57.53 g·kg−1), microbial biomass nitrogen, and NAG/LAP activities, and with the highest gross nitrification (0.395 mg·kg−1·d−1) and total nitrogen mineralization; degraded disturbed land, with the lowest SOC, showed the weakest, at times negative, ammonification, consistent with immobilization. Available phosphorus followed the same organic-matter- and enzyme-mediated pathway rather than total phosphorus, tracking alkaline phosphatase (r = 0.652), SOC, and total nitrogen. These coupled nitrogen–phosphorus patterns are best interpreted as plot-scale associations along the restoration gradient, not as direct causal effects.
4.4. Implications and Limits of Inference for Karst Restoration
The results suggest that long-term restoration plots, particularly naturally restored forest, showed significantly higher SOC, TN, and gross nitrification rates than degraded disturbed land (p < 0.05), suggesting improved soil C and N status and higher nitrogen transformation potential within the Huanjiang karst experimental platform. These findings have implications for the restoration of karst rocky desertification areas, where nutrient recovery is an important constraint on vegetation establishment and ecosystem stability [20,21,22,23,24,25,26]. Increasing organic matter inputs and maintaining continuous vegetation cover may therefore contribute to improved soil nutrient cycling in degraded karst landscapes [51,52,53].
However, the inference of this study should remain at the plot scale. Although the seven plot types represent contrasting land-use and restoration trajectories, they were all located within the same long-term karst experimental platform. Potential spatial dependence, slope-position effects, and edge effects cannot be fully excluded. In addition, detailed annual management records were not available for all plots, and historical disturbance intensity may have shaped current soil properties. Therefore, the observed differences should be interpreted as associations among long-term plot types, rather than as general land-use effects that can be directly extrapolated to all karst regions.
Several methodological limitations should also be acknowledged. First, this study measured soil physicochemical properties, enzyme activities, and gross nitrogen mineralization, but did not directly examine microbial community composition, nitrifier abundance, phoD genes, or phosphorus fractions [10,19,66]. This limits the ability to identify specific microbial or biochemical mechanisms. Second, the study was based on a single sampling period, and therefore did not capture seasonal variation in soil moisture, temperature, and microbial activity [15,54]. Third, the multivariate and random forest analyses were used to explore patterns and predictive relationships, rather than to infer direct causal control [47,48,49,50]. Future studies should include replicated independent karst sites, seasonal sampling, microbial functional gene analysis, and phosphorus fractionation to test whether the associations observed here are consistent across broader spatial and temporal scales [61,63]. Fourth, reduced soil erosion is a plausible contributing mechanism to the higher SOC, TN, and nitrogen-transformation indicators observed in conservation-oriented restoration plots [1,2,55], but this pathway could not be quantitatively evaluated with the present dataset. Future studies integrating runoff or erosion monitoring with gross nitrogen-transformation measurements at this platform would help clarify the contribution of erosion control to nitrogen retention during karst restoration. The same erosional pathway may also affect phosphorus availability: because available P in these soils was associated with SOC, TN, and alkaline phosphatase activity rather than total P, the preferential loss of fine, organic-matter-rich particles would be expected to reduce the organic, phosphatase-mediated P supply more than the total P stock.
5. Conclusions
This study investigated soil nutrient status, extracellular enzyme activity, gross nitrogen mineralization, and phosphorus availability across seven long-term land-use and restoration plots in a karst ecosystem. The main conclusions are as follows:
- (1)
- Soil carbon and nitrogen status differed among the seven plot types. Conservation-oriented restoration plots, especially naturally restored forest and some planted forest plots, generally showed higher SOC, TN, microbial biomass, and extracellular enzyme activity than development-oriented plots. This suggests that long-term vegetation recovery was associated with improved soil biochemical conditions within the Huanjiang karst experimental platform.
- (2)
- Gross nitrogen mineralization varied among plot types, with differences mainly reflected in nitrification-related indicators. Naturally restored forest showed relatively high gross nitrification and total nitrogen mineralization indicators, whereas degraded disturbed land showed weaker nitrogen transformation indicators. The strong positive correlation between gross nitrification rate and total nitrogen mineralization rate suggests that variation in total nitrogen mineralization was closely associated with nitrification-related turnover.
- (3)
- Phosphorus availability was associated with soil biochemical properties. Available phosphorus was positively correlated with alkaline phosphatase activity, SOC, and TN, suggesting that phosphorus availability in these calcareous karst soils may be linked to organic matter accumulation and enzyme-mediated phosphorus turnover. However, because phosphorus fractions, phoD abundance, and microbial community composition were not measured, this relationship should be interpreted as a potential association rather than direct evidence of a specific phosphorus transformation mechanism.
- (4)
- The multivariate and random forest analyses suggested that substrate-related and microbial indicators had relatively high explanatory or predictive importance, whereas pH contributed less under the narrow alkaline range observed in this study. These results suggest that soil organic matter, inorganic nitrogen, microbial biomass, and enzyme activity may be useful indicators for evaluating nutrient cycling differences among long-term karst restoration plots.
Overall, long-term land-use and restoration plots differed in soil nitrogen transformation and phosphorus availability within this karst experimental platform. Maintaining vegetation cover and increasing organic matter inputs may help improve soil nutrient cycling in degraded karst landscapes. Future studies should include replicated independent karst sites, seasonal sampling, microbial functional gene analysis, and phosphorus fractionation to further test the processes linking nitrogen mineralization and phosphorus availability.
Author Contributions
Writing—original draft, Writing—review and editing., Y.S.; Writing—original draft, Visualization, Validation, J.Y.; Investigation, Y.H. and J.L.; Validation, K.D.; Project administration, Funding acquisition, D.W.; and Conceptualization, Methodology, Visualization, K.D. All authors have read and agreed to the published version of the manuscript.
Funding
This research was funded by the Guangxi Natural Science Foundation (grant number: 2025GXNSFDA069043), the Guangxi Key Research and Development Program (grant number: GuikeAB24010118), Natural Science Foundation of China (grant number: 52260023), and the Guangxi Talent Hub for Novel Materials and Equipment in Aquatic Ecosystem Restoration.
Institutional Review Board Statement
Not applicable.
Informed Consent Statement
Not applicable.
Data Availability Statement
The data that support the findings of this study are available from the corresponding author upon reasonable request.
Conflicts of Interest
The authors declare no conflicts of interest.
References
- Jing, J.; Li, R.; Xiong, L.; Tang, Z. Binary response of runoff generation and erosion processes to karst vegetation-soil-rock structure and its hydrodynamic mechanisms. J. Hydrol. 2025, 647, 132319. [Google Scholar] [CrossRef] [Scilit]
- Peng, X.; Dai, Q.; Ding, G.; Li, C. Role of underground leakage in soil, water and nutrient loss from a rock-mantled slope in the karst rocky desertification area. J. Hydrol. 2019, 578, 124086. [Google Scholar] [CrossRef] [Scilit]
- Zhang, J.; Wang, S.; Fu, Z.; Chen, H.; Wang, K. Soil thickness controls the rainfall-runoff relationship at the karst hillslope critical zone in southwest China. J. Hydrol. 2022, 609, 127779. [Google Scholar] [CrossRef] [Scilit]
- Jiao, M.; Yan, J.; Zhao, Y.; Xia, T.; Shen, K.; He, Y. Dominance of rock exposure and soil depth in leaf trait networks outweighs soil quality in karst limestone and dolomite habitats. For. Ecosyst. 2024, 11, 100220. [Google Scholar] [CrossRef] [Scilit]
- Lin, Z.; Huang, Z.; Wang, M.; Xiang, H.; Chen, Y.; Lu, S. Soil nutrient profiles in three types of rocky fissure network habitats of typical karst formations in China: A Maolan World Heritage perspective. Forests 2024, 15, 2101. [Google Scholar] [CrossRef] [Scilit]
- Geng, Y.; Pan, S.; Zhang, L.; Qiu, J.; He, K.; Gao, H.; Li, Z.; Tian, D. Phosphorus biogeochemistry regulated by carbonates in soil. Environ. Res. 2022, 214, 113894. [Google Scholar] [CrossRef] [Scilit] [PubMed]
- Elser, J.J.; Bracken, M.E.S.; Cleland, E.E.; Gruner, D.S.; Harpole, W.S.; Hillebrand, H.; Ngai, J.T.; Seabloom, E.W.; Shurin, J.B.; Smith, J.E. Global analysis of nitrogen and phosphorus limitation of primary producers in freshwater, marine and terrestrial ecosystems. Ecol. Lett. 2007, 10, 1135–1142. [Google Scholar] [CrossRef] [Scilit] [PubMed]
- Vitousek, P.M. Terrestrial phosphorus limitation: Mechanisms, implications, and nitrogen-phosphorus interactions. Ecol. Appl. 2010, 20, 5–15. [Google Scholar] [CrossRef] [Scilit] [PubMed]
- Ziadi, N.; Whalen, J.K.; Messiga, A.J.; Morel, C. Assessment and modeling of soil available phosphorus in sustainable cropping systems. Adv. Agron. 2013, 122, 85–126. [Google Scholar] [CrossRef] [Scilit]
- Wang, Y.; Huang, R.; Xu, G.; Li, J.; Wang, Z.; Ci, E.; Gao, M. Soil alkaline phosphatase activity and bacterial phoD gene abundance and diversity under regimes of inorganic fertilizer reduction with straw. J. Soils Sediments 2021, 21, 388–402. [Google Scholar] [CrossRef]
- Li, J.; Xie, T.; Zhu, H.; Zhou, J.; Li, C.; Xiong, W.; Xu, L.; Wu, Y.; He, Z.; Li, X. Alkaline phosphatase activity mediates soil organic phosphorus mineralization in a subalpine forest ecosystem. Geoderma 2021, 404, 115376. [Google Scholar] [CrossRef] [Scilit]
- Margalef, O.; Sardans, J.; Fernández-Martínez, M.; Molowny-Horas, R.; Janssens, I.A.; Ciais, P.; Goll, D.; Richter, A.; Obersteiner, M.; Asensio, D.; et al. Global patterns of phosphatase activity in natural soils. Sci. Rep. 2017, 7, 1337. [Google Scholar] [CrossRef] [Scilit]
- Booth, M.S.; Stark, J.M.; Rastetter, E. Controls on nitrogen cycling in terrestrial ecosystems: A synthetic analysis of literature data. Ecol. Monogr. 2005, 75, 139–157. [Google Scholar] [CrossRef] [Scilit]
- Elrys, A.S.; Ali, A.; Zhang, H.; Cheng, Y.; Zhang, J.; Cai, Z.C.; Müller, C.; Chang, S.X. Patterns and drivers of global gross nitrogen mineralization in soils. Glob. Chang. Biol. 2021, 27, 5950–5962. [Google Scholar] [CrossRef] [Scilit] [PubMed]
- Dai, Z.; Yu, M.; Chen, H.; Zhao, H.; Huang, Y.; Su, W.; Xia, F.; Chang, S.X.; Brookes, P.C.; Dahlgren, R.A.; et al. Elevated temperature shifts soil N cycling from microbial immobilization to enhanced mineralization, nitrification and denitrification across global terrestrial ecosystems. Glob. Chang. Biol. 2020, 26, 5267–5276. [Google Scholar] [CrossRef] [Scilit]
- Zhang, X.; Ward, B.B.; Sigman, D.M. Global nitrogen cycle: Critical enzymes, organisms, and processes for nitrogen budgets and dynamics. Chem. Rev. 2020, 120, 5308–5351. [Google Scholar] [CrossRef] [Scilit] [PubMed]
- Sinsabaugh, R.L.; Lauber, C.L.; Weintraub, M.N.; Ahmed, B.; Allison, S.D.; Crenshaw, C.; Contosta, A.R.; Cusack, D.; Frey, S.; Gallo, M.E.; et al. Stoichiometry of soil enzyme activity at global scale. Ecol. Lett. 2008, 11, 1252–1264. [Google Scholar] [CrossRef] [Scilit]
- Wang, Y.; Shahbaz, M.; Zhran, M.; Chen, A.; Zhu, Z.; Galal, Y.G.M.; Ge, T.; Li, Y. Microbial resource limitation in aggregates in karst and non-karst soils. Agronomy 2021, 11, 1591. [Google Scholar] [CrossRef] [Scilit]
- Chen, H.; Li, D.; Mao, Q.; Xiao, K.; Wang, K. Resource limitation of soil microbes in karst ecosystems. Sci. Total Environ. 2019, 650, 241–248. [Google Scholar] [CrossRef] [Scilit]
- Zhang, Y.; Xu, X.; Li, Z.; Liu, M.; Xu, C.; Zhang, R.; Luo, W. Effects of vegetation restoration on soil quality in degraded karst landscapes of southwest China. Sci. Total Environ. 2019, 650, 2657–2665. [Google Scholar] [CrossRef] [Scilit] [PubMed]
- Guan, H.; Fan, J. Effects of vegetation restoration on soil quality in fragile karst ecosystems of southwest China. PeerJ 2020, 8, e9456. [Google Scholar] [CrossRef] [Scilit] [PubMed]
- Pang, D.; Cao, J.; Dan, X.; Guan, Y.; Peng, X.; Cui, M.; Wu, X.; Zhou, J. Recovery approach affects soil quality in fragile karst ecosystems of southwest China: Implications for vegetation restoration. Ecol. Eng. 2018, 123, 151–160. [Google Scholar] [CrossRef] [Scilit]
- Lu, Z.X.; Wang, P.; Ou, H.B.; Wei, S.X.; Wu, L.C.; Jiang, Y. Effects of different vegetation restoration on soil nutrients, enzyme activities, and microbial communities in degraded karst landscapes in southwest China. For. Ecol. Manag. 2022, 508, 120002. [Google Scholar] [CrossRef] [Scilit]
- Ou, H.B.; Liu, X.S.; Wei, S.X.; Jiang, Y.; Gao, F.; Wang, Z.H.; Fu, W.; Du, H. The effects of different vegetation restoration models on soil quality in karst areas of Southwest China. Forests 2024, 15, 1061. [Google Scholar] [CrossRef] [Scilit]
- Gao, L.; Wang, W.; Liao, X.; Tan, X.; Yue, J.; Zhang, W.; Wu, J.; Willison, J.H.M.; Tian, Q.; Liu, Y. Soil nutrients, enzyme activities, and bacterial communities in varied plant communities in karst rocky desertification regions in Wushan County, Southwest China. Front. Microbiol. 2023, 14, 1180562. [Google Scholar] [CrossRef] [Scilit] [PubMed]
- Wu, J.; Gong, X.; Shu, Y. Effects of vegetation restoration in karst areas on soil nitrogen mineralisation. PeerJ 2024, 12, e18582. [Google Scholar] [CrossRef] [Scilit] [PubMed]
- Shi, X.Z.; Yu, D.S.; Warner, E.D.; Sun, W.X.; Petersen, G.W.; Gong, Z.T.; Lin, H. Cross-reference system for translating between genetic soil classification of China and soil taxonomy. Soil Sci. Soc. Am. J. 2006, 70, 78–83. [Google Scholar]
- Meng, Q.; Wang, S.; Fu, Z.; Deng, Y.; Chen, H. Soil types determine vegetation communities along a toposequence in a dolomite peak-cluster depression catchment. Plant Soil 2022, 475, 5–22. [Google Scholar] [CrossRef] [Scilit]
- Pan, F.J.; Liang, Y.M.; Ma, J.M.; Yang, Z.Q.; Ling, T.W.; Li, M.J.; Lu, S.H.; Zhong, F.Y. Stand age and density affected litter nutrient changes in planted Pinus massoniana forests. Guihaia 2020, 40, 237–246. [Google Scholar]
- Pan, F.J.; Liang, Y.M.; Wang, K.L.; Zhang, W. Responses of fine root functional traits to soil nutrient limitations in a karst ecosystem of southwest China. Forests 2018, 9, 743. [Google Scholar] [CrossRef] [Scilit]
- Zhang, X.; Wang, K.L.; Fu, Z.Y.; Chen, H.S.; Zhang, W.; Shi, Z.H. Hydrological characteristics of calcareous soil with contrasting architecture on dolomite slope of northwest Guangxi. Chin. J. Appl. Ecol. 2017, 28, 2186–2196. [Google Scholar] [CrossRef]
- IUSS Working Group WRB. World Reference Base for Soil Resources 2022. In International Soil Classification System for Naming Soils and Creating Legends for Soil Maps, 4th ed.; International Union of Soil Sciences (IUSS): Vienna, Austria, 2022. [Google Scholar]
- Thomas, G.W. Soil pH and Soil Acidity. In Methods of Soil Analysis, Part 3—Chemical Methods; Sparks, D.L., Ed.; SSSA Book Series No. 5; Soil Science Society of America: Madison, WI, USA, 1996; pp. 475–490. [Google Scholar] [CrossRef] [Scilit]
- Walkley, A.; Black, I.A. An examination of the Degtjareff method for determining soil organic matter, and a proposed modification of the chromic acid titration method. Soil Sci. 1934, 37, 29–38. [Google Scholar] [CrossRef] [Scilit]
- Bremner, J.M. Nitrogen-Total. In Methods of Soil Analysis, Part 3—Chemical Methods; Sparks, D.L., Ed.; SSSA Book Series No. 5; Soil Science Society of America: Madison, WI, USA, 1996; pp. 1085–1121. [Google Scholar] [CrossRef] [Scilit]
- Brookes, P.C.; Landman, A.; Pruden, G.; Jenkinson, D.S. Chloroform fumigation and release of soil nitrogen: A rapid direct extraction method to measure microbial biomass nitrogen in soil. Soil Biol. Biochem. 1985, 17, 837–842. [Google Scholar] [CrossRef] [Scilit]
- Olsen, S.R.; Sommers, L.E. Phosphorus. In Methods of Soil Analysis, Part 2—Chemical and Microbiological Properties, 2nd ed.; Page, A.L., Miller, R.H., Keeney, D.R., Eds.; Agronomy Monograph 9; American Society of Agronomy, Soil Science Society of America: Madison, WI, USA, 1982; pp. 403–430. [Google Scholar] [CrossRef] [Scilit]
- Mulvaney, R.L. Nitrogen-Inorganic Forms. In Methods of Soil Analysis, Part 3—Chemical Methods; Sparks, D.L., Ed.; SSSA Book Series No. 5; Soil Science Society of America: Madison, WI, USA, 1996; pp. 1123–1184. [Google Scholar] [CrossRef] [Scilit]
- Thomas, G.W. Exchangeable Cations. In Methods of Soil Analysis, Part 2—Chemical and Microbiological Properties, 2nd ed.; Page, A.L., Miller, R.H., Keeney, D.R., Eds.; Agronomy Monograph 9; American Society of Agronomy, Soil Science Society of America: Madison, WI, USA, 1982; pp. 159–165. [Google Scholar] [CrossRef] [Scilit]
- Olsen, S.R.; Cole, C.V.; Watanabe, F.S.; Dean, L.A. Estimation of Available Phosphorus in Soils by Extraction with Sodium Bicarbonate; USDA Circular No. 939; U.S. Government Printing Office: Washington, DC, USA, 1954.
- German, D.P. Response to Steen and Ziervogel’s comment on “Optimization of hydrolytic and oxidative enzyme methods to ecosystem studies”. Soil. Biol. Biochem. 2012, 48, 198–199. [Google Scholar] [CrossRef] [Scilit]
- Blake, G.R.; Hartge, K.H. Bulk Density. In Methods of Soil Analysis, Part 1—Physical and Mineralogical Methods, 2nd ed.; Klute, A., Ed.; Agronomy Monograph 9; American Society of Agronomy, Soil Science Society of America: Madison, WI, USA, 1986; pp. 363–375. [Google Scholar] [CrossRef] [Scilit]
- Davidson, E.A.; Hart, S.C.; Shanks, C.A.; Firestone, M.K. Measuring gross nitrogen mineralization, immobilization, and nitrification by 15N isotopic pool dilution in intact soil cores. J. Soil Sci. 1991, 42, 335–349. [Google Scholar] [CrossRef] [Scilit]
- Isobe, K.; Suwa, Y.; Ikutani, J.; Kuroiwa, M.; Makita, T.; Takebayashi, Y.; Yoh, M.; Otsuka, S.; Senoo, K.; Ohmori, M.; et al. Analytical techniques for quantifying 15N/14N of nitrate, nitrite, total dissolved nitrogen and ammonium in environmental samples using a gas chromatograph equipped with a quadrupole mass spectrometer. Microbes Environ. 2011, 26, 46–53. [Google Scholar] [CrossRef] [Scilit] [PubMed]
- Kirkham, D.; Bartholomew, W.V. Equations for following nutrient transformations in soil, utilizing tracer data. Soil Sci. Soc. Am. J. 1954, 18, 33–34. [Google Scholar] [CrossRef] [Scilit]
- Wei, T.; Simko, V. R Package “Corrplot”: Visualization of a Correlation Matrix. Version 0.92. 2021. Available online: https://github.com/taiyun/corrplot (accessed on 28 June 2026).
- Oksanen, J.; Simpson, G.L.; Blanchet, F.G.; Kindt, R.; Legendre, P.; Minchin, P.R.; O’Hara, R.B.; Solymos, P.; Stevens, M.H.H.; Szoecs, E.; et al. vegan: Community Ecology Package. R Package Version 2.6-4. 2022. Available online: https://cran.r-project.org/web/packages/vegan/vegan.pdf (accessed on 28 June 2026).
- Chong, J.; Wishart, D.S.; Xia, J. Using MetaboAnalyst 4.0 for comprehensive and integrative metabolomics data analysis. Curr. Protoc. Bioinform. 2019, 68, e86. [Google Scholar] [CrossRef] [Scilit] [PubMed]
- Liu, F.T.; Ting, K.M.; Zhou, Z.H. Isolation Forest. In Proceedings of the 2008 Eighth IEEE International Conference on Data Mining, Pisa, Italy, 15–19 December 2008; pp. 413–422. [Google Scholar] [CrossRef] [Scilit]
- Breiman, L. Random forests. Mach. Learn. 2001, 45, 5–32. [Google Scholar] [CrossRef] [Scilit]
- Jiba, W.; Manyevere, A.; Mashamaite, C.V. The impact of ecological restoration on soil quality in humid region forest habitats: A systematic review. Forests 2024, 15, 1941. [Google Scholar] [CrossRef] [Scilit]
- Zheng, W.; Guo, X.; Zhou, P.; Tang, L.; Lai, J.; Dai, Y.; Yan, W.; Wu, J. Vegetation restoration enhancing soil carbon sequestration in karst rocky desertification ecosystems: A meta-analysis. J. Environ. Manag. 2024, 370, 122530. [Google Scholar] [CrossRef] [Scilit] [PubMed]
- Zhu, X.; Fang, X.; Xiang, W.; Chen, L.; Ouyang, S.; Lei, P. Vegetation restoration drives dynamics of soil nitrogen content and availability in the subtropics. Catena 2023, 220, 106720. [Google Scholar] [CrossRef]
- Maslov, M.N.; Maslova, O.A. Soil nitrogen mineralization and its sensitivity to temperature and moisture in temperate peatlands under different land-use management practices. Catena 2022, 210, 105922. [Google Scholar] [CrossRef]
- Qiu, L.; Zhu, H.; Liu, J.; Yao, Y.; Wang, X.; Rong, G.; Zhao, X.; Shao, M.; Wei, X. Soil erosion significantly reduces organic carbon and nitrogen mineralization in a simulated experiment. Agric. Ecosyst. Environ. 2021, 307, 107232. [Google Scholar] [CrossRef]
- Ouyang, Y.; Norton, J.M. Short-term nitrogen fertilization affects microbial community composition and nitrogen mineralization functions in an agricultural soil. Appl. Environ. Microbiol. 2020, 86, e02278-19. [Google Scholar] [CrossRef] [Scilit] [PubMed]
- Li, Y.; Sang, J.; Zou, C.; Zhang, Q.; Yang, Q.; Xu, G.; Kim, D.G.; Denton, M.D.; Carmona, C.R.; Zhao, H.; et al. Impacts of conversion of cropland to grassland on the CNP stoichiometric dynamics of soil, microorganisms, and enzymes across China: A synthesis. Catena 2024, 246, 108456. [Google Scholar] [CrossRef] [Scilit]
- Feyissa, A.; Gurmesa, G.A.; Yang, F.; Long, C.; Zhang, Q.; Cheng, X. Soil enzyme activity and stoichiometry in secondary grasslands along a climatic gradient of subtropical China. Sci. Total Environ. 2022, 825, 154019. [Google Scholar] [CrossRef] [Scilit] [PubMed]
- Xu, H.; Qu, Q.; Chen, Y.; Liu, G.; Xue, S. Responses of soil enzyme activity and soil organic carbon stability over time after cropland abandonment in different vegetation zones of the Loess Plateau of China. Catena 2021, 196, 104812. [Google Scholar] [CrossRef] [Scilit]
- Awoonor, J.K.; Amoakwah, E.; Buri, M.M.; Dogbey, B.F.; Gyamfi, J.K. Impact of land use on soil quality: Insights from the forest-savannah transition zone of Ghana. Heliyon 2024, 10, e27277. [Google Scholar] [CrossRef] [Scilit] [PubMed]
- Chang, S.C.; Jackson, M.L. Fractionation of soil phosphorus. Soil Sci. 1957, 84, 133–144. [Google Scholar] [CrossRef] [Scilit]
- DeForest, J.L.; Moorhead, D.L. Effects of elevated pH and phosphorus fertilizer on soil C, N and P enzyme stoichiometry in an acidic mixed mesophytic deciduous forest. Soil Biol. Biochem. 2020, 150, 107996. [Google Scholar] [CrossRef] [Scilit]
- Cole, C.V.; Heil, R.D. Phosphorus effects on terrestrial nitrogen cycling. Ecol. Bull. 1981, 363–374. [Google Scholar]
- Wei, X.; Hu, Y.; Peng, P.; Zhu, Z.; Atere, C.T.; O’donnell, A.G.; Wu, J.; Ge, T. Effect of P stoichiometry on the abundance of nitrogen-cycle genes in phosphorus-limited paddy soil. Biol. Fertil. Soils 2017, 53, 767–776. [Google Scholar] [CrossRef]
- Wang, Z.; Yang, S.; Wang, R.; Xu, Z.; Feng, K.; Feng, X.; Li, T.; Liu, H.; Ma, R.; Li, H.; et al. Compositional and functional responses of soil microbial communities to long-term nitrogen and phosphorus addition in a calcareous grassland. Pedobiologia 2020, 78, 150612. [Google Scholar] [CrossRef]
- Yadav, A.N.; Kour, D.; Kaur, T.; Devi, R.; Yadav, A.; Dikilitas, M.; Abdel-Azeem, A.M.; Ahluwalia, A.S.; Saxena, A.K. Biodiversity, and biotechnological contribution of beneficial soil microbiomes for nutrient cycling, plant growth improvement and nutrient uptake. Biocatal. Agric. Biotechnol. 2021, 33, 102009. [Google Scholar] [CrossRef] [Scilit]
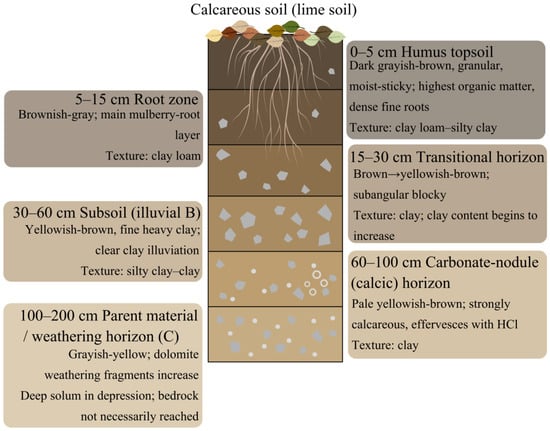
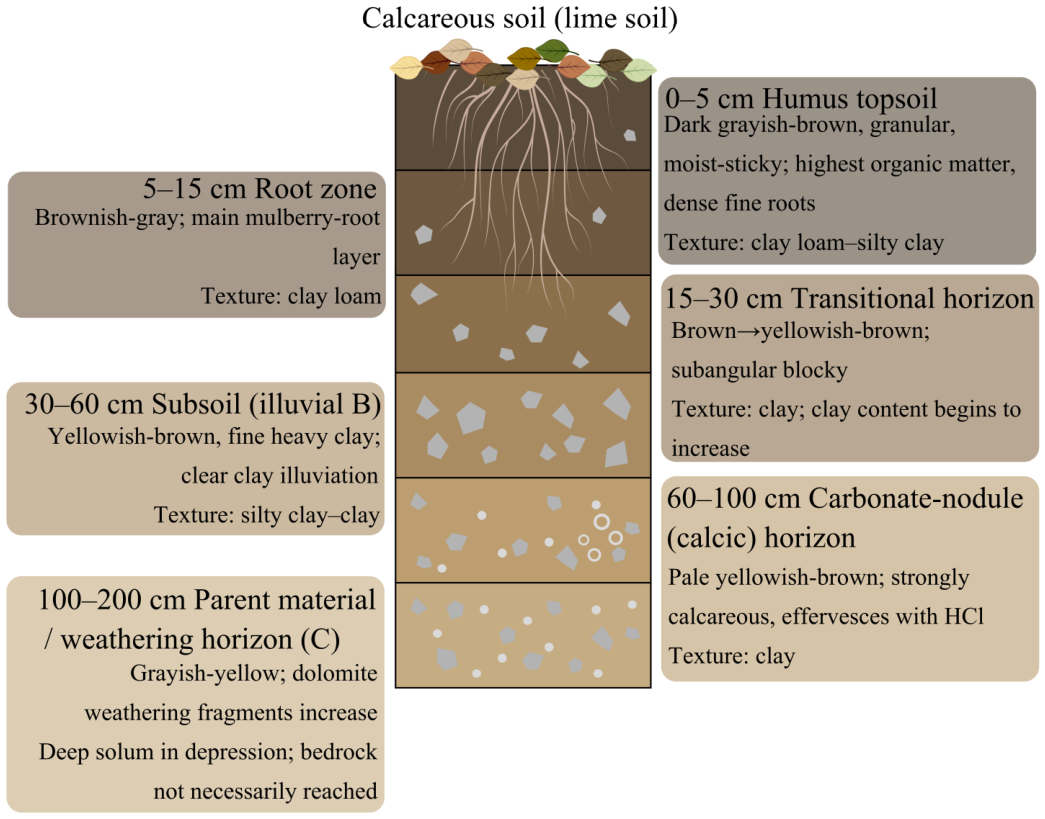
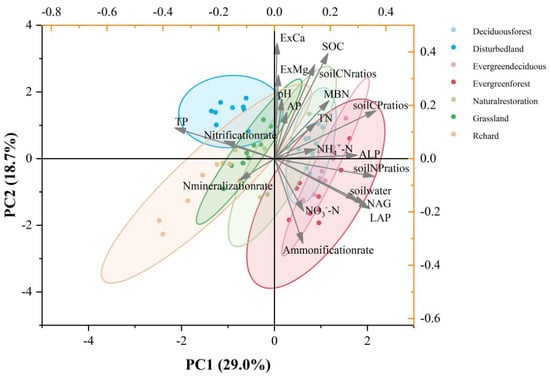
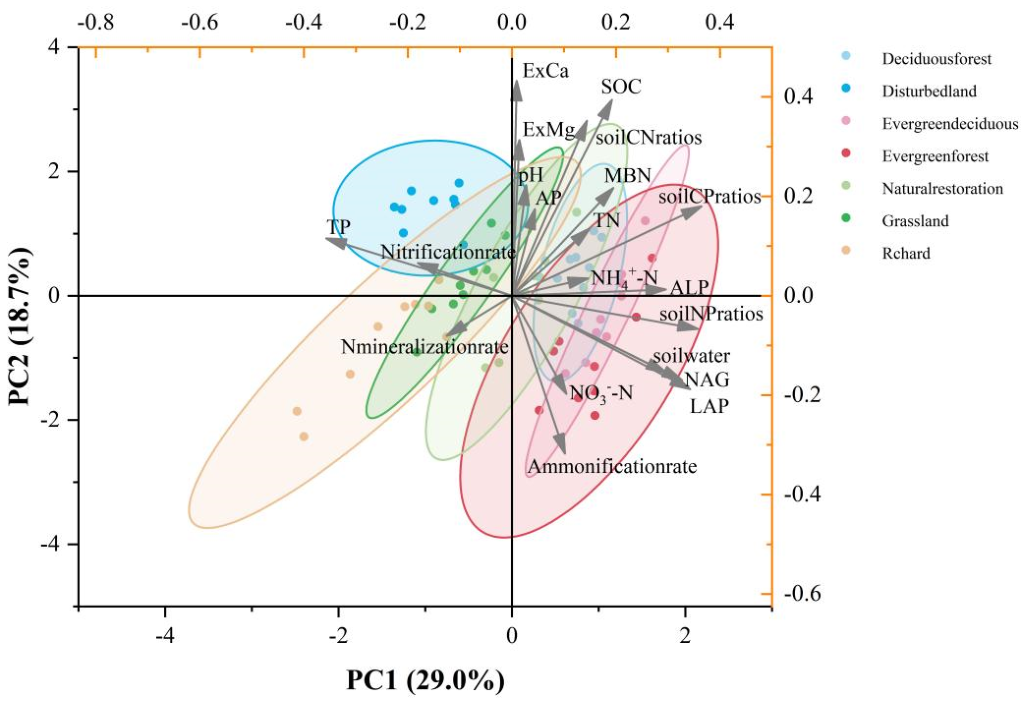
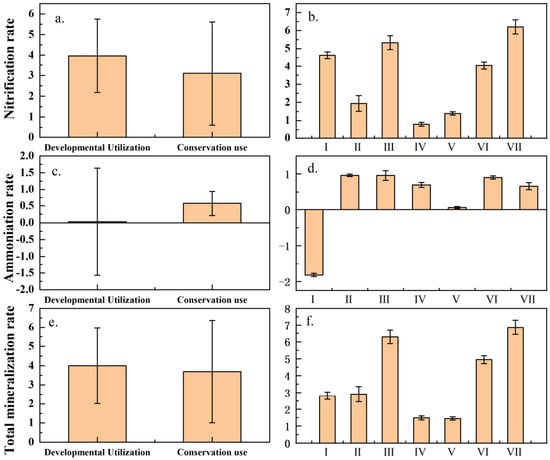
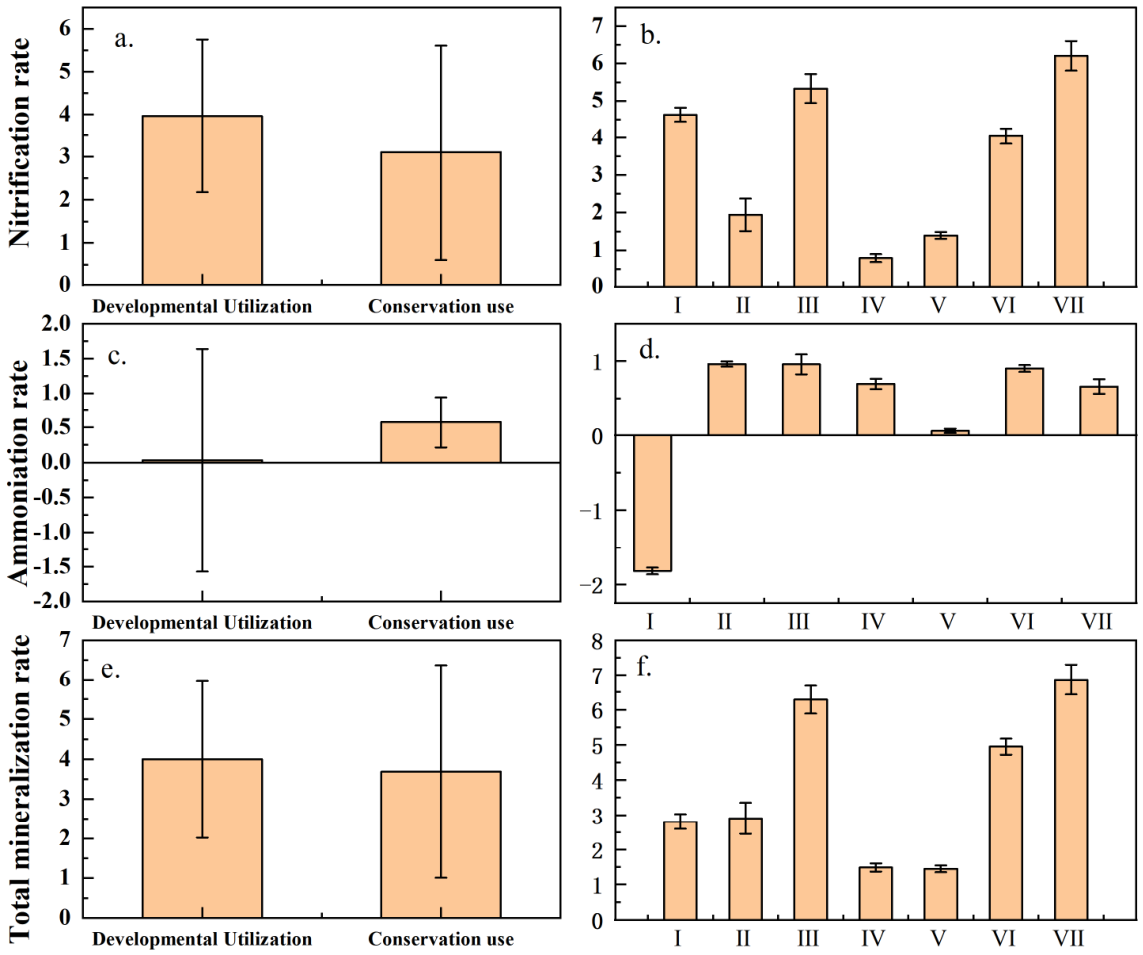
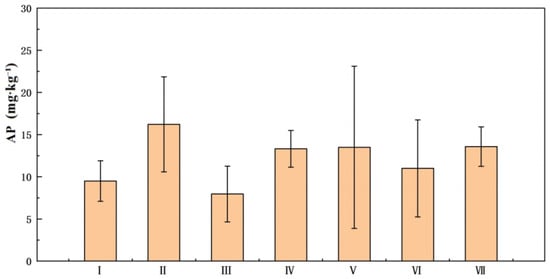
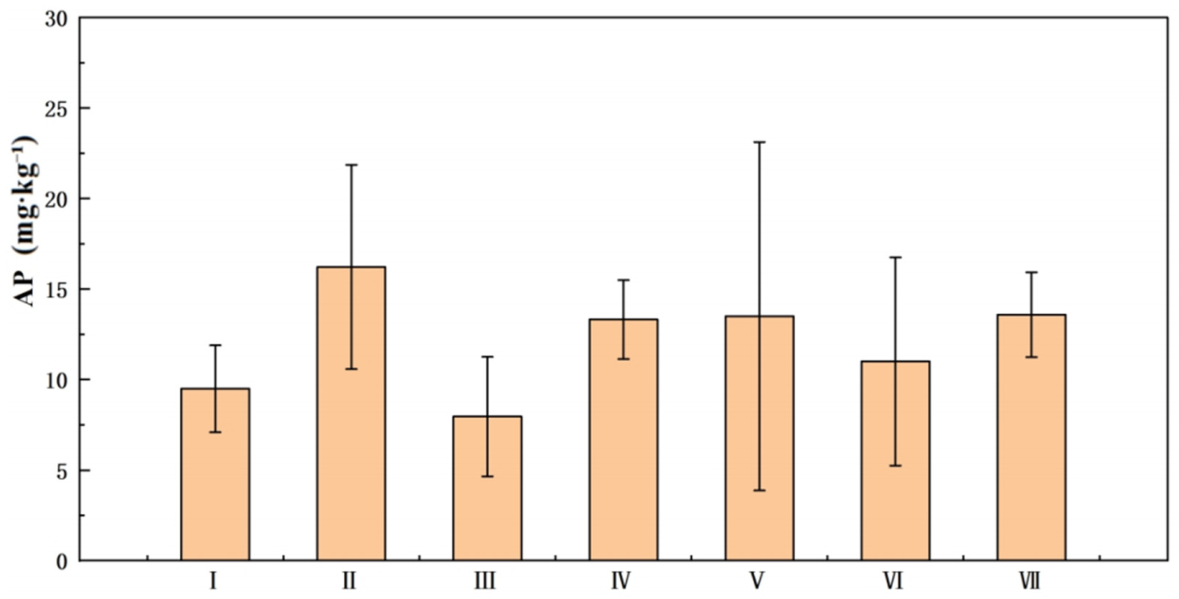
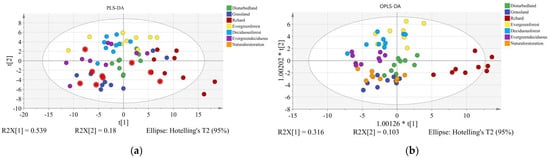
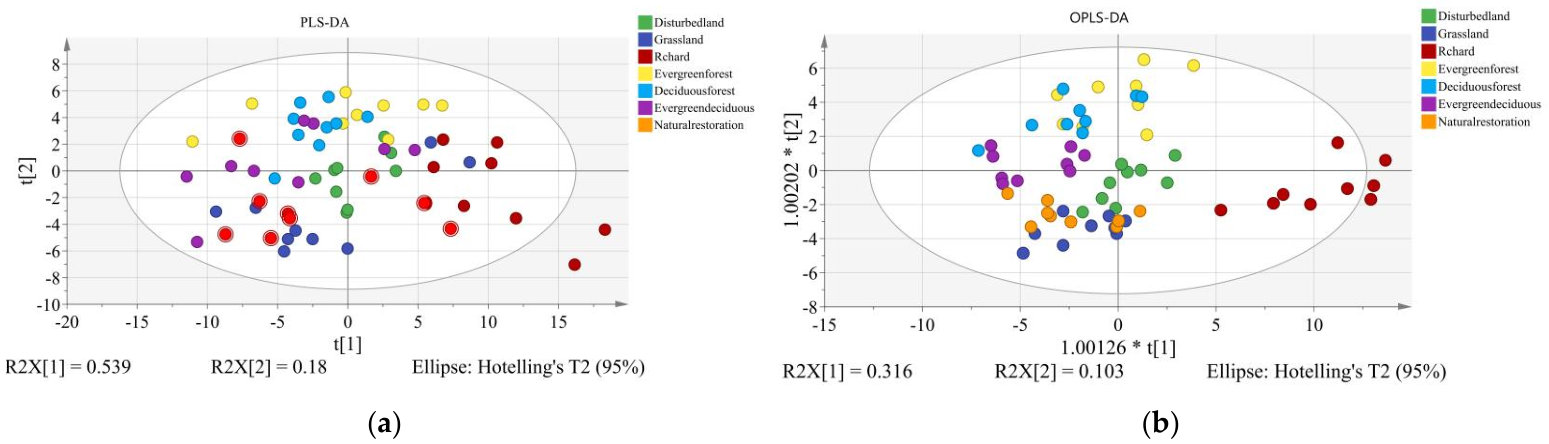
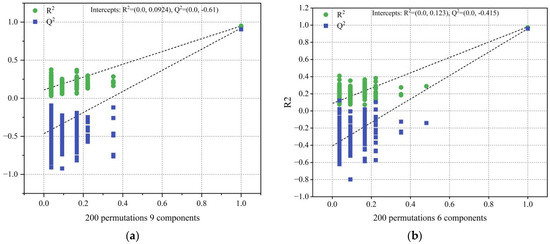
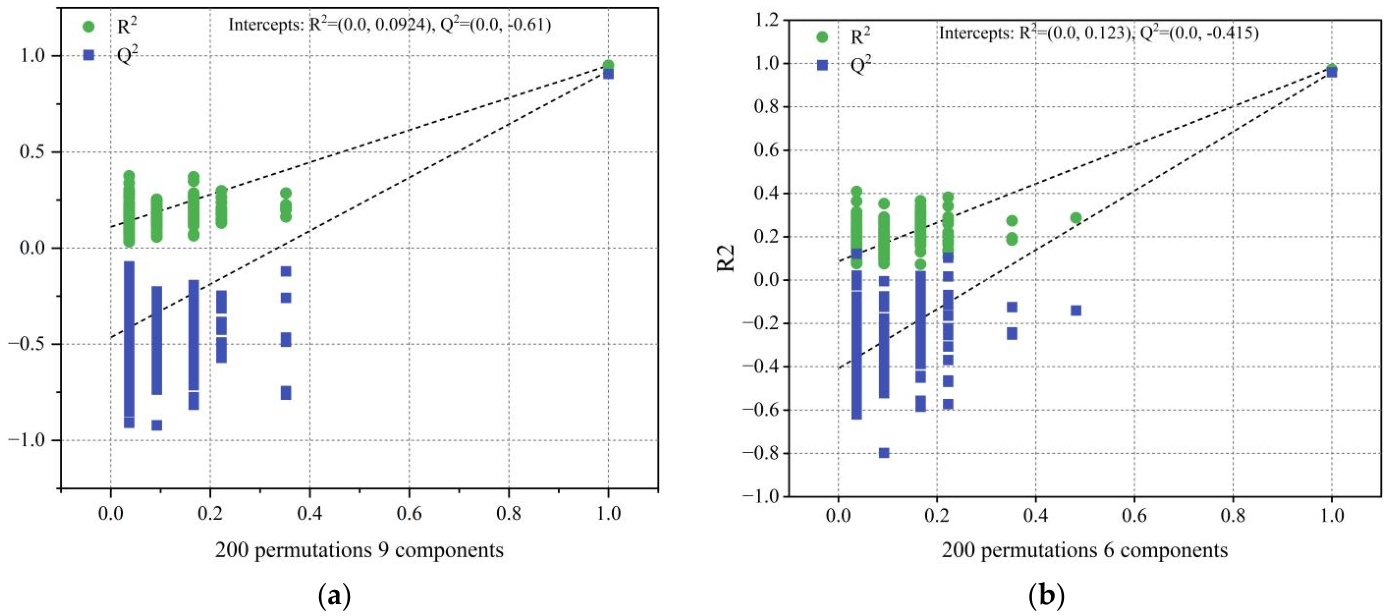
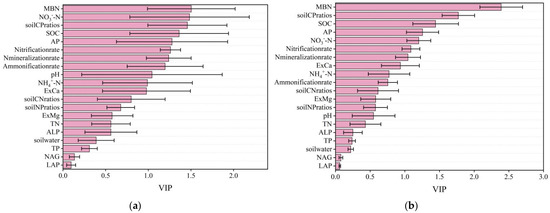
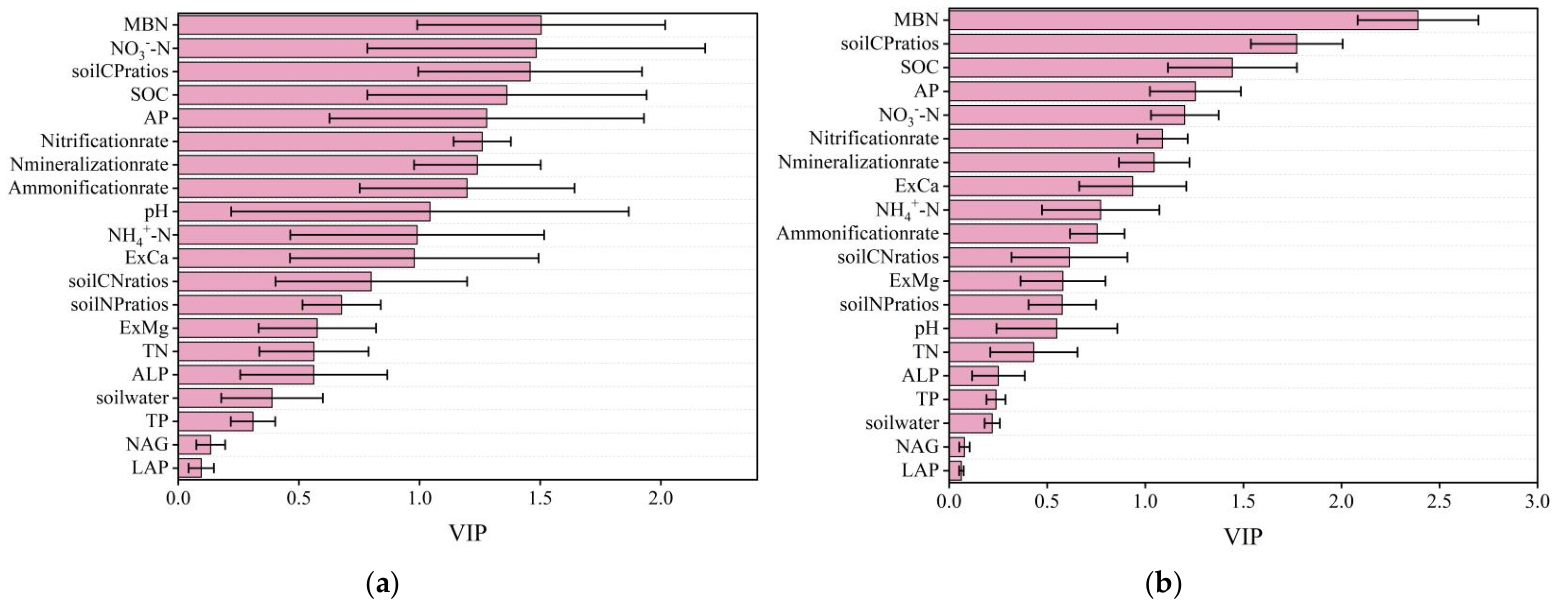
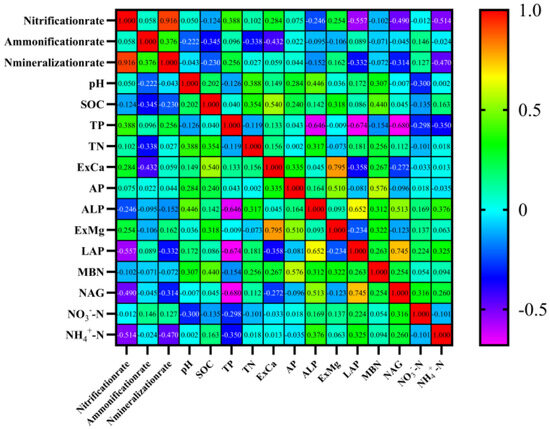
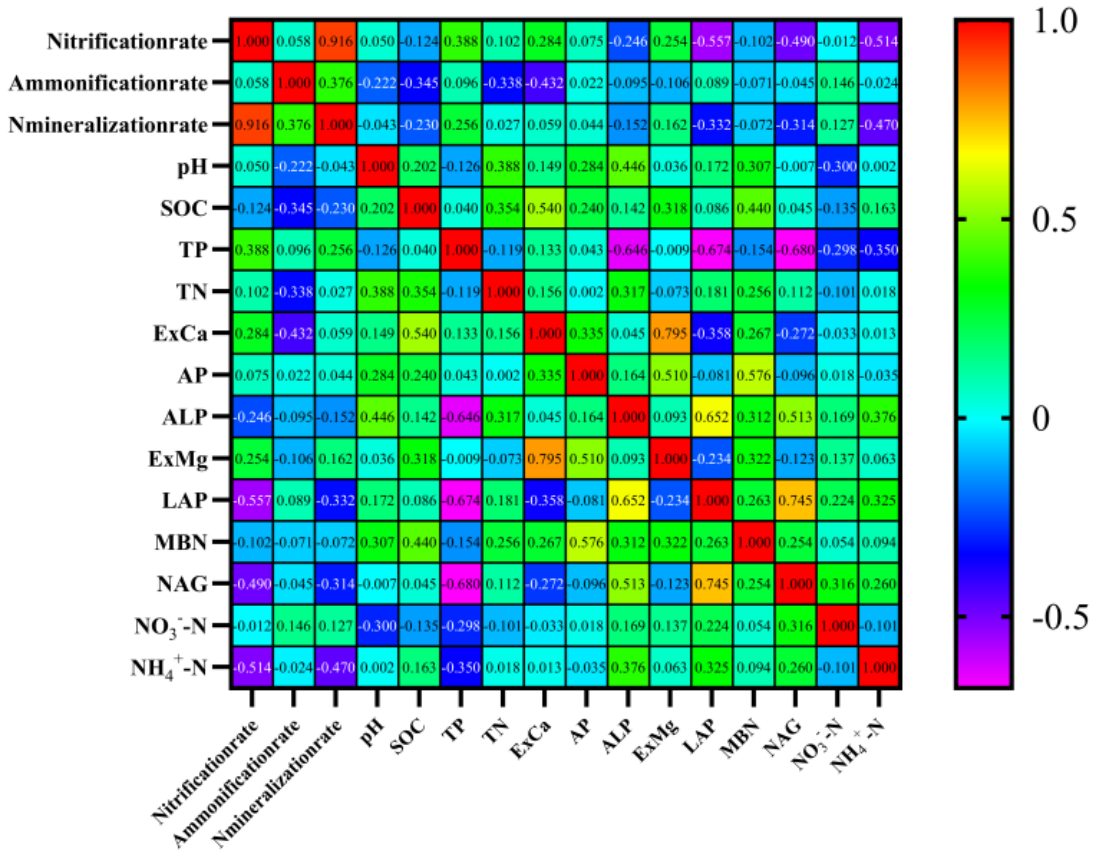
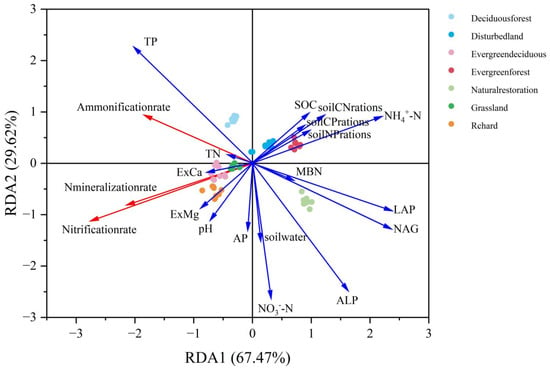
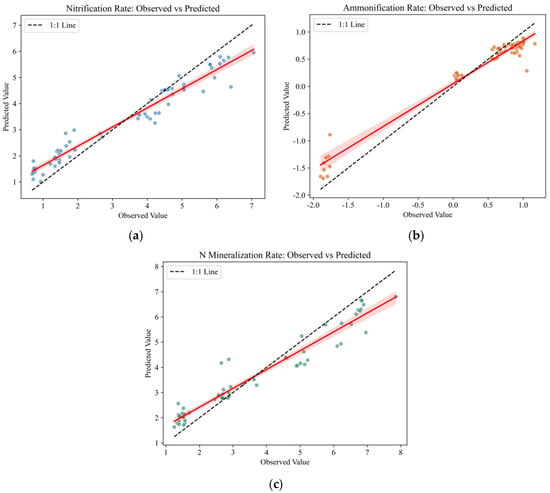
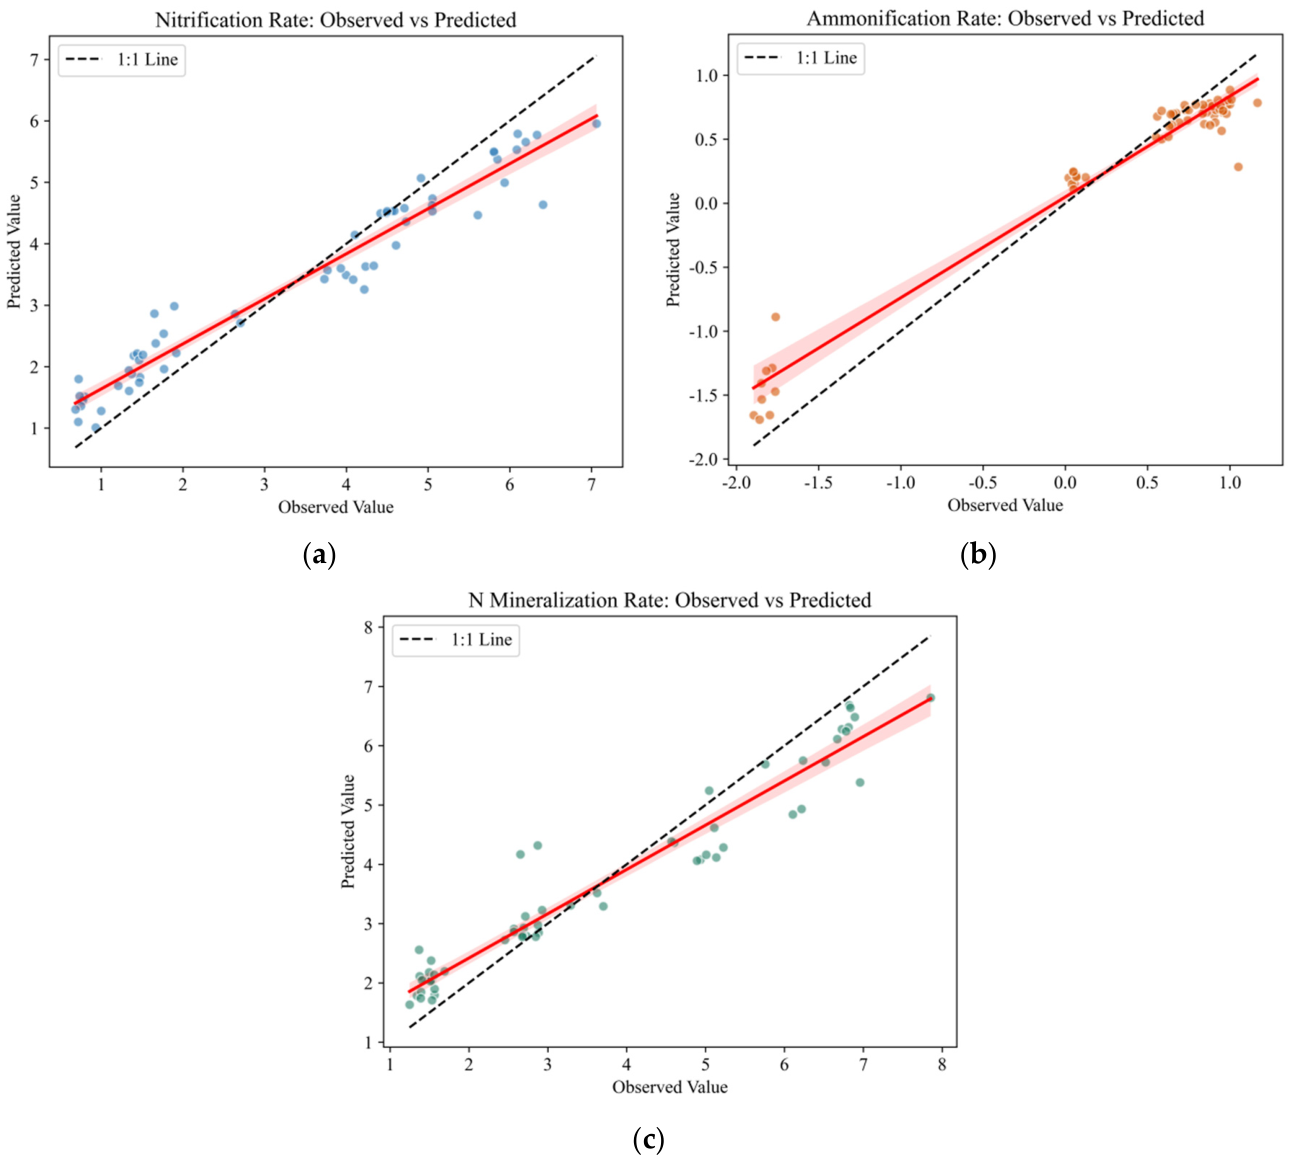
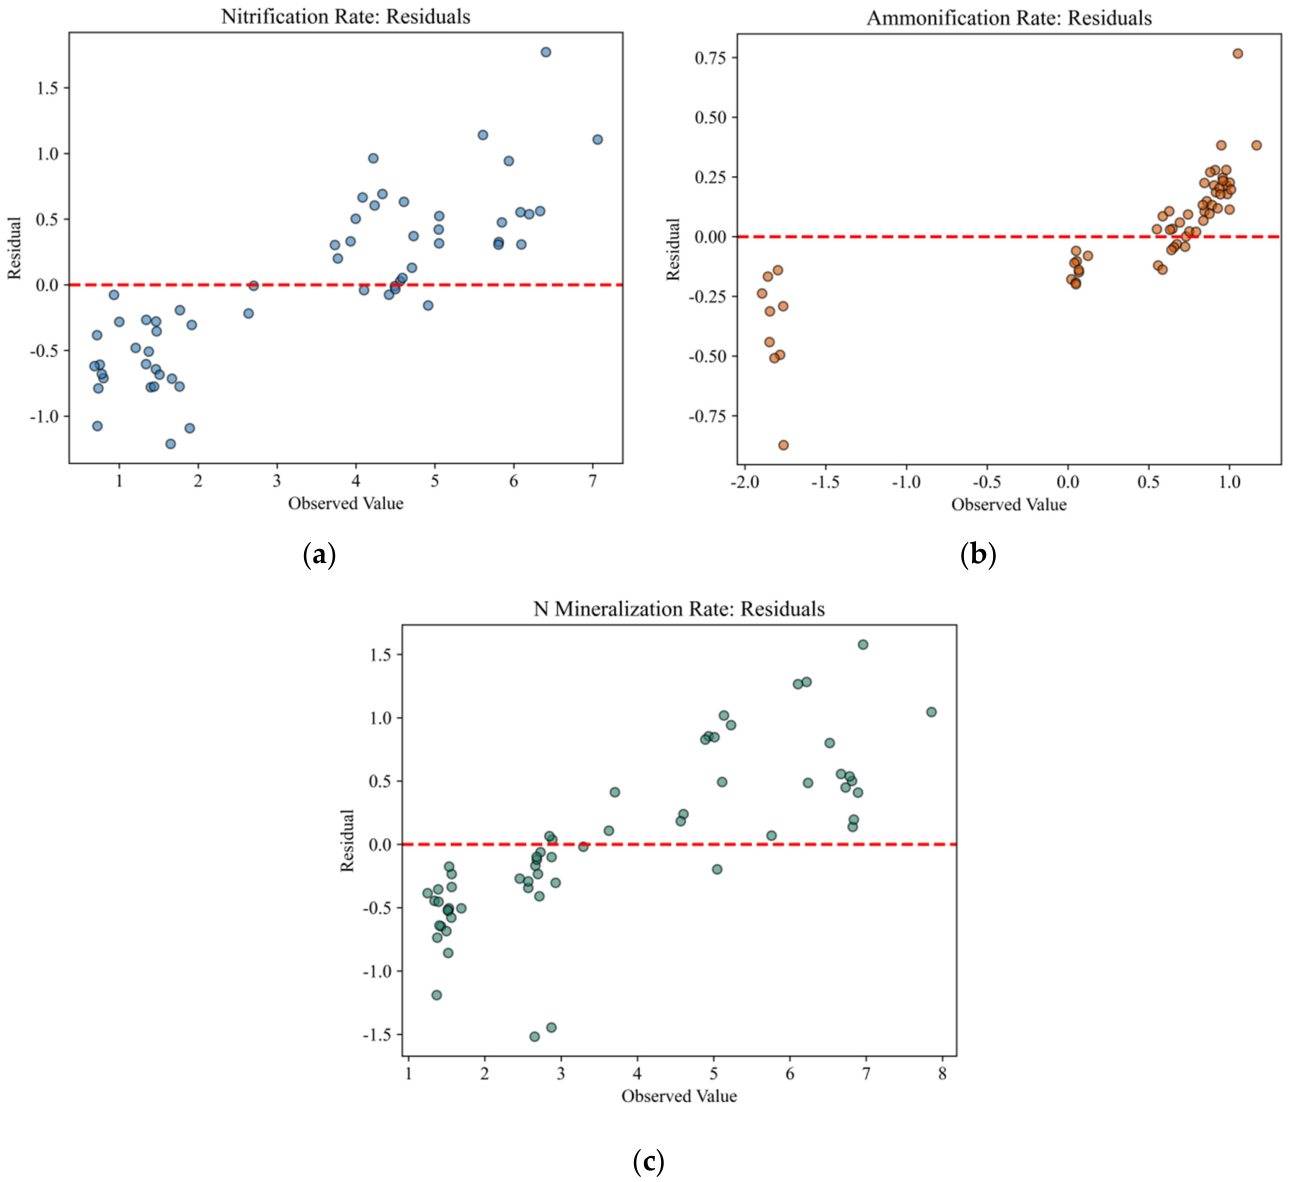
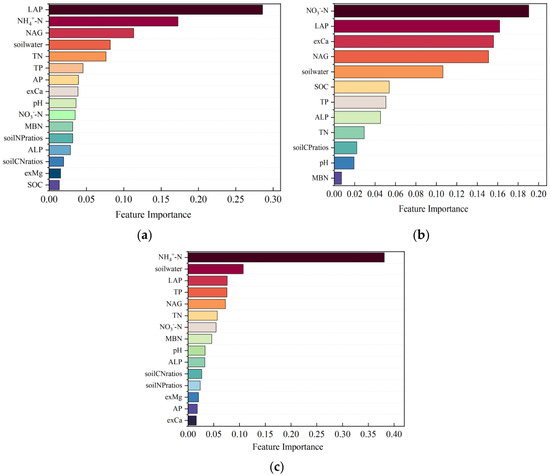
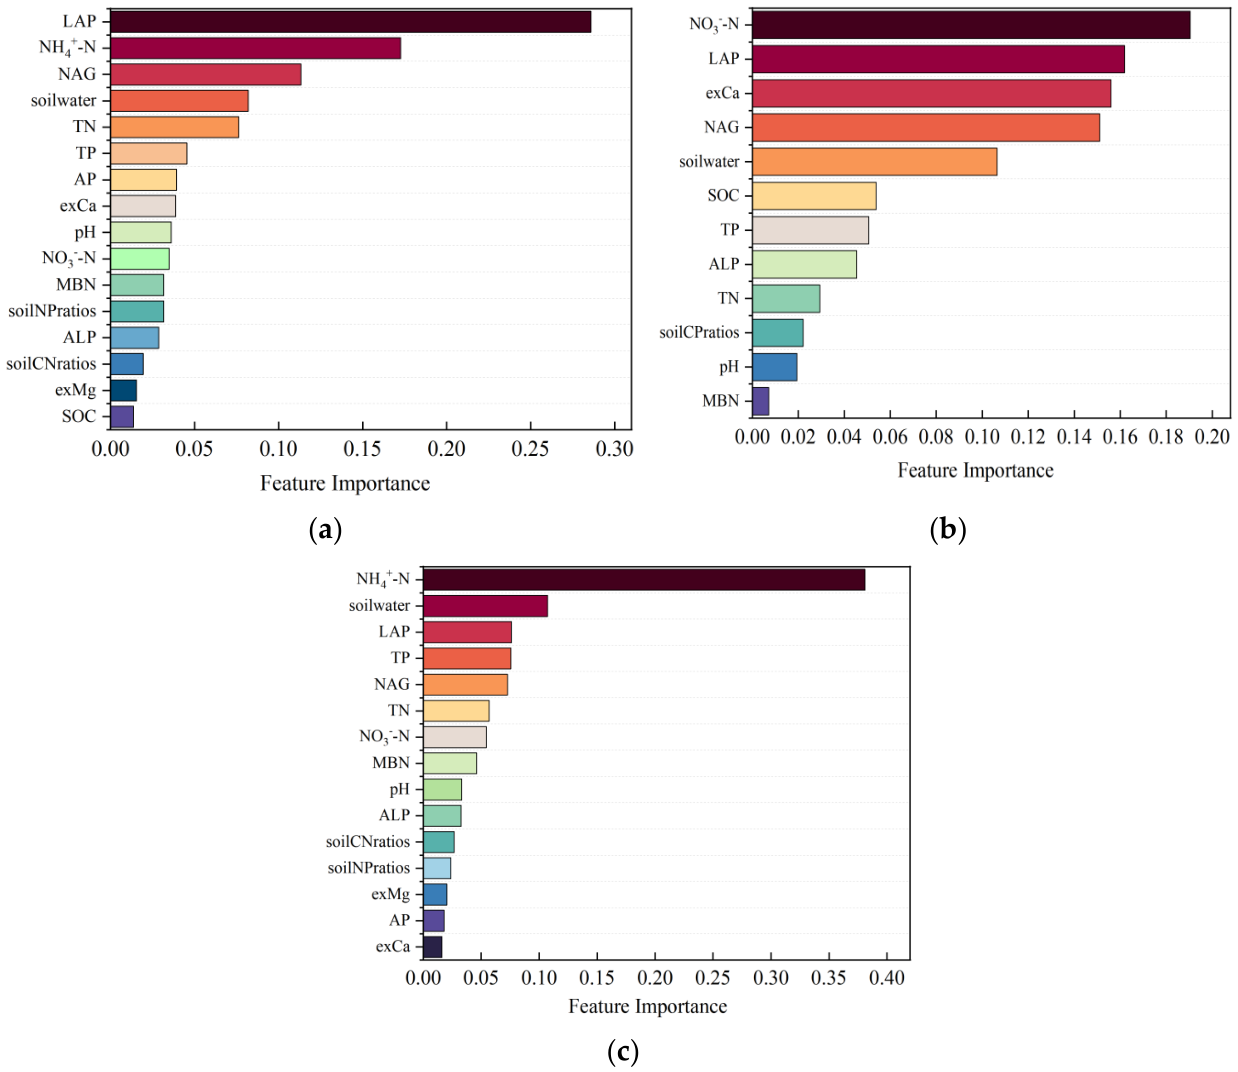

Disclaimer/Publisher’s Note: The statements, opinions and data contained in all publications are solely those of the individual author(s) and contributor(s) and not of MDPI and/or the editor(s). MDPI and/or the editor(s) disclaim responsibility for any injury to people or property resulting from any ideas, methods, instructions or products referred to in the content. |
© 2026 by the authors. Licensee MDPI, Basel, Switzerland. This article is an open access article distributed under the terms and conditions of the Creative Commons Attribution (CC BY) license.