


Abstract
This study evaluated whether image-derived morphometric descriptors can support two complementary tasks: germination-performance classification and seed-lot-level phenotypic differentiation in Genipa americana L. Seed images were acquired from eight collection localities in southern Bahia State, Brazil, comprising 16 seed lots and approximately 16,000 initially imaged seeds. Primary and derived morphometric descriptors were extracted from digital images and used as predictors in Random Forest (RF) and Linear Support Vector Machine (SVM) classifiers. After data curation, the final analytical dataset comprised 15,513 seeds. RF achieved a higher cross-validated F1-score than SVM ( versus ), but independent test-set performance was moderate and comparable between models. RF and Linear SVM achieved accuracies of 0.74 and 0.75, respectively, with PR-AUC values of 0.649 and 0.671. PCA indicated that the first two components explained 98.9% of total morphometric variance, and MANOVA confirmed a significant seed-lot effect (Wilks’ , ). Critically, under Leave-One-Locality-Out cross-validation, mean macro-F1 fell to () and balanced accuracy to (), indistinguishable from chance, indicating that random-split performance largely reflects locality-specific patterns rather than a transferable germination signal. These findings indicate that external morphometric descriptors provide a moderate within-distribution predictive signal under random seed-level partitioning, but this signal is not transferable to unseen localities. Digital morphometric phenotyping should therefore be regarded primarily as a low-cost component of native seed–lot characterization and locally calibrated preliminary screening, especially when combined with complementary physiological, internal-imaging, environmental, or genetic information.
1. Introduction
The environmental crisis driven by anthropogenic climate change has intensified the need to restore degraded ecosystems, particularly in tropical regions that contain the highest levels of global biodiversity. Forest restoration is increasingly recognized as a critical nature-based solution to mitigate climate change, restore ecosystem functions and services, and improve sustainable livelihoods [1]. The United Nations Decade on Ecosystem Restoration (2021–2030) underscores the pivotal importance of forest restoration for climate-change mitigation, biodiversity conservation, and the maintenance of local livelihood systems [2]. In this context, native tree species are indispensable not only for facilitating ecological recovery but also for protecting cultural and genetic heritage. Nevertheless, large-scale ecological restoration efforts are limited by a persistent bottleneck: consistent provision of high-quality seeds with well-documented provenance and verified viability remains a significant challenge [3].
Seed quality exerts a decisive influence on germination success, seedling vigor, and the long-term establishment of restored forest ecosystems [4]. Conventional seed viability assays impose several operational constraints that limit their scalability in native-species restoration programmes. Germination-based tests, which remain the primary reference method in Brazil under the official Rules for Forest Seed Analysis [5] require between 14 and 21 days to complete for G. americana, occupy controlled-environment germination chambers throughout that period, and consume the entire seed sample assessed, leaving no material available for sowing if lots are ultimately approved. The tetrazolium test offers a faster alternative but requires the manual cutting and staining of individual seeds, trained technicians capable of interpreting the resulting colorimetric patterns, and a temperature-controlled incubation chamber [6]. The reliability of the tetrazolium test depends critically on the availability of a validated, species-specific staining protocol covering preconditioning time, tetrazolium concentration, and immersion duration, as well as on the analyst’s interpretive experience [7]. For major crop species, such protocols are established; however, for the large majority of native Neotropical trees, they either do not yet exist or have only recently been developed on a species-by-species basis [8,9]. In the absence of a validated protocol, the accuracy of the assessment depends on taxon-specific empirical adjustments, which introduce interpretive subjectivity and reduce reproducibility across laboratories, limitations that are especially relevant for the growing number of native tree species entering restoration seed networks in the Atlantic Forest and Caatinga biomes. In community-scale or resource-constrained nurseries, which account for a substantial share of native seedling production in the Atlantic Forest restoration network, the combined effects of the associated requirements create a practical ceiling on the number of lots that can be formally evaluated before sowing. It is against this operational background that rapid, non-destructive, image-based screening methods are being explored as a complementary first-pass tool [8,10].
Digital imaging and machine learning (ML) have substantially advanced seed phenotyping in agricultural species by enabling rapid, high-throughput, and objective quantification of morphological, physiological, and proxy genetic characteristics [11,12]. Image-derived descriptors, including size, shape, and color metrics, facilitate the development of predictive models for the germination potential and the vigor of seedlings [10,13]. However, despite these technological advancements, their application to native forest species remains limited, particularly within the context of restoration-oriented seed systems.
Seed phenotyping research has identified image-based trait extraction as one of the most promising strategies for the high-throughput quantitative evaluation of seed attributes [10,14]. In this context, ensemble machine learning algorithms, such as Random Forest, have been shown to surpass the performance of single-boundary classification methods when applied to morphometric seed datasets that exhibit class imbalance and high levels of biological variability [15,16]. The coupling of computer vision techniques with machine learning classifiers has achieved a high classification accuracy for seed lot discrimination, including varietal identification and viability prediction, in several major crop species, such as soybean, maize and rice [14,17].
However, although these approaches have been extensively optimized for domesticated crop species, their implementation for non-domesticated native tree seeds characterized by increased phenotypic heterogeneity, variable dormancy behavior, and pronounced inter-population genetic structuring remains comparatively underexplored [8]. This disparity in scalability between crop-oriented and forest seed systems constitutes both a methodological challenge and an operational priority, particularly in light of the rising demand for large, certified native seed lots to meet tropical forest restoration targets established under the United Nations Decade on Ecosystem Restoration (2021–2030) [2,3].
G. americana L., commonly referred to as genipap, is a Neotropical arboreal species of substantial ecological, economic, and cultural relevance. It is distributed in the Amazon, Cerrado, and Atlantic Forest biomes, where it contributes to multiple ecosystem services, including pollination and soil stabilization [18], and exhibits a high productive potential in tropical regions [19]. Its seeds show pronounced morphological variation among populations, indicative of underlying genetic diversity and ecological adaptation. Quantifying and characterizing this intraspecific variation is essential for the development of seed sourcing strategies that safeguard genetic integrity while promoting adaptive capacity in the context of ongoing and projected climate change [20].
Despite recent advances in digital seed phenotyping for crop species, rigorous quantitative evidence supporting its applicability to native tropical forest trees remains scarce [8]. The biological rationale for expecting external morphometry to correlate with germination performance in G. americana rests on two well-established relationships. First, seed mass, which is positively correlated with projected area and, to a lesser extent, perimeter reflects the total carbohydrate and lipid reserves available to support embryo growth during the critical period between radicle emergence and the establishment of autotrophic nutrition [21,22]. Seeds with greater reserve endowment are expected to achieve longer and more robust primary root development within a fixed evaluation period. Second, morphological irregularity captured through compactness and the area-to-perimeter ratio may reflect abnormal development, mechanical damage during processing, or pathogen-induced malformation, each of which reduces the probability of successful germination [23]. At the seed-lot level, size and shape variation among provenances is expected to reflect a combination of genetic differentiation, maternal resource allocation, and local environmental filtering [24,25,26].
This study evaluated two related yet analytically distinct hypotheses.
H1.
At the individual-seed level, seeds characterized by greater projected area, larger perimeter, and higher size index—interpreted as indirect morphometric proxies for increased reserve availability and enhanced maternal provisioning—are expected to exhibit a higher probability of successful post-germinative root development than smaller or more geometrically irregular seeds. This expectation is assessed using supervised machine-learning models trained on digital morphometric descriptors.
H2.
At the seed-lot level, mean morphometric profiles are expected to differ significantly among the eight sampled localities in southern Bahia, reflecting provenance-specific environmental conditions and maternal effects on seed morphology.
Distinguishing between these hypotheses is analytically critical because morphometric traits that effectively discriminate among seed provenances do not necessarily exhibit sufficient intra-lot variability to enable reliable prediction of individual post-germinative performance. Accordingly, the two hypotheses necessitate distinct inferential frameworks: individual-level predictive modeling for H1 and seed-lot-level multivariate morphometric analyses for H2 [10].
2. Materials and Methods
2.1. Seed Sampling, Image Acquisition, and Morphometric Extraction
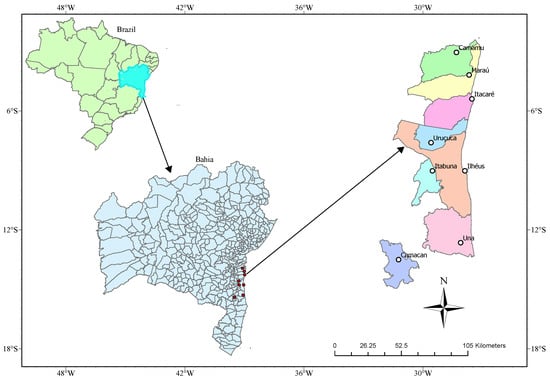
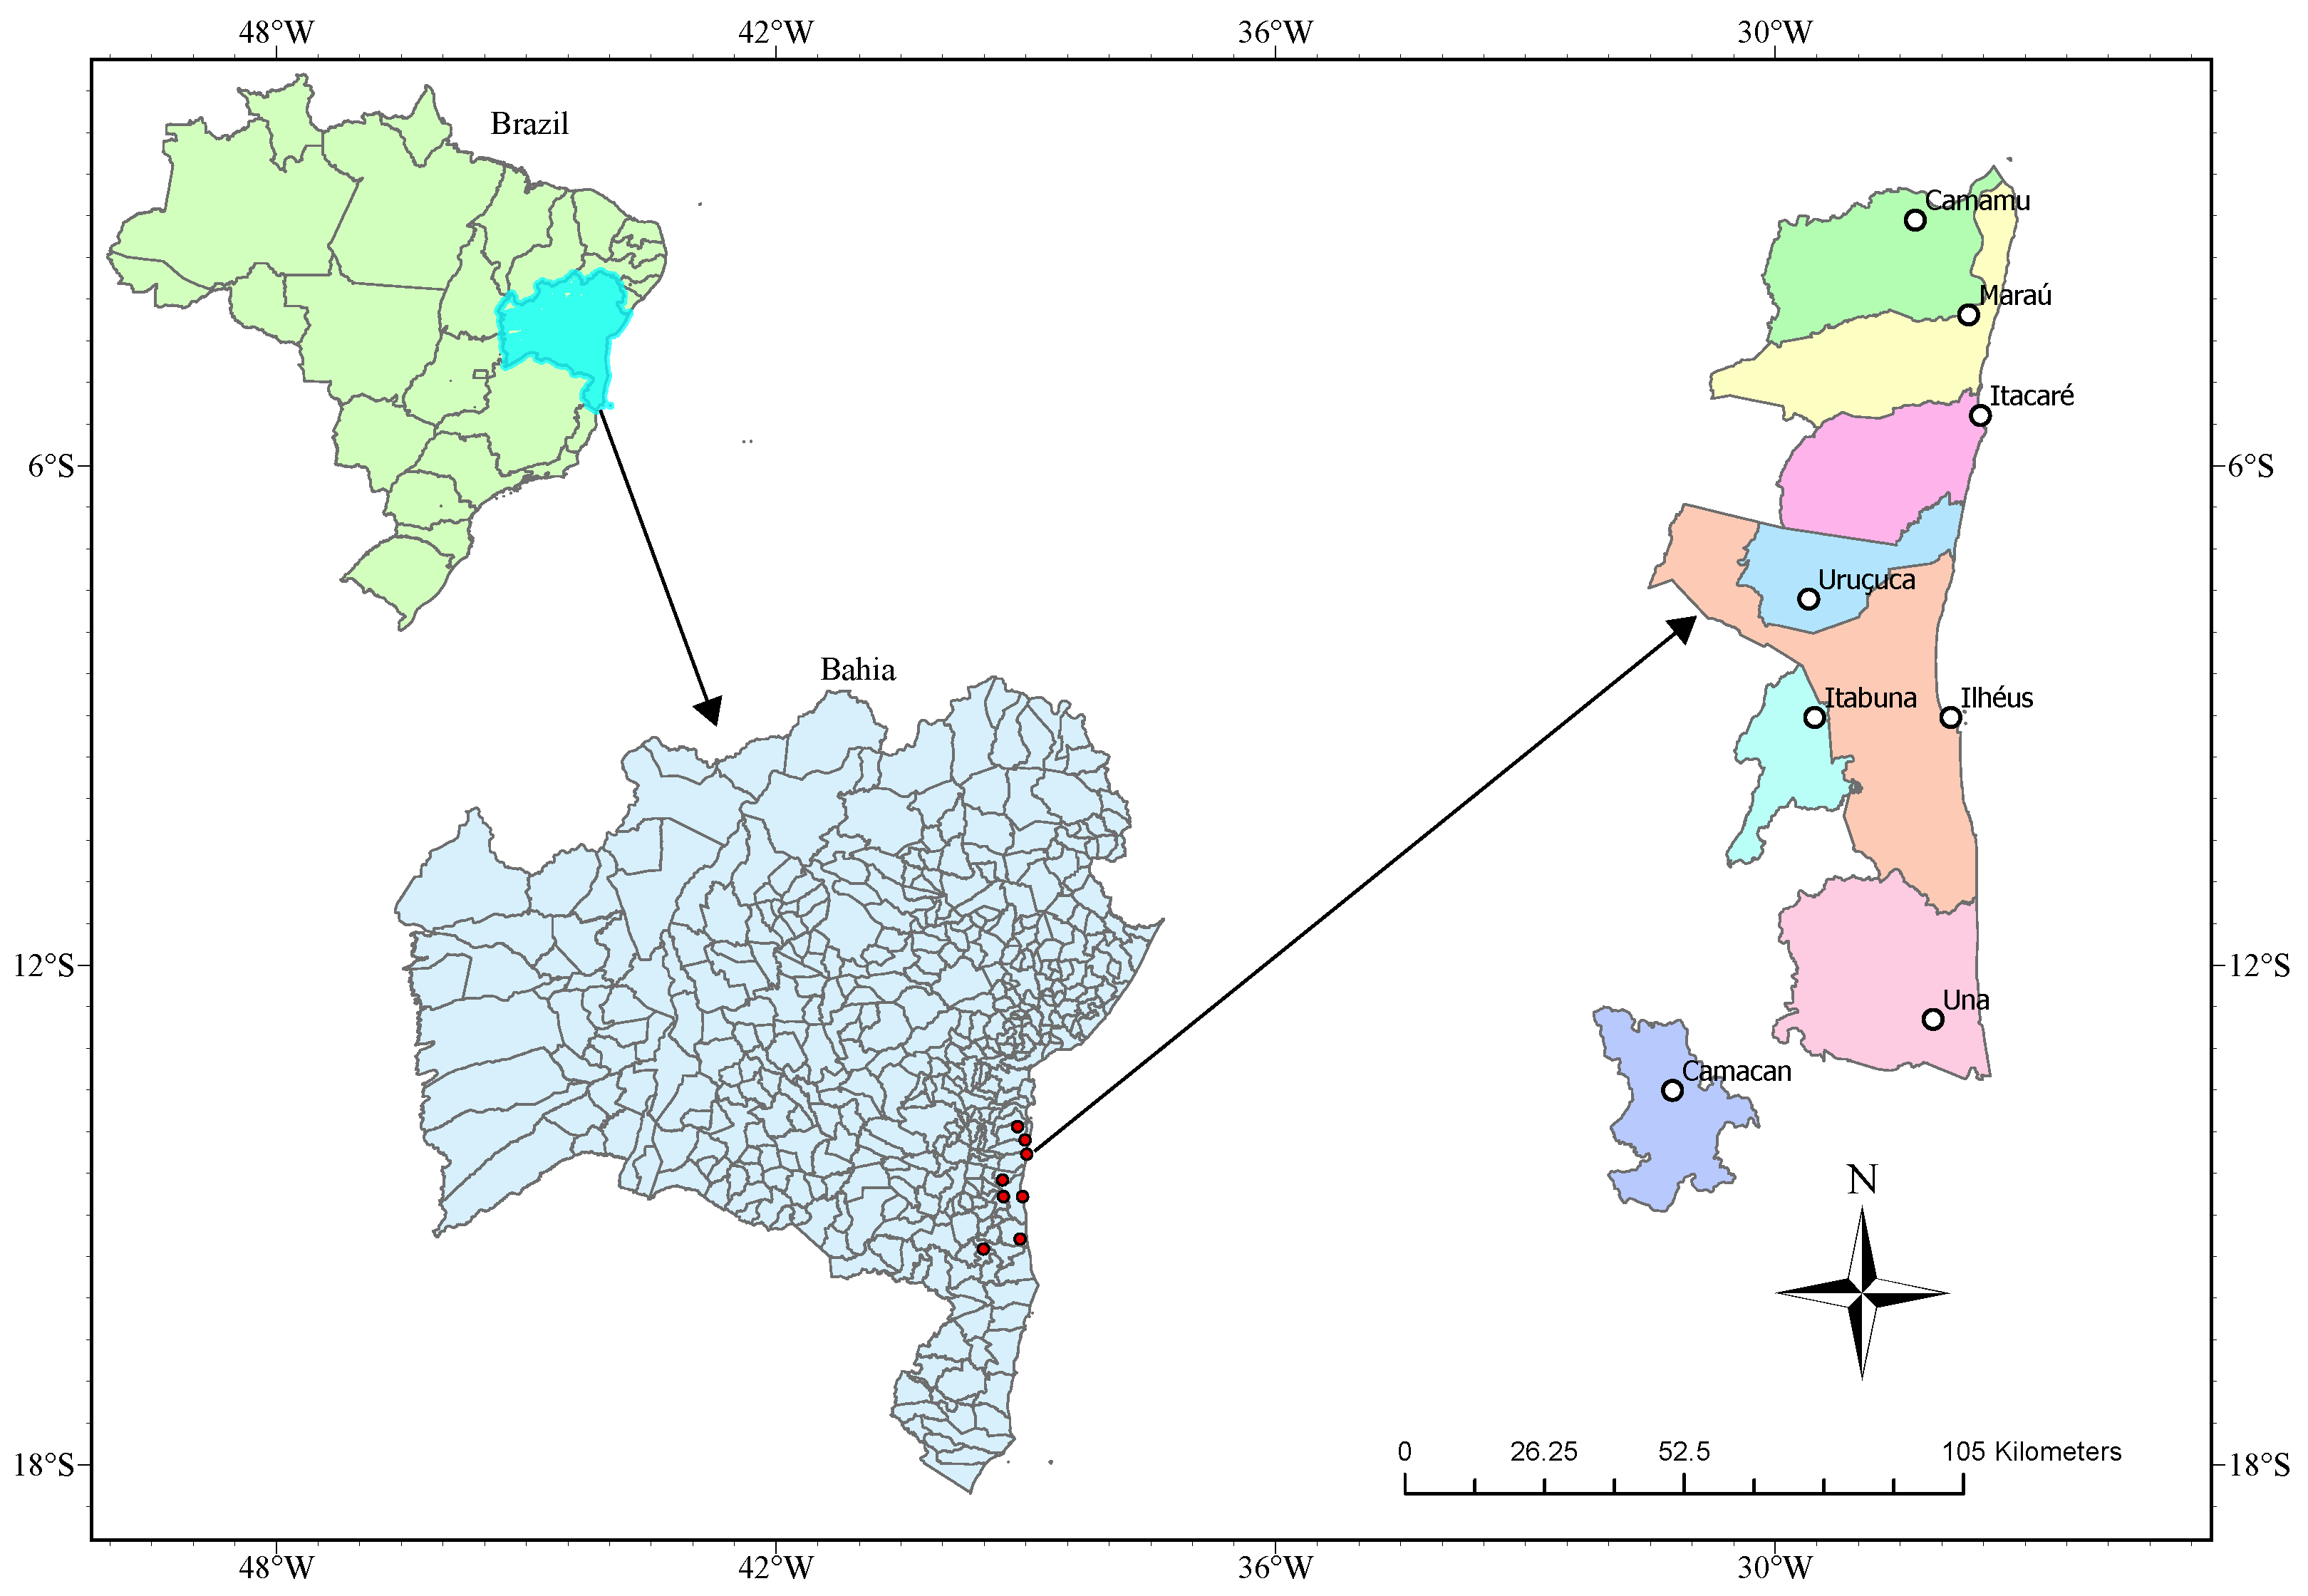
Fruits were collected from eight municipalities in southern Bahia State, Brazil (Table 1, Figure 1), a region characterized by the Atlantic Forest biome. Seeds were extracted using a mechanical pulper (Macanuda, model DM-Ji-05, Torena Indústria e Comércio Ltda., São Paulo, SP, Brazil) at the Agricultural and Industrial Laboratory of UESC, Ilhéus, yielding approximately 16,000 seeds subdivided into 16 lots. The experimental unit is the individual seed, treated as an independent observation linked to a known lot and locality. The full curated dataset (n = 15,513) was retained without sub-sampling, consistent with recommendations for predictive modelling under class imbalance [27,28].
Table 1.
Spatial distribution of seed lots by collection locality in the southern region of Bahia, Brazil.
Figure 1.
Geographic locations of the eight sampling municipalities for genipap (Genipa americana L.) in southern Bahia, Brazil. Red dots mark each collection municipality; arrows trace the inset zoom from the Brazil/Bahia overview to the sampling region.
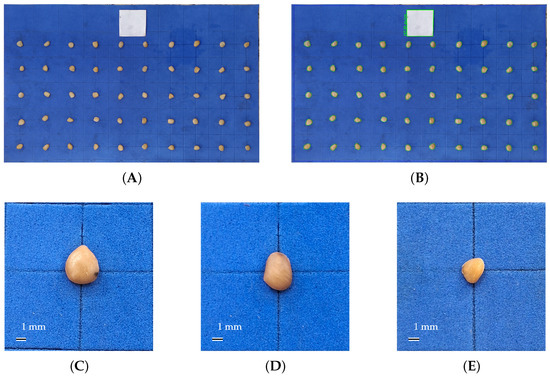
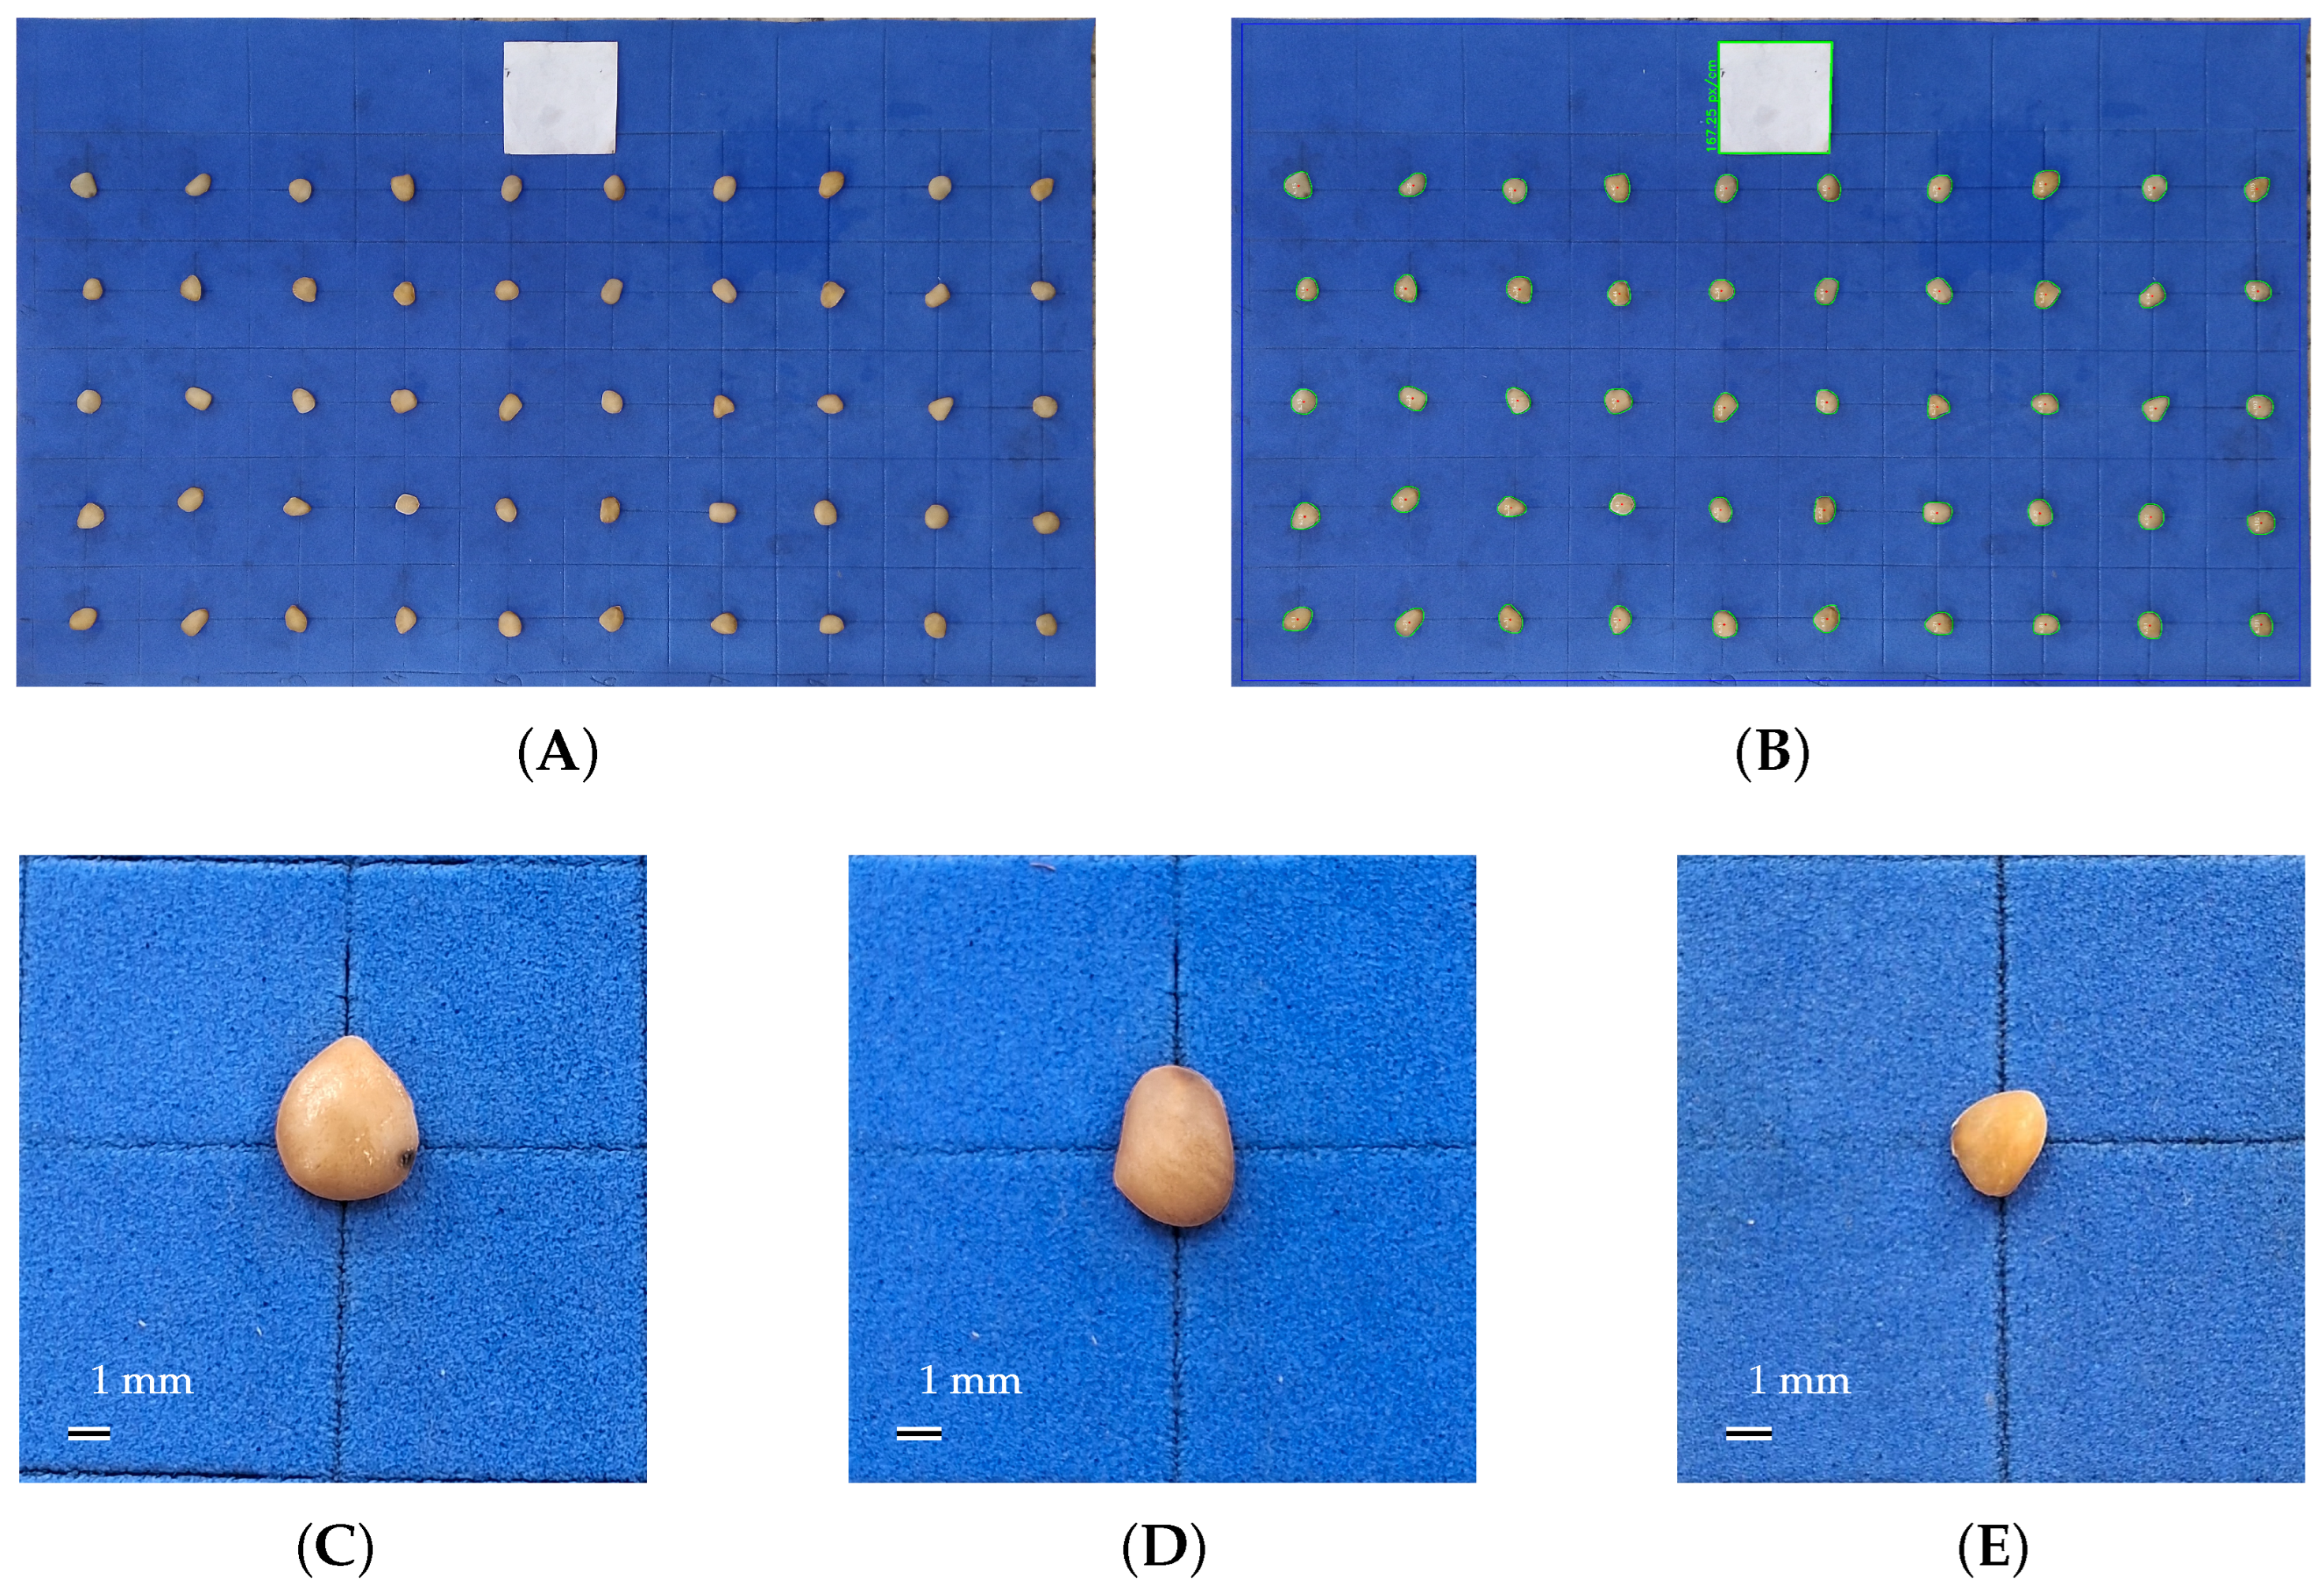
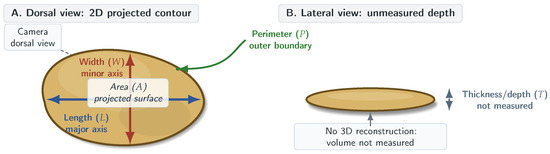
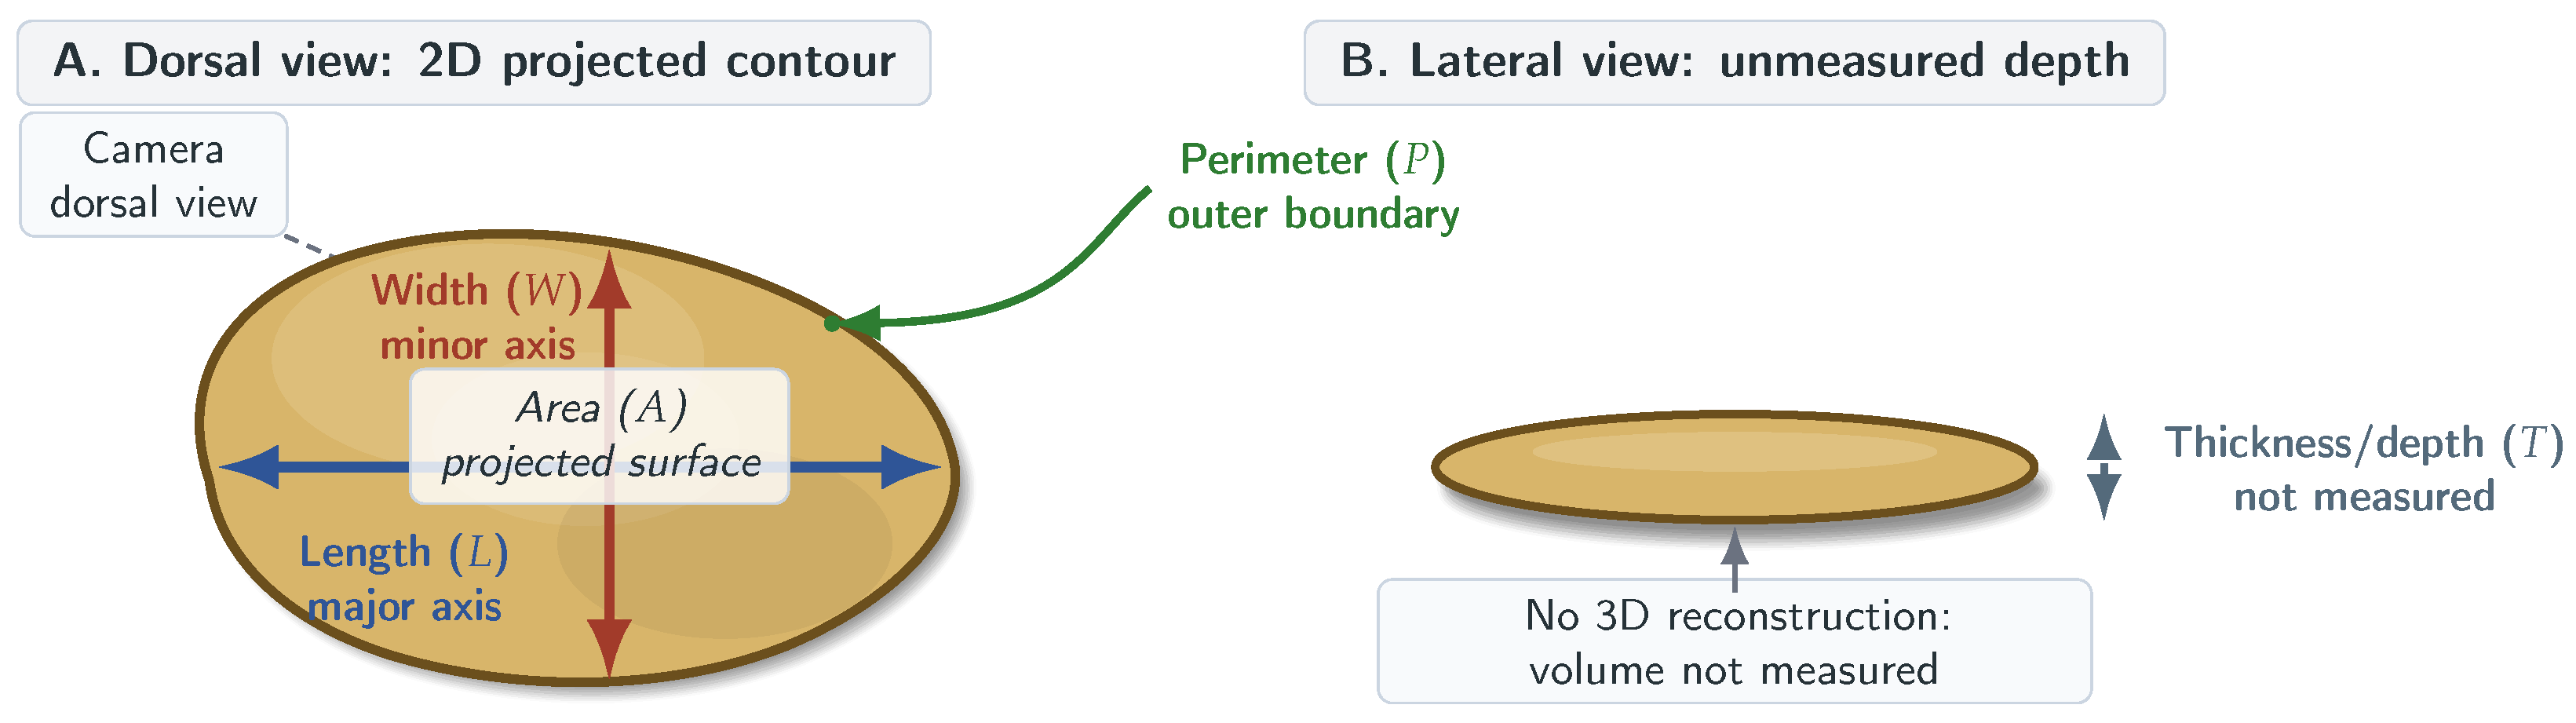
Seeds were arranged in batches of 50 on a blue ethylene vinyl acetate (EVA) sheet for image acquisition (Figure 2). A Python-based workflow using OpenCV (version 4.13.0; ref. [29] and scikit-image (version 0.25.2; ref. [30]) performed HSV colour filtering, morphological noise removal, and contour detection for seed segmentation. Four primary morphometric traits were extracted per seed using the regionprops module: length (major axis, mm), width (minor axis, mm), projected area (), and perimeter (mm). Four derived descriptors were computed: length-to-width ratio, area-to-perimeter ratio, compactness, and seed size index (mean of length and width). All measurements derive from the two-dimensional dorsal projection; seed thickness and volume were not quantified (Figure 3). Measurements were exported as CSV and linked to germination outcomes via a row-and-column grid identity maintained throughout the experiment.
Figure 2.
(A) Seeds on a blue EVA sheet for image acquisition; (B) segmented seeds after automated processing; (C) large seed; (D) medium seed; (E) small seed. White scale bars indicate 1 mm. All descriptors were derived from the two-dimensional dorsal projection.
Figure 3.
Morphometric parameters assessed in Genipa americana seeds. (A) Dorsal view: length (L), width (W), projected area (A), and perimeter (P). (B) Lateral view: seed thickness/depth (T) and volume were not quantified.
2.2. Germination Test
Seeds were placed on triple-layered germination paper moistened with distilled water to approximately 2.5 times the dry paper mass, rolled, and vertically positioned in a germination chamber at 25 °C for 21 days, following the Brazilian Rules for forest seed analysis for G. americana [5]. The row-and-column grid identity assigned at image acquisition was maintained throughout, enabling an unambiguous link between each seed’s morphometric record and its germination outcome. Seeds with a primary root length exceeding 35 mm at evaluation were classified as having achieved successful post-germinative root development, a threshold consistent with root lengths reported for vigorous G. americana seedlings under comparable conditions [19,31,32]. Seeds that failed to germinate or produced morphologically abnormal seedlings were classified as non-germinated.
2.3. Statistical Analysis of Morphometric Differentiation
Principal Component Analysis (PCA) and multivariate analysis of variance (MANOVA) were applied to z-score standardized morphometric traits, using the 16 seed lots as the grouping factor, to assess whether multivariate mean trait vectors differed significantly among lots [20]. Tukey HSD post-hoc comparisons were conducted on PC1 scores; full pairwise results are provided in Supplementary Table S3.
2.4. Machine Learning Classification and Cross-Validation
Random Forest (RF) and Linear Support Vector Machine (SVM) classifiers were fitted to evaluate the predictive capacity of morphometric descriptors for germination-performance outcomes. RF was selected as a nonlinear ensemble capable of capturing complex feature interactions; Linear SVM served as a regularized linear baseline. After outlier removal (1.5 IQR rule) and z-score standardization estimated exclusively on the training subset, the dataset was partitioned by stratified sampling into a 70% training/validation set and a 30% independent test set. Locality was encoded as one-hot dummy variables and included as a categorical predictor in random-split models.
RF hyperparameters were selected by randomized grid search with five-fold stratified cross-validation (macro-F1 criterion); the optimal configuration (n_estimators = 600, max_features = "sqrt", min_samples_leaf = 6, class_weight = "balanced_subsample") is detailed in Supplementary Table S1. Linear SVM was implemented with balanced class penalization and outputs calibrated via CalibratedClassifierCV. Performance was evaluated on the independent test set using accuracy, macro-averaged F1-score, precision, recall, ROC-AUC, and PR-AUC, with particular emphasis on recall and F1-score for the germinated class. Random Forest feature importance was assessed by Mean Decrease in Impurity (MDI) and permutation importance (30 repeats, macro-F1 scoring).
To evaluate transferability across provenances, a Leave-One-Locality-Out (LOLO) cross-validation was implemented: in each of eight folds, all seeds from one locality formed the test set and the model was trained exclusively on seeds from the remaining seven, with locality removed from the predictor set [33,34]. This approach follows established spatial cross-validation practice for ecological data, where group-structured folds respect spatial autocorrelation and produce realistic estimates of out-of-sample performance [34,35]. Macro-averaged F1-score, per-class recall, PR-AUC, and ROC-AUC were computed for each fold; results are reported in Supplementary Table S2. All analyses used Python 3.11; ref. [29]) with scikit-learn (version 1.7.2; ref. [36]), statsmodels (version 0.14.5; ref. [37]), OpenCV, scikit-image, pandas (version 2.3.3; ref. [38]), NumPy (version 2.3.5; ref. [39]), Matplotlib (version 3.10.6; ref. [40]), and Seaborn (version 0.13.2; ref. [41]).
3. Results
3.1. Morphometric Variation and Germination-Performance Classification
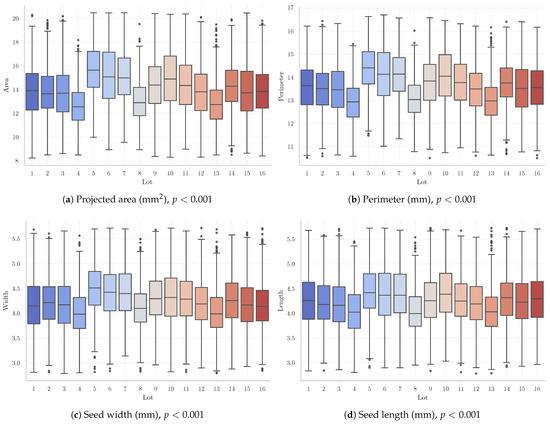
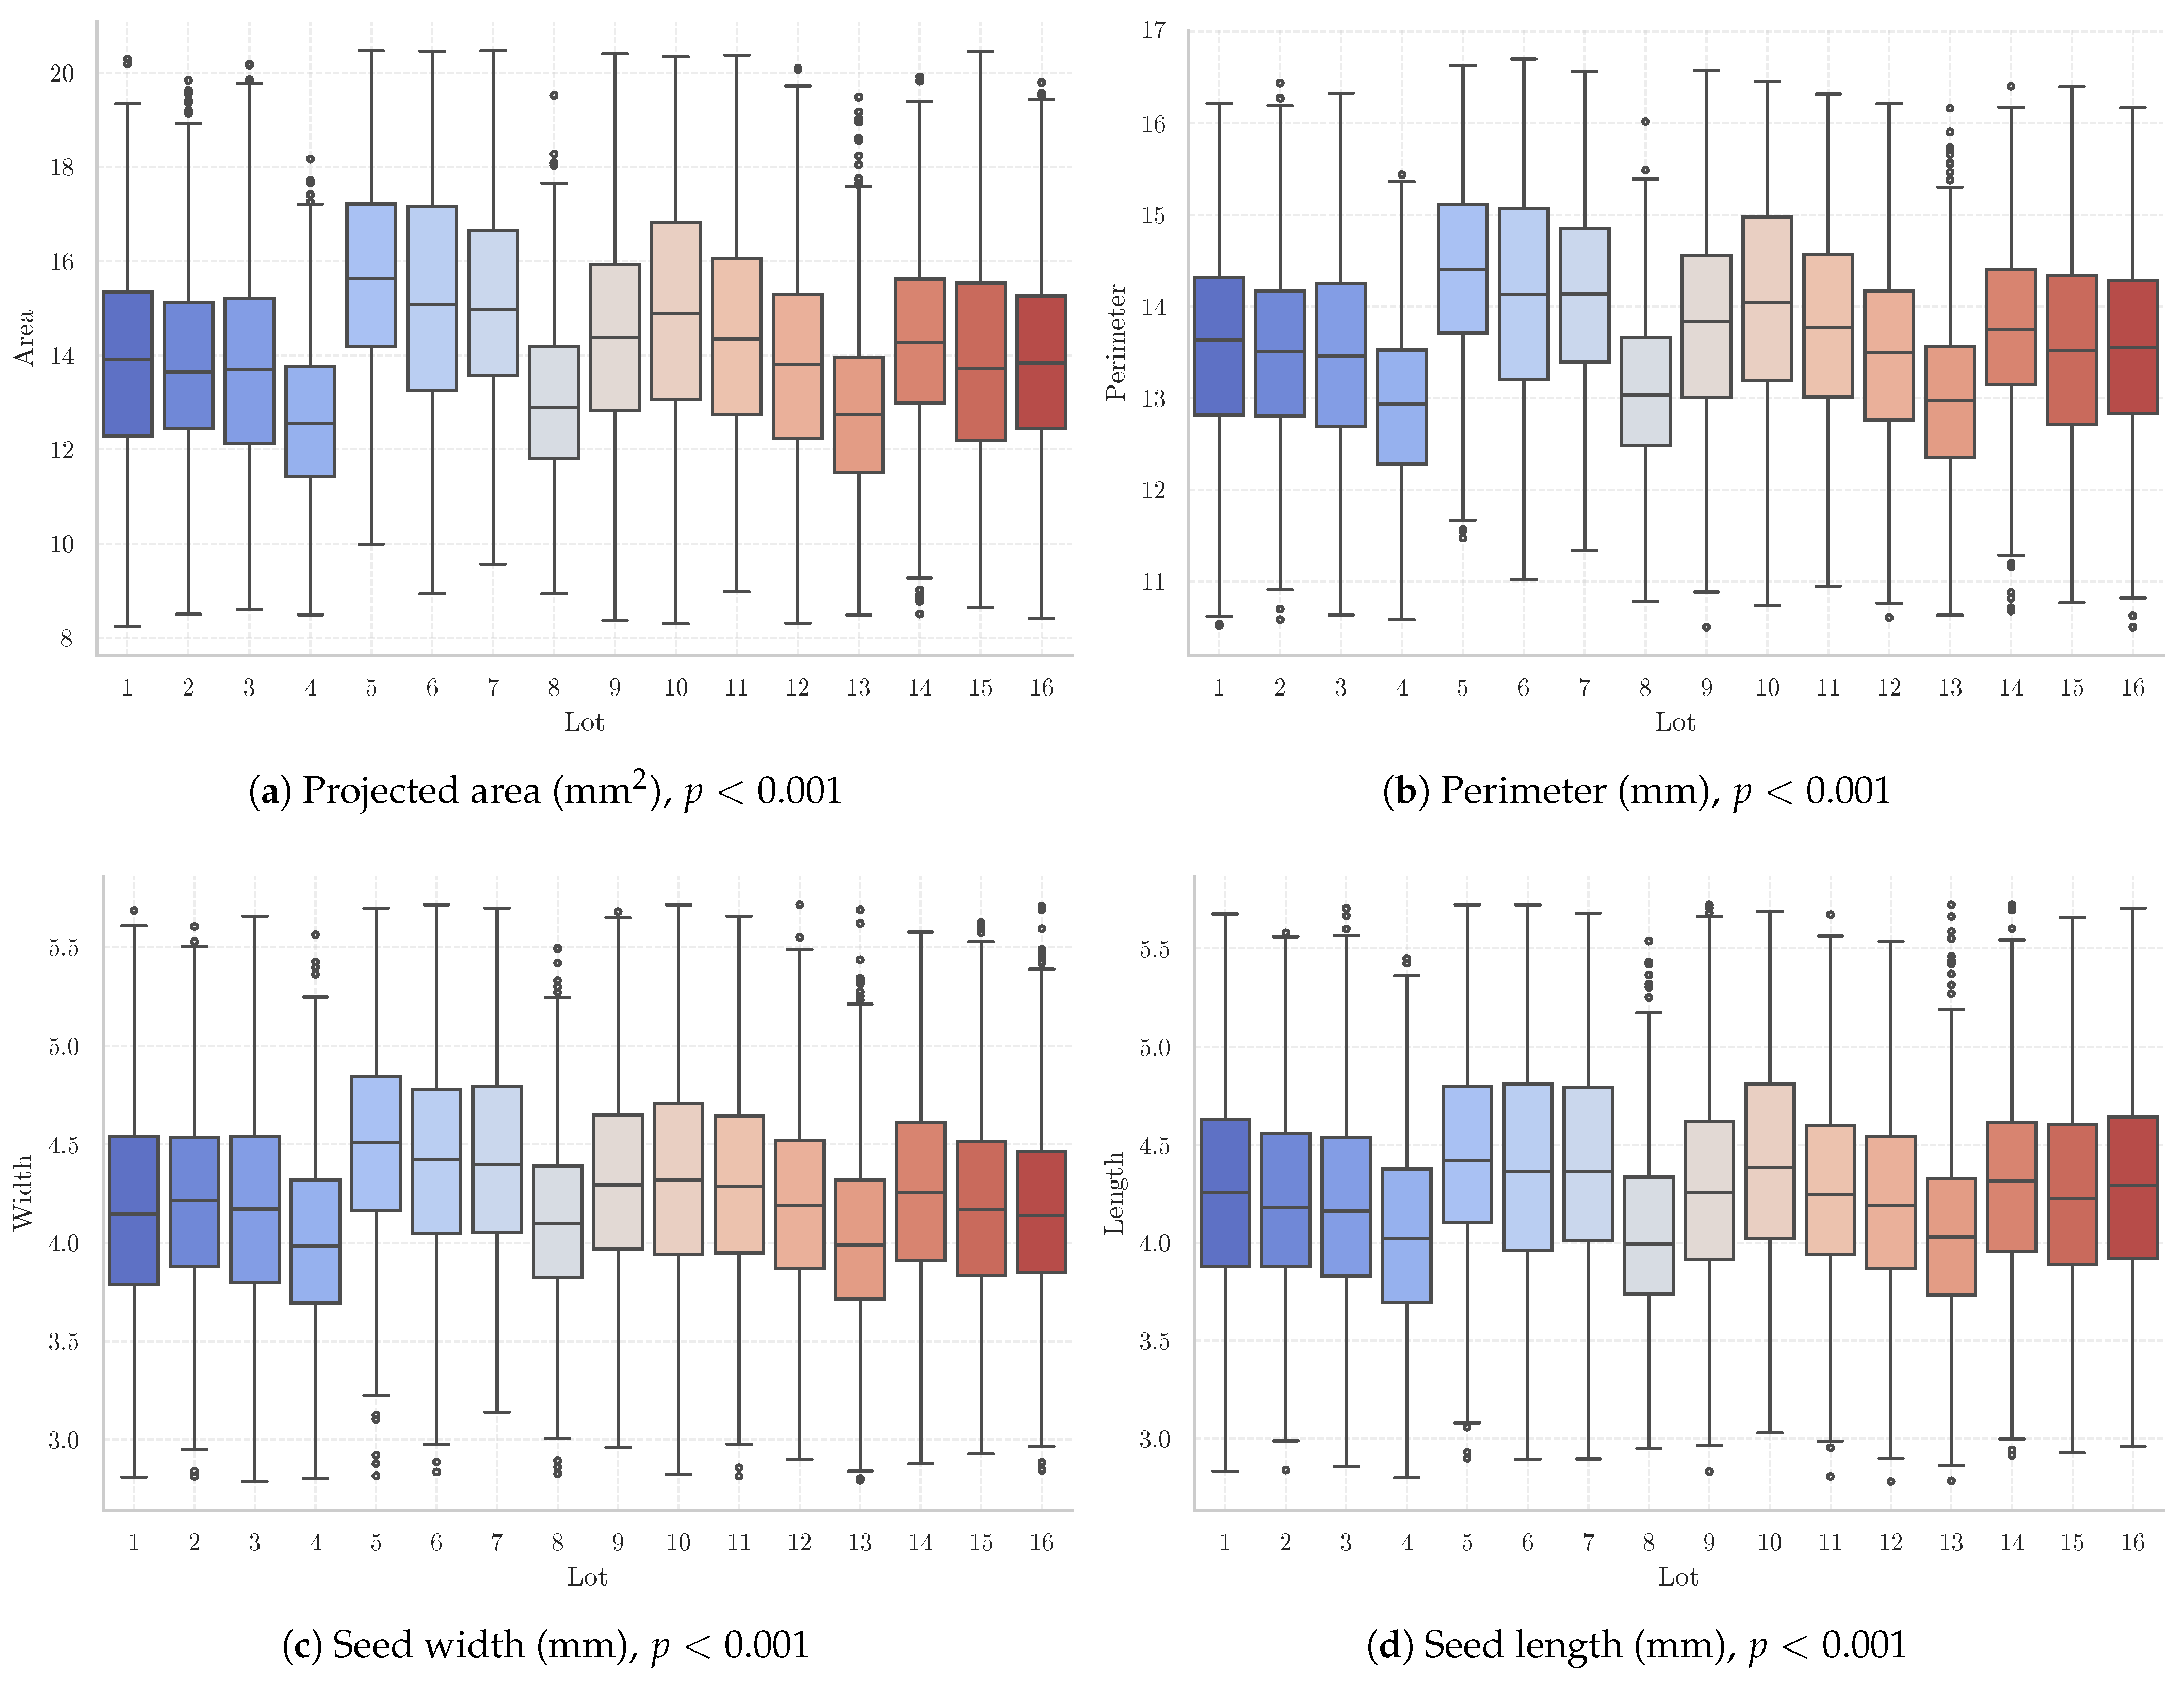
Morphometric traits differed substantially among seed lots, with area and perimeter exhibiting the broadest interquartile ranges and the strongest inter-lot differentiation (Figure 4). Length and width showed partially overlapping distributions across some lots, whereas area and perimeter accentuated size-related differences by capturing the combined effects of seed shape and size. Collectively, these observations indicate that although individual morphometric traits may overlap among seed lots, their multivariate combination delineates a biologically meaningful phenotypic structure within the species.
Figure 4.
Distribution of Genipa americana seeds across 16 seed lots from the southern coast of Bahia State, Brazil: projected area, perimeter, seed width, and seed length. Boxes represent the interquartile range, horizontal lines denote medians, and whiskers indicate data dispersion.Box colors distinguish individual seed lots and carry no additional quantitative meaning.
After curation, the final analytical dataset comprised 15,513 seeds, of which 70% were assigned to model training and validation and 30% to independent testing. The independent test set contained 4654 seeds: 2920 non-germinated and 1734 germinated, reflecting a moderate class imbalance that was addressed during model training through class-weighted learning and during evaluation by emphasizing recall, F1-score, and PR-AUC alongside overall accuracy.
RF achieved a cross-validated F1-score of compared with for SVM, suggesting that the nonlinear ensemble model captured part of the structure present in the morphometric predictor space more effectively than the linear classifier during cross-validation. However, this advantage did not persist on the independent test set, where both classifiers showed comparable performance, with a slight advantage for SVM in overall accuracy and weighted-average F1-score (Table 2). RF obtained an accuracy of 0.74 and a macro-averaged F1-score of 0.72; SVM obtained 0.75 and 0.73, respectively. These differences were small, indicating that the predictive signal available in the morphometric descriptors was not strongly dependent on the choice of classifier. Both models performed better for the non-germinated class than for the germinated class: RF F1-scores were 0.79 and 0.65 for the non-germinated and germinated classes, respectively, while SVM obtained 0.80 and 0.66. This asymmetry is operationally relevant because the germinated class is the class of direct practical interest when the objective is to retain viable propagules. Approximately one-third of germinated seeds were misclassified as non-germinated by both models, a false-negative rate with direct consequences for any seed lot screening workflow. PR-AUC values were 0.649 for RF and 0.671 for SVM; ROC-AUC values were 0.796 and 0.805, respectively, both exceeding the random classification baseline. Precision–recall and ROC curves are provided in Supplementary Figures S3 and S4.
Table 2.
Classification report for Random Forest and Linear SVM models on the independent test dataset.
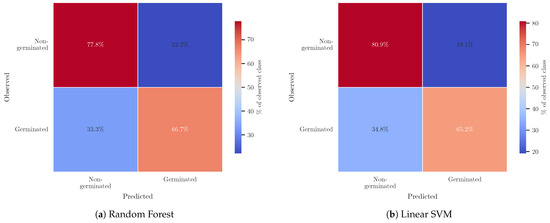
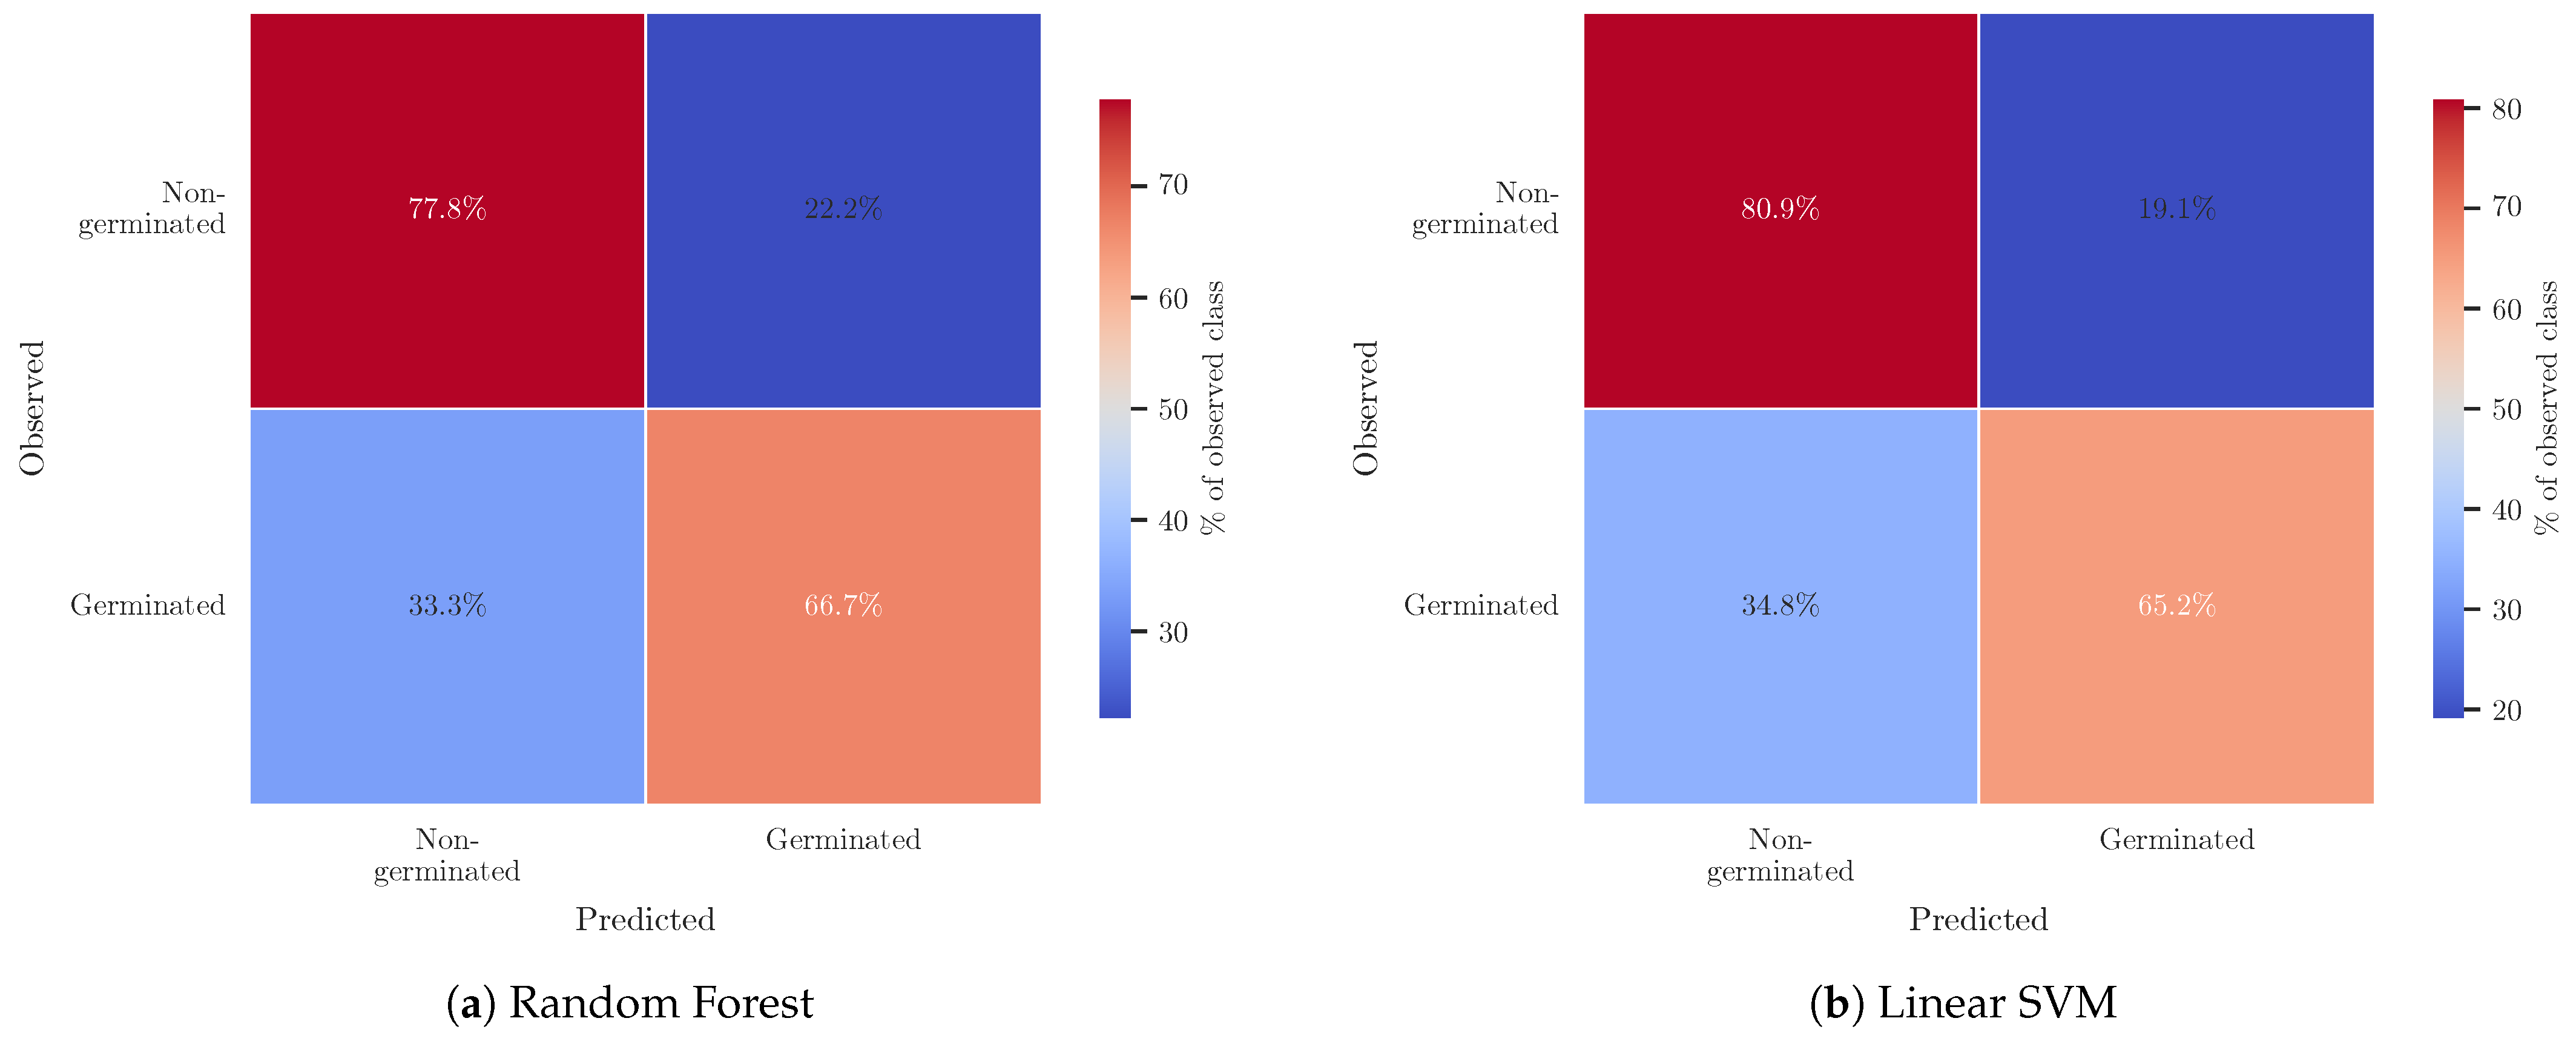
The confusion matrices showed that RF correctly classified 77.8% of non-germinated seeds and 66.7% of germinated seeds, while SVM correctly classified 80.9% and 65.2%, respectively (Figure 5). RF thus showed a slightly higher recall for the germinated class, whereas SVM showed a slightly higher recall for the non-germinated class and marginally better overall test-set performance.
Figure 5.
Confusion matrices for the (a) Random Forest and (b) Linear SVM models evaluated on the independent test dataset. Values represent the percentage of observed class instances correctly and incorrectly classified by each model.
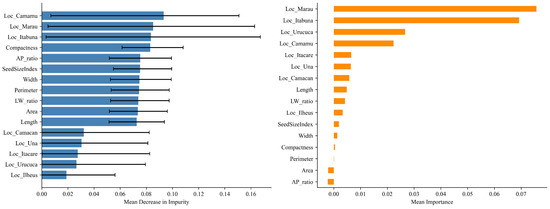
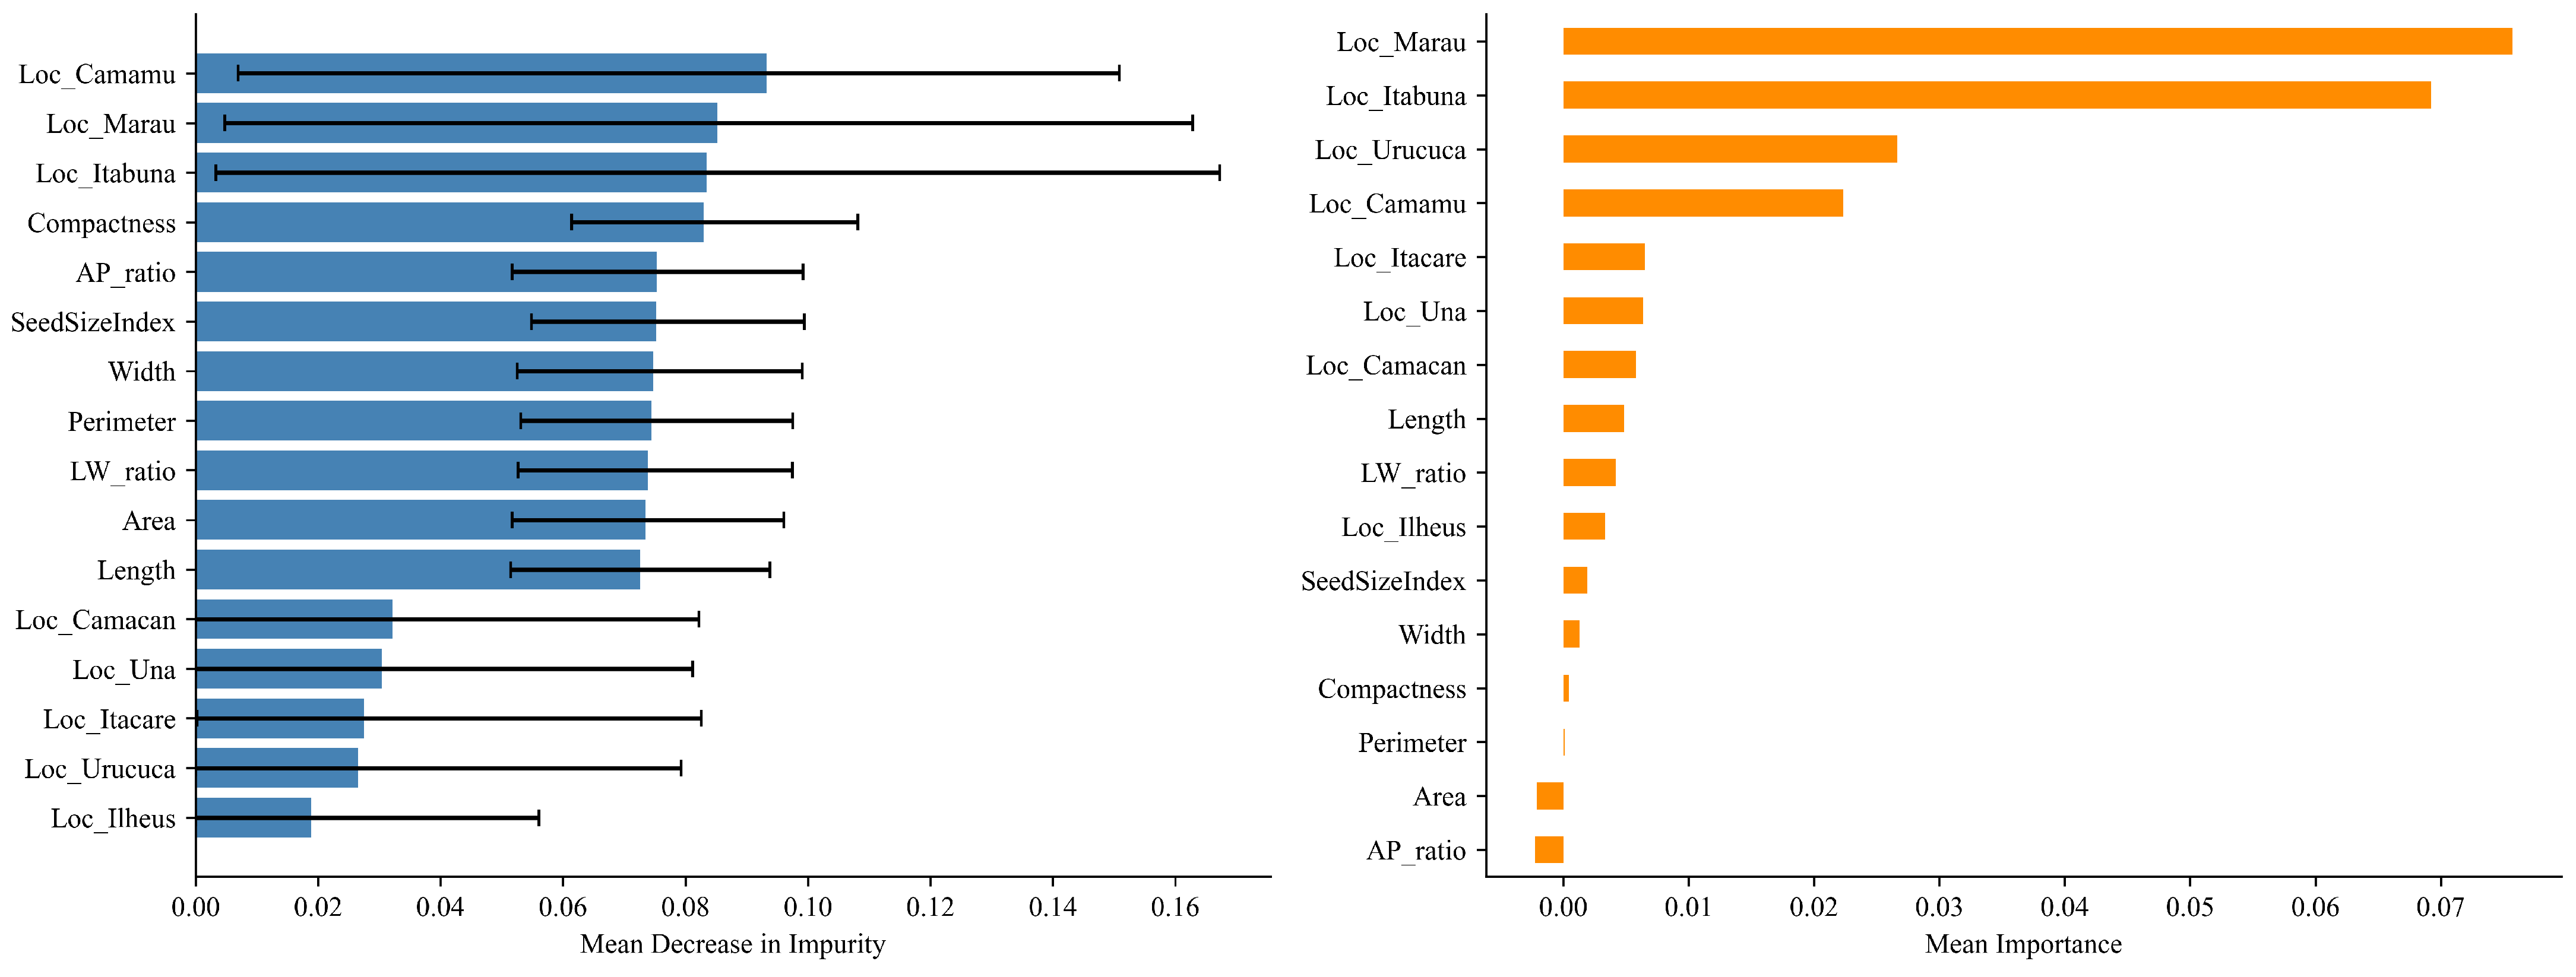
Mean Decrease in Impurity (MDI) importance, averaged across all 600 decision trees in the fitted Random Forest, and permutation importance, defined as the mean decrease in macro-averaged F1-score across 30 random permutations of each predictor on the independent test set, are reported in Figure 6. Contrary to our initial expectation, locality identity, rather than seed size or shape, received the highest importance values under both metrics, with the indicators for Maraú, Itabuna, Uruçuca, and Camamu exceeding every morphometric descriptor in permutation importance. Among the morphometric traits themselves, area, perimeter, length, and width formed a tight cluster of comparable MDI values rather than a clear area-and-perimeter-led hierarchy, and compactness contributed modestly with greater variability across trees, as reflected in its wider confidence intervals. Notably, PC1, the axis along which area and perimeter load most strongly and which separates seed lots most effectively in the differentiation analysis, carried negligible weight in the germination classification task. This indicates that the morphometric structure distinguishing provenances is largely decoupled from the structure, however limited, that distinguishes germinated from non-germinated seeds. Locality-stratified importance profiles, calculated by fitting independent Random Forest models within the seed cohort of each locality, are presented in Supplementary Figure S2.
Figure 6.
Random Forest feature importance for post-germinative root-development classification in Genipa americana seeds. The (left) panel shows Mean Decrease in Impurity (MDI) importance averaged across all 600 decision trees; error bars represent variability across trees. The (right) panel shows permutation importance computed on the held-out random-split test set, reflecting the mean decrease in macro-averaged F1-score when each predictor is randomly shuffled.
This locality dependence extended beyond feature importance to the predictive accuracy itself. Under random partitioning, the accuracy in each locality matched its own majority-class baseline to within 2.2%, indicating that apparent accuracy largely reflected the characteristic germination rate of each locality rather than genuine seed-level discrimination. Once a locality was withheld entirely from training, this advantage collapsed: balanced accuracy settled into a narrow band of 47.2–50.3% across all eight held-out localities, irrespective of how high the random-split accuracy had been. The decline was largest at Camamu and Maraú, the two localities with the most extreme germination rates (10.1% and 69.4%, respectively), where accuracy fell by approximately 30 percentage points, and smallest at Ilhéus and Uruçuca (4.3 and 4.7 points), whose rates were closest to balanced. Mean macro-F1 under LOLO cross-validation fell to and mean balanced accuracy to , statistically indistinguishable from chance. Full locality-level results under both partitioning schemes are reported in Supplementary Table S2.
3.2. Seed-Lot Morphometric Differentiation
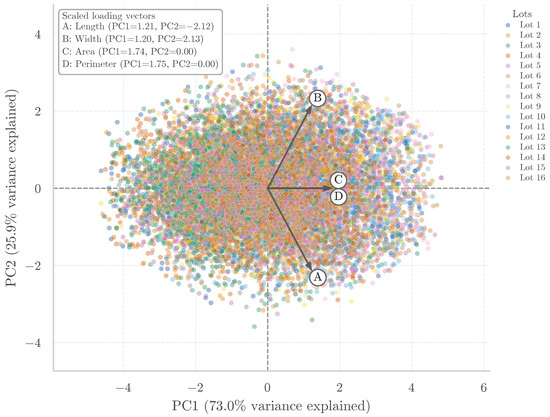
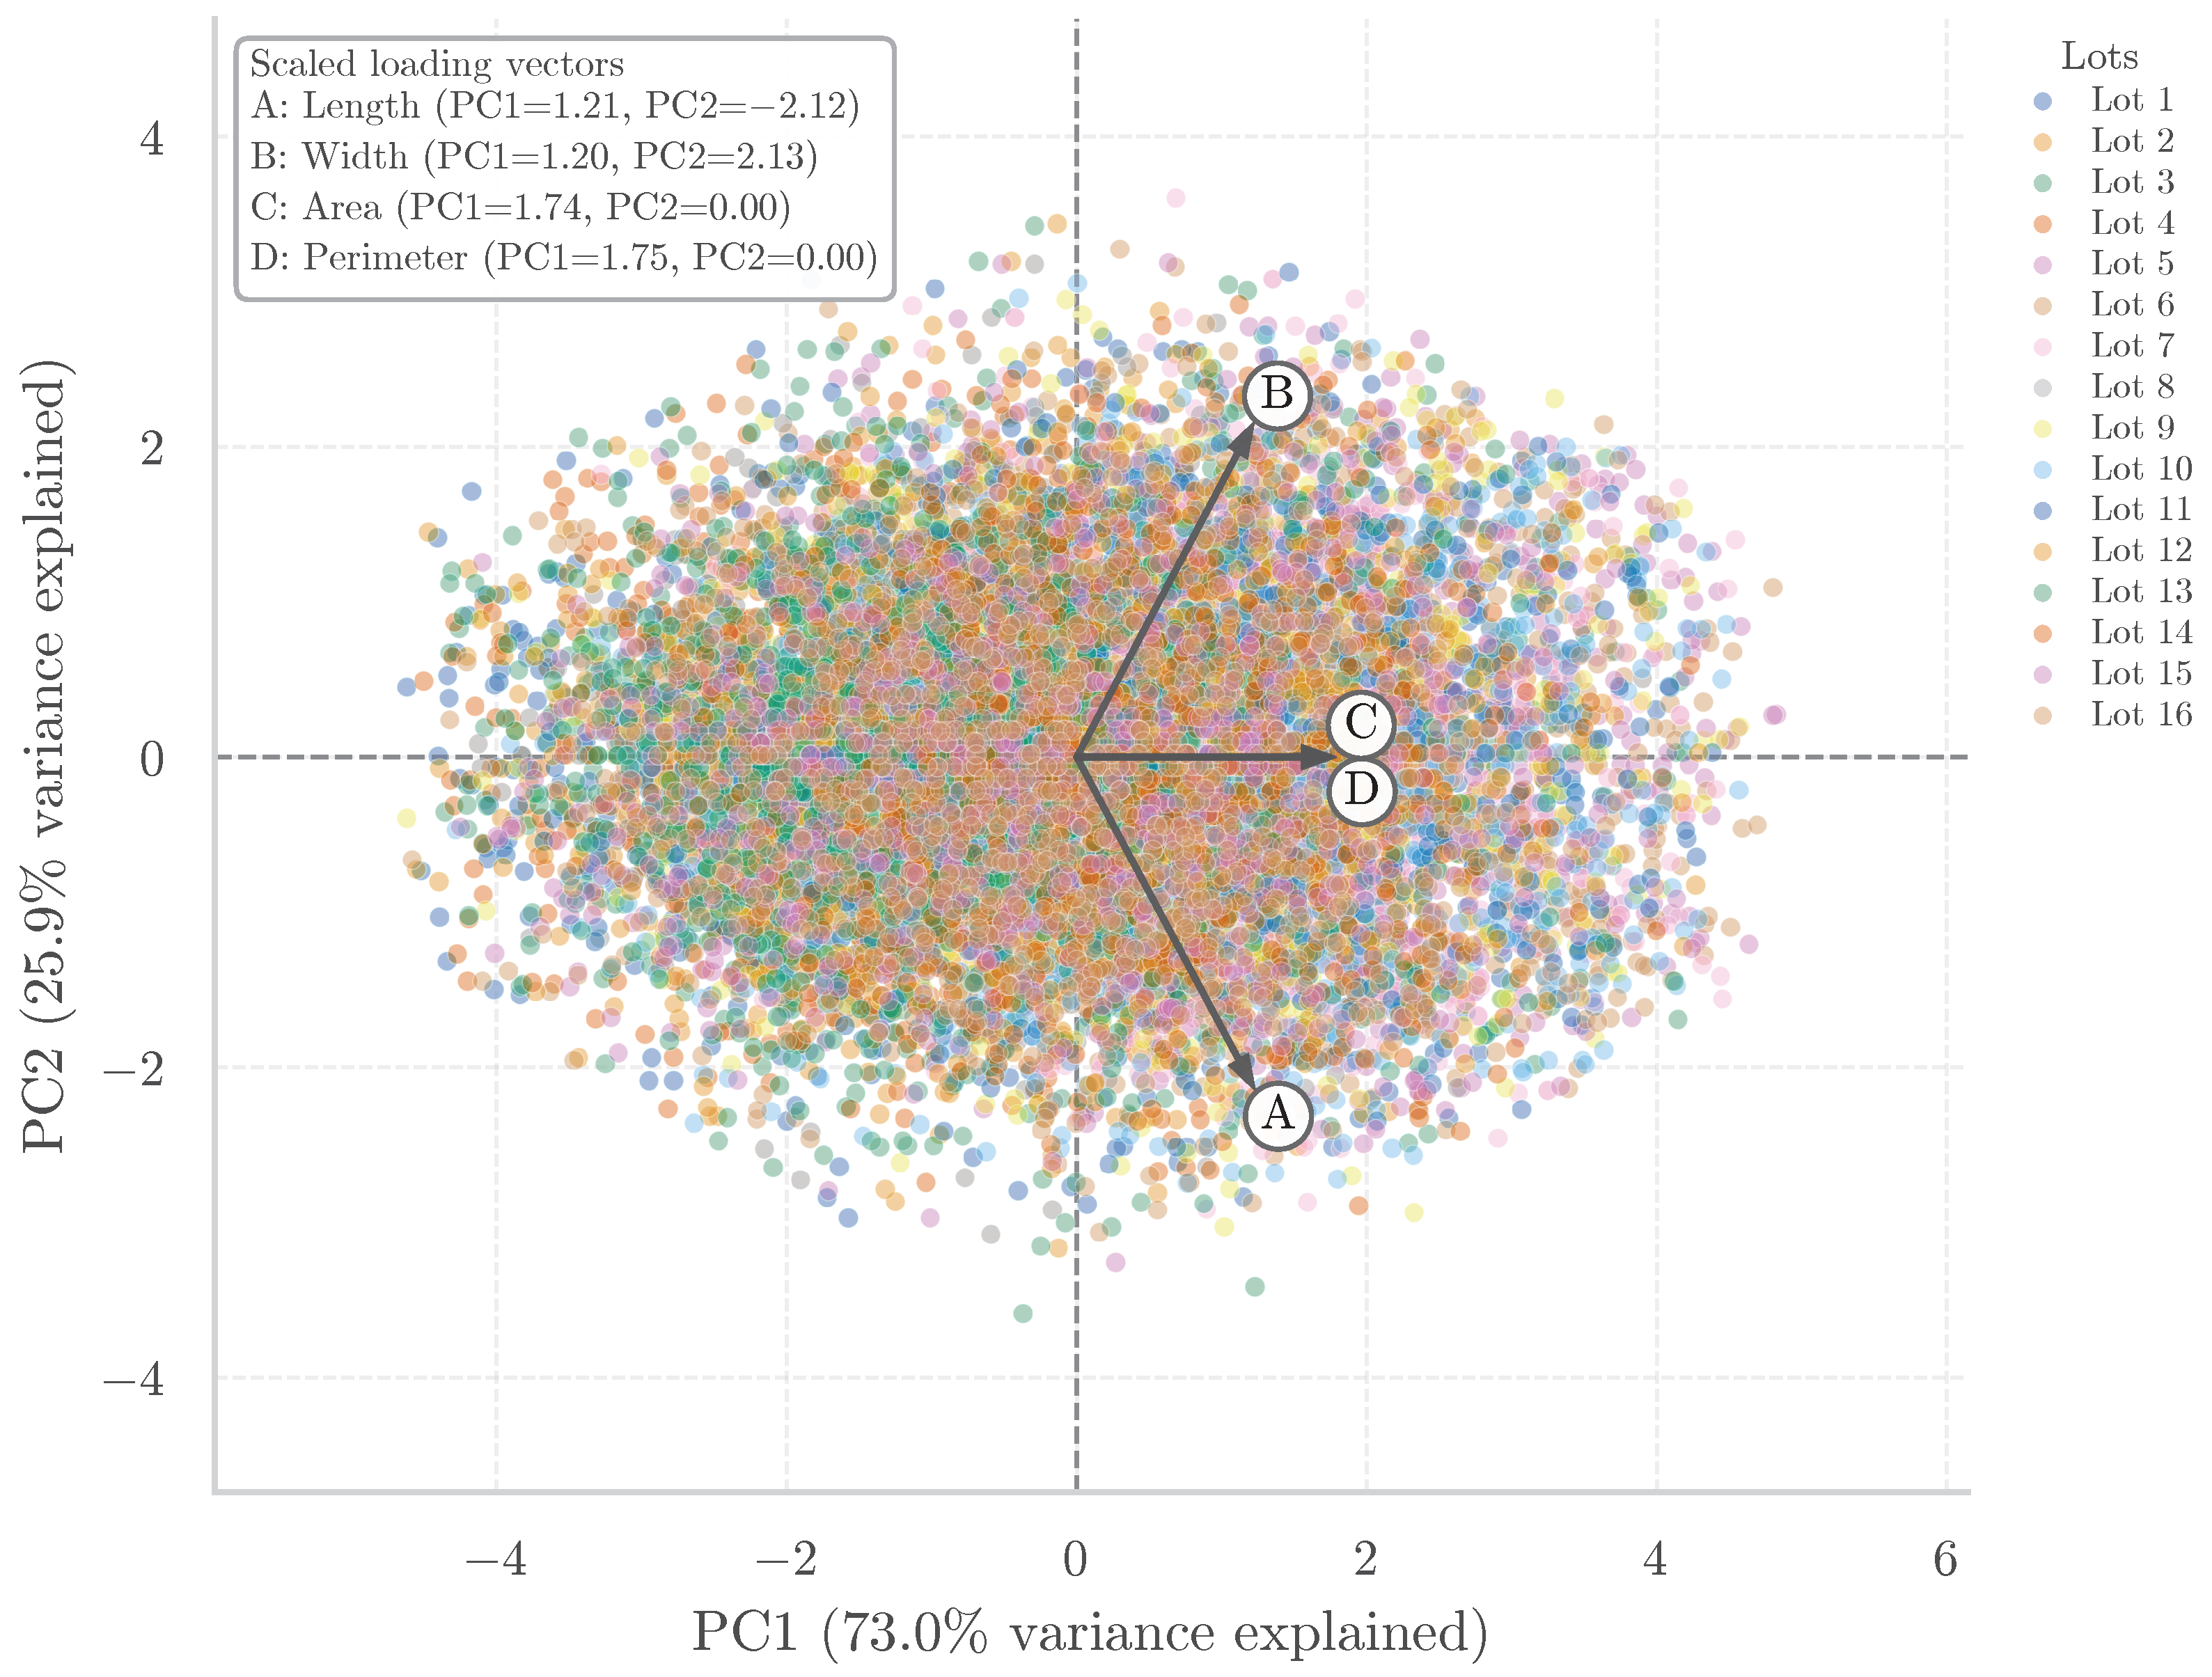
PCA of standardized morphometric traits revealed a well-defined multivariate structure among seed lots: the first two principal components together explained 98.9% of total morphometric variance (PC1: 73.0%, PC2: 25.9%), confirming that the four-dimensional trait space is effectively two-dimensional owing to strong collinearity between area and perimeter and between length and width (Figure 7). Area and perimeter loaded most strongly on PC1 (loadings of approximately 1.74 and 1.75, respectively), indicating that this axis primarily represents overall seed size, while length and width loaded on both components with opposing signs on PC2 ( and ), reflecting a dimension of seed elongation orthogonal to size [22,23]. Retaining only the two-component solution therefore captures essentially all biologically interpretable variance while avoiding the inclusion of noise dimensions.
Figure 7.
PCA of standardized morphometric traits of Genipa americana seeds. Points represent individual seeds coloured by seed lot; arrows indicate variable loadings, with area and perimeter contributing most strongly to PC1.
MANOVA confirmed a highly significant seed-lot effect across all multivariate statistics (Table 3), consistent with the PCA structure. Tukey HSD post-hoc comparisons on PC1 scores showed that the significant global result is driven by a subset of lot pairs with non-overlapping size distributions; the complete pairwise results for all 120 lot combinations are provided in Supplementary Table S3. Together, the PCA configuration and MANOVA results demonstrate that morphometric traits collectively distinguish seed lots, supporting their utility as proxies for seed-lot-level phenotypic differentiation in conservation and provenance-based restoration.
Table 3.
Multivariate analysis of variance (MANOVA) of seed morphometric traits by lot, indicating statistically significant multivariate differences. Interpretation was carried out in conjunction with PCA structure, owing to the large sample size.
4. Discussion
4.1. Morphometric Signal for Germination-Performance Classification
The machine-learning results indicate that external morphometric traits contain useful but limited information for post-germinative root-development classification in G. americana. Both classifiers achieved comparable moderate performance on the independent test set (accuracy 0.74–0.75, macro-F1 0.72–0.73, PR-AUC 0.649–0.671), with neither model clearly superior across all metrics. Both performed better for non-germinated seeds than for germinated seeds, and the confusion matrices confirmed that approximately one-third of genuinely germinated seeds were assigned the non-germinated label by both classifiers (Figure 5). In nurseries and restoration programmes, this false-negative rate would result in the unnecessary rejection of viable propagules, a consequence that is operationally significant given the irregular and spatially constrained nature of native seed supply [3]. Under conditions of seed scarcity, we recommend the classifier be used as a lot-level triage tool rather than a seed-level binary filter, directing lots with morphometrically unfavourable profiles to immediate physiological testing while allowing morphometrically favourable lots to proceed with reduced pre-screening effort. Conversely, when seed availability is high and controlled-environment chamber time is the binding operational constraint, the classifier can legitimately reduce the number of lots requiring a full 21-day germination assay.
The moderate performance ceiling is biologically plausible: two-dimensional external morphometry describes projected seed coat geometry but provides no information on embryo viability, endosperm integrity, internal pathogen load, or the metabolic status of the embryonic axis, all of which are linked to germination outcomes yet remain inaccessible to surface imaging [42,43]. Feature importance analysis reinforced this interpretation by showing that locality identity, not seed geometry, dominated the model’s discriminative power, and that PC1, the axis most responsible for inter-lot differentiation, contributed negligibly to germination classification (Figure 6). This pattern confirms the a priori distinction between H1 and H2: the morphometric structure differentiating provenances is largely decoupled from whatever residual signal separates germinated from non-germinated seeds, and the two hypotheses therefore require distinct inferential treatments rather than a single unified model. By contrast, near-infrared hyperspectral imaging and X-ray radiography combined with machine learning have achieved accuracy values of 0.80–0.92 for seed viability classification [17,42,43], substantially exceeding the present results but requiring specialised and costly equipment. Two-dimensional morphometry thus occupies a distinct niche as the lowest-cost first-pass filter in a multimodal screening hierarchy, appropriate for lot-level triage under resource constraints, with costlier modalities reserved for borderline or high-value provenances [8].
4.2. Seed-Lot Morphometric Differentiation and Implications for Restoration
The strongest evidence in this study concerns seed-lot-level morphometric differentiation. The first two PCA components jointly explained 98.9% of total morphometric variance, and MANOVA confirmed a highly significant lot effect (Wilks’ , ), with PC1 primarily representing overall seed size and PC2 capturing seed elongation orthogonal to size [22,23]. The observed differentiation is consistent with expectations that seed size and shape reflect a combination of genetic differentiation, maternal resource allocation, environmental filtering, and local adaptive processes [24,25,26]. For restoration practice, this is important because seed sourcing strategies increasingly emphasize the preservation of provenance structure and adaptive potential under environmental change [17,44].
The eight collection localities span approximately 250 km along a coast-to-interior gradient with meaningful contrasts in rainfall, atmospheric humidity, and soil type. Coastal localities such as Ilhéus, Itacaré, and Una experience mean annual rainfall typically exceeding 1800 mm, whereas interior municipalities like Itabuna and Camacan have a more pronounced dry season and differ in soil physical properties, with Argissolos becoming more prevalent at higher elevations. Maternal water availability and soil nutrient status are documented influences on seed provisioning and morphometric differentiation among populations of native tropical tree species, though the direction and magnitude of these effects vary considerably among taxa and are not consistently predictable from broad rainfall gradients alone [24,45]. The PCA pattern observed here, in which lots from some coastal municipalities occupied higher PC1 scores than others at comparable altitudes and rainfall levels, suggests that additional factors, including tree density, canopy competition, maternal genetic background, and micro-site variation in soil nutrient status, also contribute to the morphometric structure observed across lots. Resolving the relative contributions of these environmental and genetic sources of variation would require a prospective sampling design in which explicit edaphic and climatic covariates are measured at the level of individual mother trees, which we identify as a productive direction for future provenance research in this species.
For operational use, morphometric imaging is strongest as one component of a sequential screening framework in which it provides rapid, non-destructive lot-level descriptors as a first pass, with physiological, radiographic, or hyperspectral tests applied subsequently to flagged or uncertain lots. This method is particularly suited to community and regional native-species nurseries supplying Atlantic Forest restoration programmes, where lot sizes are typically small, laboratory infrastructure is limited, and cost per seed evaluated is a binding constraint. Integration with high-speed conveyor imaging systems, demonstrated for soybean and maize at throughput rates exceeding 10,000 seeds per hour [12,14], would extend applicability to large-scale operations. Future research should prioritise validation across a broader provenance range, development of species-specific germination-performance thresholds calibrated to field establishment success, and formal cost–benefit analysis comparing tiered screening frameworks against current nursery practices.
5. Conclusions
Digital morphometric phenotyping of Genipa americana seeds effectively discriminates seed lots at the provenance level, as confirmed by MANOVA (Wilks’ , ) and PCA explaining 98.9% of total morphometric variance, yet this provenance-level discriminatory power does not translate into a transferable individual-seed germination signal: Leave-One-Locality-Out cross-validation reduced balanced accuracy to chance levels () and macro-F1 to whenever a locality was withheld from training, demonstrating that models calibrated on known localities cannot reliably predict germination outcomes for morphometrically uncharacterised provenances. This decoupling between provenance-level discriminatory power and individual-level predictive transferability defines a clear functional boundary for external two-dimensional morphometry in native tropical tree seeds: it is a valid and operationally accessible descriptor of seed-lot identity and provenance structure, but its capacity to predict germination outcomes is contingent on local calibration and does not generalise to morphometrically uncharacterised provenances.
Supplementary Materials
The following supporting information can be downloaded at: https://www.mdpi.com/article/10.3390/f17070786/s1. Table S1: hyperparameters search grid used for selecting RF configuration. Table S2: Random split versus LOLO comparison. Table S3: Tukey HSD for checking pairwise significance. Table S4: Processed analytical dataset used for statistical and machine-learning analyses. Figure S1: schematic seed image used to show its axes. Figure S2: Random Forest feature importance used to ascertain contribution from morphometric features and locality. Figure S3: PR-AUC for Random Forest and Linear SVM models used to classify post-germinative root-development outcomes. Figure S4: ROC-AUC for Random Forest and Linear SVM models used to predict germination-performance outcomes.
Author Contributions
Conceptualization, R.M.B. and C.M.d.C.; data curation, A.S.M., H.R.T.N. and S.R.d.A.; formal analysis, A.S.M. and C.M.d.C.; investigation, A.S.M., H.R.T.N., S.R.d.A. and R.M.B.; methodology, A.S.M., C.M.d.C. and R.M.B.; software, A.S.M. and C.M.d.C.; validation and visualization, A.S.M., C.M.d.C. and R.M.B.; writing—original draft preparation, A.S.M.; writing—review and editing, all authors; funding acquisition, R.M.B.; resources, C.M.d.C.; project administration, R.M.B.; supervision, C.M.d.C. and R.M.B. All authors have read and agreed to the published version of the manuscript.
Funding
This study was financed in part by the Coordenação de Aperfeiçoamento de Pessoal de Nível Superior—Brasil (CAPES)—Finance Code 001 and Universidade Estadual de Santa Cruz (UESC)—Project number 073.0890.2026.0010569-16.
Institutional Review Board Statement
Not applicable.
Informed Consent Statement
Not applicable.
Data Availability Statement
The processed analytical dataset, computational notebooks, and environment files supporting the results of this study are available on Zenodo at https://doi.org/10.5281/zenodo.20261883 (accessed on 28 June 2026). Additional inquiries can be directed to the corresponding author.
Acknowledgments
The authors would like to thank Universidade Estadual de Santa Cruz and Coordenação de Aperfeiçoamento de Pessoal de Nível Superior—Brasil (CAPES).
Conflicts of Interest
The authors declare no conflicts of interest.
Abbreviations
The following abbreviations are used in this manuscript:
| RF | Random Forest |
| SVM | Support Vector Machine |
| PCA | Principal Component Analysis |
| MANOVA | Multivariate Analysis of Variance |
| ML | Machine Learning |
References
- Strassburg, B.B.N.; Iribarrem, A.; Beyer, H.L.; Cordeiro, C.L.; Crouzeilles, R.; Jakovac, C.C.; Braga Junqueira, A.; Lacerda, E.; Latawiec, A.E.; Balmford, A.; et al. Global priority areas for ecosystem restoration. Nature 2020, 586, 724–729. [Google Scholar] [CrossRef] [Scilit] [PubMed]
- Aronson, J.; Goodwin, N.; Orlando, L.; Eisenberg, C.; Cross, A.T. A world of possibilities: Six restoration strategies to support the United Nation’s Decade on Ecosystem Restoration. Restor. Ecol. 2020, 28, 730–736. [Google Scholar] [CrossRef] [Scilit]
- Pedrini, S.; Balestrazzi, A.; Madsen, M.D.; Bhalsing, K.; Hardegree, S.P.; Dixon, K.W.; Kildisheva, O. Seed enhancement: Getting seeds restoration-ready. Restor. Ecol. 2020, 28, S266–S275. [Google Scholar] [CrossRef] [Scilit]
- Food and Agriculture Organization of the United Nations. Principles for Ecosystem Restoration to Guide the United Nations Decade on Ecosystem Restoration; Food and Agriculture Organization of the United Nations: Rome, Italy, 2021. [Google Scholar]
- Brasil. Ministério da Agricultura; Pecuária e Abastecimento. Instruções para Análise de Sementes Florestais; Secretaria de Defesa Agropecuária: Brasília, Brazil, 2013.
- Virgens, P.B.S.; Conceição, T.A.; Barbosa, R.M. Tetrazolium test to evaluate viability and vigour in Genipa americana seeds. Seed Sci. Technol. 2019, 47, 307–318. [Google Scholar] [CrossRef] [Scilit]
- França-Neto, J.B.; Krzyzanowski, F.C. Use of the tetrazolium test for estimating the physiological quality of seeds. Seed Sci. Technol. 2022, 50, 31–44. [Google Scholar] [CrossRef] [Scilit]
- Hegde, R.B.; Kudva, V.; Nayak, S.; Sampathila, N.; Thalengala, A. Advanced techniques for seed quality assessment and germination monitoring. Discov. Appl. Sci. 2025, 7, 690. [Google Scholar] [CrossRef] [Scilit]
- Silva, J.C.; Silva, J.J.; Gomes, R.A.; Cruz, C.R.P.; Dantas, B.F. Seed viability of Commiphora leptophloeos (Mart.) J.B. Gillett (Burseraceae) assessed by the tetrazolium test. Int. J. Plant Biol. 2025, 16, 139. [Google Scholar] [CrossRef] [Scilit]
- Colmer, J.; Wells, R.; Bostrom, A.; Reynolds, D.; Websdale, D.; Shiralagi, G.; Lu, W.; Lou, Q.; Cornu, T.L.; Ball, J.; et al. SeedGerm: A cost-effective phenotyping platform for automated seed imaging and machine-learning based phenotypic analysis of crop seed germination. New Phytol. 2020, 228, 778–793. [Google Scholar] [CrossRef] [Scilit] [PubMed]
- Loddo, A.; Di Ruberto, C.; Vale, A.M.; Ucchesu, M.; Soares, J.M.; Bacchetta, G. An effective and friendly tool for seed image analysis. Vis. Comput. 2021, 38, 3029–3046. [Google Scholar] [CrossRef] [Scilit]
- Liu, H.; Xu, Z. Editorial: Machine vision and machine learning for plant phenotyping and precision agriculture. Front. Plant Sci. 2023, 14, 1331918. [Google Scholar] [CrossRef] [Scilit] [PubMed]
- Ghaffari, A. Precision seed certification through machine learning. Technol. Agron. 2024, 4, e019. [Google Scholar] [CrossRef] [Scilit]
- Miranda, C.; Aono, A.H.; Pinheiro, J.B. A novel image-based approach for soybean seed phenotyping using machine learning techniques. Crop Sci. 2023, 63, 2665–2684. [Google Scholar] [CrossRef] [Scilit]
- Loddo, A.; Loddo, M.; Di Ruberto, C. A novel deep learning-based approach for seed image classification and retrieval. Comput. Electron. Agric. 2021, 187, 106269. [Google Scholar] [CrossRef] [Scilit]
- Wu, L.; Xing, Y.; Yang, K.; Li, W.; Ren, G.; Zhang, D.; Fan, H. Optimizing maize germination forecasts with random forest and data fusion techniques. PeerJ Comput. Sci. 2024, 10, e2468. [Google Scholar] [CrossRef] [Scilit] [PubMed]
- Wang, Y.; Zhang, Y.; Song, A.; Guo, M.; Zhang, C.; Wang, C.; Zhao, Y.; Huang, G.; Men, Q.; Zhao, C.; et al. Precision profiling of seed coat phenotypes in maize: 3D surface morphology, color, texture traits for the construction of phenotyping interaction networks. Curr. Plant Biol. 2025, 43, 100493. [Google Scholar] [CrossRef] [Scilit]
- Santos, C.S.; Dalmolin, A.C.; Santos, M.S.; Santos, R.B.; Lima, T.M.; Pérez-Molina, J.P.; Mielke, M.S. Morphometry of the fruits of Genipa americana (Rubiaceae): A case study from the southern coast of Bahia, Brazil. Rodriguésia 2021, 72, e00652020. [Google Scholar] [CrossRef] [Scilit]
- Silva, J.S.; Santos, M.S.; Barbosa, R.M. Physiological performance of Genipa americana L. seeds primed with silicon under salt stress. J. Seed Sci. 2025, 47, e202547007. [Google Scholar] [CrossRef] [Scilit]
- Breed, M.F.; Stead, M.G.; Ottewell, K.M.; Gardner, M.G.; Lowe, A.J. Which provenance and where? Seed sourcing strategies for revegetation in a changing environment. Conserv. Genet. 2013, 14, 1–10. [Google Scholar] [CrossRef] [Scilit]
- Moles, A.T.; Westoby, M. Seedling survival and seed size: A synthesis of the literature. J. Ecol. 2004, 92, 372–383. [Google Scholar] [CrossRef] [Scilit]
- Nieto, N.; Beltrán, L.C.; Rodriguez, C.H.; Roa-Fuentes, L.L. Functional seed traits as predictors of germination and seedling growth for species with potential for restoration in Caquetá, Colombia. Trees 2023, 37, 947–961. [Google Scholar] [CrossRef] [Scilit]
- Farris, E.; Orrù, M.; Ucchesu, M.; Amadori, A.; Porceddu, M.; Bacchetta, G. Morpho-colorimetric characterization of the Sardinian endemic taxa of the genus Anchusa L. by seed image analysis. Plants 2020, 9, 1321. [Google Scholar] [CrossRef] [Scilit] [PubMed]
- Canal, G.B.; Péres, M.Z.; Almeida, F.A.N.; Araújo, M.D.S.; de Oliveira, J.T.; Santos, J.G.; de Souza, G.B.; da Silva-Ferreira, M.F.; Alexandre, R.S.; Ferreira, A. Uncovering morphometric, germination, and genetic divergence patterns in Euterpe edulis for breeding and conservation applications. Sci. Rep. 2025, 15, 33038. [Google Scholar] [CrossRef] [Scilit] [PubMed]
- Lechuga-Campuzano, J.L.; Arzate-Fernández, A.M.; García-Núñez, H.G.; Mariezcurrena-Berasáin, M.D.; Reyes Díaz, J.I. Viability and morphometry in agave seeds as an initial study for sustainable management and genetic preservation. Trop. Subtrop. Agroecosyst. 2025, 28, 1–10. [Google Scholar] [CrossRef] [Scilit]
- Bu Escobar, R.J.; Lima, T.M.; Barbosa, R.M. Genetic variability among guarana (Paullinia cupana var. sorbilis (Mart.) Ducke) provenances to support breeding strategies. Braz. J. Biol. 2025, 85, e296096. [Google Scholar] [CrossRef] [Scilit] [PubMed]
- Chen, C.; Liaw, A.; Breiman, L. Using Random Forest to Learn Imbalanced Data; Technical Report 666; University of California: Berkeley, CA, USA, 2004. [Google Scholar]
- Lemaître, G.; Nogueira, F.; Aridas, C.K. Imbalanced-learn: A Python toolbox to tackle the curse of imbalanced datasets in machine learning. J. Mach. Learn. Res. 2017, 18, 1–5. [Google Scholar]
- Van Rossum, G.; Drake, F.L. Python 3 Reference Manual; CreateSpace: Scotts Valley, CA, USA, 2009; Available online: https://www.python.org (accessed on 28 June 2026).
- van der Walt, S.; Schönberger, J.L.; Nunez-Iglesias, J.; Boulogne, F.; Warner, J.D.; Yager, N.; Gouillart, E.; Yu, T. scikit-image: Image processing in Python. PeerJ 2014, 2, e453. [Google Scholar] [CrossRef] [Scilit] [PubMed]
- Prado-Neto, M.; Dantas, A.C.V.L.; Vieira, E.L.; Almeida, V.O. Germinação de sementes de jenipapeiro submetidas à pré-embebição em regulador e estimulante vegetal. Ciência E Agrotecnologia 2007, 31, 693–698. [Google Scholar] [CrossRef] [Scilit]
- Andrade, A.C.S.d.; Souza, A.F.d.; Ramos, F.N.; Pereira, T.S.; Cruz, A.P.M. Germinação de sementes de jenipapo: Temperatura, substrato e morfologia do desenvolvimento pós-seminal. Pesqui. Agropecuária Bras. 2000, 35, 609–615. [Google Scholar] [CrossRef] [Scilit]
- Roberts, D.R.; Bahn, V.; Ciuti, S.; Boyce, M.S.; Elith, J.; Guillera-Arroita, G.; Hauenstein, S.; Lahoz-Monfort, J.J.; Schröder, B.; Thuiller, W.; et al. Cross-validation strategies for data with temporal, spatial, hierarchical, or phylogenetic structure. Ecography 2017, 40, 913–929. [Google Scholar] [CrossRef] [Scilit]
- Valavi, R.; Elith, J.; Lahoz-Monfort, J.J.; Guillera-Arroita, G. blockCV: An R package for generating spatially or environmentally separated folds for k-fold cross-validation of species distribution models. Methods Ecol. Evol. 2019, 10, 225–232. [Google Scholar] [CrossRef] [Scilit]
- Meyer, H.; Reudenbach, C.; Wöllauer, S.; Nauss, T. Importance of spatial predictor variable selection in machine learning applications—Moving from data reproduction to spatial prediction. Ecol. Model. 2019, 411, 108815. [Google Scholar] [CrossRef] [Scilit]
- Pedregosa, F.; Varoquaux, G.; Gramfort, A.; Michel, V.; Thirion, B.; Grisel, O.; Blondel, M.; Prettenhofer, P.; Weiss, R.; Dubourg, V.; et al. Scikit-learn: Machine learning in Python. J. Mach. Learn. Res. 2011, 12, 2825–2830. [Google Scholar]
- Seabold, S.; Perktold, J. Statsmodels: Econometric and statistical modeling with Python. In Proceedings of the 9th Python in Science Conference, Austin, TX, USA, 28 June–3 July 2010. [Google Scholar] [CrossRef] [Scilit]
- McKinney, W. Data structures for statistical computing in Python. In Proceedings of the 9th Python in Science Conference, Austin, TX, USA, 28 June–3 July 2010. [Google Scholar] [CrossRef] [Scilit]
- Harris, C.R.; Millman, K.J.; van der Walt, S.J.; Gommers, R.; Virtanen, P.; Cournapeau, D.; Wieser, E.; Taylor, J.; Berg, S.; Smith, N.J.; et al. Array programming with NumPy. Nature 2020, 585, 357–362. [Google Scholar] [CrossRef] [Scilit] [PubMed]
- Hunter, J.D. Matplotlib: A 2D graphics environment. Comput. Sci. Eng. 2007, 9, 90–95. [Google Scholar] [CrossRef] [Scilit]
- Waskom, M.L. Seaborn: Statistical data visualization. J. Open Source Softw. 2021, 6, 3021. [Google Scholar] [CrossRef] [Scilit]
- Onwimol, D.; Chakranon, P.; Wonggasem, K.; Wongchaisuwat, P. Non-destructive assessment of hemp seed vigor using machine learning and deep learning models with hyperspectral imaging. J. Agric. Food Res. 2025, 21, 101836. [Google Scholar] [CrossRef] [Scilit]
- Jin, B.; Qi, H.; Jia, L.; Tang, Q.; Gao, L.; Li, Z.; Zhao, G. Determination of viability and vigor of naturally-aged rice seeds using hyperspectral imaging with machine learning. Infrared Phys. Technol. 2022, 122, 104097. [Google Scholar] [CrossRef] [Scilit]
- Peña-Uribe, G.J.; Valdivia-Martínez, O.; López-Santos, A.; Valdez-Cepeda, R.D. Morphometry of castor bean seeds from the Durango State’s arid zone, Mexico. Seed Sci. Technol. 2021, 49, 247–260. [Google Scholar] [CrossRef] [Scilit]
- Saatkamp, A.; Cochrane, A.; Commander, L.; Guja, L.K.; Jimenez-Alfaro, B.; Larson, J.; Nicotra, A.; Poschlod, P.; Silveira, F.A.O.; Cross, A.T.; et al. A research agenda for seed-trait functional ecology. New Phytol. 2019, 221, 1734–1750. [Google Scholar] [CrossRef] [Scilit] [PubMed]

Disclaimer/Publisher’s Note: The statements, opinions and data contained in all publications are solely those of the individual author(s) and contributor(s) and not of MDPI and/or the editor(s). MDPI and/or the editor(s) disclaim responsibility for any injury to people or property resulting from any ideas, methods, instructions or products referred to in the content. |
© 2026 by the authors. Licensee MDPI, Basel, Switzerland. This article is an open access article distributed under the terms and conditions of the Creative Commons Attribution (CC BY) license.