


Abstract
As a typical mountain ecosystem in the western Tianshan Mountains, the Ili River Valley possesses abundant vegetation resources. Soil nematodes are effective biological indicators for evaluating soil micro-food webs. Nevertheless, the response mechanisms of nematode community structure to distinct vegetation types, especially native trees and forest-edge shrubs, remain poorly understood in this region. In this study, two dominant tree species (Picea schrenkiana and Malus sieversii) and two forest-edge shrub species (Berberis heteropoda and Berberis sibirica) were investigated. We analyzed the composition, diversity, and energy structure of rhizosphere soil nematodes and further compared their differences among plant species. The results indicated that tree rhizospheres had significantly higher amounts of nitrate nitrogen (-N and microbial biomass carbon (MBC), along with a lower amount of extractable organic carbon/extractable total nitrogen (EOC:ETN) than shrub rhizospheres (p < 0.05). Picea schrenkiana (PS) exhibited greater root carbon storage, higher root biomass, and a higher root carbon-to-nitrogen ratio (RC:RN) than Berberis heteropoda (BH) and Berberis sibirica (BS) (p < 0.05). The genus Chiloplacus dominated the nematode community across all four woody plants. The relative abundance of omnivore-predatory nematodes was markedly higher in shrubs (BH and BS) than in trees (PS and MS). The soil food webs of PS and MS were degraded, whereas shrub food webs were in a transitional state between structured and degraded habitats. Shrubs presented a higher maturity index, structural metabolic footprint, and energy flux of omnivore-predatory nematodes, but a lower energy flux of bacterivorous nematodes. Additionally, PS had the highest nematode carbon use efficiency (NCUE) and the lowest energy flux uniformity (U). -N extractable total nitrogen (ETN), soil organic carbon (SOC), and root traits were the primary factors driving variations in nematode communities and carbon indicators. Therefore, nematode carbon indicators closely associated with soil carbon and nitrogen cycling have the potential to serve as sensitive auxiliary biological metrics for evaluating material cycling and energy flow in pure forests and shrub ecosystems. This study provides empirical support for the assessment of regional ecosystem stability.
1. Introduction
Situated within the western sector of China’s Tianshan Mountain range, the Ili River Valley constitutes a distinctive “humid island” in Central Asia. This unique hydroclimatic characteristic arises from the valley’s exposure to warm, moisture-laden air masses originating from the Atlantic Ocean, which traverse extensive distances across Eurasia before reaching this inland region. The unique hydrothermal conditions and topography have formed a complete and distinctive vertical climatic zonation, which nurtures forest, grassland, and wetland ecosystems with regional characteristics [1]. The Ili River Valley is rich in herbaceous plants and retains diverse tree and shrub species, making it one of the key areas for terrestrial biodiversity conservation in China and globally [2]. Primary coniferous forests of Picea schrenkiana Fisch. et Mey. are distributed on slopes at elevations of 1300–2900 m, with strong carbon sink functions [3]. The valley also preserves the largest and best-preserved primary forest of Malus sieversii (Ledeb.) Roem. in Eurasia [4]. Species belonging to the genus Berberis—notably Berberis heteropoda Schrenk and Berberis sibirica Pall.—exhibit a pronounced affinity for subcanopy habitats and forest–ecotone margins. Their spatial aggregation generates distinctive shrub-dominated assemblages that fulfill critical functions in sustaining regional biodiversity and stabilizing ecosystem processes [5].
Soil nematodes constitute pivotal constituents of belowground food webs, functioning as critical conduits mediating energy and nutrient transfer between plant canopies and subsurface ecological processes. Because their assemblage composition and taxonomic richness respond markedly to shifts in vegetation cover and edaphic conditions, these organisms have gained broad acceptance as diagnostic metrics for soil health appraisal and ecosystem condition monitoring [5]. Nematodes serve as crucial soil biota that modulate material cycling and energy flux, while substantially contributing to terrestrial carbon dynamics [6]. These organisms govern the redistribution and retention of nutrients across heterogeneous terrain, thereby mediating biogeochemical connectivity between distinct landscape units [7]. Investigations into soil nematode assemblages inhabiting the rhizospheres of characteristic plant species across the Ili River Valley remain notably deficient. In particular, studies on the relationships between nematode carbon indicators and soil carbon or plant carbon in trees and shrubs are limited, and further research is needed for the conservation of characteristic woody plants and regional carbon cycling.
Previous studies on woody plants in the Ili River Valley have mainly focused on genetic diversity, population and community dynamics, ecological characteristics, and soil organic carbon [5,8,9,10,11,12,13]. In this study, two tree species (Picea schrenkiana, Malus sieversii) and two forest-edge mixed shrubs (Berberis heteropoda, Berberis sibirica) were selected as research objects. We analyzed soil nematode community structure, metabolic footprint, energy flux, and their relationships with environmental factors. The objectives were to (1) clarify significant differences in soil nematode community composition and structure between pure tree forests and forest-edge shrubs, (2) verify that the energy flow of soil nematode food webs is higher in shrub root zones than in tree root zones, and (3) reveal significant correlations between nematode carbon indicators and plant carbon as well as soil carbon. Based on the above research objectives and regional ecological characteristics, we proposed three explicit and testable hypotheses: (1) Tree habitats possess higher soil nutrient availability but simpler nematode food web structure compared with forest-edge shrub habitats. (2) Shrub rhizosphere environments sustain higher trophic complexity and greater energy flux of omnivore-predatory nematodes. (3) Soil available nitrogen and root functional traits jointly drive the variation in nematode carbon indicators in mountain forest ecosystems. These findings furnish empirical underpinnings for conserving biodiversity and evaluating soil health throughout the Ili River Valley.
2. Materials and Methods
2.1. Overview of the Study Area
The study area is located in the Ili River Valley of the Xinjiang Uygur Autonomous Region, with geographical coordinates ranging from 80°9′42″ E to 91°1′45″ E and 40°14′16″ N to 49°10′45″ N. Covering an area of approximately 55,300 km2, it has a temperate continental semi-arid climate. The region is surrounded by mountains on the north, east, and south, with the Awulale Mountain and Nalati Mountain crossing the middle, forming a landform pattern of “three mountains sandwiching two valleys”. The main landform types are mountains, hills, and plains. The annual average temperature is 10.4 °C, the average annual sunshine duration is 2898.4 h, and annual precipitation is 417.6 mm [14], making it the wettest region in Xinjiang. Its soil types are diverse, including chestnut soil, sierozem, meadow soil, chernozem, fluvo-aquic soil, and bog soil [15]. In this study, the 0–20 cm soil layer was selected for sampling because this layer concentrates fine roots and exhibits the highest soil biological activity in forest ecosystems; this sampling depth is widely adopted for soil nematode investigation in mountain forest habitats. Although certain omnivore-predatory nematodes prefer deeper soil layers, topsoil is more sensitive to vegetation-induced microenvironmental changes and can better reflect the rhizosphere effect of target woody plants. Considering the obvious differences in plant morphology and root architecture between trees and shrubs in mountain wild fruit forests, different root diameter thresholds were set for root carbon and nitrogen determination: ≤2 mm for shrub fine roots and ≤10 mm for tree fine roots. Shrubs naturally develop thinner fibrous roots, while trees possess thicker fine roots. Classifying roots according to plant functional types can eliminate morphological differences and ensure the comparability of root C and N stoichiometry.
2.2. Experimental Design and Sample Collection
In July 2024, two tree species (Picea schrenkiana and Malus sieversii) and two shrub species (Berberis heteropoda and sibirica) were selected from the Ili River Valley. Picea schrenkiana and Malus sieversii are endemic constructive tree species that sustain mountain forest stability in the Ili River Valley. The two Berberis shrubs are typical ecotone species widely distributed at forest edges, which regulate material exchange between forests and open land. This tree–shrub combination represents the dominant vegetation transition pattern in arid mountain wild fruit forests and has strong regional ecological representativeness. Individuals of each tree species had similar diameter at breast height (DBH), and shrubs had similar crown width and plant height. All target plants were found at 1200–1500 m elevation, 10–15° slope, and on a semi-sunny slope. For each designated woody individual, subsurface material was gathered from six to eight equidistant locations distributed circumferentially within a 20 cm radius from the stem base or central axis. Material retrieved from these points was amalgamated into a single composite specimen. This protocol was executed for six replicate individuals per taxon, yielding 24 composite specimens in total. Retrieval extended to the 0–20 cm pedological horizon using a cylindrical coring device 2.5 cm in diameter. All specimens were transferred directly into aseptically sealed containers and conveyed to the analytical facility within thermally insulated packaging maintained at 4 °C. Upon arrival, each composite specimen was partitioned: one portion underwent manual extraction of coarse fragments and root detritus prior to passage through a 2 mm mesh, with the resulting fine fraction designated for edaphic characterization and metazoan isolation; the remaining portion was desiccated under ambient atmospheric conditions, pulverized, and sequentially passed through 2 mm and 0.149 mm apertures for supplementary geochemical determinations. Concurrently, belowground axes were harvested according to diameter thresholds (≤2 mm for shrub growth forms; ≤10 mm for arborescent taxa) for stoichiometric quantification of carbon and nitrogen.
2.3. Quantification of Edaphic Physicochemical and Biogeochemical Attributes, Plus Belowground Carbon and Nitrogen Stoichiometry
Edaphic attributes were quantified following the analytical protocols outlined in Soil Agricultural Chemistry [16]. Gravimetric water content was ascertained via oven desiccation at 105 °C for 24 h. Hydrogen ion activity was measured potentiometrically using a glass electrode at a solid-to-liquid ratio of 2.5:1. Ionic strength was assessed conductimetrically at a 5:1 aqueous suspension. Organic carbon was oxidized with potassium dichromate under external thermal application and titrated volumetrically. Total nitrogen was digested by the Kjeldahl procedure. Microbial biomass carbon and nitrogen were estimated through chloroform fumigation followed by aqueous extraction [17,18]. Parallel non-fumigated specimens served to quantify extractable organic carbon and total extractable nitrogen. Ammonium and nitrate fractions were liberated with 2 mol·L−1 KCl and analyzed via segmented flow injection spectrophotometry. For belowground tissues, carbon was oxidized dichromatically with thermal augmentation, while nitrogen was quantified through Kjeldahl mineralization.
2.4. Isolation and Taxonomic Classification of Edaphic Metazoan Fauna
Metazoan microfauna were separated from 100 g aliquots of field-moist subsurface material by sucrose density-gradient centrifugation [19] and counted under a Motic SMZ-140 stereomicroscope (Motic China Group Co., Ltd., Xiamen, China). From every composite specimen, a subsample comprising 200 individuals was drawn by stochastic selection; where population density fell below this threshold, exhaustive enumeration of all recovered specimens was performed. Nematodes were identified under an Olympus CX41 biological microscope (Olympus Corporation, Tokyo, Japan) according to De Nematoden van Nederland [20], Illustrated Key to Chinese Soil Fauna [21], and Forest Soil Nematodes of Changbai Mountain [22]. It should be noted that morphological identification has inherent limitations. Morphological similarities between closely related nematode species may cause potential misclassification. In future research, molecular identification techniques can be used to assist species identification to improve classification accuracy.
2.5. Calculation of Ecological Indices, Metabolic Footprints, and Energy Fluxes
Dominant, common, and rare nematode genera were classified based on relative 129 abundances of ≥10%, 1%–10%, and <1%, respectively. Subsequently, specimens were allocated to trophic guilds predicated upon buccal apparatus morphology and ingestive behavior: microbivores targeting bacterial prey (BF), mycophagous consumers (FF), generalist predators and omnivorous taxa (OP), and phytophagous parasites (PP) [22]. Specimens were further categorized into five colonizer–persister (cp) assemblages reflecting differential adherence to r-selected and K-selected life-history syndromes [23]. Ecological indices of soil nematodes under different woody plants were calculated based on the relative abundance or abundance of nematode genera and groups. Metabolic footprints, carbon respiration, carbon production, energy flux (carbon flux), and nematode carbon use efficiency were calculated based on nematode biomass. The formulas are as follows.
where pi is the percentage of the i-th nematode group.
where v(i) represents the cp value from 1 to 5 assigned according to life history strategy, and f(i) represents the proportion of free-living nematode families/genera in the nematode community.
Shannon–Wiener diversity index (H′): H′ = −Σpi(lnpi)
Maturity index of free-living nematodes (MI): MI = Σv(i)f(i)
Wasilewska index (WI): WI = (BF + FF)/PP
BF: abundance of bacterivores; FF: abundance of fungivores; PP: abundance of plant-parasitic nematodes.
where e = enriched component of the food web (mainly bacterivores and fungivores with cp values of 1–2); b = basal component of the food web (mainly bacterivores and fungivores with cp value of 2); and s = structured component of the food web (including bacterivores, fungivores, plant-parasitic nematodes, and omnivore-predators with cp values of 3–5).
where Nt = individual number of nematodes in group t; mt = cp value of nematodes in group t; Wt = biomass (fresh weight) of nematodes in group t, for which values listed in Nemaplex (accessed on 12 May 2026) can be used; and F = nematode energy flux (μg C/100 g dry soil day−1) [7,24].
Enrichment index (EI): EI = 100 × e/(b + e)
Structure index (SI): SI = 100 × s/(b + s)
Energy flux between nodes (Fi): Fi = (F + L)/ea
Energy loss (L): L = Dio × Fo
2.6. Estimation of Root Biomass and Calculation of Carbon Storage in Different Woody Plants
Related research methods were adopted in this study [12,28,29,30]
Root biomass of Picea schrenkiana: WR = 0.03654 × D2.3619
Root biomass of Malus sieversii: WR = 0.015 × (D2H)0.976
Root biomass of Berberis heteropoda: WR = −3061.6 + 1251.5(D2H) − 1.86
× (D2H)2.33 − 0.02 × (D2H)4.94
× (D2H)2.33 − 0.02 × (D2H)4.94
Root biomass of Berberis sibirica: WR = 0.446 × (D2H)2 + 2.352 × (D2H) + 0.060
Root carbon stock = Root biomass × root carbon concentration
2.7. Data Analysis
Primary datasets were collated, and edaphic metazoan ecological metrics were computed through Microsoft Excel 2017. Distributional normality was evaluated via the Kolmogorov–Smirnov procedure executed in SPSS 26.0, whereas variance equivalence across groups was scrutinized by Levene’s procedure. Simultaneous satisfaction of both criteria—exceeding the 0.05 probability threshold for each respective test—permitted classification as Gaussian-distributed with homogeneous dispersion. For datasets meeting these parametric assumptions, unidirectional variance decomposition (ANOVA) was conducted, with post hoc pairwise differentiation assessed through Duncan’s multiple-range comparison. Data that were normal but heteroscedastic were log-transformed or square-root transformed before ANOVA. The transformation type was determined based on the spatial distribution characteristics of nematode populations; log-transformation was used for aggregated distributions, whereas square-root transformation was applied for random or slightly aggregated distributions. Non-parametric tests were used for data that still failed normality or homogeneity after transformation. Correlation analysis was performed using the Pearson correlation coefficient. Linear regression and figure plotting were conducted using Origin 2024.
3. Results
With the exception of gravimetric water content and microbial biomass nitrogen, all remaining edaphic parameters exhibited statistically discernible variation across the arborescent and frutescent taxa under investigation (p < 0.05; Table 1). Nitrate nitrogen and microbial biomass carbon within the rhizospheres of PS and MS registered markedly elevated concentrations relative to those associated with BH and BS, whereas the extractable organic carbon-to-total nitrogen quotient was correspondingly diminished in these latter taxa (p < 0.05). Organic carbon, extractable organic carbon, extractable total nitrogen, the soil organic carbon-to-total nitrogen ratio, and the microbial biomass carbon-to-nitrogen ratio within the PS rhizosphere all exceeded values recorded for BH and BS; conversely, hydrogen ion activity was depressed in PS relative to these shrub taxa (p < 0.05). For MS, both hydrogen ion activity and total nitrogen surpassed levels detected in BS. Additionally, the microbial biomass carbon-to-nitrogen ratio in PS exceeded that of both BH and BS (p < 0.05).
Table 1.
Soil physical and chemical properties in the root zone of different woody plants.
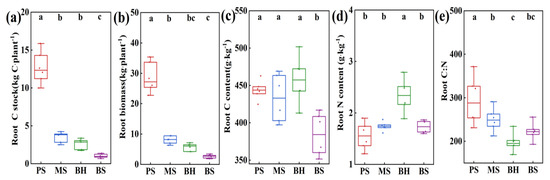
Belowground carbon sequestration, axial biomass, carbon concentration, nitrogen concentration, and the carbon-to-nitrogen stoichiometric quotient all manifested statistically discernible divergence across the investigated taxa (p < 0.05). PS exceeded both Berberis species in belowground carbon sequestration, axial biomass, and carbon-to-nitrogen stoichiometry (p < 0.05; Figure 1a,b,e). The root carbon content (RC) of BS was significantly lower than that of trees (Figure 1c), whereas the root nitrogen content (RN) of BH surpassed levels recorded for arborescent taxa (p < 0.05) (Figure 1d).
Figure 1.
Belowground carbon sequestration, axial biomass, and elemental stoichiometry across distinct growth forms. (a) Carbon sequestered per individual (kg C·plant−1). (b) Axial biomass per individual (kg·plant−1). (c) Carbon concentration (g·kg−1). (d) Nitrogen concentration (g·kg−1). (e) Carbon-to-nitrogen stoichiometric quotient. Rectangles demarcate the interquartile span (25th–75th percentiles), with the central tendency indicated by the horizontal line; vertical extensions denote the full observational range. Dissimilar lowercase superscripts denote statistically discernible divergence among taxa (p < 0.05).
3.1. Analysis of Nematode Community Composition in the Root Zones of Different Woody Plants
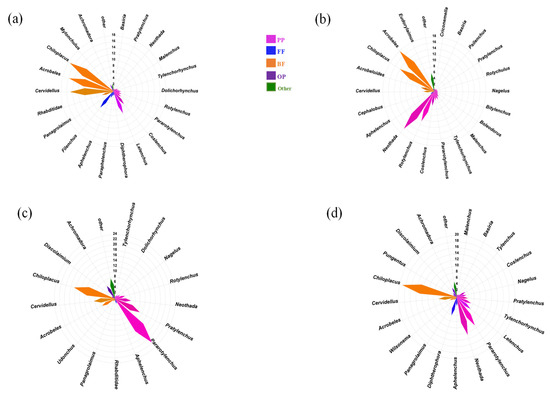
A total of 57 nematode genera belonging to 2 classes, 6 orders, and 21 families were identified in this study. The number of genera identified in the root zones of PS, MS, BH, and BS was 29, 38, 33, and 35, respectively. The number of genera with relative abundance ≥ 1% was 21, 21, 16, and 20, respectively. Chiloplacus showed a relative abundance of >10% in the root zones of all four plant species. Other dominant genera were as follows: PS (Acrobeles, 15.78%; Cervidellus, 14.92%) (Figure 2a); MS (Acrobeles, 17.95%; Neothada, 16.29%; Rotylenchus, 10.82%) (Figure 2b); BH (Pararotylenchus, 22.10%; Pratylenchus, 11.02%) (Figure 2c); and BS (Neothada, 12.81%; Pararotylenchus, 11.06%) (Figure 2d). In terms of community composition, the soil nematode communities in the root zones of BH and BS were similar, but both differed greatly from those of MS and PS (Figure 2c,d).
Figure 2.
Proportional representation of edaphic metazoan genera across rhizospheres of distinct growth forms. (a) Picea schrenkiana rhizosphere assemblage. (b) Malus sieversii rhizosphere assemblage. (c) Berberis heteropoda rhizosphere assemblage. (d) Berberis sibirica rhizosphere assemblage. PP: phytophagous parasites; FF: mycophagous consumers; BF: microbivorous taxa; OP: omnivorous and predatory guilds; Other: supplementary functional categories.
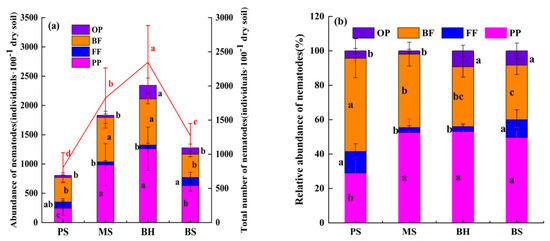
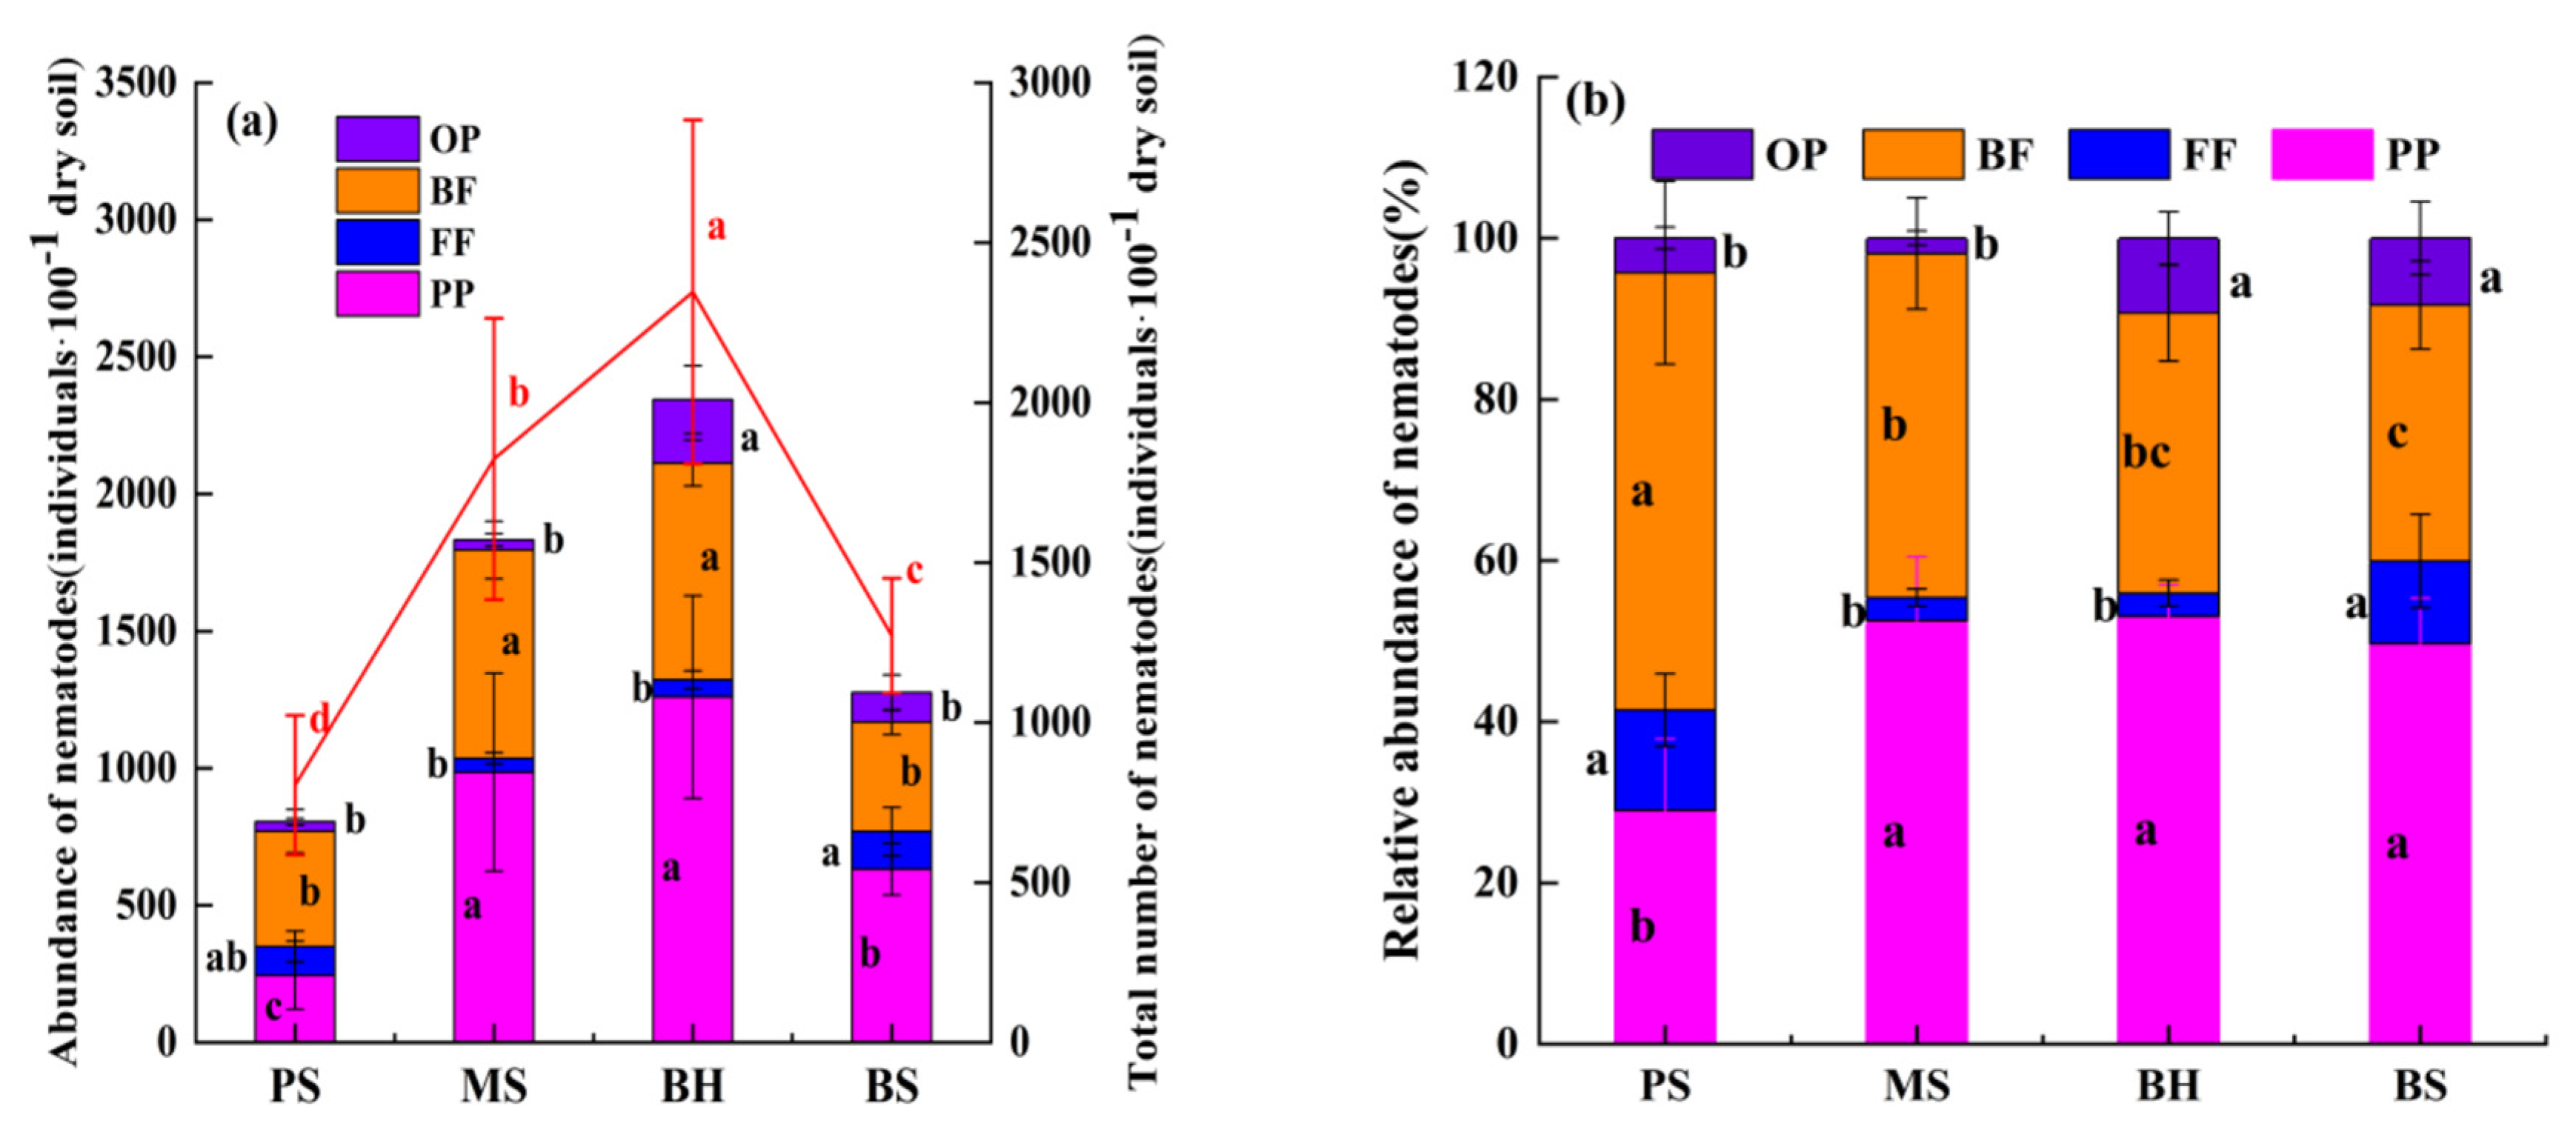
Aggregate metazoan population density exhibited statistically discernible divergence across the investigated growth forms (p < 0.05; Figure 3a). MS rhizospheres harbored elevated densities of both phytophagous parasites and microbivorous taxa relative to BS, whereas omnivorous-predatory guilds attained greater abundance within BH rhizospheres than in arborescent taxa (Figure 3a). Proportional representation of microbivorous consumers peaked in PS at 54.26%, surpassing values recorded for frutescent taxa; conversely, phytophagous parasites constituted merely 29.00% in PS, falling below proportions detected in both shrub species (Figure 2a and Figure 3b). Omnivorous-predatory guilds within BH and BS rhizospheres exceeded those associated with PS and MS (Figure 2 and Figure 3b).
Figure 3.
Aggregate population density and trophic guild composition of edaphic metazoan assemblages across distinct rhizosphere environments. (a) Cumulative bar representation of absolute densities for four functional guilds—phytophagous parasites (PP), mycophagous consumers (FF), microbivorous taxa (BF), and omnivorous-predatory forms (OP)—within each investigated taxon, with the superimposed crimson trace denoting total individuals recovered. (b) Cumulative bar representation of proportional representation (%) for the aforementioned guilds across taxa. Dissimilar lowercase superscripts within any horizontal array denote statistically discernible divergence (p < 0.05).
3.2. Analysis of Soil Nematode Community Diversity and Faunal Analysis
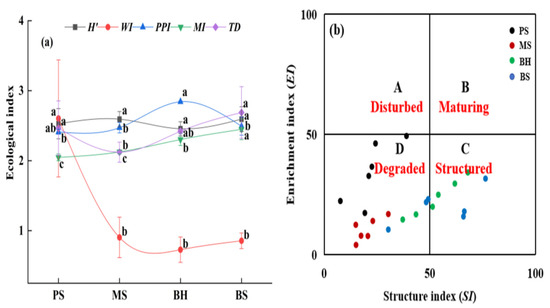
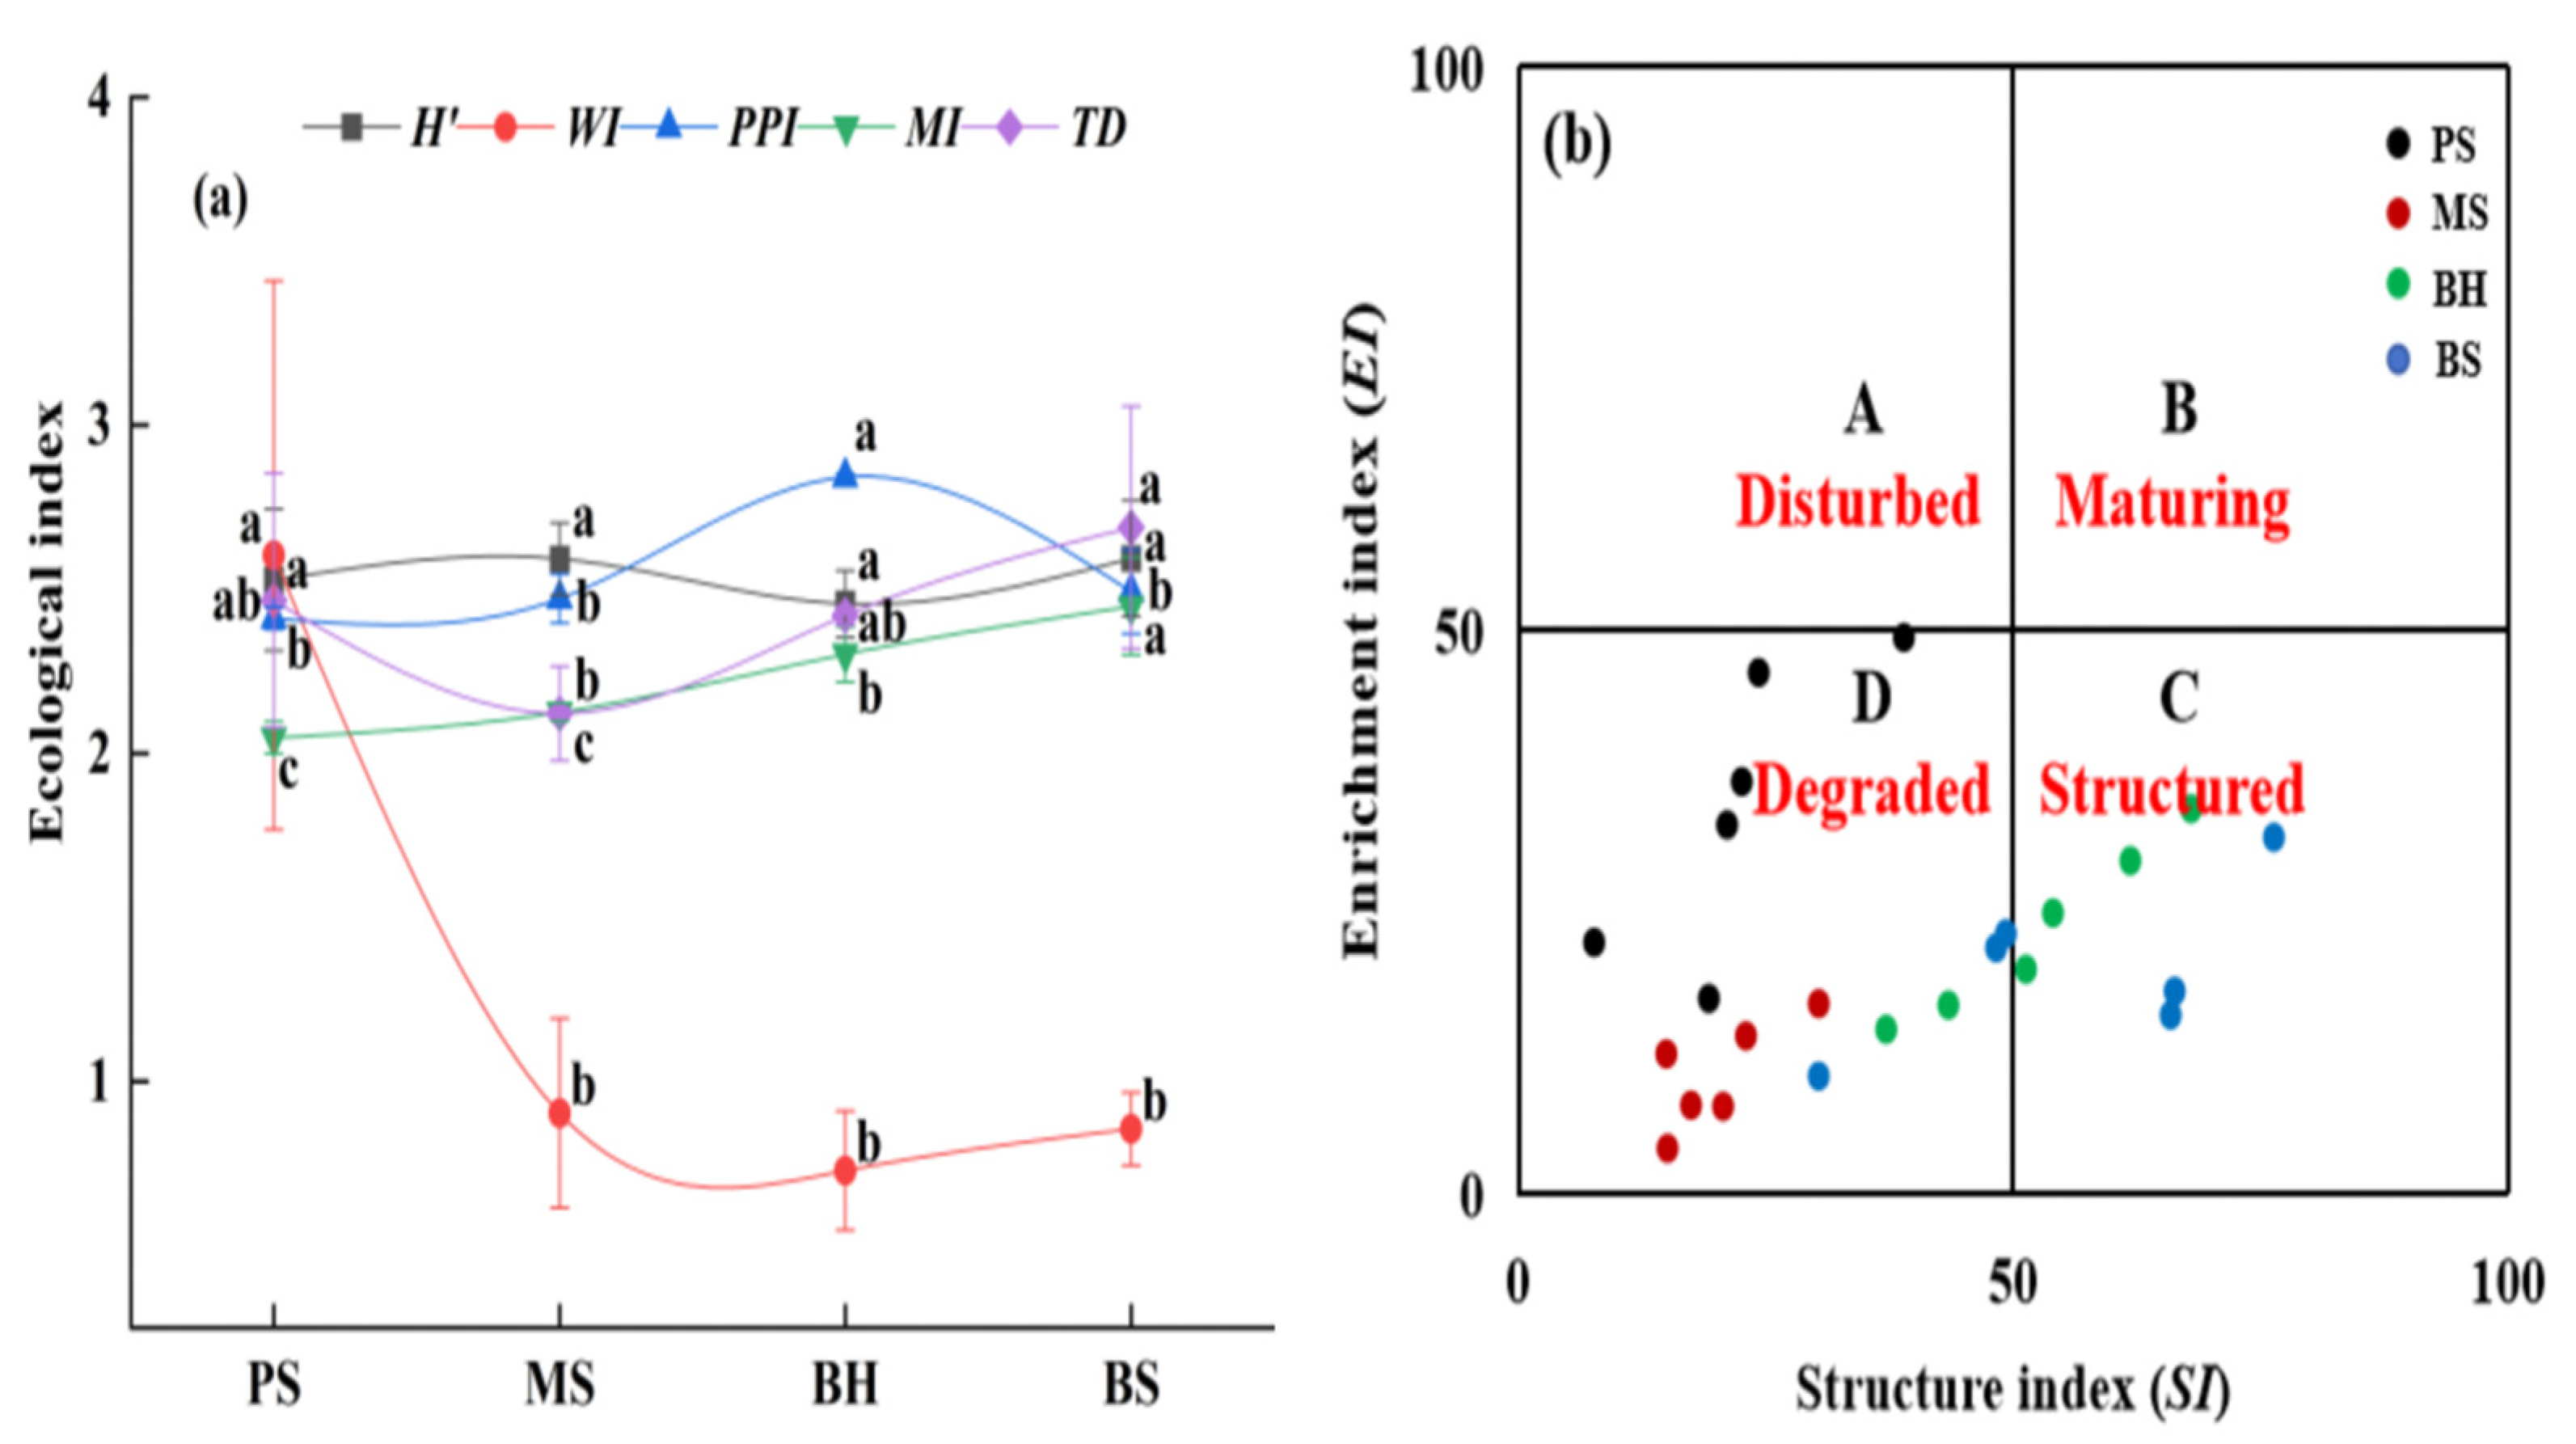
As depicted in Figure 4, the Wasilewski Index (WI) for edaphic metazoan assemblages within PS rhizospheres surpassed values recorded for frutescent taxa (p < 0.05). Conversely, the Plant Parasite Index (PPI) attained a greater magnitude in Berberis heteropoda (BH) rhizospheres relative to arborescent counterparts. The Maturity Index (MI) for free-living forms exceeded arborescent levels in both shrub species (p < 0.05). Trophic diversity (TD) in B. sibirica (BS) outpaced that associated with Malus sieversii (MS) (p < 0.05; Figure 4a). Faunal profiling positioned nematode assemblages within PS and MS rhizospheres in Quadrant D, indicative of a degraded trophic architecture. In contrast, those in BH and BS occurred in both Quadrant C and Quadrant D, indicating a more structured food web (Figure 4b).
Figure 4.
Community-level metrics and faunal profiling of edaphic metazoan assemblages across distinct belowground habitats. (a) Variation in soil nematode ecological indices. (b) Nematode faunal analysis plot classifying soil food webs into four quadrants. H’: Shannon–Wiener diversity index; WI: Wasilewska index; PPI: plant parasite index; MI: maturity index; TD: trophic diversity; EI: enrichment index; SI: structure index. Note: Dissimilar lowercase superscripts denote statistically discernible divergence (p < 0.05).
3.3. Analysis of Nematode Metabolic Footprints in the Root Zones of Different Woody Plants
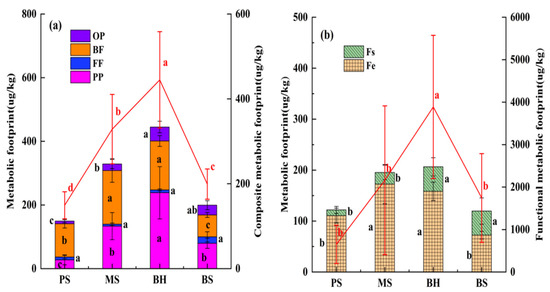
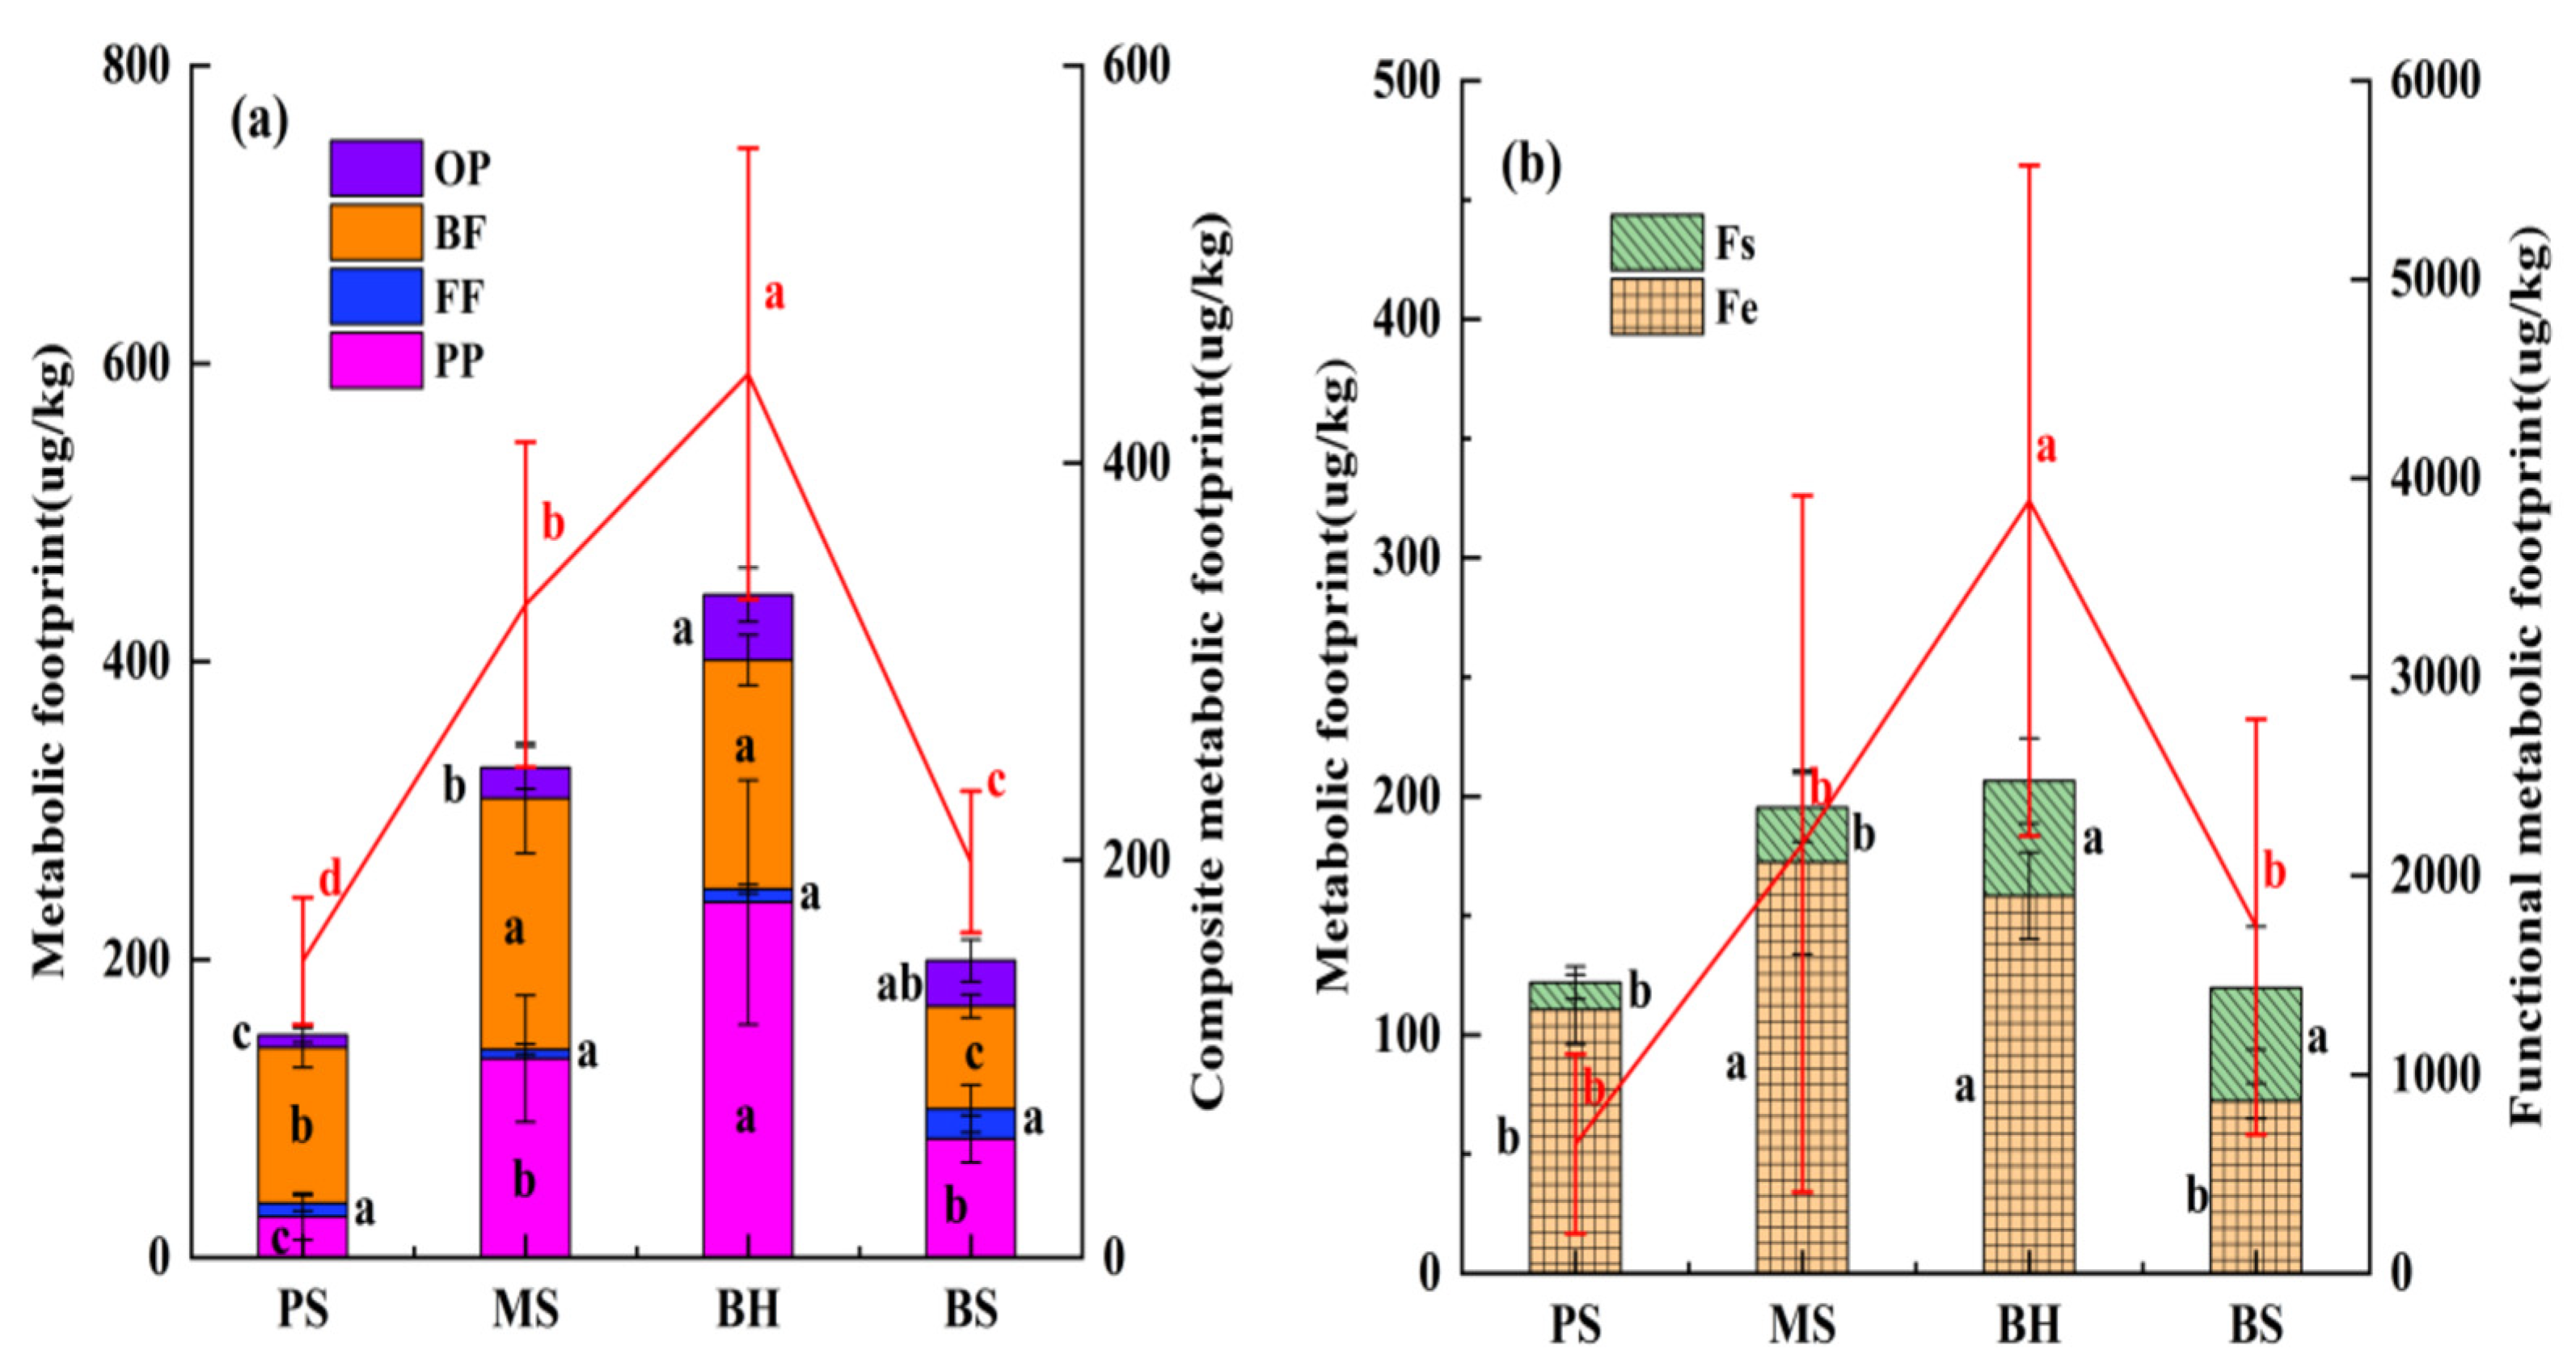
As shown in Figure 5, the metabolic footprints of plant-parasitic nematodes, bacterivorous nematodes, and omnivore-predator nematodes, as well as composite, enrichment, structural, and functional metabolic footprints, all differed significantly among woody plant species (p < 0.05, Figure 5). The plant-parasitic nematode metabolic footprint, composite metabolic footprint, and functional metabolic footprint of BH were significantly higher than those of the two trees (p < 0.05, Figure 5). The structural metabolic footprints of the two shrub species (BH and BS) were significantly higher than those of the two tree species (PS and MS) (p < 0.05, Figure 5b).
Figure 5.
Metabolic imprints of edaphic metazoan functional guilds across distinct rhizosphere environments. (a) Cumulative bar representation of absolute metabolic imprints for four trophic categories—phytophagous parasites (PP), mycophagous consumers (FF), microbivorous taxa (BF), and omnivorous-predatory forms (OP)—within each investigated taxon, with the superimposed crimson trace denoting aggregate community imprint. (b) Cumulative bar representation of structural (Fs) and enrichment (Fe) functional imprints across taxa. Dissimilar lowercase superscripts within any horizontal array denote statistically discernible divergence (p < 0.05).
3.4. Variations in Nematode Carbon Utilization Efficiency in the Root Zones of Different Woody Plants
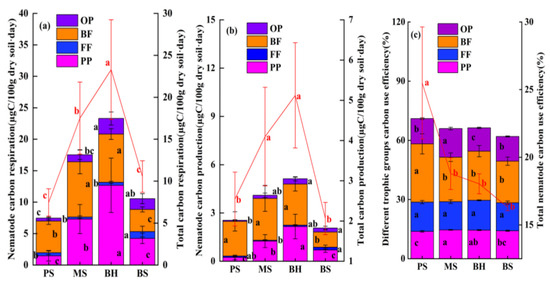
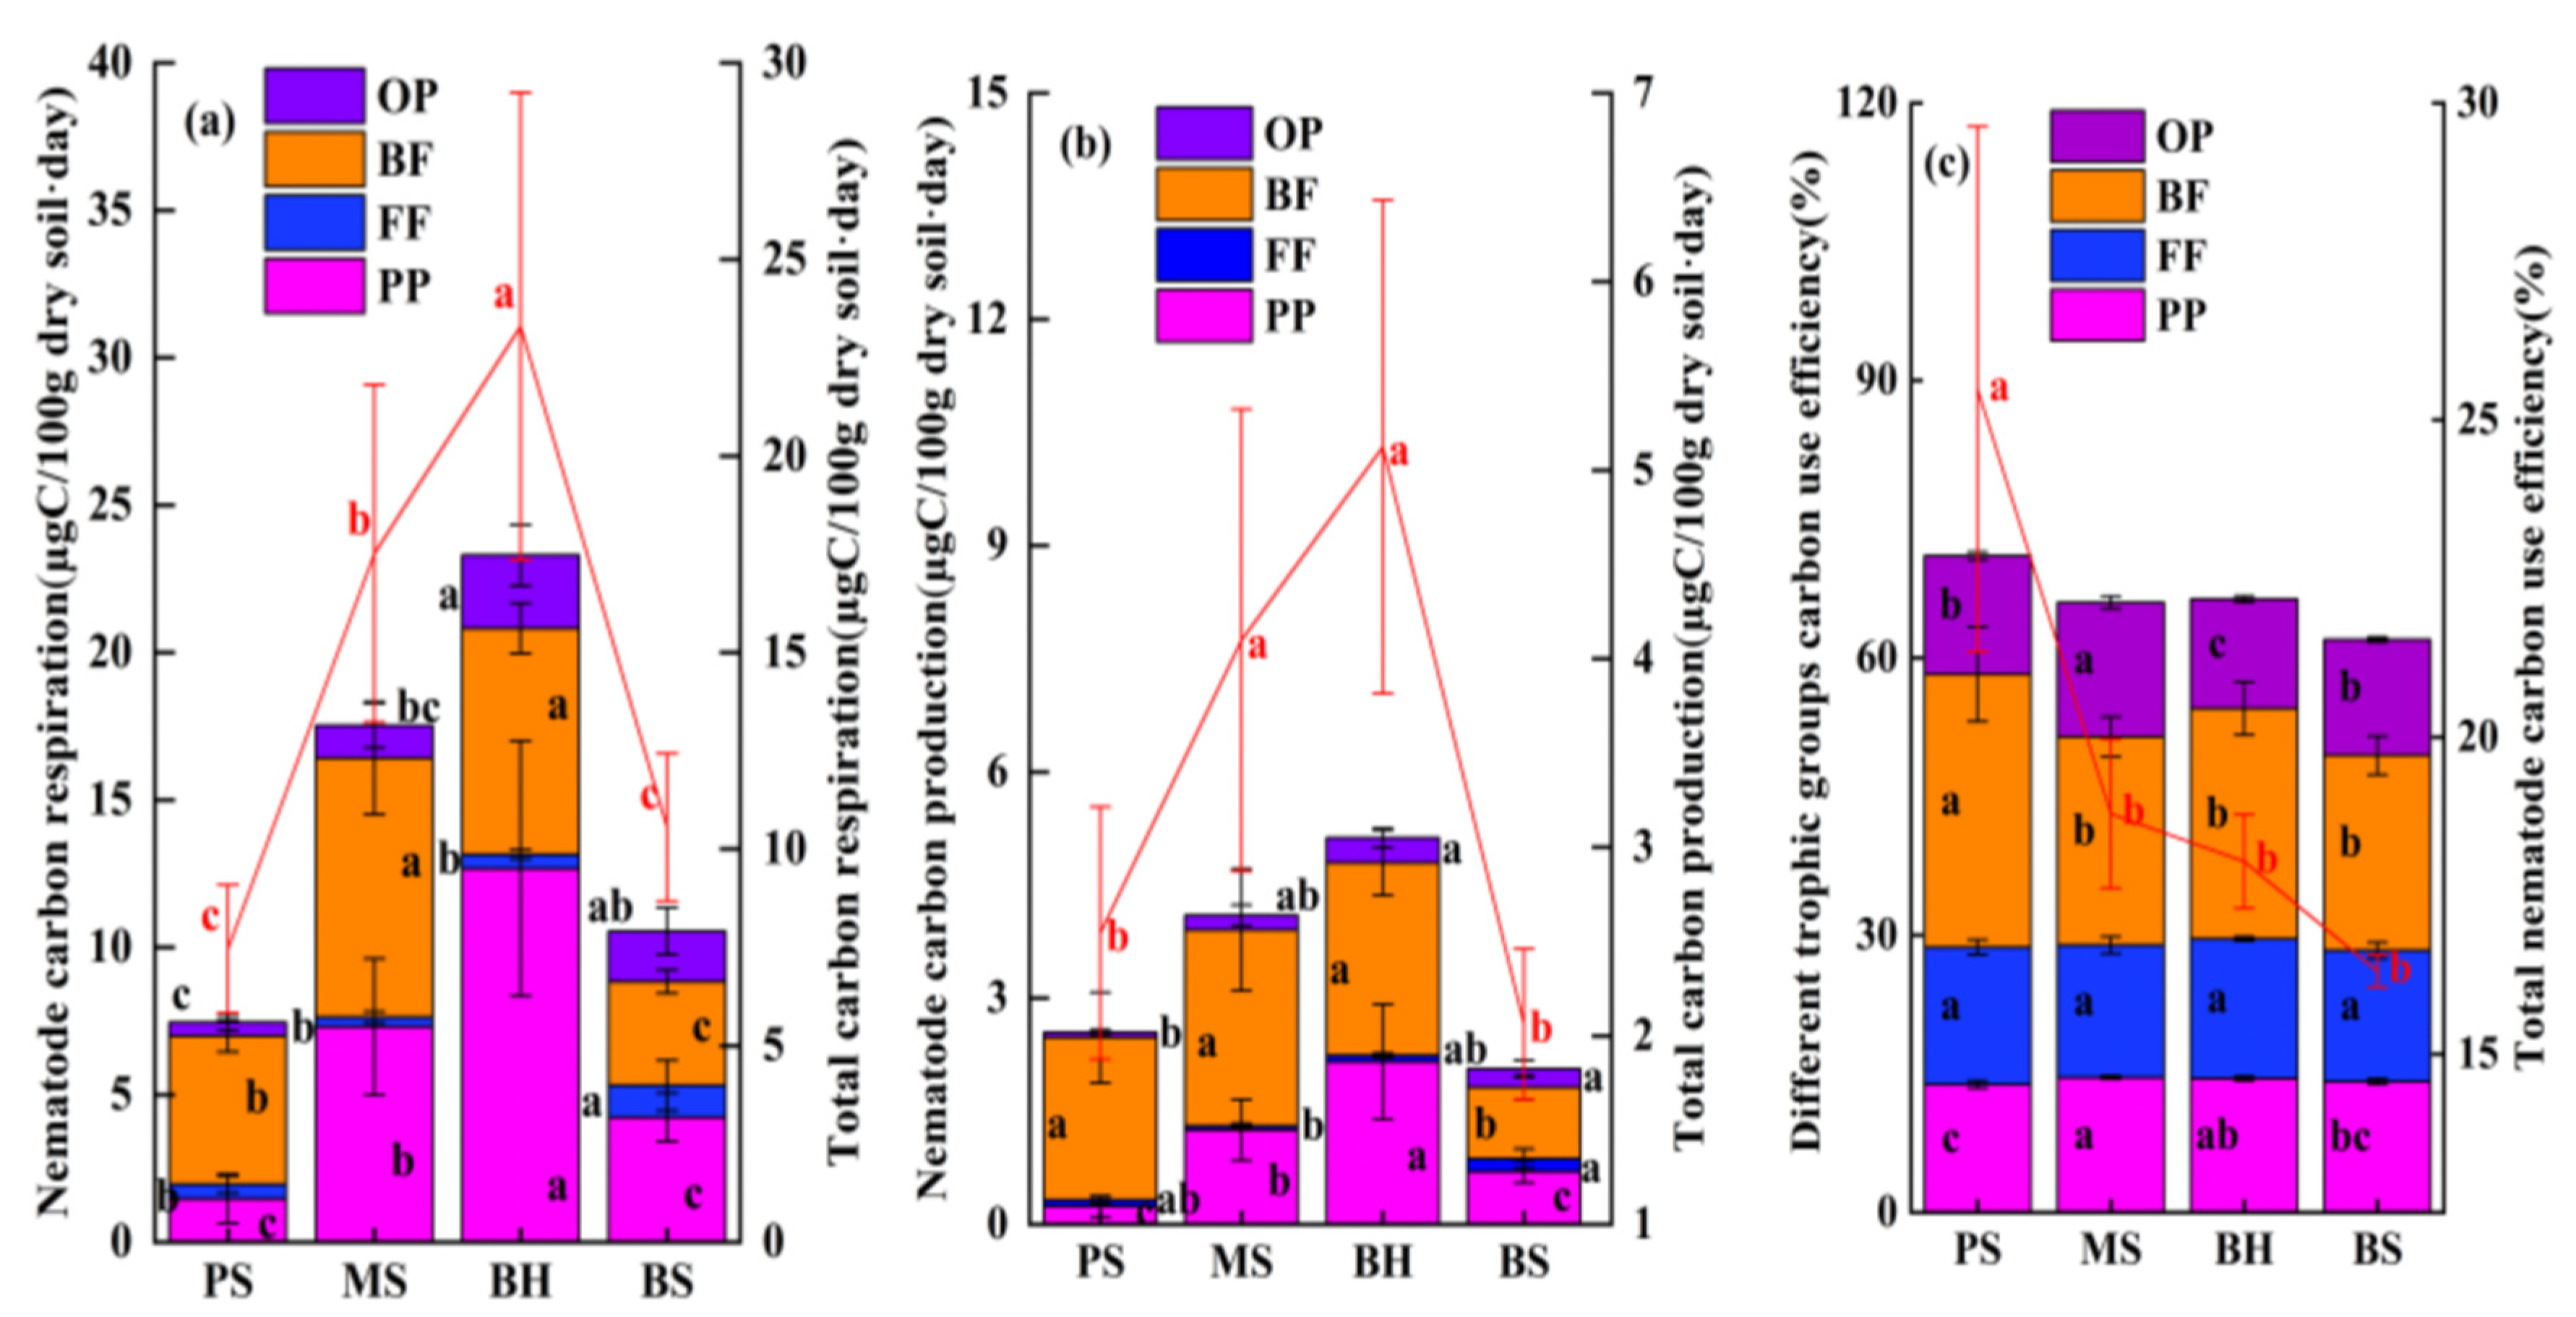
Plant species significantly affected total nematode carbon respiration, total carbon production, and total nematode carbon use efficiency (NCUE) (p < 0.05). BH rhizospheres exhibited elevated carbon mineralization rates for both aggregate metazoan assemblages and phytophagous parasite guilds relative to arborescent taxa (p < 0.05, Figure 6a). For bacterivorous nematode carbon respiration and total nematode carbon production: values in the MS root zone were significantly higher than those in BS, and values in BH were significantly higher than those in PS (p < 0.05, Figure 6a,b). Total carbon respiration, omnivore-predator nematode carbon respiration, and plant-parasitic nematode carbon production were significantly higher in BH than in trees (p < 0.05, Figure 6a,b). Microbivorous guild carbon mineralization and assimilation both registered depression in BS relative to arborescent taxa (p < 0.05; Figure 6b). Aggregate and microbivorous nematode carbon use efficiency (NCUE) commanded superior values in PS compared with frutescent counterparts. Omnivorous-predatory NCUE in MS likewise exceeded shrub-associated levels (p < 0.05, Figure 6c).
Figure 6.
Carbon respiration, carbon production, and carbon use efficiency of soil nematodes in the rhizosphere of different woody plants. (a) Cumulative bar representation of carbon mineralization across four functional guilds—phytophagous parasites (PP), mycophagous consumers (FF), microbivorous taxa (BF), and omnivorous-predatory forms (OP)—within distinct belowground habitats, with the superimposed crimson trace denoting aggregate community efflux. (b) Stacked bar chart showing the carbon production of four nematode trophic groups (PP, FF, BF, OP) in the rhizosphere of different woody plant species, with the red line indicating the total carbon production of nematodes. (c) Stacked bar chart showing the carbon use efficiency of four nematode trophic groups (PP, FF, BF, OP) in the rhizosphere of different woody plant species, with the red line indicating the total carbon use efficiency of nematodes. PP: plant-parasitic nematodes; FF: fungal-feeding nematodes; BF: bacterial-feeding nematodes; OP: omnivorous-predatory nematodes. Note: Dissimilar lowercase superscripts denote statistically discernible divergence among group means (p < 0.05).
3.5. Analysis of Nematode Energy Flux in the Root Zones of Different Woody Plants
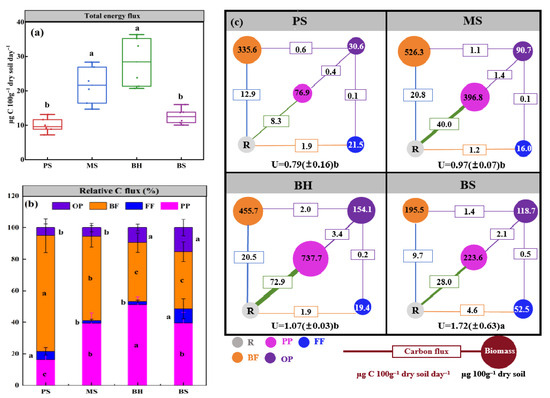
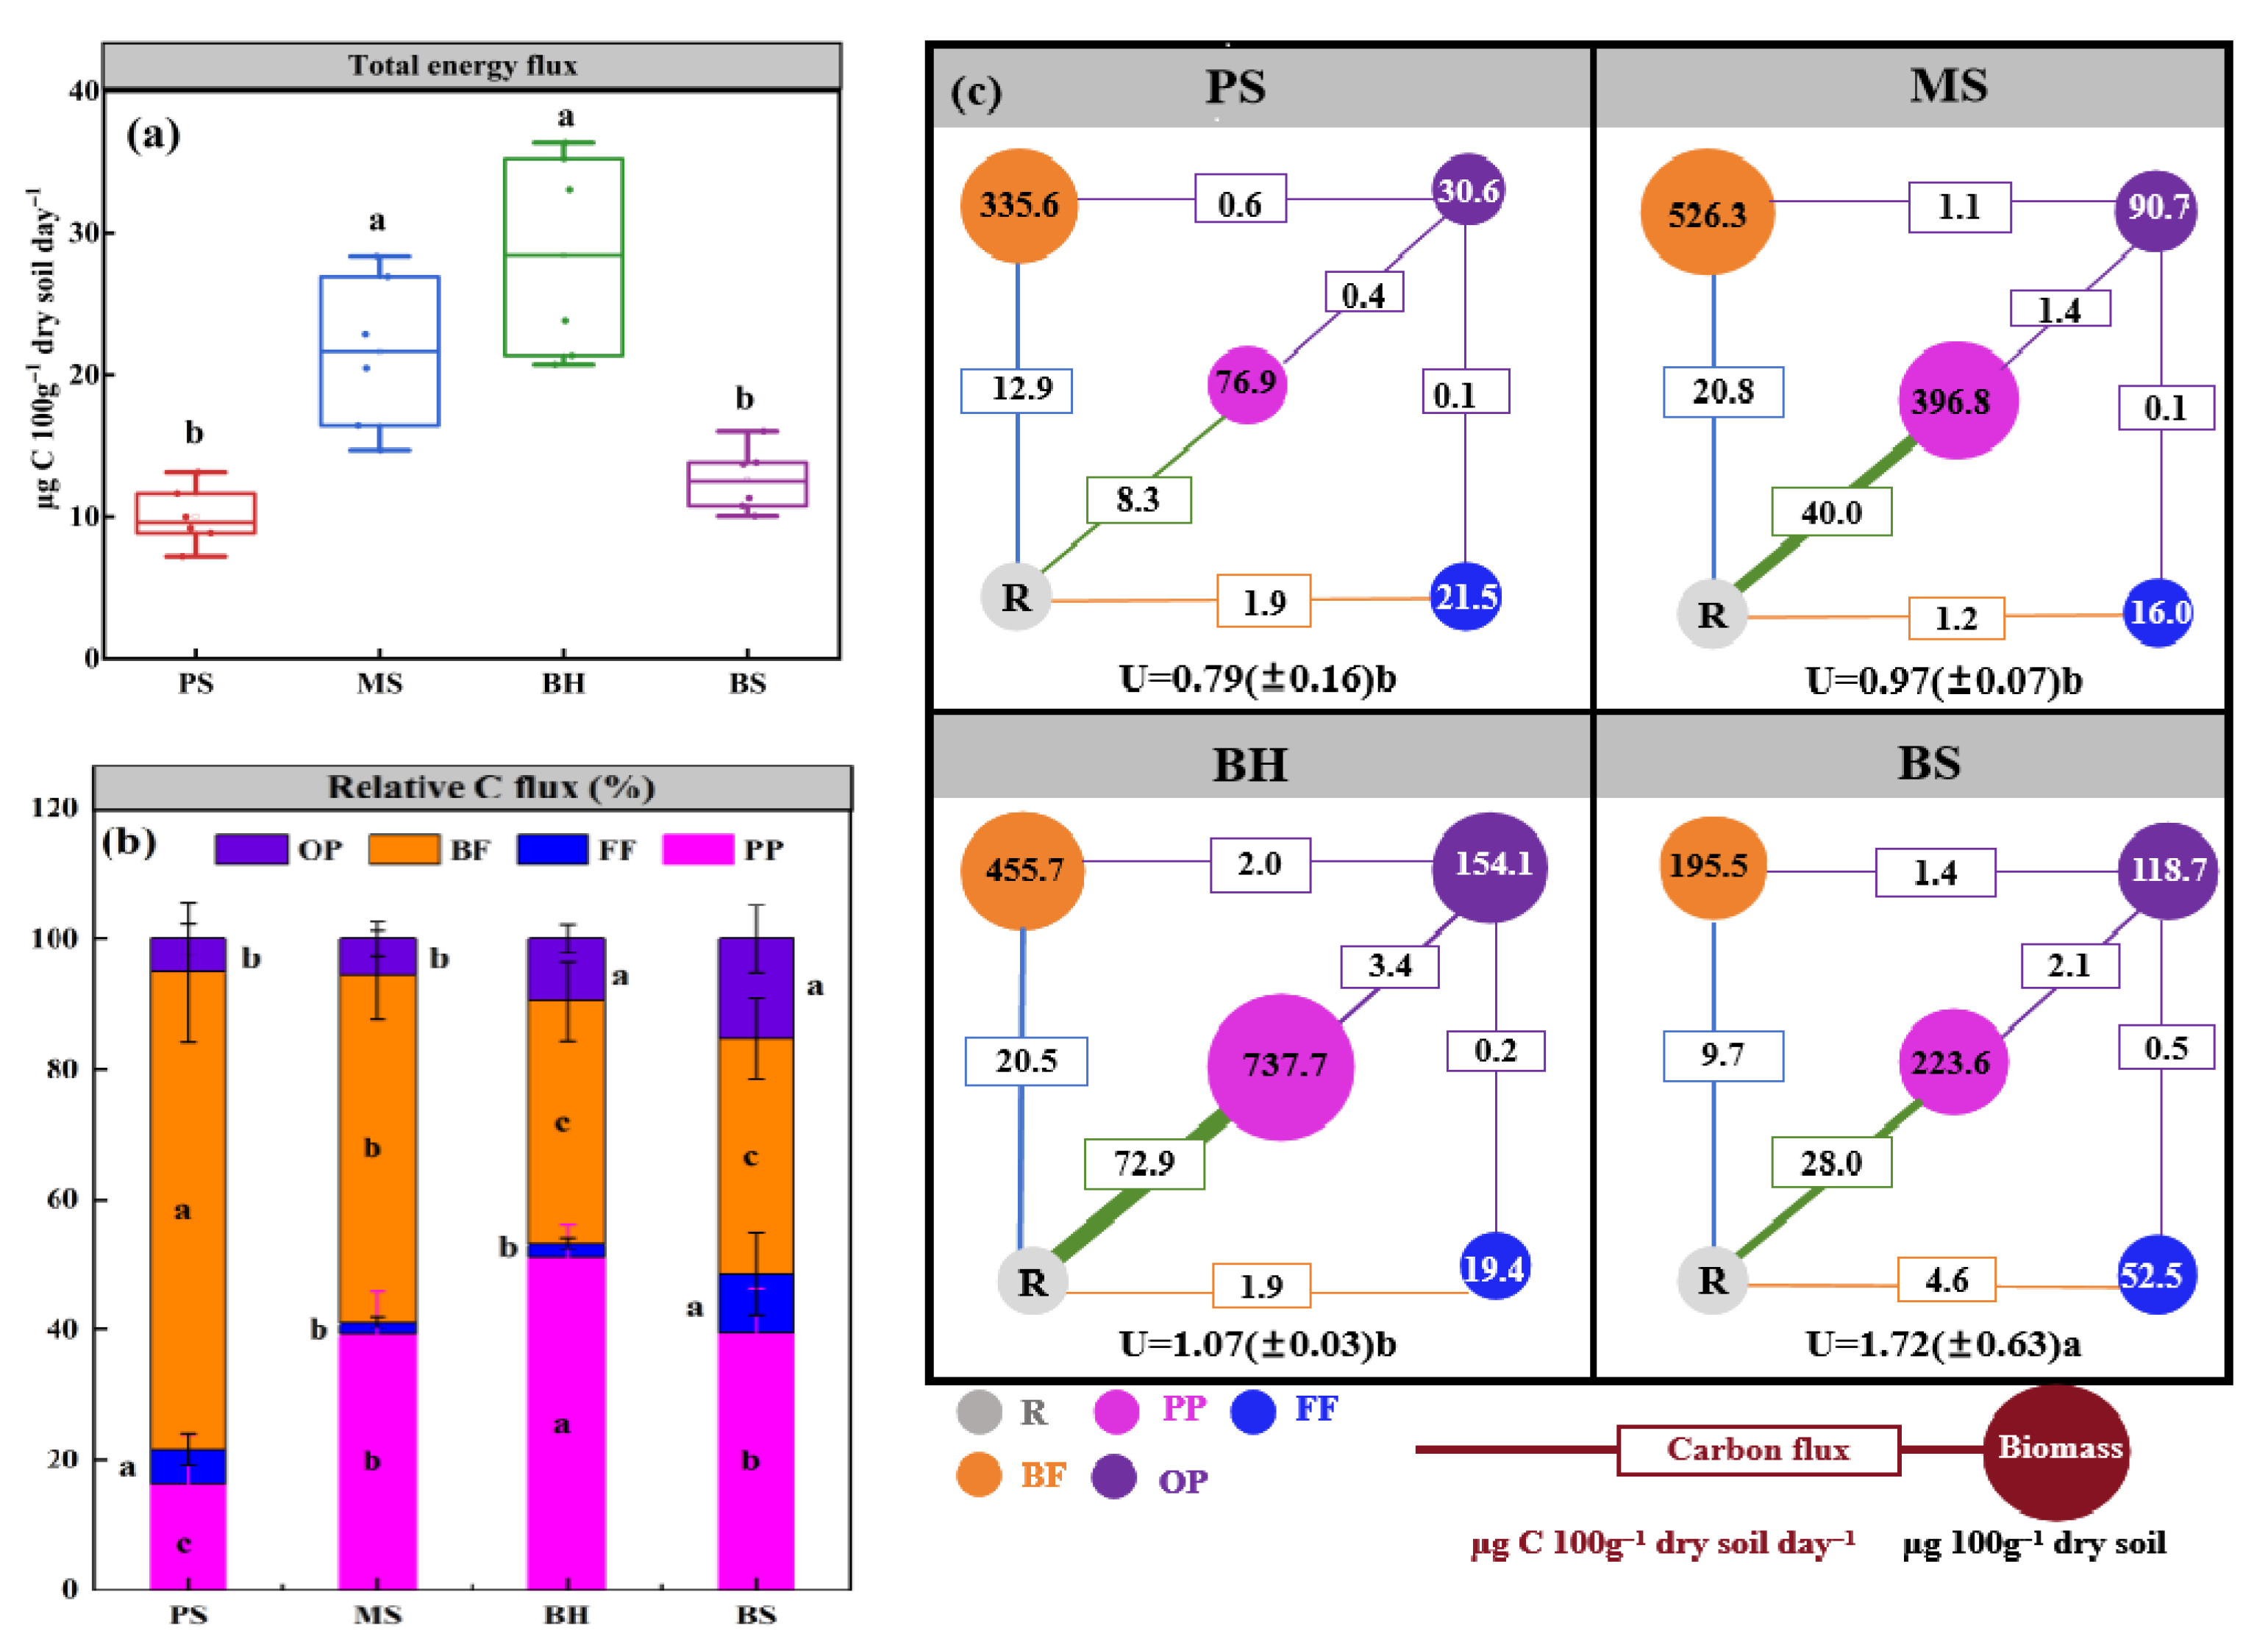
Aggregate metazoan energy flux within PS rhizospheres trailed BH levels, whereas MS surpassed BS for the corresponding parameter (p < 0.05; Figure 7a). Host taxon identity exerted discernible influence upon trophic guild composition, thereby restructuring energetic partitioning within belowground assemblages (Figure 7b). Proportional energy allocation to omnivorous-predatory guilds in both frutescent taxa exceeded arborescent values; conversely, microbivorous fractions registered concomitant depression (p < 0.05). Within B. heteropoda and B. sibirica, energetic distribution followed a descending gradient: phytophagous parasites > microbivorous consumers > omnivorous-predatory forms > mycophagous taxa. In PS and MS, the order was: bacterivorous nematodes > plant-parasitic nematodes > omnivore-predator nematodes > fungivorous nematodes (Figure 7b).
Figure 7.
Energetic architecture of belowground metazoan assemblages and guild-specific contributions to trophic energy transfer across distinct rhizosphere environments. (a) Box plot showing the total energy flux of soil nematodes in the rhizosphere of different woody plant species. (b) Stacked bar chart showing the relative carbon flux (%) of four nematode trophic groups (PP, FF, BF, OP) in the rhizosphere of different woody plant species. (c) Carbon flux food web diagrams of soil nematodes in the rhizosphere of PS, MS, BH, and BS, respectively, with the circle size representing biomass and the line width representing carbon flux. PP: plant-parasitic nematodes; FF: fungal-feeding nematodes; BF: bacterial-feeding nematodes; OP: omnivore-predatory nematodes; R: root resource; U: uncoupling index. Note: Dissimilar lowercase superscripts denote statistically discernible divergence among group means (p < 0.05).
The highest biomass of both plant-parasitic nematodes and omnivore-predator nematodes occurred in the root zone of BH. This indicates that a higher energy flux (72.9 µg C 100 g−1 dry soil day−1) from basal resources (R) to plant-parasitic nematodes was required to sustain their metabolic activities. Meanwhile, omnivore-predator nematodes also obtained the highest energy flux (2.8 µg C 100 g−1 dry soil day−1) from lower trophic levels (Figure 7c). In the root zone of PS, omnivore-predator nematodes acquired the lowest energy flux (0.5 µg C 100 g−1 dry soil day−1) from lower trophic levels (Figure 7c). Energy flux equitability (U) within Berberis sibirica (BS) rhizospheres exceeded values recorded for both arborescent taxa (Figure 7c).
3.6. Relationship Between Environmental Factors and Nematode Communities
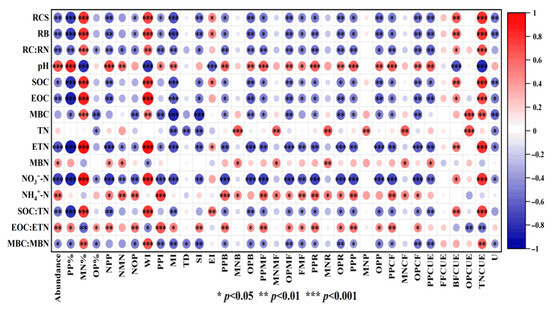
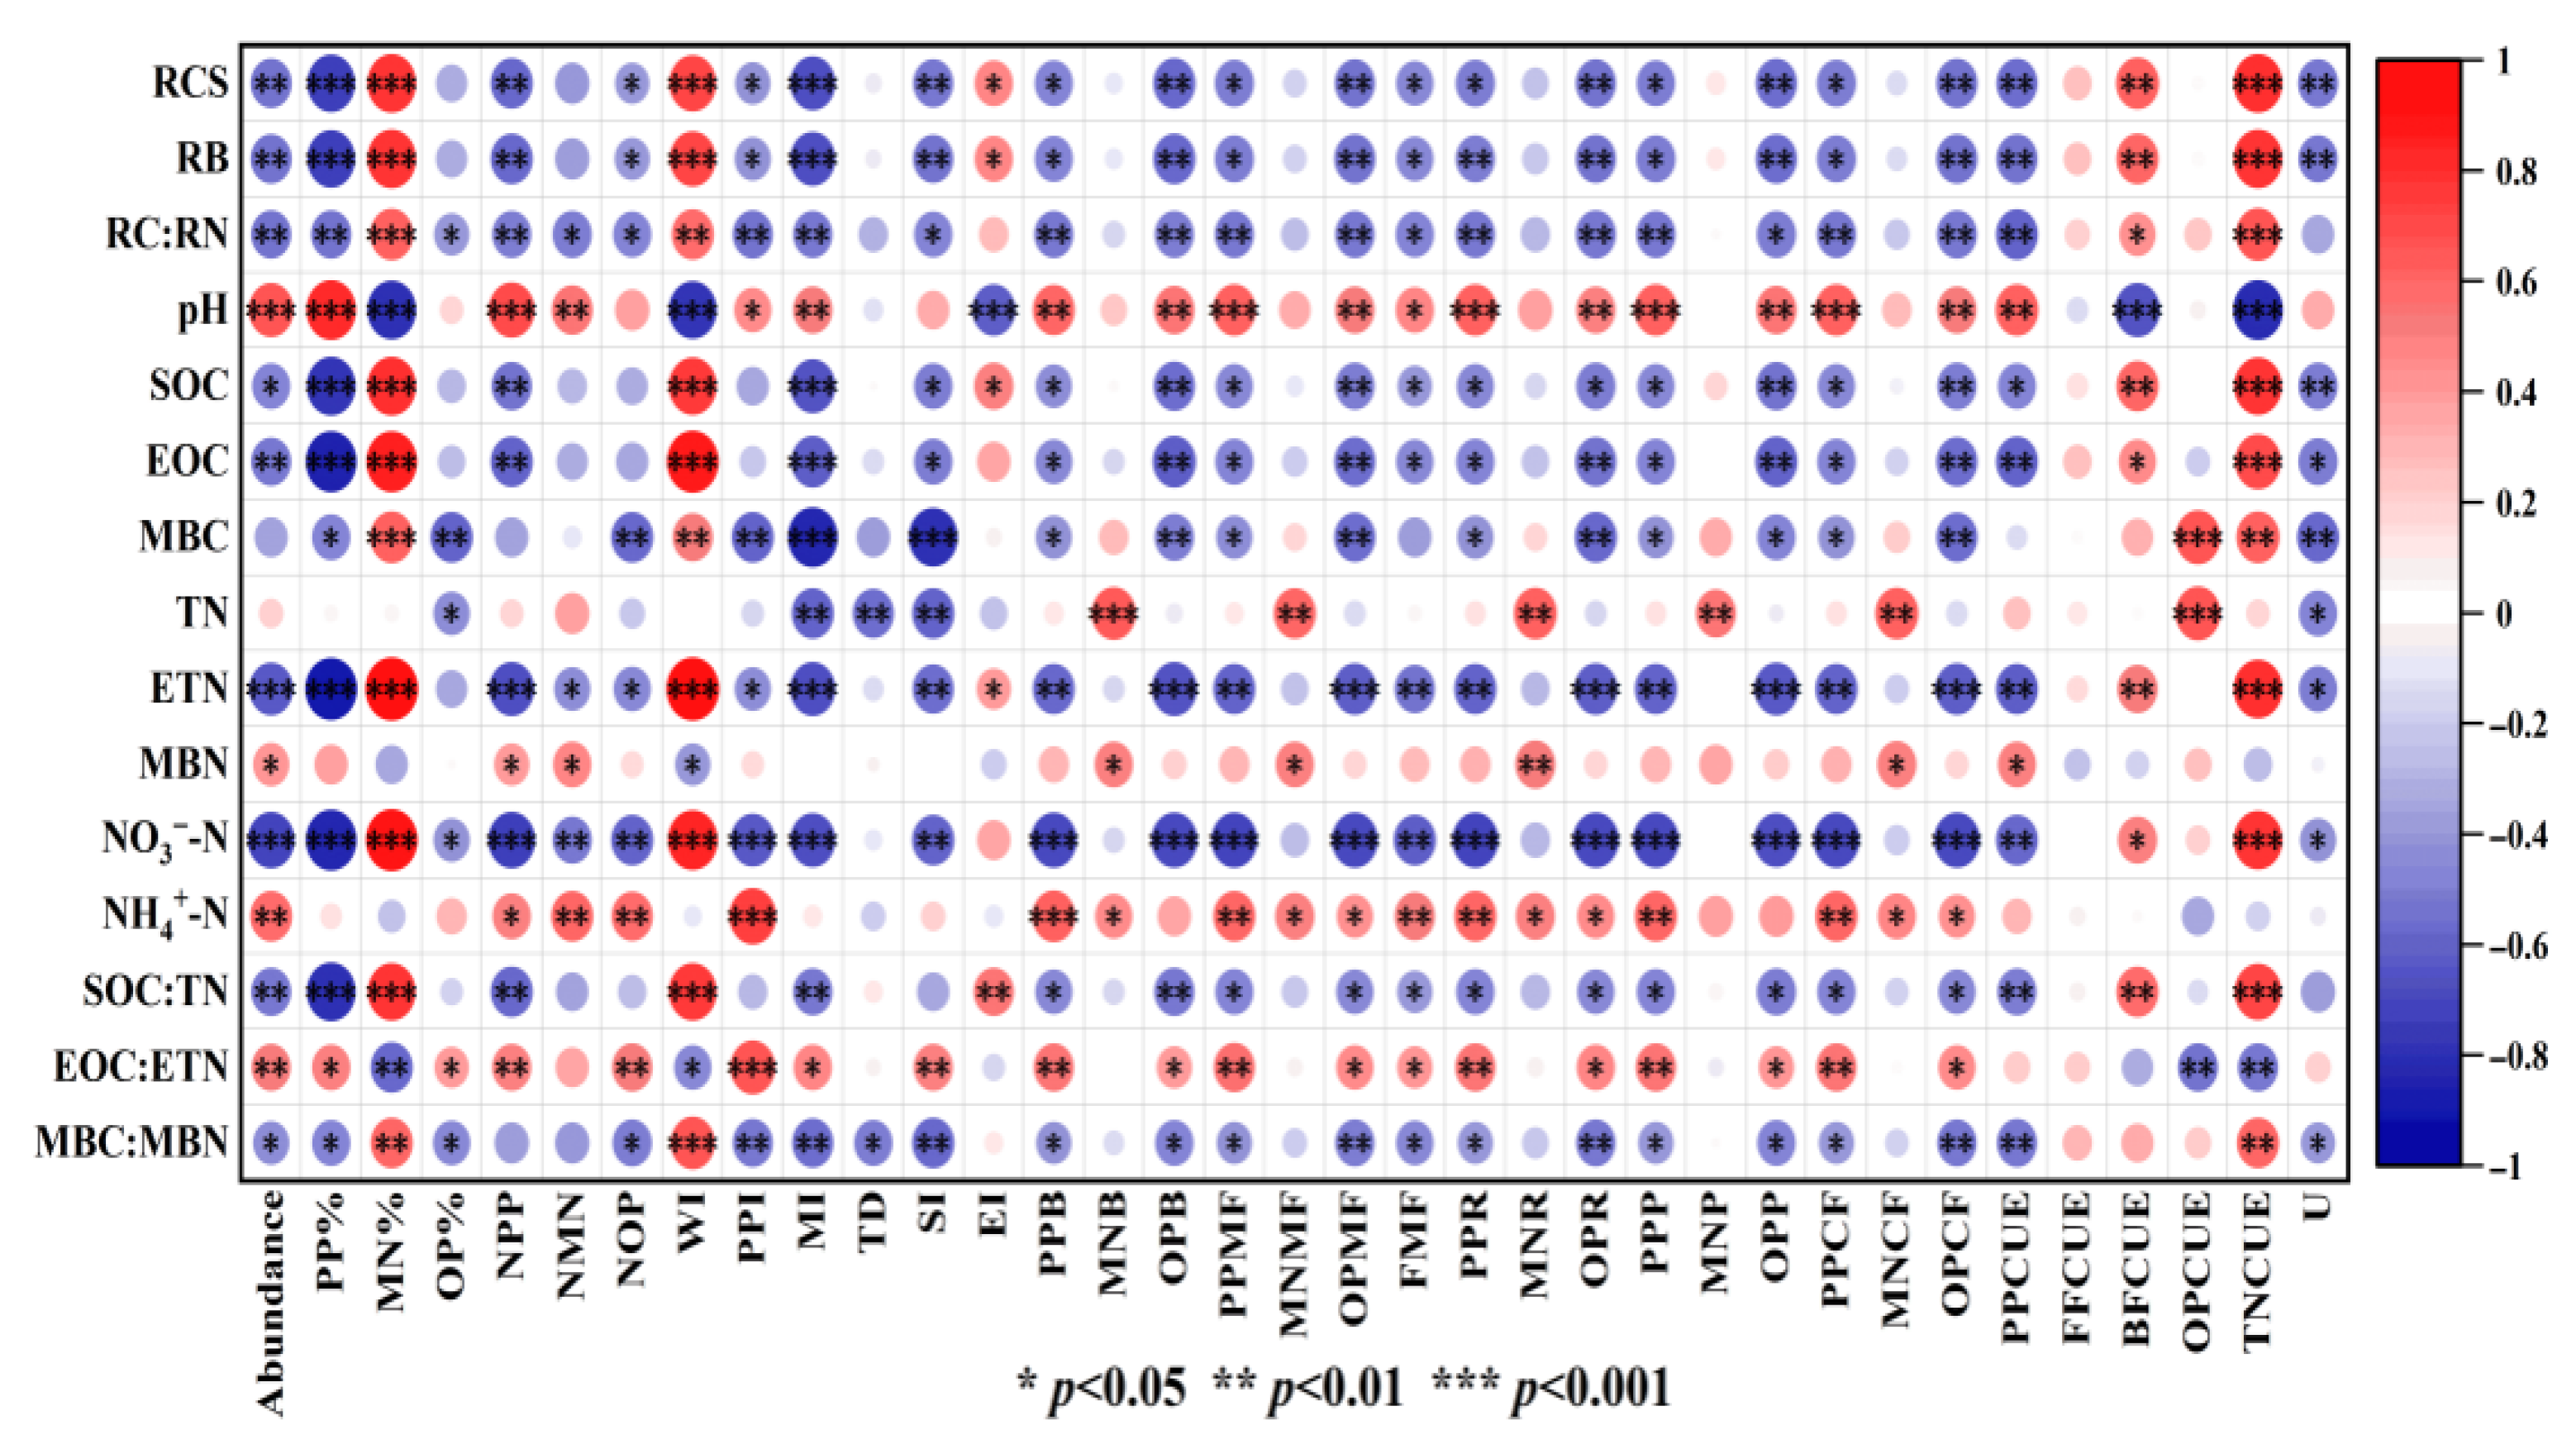
A total of 540 paired relationships were detected between environmental factors and nematode community indices, among which 112 pairs were significantly positive and 208 pairs were significantly negative (p < 0.05). All plant-parasitic nematode indices (PP%, NPP, PPB, PPMF, PPR, PPP, PPCF) showed significantly negative correlations with RCS, RB, RC:RN, SOC, EOC, ETN, -N, and SOC:TN, but significantly positive correlations with pH, EOC:ETN (except PPCUE), and -N (except PP%) (p < 0.05, Figure 8). TN and MBN were significantly positively correlated with MNB, MNMF, MNR, MNP, and MNCF.RCS; RB, RC:RN, MBC, -N, MBC:MBN, and EOC:ETN were significantly correlated with NOP, OPB, OPMF, OPR, OPP, and OPCF.RCS; and RB, RC:RN, SOC, EOC, ETN, -N, and SOC:TN were positively correlated with MN%, WI, BFCUE, and TNCUE, but negatively correlated with MI and FMF (p < 0.05, Figure 8). Environmental factors significantly affecting energy flux evenness (U) included RCS, RB, SOC, EOC, MBC, ETN, pH, -N, TN, TD, and MI (p < 0.05, Figure 8). Besides the above correlations, pH was significantly positively correlated with abundance, NMN, PPI, MI, OPB, OPMF, FMF, PPR, OPR, PPP, OPP, PPCF, and OPCF, but significantly negatively correlated with MN%, WI, EI, BFCUE, and TNCUE (p < 0.05, Figure 8). -N was significantly positively correlated with abundance, NMN, NOP, PPI, MNB, MNMF, OPMF, FMF, MNR, OPR, PPCF, MNCF, and OPCF (p < 0.05). SOC and EOC were also significantly correlated with abundance, OPB, OPMF, OPR, OPP, and OPCF. Among the 35 nematode community indices, 26 were significantly correlated with -N and ETN, while only 9 and 11 indices were significantly correlated with MBN and TN, respectively.
Figure 8.
Correlation analysis between environmental factors and nematode community. Abundance: total abundance of nematodes; BFCUE: bacterivorous carbon use efficiency; EI: enrichment index; EOC: extractable organic carbon; ETN: extractable total nitrogen; FMF: functional metabolic footprint; FFCUE: fungivorous carbon use efficiency; MBC: microbial biomass carbon; MBN: microbial biomass nitrogen; MI: maturity index; MNB: microbivorous nematodes biomass; MNCF: fungivorous energy flux; MNCUE: microbivorous carbon use efficiency; MNP: microbivorous nematodes carbon production; MNR: microbivorous nematodes carbon respiration; MNMF: microbivorous nematodes metabolic footprint; MN%: percentage of bacterivorous nematodes; NMN: number of bacterivorous nematodes; NOP: number of omnivore-predator nematodes; NPP: number of plant-parasitic nematodes; -N: nitrate nitrogen; -N: ammonium nitrogen; OPCF: omnivore-predatory energy flux; OPCUE: omnivore-predatory carbon use efficiency; OPP: omnivore-predatory carbon production; OPR: omnivore-predatory carbon respiration; OPMF: omnivore-predatory metabolic footprint; OPB: omnivore-predatory biomass; OP%: percentage of omnivore-predator nematodes; PPI: plant parasite index; PPCF: plant-parasitic energy flux; PPCUE: plant-parasitic carbon use efficiency; PPP: plant-parasitic carbon production; PPR: plant-parasitic carbon respiration; PPMF: plant-parasitic metabolic footprint; PPB: plant-parasitic biomass; PP%: percentage of plant-parasitic nematodes; RCS: root C stock; RB: root biomass; SI: structure index; SOC: soil organic carbon; TD: trophic diversity; TNCUE: total nematode carbon use efficiency; TN: total nitrogen; U: energy flux uniformity; WI: Wasilewska index.
4. Discussion
4.1. Effects of Different Woody Plants on Soil Nematode Community Composition and Ecological Indices
Edaphic metazoans constitute integral constituents of terrestrial belowground systems, engaging in intricate trophic interactions with microbiota to generate complex subterranean food webs. These organisms manifest pronounced sensitivity to physicochemical perturbations, with their assemblage composition and taxonomic richness serving as robust sentinels for pedological condition and environmental heterogeneity. Consequently, such attributes furnish reliable diagnostic criteria for soil health appraisal [31,32].
Chiloplacus was the dominant genus in the root zones of all four woody plant species (relative abundance: 14.06%–19.12%), which is highly consistent with its ecological adaptability. Chiloplacus is a typical bacterivorous nematode, and its survival and reproduction directly depend on the abundance and activity of rhizosphere bacteria. Although the four plant species differ in functional type (trees vs. shrubs), they all share continuous root exudation. Carbon sources in root exudates (e.g., sugars, organic acids) significantly promote the proliferation of rhizosphere bacteria. As an important group of bacterivorous nematodes, Chiloplacus mainly feeds on these bacteria, forming a specific trophic pathway of “root exudate C–rhizosphere bacteria–Chiloplacus”, which maintains its dominance [33]. All dominant genera in the root zone of PS were bacterivorous nematodes, whereas dominant genera other than Chiloplacus in the two shrubs were plant-parasitic nematodes. The relative abundances of plant-parasitic, bacterivorous, and fungivorous nematodes were higher in tree root zones than in shrub root zones. Plant-parasitic nematodes link to the plant resource pool by feeding on roots, while bacterivores and fungivores participate in organic matter decomposition by consuming microorganisms [34], indicating that nematode communities in tree root zones were more closely coupled with soil nutrient cycling. In the PS root zone, bacterivorous nematodes had higher abundance and relative abundance than other trophic groups. In contrast, plant-parasitic nematodes were dominant in BH and BS. The trophic pathway “root exudate C–bacteria–bacterivorous nematodes” is a key process driving soil C and N mineralization [35], suggesting a stronger linkage between nematodes and soil functions in the PS root zone.
Both generic richness and aggregate population density of edaphic metazoans within PS rhizospheres registered depression relative to values recorded for frutescent taxa. This may be because PS is an evergreen tree with less understory litter and lower understory temperature. Under cold and humid conditions, organic matter decomposition is slow, leading to reduced organic matter input into the soil, which decreases food resources for soil nematodes and further restricts their reproduction. In addition, the abundance and relative abundance of omnivore-predator nematodes in the root zones of PS and MS were lower than those in BH and BS. As the top trophic level in the soil food web, omnivore-predator nematodes are critical for maintaining soil ecosystem stability [36] and are highly sensitive to environmental disturbance [37]. High disturbance intensity usually results in low abundance of omnivore-predator nematodes [38].
According to soil nematode ecological indices, the ecological functions of nematodes differed among plant species. The WI in BH and BS was significantly lower than that in PS. A WI value exceeding 1 in PS reflected better soil nutritional conditions, whereas WI values below 1 in BH and BS indicated relatively poorer soil health, which is consistent with the decline in soil health caused by increased plant-parasitic nematodes in freely grazed grasslands [39]. The fungivore/bacterivore (FF/BF) ratio further confirmed that the soil decomposition pathway in PS was dominated by the bacterial energy channel. The MI, PPI, and SI values in the two shrub stands were higher than those in tree stands, suggesting that shrub root zones represented a more structured habitat compared with tree root zones. The lower trophic complexity in pure tree habitats may be attributed to simpler understory microhabitats and lower habitat heterogeneity, which cannot continuously support abundant high-trophic nematodes.
4.2. Changes in Carbon-Related Indicators of Soil Nematodes in the Root Zones of Different Woody Plants
Variations in assemblage composition and architectural configuration of belowground metazoan communities exert discernible influence upon their metabolic imprints, thereby furnishing diagnostic proxies for carbon transformation trajectories and energetic dynamics within subterranean trophic networks [24]. In the present study, composite metabolic footprint, bacterivorous nematode metabolic footprint, enrichment metabolic footprint, total energy flux, total carbon respiration, total carbon production, bacterivorous nematode carbon respiration, and plant-parasitic nematode carbon respiration and production were significantly higher in MS than in BS, and significantly higher in BH than in PS (p < 0.05). This confirms that metabolic footprint is an effective indicator for characterizing the energy structure of soil nematode food webs [40]. BFCUE and total NCUE in the PS root zone were significantly higher than those in the two shrubs. The dominant energy channel in PS was the bacterivorous channel, whereas the dominant energy channel in BH and BS was the plant-parasitic channel. This is consistent with results in oil palm plantations in Indonesia, where plant and bacterial channels dominated over fungal channels [41]. Previous studies showed that simultaneous aboveground and belowground C input led to lower carbon respiration and production of bacterivores, omnivore-predator nematodes, and total nematodes compared with belowground-only input, but higher than no-plant input treatments. OPCUE and total NCUE were significantly lower under aboveground input than belowground input [42]. In the present study, however, SOC in PS was significantly higher than in BH, and SOC in MS was significantly higher than in BS. This suggests that SOC content alone may not be the key factor, but SOC availability may regulate energy flux in the soil ecosystem [43,44]. As a conifer, PS is rich in lignin in its needles [45]. Lignin accounts for approximately 20% of plant litter C input [46] and is one of the most recalcitrant compounds [47]. High lignin content suppresses microbial decomposition [48] and herbivore feeding. Recalcitrant lignin accumulation reduces SOC availability, thereby regulating soil C pool size, storage, and turnover [46]. The relative energy flux of omnivore-predator nematodes increased significantly in BH and BS, indicating enhanced energy flow to higher trophic levels, which benefits soil food web stability [49]. Increased relative energy flux and biomass of omnivore-predators also improved U, because omnivore-predators are key indicators of belowground stability and strongly regulate energy flow [41].
4.3. Effects of Environmental Factors on Soil Nematode Communities in the Root Zones of Woody Plants
Linking nematode functional groups to specific energy pathways provides a new perspective for understanding how environmental factors influence soil nematode communities [41]. The correlation matrix between soil nematode community indicators and soil environmental factors showed that 322 pairs of factors and indicators were significantly correlated, accounting for 61.3% of all pairs. PP%, NPP, PPB, PPMF, PPR, PPP, and PPCF were significantly negatively correlated with SOC, EOC, ETN, -N, and SOC:TN. These observations align with established reports demonstrating that elevated pedological organic carbon, widened carbon-to-nitrogen stoichiometry, and enriched nitrate nitrogen constrain phytophagous parasite representation within belowground assemblages [50].
TN, MBN, and -N were significantly positively correlated with microbivore nematode biomass, metabolic footprint, carbon respiration, and energy flux. TN was also significantly negatively correlated with OP%, MI, TD, SI, and U. Soil available nitrogen is a key factor for identifying changes in soil nematode communities during natural vegetation restoration in subtropical forest ecosystems [51]. In Robinia pseudoacacia plantations, soil available nitrogen was significantly positively correlated with the metabolic footprint of fungivorous nematodes [52], which is consistent with the results of this study. In Baikal feather grass steppes, the correlation between TN and SI was consistent with our findings [53], whereas in heterogeneous habitats of the Songnen Plain, SI was positively correlated with soil TN [54], which is inconsistent with our results. In this study, correlations between environmental factors and microbivore nematode-based indicators were weak, while those with plant-parasitic and omnivore-predator nematode-based indicators were strong, showing a distinct polarization. Significant deviations also occurred in the relationships between environmental factors and energy fluxes of different trophic groups, which is consistent with results from studies on soil nematodes under oil palm plantations [41]. Energy fluxes to microbivore nematodes were significantly correlated with -N, while those to omnivore-predator nematodes were associated with dissolved organic carbon [55]. In the present study, pH was significantly positively correlated with nematode abundance, PP%, NPP, PPI, and MI, but significantly negatively correlated with MN%, WI, and total NCUE. In heterogeneous habitats of the Songnen Plain, pH was negatively correlated with both total nematode abundance and fungivorous nematode abundance [54], which is not entirely consistent with our results. In contrast, pH changes before and after the invasion of Impatiens parviflora in beech forests were significantly negatively correlated with the relative abundance of plant-parasitic nematodes [56]. Among plant root traits, root biomass and root C:N ratio were significantly negatively correlated with total nematode abundance, PP%, OP%, NPP, and NOP, and significantly positively correlated with MN%. In a study of rhizosphere nematodes and root traits of four herbaceous plant species in Jiangxi, China, root biomass and root C:N ratio during the growing season were significantly positively correlated with BF% and significantly negatively correlated with PP% [57], which is consistent with our results. In a study of alpine meadows on the Qinghai–Tibet Plateau, plant root biomass and root C:N ratio were positively correlated with microbivore nematode abundance [58]. Therefore, research results on soil nematodes around the roots of different plants are not entirely consistent: results for herbaceous plants are more diverse, while studies on trees and shrubs are scarce but also show inconsistencies.
5. Conclusions
The dominant trophic group of nematodes in the root zones of MS, BH, and BS was plant-parasitic nematodes, indicating poor soil health. By contrast, bacterivorous nematodes dominated in the root zone of PS, indicating favorable soil health. The abundance, relative abundance, free-living maturity index (MI), and relative energy flux of omnivore-predator nematodes in the two shrubs were significantly higher than those in the two tree species. However, soil organic carbon content in the two shrubs was lower than that in the two trees. Environmental factors exerted significantly stronger effects on plant-parasitic nematodes and omnivore-predator nematodes than on microbivore nematodes. Therefore, highly sensitive omnivore-predator nematodes are an important indicator group for reflecting environmental changes, whereas plant-parasitic nematodes are critical for characterizing plant involvement in soil carbon cycling. -N, ETN, SOC, and pH were the key environmental factors regulating the four ecosystems. Based on the present results, studies on organism-environment relationships should couple aboveground vegetation, belowground biota, and environmental factors to comprehensively reveal above-belowground interaction mechanisms and biological indicator roles across different scales.
Author Contributions
Conceptualization, Y.L. and X.L.; methodology, Y.L.; formal analysis, Y.L. and J.F.; data curation, D.S., S.F. and C.Y.; writing—original draft preparation, Y.L.; writing—review and editing, Y.L., S.L. and X.L.; visualization, Y.L.; supervision, X.L.; funding acquisition, X.L. All authors have read and agreed to the published version of the manuscript.
Funding
This research was funded by the Tianchi Innovation Leading Talent Fund of Xinjiang Autonomous Region (2025CXLJ005) and the High-Level Talent Project of Yili Normal University (2023RCYJ07).
Data Availability Statement
The datasets used and/or analyzed during the current study are available from the corresponding author upon reasonable request.
Acknowledgments
The authors sincerely thank Xiaolan Li and Suqing Li for their valuable guidance throughout this study. We are also grateful to Junyan Fan, Deshuai Sun, Shuyue Fang, and Cuiling Ye for their assistance in field work and laboratory analysis. We greatly appreciate the reviewers for their constructive comments and suggestions on this manuscript.
Conflicts of Interest
The authors declare no conflicts of interest.
References
- Shi, M.J.; Wu, H.Q.; Fan, X.; Jia, H.T.; Dong, T.; He, P.X.; Baqa, M.F.; Jiang, P.A. Trade-offs and synergies of multiple ecosystem services for different land use scenarios in the Yili River valley, China. Sustainability 2021, 13, 1577. [Google Scholar] [CrossRef] [Scilit]
- Chen, L.Z. Biodiversity in China: Current Status and Conservation Strategies; Science Press: Beijing, China, 1993. [Google Scholar]
- Cui, Y.R.; Jiang, Y.; Li, J.M.; Zhang, Y.T. Variation in carbon flux and its response to environmental factors in schrenk spruce forests on the northern slopes of the central Tianshan Mountains. Arid Zone Res. 2026, 43, 792–800. [Google Scholar]
- Zhang, W. Basic Researches on Conservation Biology of Endangered Species Juglans cathayensis in Tianshan Valley in Xinjiang, China; Northeast Normal University: Changchun, China, 2016. [Google Scholar]
- Li, L.Y.; Fang, Z.Y.; Aikebaier, M.; Zhou, L.; Lu, B. Characteristics and species diversity of Berberis community in wild fruit forest of West Tianshan Mountain. Bull. Soil Water Conserv. 2018, 38, 227–233. [Google Scholar]
- Tiwari, S.P.; Husain, R.; Vikram, N.; Pandey, S.; Kumar, N. Nematodes as Biological Indicators: Managing Soil Health: A Review. Agric. Assoc. Text. Chem. Crit. Rev. 2024, 12, 372–382. [Google Scholar] [CrossRef] [Scilit]
- van den Hoogen, J.; Geisen, S.; Routh, D.; Ferris, H.; Traunspurger, W.; Wardle, D.A.; de Goede, R.G.M.; Adams, B.J.; Ahmad, W.; Andriuzzi, W.S.; et al. Soil nematode abundance and functional group composition at a global scale. Nature 2019, 572, 194–198. [Google Scholar] [CrossRef] [Scilit]
- Ferris, H. Contribution of Nematodes to the Structure and Function of the Soil Food Web. J. Nematol. 2010, 42, 63–67. [Google Scholar]
- Li, X.C.; Gong, L.; Wei, B.; Ding, Z.L.; Zhu, H.Q.; Li, Y.F.; Zhang, H.; Ma, Y.G. Effects of climate change on potential distribution and niche differentiation of Picea schrenkiana in Xinjiang. Acta Ecol. Sin. 2022, 42, 4091–4100. [Google Scholar] [CrossRef] [Scilit]
- Qin, A.L.; Liu, B.; Chen, Q.; Zheng, X.K.; Jin, K. Population structure and dynamic characteristics of Malus sieversii distributed in Ili and Tacheng regions of Xinjiang, China. Acta Ecol. Sin. 2025, 45, 197–209. [Google Scholar]
- Xia, X.Y.; Li, S.Y.; Wang, J.; Wang, W.X. Effects of topographic factors on soil organic carbon in Picea schrenkiana forest on the northern slope of Tianshan Mountain. Xinjiang Agric. Sci. 2023, 60, 965–973. [Google Scholar]
- Zhang, H.F.; Gao, Y.Q.; Zhu, Y.L.; Dilixiat, B.E.; Li, X. Comparative study on biomass models for Picea schrenkiana in Xinjiang. J. Northwest For. Univ. 2015, 30, 52–58. [Google Scholar]
- Zhang, J.; Zhao, F.Y.; Zhang, H.X. Evolutionary genomics provides insights into endangerment and conservation of a wild apple tree species, Malus sieversii. Evol. Appl. 2024, 17, e70048. [Google Scholar] [CrossRef] [Scilit] [PubMed]
- Ma, Y.N.; Ma, X.Z.; Chao, K.R.; Zhang, C.C.; Zheng, Y.; Zhang, Z.J.; Liang, Y. A GIS-based comprehensive evaluation of natural ecological environment quality in Yili River Valley, Xinjiang. Environ. Sci. Technol. 2025, 48, 206–218. [Google Scholar]
- Cui, D.; Deng, X.; Yan, J.J.; Meng, X.X.; Luo, Q.Q.; Xiao, Z.G. Effects of different land use patterns on soil nutrients and enzyme activities in the Ili River Valley. Jiangsu Agric. Sci. 2016, 44, 371–374. [Google Scholar]
- Bao, S.D. Soil Agrochemical Analysis, 3rd ed.; China Agriculture Press: Beijing, China, 2000. [Google Scholar]
- Vance, E.D.; Brookes, P.C.; Jenkinson, D.S. An extraction method for measuring soil microbial biomass C. Soil Biol. Biochem. 1987, 19, 703–707. [Google Scholar] [CrossRef] [Scilit]
- Brookes, P.C.; Powlson, D.S.; Jenkinson, D.S. Measurement of microbial biomass phosphorus in soil. Soil Biol. Biochem. 1982, 14, 319–329. [Google Scholar] [CrossRef] [Scilit]
- Luo, J.M.; Zhang, X.K.; Liang, W.J. Soil nematode collection, specimen preparation and data analysis. Bio-Protocol 2021, 11, e1010621. [Google Scholar]
- Bongers, T. De Nematoden van Nederland, 2nd ed.; Uitgenerij Pirola: Schoorl, The Netherlands, 1994; pp. 1–408. [Google Scholar]
- Yin, W.Y. Illustrated Key to Soil Animals of China; Science Press: Beijing, China, 1998; pp. 51–89. [Google Scholar]
- Zhang, X.K.; Liang, W.J.; Li, Q. Forest Soil Nematodes in Changbai Mountain—Morphology and Distribution; China Agriculture Press: Beijing, China, 2013; pp. 17–124. [Google Scholar]
- Bongers, T. The maturity index: An ecological measure of environmental disturbance based on nematode species composition. Oecologia 1990, 83, 14–19. [Google Scholar] [CrossRef] [Scilit] [PubMed]
- Ferris, H. Form and function: Metabolic footprints of nematodes in the soil food web. Eur. J. Soil Biol. 2010, 46, 97–104. [Google Scholar] [CrossRef] [Scilit]
- Schwarz, B.; Barnes, A.D.; Thakur, M.P.; Brose, U.; Ciobanu, M.; Reich, P.B.; Rich, R.L.; Rosenbaum, B.; Stefanski, A.; Eisenhauer, N. Warming alters energetic structure and function but not resilience of soil food webs. Nat. Clim. Change 2017, 7, 895–900. [Google Scholar] [CrossRef] [Scilit]
- Cui, S.Y.; Liang, S.W.; Zhang, X.K.; Li, Y.B.; Liang, W.J.; Sun, L.J.; Wang, J.K.; Bezemer, T.M.; Li, Q. Long-term fertilization management affects the C utilization from crop residues by the soil micro-food web. Plant Soil 2018, 429, 335–348. [Google Scholar] [CrossRef] [Scilit]
- Zheng, H.; Gao, D.D.; Zhou, Y.Q.; Zhao, J. Energy flow across soil food webs of different ecosystems: Food webs with complex structures support higher energy flux. Geoderma 2023, 439, 116666. [Google Scholar] [CrossRef] [Scilit]
- Lv, J.L. Study on Biomass and Carbon Sequestration of Apple Economic Forest in the Residual Gully Area of Shaanxi Province. Master’s Thesis, Inner Mongolia Agricultural University, Hohhot, China, 2019. [Google Scholar]
- Wang, W.D.; Bai, Z.Q.; Maimaiti, A.; Liu, D.; Guo, Z.J. Biomass comparison and estimation models for six dominant species of woody shrubs in the forest zones of the Tianshan Mountains. Acta Ecol. Sin. 2016, 36, 2695–2704. [Google Scholar] [CrossRef] [Scilit]
- Wang, J.; He, B.Y. Study on biomass estimation model of dominant woody shrubs in Altay Mountain. J. Anhui Agric. Sci. 2017, 45, 157–160. [Google Scholar]
- Lu, Q.F.; Liu, T.T.; Wang, N.Q.; Dou, Z.C.; Wang, K.G.; Zuo, Y.M. A review of soil nematodes as biological indicators for the assessment of soil health. Front. Agric. Sci. Eng. 2020, 7, 275–281. [Google Scholar] [CrossRef] [Scilit]
- Ghaderi, R.; Hayden, H.L.; Jayaramaiah, R.H.; Hu, H.W.; He, J.Z. An innovative framework fosters practical application of nematode-based indices in soil health assessment. Eur. J. Soil Sci. 2025, 76, e70149. [Google Scholar] [CrossRef] [Scilit]
- Sun, W.X.; Li, Q.Q.; Qiao, B.; Jia, K.T.; Li, C.Y.; Zhao, C.J. Advances in plant-soil feedback driven by root exudates in forest ecosystems. Forests 2024, 15, 515. [Google Scholar] [CrossRef] [Scilit]
- Ferris, H.; Bongers, T.; de Goade, R.G.M. A framework for soil food web diagnostics, extension of the nematode faunal analysis concept. Appl. Soil Ecol. 2001, 18, 13–29. [Google Scholar] [CrossRef] [Scilit]
- Bongers, T.; Ferris, H. Nematode community structure as a bioindicator in environmental monitoring. Trends Ecol. Evol. 1999, 14, 224–228. [Google Scholar] [CrossRef] [Scilit]
- Neher, D.A. Ecology of plant and free-living nematodes in natural and agricultural soil. Annu. Rev. Phytopathol. 2010, 48, 371–394. [Google Scholar] [CrossRef] [Scilit]
- Korthals, G.W.; Bongers, T.; Kammenga, J.E.; Alexiev, A.D.; Lexmond, T.M. Long-term effects of copper and pH on the nematode community in an agroecosystem. Environ. Toxicol. Chem. 1996, 15, 979–985. [Google Scholar] [CrossRef]
- Pothula, S.K.; Grewal, P.S.; Auge, R.M.; Saxton, A.M.; Bernard, E.C. Agricultural intensification and urbanization negatively impact soil nematode richness and abundance: A meta-analysis. J. Nematol. 2019, 51, 1–17. [Google Scholar] [CrossRef] [Scilit] [PubMed]
- Wu, Z.D.; Lu, J.Y.; Ma, S.F.; Ye, H.; Zhang, Y.L.; Yang, D.L.; Hong, M. Effects of grassland utilization on soil nematode community structure and metabolic footprint. Chin. Environ. Sci. 2024, 44, 3342–3352. [Google Scholar]
- Barnes, A.D.; Jochum, M.; Lefcheck, J.S.; Eisenhauer, N.; Scherber, C.; O’Connor, M.I.; de Ruiter, P.; Brose, U. Energy flux: The link between multitrophic biodiversity and ecosystem functioning. Trends Ecol. Evol. 2020, 35, 863–873. [Google Scholar] [CrossRef] [Scilit]
- Wang, S.M. Advancing Soil Nematode Research: Molecular, Morphological and Stable Isotope Analyses; The Georg-August University School of Science (GAUSS): Göttingen, Germany, 2024. [Google Scholar]
- Zhang, Z.Y.; Wang, H.; Ding, F.; Wilschut, R.A.; Jia, Z.J.; Zhang, X.K.; Zhang, D.; Rasmann, S.; Sánchez-Moreno, S.; Li, B.X. Belowground plant inputs exert higher metabolic activities and carbon use efficiency of soil nematodes than aboveground inputs. Geoderma 2022, 420, 115883. [Google Scholar] [CrossRef] [Scilit]
- Fontaine, S.; Bardoux, G.; Abbadie, L.; Mariotti, A. Carbon input to soil may decrease soil carbon content. Ecol. Lett. 2004, 7, 314–320. [Google Scholar] [CrossRef] [Scilit]
- Strickland, M.S.; Rousk, J. Considering fungal: Bacterial dominance in soils-methods, controls, and ecosystem implications. Soil Biol. Biochem. 2010, 42, 1385–1395. [Google Scholar] [CrossRef] [Scilit]
- Rahman, M.M.; Tsukamoto, J.; Rahman, M.M.; Yoneyama, A.; Mostafa, K.M. Lignin and its effects on litter decomposition in forest ecosystems. Chem. Ecol. 2013, 29, 540–553. [Google Scholar] [CrossRef] [Scilit]
- Thévenot, M.; Dignac, M.F.; Rumpel, C. Fate of lignins in soils: A review. Soil Biol. Biochem. 2010, 42, 1200–1211. [Google Scholar] [CrossRef] [Scilit]
- Hammel, K.E. Fungal degradation of lignin. In Driven by Nature: Plant Litter Quality and Decomposition; Cadisch, G., Giller, K.E., Eds.; CAB International: Oxford, UK, 1997; pp. 33–40. [Google Scholar]
- Devi, A.S.; Yadava, P.S. Wood and leaf litter decomposition of Dipterocarpus tuberculatus Roxb. in a tropical deciduous forest of Manipur, Northeast India. Curr. Sci. 2007, 93, 243–246. [Google Scholar]
- Jochum, M.; Eisenhauer, N. Out of the dark: Using energy flux to connect above- and belowground communities and ecosystem functioning. Eur. J. Soil Sci. 2022, 73, e13154. [Google Scholar] [CrossRef] [Scilit]
- Li, J.F.; La, S.K.; Song, M.Y.; Gao, L.H.; Tian, Y.Q. Evidence for the role of soil C/N ratio in shaping plant responses to root-knot nematode infection. J. Adv. Res. 2026, 79, 51–60. [Google Scholar] [CrossRef] [Scilit]
- Wang, J.Q.; Zheng, Y.F.; Shi, X.Z.; Lam, S.K.; Lucas-Borja, M.E.; Huang, Z.Q. Nature restoration shifts the abundance and structure of soil nematode communities in subtropical forests. Plant Soil 2022, 471, 315–327. [Google Scholar] [CrossRef] [Scilit]
- Shi, Y.; Fan, X.J.; Liu, J.L.; Zhang, R.B.; He, Y.X.; Fu, X.L.; He, C.J.; Fan, Z.Z.; He, J.L.; Liu, M.Z.; et al. Effects of litter inputs on soil nematode community structure and metabolic footprint in a Robinia pseudoacacia forest. Acta Ecol. Sin. 2024, 44, 11276–11285. [Google Scholar]
- Lu, J.Y. Effects of Grassland Utilization Modes on Soil Nematode Community Characteristics in Baikal Stipa Steppe. Master’s Thesis, Inner Mongolia Agricultural University, Hohhot, China, 2022. [Google Scholar]
- Yang, S.H.; Wang, H.; Chen, L.; Liao, Y.F.; Yan, G.; Wu, Y.N.; Zou, H.F. Effects of heterogeneous habitat on soil nematode community characteristics in the Songnen Plain. Biodivers. Sci. 2024, 33, 23295. [Google Scholar] [CrossRef] [Scilit]
- Mo, X.M.; Zhang, Q.; Yang, J.X.; Zheng, G.; Hu, Z.; Zhang, X.; Liang, S.; Cui, S. Responses of soil nematode metabolic rate and energy flow to nitrogen addition and precipitation pattern change in a typical northern grassland. Biodivers. Sci. 2025, 33, 24341. [Google Scholar] [CrossRef] [Scilit]
- Renčo, M.; Jurová, J.; Čerevková, A. Invasiveness of Impatiens parviflora in Carpathian beech forest: Insights from soil nematode communities. Diversity 2024, 16, 393. [Google Scholar] [CrossRef] [Scilit]
- Zhang, J.R.; Hu, Z.K.; Zhang, C.Z.; Tao, Y.H.; Chen, X.Y.; Griffiths, B.S.; Liu, M.Q. Roots with larger specific root length and C:N ratio sustain more complex rhizosphere nematode community. Plant Soil 2022, 477, 693–706. [Google Scholar] [CrossRef] [Scilit]
- Jiang, X. Effects of Plant Functional Group Removal on Soil Fungal and Nematode Communities in an Alpine Meadow on the Tibetan Plateau; Tibet University: Lhasa, China, 2023. [Google Scholar]

Disclaimer/Publisher’s Note: The statements, opinions and data contained in all publications are solely those of the individual author(s) and contributor(s) and not of MDPI and/or the editor(s). MDPI and/or the editor(s) disclaim responsibility for any injury to people or property resulting from any ideas, methods, instructions or products referred to in the content. |
© 2026 by the authors. Licensee MDPI, Basel, Switzerland. This article is an open access article distributed under the terms and conditions of the Creative Commons Attribution (CC BY) license.