


Abstract
Urban forests (UFs) are increasingly promoted as a nature-based solution for mitigating particulate matter (PM) pollution, yet their removal performance can vary depending on surrounding emission sources and environmental conditions. Here, we quantified the particulate matter reduction efficiency (PMRE) of UFs located near roads, industrial complexes, and urban areas, together with background forests in South Korea, based on field observations during the late autumn–spring period across two consecutive years (November–May in 2021–2022 and 2022–2023). We applied vector autoregression (VAR) to examine the dynamic relationships between PMRE and meteorological and air pollutant variables across eight representative sites. The results revealed that PM mitigation dynamics were strongly particle-size-dependent and context-specific. Across all sites, ΔPM10 RE was predominantly self-driven, explaining over 90% of its own variance, whereas fine-particle dynamics showed stronger interdependence. In particular, ΔPM2.5 RE consistently acted as a key mediator, accounting for up to 70%–80% of the variation in ΔPM1.0 RE depending on source context. Industrial-complex-adjacent UFs exhibited the strongest cross-variable interactions, while urban-core UFs were largely governed by intrinsic mitigation processes. Roadside UFs showed site-specific responses associated with CO and temperature variability. Notably, PMRE responses exhibited damped oscillation patterns across all source contexts, converging toward equilibrium over time, indicating stabilization of mitigation performance following disturbance events. These findings demonstrate that urban forest air-quality benefits are highly context dependent and governed by particle-size-specific dynamics. Our results provide evidence-based guidance for designing and managing urban forests, emphasizing the need for source-specific strategies and prioritization of PM2.5-oriented mitigation, particularly in industrial and roadside environments where fine-particle interactions are strongest.
1. Introduction
Particulate matter (PM) pollution remains a persistent environmental and public health challenge in urban areas, particularly during recurrent high-concentration episodes. Fine particles, such as PM10 and PM2.5, can penetrate the human respiratory system and are associated with severe health outcomes, including cerebrovascular and cardiovascular diseases, lung cancer, and other respiratory complications [1,2]. Smaller particles also exhibit higher toxicity due to their larger surface area and stronger capacity to adsorb hazardous substances, increasing their retention time in the human body [3]. Although policy efforts have contributed to long-term improvements in air quality, a substantial share of urban air pollution continues to originate from major and persistent emission sources, highlighting the need for effective, practical mitigation strategies [4].
Urban forests (UFs) are widely implemented as nature-based solutions to address urban environmental and social challenges, including air quality improvement. Trees mitigate PM primarily through dry and wet deposition processes. During dry deposition, airborne particles accumulate on leaf surfaces depending on morphological traits (e.g., leaf structure) and physicochemical properties (e.g., wax layer composition), while deposited particles may be resuspended or removed through wind, leaf fall, or meteorological variability. Wet deposition further removes accumulated particles through precipitation wash-off [5,6,7,8,9,10]. Importantly, however, the PM mitigation performance of UFs is not uniform and can vary with vegetation characteristics, seasonality, meteorological conditions, and the surrounding emission environment.
Previous studies have examined PM mitigation by UFs across diverse geographic contexts, including roadside, industrial, and urban environments [11,12,13,14], and have further explored the influence of meteorology [15,16] and distance from forests [17,18]. These studies consistently indicate that mitigation capacity is shaped by multiple interacting factors. In cold-season conditions, for example, the removal of fine PM can be reduced in deciduous systems due to seasonal foliage loss, thereby changing deposition capacity and pollutant dynamics. Moreover, the composition and quantity of air pollutants differ across emission sources. Industrial activities commonly emit PM alongside sulfur dioxide (SO2), nitrogen oxides (NOX), and carbon monoxide (CO), and may also release heavy metals and other hazardous compounds depending on processes and materials [19]. Road traffic emissions arise from exhaust, tire wear, and road abrasion, contributing to VOCs, PM, NOX, and CO [20], while dense urban areas also emit complex mixtures associated with residential, commercial, and transportation activities [21]. Such source-dependent differences suggest that the effectiveness of UFs in mitigating PM may vary substantially across land-use types and emission contexts. Recent observational studies have further advanced the understanding of urban forest contributions to particulate matter mitigation under real-world conditions. For example, Seo et al. [22] demonstrated that urban forests tend to exhibit higher removal efficiency for coarse particles than fine particles, with performance varying depending on seasonal and structural characteristics. These findings highlight the importance of considering particle-size-specific dynamics and contextual factors when evaluating urban forest mitigation performance.
Despite decades of research, current evidence remains limited in its ability to guide context-specific planning and management of UFs across diverse urban environments. Many studies have been restricted to specific regions or seasons, constraining the generalization of findings to recurrent high-PM episodes and contrasting emission settings. In addition, PM mitigation has often been assessed primarily through concentration changes, while fewer studies have examined the dynamic interactions between PM mitigation performance, co-pollutants, and meteorological drivers across different emission-source contexts. A deeper understanding of these interactions is essential for developing tailored UF strategies that maximize air-quality co-benefits near major pollution sources, such as roads and industrial complexes, while improving overall urban exposure conditions. Understanding time-lagged and cross-fraction responses is critical because urban forest management operates through repeated disturbances (pollution episodes, weather variability), and mitigation effectiveness must be interpreted as a dynamic service rather than a static concentration difference.
Therefore, in this study, we selected eight UF sites representing roadside, industrial-complex-adjacent, dense urban-core environments, along with background forests in South Korea, where fine PM concentrations are typically elevated from late autumn to spring. Using PM reduction efficiency (PMRE) as an indicator of UF mitigation performance during high-pollution periods, we investigated (1) the key influencing factors of PMRE across contrasting emission-source contexts, and (2) the dynamic relationships among PMRE, meteorological variables, and air pollutant variables, highlighting source-context-specific interactions relevant to urban forest design and management.
This study contributes to the current understanding of urban forest PM mitigation in several important ways. First, it applies a multivariate time-series framework (VAR) to examine dynamic interactions among particulate matter reduction efficiency, meteorological variables, and co-pollutants, moving beyond conventional static approaches. Second, it provides empirical evidence that PM mitigation dynamics are strongly particle-size dependent, with PM2.5 acting as a central mediator linking coarse and ultrafine particle responses across emission-source contexts. Third, it offers context-specific insights for urban forest design and management by showing that mitigation performance varies systematically with surrounding emission environments.
2. Materials and Methods
2.1. Monitoring Network and Study Design
The National Institute of Forest Science established the Asian Initiative for Clean Air Networks (AICAN) to investigate the role of forests and urban green spaces in mitigating particulate matter (PM) pollution across South Korea. Between 2019 and 2023, AICAN strategically selected and operated 44 monitoring sites located near major pollution sources, enabling long-term observations of PM concentrations, meteorological conditions, and selected co-pollutants.
Site selection was conducted in two steps. First, candidate urban forests (UFs) were categorized according to four construction-background types. Second, candidate locations were evaluated using three-year meteorological data, atmospheric modeling, field surveys, and on-site evaluations to finalize monitoring locations. This network design provides a basis for comparing UF mitigation performance under contrasting emission environments.
For the present study, we selected study sites based on the following criteria:
- (1)
- availability of at least three years of long-term data, and
- (2)
- inclusion of at least two sites per emission-source context.
Accordingly, we analyzed eight sites representing four source contexts: roadside, industrial-complex-adjacent, dense urban-core, and background forest (control/reference) environments.
The selected sites were chosen to represent distinct emission-source contexts within the AICAN monitoring network, including roadside, industrial-complex-adjacent, urban-core, and background forest environments. Site classification was based on proximity to dominant emission sources and surrounding land-use characteristics, ensuring that each site reflects the typical environmental conditions of its respective context.
From the full set of monitoring sites, only those with sufficient data completeness and consistency were considered. Specifically, sites were required to have at least three years of continuous observations and complete datasets for particulate matter, meteorological variables, and co-pollutants. Several candidate sites were excluded due to incomplete time-series data, shorter monitoring periods, or inconsistencies in key variables, which could compromise the reliability of the VAR-based analysis.
2.2. Data Scope and Temporal Coverage
AICAN continuously measures PM concentrations and provides near-real-time information on air quality in forests and urban green spaces. For this study, UF monitoring data were acquired through the AICAN platform (publicly available via the national Open Data Portal). Pollution-source and ambient air-quality data were obtained from multiple sources depending on site context. Roadside and industrial-complex data were obtained from AICAN, whereas urban and background forest data were obtained from Air Korea (the national air-quality monitoring network). Meteorological data (temperature, pressure, humidity, wind speed, and wind direction) were obtained from the Korea Meteorological Administration (KMA) using the nearest station to each site.
All datasets were preprocessed and integrated based on the most recent period for which harmonized PM, meteorological, and co-pollutant observations were consistently available across all selected sites. We prioritized temporal completeness, cross-site comparability, and data quality control because the VAR framework requires a common and internally consistent time series across source contexts. The final dataset therefore covered two cold-season periods characterized by elevated PM concentrations in South Korea: November 2021–May 2022 and November 2022–May 2023. All datasets were processed at a daily resolution following temporal aggregation of high-frequency measurements to ensure consistency with the event-based analytical framework and comparability across sites.
Within the AICAN monitoring network, all variables were recorded at a 10 min temporal resolution, including particulate matter, meteorological parameters, and co-pollutants. These high-frequency measurements were subsequently aggregated into daily averages to ensure consistency across datasets and to align with the event-based analytical framework. This aggregation reduces short-term variability and measurement noise while preserving the overall temporal patterns relevant for the VAR-based time-series analysis.
The dataset includes particulate matter size fractions (PM10, PM2.5, and PM1.0), meteorological variables (temperature, humidity, wind speed, and wind direction), and co-pollutants (SO2, NO2, CO, and O3), allowing for a comprehensive assessment of UF–atmosphere interactions.
2.3. Study Sites and Source Contexts
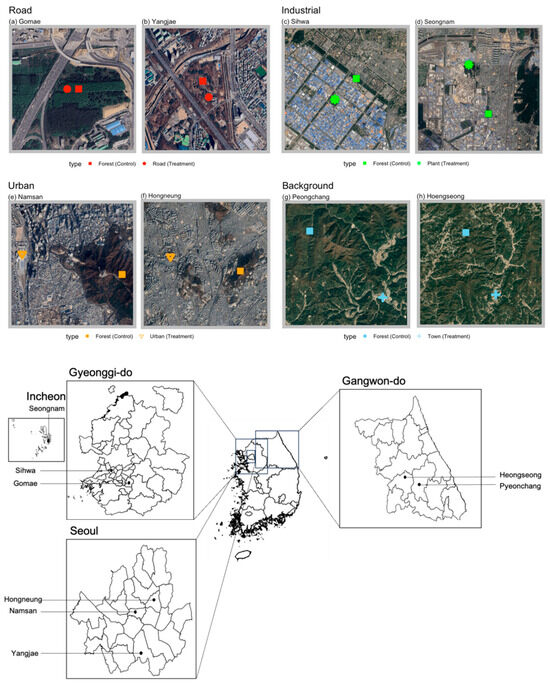
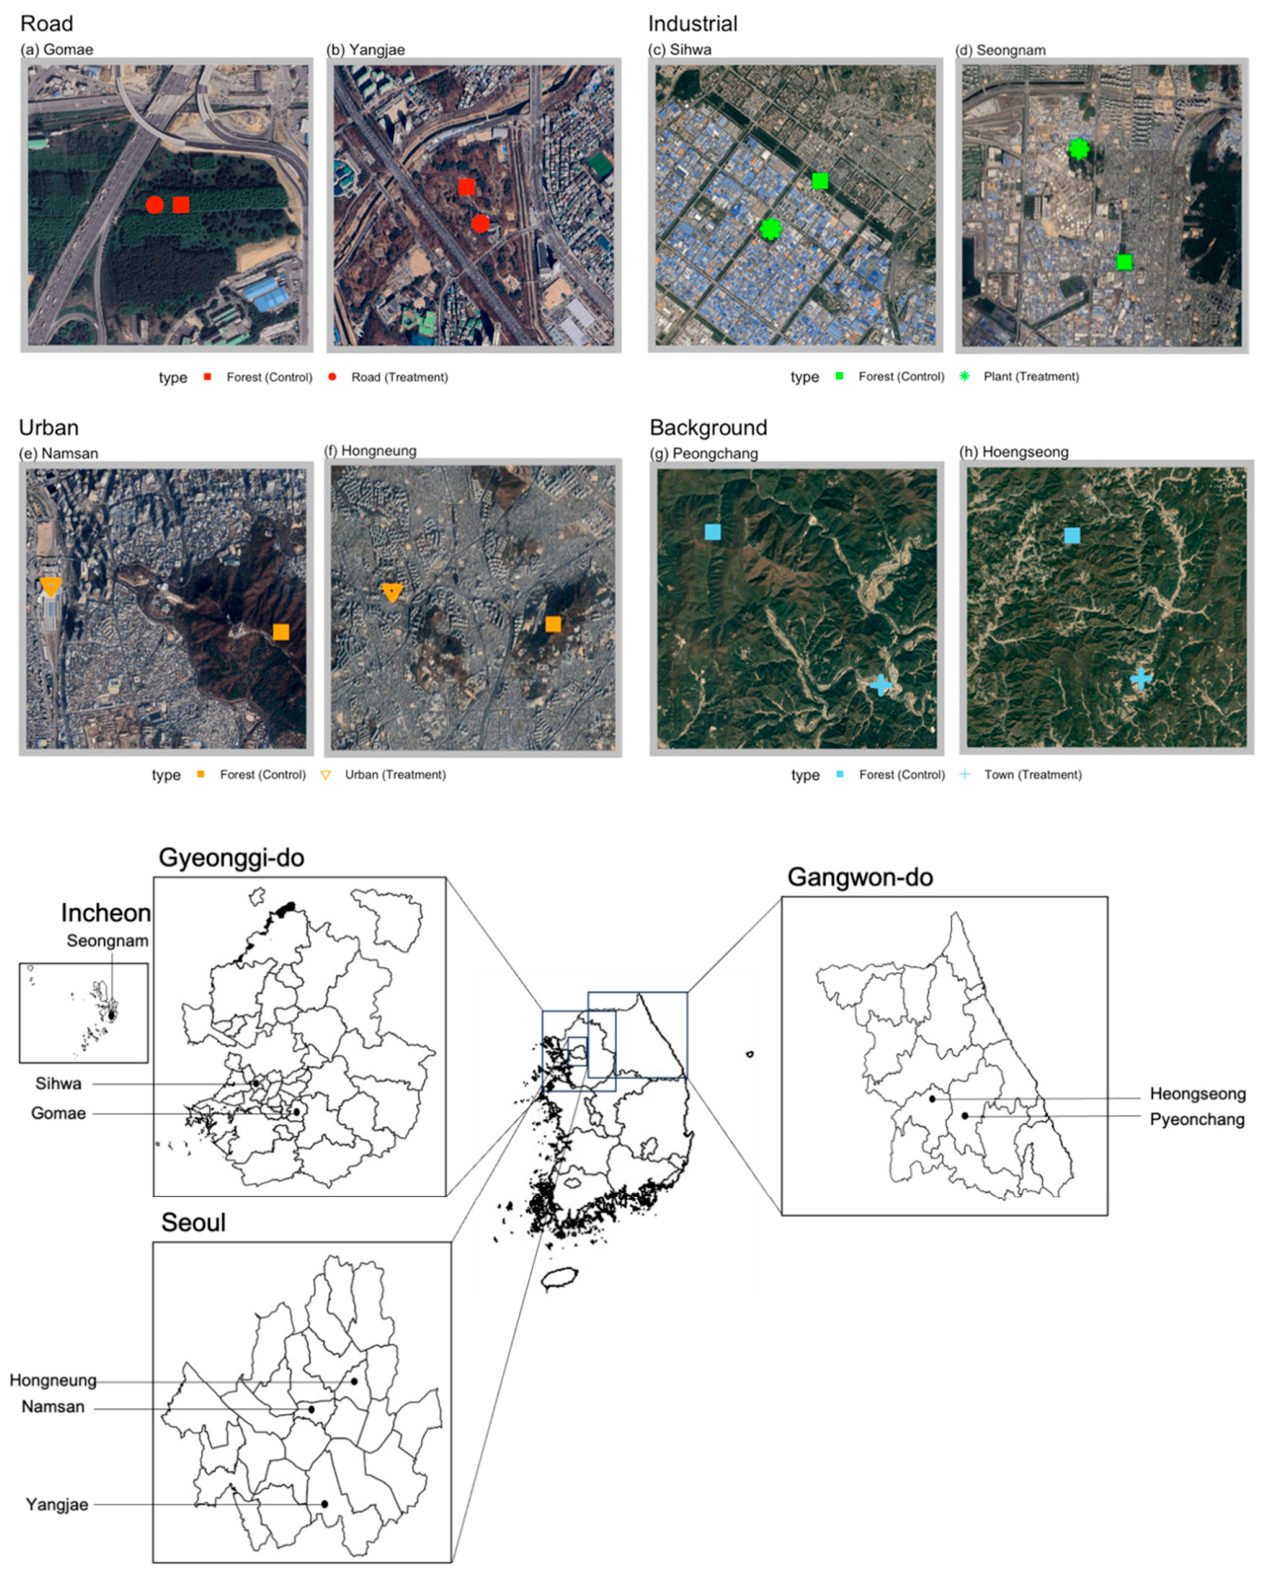
Two roadside sites (Gomae and Yangjae) were located near the Gyeongbu Expressway and represented high-traffic environments, with an average traffic volume of approximately 192,000 vehicles per day [23]. Two industrial-complex-adjacent sites (Sihwa and Seongnam) were selected to represent industrial emission environments with contrasting surrounding land-use contexts. Two urban-core sites (Hongneung and Namsan) were located in Seoul, representing dense urban environments influenced by multiple local emission sources. Finally, two background forest sites (Pyeongchang and Hoengseong) were located in the eastern region of South Korea, where wintertime northwesterly winds and mountain ranges reduce pollutant transport from the western region [24]. These background sites were used to characterize reference atmospheric conditions in forested environments (Figure 1, Table 1).
Figure 1.
Study area and spatial distribution of the eight AICAN monitoring sites across South Korea. (a) Gomae; (b) Yangje; (c) Sihwa; (d) Seongnam; (e) Namsan; (f) Hongneung; (g) Peongchang; (h) Hoengseong.
Table 1.
Characteristics of study sites.
2.4. Data Preprocessing and Event Selection
To analyze UF–pollution interactions during high-PM episodes, we conducted the following preprocessing steps:
- (a)
- Integration of multi-source datasets. For roadside and industrial-complex contexts, variables from AICAN (site information, observation time, and meteorological parameters) were integrated with Air Korea co-pollutant data (SO2, NO2, CO, and O3). For urban and background forest contexts, datasets from AICAN, Air Korea, and KMA were integrated.
- (b)
- Wind-direction classification. Wind direction was used to distinguish periods when UFs were more likely to be influenced by their adjacent pollution sources. Each UF site was assigned a wind-direction range based on the relative location of nearby sources. For example, Gomae was assigned 180–360°, Sihwa 135–315°, and Seongnam 225–45° across north (i.e., 225–360° and 0–45°). In contrast, for urban-core sites (Namsan and Hongneung), all wind directions were included due to multi-source influences. Wind sectors were determined based on the relative geometry between the UF plot and the dominant upwind emission source to maximize source influence while minimizing mixed-source conditions.
- (c)
- High-PM episode definition. We focused on the cold-season period (November–May) when PM concentrations are typically elevated in South Korea. High-pollution events were defined based on the national episode classification thresholds: a day was classified as a high-PM event when either PM10 exceeded 51 µg m−3 or PM2.5 exceeded 36 µg m−3 (Ministry of Environment, South Korea). Extracted datasets were summarized at a daily resolution for subsequent analysis. These thresholds are substantially higher than the World Health Organization (WHO) air quality guideline for PM2.5 (15 µg m−3, 24 h mean), indicating that the analyzed periods represent severe pollution conditions in a global context.
These preprocessing steps were designed to isolate the influence of dominant emission sources while ensuring temporal consistency across datasets. In particular, wind-direction filtering was applied to maximize source-specific signals and minimize mixed-source interference, thereby improving the interpretability of subsequent time-series analyses.
2.5. Variable Definition
To identify drivers of UF mitigation performance during high-pollution periods, the dependent variables were defined as the reduction efficiency of PM size fractions (PM10, PM2.5, and PM1.0). Meteorological variables and ambient co-pollutant concentrations (SO2, NO2, CO, and O3) were included as explanatory variables.
This formulation allows a relative comparison of PM reduction performance between urban forest (treatment) and pollution-source (control) sites, thereby minimizing site-specific baseline differences and enabling consistent cross-site comparison across different emission contexts (Table 2).
Table 2.
Used variable description in this study.
2.6. Time-Series Analysis Using Vector Autoregression
PM concentrations exhibit temporal dependencies and cross-variable interactions, particularly because PM2.5 is a subset of PM10 and PM1.0 is a subset of PM2.5. To account for particle-size interdependence, time-lagged responses, and multivariate interactions among PM reduction efficiency, meteorology, and co-pollutants, we employed a vector autoregression (VAR) framework [25].
We used a VAR(p) model of the form:
where denotes the vector of dependent and explanatory variables at time ; is a constant vector; are coefficient matrices; and is the error term. We interpreted dynamic relationships using impulse response functions (IRFs) and forecast error variance decomposition (FEVD), which quantify how shocks to one variable propagate through the system over time and the relative contributions of each variable to variance in PM reduction efficiency.
The VAR framework was adopted because it enables the joint modeling of multivariate time-series data while capturing interdependencies, feedback mechanisms, and time-lagged effects among variables. This is particularly appropriate for urban air quality systems, where PM fractions, meteorological conditions, and co-pollutants interact dynamically rather than operating in isolation. The robustness of the impulse response functions was assessed through standard VAR diagnostics, including lag-length selection based on information criteria (AIC/BIC), stationarity testing, and residual analysis. These procedures ensure the stability and reliability of the estimated dynamic responses.
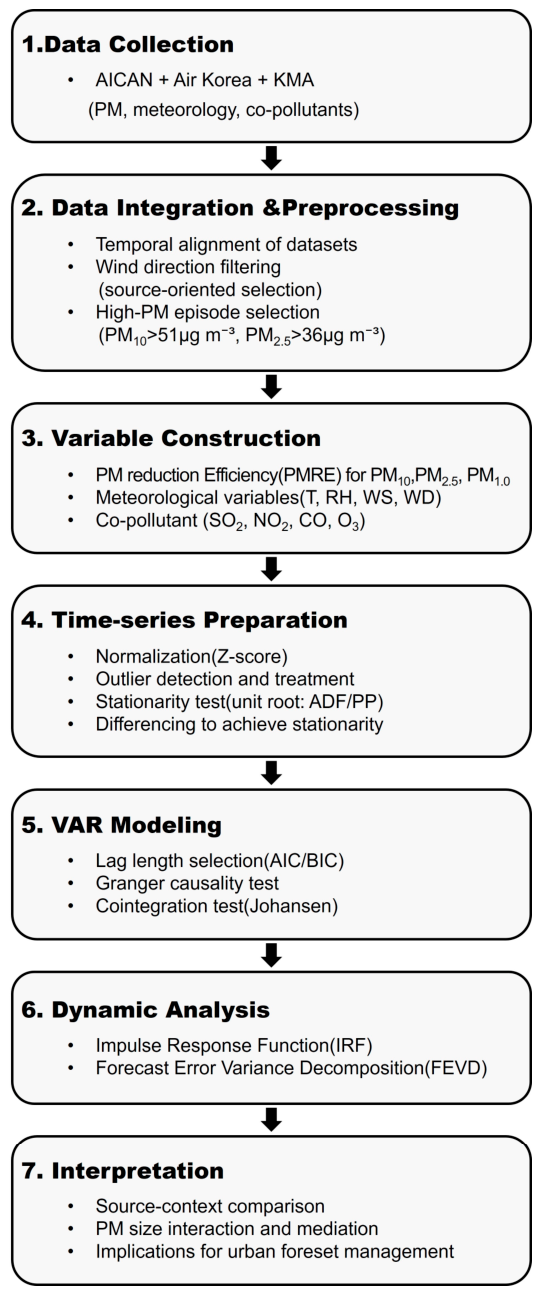
2.7. Model Specification and Analytical Workflow
Before fitting VAR models, we conducted standard diagnostic and specification procedures:
- (1)
- PM reduction efficiency generation and normalization. Difference variables for PM reduction efficiency and meteorological factors were generated between pollution-source (control) and UF (treatment) sites. Variables were normalized to a common scale using min–max normalization.
- (2)
- Outlier detection. Multivariate outliers were identified using Mahalanobis distance for joint distributions of PM variables. Normality was evaluated using the Jarque–Bera test.
- (3)
- Stationarity and differencing. Unit-root tests were performed, and first differences were applied to dependent variables to improve stability and ensure consistent interpretation across sites.
- (4)
- Granger causality testing. Granger causality tests were conducted to assess temporal dependencies and inform variable ordering.
- (5)
- Lag selection and model fitting. Lag length was selected based on information criteria (AIC and BIC).
- (6)
- Cointegration testing. Cointegration tests were conducted to examine potential long-term relationships among variables.
- (7)
- IRF and FEVD analyses. Impulse responses and variance decompositions were used to interpret dynamic interactions among variables and identify key drivers of PM reduction efficiency across source contexts.
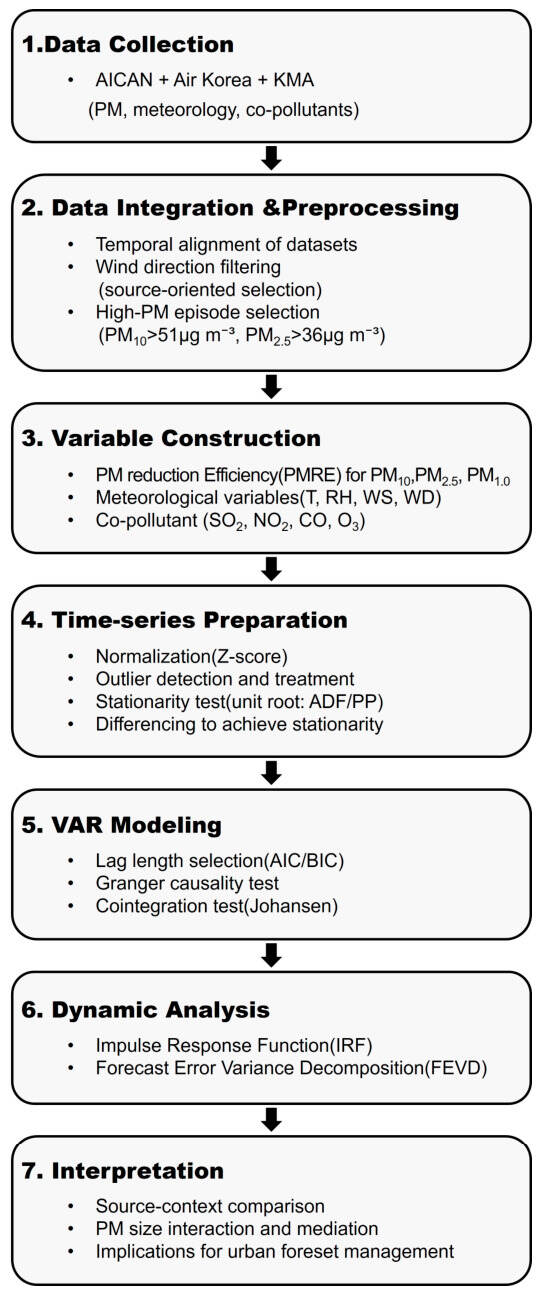
These procedures were implemented sequentially as an integrated analytical pipeline to ensure model stability, reduce statistical bias, and enhance the interpretability of dynamic relationships. The stepwise framework also improves reproducibility by providing a transparent linkage between data preprocessing, model specification, and result interpretation (Figure 2).
Figure 2.
Schematic framework of the analytical workflow.
3. Results
3.1. VAR Model Specification and Diagnostics
Prior to fitting the VAR models, we evaluated time-series properties using unit-root testing, cointegration analysis, Granger causality testing, and lag-length selection. Unit-root tests indicated that some variables were non-stationary in several regions; therefore, first-order differencing was applied to all variables to ensure stationarity and comparability across sites. The Johansen cointegration test confirmed cointegration relationships in all study regions, suggesting a long-term equilibrium relationship between UF PM reduction efficiency (PMRE) and explanatory variables. Although cointegration typically motivates the use of a vector error correction model, a standard VAR framework was adopted here to avoid overfitting, particularly in regions with limited sample sizes.
Granger causality results were used to support variable ordering (Table A1). The optimal lag length was primarily determined using the Schwarz criterion (SC), supported by residual diagnostics based on the autocorrelation and partial autocorrelation functions (Table A2). While SC suggested a lag of 3 for Seongnam, residual diagnostics indicated that autocorrelation was not persistent beyond lag 1; therefore, a lag length of 1 was consistently applied across all regions. In addition, a trend-included VAR specification was used to account for underlying trends in the air quality and meteorological datasets.
3.2. Source-Context Differences in PMRE Dynamics (Impulse Response Functions)
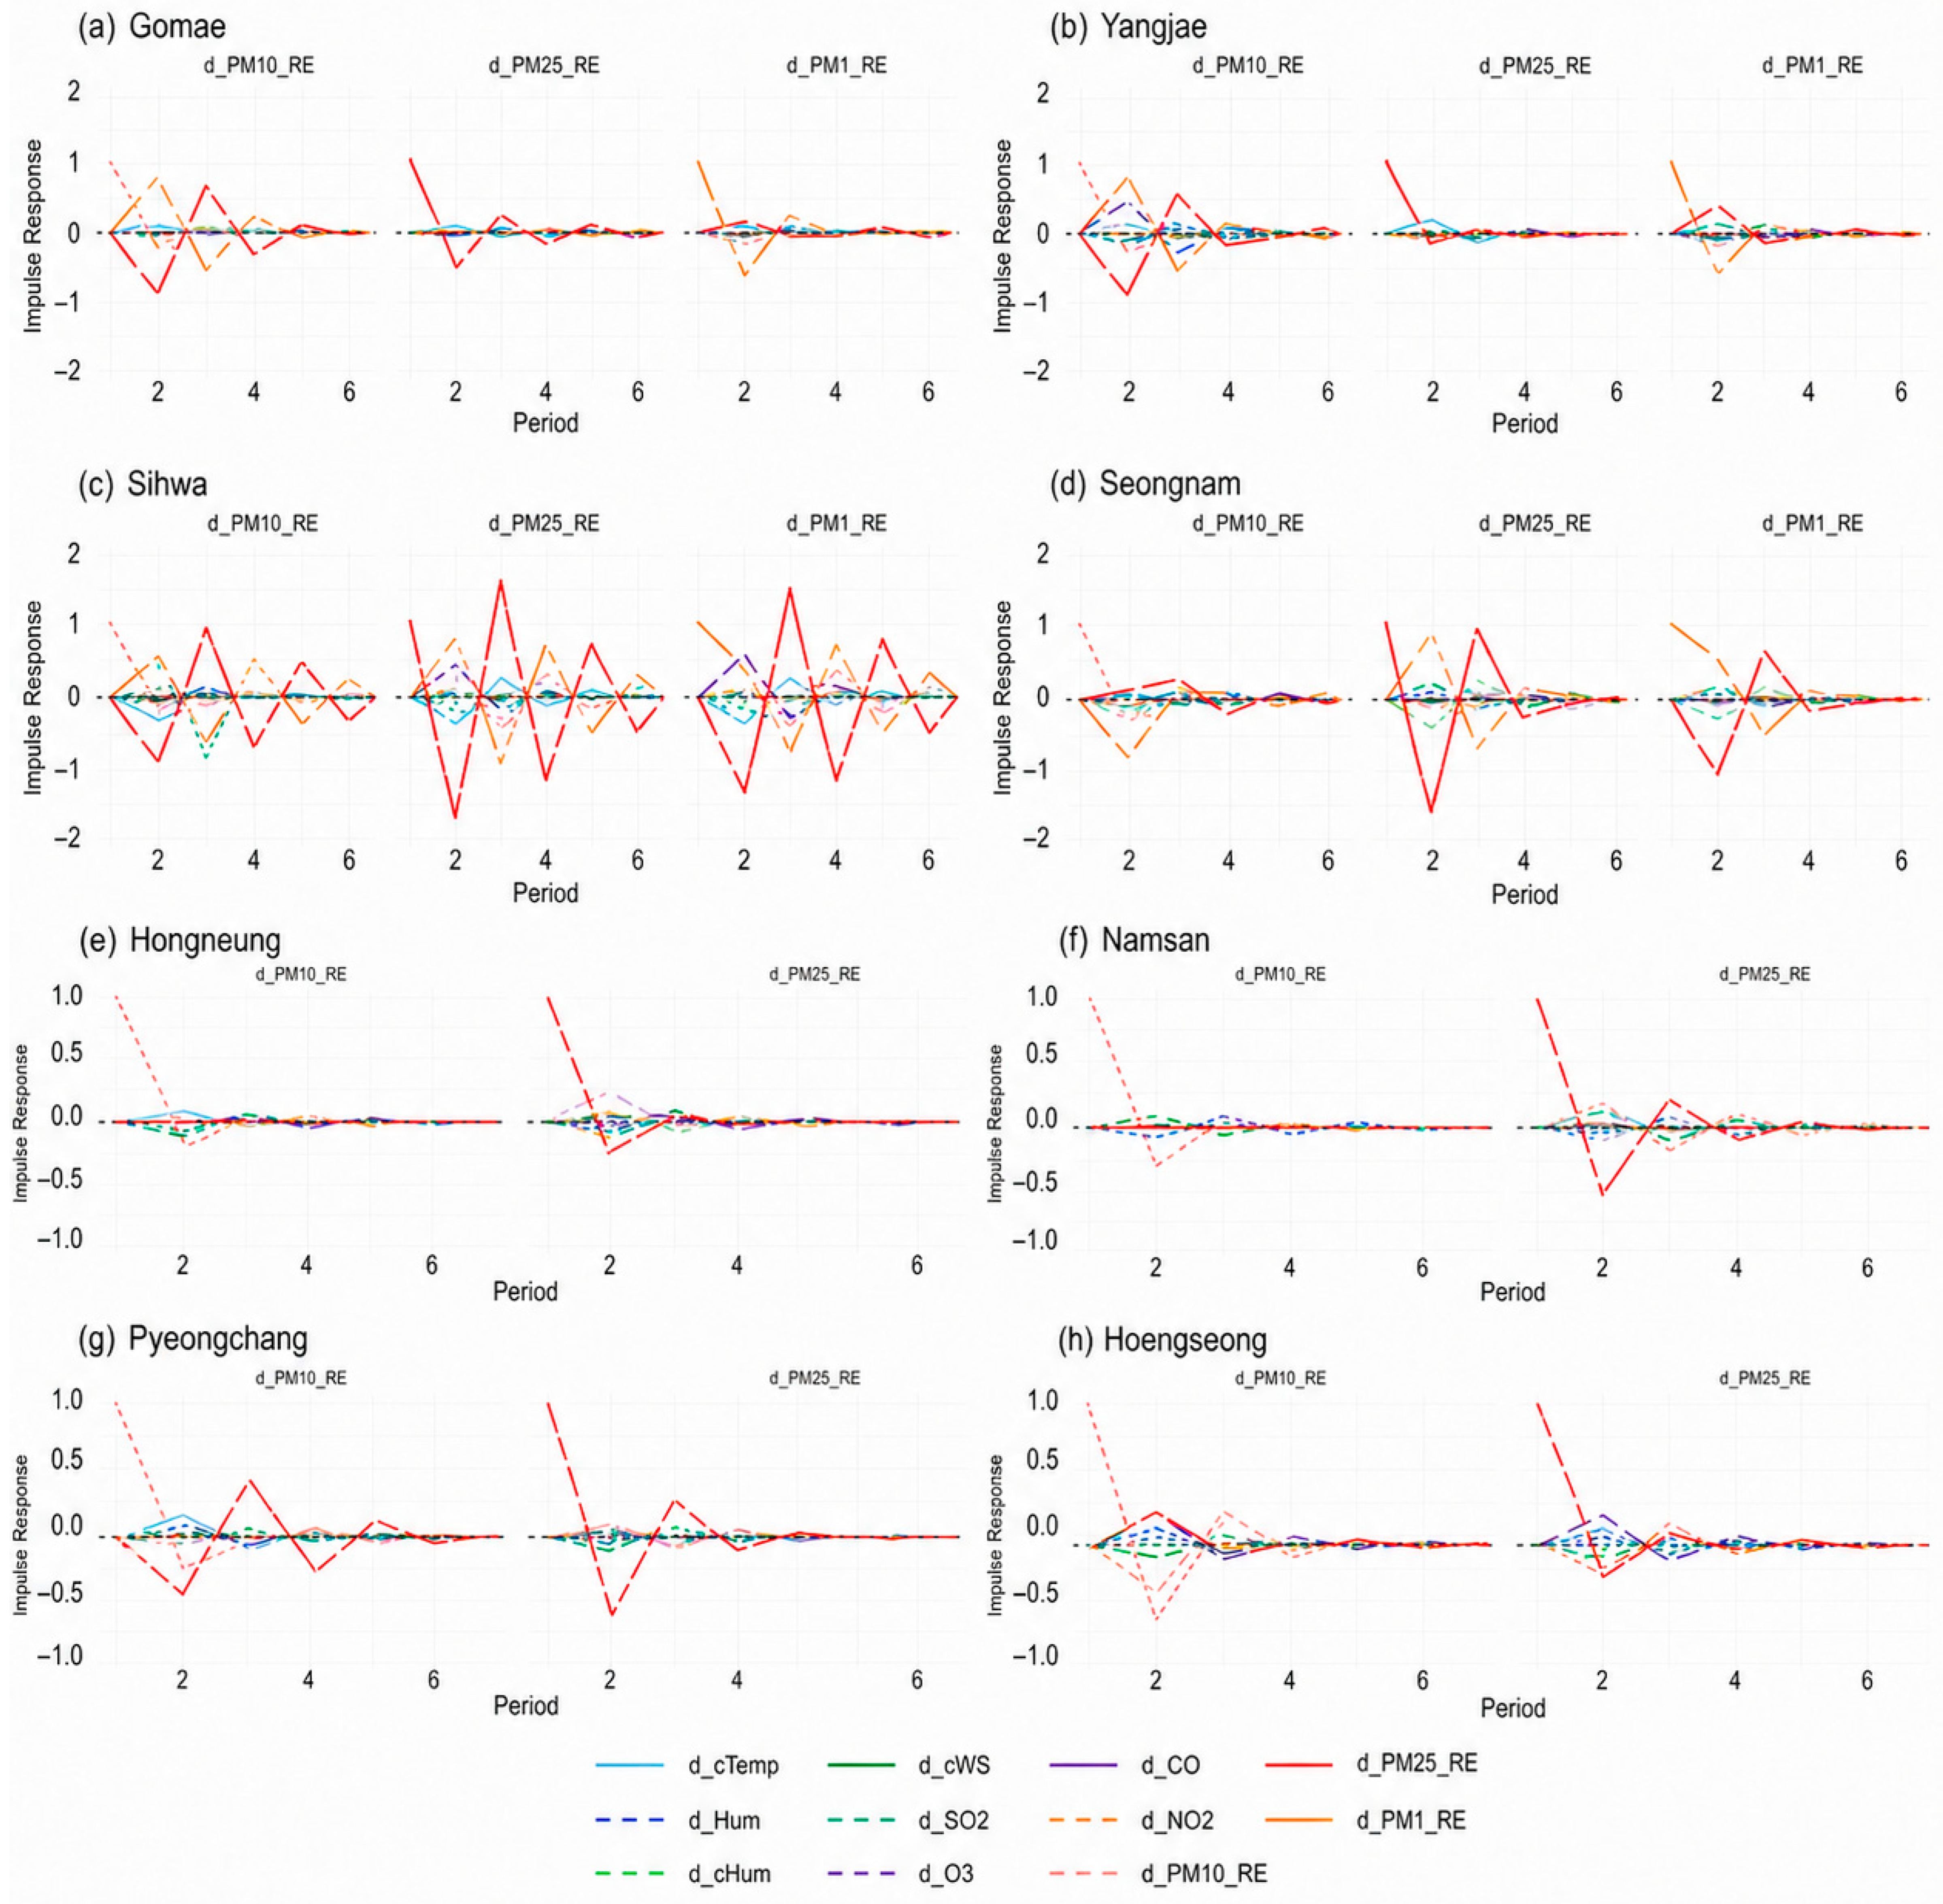
Impulse response functions (IRFs) were used to quantify how PMRE variables responded over time to shocks in PMRE itself, meteorological factors, and co-pollutants. Specifically, we examined the temporal evolution of ΔPM10 RE, ΔPM2.5 RE, and ΔPM1.0 RE in response to a one-unit shock in impulse variables at the previous time step (t−1), including ΔPM10 RE, ΔPM2.5 RE, ΔPM1.0 RE, ΔdHum, ΔcTemp, ΔcHum, ΔcWS, ΔO3, ΔSO2, ΔCO, and ΔNO2. Shocks were defined as one-unit increases corresponding to the square root of the diagonal elements of the forecast error variance matrix (Table A3, Table A4 and Table A5). Standardized IRFs were normalized by the standard deviation of each response variable to enable comparison across variables (Figure 3).
3.2.1. Background Forests
Background forest sites (Hoengseong and Pyeongchang) showed strong self-responses in both ΔPM10 RE and ΔPM2.5 RE. When cross-responses were examined, ΔPM10 RE reacted more strongly to shocks in ΔPM2.5 RE than the reverse, indicating an asymmetric interaction between these two PM fractions under background conditions.
3.2.2. Roadside Urban Forests
At roadside sites (Gomae and Yangjae), ΔPM10 RE responded significantly to shocks from all PMRE variables. In contrast, ΔPM2.5 RE exhibited responses primarily to its own shocks, whereas ΔPM10 RE responded to both its own shocks and ΔPM2.5 RE shocks. These patterns indicate that roadside UF mitigation dynamics are strongly structured around ΔPM10 RE responses but show more limited cross-coupling for fine PM fractions.
3.2.3. Industrial-Complex-Adjacent Urban Forests
The two industrial sites represent distinct emission environments, with Sihwa characterized by large-scale heavy industry and relatively strong, continuous emission sources, whereas Seongnam is situated within a densely urbanized area with smaller-scale and mixed urban–industrial activities, implying more heterogeneous emission patterns.
Industrial sites (Sihwa and Seongnam) exhibited the strongest and most complex cross-interactions among PMRE variables, but the patterns differed between the two locations. In Sihwa (a mechanical parts and materials industrial complex), ΔPMRE variables responded to shocks from all PMRE variables, and finer particle fractions (ΔPM2.5 RE) exhibited more pronounced responses than ΔPM10 RE, indicating greater sensitivity to interactions among smaller particles. In Seongnam (a wood-processing industrial area), ΔPM10 RE responded to shocks from all PMRE variables; however, fine particle responses (ΔPM2.5 RE and ΔPM1.0 RE) to ΔPM10 RE shocks were minimal. Instead, ΔPM2.5 RE and ΔPM1.0 RE showed strong mutual interactions, suggesting a distinct fine-particle-driven dynamic structure in this region.
Figure 3.
Impulse response functions (IRFs) across emission-source contexts. (a,b) roadside environments; (c,d) industrial-complex-adjacent environments; (e,f) urban-core environments; (g,h) background forest environments.
3.2.4. Dense Urban-Core Urban Forests
For urban-core sites (Hongneung and Namsan), PMRE variables predominantly responded to their own shocks, with minimal cross-interactions among different PMRE fractions. This indicates that PM mitigation dynamics in dense urban cores were largely driven by intrinsic UF processes rather than strong coupling among PM fractions.
3.2.5. Key Cross-Cutting Patterns
Across all source contexts, five main findings emerged.
- (1)
- ΔPM10 RE responded strongly to PMRE shocks, but its influence on other ΔPM10 RE variables was limited.
- (2)
- Responses triggered by fine PM shocks (ΔPM2.5 RE and ΔPM1.0 RE) persisted longer than those induced by ΔPM10 RE shocks, indicating greater temporal persistence for finer particles.
- (3)
- Industrial-complex-adjacent UFs showed the clearest evidence that reductions in one PM fraction were associated with reductions in others, suggesting strong interdependence among PM fractions.
- (4)
- ΔPM2.5 RE acted as a central mediator linking PM fractions, particularly for ΔPM10 RE–ΔPM2.5 RE and ΔPM2.5 RE–ΔPM1.0 RE interactions, indicating the importance of PM2.5-driven mitigation dynamics.
- (5)
- PMRE responses commonly exhibited damped oscillation patterns and gradually converged toward zero over time, suggesting stabilization of mitigation performance following disturbances. This behavior indicates that shocks to the system initially propagate through short-term fluctuations but progressively diminish over time, reflecting a stabilizing adjustment process and dynamic equilibrium in PM reduction dynamics.
3.2.6. Responses to Meteorological Factors and Co-Pollutants
Responses to meteorological variables and co-pollutants differed across sites, even within the same source-context category (Table A6). In Gomae, where one side of the UF bordered a high-traffic roadside and tree density was high, the influence of meteorological and air pollutant variables on PMRE was relatively small. In contrast, Yangjae, a roadside-encircled urban park forest, exhibited stronger responses to CO and temperature fluctuations.
Industrial-complex-adjacent UFs showed the largest magnitude of responses to non-PMRE variables. Despite both being located in western South Korea, Sihwa responded more strongly to air pollutants and temperature, whereas Seongnam was more sensitive to meteorological factors, reflecting differences in industrial activities and geographic context. In dense urban-core sites (Hongneung and Namsan), responses differed by particle size: larger particles tended to respond more strongly to meteorological factors, whereas finer particles exhibited greater sensitivity to ozone (O3). However, consistent with Figure 3, strong non-PMRE responses were most prominent in industrial settings, while meteorological and co-pollutant influences were comparatively limited in other contexts.
3.3. Long-Term Contributions of Drivers (Forecast Error Variance Decomposition)
Forecast error variance decomposition (FEVD) was used to quantify the relative contributions of PMRE variables, meteorological factors, and co-pollutants to overall variance in mitigation dynamics [25]. Because individual meteorological and air pollutant contributions were relatively small, they were aggregated into broader categories for clearer comparison (Table 3).
Table 3.
Forecast Error Variance Decomposition for for each pollution source.
Forecast horizons represent the number of time steps ahead (i.e., days in this study) over which the contribution of each variable to forecast error variance is assessed. The percentage values reported in Table 3 indicate the relative contribution of each variable to the total variance of PMRE at each horizon. Higher percentages denote a stronger influence of a given variable on the system’s variability, thereby reflecting the relative importance and persistence of dynamic interactions over time. Accordingly, FEVD provides a dynamic perspective on how different drivers influence the evolution of PMRE over time.
Across all emission-source contexts, ΔPM10 RE generally exhibited the highest explanatory power over time, indicating that its past values substantially influenced current ΔPM10 RE behavior. However, fine-particle dynamics (ΔPM2.5 RE and ΔPM1.0 RE) varied by context, requiring source-specific interpretation.
In background forests, ΔPM10 RE predominantly explained variance in ΔPM2.5 RE, indicating strong dependency between these PM fractions. At roadside sites (Gomae and Yangjae), the relative contribution of ΔPM10 RE and ΔPM2.5 RE to fine particle variance was approximately 3:7 and 2:8, respectively, suggesting that ΔPM2.5 RE and ΔPM10 RE were the primary contributors to fine particle variation. For ΔPM1.0 RE, the contribution of ΔPM10 RE was relatively low, whereas ΔPM2.5 RE accounted for a larger share, indicating that ΔPM2.5 RE served as a key explanatory variable for ultrafine particle dynamics.
In industrial settings, the relative contributions of ΔPM10 RE and ΔPM2.5 RE shifted across sites and time horizons. In Sihwa, the ratio of ΔPM10 RE to ΔPM2.5 RE contributions was approximately 6:4 for ΔPM2.5 RE and 4:5 for ΔPM1.0 RE, with increasing contributions over time from ΔPM1.0 RE, meteorological variables, and co-pollutants. In Seongnam, ΔPM2.5 RE initially dominated variance in both ΔPM2.5 RE and ΔPM1.0 RE, but its dominance diminished over time, with increasing contributions from meteorological and air pollutant variables. These results indicate strong PM–fraction interactions in industrial-complex-adjacent UFs, while the balance of drivers varies across industrial contexts.
Overall, the FEVD results indicate that the dominant drivers of PM reduction efficiency differ by particle size. For PM2.5 RE, variability is primarily influenced by interactions with co-pollutants and meteorological factors, reflecting the complex and dynamic nature of fine particle behavior. In contrast, PM10 RE is more strongly associated with its own past values and exhibits relatively more stable dynamics over time. Across both particle sizes, meteorological variables contribute consistently but to a lesser extent, suggesting that while environmental conditions play a supporting role, the core variability is driven by particle-specific dynamics and their interactions with surrounding atmospheric components.
In dense urban-core sites (Hongneung and Namsan), each PMRE variable was primarily explained by its own past values, and contributions gradually shifted toward meteorological and air pollutant variables over time. This pattern suggests that intrinsic UF mitigation processes play a significant role in shaping PMRE dynamics in urban cores, while external drivers exert comparatively smaller effects.
Finally, consistent with source-specific ratio characteristics, the PM2.5/PM10 ratio in background UFs was higher than those observed near roads, industrial complexes, and urban areas (Table 4), indicating differences in PM composition between background forests and source-influenced environments.
Table 4.
Characteristics of particulate matter ratios by pollution source.
4. Discussion
4.1. Overview: Why Source Context Matters for Urban Forest PM Mitigation
South Korea frequently experiences elevated PM concentrations during cold seasons due to a combination of local emissions and regional atmospheric transport. During such episodes, PM2.5 levels often exceed international guideline values, including those recommended by the World Health Organization, placing urban populations at increased health risk. Therefore, understanding the performance of urban forests under these high-pollution conditions is critical not only for national policy but also for informing urban air quality management in other regions experiencing similar pollution regimes.
This study used multivariate time-series modeling to examine how urban forests (UFs) mitigate particulate matter (PM) near contrasting emission environments (roadside, industrial-complex-adjacent, dense urban-core) relative to background forest conditions. By focusing on recurrent high-pollution periods (late autumn–spring) and comparing eight sites across two cold seasons, we show that PM reduction efficiency (PMRE) is strongly context dependent and that mitigation dynamics differ by particle size fraction. These results support a key implication for urban forestry practice: “one-size-fits-all” greening is unlikely to maximize air-quality co-benefits, and UF planning and management should be tailored to local emission environments and particle-size-specific dynamics. From an ecosystem-service perspective, PM mitigation should be interpreted as a dynamic regulating service that responds to repeated disturbances rather than a fixed removal rate. While previous studies have often focused on static concentration differences or site-specific assessments, this study contributes to the literature by explicitly quantifying dynamic interactions among particulate matter fractions and environmental drivers across multiple emission-source contexts using a unified time-series framework.
Taken together, these findings demonstrate the value of integrating dynamic time-series analysis with source-context-specific evaluation of urban forest PM mitigation, offering insights into underlying mechanisms and implications for urban environmental management.
4.2. Particle-Size-Dependent Dynamics and Stabilization of Mitigation Performance
Across source contexts, ΔPM10 RE was largely explained by its own past values, whereas fine-particle dynamics (ΔPM2.5 RE and ΔPM1.0 RE) showed stronger interdependencies, with ΔPM2.5 RE repeatedly emerging as a central mediator for ΔPM1.0 RE. This pattern indicates that fine and ultrafine particle mitigation should not be interpreted as independent outcomes, but rather as coupled processes in which PM2.5 plays a critical bridging role. The longer persistence of responses to fine-particle shocks further suggests that fine PM mitigation can exert sustained effects across time, highlighting the importance of prioritizing PM2.5-oriented strategies when the goal is to reduce ultrafine PM exposure. This interpretation is consistent with evidence that fine and ultrafine particles may originate from combustion byproducts and industrial emissions and can remain dynamically linked over time [26], as well as prior time-series studies reporting coupled dynamics among PM2.5 and co-pollutants and meteorology [27,28]. This particle-size-dependent behavior is consistent with previous findings that fine particles tend to exhibit stronger atmospheric persistence and more complex interactions with co-pollutants and meteorological variables than coarse particles. In particular, the central role of PM2.5 observed in this study supports the interpretation that fine particles act as key intermediates in transformation and transport processes within urban atmospheric systems [29]. This interpretation is consistent with recent observational evidence indicating that the effectiveness of urban forests in mitigating particulate matter differs by particle size, with stronger removal observed for coarse particles compared to fine particles under certain environmental conditions [22].
Notably, the impulse-response patterns commonly exhibited damped oscillations, where responses initially deviated upward or downward after a shock and gradually converged toward zero. From an urban forestry perspective, this indicates that UF mitigation effects may stabilize over time following disturbances, which is consistent with the interpretation that UFs can sustain a baseline level of PM reduction function during repeated high-pollution conditions. However, because stabilization patterns and cross-coupling differed between PM size fractions, UF strategies should be particle-size specific, rather than relying on a single generalized “PM reduction” objective.
4.3. Structural Mediation of PM Mitigation Dynamics in Urban Forests
Although the present study focused on dynamic interactions among PM fractions and environmental variables, the observed patterns may be influenced by the structural and compositional characteristics of urban forests. Particulate matter interception is not solely an atmospheric process but is likely to occur at the canopy–atmosphere interface, where vegetation structure can regulate deposition, retention, and resuspension processes. However, it should be noted that canopy structural variables were not directly measured in this study; therefore, these mechanisms are proposed as plausible interpretations rather than empirically tested factors. Future studies incorporating direct measurements of vegetation structure (e.g., canopy density, leaf area index, and species composition) would be necessary to quantitatively evaluate these mechanisms.
The differentiated response patterns identified across pollution-source contexts can be ecologically interpreted through forest structure. In roadside and industrial-complex environments—where cross-fraction coupling between PM10 and PM2.5 was pronounced—urban forests likely function as semi-permeable filtration systems. Dense canopies, multilayered vegetation (arbor–shrub–herb structures), and edge-facing leaf area can enhance aerodynamic roughness, reduce wind speed locally, and increase particle interception surfaces. These structural attributes may strengthen the dynamic linkage between coarse and fine particle removal observed in the VAR impulse responses. These interpretations are consistent with previous studies indicating that vegetation structure, canopy density, and leaf characteristics play important roles in regulating particulate matter interception, retention, and resuspension processes in urban forests [30,31].
In contrast, in urban-core environments where PM reduction efficiencies were predominantly self-driven and exhibited weaker cross-fraction interactions, structural constraints such as limited patch size, fragmented canopy continuity, and restricted airflow between built structures may reduce turbulence mixing and limit inter-fraction transformation processes. Under such conditions, PM mitigation appears to operate more as a localized retention process rather than an integrated particle-size interaction system.
The damped oscillation pattern consistently observed across sites further suggests that urban forests provide a stabilizing ecological function. Canopy structure likely buffers short-term pollution shocks by temporarily storing particles on foliar and bark surfaces before gradual resuspension or wash-off, thereby contributing to temporal stabilization of PM reduction efficiency.
Taken together, these findings indicate that PM mitigation in urban forests should be conceptualized as a structurally mediated ecosystem service. Forest configuration—including canopy density, vertical layering, spatial buffering distance from emission sources, and edge orientation—may regulate not only the magnitude of PM removal but also the dynamic coupling among particle-size fractions. Therefore, urban forest design strategies should move beyond species selection alone and incorporate structural optimization tailored to pollution-source characteristics.
4.4. How Mitigation Dynamics Differed by Source Context
4.4.1. Background Forests: Baseline Dynamics and Natural Particle Processes
In background forest settings with limited nearby emission sources, ΔPM10 RE explained a substantial share of ΔPM2.5 RE variation. This suggests that PM2.5 formation and removal under relatively clean conditions may be influenced by natural processes and particle transformation pathways. Prior studies have reported that larger particles can break down into smaller fractions through mechanical fragmentation or chemical degradation [32,33], which may be consistent with the observed dependency pattern. Importantly, the background sites provide a useful baseline for interpreting the incremental benefits of source-adjacent UFs and for distinguishing source-driven dynamics from more natural background behavior.
4.4.2. Roadside Urban Forests: Site Sensitivity and Local Configuration Effects
For roadside contexts, ΔPM10 RE and ΔPM2.5 RE were largely explained by their own past values, suggesting relatively independent mitigation behavior of each fraction within roadside UFs. However, responses to non-PMRE shocks differed markedly across roadside sites, implying strong sensitivity to local configuration (e.g., the number and arrangement of nearby roads, surrounding built form, and UF stand structure). For example, Gomae—characterized by high tree density and proximity to a primary roadside source—showed minimal responses to meteorological and co-pollutant variables, whereas Yangjae—an urban park surrounded by roads—responded more strongly to CO and temperature variability. These results indicate that roadside UF performance should be interpreted through both the emission environment and local UF configuration, reinforcing the need for site-specific design and management even within the same “roadside” category.
4.4.3. Industrial-Complex-Adjacent Urban Forests: Strongest Coupling and Fine-Particle Centrality
Industrial contexts exhibited the strongest PM–fraction interactions, but the balance of drivers varied across locations. In Sihwa, both ΔPM10 RE and ΔPM2.5 RE contributed substantially to fine-particle variation, suggesting active coupling between coarse and fine fractions. In Seongnam, ΔPM2.5 RE dominated fine-particle dynamics initially, but its explanatory power gradually dispersed as meteorological and co-pollutant influences increased over time. These differences likely reflect heterogeneity in industrial emission profiles and geographic settings. More broadly, the consistent centrality of ΔPM2.5 RE across industrial settings implies that PM2.5 reduction should be a primary management objective near industrial complexes, particularly because PM1.0 constitutes a substantial portion of PM2.5 and the ΔPM2.5 RE–ΔPM1.0 RE linkage remained strong across contexts [34,35]. Such strong interactions among particle fractions in industrial contexts are in line with previous findings that complex emission mixtures and secondary particle formation processes can enhance interdependence among pollutants. However, our results further demonstrate that these interaction patterns are not uniform but vary depending on site-specific emission characteristics and environmental conditions.
4.4.4. Dense Urban-Core Urban Forests: Intrinsic Dynamics and Exposure-Reduction Priorities
Urban-core sites (Namsan and Hongneung) were largely self-driven, with limited cross-interactions among PM fractions. This pattern may reflect the presence of multiple small, localized sources (traffic, heating, biomass combustion) and restricted dispersion due to dense built form, which can reduce cross-fraction coupling at the monitoring scale [36,37]. The observed particle-size-specific sensitivity—larger particles responding more to meteorology and finer particles showing stronger responses to ozone—supports the interpretation that mechanisms and management levers differ by particle size in dense urban areas.
4.5. Planning and Management Implications for Maximizing PM Mitigation
Together, these findings suggest that UF strategies should be tailored to both source context and particle size. These recommendations are grounded in the empirical findings of this study, particularly the FEVD results (Section 3.3), which reveal particle-size-dependent mitigation dynamics and context-specific differences in the relative contributions of co-pollutants and meteorological factors.
Roadside contexts. Given strong site sensitivity, roadside UFs should adopt adaptive structural designs that consider the number and arrangement of nearby roads, the UF’s stand composition, and its interface with pedestrian spaces. This is supported by the VAR and FEVD results, which indicate that PM2.5 RE plays a central role in mediating interactions among pollutants, particularly in industrial and source-influenced contexts, highlighting the need for strategies that explicitly address fine particle dynamics. Prior evidence highlights that green infrastructure effectiveness depends on type and placement and is most effective when paired with emission reduction and strategic placement near roads [38]. Multi-layer vegetation structures (arbor–shrub–herb) can enhance deposition and interception [39], and plant community attributes such as canopy area and stem size may support PM reduction [40]. Because PM10 and PM2.5 exhibited different response characteristics, roadside designs should explicitly plan for both barrier/interception functions for coarse particles and enhanced capture of fine particles within the UF interior. Where CO and temperature sensitivity is high (e.g., Yangjae-type settings), species selection and maintenance should also consider tolerance to pollutant stress and thermal stress to ensure sustained performance and resilience.
Industrial-complex-adjacent contexts. The strong coupling among fine particles indicates that PM2.5-oriented mitigation should be prioritized. In settings where PM10 also contributes substantially to fine particle dynamics (e.g., Sihwa), designs should aim to reduce the interaction pathways between coarse and fine fractions by optimizing species composition and stand structure for both interception and retention. In settings where meteorology and co-pollutants increasingly contribute over time (e.g., Seongnam), complementary strategies that leverage airflow and deposition processes may be beneficial, such as enhancing buffer continuity, linking nearby green spaces to improve ventilation pathways, and using surface designs that support wet deposition and wash-off processes [5,40]. Coniferous species have been suggested as effective for PM blocking and retention in some contexts [40,41], but selection should be balanced with local climate and management feasibility.
Dense urban-core contexts. Because urban-core emissions are diverse and green-space availability is limited, maximizing air-quality co-benefits requires optimizing small green spaces and street greenery as exposure-reduction infrastructure. Multi-layer structures in parks and plazas can enhance deposition and sustain purification functions [40], while targeted planting along roadside edges can provide biofiltration benefits for pedestrian corridors [39]. Where biomass burning or localized fine PM sources are relevant, vertical greening (green walls, vertical gardens) and distributed greening systems may provide supplementary mitigation opportunities for PM2.5 and associated pollutants.
Overall, these results underscore that UF planning should move beyond generic greening targets toward context-specific prescriptions that explicitly consider local emission environments and particle-size-dependent mitigation dynamics.
Our results suggest that design levers such as canopy density, vertical layering, and edge-to-interior configuration may be especially relevant in roadside and industrial contexts, where fine-particle coupling and cross-variable responses were most pronounced. Recent studies have also emphasized the broader implications of urban forest-based particulate matter mitigation in terms of long-term environmental and health benefits, reinforcing the importance of context-specific management strategies [42].
4.6. Limitations and Future Research
This study has several limitations. First, although two representative sites per source context enabled comparative analysis across contrasting emission environments, site-specific features (e.g., local built form, stand structure, and microclimate) may influence observed dynamics. Second, some regions showed narrower variation in response variables and higher residual errors (e.g., Yangjae and Sihwa), and one urban site (Hongneung) showed limited model significance, indicating that time-series models may not fully capture all patterns at every site. Third, VAR outcomes can be sensitive to lag selection and variable ordering, representing an inherent methodological limitation. Finally, incorporating multiple variables increases model complexity and parameter estimation burden, potentially increasing overfitting risk and reducing degrees of freedom [25]. Future studies should therefore expand multi-site monitoring, strengthen site characterization (e.g., canopy structure, species composition, and spatial configuration), and develop context-specific models that better represent local emission mixtures and seasonal dynamics. Extending observations to leaf-on periods and additional seasons would further improve generalizability and support year-round UF management guidance. Because observations focus on late autumn–spring, mitigation dynamics may differ in leaf-on periods when deposition surfaces and BVOC-related secondary aerosol processes can change.
5. Conclusions
In this study, we quantified particulate matter reduction efficiency (PMRE) of urban forests (UFs) across contrasting emission-source contexts in South Korea (roadside, industrial-complex-adjacent, dense urban-core, and background forests) using field observations during recurrent high-pollution periods (late autumn–spring) over two consecutive years. By applying vector autoregression, we compared region-specific characteristics and dynamic interactions among PM size fractions, meteorological variables, and co-pollutants to derive implications for urban forest planning and management.
Three key insights emerged. First, interactions among PM size fractions were particle-size dependent and varied by site context. While ΔPM10 RE and ΔPM2.5 RE were largely explained by their own past values, ΔPM1.0 RE was strongly influenced by ΔPM2.5 RE, indicating a persistent linkage between fine and ultrafine fractions. This finding supports the need to differentiate UF strategies by particle size, particularly by prioritizing PM2.5-oriented management when ultrafine particle reduction is a key objective. Second, PM mitigation characteristics differed markedly across emission-source contexts. In background forests, ΔPM2.5 RE was predominantly explained by ΔPM10 RE, suggesting a stronger influence of primary particle processes under relatively clean conditions. In roadside environments, ΔPM10 RE and ΔPM2.5 RE behaved more independently, yet local sensitivity to external factors (e.g., CO and temperature) varied by site configuration. In industrial-complex-adjacent contexts, interactions between ΔPM10 RE and ΔPM2.5 RE were prominent or ΔPM2.5 RE dominated, depending on emission profiles; in coastal industrial areas, the influence of meteorological variables and co-pollutants increased over time, highlighting geographic modulation of mitigation dynamics. In dense urban-core environments, PMRE was primarily self-driven, with notable responses to O3 and other pollutants, indicating that mitigation pathways and levers may differ by particle size and co-pollutant regime. Third, the predominance of self-driven dynamics in PMRE, together with damped oscillation patterns, suggests that UF mitigation performance can stabilize and persist over time, reinforcing the value of UFs as long-term air-pollution mitigation infrastructure.
Overall, these findings corroborate that UFs can contribute substantially to PM mitigation, but that benefits are strongly context dependent. Accordingly, UF design and management should be tailored to local emission environments and particle-size-specific dynamics to maximize air-quality co-benefits. Future research should strengthen site characterization (e.g., stand structure, species composition, and spatial configuration), further examine interactions between meteorology and co-pollutants across seasons, and develop empirical, context-specific models that translate monitoring evidence into practical planning guidance for optimizing UF PM mitigation.
Author Contributions
Conceptualization, methodology, formal analysis, investigation, resources, data curation, writing—original draft, and visualization: B.L.; conceptualization, methodology, validation, writing—original draft, writing—review and editing, supervision, project administration, Resources, and funding acquisition: H.-D.S.; conceptualization and methodology: S.P.; Conceptualization, Supervision, Writing—original draft: C.-R.P. All authors have read and agreed to the published version of the manuscript.
Funding
This research was funded by the National Institute of Forest Science of Korea, grant number NIFOS FE0100-2024-03-2026.
Data Availability Statement
Dataset available upon request from the authors.
Conflicts of Interest
The authors declare no conflicts of interest.
Abbreviations
The following abbreviations are used in this manuscript:
| PM | Particulate Matter |
| UFs | Urban Forests |
| PMRE | Particulate Matter Reduction Efficiency |
| VAR | Vector Autoregression |
| IRF | Impulse Response Function |
| FEVD | Forecast Error Variance Decomposition |
| AICAN | Asian Initiative for Clean Air Networks |
| KMA | Korea Meteorological Administration |
| GI | Green Infrastructure |
| AIC | Akaike information criterion |
| BIC | Bayesian information criterion |
| CO | Carbon monoxide |
| NO2 | Nitrogen dioxide |
| SO2 | Sulfur dioxide |
| O3 | Ozone |
Appendix A
Table A1.
Granger casual test results on each site. Null hypothesis: A particular variable does not have Granger causality with the rest of the set of variables except for it.
Table A2.
The selection of VAR model Time lag length for each region.
Table A3.
The square root value of forecast error.
Table A4.
Summary statistics of data.
Table A5.
Regression coefficient estimation results.
Table A6.
Response variables other than by pollution source.
References
- Han, D.; Chen, R.; Kan, H.; Xu, Y. The bio-distribution, clearance pathways, and toxicity mechanisms of ambient ultrafine particles. Eco-Environ. Health 2023, 2, 95–106. [Google Scholar] [CrossRef] [Scilit] [PubMed]
- Chauhan, B.V.; Corada, K.; Young, C.; Smallbone, K.L.; Wyche, K.P. Review on sampling methods and health impacts of fine (PM2.5, ≤2.5 µm) and ultrafine (UFP, PM0.1, ≤0.1 µm) particles. Atmosphere 2024, 15, 572. [Google Scholar] [CrossRef] [Scilit]
- Environmental Protection Agency (EPA). Health and Environmental Effects of Particulate Matter (PM). United States Environmental Protection Agency. 2024. Available online: https://www.epa.gov/pm-pollution/health-and-environmental-effects-particulate-matter-pm (accessed on 18 February 2026).
- Health Effects Institute. State of Global Air 2024: Special Report; Health Effects Institute: Boston, MA, USA, 2024. [Google Scholar]
- Diener, A.; Mudu, P. How can vegetation protect us from air pollution? A critical review on green spaces’ mitigation abilities for airborne particles from a public health perspective—With implications for urban planning. Sci. Total Environ. 2021, 796, 148605. [Google Scholar] [CrossRef] [Scilit]
- Yin, S.; Chen, D.; Zhang, X.; Yan, J. Review on the multi-scale interactions of urban forests and atmospheric particles: Affecting factors are scale-dependent among tree, stand and region. Urban For. Urban Green. 2022, 78, 127789. [Google Scholar] [CrossRef] [Scilit]
- Park, S.; Kwak, M.J.; Lee, J.; Lim, Y.J.; Kim, H.; Jeong, S.G.; Son, J.-A.; Chang, H.; Je, S.M.; Oh, C.-Y.; et al. Urban greening: A sustainable method for particulate matter (PM) reduction. J. Korean Soc. For. Sci. 2023, 112, 1–10. [Google Scholar]
- Steinparzer, M.; Schaubmayr, J.; Godbold, D.L.; Rewald, B. Particulate matter accumulation by tree foliage is driven by leaf habit types, urbanization-and pollution levels. Environ. Pollut. 2023, 335, 122289. [Google Scholar] [CrossRef] [Scilit]
- Chen, D.; Yan, J.; Sun, N.; Sun, W.; Zhang, W.; Long, Y.; Yin, S. Selective capture of PM2.5 by urban trees: The role of leaf wax composition and physiological traits in air quality enhancement. J. Hazard. Mater. 2024, 478, 135428. [Google Scholar] [CrossRef] [Scilit] [PubMed]
- Moura, B.B.; Zammarchi, F.; Manzini, J.; Hoshika, Y.; Brilli, L.; Vagnoli, C. Assessment of seasonal variations in particulate matter accumulation and elemental composition in urban tree species. Environ. Res. 2024, 252, 118782. [Google Scholar] [CrossRef] [Scilit] [PubMed]
- Tong, Z.; Whitlow, T.H.; MacRae, P.F.; Landers, A.J.; Harada, Y. Quantifying the effect of vegetation on near-road air quality using brief campaigns. Environ. Pollut. 2015, 201, 141–149. [Google Scholar] [CrossRef] [Scilit]
- Chen, L.; Liu, C.; Zou, R.; Yang, M.; Zhang, Z. Experimental examination of effectiveness of vegetation as bio-filter of particulate matters in the urban environment. Environ. Pollut. 2016, 208, 198–208. [Google Scholar] [CrossRef] [Scilit]
- Yli-Pelkonen, V.; Setälä, H.; Viippola, V. Urban forests near roads do not reduce gaseous air pollutant concentrations but have an impact on particles levels. Landsc. Urban Plan. 2017, 158, 39–47. [Google Scholar] [CrossRef] [Scilit]
- Yang, W.; Lin, W.; Li, Y.; Shi, Y.; Xiong, Y. Estimating the seasonal and spatial variation of urban vegetation’s PM2.5 removal capacity. Environ. Pollut. 2025, 369, 125800. [Google Scholar] [CrossRef] [Scilit]
- Gao, T.; Liu, F.; Wang, Y.; Mu, S.; Qiu, L. Reduction of atmospheric suspended particulate matter concentration and influencing factors of green space in urban forest park. Forests 2020, 11, 950. [Google Scholar] [CrossRef] [Scilit]
- Gong, C.; Xian, C.; Wu, T.; Liu, J.; Ouyang, Z. Role of urban vegetation in air phytoremediation: Differences between scientific research and environmental management perspectives. npj Urban Sustain. 2023, 3, 24. [Google Scholar] [CrossRef] [Scilit]
- Cavanagh, J.A.; Zawar-Reza, P.; Wilson, J.G. Spatial attenuation of ambient particulate matter air pollution within an urbanised native forest patch. Urban For. Urban Green. 2009, 8, 21–30. [Google Scholar] [CrossRef] [Scilit]
- Viippola, V.; Whitlow, T.H.; Zhao, W.; Yli-Pelkonen, V.; Mikola, J.; Pouyat, R.; Setälä, H. The effects of trees on air pollutant levels in peri-urban near-road environments. Urban For. Urban Green. 2018, 30, 62–71. [Google Scholar] [CrossRef] [Scilit]
- European Environment Agency (EEA). EMEP/EEA Air Pollutant Emission Inventory Guidebook 2023: 1.A.2 Manufacturing Industries and Construction (Combustion). European Environment Agency. 2023. Available online: https://www.eea.europa.eu/publications/emep-eea-guidebook-2023 (accessed on 18 February 2026).
- Pant, P.; Harrison, R.M. Estimation of the contribution of road traffic emissions to particulate matter concentrations from field measurements: A review. Atmos. Environ. 2013, 77, 78–97. [Google Scholar] [CrossRef] [Scilit]
- Lee, H.J.; Liu, Y.; Chatfield, R.B. Neighborhood-scale ambient NO2 concentrations using TROPOMI NO2 data: Applications for spatially comprehensive exposure assessment. Sci. Total Environ. 2023, 857, 159342. [Google Scholar] [CrossRef] [Scilit]
- Seo, J.; Oh, H.-R.; Park, D.-S.R.; Kim, J.Y.; Chang, D.Y.; Park, C.-R.; Sou, H.-D.; Jeong, S. The role of urban forests in mitigation of particulate air pollution: Evidence from ground observations in South Korea. Urban Clim. 2025, 59, 102264. [Google Scholar] [CrossRef] [Scilit]
- Seoul Metropolitan Facilities Management Corporation. Seoul Traffic Survey Report. Seoul Metropolitan Government. 2022. Available online: https://news.seoul.go.kr/traffic/archives/373 (accessed on 18 February 2026).
- Lee, J.H.; Kang, S.L. Effect of Taebaek Mountains on the spatial distribution of PM10 and PM2.5 in Gangwon Province. Korean Soc. Hazard Mitig. 2023, 23, 21–31. [Google Scholar] [CrossRef] [Scilit]
- Lütkepohl, H. New Introduction to Multiple Time Series Analysis; Springer Science & Business Media: Berlin/Heidelberg, Germany, 2005. [Google Scholar] [CrossRef]
- Hien, P.D.; Bac, V.T.; Thinh, N.T.H.; Anh, H.L.; Thang, D.D.; Nghia, N.T. A comparison study of chemical compositions and sources of PM1.0 and PM2.5 in Hanoi. Aerosol Air Qual. Res. 2021, 21, 210056. [Google Scholar] [CrossRef] [Scilit]
- Mingzhi, L. Analysis of influence factors of PM2.5 in Chengdu based on VAR model. IOP Conf. Ser. Earth Environ. Sci. 2017, 63, 012039. [Google Scholar] [CrossRef] [Scilit]
- Deng, C.; Qin, C.; Li, Z.; Li, K. Spatiotemporal variations of PM2.5 pollution and its dynamic relationships with meteorological conditions in Beijing-Tianjin-Hebei region. Chemosphere 2022, 301, 134640. [Google Scholar] [CrossRef] [Scilit]
- Zhang, L.; Jacob, D.J.; Knipping, E.M.; Kumar, N.; Munger, J.W.; Carouge, C.C.; van Donkelaar, A.; Wang, Y.X.; Chen, D. Nitrogen deposition to the United States: Distribution, sources, and processes. Atmos. Chem. Phys. 2012, 12, 4539–4554. [Google Scholar] [CrossRef] [Scilit]
- Beckett, K.P.; Freer-Smith, P.H.; Taylor, G. Particulate pollution capture by urban trees: Effect of species and wind speed. Glob. Change Biol. 2000, 6, 995–1003. [Google Scholar] [CrossRef] [Scilit]
- Nowak, D.J.; Crane, D.E.; Stevens, J.C. Air pollution removal by urban trees and shrubs in the United States. Urban For. Urban Green. 2006, 4, 115–123. [Google Scholar] [CrossRef] [Scilit]
- Holmes, N.S. A review of particle formation events and growth in the atmosphere in the various environments and discussion of mechanistic implications. Atmos. Environ. 2007, 41, 2183–2201. [Google Scholar] [CrossRef] [Scilit]
- Fuzzi, S.; Baltensperger, U.; Carslaw, K.; Decesari, S.; Denier van der Gon, H.; Facchini, M.C.; Fowler, D.; Koren, I.; Langford, B.; Lohmann, U.; et al. Particulate matter, air quality and climate: Lessons learned and future needs. Atmos. Chem. Phys. 2015, 15, 8217–8299. [Google Scholar] [CrossRef] [Scilit]
- Gong, W.; Zhang, T.; Zhu, Z.; Ma, Y.; Ma, X.; Wang, W. Characteristics of PM1.0, PM2.5, and PM10, and their relation to black carbon in Wuhan, Central China. Atmosphere 2015, 6, 1377–1387. [Google Scholar] [CrossRef] [Scilit]
- Kwon, S.; Won, S.R.; Lim, H.B.; Hong, S.C.; Lee, Y.M.; Jung, J.Y.; Choi, S.-D.; Lee, S.-J.; Oh, S.; Kim, J.Y.; et al. Relationship between PM1.0 and PM2.5 in urban and background areas of Republic of Korea. Atmos. Pollut. Res. 2023, 14, 101858. [Google Scholar] [CrossRef] [Scilit]
- Zhang, Y.; Kwok, K.C.; Liu, X.P.; Niu, J.L. Characteristics of air pollutant dispersion around a high-rise building. Environ. Pollut. 2015, 204, 280–288. [Google Scholar] [CrossRef] [Scilit]
- Jia, B.; Liu, S.; Ng, M. Air quality and key variables in high-density housing. Sustainability 2021, 13, 4281. [Google Scholar] [CrossRef] [Scilit]
- Tiwari, A.; Kumar, P. Integrated dispersion-deposition modelling for air pollutant reduction via green infrastructure at an urban scale. Sci. Total Environ. 2020, 723, 138078. [Google Scholar] [CrossRef] [Scilit]
- Wang, A.; Guo, Y.; Fang, Y.; Lu, K. Research on the horizontal reduction effect of urban roadside green belt on atmospheric particulate matter in a semi-arid area. Urban For. Urban Green. 2022, 68, 127449. [Google Scholar] [CrossRef] [Scilit]
- Zhu, C.; Przybysz, A.; Chen, Y.; Guo, H.; Chen, Y.; Zeng, Y. Effect of spatial heterogeneity of plant communities on air PM10 and PM2.5 in an urban forest park in Wuhan, China. Urban For. Urban Green. 2019, 46, 126487. [Google Scholar] [CrossRef] [Scilit]
- Jin, E.J.; Yoon, J.H.; Bae, E.J.; Jeong, B.R.; Yong, S.H.; Choi, M.S. Particulate matter removal ability of ten evergreen trees planted in Korea urban greening. Forests. 2021, 12, 438. [Google Scholar] [CrossRef] [Scilit]
- Jeong, J.; Kim, C.; Choi, S.; Park, C.-R. Long-term greenness effects of urban forests on particulate matter reduction and respiratory health outcomes. Int. J. Environ. Res. Public Health 2025, 22, 167. [Google Scholar] [CrossRef] [Scilit] [PubMed]

Disclaimer/Publisher’s Note: The statements, opinions and data contained in all publications are solely those of the individual author(s) and contributor(s) and not of MDPI and/or the editor(s). MDPI and/or the editor(s) disclaim responsibility for any injury to people or property resulting from any ideas, methods, instructions or products referred to in the content. |
© 2026 by the authors. Licensee MDPI, Basel, Switzerland. This article is an open access article distributed under the terms and conditions of the Creative Commons Attribution (CC BY) license.