


Abstract
Under climate change, extreme wind events are predicted to become both more common and more severe, increasing the vulnerability of plantation forests. In February 2023, ex-tropical Cyclone Gabrielle caused widespread wind damage to radiata pine (Pinus radiata D. Don) forests across the North Island of New Zealand, providing a rare opportunity to evaluate mechanistic wind-risk modelling under extreme storm conditions. This study assessed the performance of the ForestGALES model in predicting wind damage within the Rangipo genetic accelerator trial and examined the influence of stocking and cultivation on wind vulnerability. Using detailed pre-cyclone field measurements and high-resolution unmanned aerial vehicle light detection and ranging (ULS) data, ForestGALES was parameterised for the Rangipo trial and applied at both individual-tree and stand scales. Model predictions were compared with observed post-cyclone damage using balanced area under the receiver operating characteristic curve (AUC), accounting for strong class imbalance. Wind damage was observed in 16.7% of trees, of which 10.2% showed stem breakage and 6.5% overturning. Across both spatial scales, overturning was more accurately predicted than stem breakage. At the individual-tree scale, ForestGALES showed moderate predictive skill, with balanced AUC values of 0.650 ± 0.014 for overturning, 0.595 ± 0.011 for breakage, and 0.621 ± 0.008 for total damage. Model performance was stronger at the stand scale, where discrimination was highest for overturning (AUC 0.811 ± 0.122), followed by breakage (0.693 ± 0.116) and total damage (0.623 ± 0.083). Silvicultural treatments significantly influenced predicted critical wind speeds (CWS). High-stocking treatments exhibited consistently higher CWS values and therefore greater wind firmness than low-stocking treatments, while cultivation effects were smaller but significant. Simulated reductions in stocking further demonstrated increased wind vulnerability as stocking declined, highlighting thinning as a primary determinant of wind risk. These findings demonstrate that ForestGALES can reliably discriminate wind damage at operational stand scales under extreme cyclone conditions and highlight the importance of stand structure in improving plantation resilience under increasingly storm-prone climates.
Keywords:
Cyclone Gabrielle; ex-tropical cyclone; ForestGALES; LiDAR; radiata pine; stocking; storms; wind risk 1. Introduction
Severe wind events are expected to occur more often and with greater intensity during the twenty-first century due to increases in average air temperatures and changes in atmospheric circulation associated with climate change [1]. These changes pose substantial risks to forest ecosystems globally, particularly to plantation forests that are often structurally uniform and spatially extensive. New Zealand has experienced several severe storm events in recent decades, culminating in the widespread impacts of ex-tropical Cyclone Gabrielle in February 2023. Gabrielle caused extensive flooding, infrastructure damage, forest windthrow and more than 800,000 landslides across the North Island [2,3,4]. The scale of damage highlighted the vulnerability of both natural and managed landscapes to extreme wind and rainfall events and reinforced projections that severe storm hazards will become increasingly consequential under continued warming.
The New Zealand forestry sector shows a high level of vulnerability to wind disturbance, with radiata pine (Pinus radiata D.Don) accounting for around 90% of the plantation estate [5]. Wind damage in radiata pine stands typically occurs through two primary failure mechanisms: stem breakage, resulting from exceedance of stem strength under gust loading, and overturning (uprooting), which occurs when wind-induced turning moments exceed root anchorage resistance [6,7]. Resistance to breakage is influenced by stem diameter, wood density and mechanical properties such as modulus of rupture (MOR) and modulus of elasticity (MOE), whereas resistance to overturning is strongly related to tree size, leverage and soil–root interactions [8,9]. Stocking (also known as stand density), cultivation practices, tree slenderness and edge exposure further modify wind loading and mechanical stability. Despite extensive research on wind damage processes, predicting the balance between stem breakage and overturning under extreme storm conditions remains challenging, particularly in young to mid-rotation radiata pine stands growing on freely draining soils.
Mechanistic wind-risk models provide a portable framework for integrating stand structural attributes with wind climate to estimate vulnerability to wind damage across different locations, tree species, soil types, and management strategies. Hybrid-mechanistic models vary in complexity [10] but generally comprise two key components: (1) calculation of the critical wind speed (CWS) required to cause mechanical failure, and (2) estimation of the probability of exceeding the CWS given the local wind climate at the site of interest [9]. CWS represents the wind speed at which there is a nominal 50% probability of failure, either through stem breakage or overturning [8,11]. ForestGALES is among the most commonly used hybrid-mechanistic wind-risk models and has been widely applied across Europe, North America [12,13] and Asia [14,15] to evaluate wind vulnerability under varying stand structures and management regimes [16,17]. The model incorporates species-specific parameterisation including mechanical properties of green wood, estimates critical turning moments of trees, and calculates uprooting resistance based on stem weight, soil conditions, and root depth.
Although ForestGALES has been rigorously tested in temperate European forests, comparatively few studies have evaluated its performance in New Zealand plantation systems [18], and even fewer have assessed its predictive ability under extreme cyclone events. Furthermore, limited empirical evidence exists on how silvicultural treatments such as initial stocking and site cultivation influence both observed wind damage and modelled wind vulnerability in radiata pine [19]. Validation of mechanistic wind-risk models against observed failure following severe storms is therefore essential to determine their applicability under the increasingly extreme wind climates projected for New Zealand [20].
Ex-tropical Cyclone Gabrielle provides a rare opportunity to evaluate wind-risk model predictions against observed damage under real-world extreme conditions. The Rangipo accelerator trial in the central North Island experienced substantial wind damage during Cyclone Gabrielle and offers a uniquely well-instrumented experimental setting [21]. The observed cyclone impacts in this trial, including treatment × genotype effects and mode-specific failure patterns, have recently been described by Watt et al. (2026) [22]. In that study, damage incidence and severity were quantified across silvicultural treatments and different genotypes, demonstrating clear differences in vulnerability among management regimes and genotypes.
The objectives of this study were therefore to (i) evaluate the ability of the ForestGALES model to distinguish between damaged and undamaged trees following Cyclone Gabrielle at both individual-tree and stand scales; (ii) compare model performance for the two principal failure modes, stem breakage and overturning; and (iii) examine the influence of stocking and cultivation on modelled CWS and wind vulnerability. Here, we use the same trial and pre-cyclone structural dataset as Watt et al., 2026 [22] to test whether a hybrid-mechanistic wind-risk model reproduces those empirically observed damage patterns and to determine the spatial scale at which predictions are most reliable. By integrating mechanistic modelling with observed storm damage, this study provides a robust assessment of ForestGALES performance under extreme cyclone conditions and offers insights into management strategies to enhance wind resilience in New Zealand radiata pine plantations [20]. To our knowledge, this is the first formal validation of ForestGALES for radiata pine under an extreme cyclone event, providing a novel test of performance under wind conditions unlike those examined in previous applications.
2. Materials and Methods
This study modelled wind vulnerability in the Rangipo accelerator trial using the ForestGALES (v3.0/fgr) wind-risk model. ForestGALES was applied at two spatial scales: the individual-tree scale using the turning moment coefficient (TMC) mode, and the stand scale using the roughness-mode configuration [23]. The individual-tree simulations quantified wind vulnerability for each measured tree, while stand-scale simulations summarised average vulnerability across measurement plots and silvicultural treatments. In both modes, ForestGALES calculated CWS for stem failure and uprooting, representing the wind speed at which failure is predicted. Wind risk was then expressed as the probability that local mean or storm-extreme wind speeds exceeded the relevant CWS threshold. Together, these outputs provided estimates of wind damage vulnerability and risk across spatial scales and management treatments.
2.1. Study Area and Experimental Design
The Rangipo accelerator trial is situated in the central North Island of New Zealand (39.09° S, 175.83° E) at 544 m above sea level. The site experiences a cool temperate climate with a mean annual air temperature of 10.7 °C and approximately 2038 mm of mean annual rainfall. The soil is classified as Typic Orthic Pumice according to the New Zealand Soil Classification framework [24], corresponding to a Humic Ustivitrand under USDA Soil Taxonomy [25]. These soils originate from volcanic airfall deposits derived from material associated with the Taupō volcanic centre (1860 ± 100 BP) [26]. The profile consists of freely draining sandy loam overlying a very gravelly pumice subsoil, with no apparent restriction to rooting depth to at least 1 m. These characteristics are important in the context of wind stability because soil structure and drainage influence root development and anchorage strength.
The trial was established in 2016 on moderately improved pasture as part of a national series of accelerator trials designed to examine the interaction between silvicultural management and genetic variation on forest productivity [21]. The experimental design comprises a factorial combination of two initial stand densities (833 and 1282 stems ha−1) and two site preparation treatments applied prior to afforestation. Cultivation involved the use of a disc implement to disrupt the grass thatch and create raised soil ridges, representing standard operational practice for the site, while the alternative treatment involved no cultivation. Crossing stocking and cultivation treatments produced four silvicultural regimes.
Trees were planted in 81-tree plots arranged in a 9 × 9 layout. The inner 7 × 7 trees formed the measurement population, while outer rows acted as buffers to reduce potential edge effects. Each plot contained a single genotype. Three replicate blocks were established within each treatment, resulting in a total of 144 plots (12 genotypes × 4 treatments × 3 blocks) covering approximately 13.4 ha. Although blocks were spatially clustered, strict contiguity was not always possible due to operational constraints. During Cyclone Gabrielle (12–13 February 2023), the trees were aged seven years. No pruning or thinning had been carried out, and survival remained high, such that stand densities remained close to the original planting levels.
2.2. Field Measurements and Damage Assessment
Field measurements closest to Cyclone Gabrielle were undertaken between 9 and 22 August 2022 and provided the pre-cyclone structural data used to parameterise ForestGALES. Measurements included diameter at breast height (DBH; 1.4 m above ground) for all trees and height measurements for a representative subset of trees within each plot. These measurements represent stand and tree conditions immediately prior to the storm event. Cyclone Gabrielle impacted the site on 12–13 February 2023. Post-cyclone field assessments were conducted from 23 September to 1 October 2024 in all 144 plots.
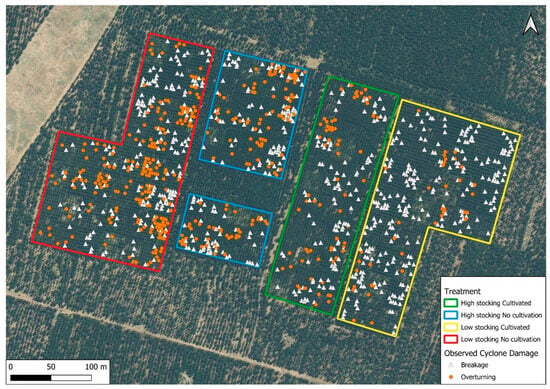
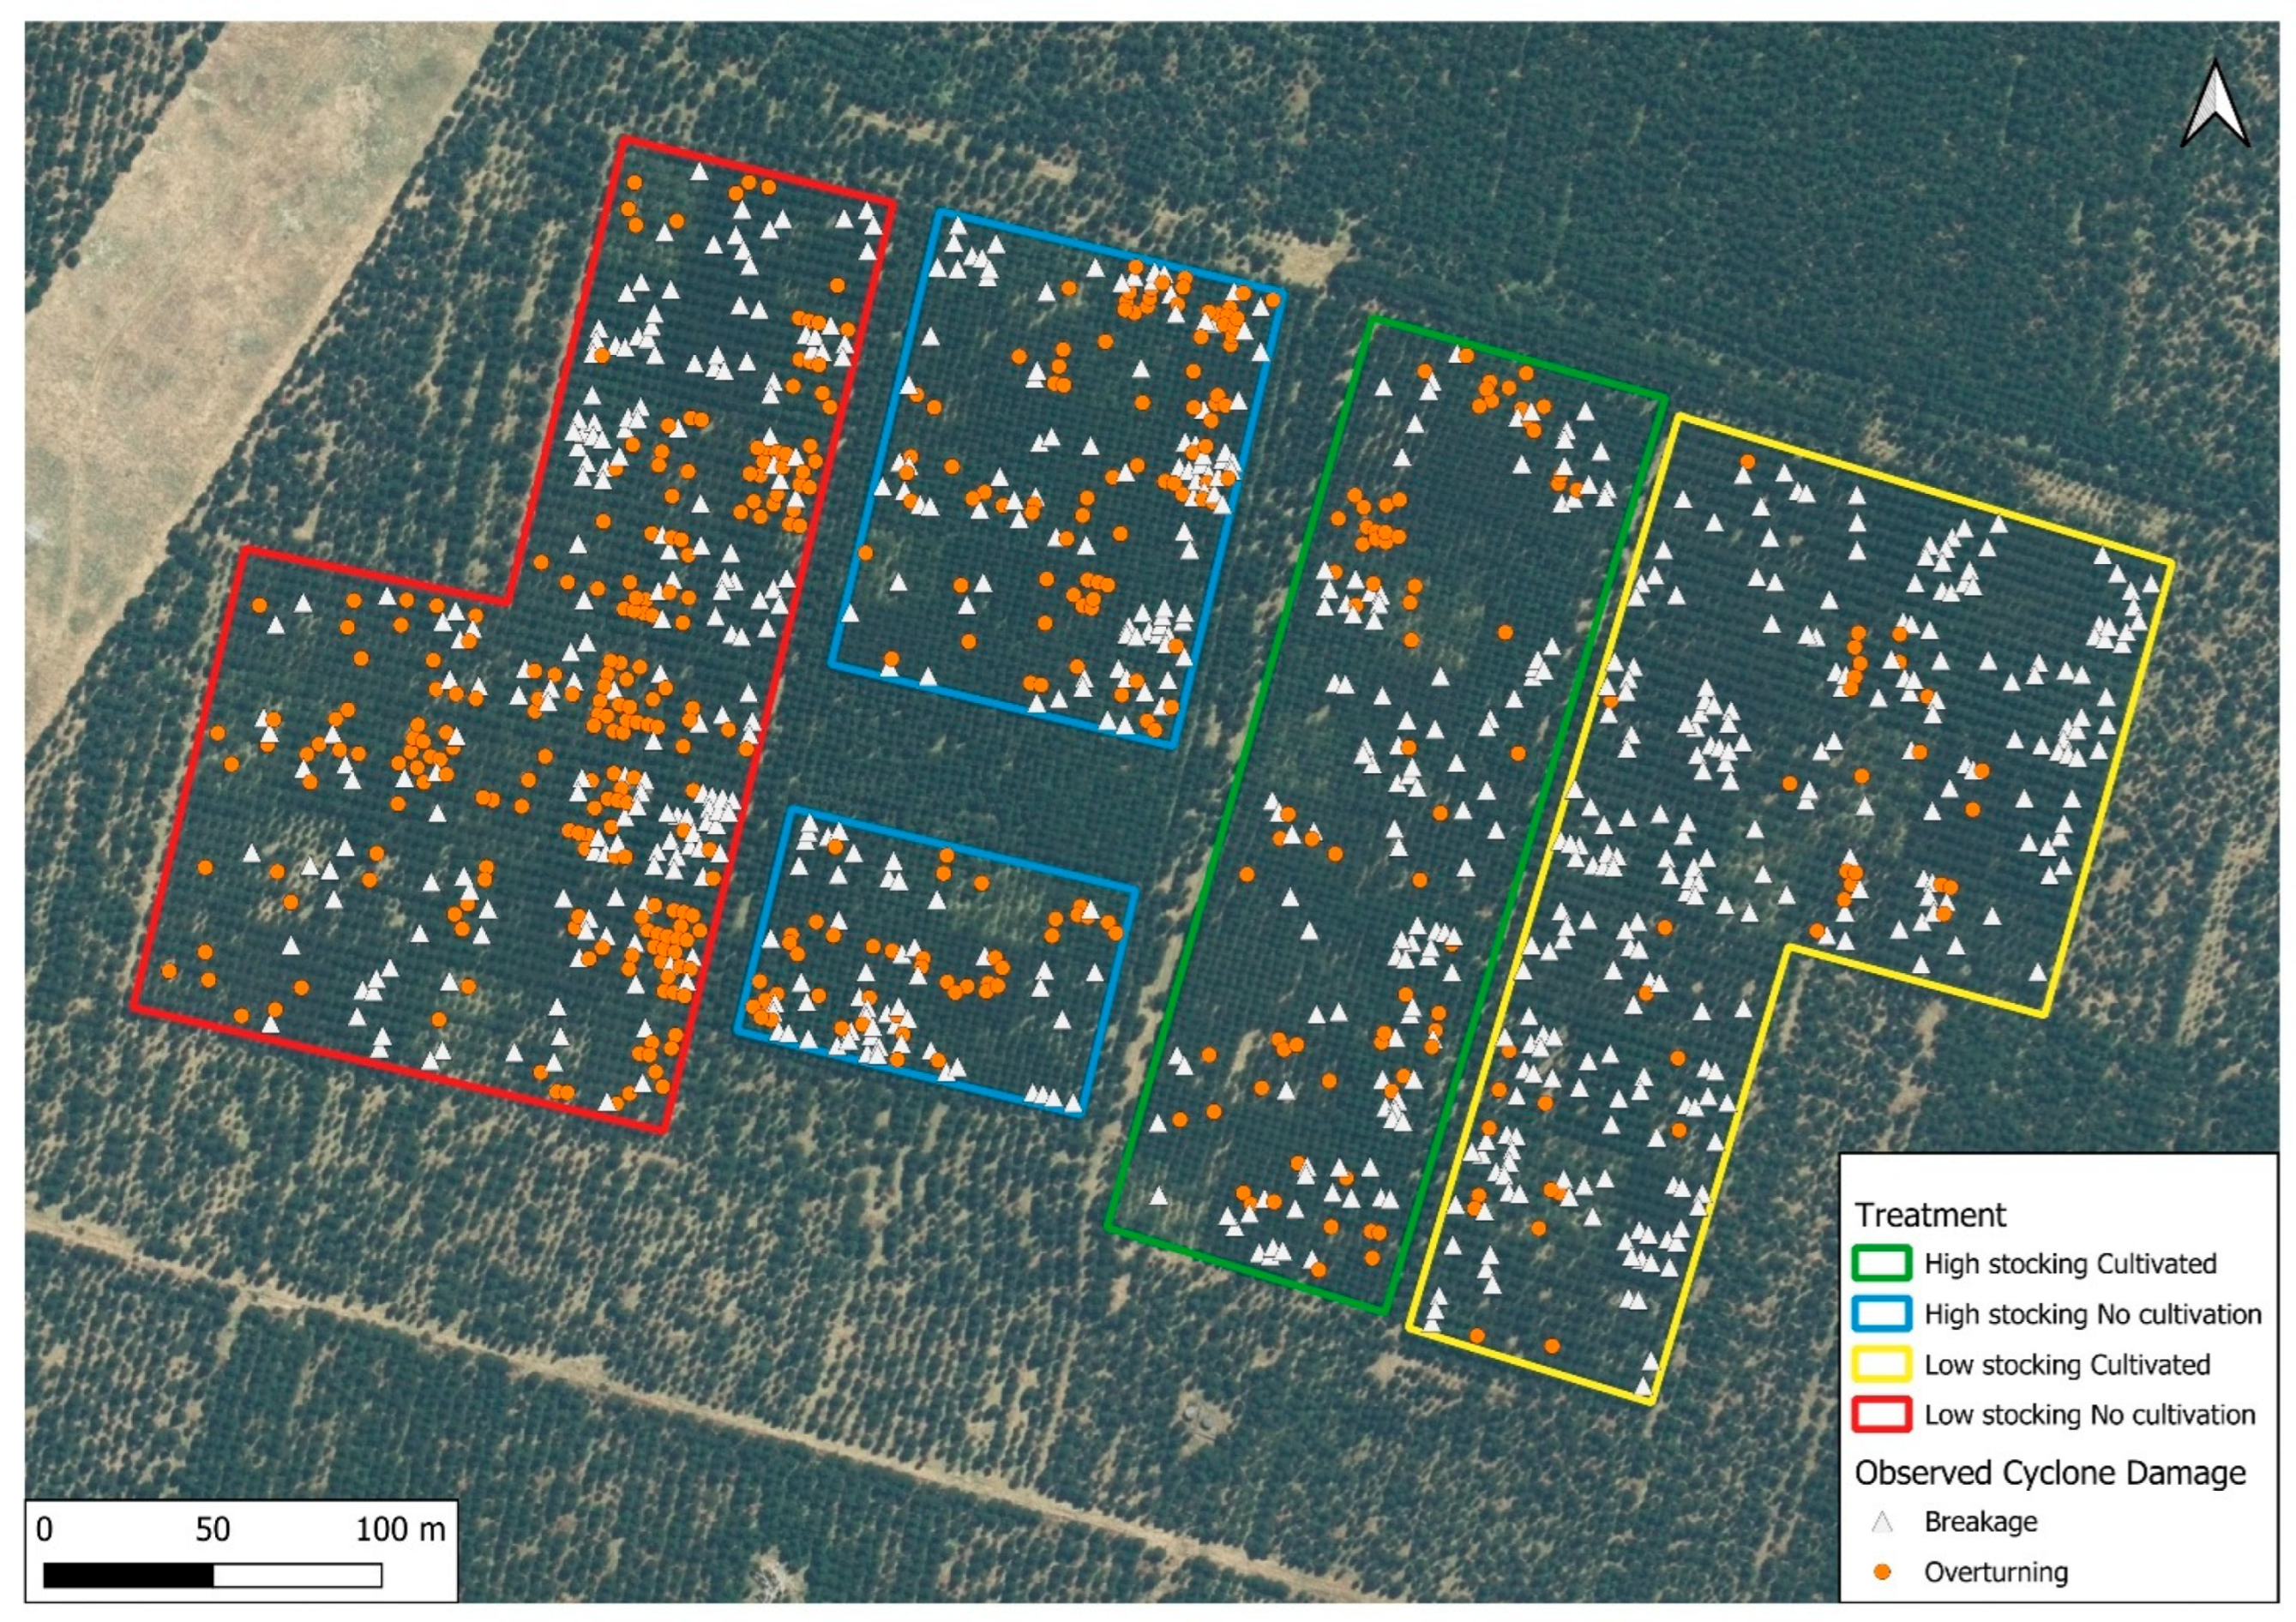
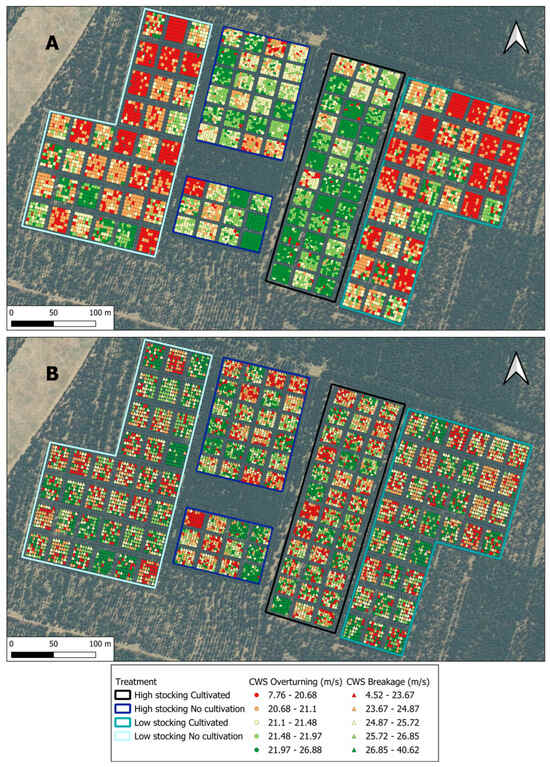
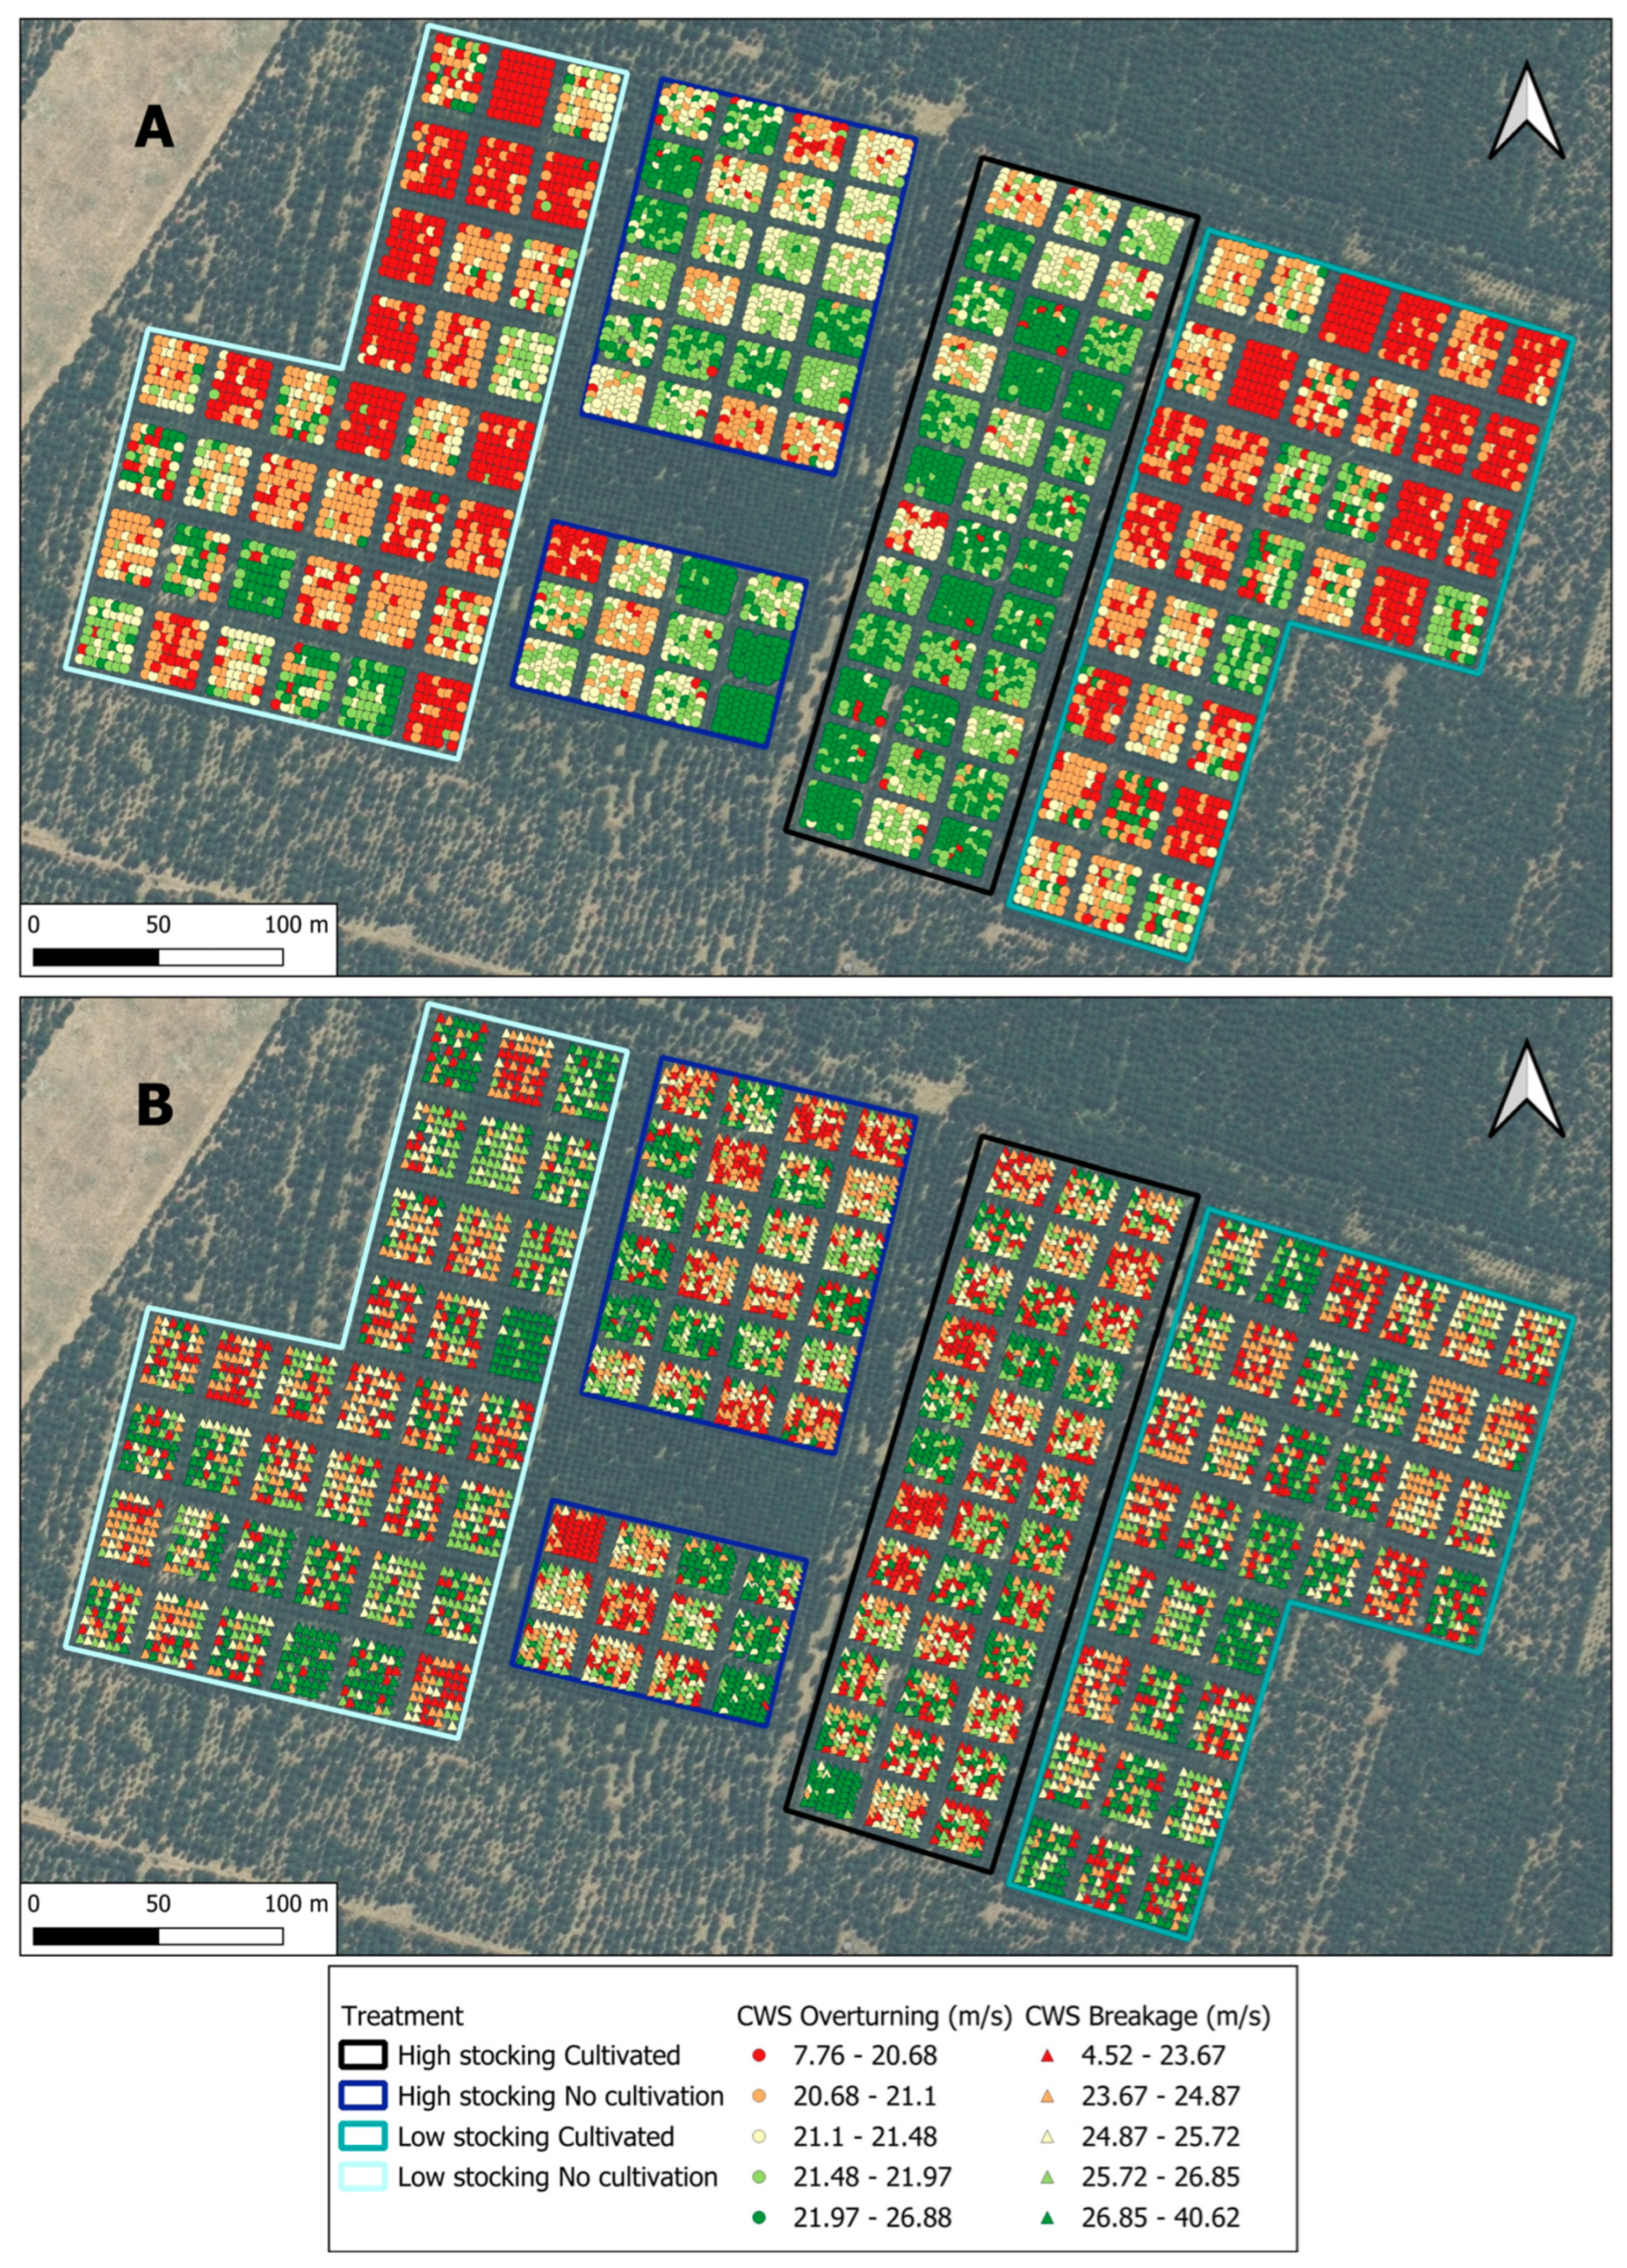
Post-event measurements included tree survival, DBH, height, and detailed classification of wind damage. Damage was recorded using standard tree description codes and categorised into two primary failure modes: stem breakage (top-out) and overturning (toppled or uprooted). Trees that had experienced stem breakage prior to the cyclone or could not be assessed due to debris obstruction were excluded from analysis. Following data filtering, 6962 trees were retained. ForestGALES individual-tree simulations required complete pre-cyclone structural inputs; complete data were available for 6918 trees, and all analyses involving CWS were conducted on this subset. Although damage was assessed approximately 19 months after the cyclone, the principal damage categories (stem breakage and overturning) remained evident and could be clearly identified in the field, with no major storm events or site disturbance occurring in the interim period. Of the 6962 assessed trees, 16.7% exhibited wind damage, with 10.2% attributed to stem breakage and 6.5% to overturning [22]. These observed damage classes formed the response variables used in subsequent model validation. The spatial distribution of damaged and undamaged trees across the four treatment areas is shown in Figure 1.
Figure 1.
Trial design illustrating the four silvicultural treatment units together with the spatial pattern of cyclone damage (breakage and overturning) [22].
Observed damage varied among silvicultural treatments (Table 1). Total damage, the sum of both overturning and breakage, was lowest in the high-stocking cultivated treatment and highest in the low-stocking non-cultivated treatment. Breakage was most prevalent under low stocking with cultivation, whereas overturning was greatest in the low-stocking non-cultivated treatment. Overall, low-stocking regimes exhibited greater damage than high-stocking regimes.
Table 1.
Percentage (%) of trees for each damage category (breakage, overturning, or total damage) across the different silvicultural treatments [22].
2.3. Remote Sensing Data Acquisition and Parameter Derivation
As described in detail in [22], high-resolution unmanned aerial vehicle (UAV) imagery and unmanned laser scanning data (ULS) were collected prior to Cyclone Gabrielle on 17 October 2022. The survey was flown at approximately 45 m above ground level and a flight speed of 5 m s−1, producing RGB imagery and a light detection and ranging (LiDAR) point density of ~1025 points m−2. Orthomosaics were generated at 1.34 cm resolution, and datasets were co-registered using ground control points. LiDAR point clouds were pre-processed (including noise removal, ground classification, and height normalisation), and a canopy height model (CHM) was produced at a 10 cm resolution.
Individual trees were detected from the CHM using a local maxima approach implemented in the lidR package [27] in R (ver. 4.4.3) [28], with results visually checked and corrected where necessary. Crown delineation was performed using a marker-controlled watershed method, and the resulting polygons were used to segment the LiDAR point cloud into individual trees. Tree height, crown width, and crown volume (estimated using a three-dimensional convex hull) were derived for each tree. These metrics were linked to field-measured DBH and tree identifiers to generate the pre-cyclone structural dataset used as input to ForestGALES.
Airborne LiDAR data from the Waikato Regional Council 2021 survey (Land Information New Zealand; nominal mean point density 10 points m−2) were used to develop a digital terrain model (DTM) for an approximately 63,000 ha area surrounding the trial. This dataset was used to represent landscape-scale topography in the wind hazard modelling (Section 2.4).
2.4. Wind Hazard Characterisation
2.4.1. Wind Hazard Modelling
Wind conditions at the Rangipo trial were modelled using WAsP, the Wind Atlas Analysis and Application Programme (WAsP, 12.10.0018) [29], and WAsP Engineering (WEng, 4.00.0226) [30], developed by the Danish Technical University (DTU). Terrain- and land-use-adjusted 20-year mean wind climatology [31] was derived using WAsP, while extreme wind conditions associated with Cyclone Gabrielle were simulated using WEng [31].
Wind data were sourced from the Turangi meteorological station (−38.97352° S, 175.7908° E), located approximately 13 km north of the trial site. Approximately 20 years of 10 min mean wind speed records were used, with wind speeds described using a Weibull distribution (scale A, shape k). Extreme wind conditions during Cyclone Gabrielle were simulated in WEng using 10 min gust wind speeds.
Terrain inputs were derived from the digital terrain model described in Section 2.3 and resampled to 10 m resolution. Surface roughness was obtained from the New Zealand Land Cover Database (LCDB [32]) by assigning roughness-length values based on equivalent CORINE land-cover classes [33,34]. These inputs enabled wind conditions measured at the Turangi station to be transferred to the Rangipo site.
The WEng-derived cyclone wind field was used as the wind speed input in ForestGALES simulations (Section 2.5). Critical wind speeds (CWSs) were calculated for individual trees and stands independently of wind climate, based on structural and mechanical properties using the TMC and roughness methods [23], respectively. The probability of failure under cyclone conditions was estimated using a logistic damage function applied to CWS and WEng-derived wind speeds, as in Gardiner et al., 2024 [17].
2.4.2. Cyclone Wind Conditions
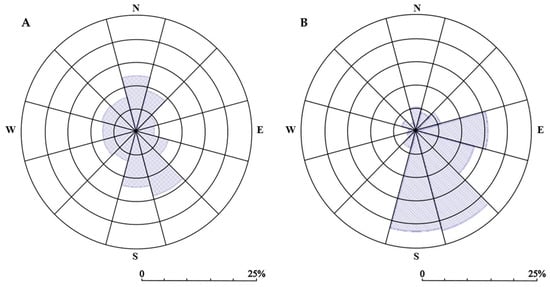
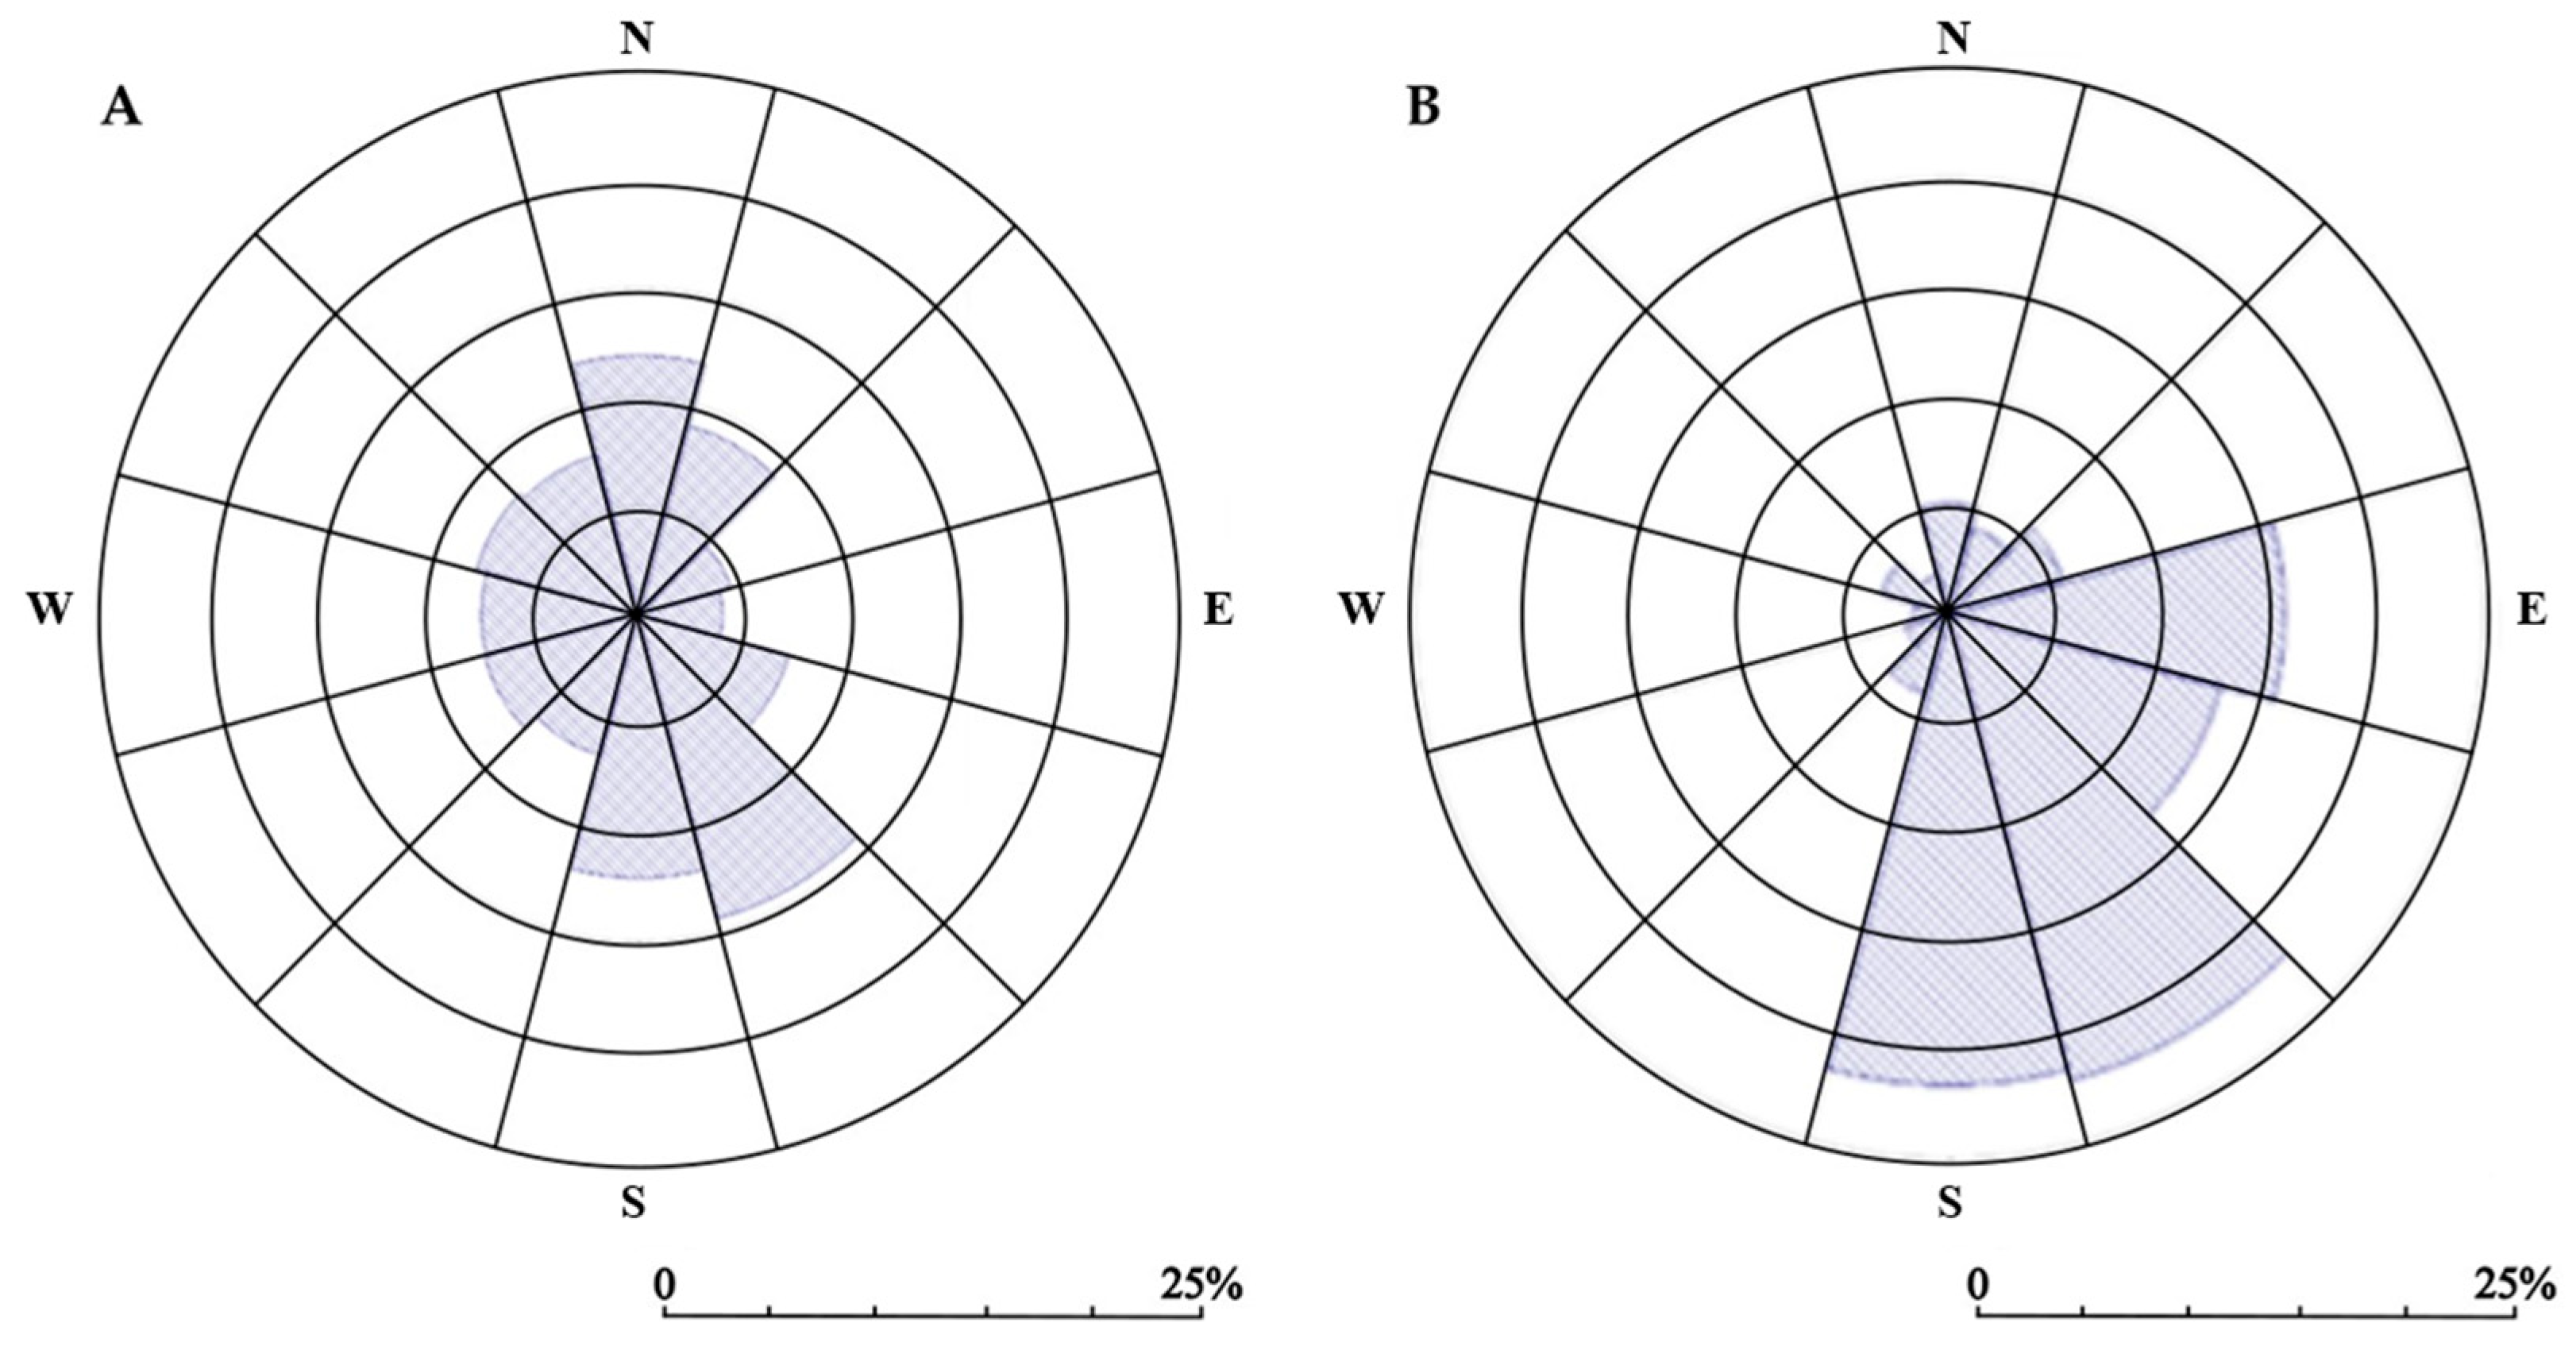
Long-term wind characteristics at the Rangipo site were examined using the 20-year meteorological record from the Turangi station (Section 2.4.1). Wind direction frequencies were summarised using wind roses, and wind speed distributions were represented using fitted Weibull probability functions. The long-term record indicates that winds most frequently originate from the S and SSE sectors, with additional contributions from the N direction, resulting in a predominantly north–south-oriented wind regime (Figure 2A and Figure A1A). Wind conditions during Cyclone Gabrielle were characterised using 10 min gust wind speeds from the Turangi station and spatial simulations produced using WEng (Section 2.4.1). The 48 h cyclone period was characterised by an event-specific wind rose and Weibull distribution (Figure A1B), allowing comparisons with the long-term climatology.
Figure 2.
Wind roses illustrating wind direction and speed distributions at the study site for (A) the 20-year mean wind climate and (B) Cyclone Gabrielle over a 48 h period [22].
The long-term mean wind climatology modelled using WAsP indicated mean wind speeds across the surrounding 2 km × 2 km domain ranging from 0.3 to 3.6 m s−1 (Figure A2). In contrast, WEng simulations of Cyclone Gabrielle produced spatially distributed mean wind speeds ranging from 4.1 to 18.6 m s−1 across the same domain (Figure A3). Spatial variation in wind exposure was evident across the landscape, with higher simulated wind speeds occurring toward the eastern portion of the trial area and lower values in more sheltered locations.
2.5. ForestGALES Modelling
Wind vulnerability was modelled using the Fgr R package of ForestGALES in individual-tree and stand-level configurations [23]. All simulations were parameterised using pre-cyclone structural measurements collected in August 2022, representing tree and stand conditions immediately prior to Cyclone Gabrielle. In individual-tree mode, ForestGALES was run for each tree with complete structural inputs (n = 6918). Required inputs included individual tree height (m), DBH (cm), mean spacing (m), crown width (m), crown volume (m3), stand mean DBH, stand top height, stand mean crown width, soil group, distance to stand edge (m), spatial coordinates of individual trees, soil group, rooting depth, and wood-property parameters including stem density, modulus of elasticity (MOE), and modulus of rupture (MOR) described below. Tree height and crown metrics were derived from ULS data (Section 2.3), while DBH was obtained from field measurements. DBH values were measured at 1.4 m above ground level following standard New Zealand forestry practice (Section 2.2), whereas ForestGALES was parameterised using DBH measured at 1.3 m. No adjustment was applied, as the 0.1 m difference is negligible relative to total tree height and stem taper at this age, and simulations therefore reflect the standard ForestGALES model being tested.
Distance to stand edge was calculated from digitised stand boundaries using GIS. Soil was specified as freely draining mineral (ForestGALES soil group 1), consistent with site characteristics, and deep rooting (ForestGALES rooting class 2). Rooting depth was not directly measured; therefore, the deep-rooting class was selected to represent an unconstrained, best-case anchorage scenario within ForestGALES. Structural wood properties for radiata pine were specified using published values for New Zealand-grown material: stem density 510 kg m−3 [35], modulus of elasticity 4.3 GPa, and modulus of rupture 11.8 MPa [36,37]. The species parameter was set to radiata pine, using the default parameterisation provided within ForestGALES, to include species-specific parameters of crown streamlining, canopy density, and anchorage.
In stand-level roughness mode, ForestGALES was parameterised using mean structural variables summarised at the plot level (n = 144 plots). Inputs included mean height, mean DBH, spacing, top height, mean crown width, and mean crown volume, derived from aggregated individual-tree measurements and LiDAR-based crown metrics (Section 2.3). Soil, rooting, and wood-property parameters, including soil group, rooting depth, stem density, modulus of elasticity (MOE), and modulus of rupture (MOR), were specified as above.
For each simulation, ForestGALES calculated CWS for stem breakage and overturning. To estimate failure probability under Cyclone Gabrielle conditions, the WEng-derived spatial wind field (Section 2.4) was combined with modelled CWS using a logistic damage probability function [14]. For each failure mode, probability of damage was expressed as a logistic function of the difference between simulated wind speed and CWS, with probabilities constrained between 0 and 1. The structural and mechanical inputs used in individual-tree and stand-level simulations are summarised in Table 2.
Table 2.
Input variables used to parameterise ForestGALES in individual-tree and stand-level simulations. Variables were derived from pre-cyclone field measurements, ULS, GIS analyses, and published radiata pine wood property values. ✗ indicates inclusion in the corresponding modelling configuration.
To further examine the sensitivity of wind vulnerability to stocking, the stand-level configuration of ForestGALES was re-run across a gradient of ten alternative stocking levels ranging from 1100 to 200 stems ha−1 in decrements of 100 stems ha−1. For these simulations, tree structural attributes (height, DBH, crown width, and crown volume) were held constant at their pre-cyclone measured values, and only mean spacing was adjusted to reflect altered stocking. This approach isolates the effect of stocking on predicted wind risk independently of tree size and structural development.
2.6. Model Validation
Model performance was evaluated separately at the individual-tree and stand scales. Because wind damage was relatively infrequent, resulting in strong class imbalance (particularly at the tree scale), model discrimination was assessed using a balanced resampling approach to the area under the receiver operating characteristic curve (AUC) [17].
At the individual-tree scale, observed damage for each of the three categories (overturning (TP), breakage (TO), total damage) was classified as a binary outcome for each tree. ForestGALES provided predicted probabilities of failure for each tree based on the relationship between WEng-modelled wind speed and CWS. For each failure mode, undamaged trees were randomly subsampled to match the number of damaged trees, and AUC was calculated on this balanced subset. A total of 1000 iterations were performed, and the mean and standard deviation of AUC were reported. This approach ensures that model discrimination reflects its ability to distinguish damaged from undamaged trees without being inflated by the large number of true negatives. Model discrimination at the tree scale was assessed using balanced AUC, which provides a threshold-free evaluation of the model’s ability to separate damaged and undamaged trees.
At the stand scale, trees were aggregated to measurement plots, and the percentage of trees exhibiting overturning, breakage, and total damage were calculated for each plot. To define meaningful stand-level damage, observed percentage thresholds were optimised separately for each endpoint. Candidate thresholds were tested iteratively, ranging from 5% to 30% for overturning and breakage (in 1% increments), and from 10% to 50% (in 2% increments) for total damage. For each threshold, plots were classified as damaged or undamaged and compared with ForestGALES-predicted probabilities derived from the logistic function applied to CWS and simulated wind speed. Model discrimination was quantified using the balanced AUC, calculated across 1000 resampling replicates in which undamaged plots were randomly subsampled to match the number of damaged plots. The threshold yielding the highest mean balanced AUC was selected for each failure mode and used for subsequent reporting of classification statistics. The optimised thresholds derived from this procedure are given in Table 3. All analyses were conducted in R [28]. ROC curves and AUC statistics were calculated using the pROC package [38].
Table 3.
Validation performance of ForestGALES predictions at individual-tree and stand scales. Model discrimination was quantified using balanced area under the receiver operating characteristic curve (AUC), reported as the mean ± standard deviation (SD) from 1000 balanced resampling iterations. At the stand scale, observed damage was defined using plot-level damage thresholds (percentage of trees damaged per plot), enabling estimation of cut points and accuracy. At the individual-tree scale, damage was treated as a binary outcome and model performance was evaluated using AUC only.
2.7. Statistical Analyses
Treatment effects on predicted CWS were analysed separately at the individual-tree and stand scales. At the individual-tree scale, CWS values for overturning and stem breakage were analysed using two-way analysis of variance (ANOVA) with stocking (high vs. low) and cultivation (cultivated vs. non-cultivated) as fixed effects. At the stand scale, plot-level mean CWS values were analysed using the same two-way ANOVA structure (n = 144 plots). Relationships between stand-level CWS and structural attributes (mean DBH, mean height, mean crown width and mean crown volume) were assessed using simple linear regression models fitted separately for each failure mode. All analyses were conducted in R [28].
3. Results
3.1. Validation of ForestGALES Predictions
ForestGALES predictions were evaluated against observed wind damage following Cyclone Gabrielle at both the individual-tree and stand scales. Model performance was assessed using ROC analysis and balanced AUC values, allowing comparison of discrimination ability across failure modes and spatial scales while accounting for strong class imbalance through resampling. AUC values range from 0 to 1, where 0.5 indicates no discrimination (equivalent to random performance), and 1 indicates perfect discrimination.
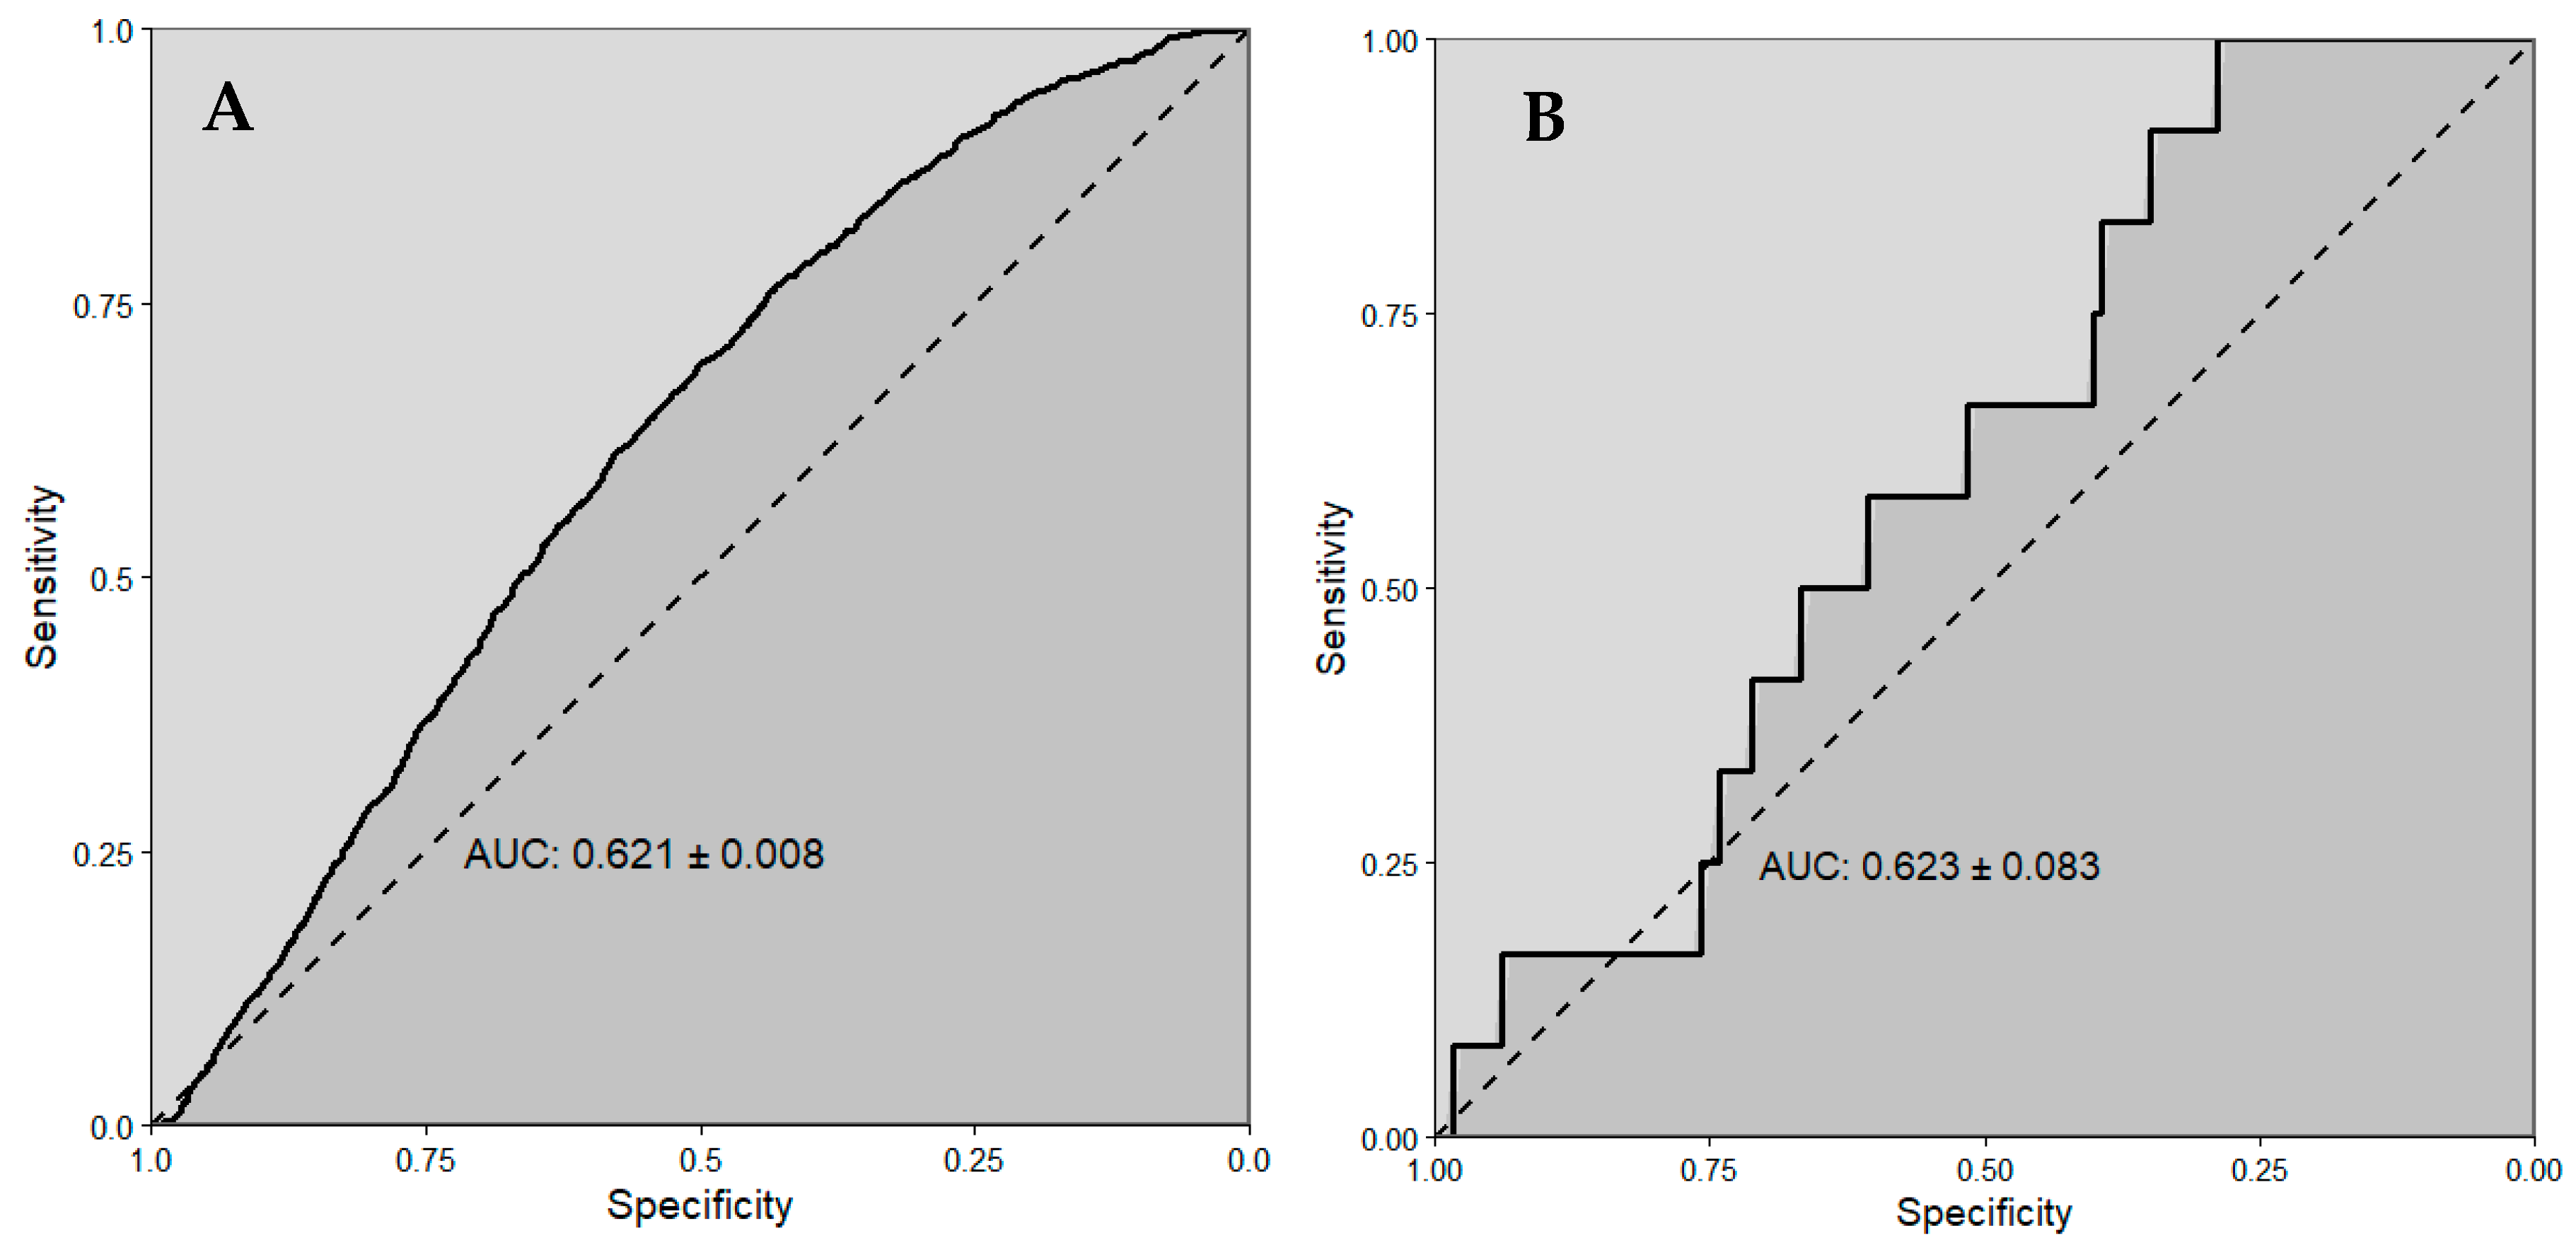
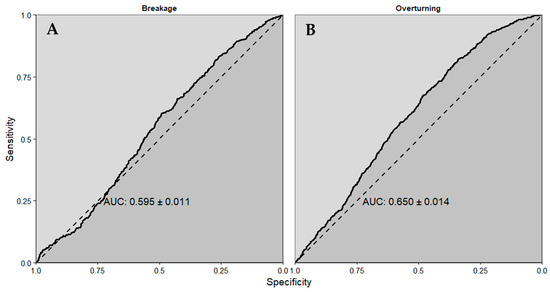
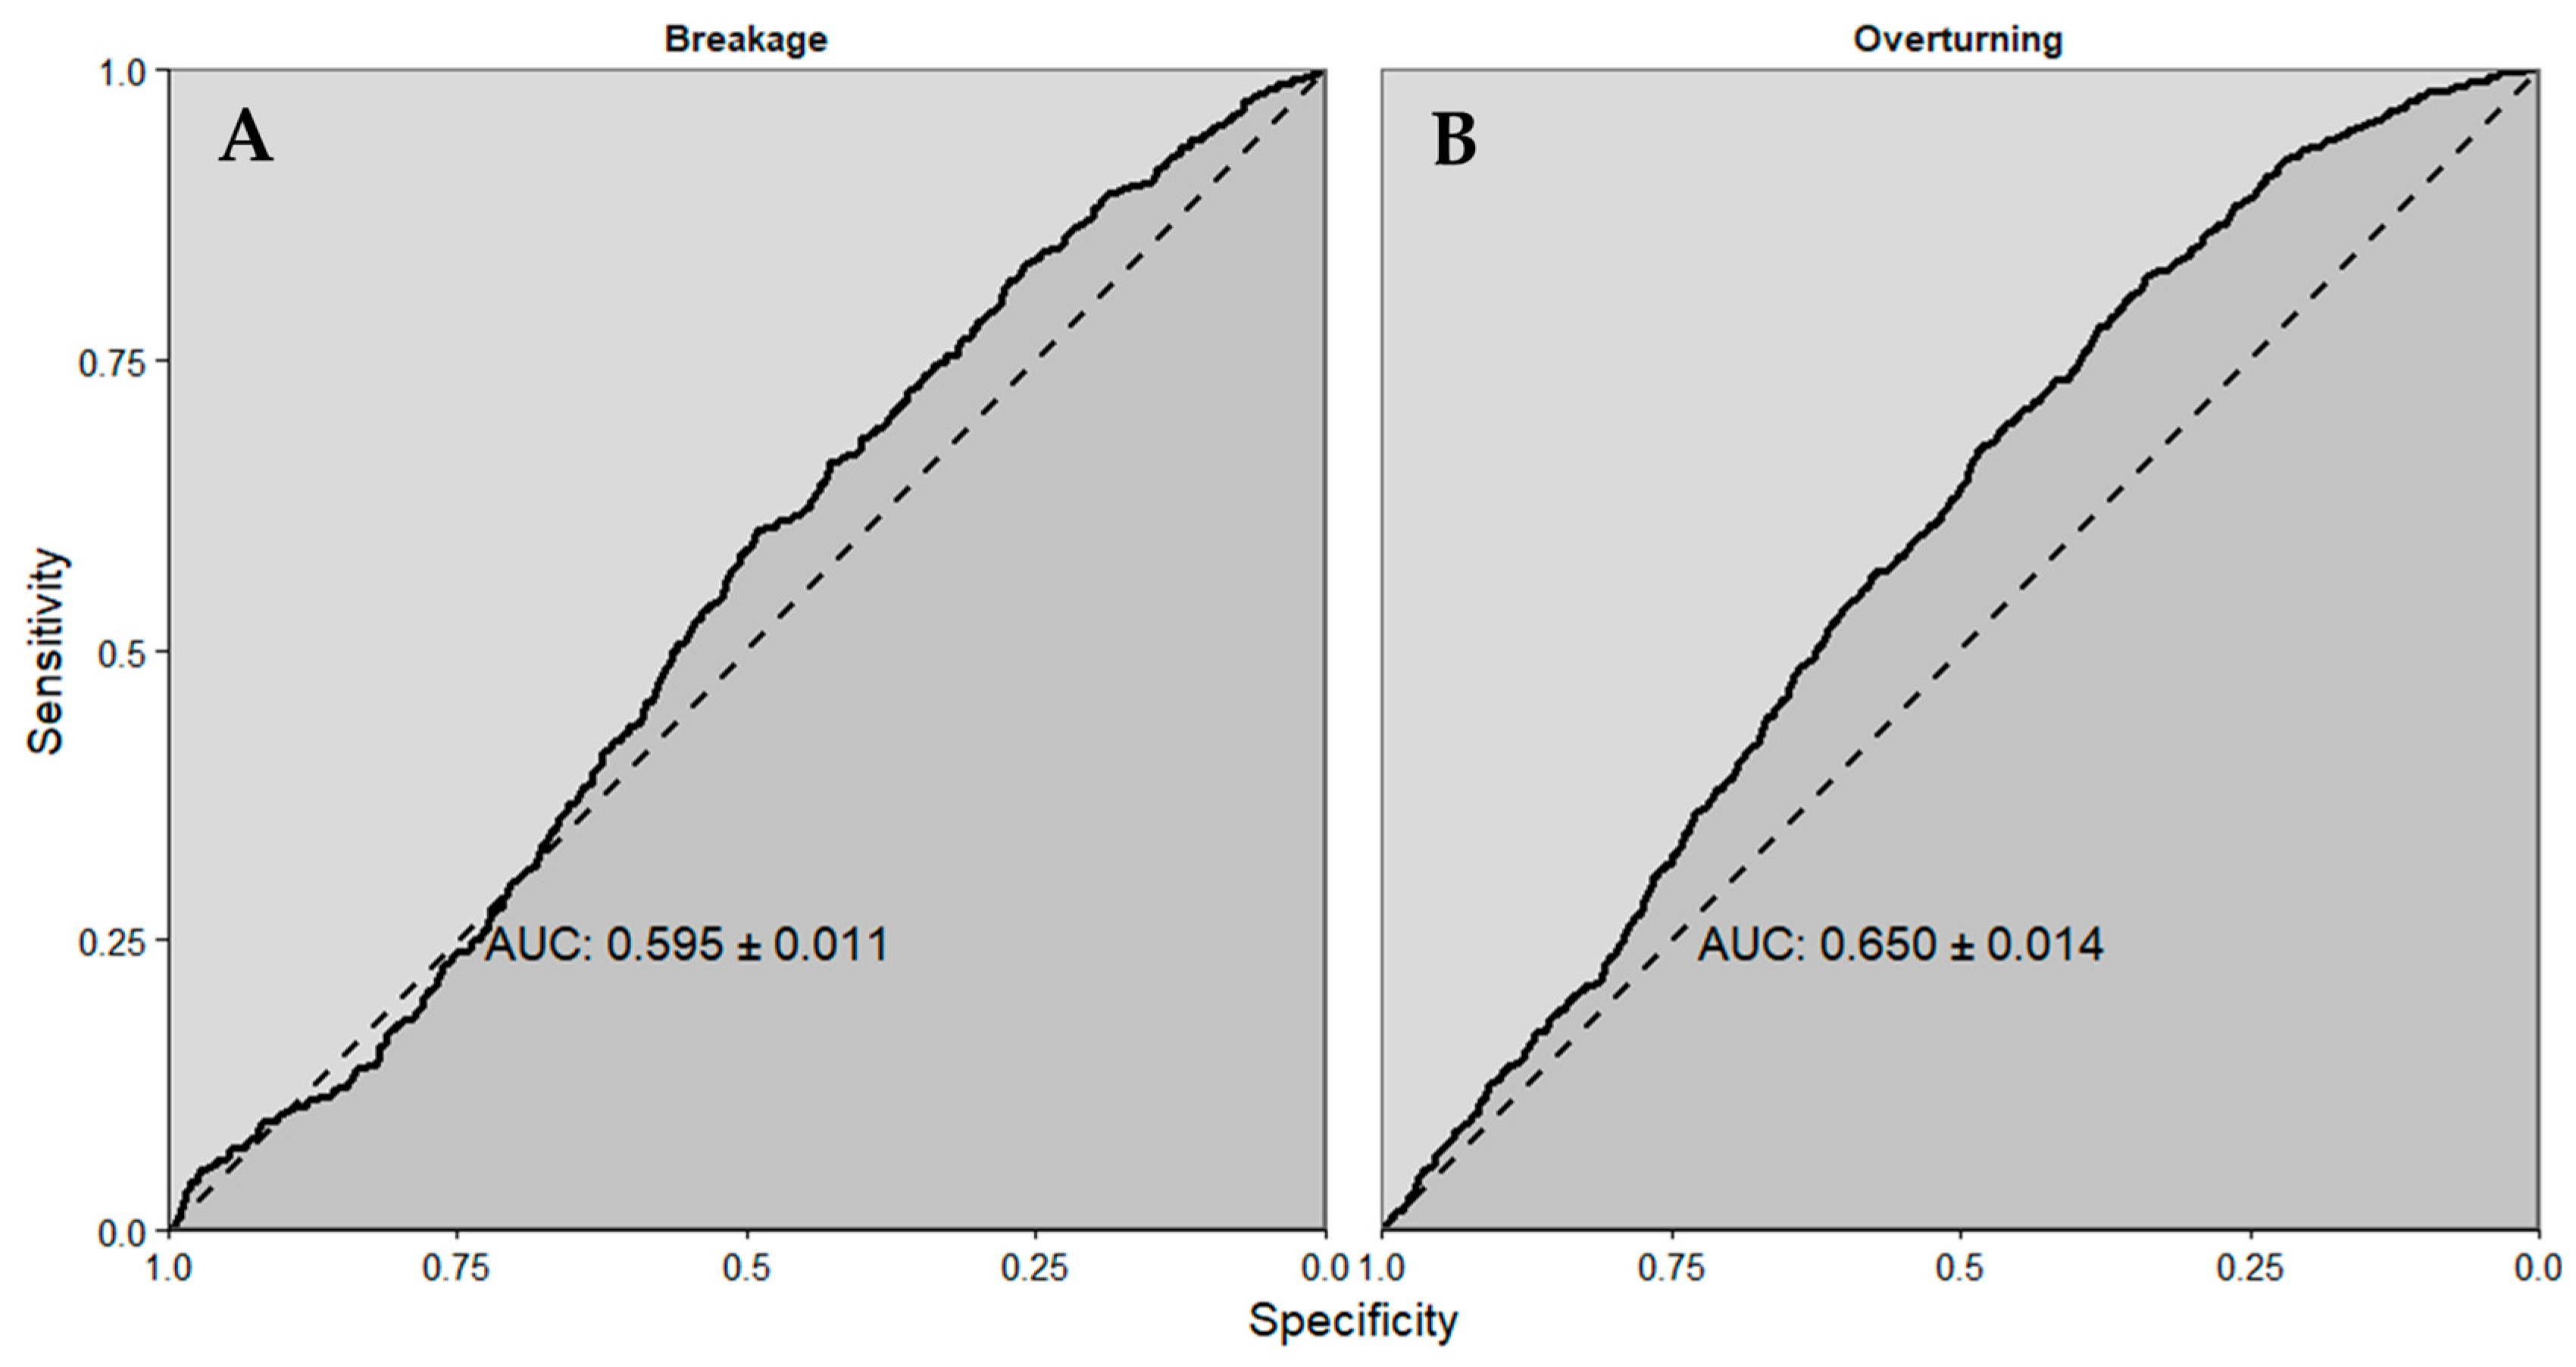
At the individual-tree scale, ForestGALES predictions showed meaningful and consistent discrimination between damaged and undamaged trees (Figure 3; Table 3). Balanced AUC for overturning was 0.650 ± 0.014, exceeding that for stem breakage (0.595 ± 0.011) (Figure 3), while discrimination for total damage was intermediate (0.621 ± 0.008) (Figure A4A). According to classification guidelines [39], these values indicate clear discrimination above random performance. Although discrimination at the individual-tree scale was lower than at the stand scale, overturning was consistently better predicted than breakage or total damage (Table 3).
Figure 3.
Receiver operating characteristic (ROC) curves for individual-tree-level validation of ForestGALES predictions for (A) stem breakage and (B) overturning following Cyclone Gabrielle. Balanced AUC values (mean ± SD from 1000 balanced resampling iterations) quantify model discrimination under strong class imbalance; the dashed line represents random performance.
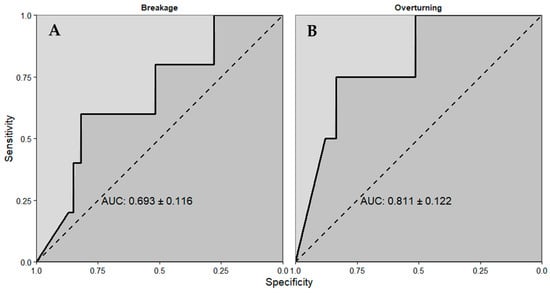
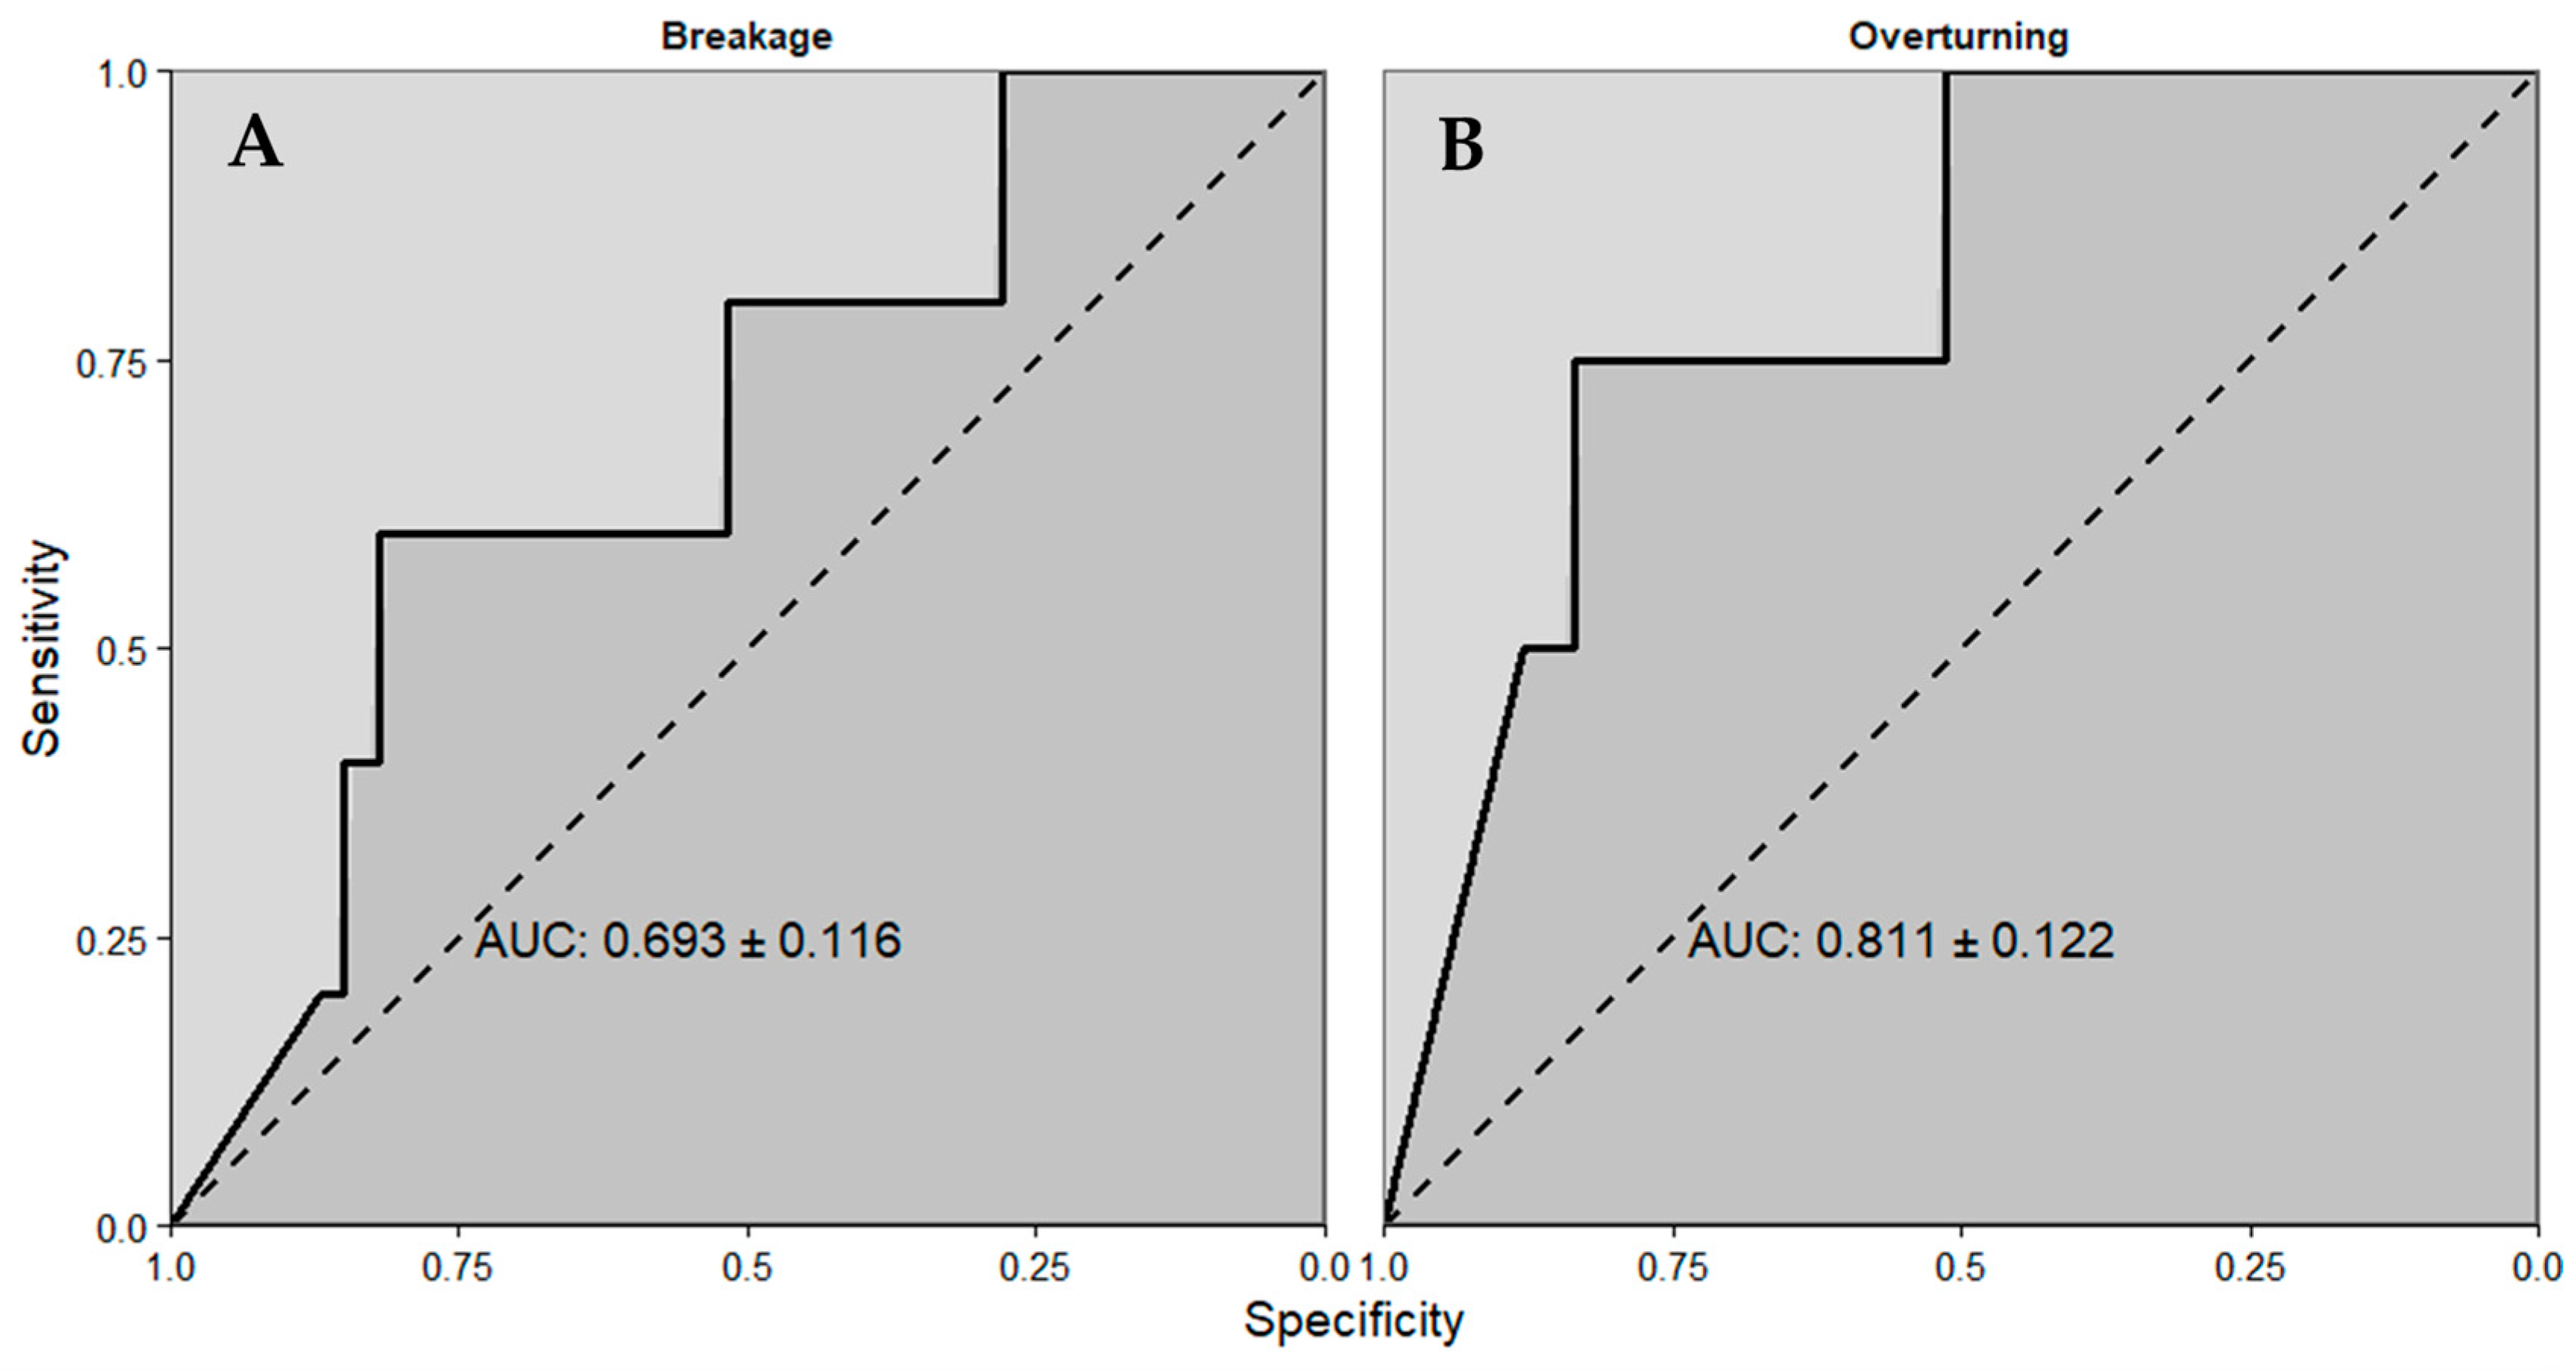
At the stand scale, ForestGALES showed stronger discriminatory performance across all failure modes (Figure 4 and Table 3). Balanced AUC was highest for overturning (0.811 ± 0.122), followed by breakage (0.693 ± 0.116) (Figure 4) and lowest for total damage (0.623 ± 0.083) (Figure A4B). Based on classification criteria [39], discrimination for overturning at the stand scale can be considered excellent, while discrimination for breakage and total damage represents meaningful and consistent performance above random classification. Observed stand-level damage was defined using optimised plot-level damage thresholds of ≥29% overturned trees, ≥30% broken trees, and ≥36% total damaged trees per plot. For each failure mode, probability cut points were selected where sensitivity equalled specificity, yielding balanced accuracies of 75.0% for overturning, 59.9% for breakage, and 58.3% for total damage (Table 3 and Figure A4B).
Figure 4.
Receiver operating characteristic (ROC) curves for stand-level validation of ForestGALES predictions for (A) stem breakage and (B) overturning following Cyclone Gabrielle. Balanced AUC (mean ± SD from 1000 balanced resampling iterations) was calculated using binary stand-level damage classes derived from observed damage proportions using optimised percentage thresholds. The dashed line indicates random performance.
Across both spatial scales, ForestGALES demonstrated consistent and reliable discrimination between damaged and undamaged observations, with strongest performance at the stand scale (Table 3). Overturning was consistently better predicted than breakage or total damage, and model performance remained robust across both spatial scales.
3.2. Effects of Silvicultural Treatment on Wind Vulnerability
3.2.1. Individual-Tree-Level Differences Between Treatments
At the individual-tree scale, ForestGALES consistently predicted overturning to be the dominant failure mechanism across the Rangipo trial. CWS thresholds for overturning were lower than those for stem breakage across all treatments (Figure 5A,B), indicating that trees were more susceptible to root plate failure than stem fracture under equivalent wind loading conditions.
Figure 5.
Spatial distribution of individual critical wind speed (CWS) for (A) overturning and (B) stem breakage across the Rangipo trial. Treatment plots representing combinations of stocking density and cultivation are outlined.
Spatial patterns of individual-tree CWS revealed a strong influence of silvicultural treatment (Figure 5). Trees within low-stocking treatments exhibited lower overturning CWS values and therefore greater predicted vulnerability, particularly in cultivated plots. In contrast, trees within high-stocking treatments showed higher CWS values, indicating increased wind firmness. These treatment-related patterns were spatially coherent across the trial, with clusters of lower CWS values evident within low-stocking blocks and higher values concentrated within high-stocking blocks. Within treatments, fine-scale heterogeneity was evident. Trees located along plot margins and exposed edges frequently exhibited lower CWS values than interior trees, particularly for overturning, while more sheltered interior positions showed greater resistance to wind loading. In the low-stocking, non-cultivated treatment, elevated vulnerability was concentrated in the northern portion of the block, whereas lower vulnerability was apparent in the southern section (Figure 5A). In contrast, the low-stocking, cultivated treatment displayed consistently low overturning CWS values throughout the block, suggesting a more uniform distribution of vulnerability. The CWS values for stem breakage were consistently higher than those for overturning across the trial (Figure 5B), confirming that breakage was predicted to be a less frequent failure mechanism. Although breakage CWS also varied among treatments, spatial contrasts were less pronounced than for overturning, with substantial overlap between treatments.
To quantify treatment effects, individual-tree CWS values were analysed using a two-way ANOVA with stocking (high vs. low) and cultivation (cultivated vs. non-cultivated) as fixed factors (n = 6918 trees). For overturning, both main effects and their interaction were highly significant (stocking: F1,6914 = 1761.9, p < 0.001; cultivation: F1,6914 = 38.7, p < 0.001; stocking × cultivation: F1,6914 = 100.1, p < 0.001). Trees in high-stocking treatments had higher mean overturning CWS values (21.8 m s−1) than those in low-stocking treatments (20.9 m s−1), indicating greater resistance to uprooting at higher stand densities. Cultivation exerted a smaller but significant effect, with cultivated plots showing slightly higher overturning CWS. For stem breakage, treatment effects were weaker. Both stocking (F1,6914 = 5.42, p = 0.02) and cultivation (F1,6914 = 10.19, p = 0.001) were significant, but their interaction was not (p = 0.77). Mean breakage CWS values differed only marginally between stocking levels, indicating limited sensitivity of stem failure to silvicultural treatment at the individual-tree scale.
3.2.2. Stand Level
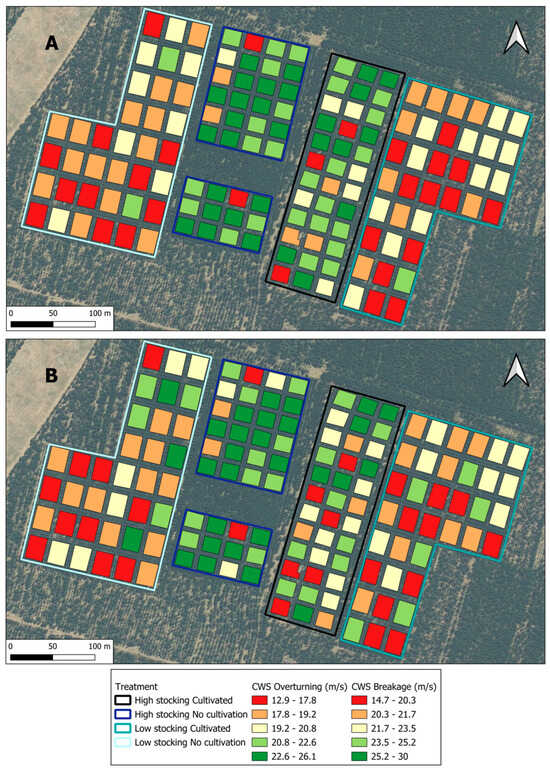
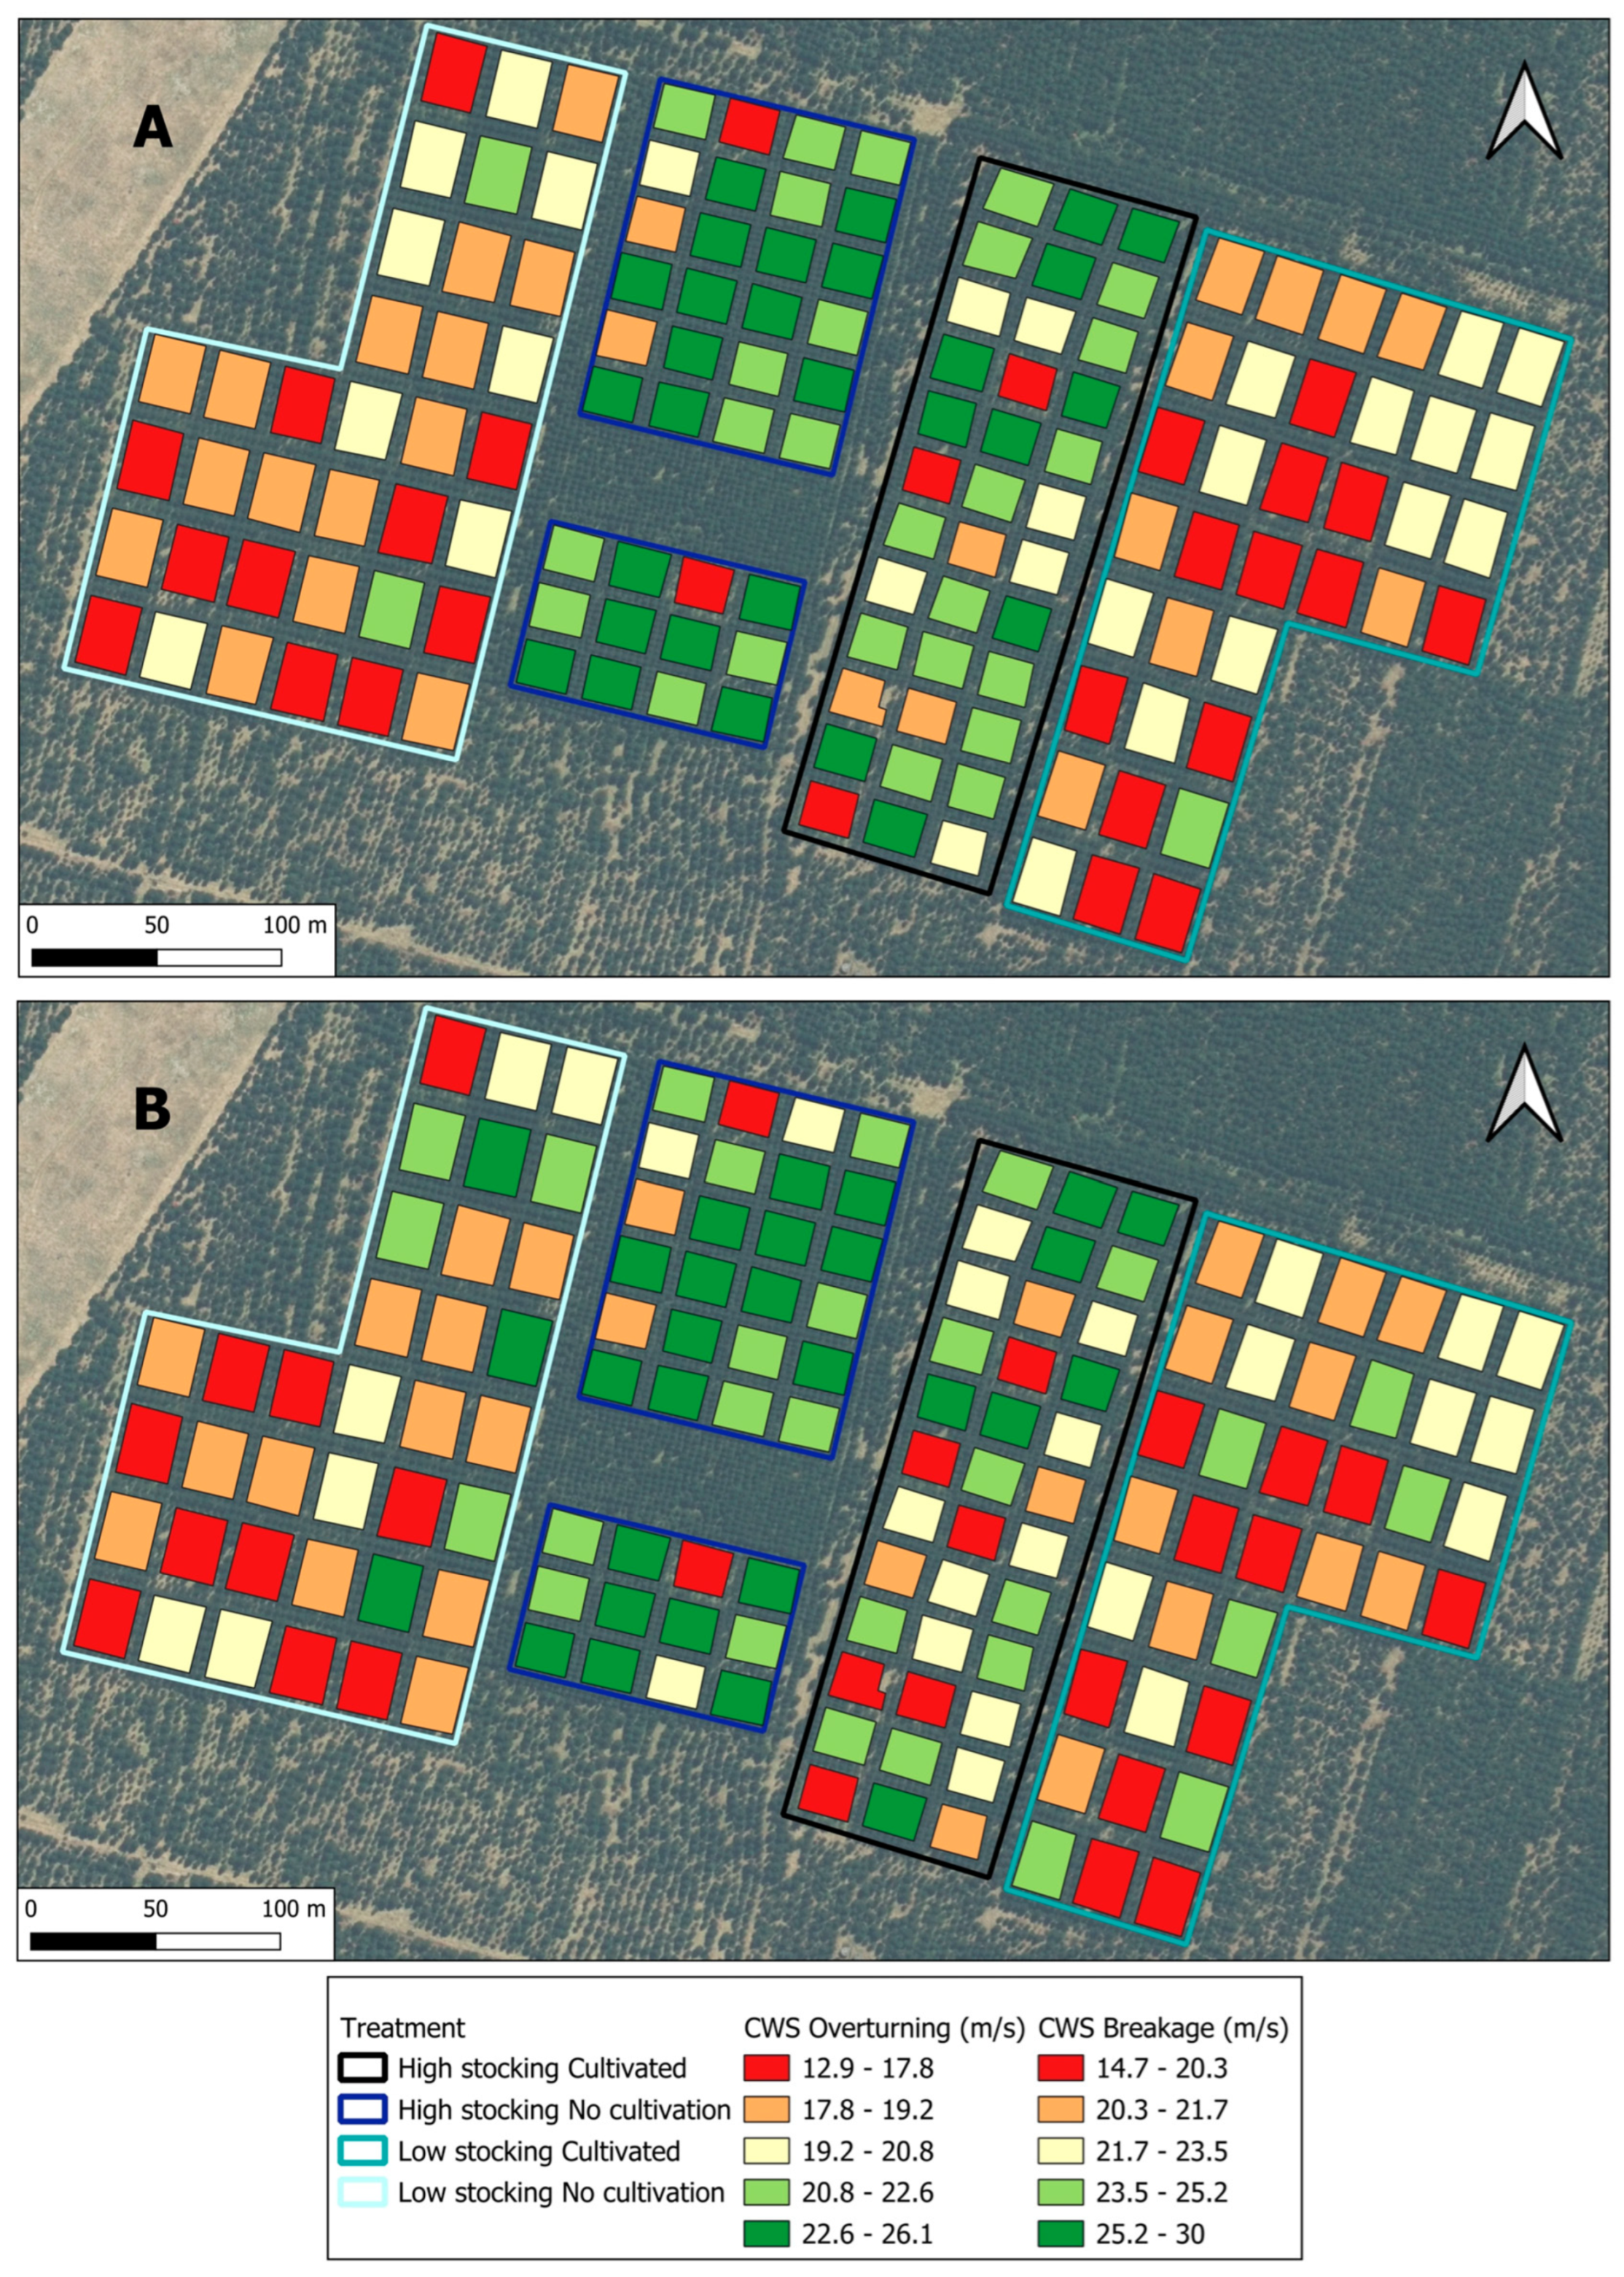
At the stand scale, spatial patterns of wind vulnerability broadly mirrored those observed at the individual-tree scale but were more spatially coherent and less influenced by fine-scale heterogeneity (Figure 6). Stands managed under low-stocking regimes exhibited lower mean CWS values for both overturning and breakage, indicating greater vulnerability to wind damage, whereas high-stocking stands were consistently more wind-firm. Overturning remained the dominant failure mode at the stand scale, with overturning CWS values consistently lower than breakage CWS values across all treatments (Figure 6A,B). Spatially, the lowest CWS values were concentrated in low-stocking plots located toward the outer areas of the trial, while higher CWS values were observed in centrally located high-stocking plots. Compared with individual-tree results, aggregation at the stand level reduced the influence of localised edge effects and produced clearer treatment-level contrasts.
Figure 6.
Spatial distribution of stand critical wind speed (CWS) for (A) overturning and (B) stem breakage across the Rangipo trial. Treatment plots representing combinations of stocking density and cultivation are outlined.
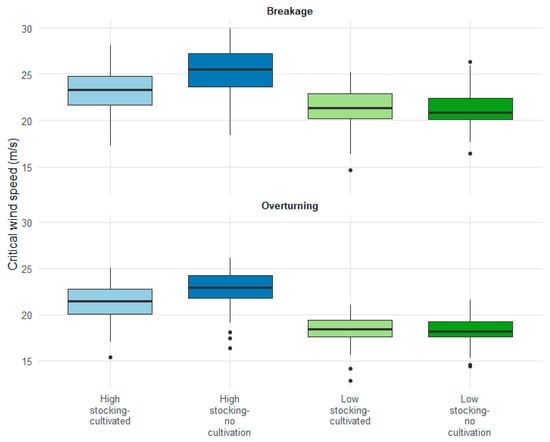
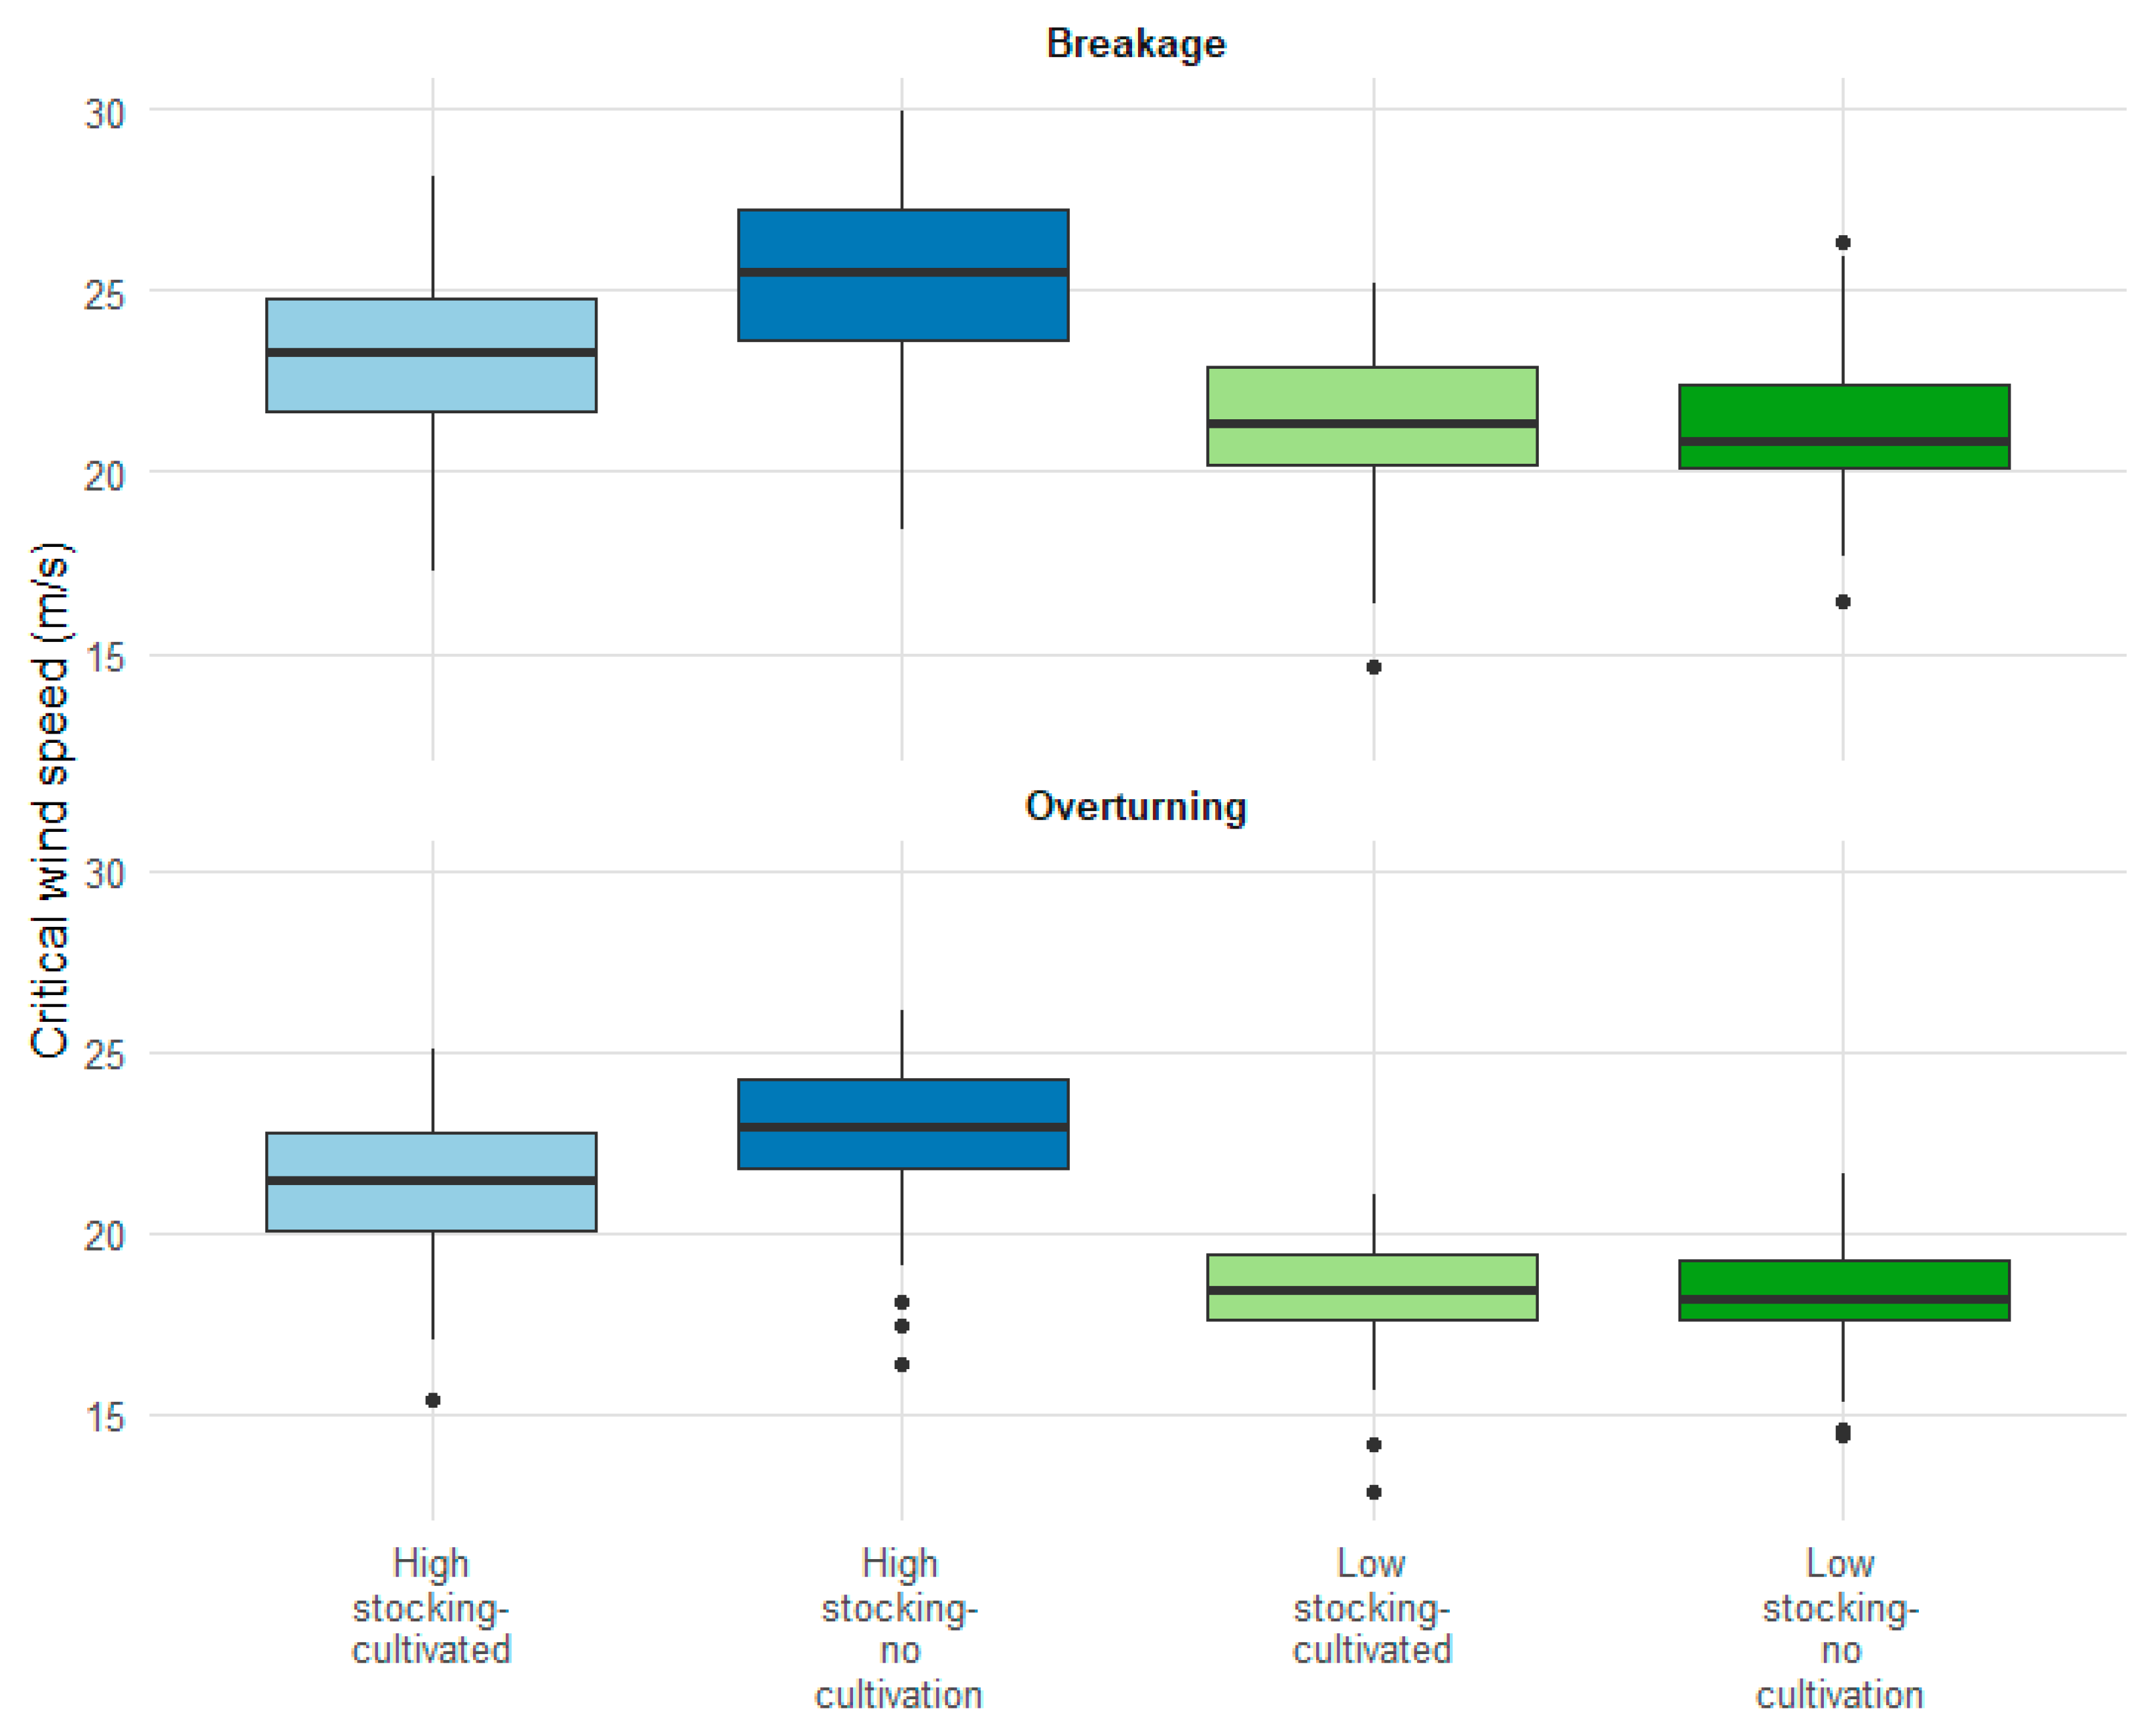
Plot-level distributions of stand CWS (Figure 7) showed substantial variability within treatments, particularly under low-stocking regimes. Mean stand-level overturning CWS values ranged from 18.2 to 18.3 m s−1 in low-stocking treatments to 21.2–22.7 m s−1 in high-stocking treatments. For stem breakage, mean CWS values ranged from 21.2 to 21.3 m s−1 in low-stocking treatments to 23.0–25.3 m s−1 in high-stocking treatments. Low-stocking plots exhibited lower median CWS values than high-stocking plots for both failure modes, indicating reduced wind resistance under lower stand density. Overturning CWS showed stronger separation between treatments than breakage CWS, with less overlap between high- and low-stocking plots. Differences associated with cultivation were evident within stocking classes but were consistently smaller than those associated with stocking density (Figure 7).
Figure 7.
Plot-level critical wind speeds (CWS) by damage category—breakage or overturning—across silvicultural treatments.
Two-way ANOVA of plot-level CWS values (n = 144 plots) confirmed these patterns. For overturning, there were strong main effects of stocking (F1,140 = 122.9, p < 0.001) and cultivation (F1,140 = 5.42, p = 0.021), as well as a significant interaction (F1,140 = 4.36, p = 0.039). Low-stocking plots had markedly lower overturning CWS values than high-stocking plots. For stem breakage, stocking (F1,140 = 49.1, p < 0.001), cultivation (F1,140 = 7.94, p = 0.005), and their interaction (F1,140 = 6.12, p = 0.015) were also significant, although the magnitudes of these effects were smaller than those observed for overturning.
3.2.3. Consistency Across Spatial Scales
Across both spatial scales, ForestGALES predictions showed consistent responses to silvicultural treatment. Low-stocking treatments were associated with lower CWS values and greater wind vulnerability, while high-stocking treatments were more wind-firm. Overturning was consistently identified as the dominant failure mechanism at both individual-tree and stand scales, with stronger treatment discrimination than for stem breakage. Aggregation to the stand scale reduced fine-scale variability while preserving treatment effects, indicating that modelled wind vulnerability patterns were robust across broader spatial scales.
3.3. Relationships Between Stand Structural Attributes and Vulnerability
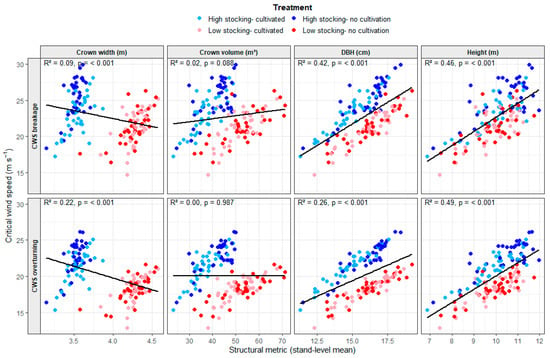
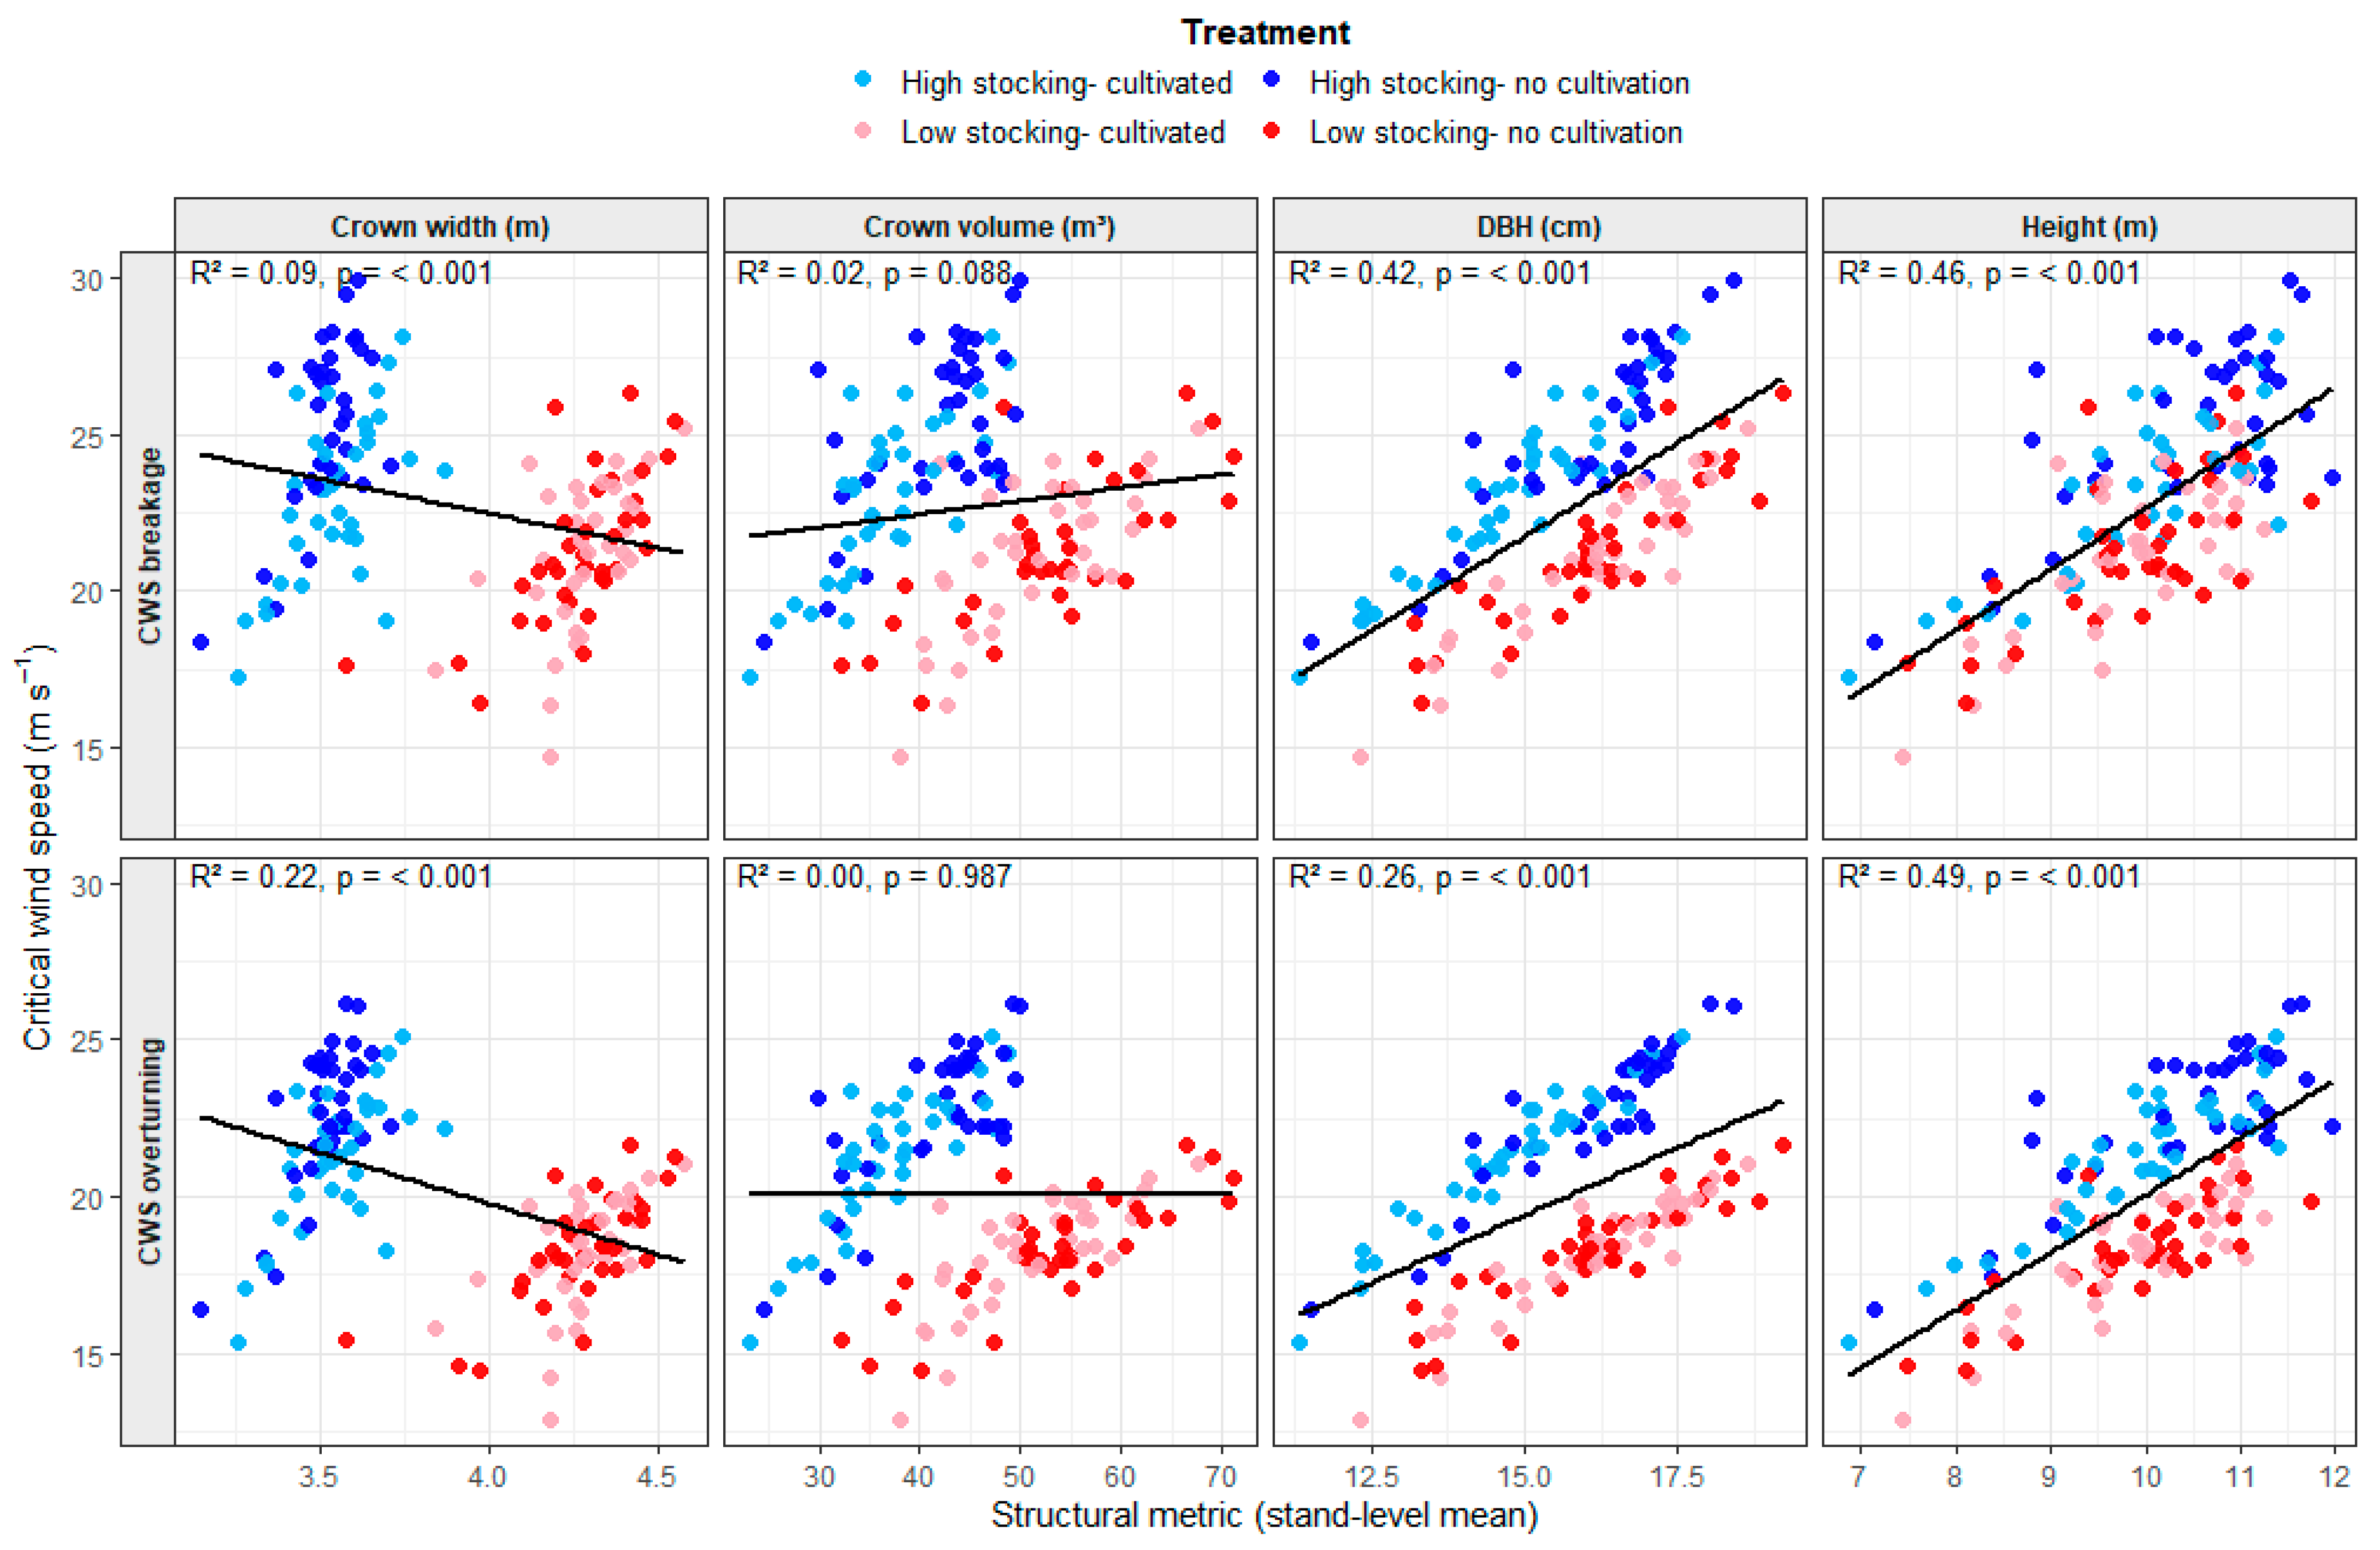
Relationships between predicted CWS and stand structural attributes were examined at the stand level (n = 144 stands) for stem breakage and overturning (Figure 8). Structural variables included stem-based metrics (DBH and height) and crown-based metrics (crown width and crown volume).
Figure 8.
Predicted critical wind speed (CWS) plotted against stand-level structural attributes (DBH, height, crown width, and crown volume), with breakage shown in the top row and overturning in the lower row, across four silvicultural treatments. Points represent stand-level means (n = 144). Solid lines indicate linear regressions; coefficients of determination (R2) and associated p-values are shown within panels.
Strong positive relationships were observed between CWS and both DBH and height for stem breakage and overturning. CWS increased significantly with increasing DBH and height across both failure modes (R2 = 0.26–0.49, p < 0.001), with height showing the strongest associations.
Crown attributes showed weaker and more variable associations with CWS. Crown width was negatively related to CWS for both failure modes (p < 0.001), indicating lower predicted wind resistance in stands with wider crowns. Crown volume showed a weak positive relationship with breakage CWS but no significant relationship with overturning. Across crown metrics, coefficients of determination were low (R2 ≤ 0.22). Treatment-level clustering was evident across all structural relationships, with high-stocking stands generally associated with higher CWS values and low-stocking stands with lower CWS values.
3.4. Simulated Impact of Stocking on Breakage and Overturning Risk
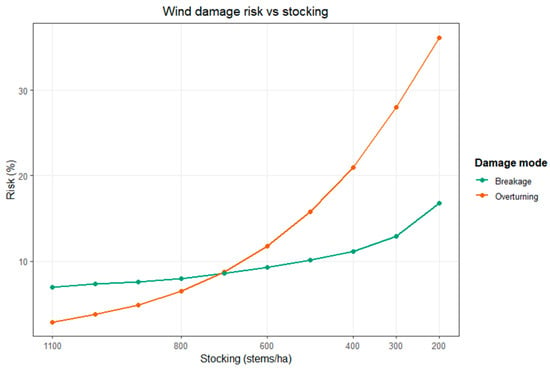
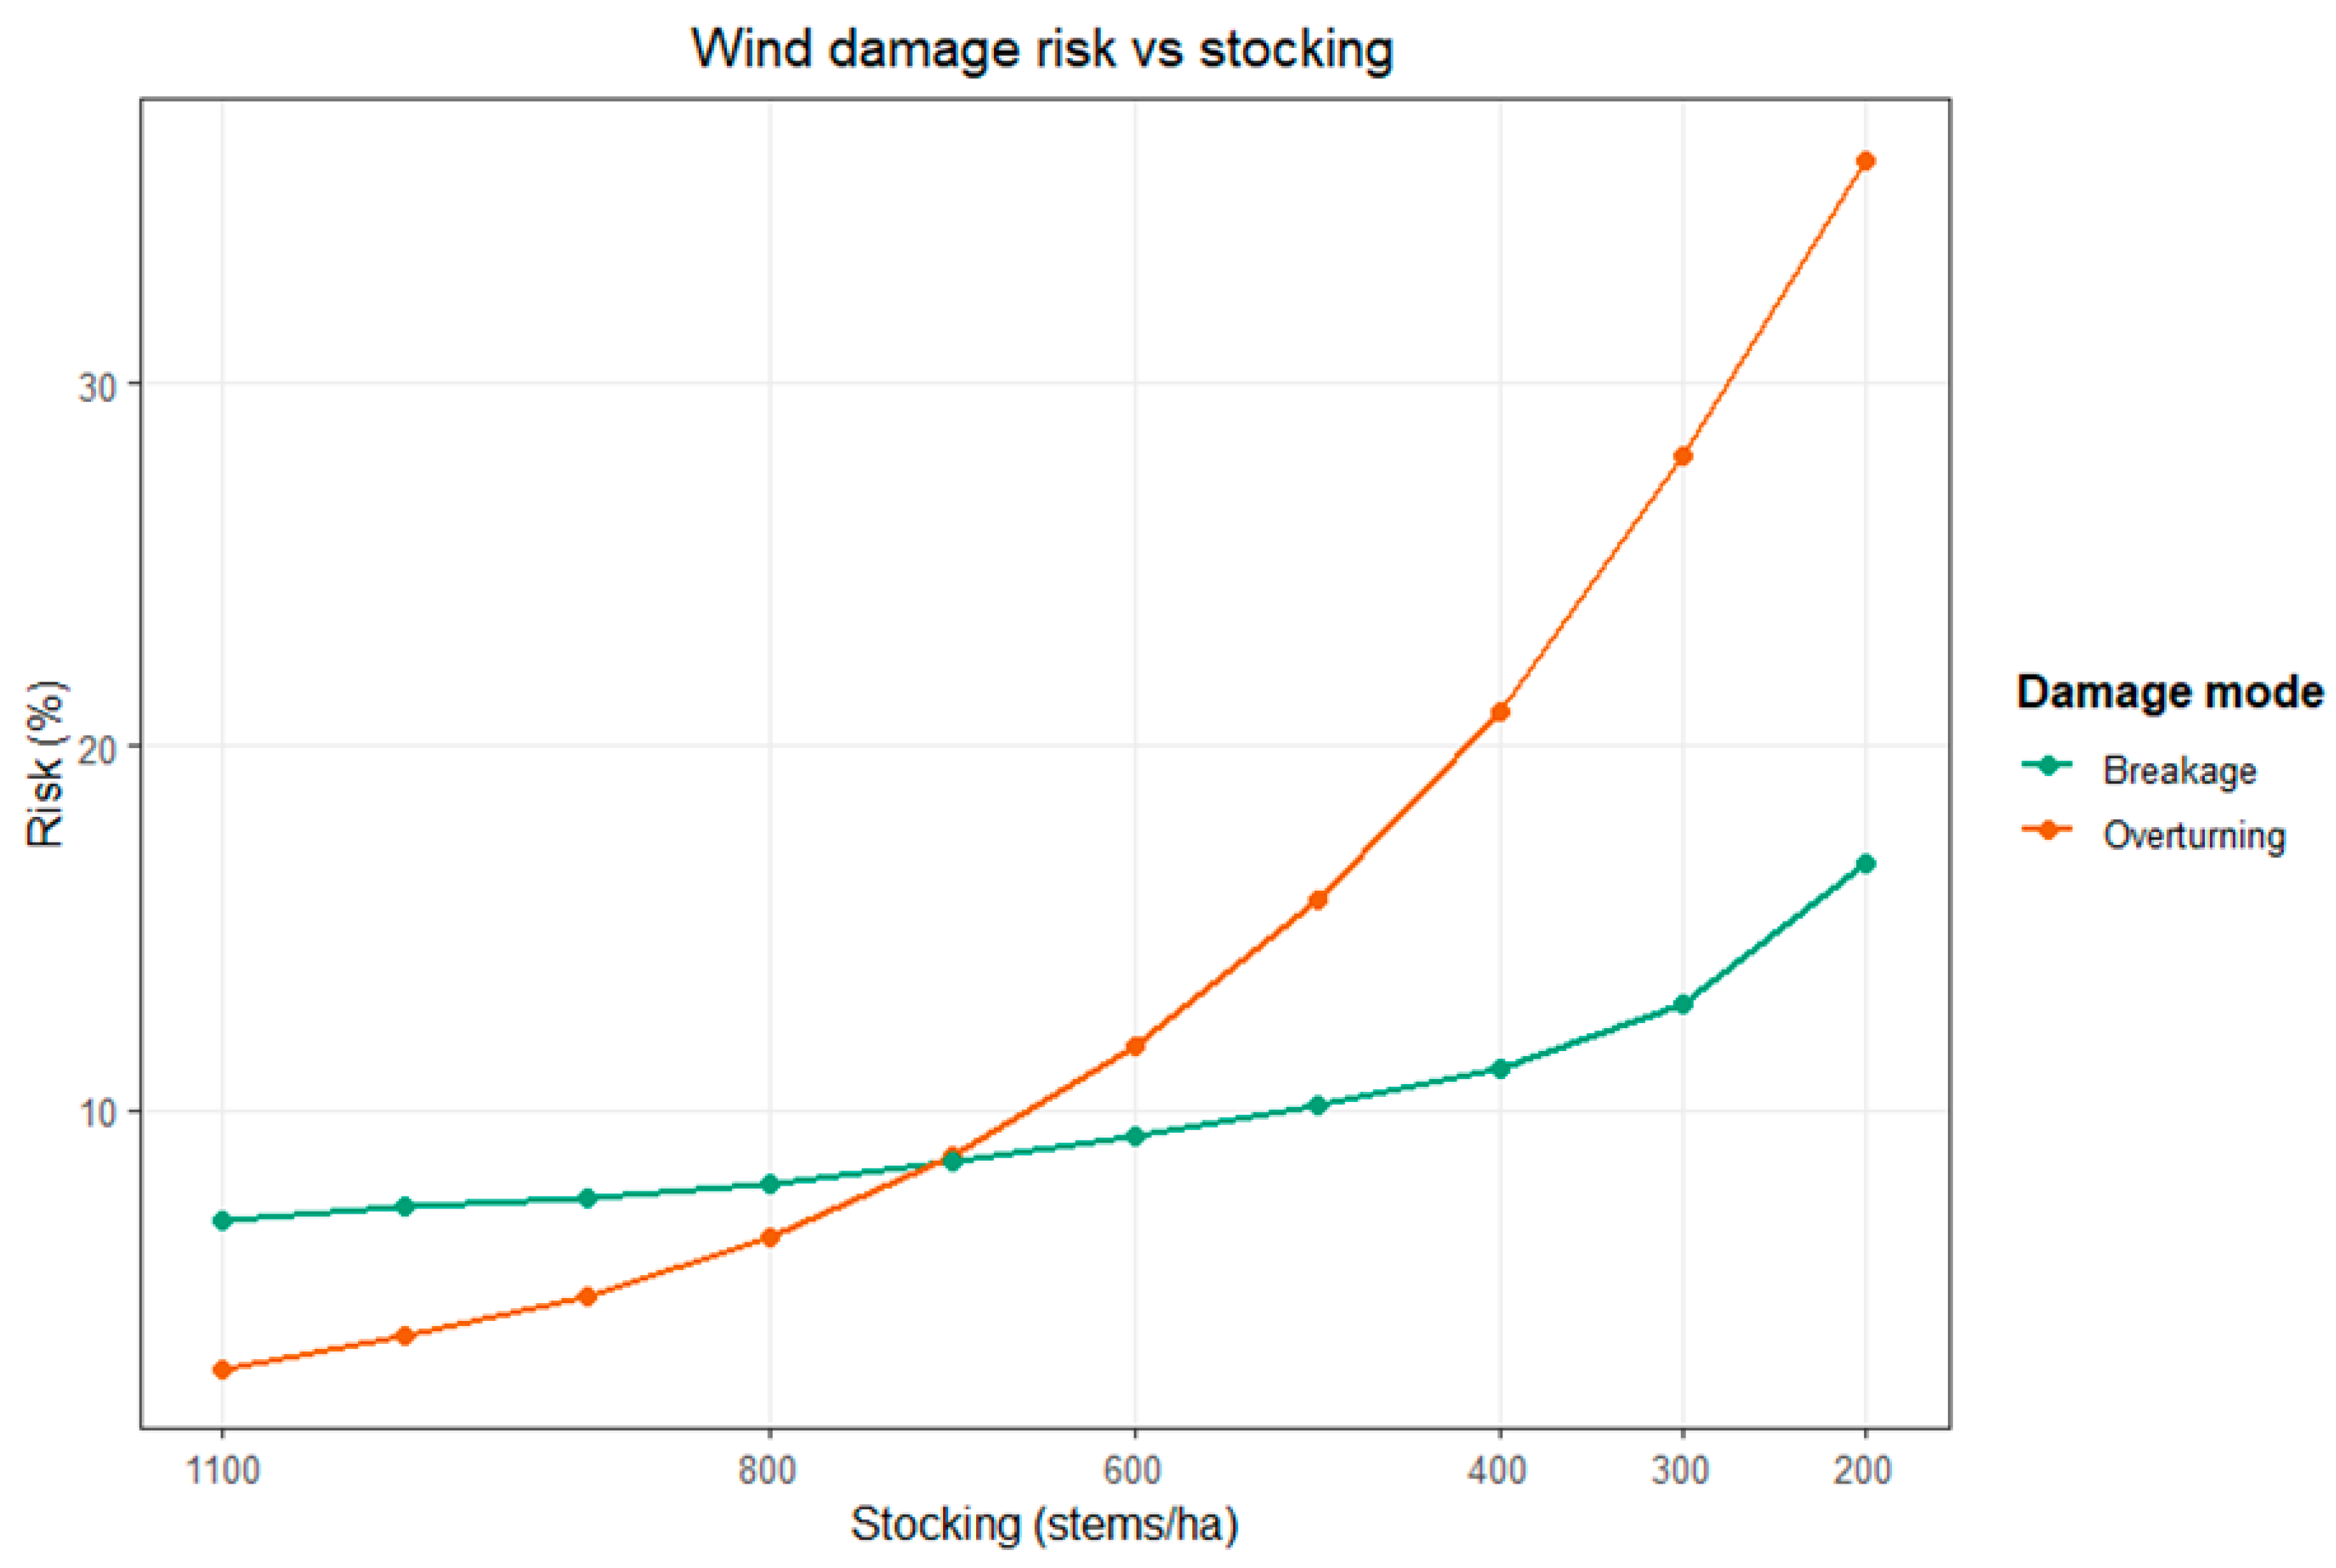
Predicted breakage and overturning risks across the simulated stocking gradient are shown in Figure 9. Consistent with the treatment-level analyses, reductions in stocking resulted in increased vulnerability to both failure modes, with risk rising progressively as stocking declined. However, the magnitude and rate of increase differed markedly between failure modes.
Figure 9.
Risk of breakage and overturning calculated using ForestGALES at the stand scale for decreasing stocking simulations.
Breakage risk increased gradually across the full stocking gradient, rising from approximately 7% at 1100 stems ha−1 to around 16%–17% at 200 stems ha−1. In contrast, overturning risk was lower than breakage at higher stocking densities but showed a much stronger response to reductions in stocking. The two failure modes converged and crossed over at approximately 700 stems ha−1. Above this threshold, breakage was the dominant failure mode; below it, overturning risk increased rapidly, exceeding 20% at 400 stems ha−1 and reaching more than 35% at 200 stems ha−1. This crossover point highlights a shift in the dominant failure mechanism with decreasing stocking and illustrates how changes in stand structure influence both the magnitude and type of wind damage.
4. Discussion
This study uses ForestGALES to examine wind vulnerability in a large, well-characterised radiata pine trial exposed to an extreme wind event. By combining model validation with analyses of silvicultural treatment and stand structure, the results offer insight into both the reliability of CWS as a vulnerability metric and the biological and management factors that govern mechanical stability. The discussion therefore focuses on (i) how predicted vulnerability relates to observed damage, (ii) how management and structure shape resistance to different failure modes, and (iii) how stocking influences wind vulnerability under extreme storms. Together, these findings help clarify the mechanisms driving radiata pine wind damage under extreme events and the scope for improving resilience in New Zealand through management and stand design.
4.1. ForestGALES Performance and Interpretation of CWS
The level of discrimination achieved in this study is consistent with, and in several cases exceeds, that reported in previous ForestGALES validation studies. At the stand scale, balanced AUC values for overturning (0.81) and breakage (0.69) (Table 3) fall within previously documented AUC values of approximately 0.71–0.74 for ForestGALES applied to Sitka spruce stands using both WAsP- and DAMS-derived wind fields [8]. Similarly, recent ForestGALES-based assessments of storm damage risk in European forests report stand-level discrimination typically between 0.7 and 0.85, depending on species, failure mode, and damage definition [17]. These results show that ForestGALES performs at least as well under cyclone-driven winds as it does under severe New Zealand storms and the temperate wind climates for which it was originally developed and most extensively tested.
At the individual-tree scale, discrimination was lower but remained clearly above random expectation, with balanced AUC values of 0.65 for overturning and 0.60 for breakage (Table 3). These values are comparable to tree-level ForestGALES applications reported for European species, where individual-tree AUC values typically range from approximately 0.6 to 0.75 depending on species, calibration approach, and optimisation method [8]. The reduced performance at the individual-tree scale is consistent with the conceptual design of ForestGALES. This design applies to both the stand and tree-level methods in ForestGALES and it relies on stand-average structural properties and steady-state wind assumptions to calculate wind loading and resistance to damage, rather than capturing microsite effects, transient gusts, or individual stem defects that can significantly influence tree-level failure [40,41].
Importantly, despite the widespread commercial importance of radiata pine, there are no published studies reporting formal ForestGALES validation for this species. Previous ForestGALES evaluations have focused primarily on European conifers such as Sitka spruce, Norway spruce, and Scots pine [8,19,42], while wind damage modelling for radiata pine has largely relied on empirical or machine-learning approaches rather than mechanistic frameworks [4,20,43]. Furthermore, the mechanical and anchorage relationships used to parameterise ForestGALES were largely derived from European species and soil classifications, with limited representation of intensively grown forests or the pumice-derived, freely draining soils typical of central North Island plantations. The present study therefore extends evaluation of ForestGALES to a well-characterised radiata pine trial grown under contrasting stocking and cultivation regimes on volcanic soils. The strong stand-level discrimination observed here indicates that ForestGALES captures the dominant structural controls on wind vulnerability in radiata pine plantations, supporting the use of CWS as a robust intermediate indicator of relative wind risk across management regimes and structural conditions.
4.2. Predicted Versus Observed Failure Modes
ForestGALES consistently predicted overturning to occur at lower values of CWS than stem breakage across treatments and spatial scales, indicating that root anchorage most often controlled failure in the model. In contrast, observed damage following Cyclone Gabrielle was dominated by stem breakage (10.2% of trees) rather than overturning (6.5%) (Table 1). This discrepancy between predicted mechanical thresholds and realised damage patterns requires mechanistic interpretation rather than being viewed as model failure. However, it may also reflect limitations in the model parameterisation, particularly in the representation of soil conditions and root anchorage.
Overturning (windthrow) and stem breakage represent fundamentally different modes of mechanical failure. Overturning occurs when sustained wind-induced swaying exceeds the resistance of the root–soil system, leading to partial or complete overturning of the stem and root plate [6,44,45]. Stem breakage, by contrast, occurs when bending stresses induced by wind loading exceed stem strength before the root–soil system can fail under wind loading [46]. Uprooting resistance has been shown to depend on tree size and leverage, commonly represented by metrics such as height × diameter2 or the height:DBH ratio, whereas stem failure is more strongly linked to stem diameter and the mechanical properties of the wood [9,47,48]. Consistent with established mechanics, CWS increased strongly with DBH and height in this study, particularly for overturning, confirming stem size as a key determinant of predicted wind resistance. In New Zealand radiata pine plantation forests, both failure modes occur, but uprooting tends to occur under wetter, shallower soil conditions and in older stands, whereas breakage is more often observed in younger or mid-rotation stands on well-drained sites [49]. Radiata pine is often considered vulnerable to windthrow because of its relatively shallow, plate-like root system, particularly on compacted or poorly structured substrates [50]. High slenderness ratios, common in fast-growing plantations, further increase bending moments at the root plate and are traditionally associated with overturning risk in older trees [43].
At Rangipo, several factors likely drove stem failure as the dominant damage mode. First, the Typic Orthic Pumice soils may provide stronger anchorage than represented by the generic freely draining mineral soil class used in ForestGALES, which was parameterised primarily for UK conditions [51]. Although pumice soils are typically lower in bulk density and shear strength than many mineral soils, their high porosity and low penetration resistance may permit deeper and more extensive root penetration [52]. Experimental evidence from poplar grown on contrasting soil types showed that root length and biomass were negatively correlated with soil bulk density, with substantially greater root mass and deeper rooting observed in pumice soils than in denser mineral soils [53]. Empirical tree-pulling studies in radiata pine further demonstrate that maximum resistive bending moment varies across soil types and is strongly influenced by root plate diameter and depth [54], with soil–root interactions affecting both anchorage strength and failure mode. Although Moore [54] reported lower resistive bending moments on pumice soils relative to some mineral soil types, site-specific rooting patterns in deep, unconstrained pumice profiles may have enhanced anchorage at Rangipo beyond that represented by the generic soil class in ForestGALES. If anchorage strength was underestimated, the model would conservatively predict lower overturning thresholds than those realised in practice.
Second, long-term exposure to prevailing southerly and south–south-easterly winds may have promoted structural acclimation in the root systems of the Rangipo trial trees along these directions. Trees are known to respond to recurrent wind loading through thigmomorphogenesis, reallocating resources to enhance stability via increased stem taper, asymmetric crown development and enhanced root anchorage [55,56]. Because Cyclone Gabrielle arrived predominantly from similar wind directions, root systems previously acclimated by recurrent loading were likely robust, while stems experienced extreme bending stresses beyond typical exposure levels.
4.3. Effects of Silvicultural Treatment
Silvicultural treatment had a clear influence on predicted wind vulnerability, with stocking emerging as the dominant management factor. Stocking fundamentally alters canopy structure and exposure, thereby changing the mechanical forces acting on trees during wind events. Increased spacing reduces mutual shelter and increases wind loading on individual trees, a pattern well documented in wind-risk studies [8,57]. In this study, low-stocking treatments were consistently associated with lower values of CWS, particularly for overturning, indicating greater predicted vulnerability under reduced stand density. This predicted response mirrors the discrete treatment contrasts observed in the empirical damage patterns (Table 1), where low-stocking treatments exhibited greater wind damage than high-stocking treatments.
Mechanistically, wider spacing promotes larger crowns and greater effective sail area, increasing aerodynamic drag and bending moments during wind loading [58,59]. This aligns with the structural relationships observed here, where crown width was negatively associated with CWS and predicted overturning showed stronger sensitivity to stand structure than stem breakage. Reduced stocking also increases individual tree exposure, especially near stand edges, amplifying mechanical loading relative to denser stands where canopy shelter moderates wind speeds [60]. Stand developmental stage likely further interacts with spacing effects. During stand development, biomass allocation shifts over time, with early growth often dominated by rapid height increment before proportional crown expansion and stem thickening [61,62]. Under wider spacing, accelerated crown expansion increases sail area and aerodynamic loading, reinforcing the sensitivity of overturning to stocking density [59]. However, if crown and anchorage development do not increase proportionally with leverage, mechanical limits may be reached more rapidly under extreme wind loading. This interaction between spacing, crown development, and structural growth helps explain why overturning CWS was particularly responsive to stocking.
The simulation highlighted how risk can differ between failure modes across the stocking gradient. Modelled wind risk increased progressively as stocking declined from 1100 to 200 stems ha−1, with a particularly strong and nonlinear response for overturning. The modelled shift in the dominant failure mechanism across the stocking gradient provides further insight into the structural controls on wind damage. The crossover at approximately 700 stems ha−1 indicates a transition from breakage- to overturning-dominated failure as stand density declines (Figure 9). This reflects changes in stand structure and exposure with reduced stocking. Within ForestGALES, overturning is governed by the balance between turning moments and root–soil anchorage and is therefore more sensitive to changes in wind exposure driven by stand spacing. In contrast, stem breakage is primarily controlled by stem diameter and wood strength, making it less responsive to changes in exposure [47,48]. This highlights the ability of ForestGALES to capture how silvicultural decisions influence both the magnitude and type of wind damage.
Cultivation effects were detectable but secondary. While cultivation-modified CWS within stocking classes and significant interactions were observed at the stand scale, these differences were consistently smaller than those associated with stand density. This suggests that although soil preparation and rooting environment may influence anchorage [63,64], canopy structure and spacing exert the primary control on wind resistance under the conditions examined here. Overall, stocking density was the main silvicultural factor influencing predicted wind resistance at Rangipo. This pattern was consistent with the empirical damage observations, in which cultivation also had a secondary effect relative to stocking [22], further supporting the modelled results from ForestGALES.
4.4. Limitations and Future Research
One limitation of this study is that ForestGALES was developed and parameterised primarily under UK conditions, and the soil and anchorage assumptions used here may not fully represent New Zealand substrates such as Typic Orthic Pumice [24,51]. This is particularly relevant for interpreting failure mode, as conservative anchorage parameterisation may bias predictions toward overturning and contribute to overestimating overturning risk relative to stem breakage, as observed in this study. Future work should therefore apply the same modelling framework to additional storm-damaged radiata pine sites across New Zealand that span contrasting soil types (e.g., pumice, alluvial, clay), stand ages, and wind regimes, to evaluate whether treatment rankings remain consistent under different boundary conditions. A coordinated multi-site validation would also enable more rigorous testing of model performance across spatial scales, including whether discrimination improves from tree- to plot- to stand-scale in the same way observed here, and whether optimal thresholds or calibration parameters vary systematically with stand structure or exposure. Collectively, this would strengthen confidence in the transferability of ForestGALES outputs for operational risk assessment and management decisions under New Zealand conditions [20].
5. Conclusions
This study represents the first formal validation of ForestGALES for radiata pine under an extreme cyclone event and shows that CWS provides a meaningful measure of relative wind vulnerability across management regimes. Model performance was strongest at the stand scale, where overturning was predicted with high discrimination (AUC = 0.81 ± 0.12), indicating that ForestGALES captures the key structural drivers of wind resistance in radiata pine plantations. Although the model predicted overturning to occur at lower wind speeds than stem breakage, the observed damage during Cyclone Gabrielle was dominated by breakage (10.2% of trees) rather than overturning (6.5% of trees). This difference most likely reflects local soil conditions and structural acclimation rather than a limitation of the modelling framework. Importantly, the relative ranking of treatments was consistent across failure modes, reinforcing the value of CWS as a comparative indicator of mechanical stability rather than a direct predictor of damage frequency.
Stocking had the clearest influence on predicted wind vulnerability. Lower stocking reduced shelter, promoted crown expansion, and was associated with lower CWS, particularly for overturning. Simulated reductions in stocking further demonstrated an increase in predicted wind vulnerability as stocking declined, with a marked increase in overturning risk below approximately 700 stems ha−1. Cultivation effects were detectable but comparatively small. Overall, wind vulnerability in radiata pine at Rangipo was shaped predominantly by stand structure arising from silvicultural management, particularly initial planting density. These results show that mechanistic models such as ForestGALES can support practical decisions aimed at improving plantation resilience to extreme wind events.
Author Contributions
Conceptualization, K.H., M.S.W. and T.L.; methodology, K.H., M.S.W. and T.L.; software, K.H.; validation, K.H. and B.G.; formal analysis, K.H., M.S.W. and T.L.; investigation, K.H., M.S.W. and T.L.; resources, M.S.W. and T.L.; data curation, M.S.W. and N.C.; writing—original draft preparation, K.H., M.S.W. and T.L.; writing—review and editing, K.H., M.S.W., T.L., N.C., B.G. and J.C.S.; visualisation, K.H.; supervision, M.S.W. and T.L.; project administration, M.S.W. and N.C.; funding acquisition, M.S.W. All authors have read and agreed to the published version of the manuscript.
Funding
This study was funded by Forest Growers Research (CN013708—FGR407). Support for collaboration between Scion Group and Forest Research (Scotland) was provided by the Catalyst Fund—Seeding (CSG-FRI2401). Ground-based tree measurements were funded by the Resilient Forest programme through the Forest Growers Levy Trust, with additional support from the New Zealand Forest Owners Association (FOA) and the New Zealand Farm Forestry Association (FFA) (CO4X1703).
Data Availability Statement
The datasets presented in this article are not available because of privacy restrictions.
Acknowledgments
The authors acknowledge the forest company hosting the Accelerator trial and the technical staff involved in data collection. The authors also thank Sadeepa Jayathunga for processing the ULS datasets used in this study.
Conflicts of Interest
The authors declare no conflicts of interest.
Abbreviations
The following abbreviations are used in this manuscript:
| AUC | Area under curve |
| CHM | Canopy Height Model |
| CWS | Critical Wind Speed |
| DBH | Diameter at breast height |
| LCDB | Land-cover database |
| LiDAR | Light detection and ranging |
| MOE | Modulus of elasticity |
| MOR | Modulus of rupture |
| ROC | Receiver operating characteristic |
| TMC | Turning moment coefficient |
| UAV | Unmanned aerial vehicle |
| ULS | Unmanned aerial vehicle laser scanning |
| WAsP | Wind Atlas Analysis and Application Programme |
| WEng | WAsP Engineering |
Appendix A
Figure A1.
Weibull distributions of wind speed at the study site showing frequency density (f, Nᵤ/Δu) as a function of wind speed (u, m/s). Bars represent observed wind-speed frequencies and solid lines show fitted Weibull probability density functions. Reported parameters include the Weibull scale parameter (A, m/s), shape parameter (k), mean wind speed (u, m/s), and mean wind power density (P, W/m2). Panel (A) shows the long-term (20-year) wind climatology for all wind directions at the study site, and panel (B) shows the wind-speed distribution during Cyclone Gabrielle [22].
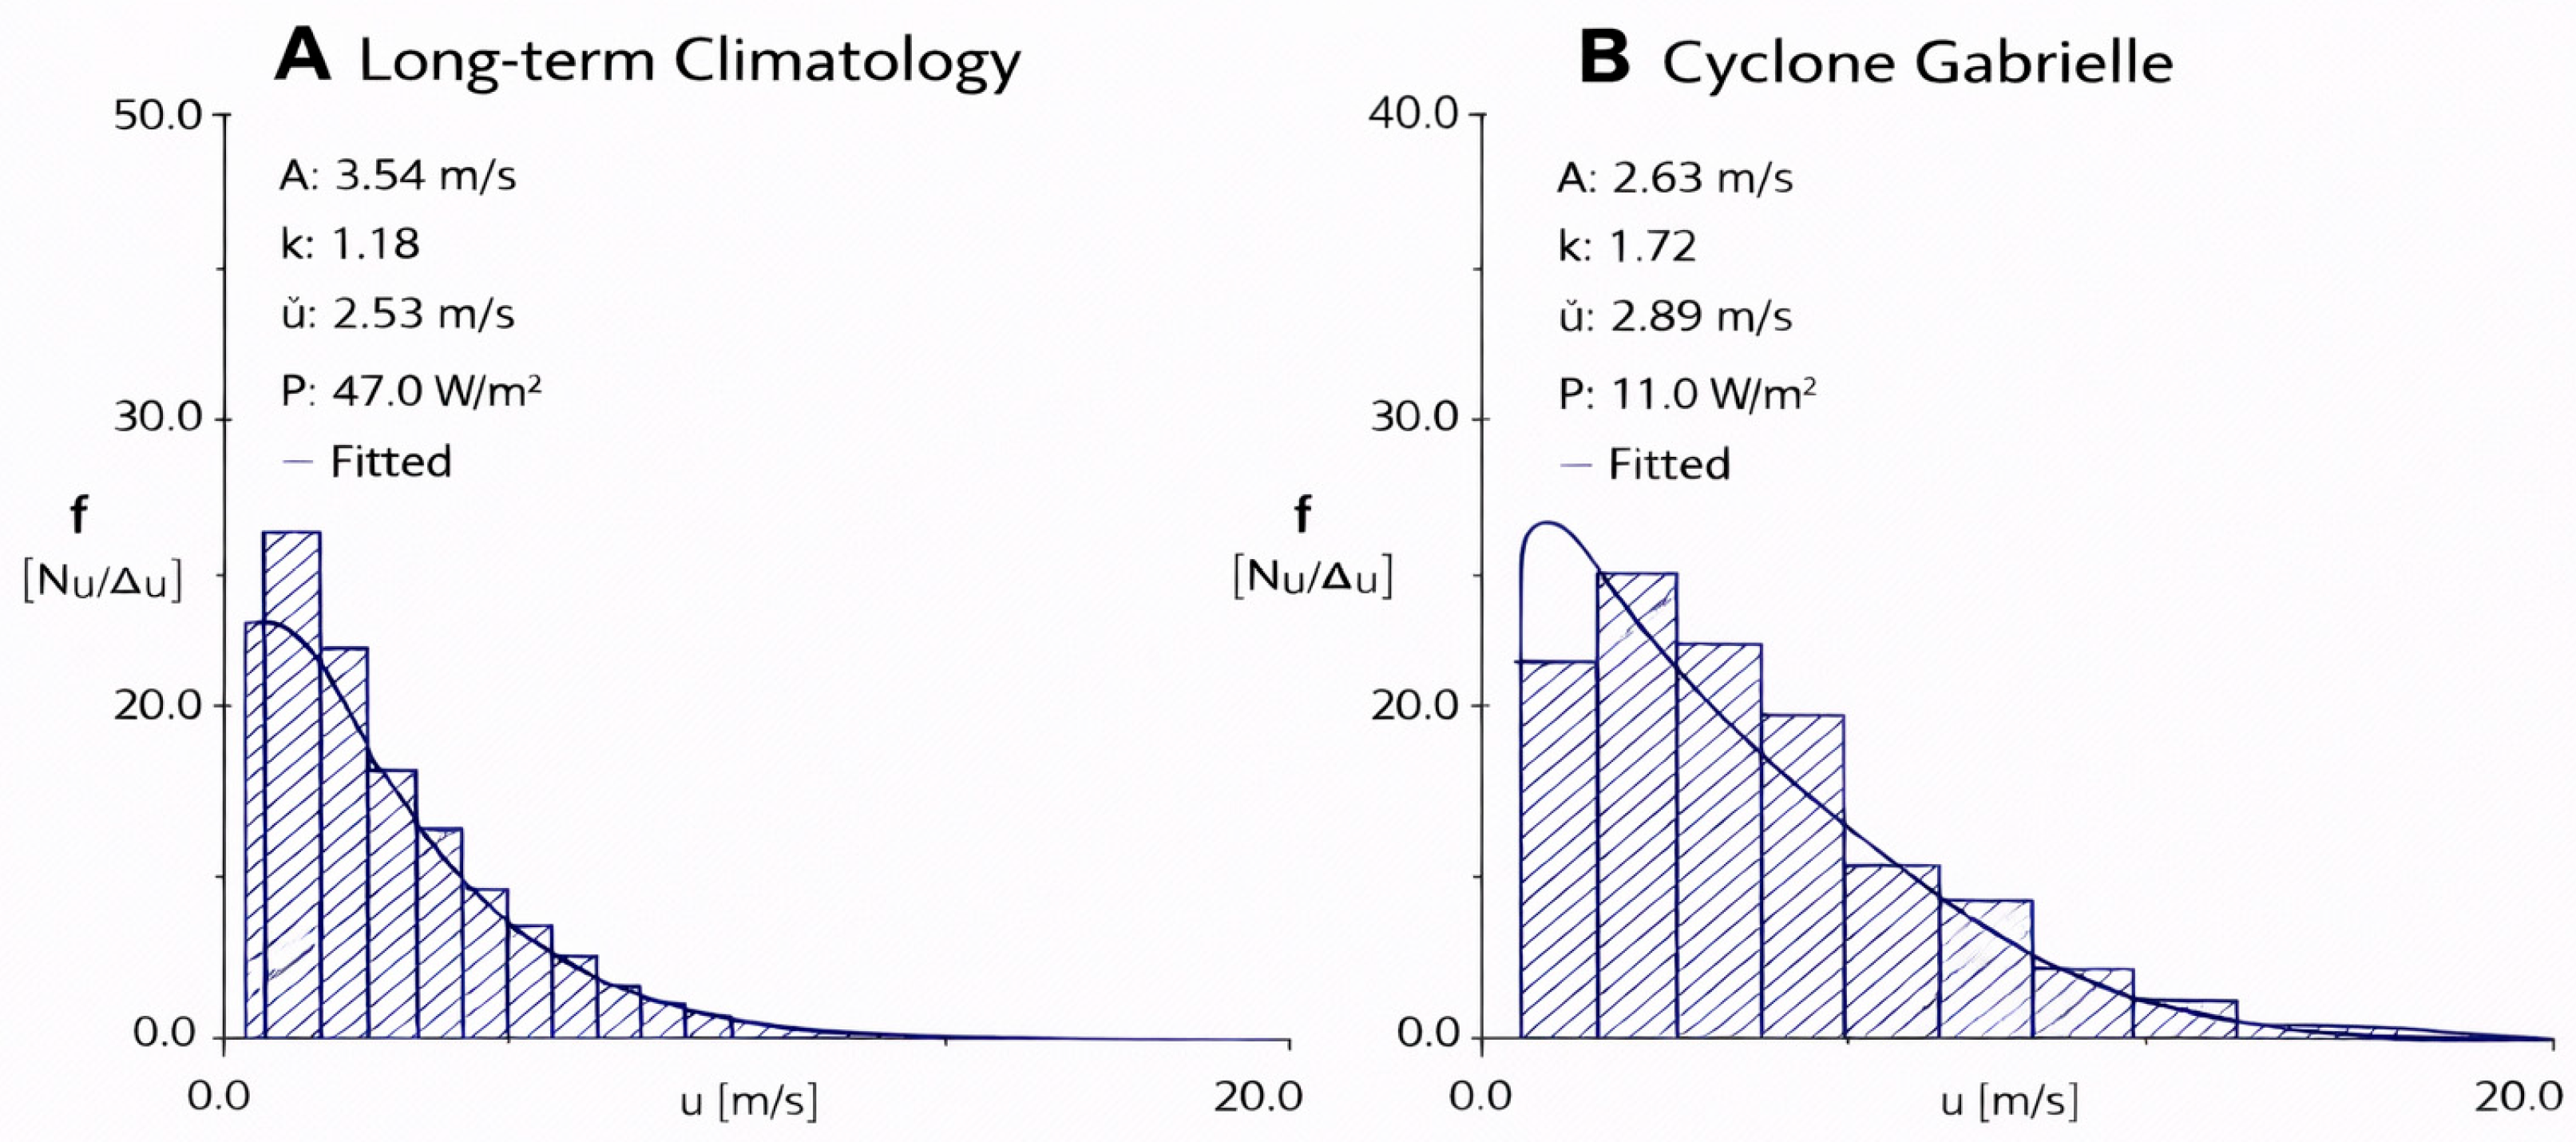
Figure A2.
Mean wind speed map for the Rangipo trial and surrounding area. Wind speeds were calculated using WAsP 12 over a 2 km × 2 km domain at 10 m spatial resolution. Darker blue colours indicate lower wind speeds and darker red colours indicate higher wind speeds, with intermediate values shown in lighter shades.
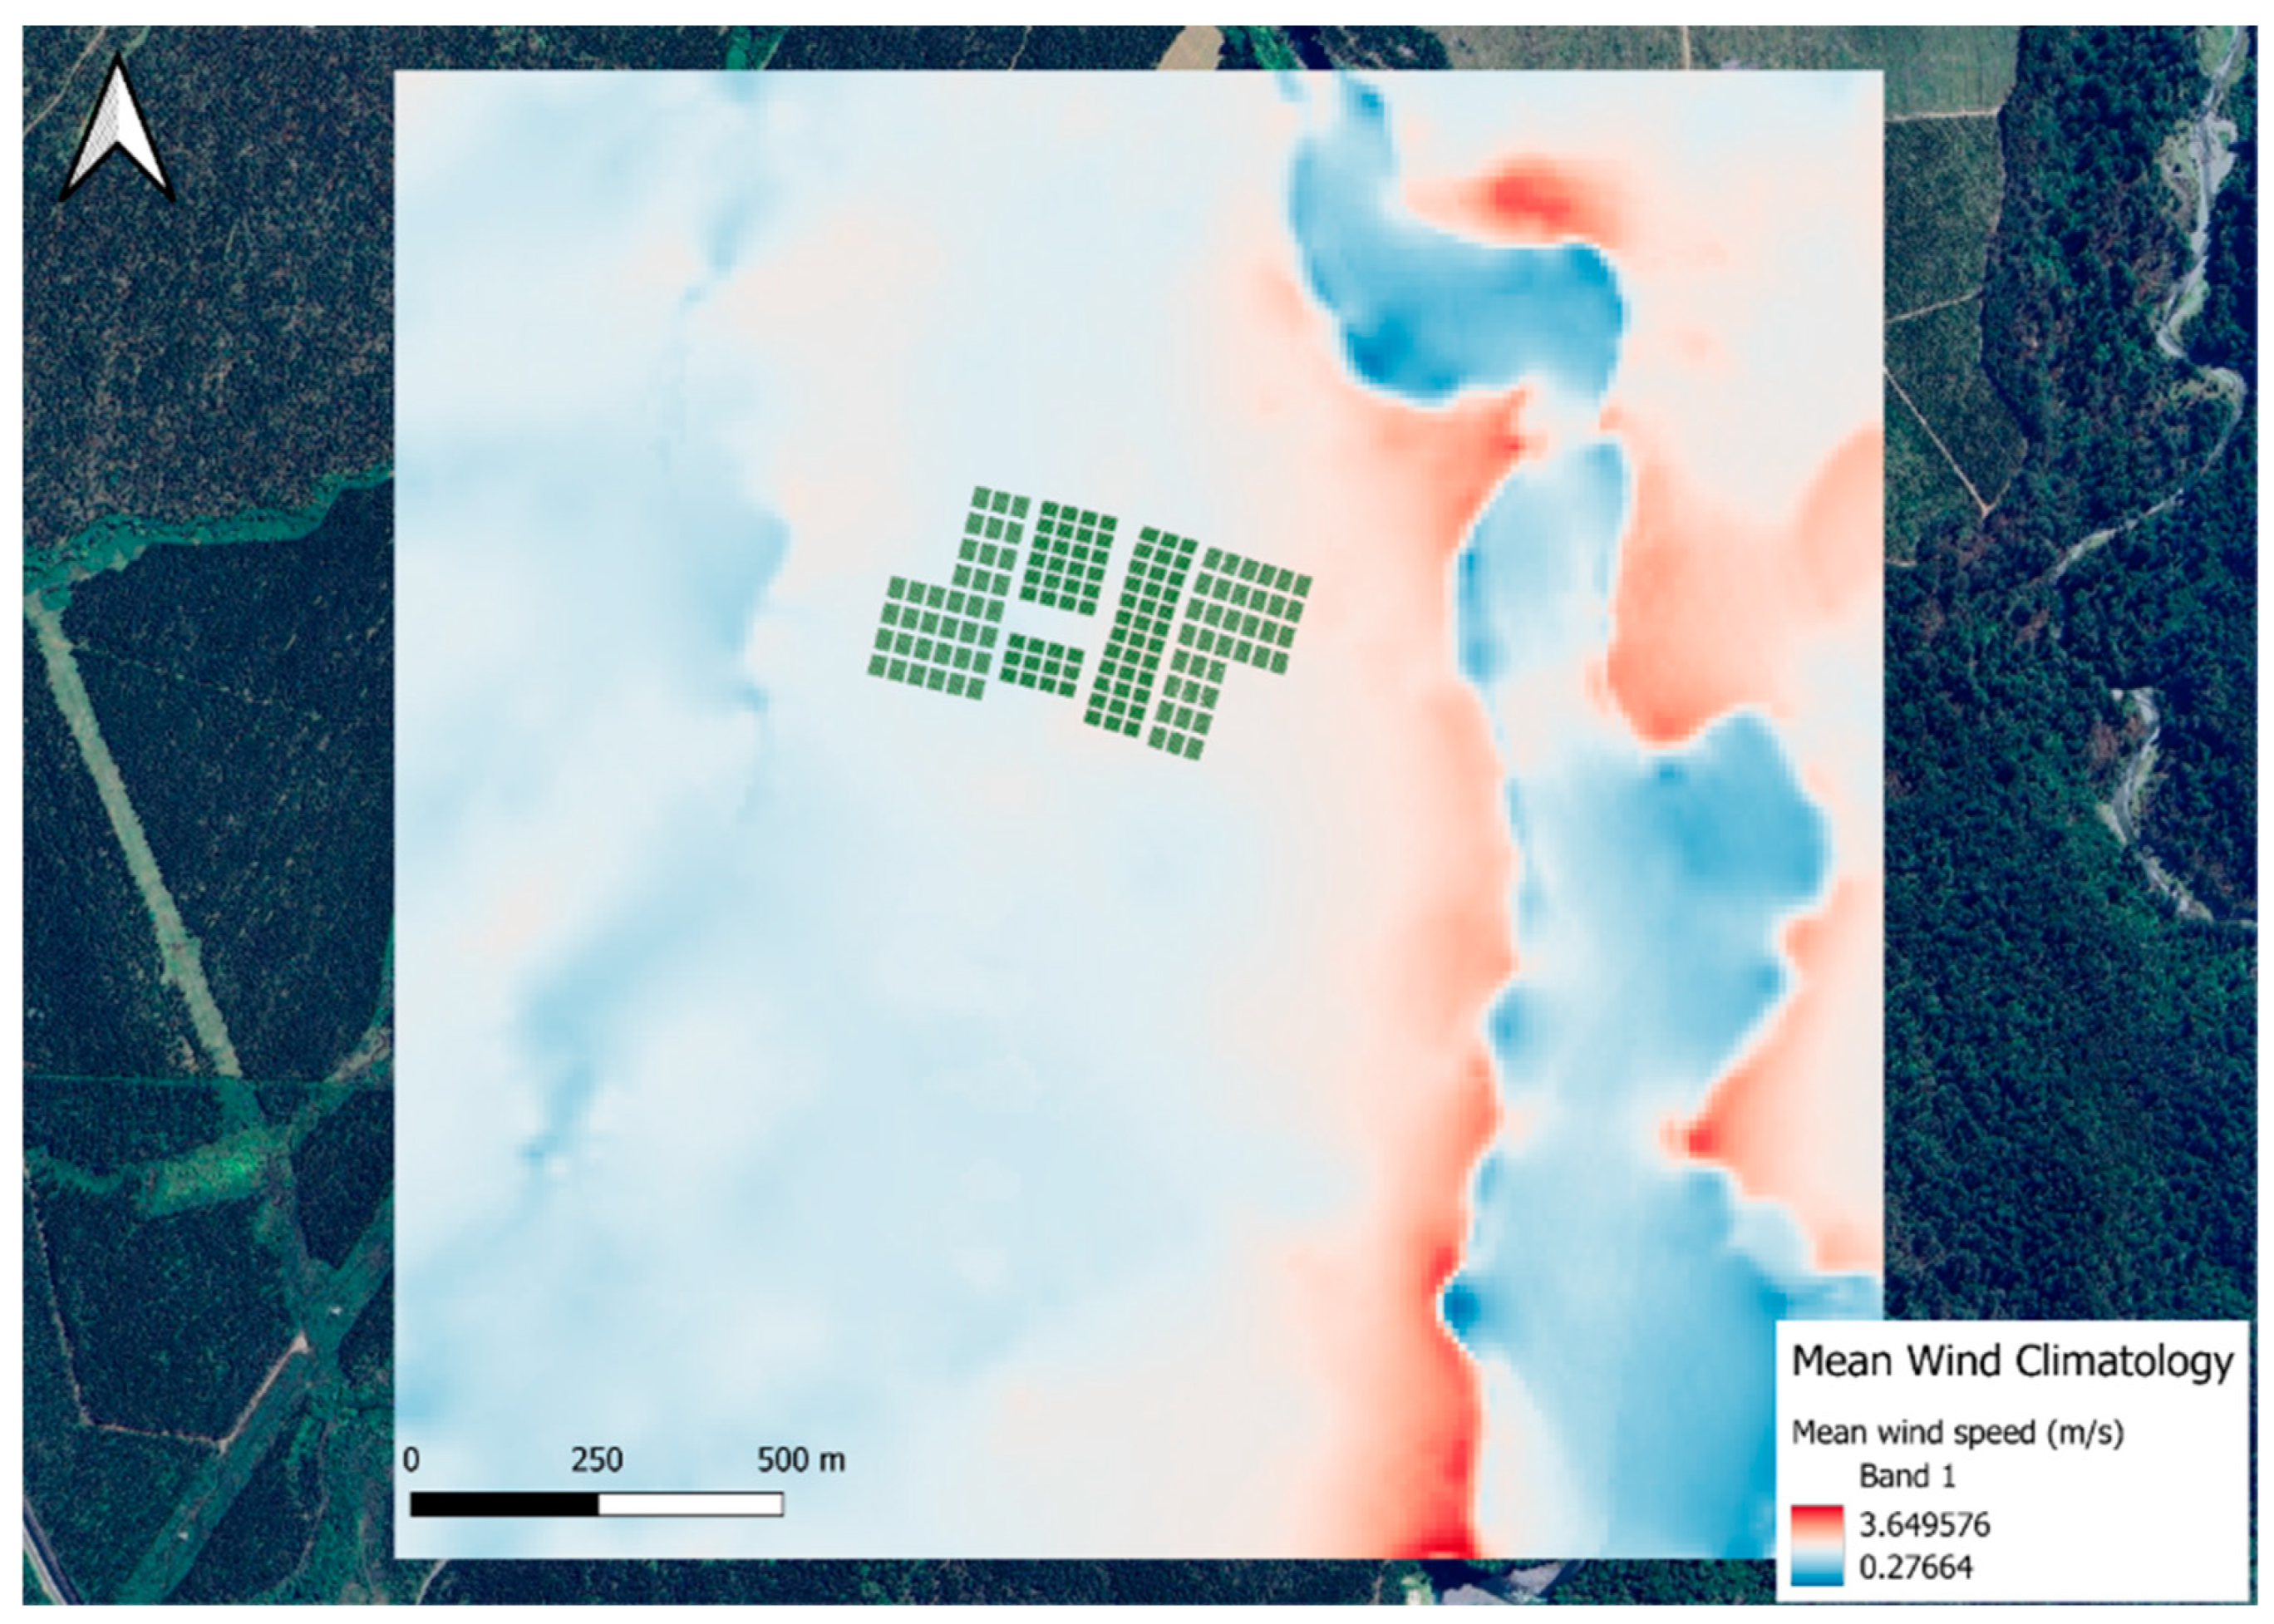
Figure A3.
Spatial distribution of mean wind speed during Cyclone Gabrielle across the Rangipo trial and surrounding area, modelled using WAsP Engineering (WEng). Calculations were performed over a 2 km × 2 km domain at 50 m spatial resolution. Lighter orange tones indicate lower wind speeds, while darker shades represent higher wind speeds, with intermediate values shown by gradual colour transitions.
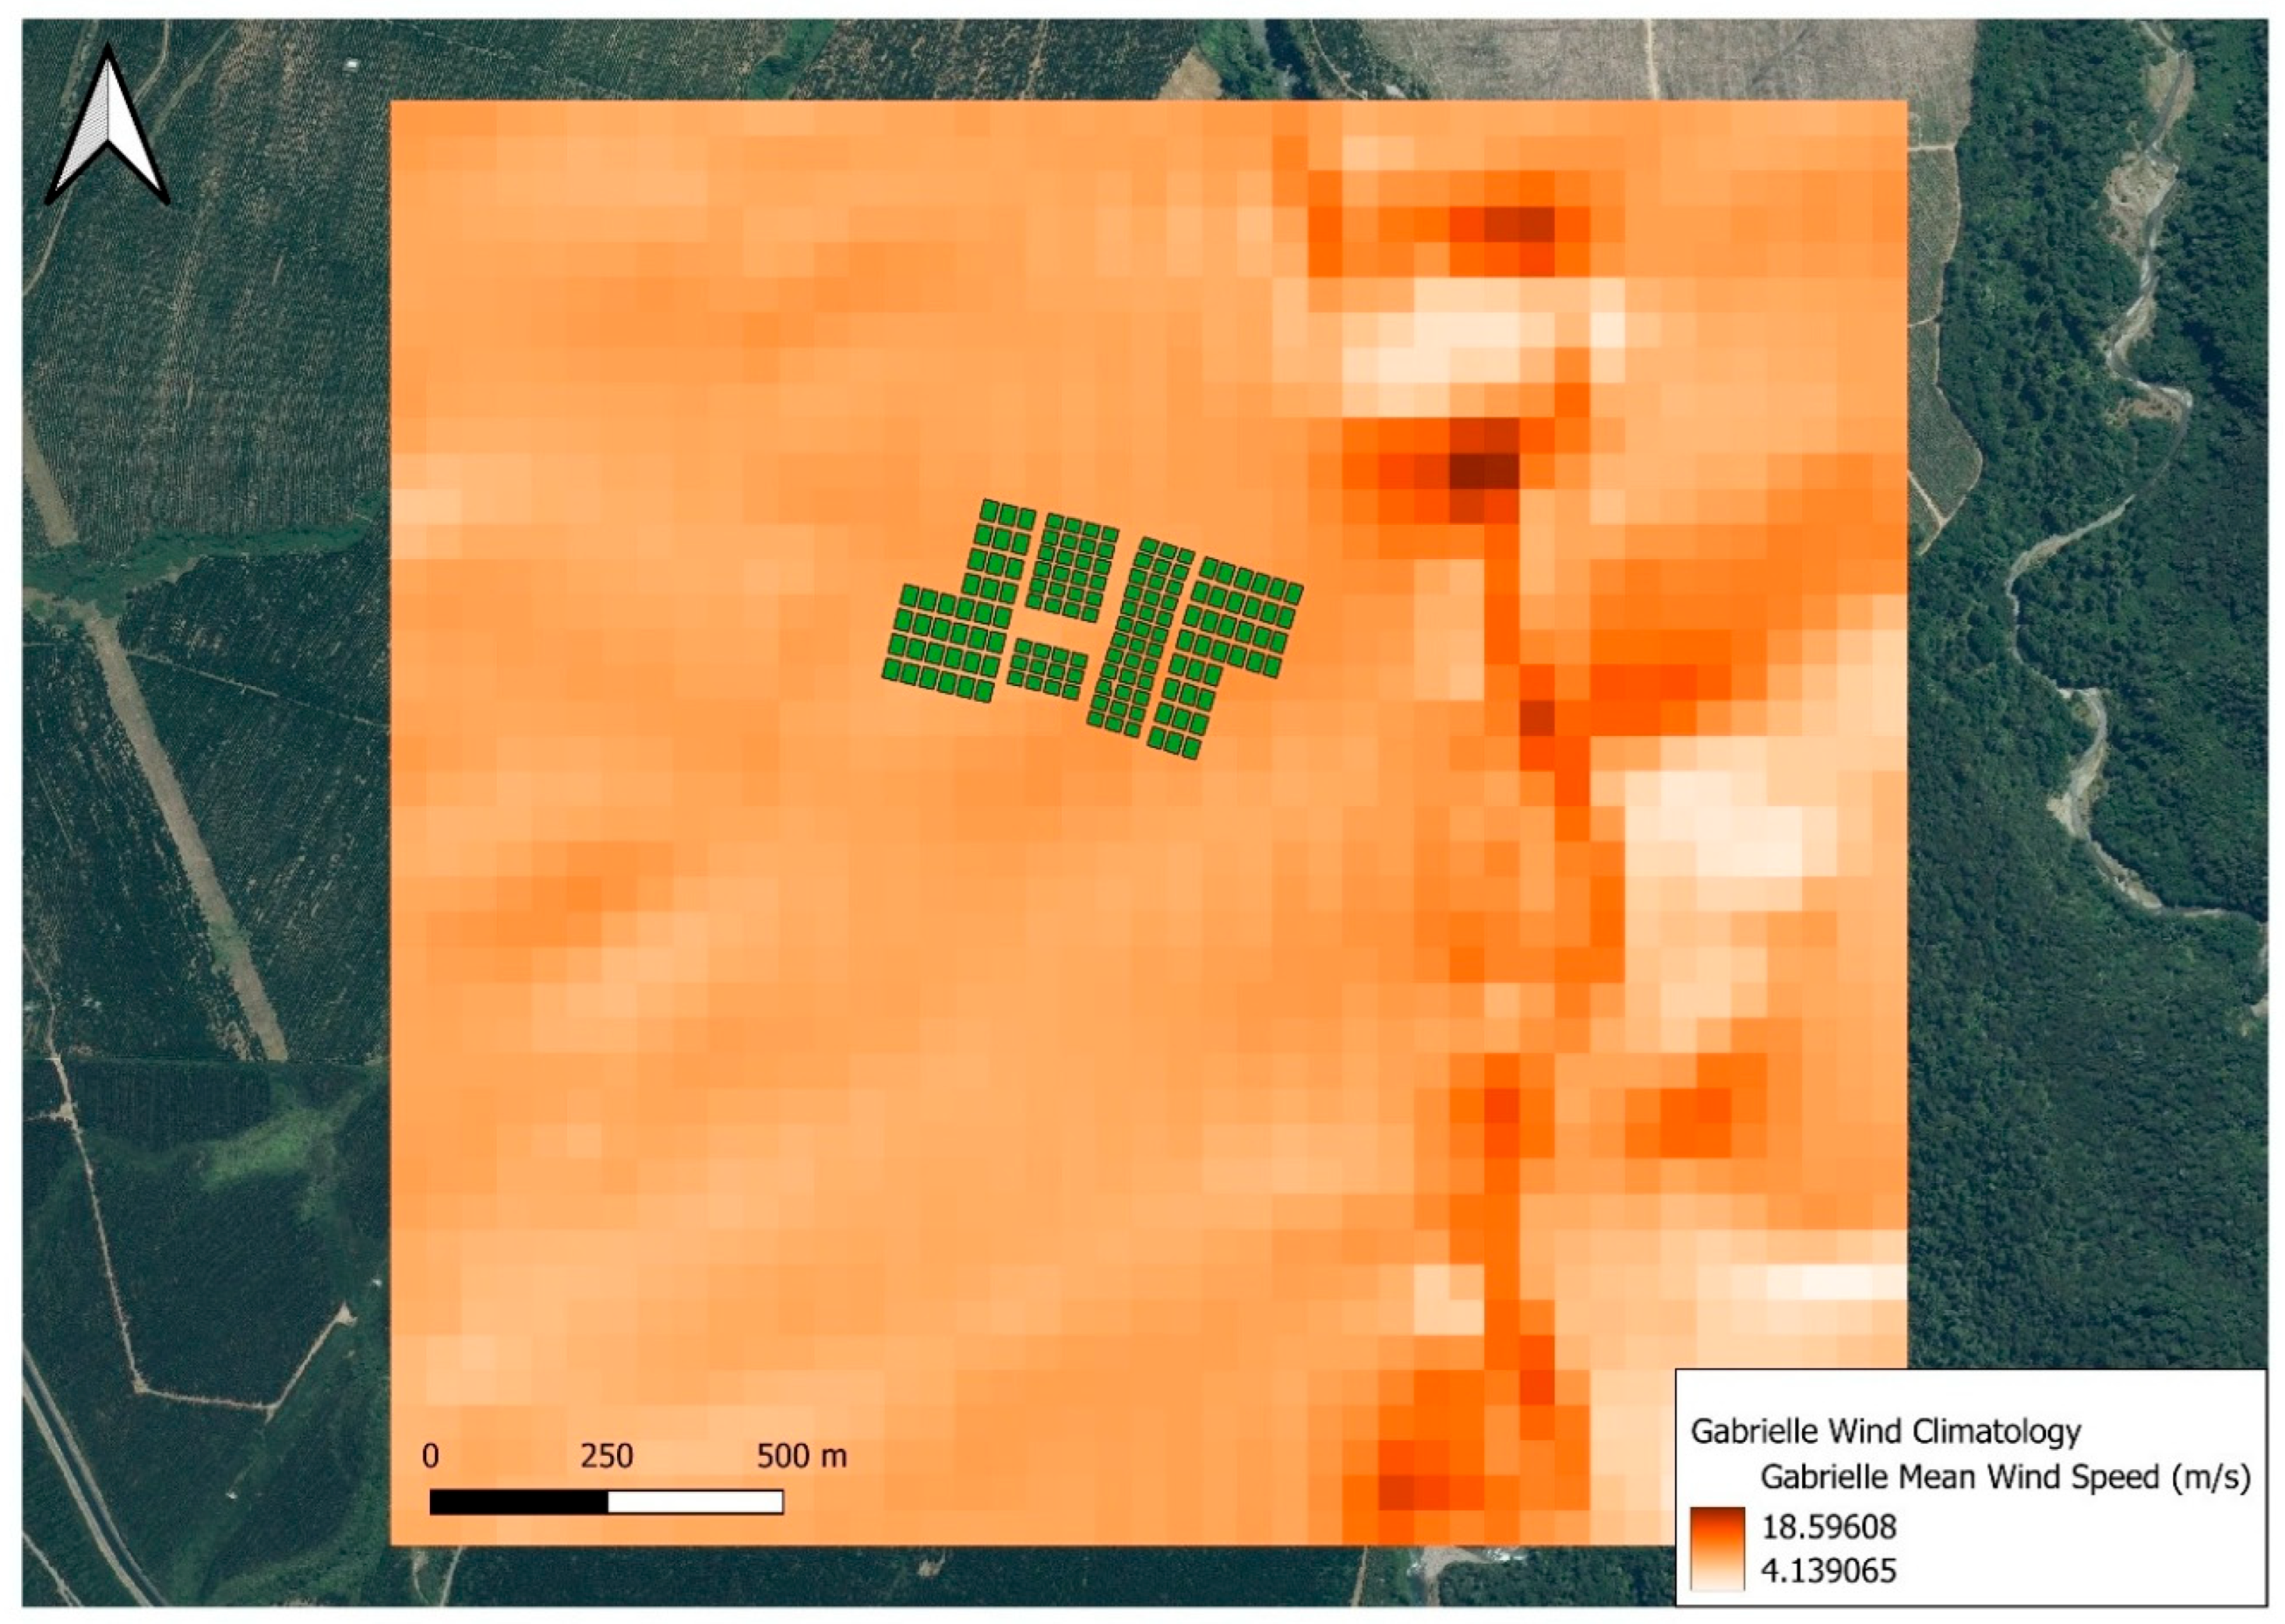
Figure A4.
Receiver operating characteristic (ROC) curves for validation of ForestGALES predictions of total wind damage (stem breakage and overturning) following Cyclone Gabrielle at the (A) individual-tree scale and (B) stand (plot) scale.
References
- Tamura, Y.; Cao, S. International Group for Wind-Related Disaster Risk Reduction (IG-WRDRR). J. Wind. Eng. Ind. Aerodyn. 2012, 104–106, 3–11. [Google Scholar] [CrossRef] [Scilit]
- Massey, C.; Leith, K.; Robinson, T.R.; Lukovic, B.; McColl, S.; Carey-Smith, T.; Rosser, B.; Wotherspoon, L.; Smith, H.; Betts, H.; et al. What Controlled the Occurrence of More than 116,000 Human-Mapped Landslides Triggered by Cyclone Gabrielle, New Zealand? Landslides 2025, 22, 3953–3972. [Google Scholar] [CrossRef] [Scilit]
- Hawke’s Bay Regional Recovery Agency. Te Matau-a-Māui Hawke’s Bay Regional Recovery Plan 2.0; Hawke’s Bay Regional Recovery Agency: Napier, New Zealand, 2023. [Google Scholar]
- Watt, M.S.; Holdaway, A.; Camarretta, N.; Locatelli, T.; Jayathunga, S.; Watt, P.; Tao, K.; Suárez, J.C. Mapping Windthrow Risk in Pinus Radiata Plantations Using Multi-Temporal LiDAR and Machine Learning: A Case Study of Cyclone Gabrielle, New Zealand. Remote Sens. 2025, 17, 1777. [Google Scholar] [CrossRef] [Scilit]
- Pearse, G.D.; Jayathunga, S.; Camarretta, N.; Palmer, M.E.; Steer, B.S.C.; Watt, M.S.; Watt, P.; Holdaway, A. Developing a Forest Description from Remote Sensing: Insights from New Zealand. Sci. Remote Sens. 2025, 11, 100183. [Google Scholar] [CrossRef] [Scilit]
- Quine, C.; Coutts, M.; Gardiner, B.; Pyatt, G. Forests and Wind: Management to Minimise Damage; Forestry Commission Bulletin 114; HMSO: London, UK, 1995. [Google Scholar]
- Gardiner, B.; Schuck, A.; Schelhaas, M.-J.; Orazlo, C.; Blennow, K.; Nicoll, B. Living with Storm Damage to Forests; European Forest Institute: Joensuu, Finland, 2013; ISBN 978-952-5980-09-7. [Google Scholar]
- Hale, S.E.; Gardiner, B.; Peace, A.; Nicoll, B.; Taylor, P.; Pizzirani, S. Comparison and Validation of Three Versions of a Forest Wind Risk Model. Environ. Model. Softw. 2015, 68, 27–41. [Google Scholar] [CrossRef] [Scilit]
- Gardiner, B. Wind Damage to Forests and Trees: A Review with an Emphasis on Planted and Managed Forests. J. For. Res. 2021, 26, 248–266. [Google Scholar] [CrossRef] [Scilit]
- Gardiner, B.; Byrne, K.; Hale, S.; Kamimura, K.; Mitchell, S.J.; Peltola, H.; Ruel, J.-C. A Review of Mechanistic Modelling of Wind Damage Risk to Forests. Forestry 2008, 81, 447–463. [Google Scholar] [CrossRef] [Scilit]
- Moore, J.; Gardiner, B.; Sellier, D. Tree Mechanics and Wind Loading. In Plant Biomechanics; Springer International Publishing: Cham, Switzerland, 2018; pp. 79–106. [Google Scholar]
- Duperat, M.; Gardiner, B.; Ruel, J.-C. Testing an Individual Tree Wind Damage Risk Model in a Naturally Regenerated Balsam Fir Stand: Potential Impact of Thinning on the Level of Risk. Forestry 2021, 94, 141–150. [Google Scholar] [CrossRef] [Scilit]
- Ruel, J.-C.; Meunier, S.; Quine, C.P.; Suarez, J. Estimating Windthrow Risk in Balsam Fir Stands with the ForestGales Model. For. Chron. 2000, 76, 329–337. [Google Scholar] [CrossRef] [Scilit]
- Hutabarat, G.I.; Prasetyo, A.; Gardiner, B.; Bajpai, K.; Grzeskowiak, V.; Duran, A.; Hidayati, F. Use of a Mechanistic Wind Damage Risk Model to Select Eucalyptus Clones Resistant to Stem Breakage and Uprooting in Tropical Plantations. For. Ecol. Manag. 2024, 569, 122167. [Google Scholar] [CrossRef] [Scilit]
- Kamimura, K.; Gardiner, B.; Kato, A.; Hiroshima, T.; Shiraishi, N. Developing a Decision Support Approach to Reduce Wind Damage Risk—A Case Study on Sugi (Cryptomeria japonica (L.f.) D.Don) Forests in Japan. Forestry 2008, 81, 429–445. [Google Scholar] [CrossRef] [Scilit]
- Gardiner, B.; Peltola, H.; Kellomäki, S. Comparison of Two Models for Predicting the Critical Wind Speeds Required to Damage Coniferous Trees. Ecol. Modell. 2000, 129, 1–23. [Google Scholar] [CrossRef] [Scilit]
- Gardiner, B.; Lorenz, R.; Hanewinkel, M.; Schmitz, B.; Bott, F.; Szymczak, S.; Frick, A.; Ulbrich, U. Predicting the Risk of Tree Fall onto Railway Lines. For. Ecol. Manag. 2024, 553, 121614. [Google Scholar] [CrossRef] [Scilit]
- Moore, J.R.; Watt, M.S. Modelling the Influence of Predicted Future Climate Change on the Risk of Wind Damage within New Zealand’s Planted Forests. Glob. Change Biol. 2015, 21, 3021–3035. [Google Scholar] [CrossRef] [Scilit]
- Silen, R.R.; Olson, D.L.; Weber, J.C. Genetic Variation in Susceptibility to Windthrow in Young Douglas-Fir. For. Ecol. Manag. 1993, 61, 17–28. [Google Scholar] [CrossRef] [Scilit]
- Merz, B.; Kuhlicke, C.; Kunz, M.; Pittore, M.; Babeyko, A.; Bresch, D.N.; Domeisen, D.I.V.; Feser, F.; Koszalka, I.; Kreibich, H.; et al. Impact Forecasting to Support Emergency Management of Natural Hazards. Rev. Geophys. 2020, 58, e2020RG000704. [Google Scholar] [CrossRef] [Scilit]
- Smaill, S.J.; Garrett, L.G.; Addison, S.L. Accelerator Trial Series in Pinus Radiata Stands in New Zealand: Trial Establishment, Site Description and Initial Soil, Forest Floor and Tree Data. Data Brief 2023, 47, 108991. [Google Scholar] [CrossRef] [Scilit]
- Watt, M.S.; Halstead, K.; Locatelli, T.; Camarretta, N.; Jayathunga, S.; Suárez, J.C. Genotypic and Silvicultural Controls on Wind Damage, Failure Mode, and Productivity in a Radiata Pine Trial Following Cyclone Gabrielle. Forests 2026, 17, 269. [Google Scholar] [CrossRef] [Scilit]
- Locatelli, T.; Gardiner, B.; Hale, S.; Nicoll, B. fgr: R Version of the ForestGALES Wind Risk Model; R Foundation for Statistical Computing: Vienna, Austria, 2021. [Google Scholar]
- Hewitt, A.E. New Zealand Soil Classification; Manaaki Whenua Press: Lincoln, New Zealand, 2010; ISBN 9780478347104. [Google Scholar]
- Soil Survey Staff. Keys to Soil Taxonomy; USDA Natural Resources Conservation Services: Washington, DC, USA, 2022. [Google Scholar]
- Rijkse, W.C. Soils of Taupo Region Interim Soil Maps and Legend; New Zealand Soil Bureau District Office: Rotorua, New Zealand, 1986. [Google Scholar]
- Roussel, J.-R.; Auty, D.; Coops, N.C.; Tompalski, P.; Goodbody, T.R.H.; Meador, A.S.; Bourdon, J.-F.; de Boissieu, F.; Achim, A. LidR: An R Package for Analysis of Airborne Laser Scanning (ALS) Data. Remote Sens. Environ. 2020, 251, 112061. [Google Scholar] [CrossRef] [Scilit]
- R Core Team. R: A Language and Environment for Statistical Computing; R Foundation for Statistical Computing: Vienna, Austria, 2022. [Google Scholar]
- Mortensen, N.G.; Heathfield, D.N.; Myllerup, L.; Landberg, L.; Rathmann, O. Getting Started with WAsP 9; Risø National Laboratory: Roskilde, Denmark, 2007. [Google Scholar]
- Mortensen, N.G.; Bowen, A.J.; Antoniou, I. WAsP Engineering 2001; Risø National Laboratory: Roskilde, Denmark, 2001. [Google Scholar]
- Astrup, P.; Larsen, S.E. WAsP Engineering Flow Model for Wind over Land and Sea; Risø National Laboratory: Roskilde, Denmark, 1999. [Google Scholar]
- Manaaki Whenua—Landcare Research. LCDB v5.0—Land Cover Database Version 5.0, Mainland New Zealand. 2020. Available online: https://lris.scinfo.org.nz/layer/104400-lcdb-v50-land-cover-database-version-50-mainland-new-zealand-deprecated/ (accessed on 20 January 2026).
- European Environment Agency. CORINE Land Cover (CLC)—Pan-European Land Cover Data for 1990–2018. 2019. Available online: https://land.copernicus.eu/en/products/corine-land-cover (accessed on 5 January 2026).
- Dörenkämper, M.; Olsen, B.T.; Witha, B.; Hahmann, A.N.; Davis, N.N.; Barcons, J.; Ezber, Y.; García-Bustamante, E.; González-Rouco, J.F.; Navarro, J.; et al. The Making of the New European Wind Atlas—Part 2: Production and Evaluation. Geosci. Model Dev. 2020, 13, 5079–5102. [Google Scholar] [CrossRef] [Scilit]
- Kininmonth, J.A.; Whitehouse, L.J. Properties and Uses of New Zealand Radiata Pine; Forest Research Institute with Assistance from the New Zealand Lottery Grants Board, New Zealand Ministry of Forestry: Rotorua, New Zealand, 1991; ISBN 0473011816. [Google Scholar]
- Bayne, K. Wood Quality Wood Quality Considerations for Radiata Pine in International Markets. N. Z. J. For. 2015, 59, 23–31. [Google Scholar]
- Watt, M.S.; Clinton, P.C.; Parfitt, R.L.; Ross, C.; Coker, G. Modelling the Influence of Site and Weed Competition on Juvenile Modulus of Elasticity in Pinus Radiata across Broad Environmental Gradients. For. Ecol. Manag. 2009, 258, 1479–1488. [Google Scholar] [CrossRef] [Scilit]
- Robin, X.; Turck, N.; Hainard, A.; Tiberti, N.; Lisacek, F.; Sanchez, J.-C.; Müller, M. PROC: An Open-Source Package for R and S+ to Analyze and Compare ROC Curves. BMC Bioinform. 2011, 12, 77. [Google Scholar] [CrossRef] [Scilit]
- Hosmer, D.W.; Lemeshow, S.; Sturdivant, R.X. Applied Logistic Regression; Wiley: Hoboken, NJ, USA, 2013; ISBN 9780470582473. [Google Scholar]
- Quine, C.P.; White, I.M.S. Using the relationship between rate of tatter and topographic variables to predict site windiness in upland Britain. Forestry 1994, 67, 245. [Google Scholar] [CrossRef] [Scilit]
- Quine, C.P.; Gardiner, B.A. Understanding How the Interaction of Wind and Trees Results in Windthrow, Stem Breakage, and Canopy Gap Formation. In Plant Disturbance Ecology; Elsevier: Amsterdam, The Netherlands, 2007; pp. 103–155. [Google Scholar]
- Costa, M.; Gardiner, B.; Locatelli, T.; Marchi, L.; Marchi, N.; Lingua, E. Evaluating Wind Damage Vulnerability in the Alps: A New Wind Risk Model Parametrisation. Agric. For. Meteorol. 2023, 341, 109660. [Google Scholar] [CrossRef] [Scilit]
- Watt, M.S.; Moore, J.R. Modeling Spatial Variation in Radiata Pine Slenderness (Height/Diameter Ratio) and Vulnerability to Wind Damage under Current and Future Climate in New Zealand. Front. For. Glob. Change 2023, 6, 1188094. [Google Scholar] [CrossRef] [Scilit]
- Mayer, H. Wind-Induced Tree Sways. Trees 1987, 1, 195–206. [Google Scholar] [CrossRef] [Scilit]
- Panferov, O.; Sogachev, A. Influence of Gap Size on Wind Damage Variables in a Forest. Agric. For. Meteorol. 2008, 148, 1869–1881. [Google Scholar] [CrossRef] [Scilit]
- Quine, C.P.; Gardiner, B.A.; Moore, J. Wind Disturbance in Forests: The Process of Wind Created Gaps, Tree Overturning, and Stem Breakage. In Plant Disturbance Ecology; Elsevier: Amsterdam, The Netherlands, 2021; pp. 117–184. [Google Scholar]
- Valinger, E.; Fridman, J. Models to Assess the Risk of Snow and Wind Damage in Pine, Spruce, and Birch Forests in Sweden. Environ. Manag. 1999, 24, 209–217. [Google Scholar] [CrossRef] [Scilit] [PubMed]
- Peltola, H.; Kellomäki, S.; Väisänen, H.; Ikonen, V.-P. A Mechanistic Model for Assessing the Risk of Wind and Snow Damage to Single Trees and Stands of Scots Pine, Norway Spruce, and Birch. Can. J. For. Res. 1999, 29, 647–661. [Google Scholar] [CrossRef]
- Martin, T.J.; Ogden, J. Wind Damage and Response in New Zealand Forests: A Review. N. Z. J. Ecol. 2006, 30, 295–310. [Google Scholar]
- Mason, R.G. Causes of Juvenile Instability of Pinus Radiata in New Zealand. N. Z. J. For. Sci. 1985, 15, 163–280. [Google Scholar]
- Locatelli, T.; Tarantola, S.; Gardiner, B.; Patenaude, G. Variance-Based Sensitivity Analysis of a Wind Risk Model—Model Behaviour and Lessons for Forest Modelling. Environ. Model. Softw. 2017, 87, 84–109. [Google Scholar] [CrossRef] [Scilit]
- Elankumaran, B.; de Graaf, K.L.; Orense, R.P. Understanding the Geotechnical Behaviour of Pumiceous Soil: A Review. Geotechnics 2024, 4, 1189–1227. [Google Scholar] [CrossRef] [Scilit]
- McIvor, I. Influence of Soil Type on Root Development and Above-and below-Ground Biomass of 1-3 Year-Old Populus Deltoides × Nigra Grown from Poles. Int. J. Environ. Sci. Nat. Resour. 2020, 24, 556138. [Google Scholar] [CrossRef] [Scilit]
- Moore, J.R. Differences in Maximum Resistive Bending Moments of Pinus Radiata Trees Grown on a Range of Soil Types. For. Ecol. Manag. 2000, 135, 63–71. [Google Scholar] [CrossRef] [Scilit]
- Telewski, F.W. A Unified Hypothesis of Mechanoperception in Plants. Am. J. Bot. 2006, 93, 1466–1476. [Google Scholar] [CrossRef] [Scilit]
- Nicoll, B.C.; Connolly, T.; Gardiner, B.A. Changes in Spruce Growth and Biomass Allocation Following Thinning and Guying Treatments. Forests 2019, 10, 253. [Google Scholar] [CrossRef] [Scilit]
- Gardiner, B.A.; Stacey, G.R.; Belcher, R.E.; Wood, C.J. Field and Wind Tunnel Assessments of the Implications of Respacing and Thinning for Tree Stability. Forestry 1997, 70, 233–252. [Google Scholar] [CrossRef] [Scilit]
- Gibbs, J.N.; Greig, B.J.W. Survey of parkland trees after the great storm of October 16, 1987. Arboric. J. 1990, 14, 321–347. [Google Scholar] [CrossRef] [Scilit]
- Halstead, K.; Gaulton, R.; Sanderson, R.; Suggitt, A.; Quine, C. Localised Damage Patterns to Oak during Severe UK Storms in Winter 2021. For. Ecol. Manag. 2024, 562, 121942. [Google Scholar] [CrossRef] [Scilit]
- Mitchell, S.J. Wind as a Natural Disturbance Agent in Forests: A Synthesis. Forestry 2013, 86, 147–157. [Google Scholar] [CrossRef] [Scilit]
- Fransson, P.; Brännström, Å.; Franklin, O. A Tree’s Quest for Light—Optimal Height and Diameter Growth under a Shading Canopy. Tree Physiol. 2021, 41, 1–11. [Google Scholar] [CrossRef] [Scilit]
- Calders, K.; Verbeeck, H.; Burt, A.; Origo, N.; Nightingale, J.; Malhi, Y.; Wilkes, P.; Raumonen, P.; Bunce, R.G.H.; Disney, M. Laser Scanning Reveals Potential Underestimation of Biomass Carbon in Temperate Forest. Ecol. Solut. Evid. 2022, 3, e12197. [Google Scholar] [CrossRef] [Scilit]
- Fourcaud, T.; Ji, J.-N.; Zhang, Z.-Q.; Stokes, A. Understanding the Impact of Root Morphology on Overturning Mechanisms: A Modelling Approach. Ann. Bot. 2007, 101, 1267–1280. [Google Scholar] [CrossRef] [Scilit] [PubMed]
- Liu, S.; Ji, X.; Zhang, X. Effects of Soil Properties and Tree Species on Root–Soil Anchorage Characteristics. Sustainability 2022, 14, 7770. [Google Scholar] [CrossRef] [Scilit]

Disclaimer/Publisher’s Note: The statements, opinions and data contained in all publications are solely those of the individual author(s) and contributor(s) and not of MDPI and/or the editor(s). MDPI and/or the editor(s) disclaim responsibility for any injury to people or property resulting from any ideas, methods, instructions or products referred to in the content. |
© 2026 by the authors. Licensee MDPI, Basel, Switzerland. This article is an open access article distributed under the terms and conditions of the Creative Commons Attribution (CC BY) license.