


Abstract
This study presents a fire risk prediction framework applied to two conservation units within the Atlantic Forest biome (AFb): Serra da Gandarela National Park (PNSG), Minas Gerais, and Campos de Palmas Wildlife Refuge (RVSCP), Paraná. Daily climate data (2001–2023), remote sensing vegetation indices Normalized Difference Vegetation Index (NDVI) and Normalized Multi Band Drought Index (NMDI), fire foci, and estimates of soil volumetric moisture were integrated to analyze the climatic and environmental drivers of fire occurrence and to develop predictive models. Sea Surface Temperature (SST) anomalies in the Niño 3.4 region revealed the influence of El Niño–Southern Oscillation (ENSO) variability on local hydrometeorological dynamics. Vegetation indices and soil moisture data reinforced this relationship, with NMDI values below 0.4 and sharp declines in volumetric moisture indicating water stress during the dry season. Kernel density maps identified clusters of fire foci during this period, confirming the strong seasonality of fire occurrence. Based on climatic predictors and environmental indicators, fire risk indices were developed for each conservation unit and validated using independent data. Model performance showed moderate explanatory capacity, with coefficients of determination ranging from 0.53 to 0.68 and high agreement between estimated and observed values. Validation stratified by ENSO phases (Neutral, El Niño, and La Niña) demonstrated stable performance across contrasting climatic regimes, indicating temporal resilience of the modeling framework. Overall, the integration of climate data, spectral indices, and soil moisture information improves the ability to anticipate fire risk in Atlantic Forest conservation units, providing a useful tool to support prevention, monitoring, and decision-making in protected areas.
1. Introduction
Wildfires are one of the most devastating sources of environmental disturbance known, as they are a complex phenomenon, difficult to extinguish, predict, and model, since they are generated by the interaction of factors such as local climatic conditions, land use, and vegetation [1,2], leading to enormous financial and environmental losses for society [3].
The susceptibility to wildfires has increased due to the interaction between climate change and anthropogenic factors, such as land cover change and urbanization, which influence the availability of fuel (biomass, soil, and moisture) [4,5,6,7]. Extreme meteorological conditions, such as high air, soil, and ocean temperatures, scarce rainfall, and low relative humidity, as well as large-scale climate phenomena, particularly the ENSO, play a central role in modulating these conditions [8]. El Niño phases are typically associated with reduced rainfall and higher temperatures in many regions of South America, increasing drought severity and fire risk. In contrast, La Niña phases can alter precipitation and atmospheric circulation patterns in ways that also influence fuel moisture and fire dynamics, depending on the regional context [9].
Driven by urban and economic development pressures, the Atlantic Forest Biome (AFB) has been transformed into a mosaic of “islets” of vegetation amid a mixture of degraded areas, pastures, forests, agricultural lands, and urban areas [10]. Despite the severe loss of forest cover, the biome is part of a group of 34 regions with high richness of endemic species, known as fire foci [11,12].
The prevalence of fire events directly impacts the balance of forest ecosystems, influencing plant growth, vegetation succession dynamics, and landscape fragmentation [13], while affecting ecosystem services, economic potential, and nutrient and organic matter cycling processes [14], especially in fragmented and weakened environments such as the AFB [15].
The increase in fire records is linked to the growth of human activity and the reduction in forest cover, making the relationship between Atlantic Forest fragmentation and fire synergistic. This has resulted in an increase in fire frequency [16,17], causing the local loss of medium- and large-sized plant and animal species [18], due to high fragmentation, native vegetation degradation, and wildfires.
The concentration of these fires in the dry season is increasing in the AFb, especially in Minas Gerais [19], becoming more frequent. As fire fragments ecosystems, the concern of forest management and protection sectors grows, since uncontrolled fire incidence causes environmental damage and losses, affects human health, marginalized communities, and Indigenous peoples [20,21]
The scenario is even more alarming for conservation units (CUs), which face wildfires as a continuous threat, especially protected areas whose main role is the preservation of natural resources in forest remnants [22], and which suffer more from being fragmented and sometimes permeated by land uses that do not prioritize conservation. Failures in the protection of these areas arise from the lack of enforcement, especially where protection coexists with different types of land use, ownership, and management [23], as well as from access difficulties and shortages of financial and human resources.
Given the numerous factors that contribute to the occurrence of wildfires (climate, topography, anthropogenic action, among others), their prediction is challenging, and in this sense, the use of predictive tools for fire control has become increasingly necessary as a way to mitigate fire effects and assist forest management and decision-making in Brazil [24,25,26].
Considering the current scenario, in which climate change amplifies wildfire occurrences and conservation units have been losing area to non-forest land uses, it is increasingly imperative to implement more accurate models that use local daily information, such as that obtained through geotechnologies [27,28], which provide more precise detail.
Numerous fire prediction and risk assessment models have been applied worldwide, ranging from empirical and statistical approaches to physically based and machine learning models, integrating climatic, topographic, and vegetation variables at multiple spatial and temporal scales [28]. However, despite these advances, significant gaps remain in adapting such models to specific regional contexts, particularly in biodiverse and climate-sensitive biomes such as the Atlantic Forest [29]. Therefore, expanding the application of multi-attribute, data-driven frameworks that incorporate local meteorological dynamics, remote sensing products, and global climate forcings represents a crucial step toward improving early warning systems and strengthening fire prevention policies in conservation areas.
In this context, the following research questions are addressed: (i) what are the main climatic and anthropogenic factors influencing wildfire occurrence? (ii) in what ways can the integration of climate data and geotechnologies contribute to the construction of a predictive model? (iii) to what extent can such a model provide a tool to support management, prevention, and response to fires in protected areas.
Thus, this study develops and evaluates an integrated wildfire risk prediction framework for conservation units of the Atlantic Forest by combining daily meteorological data, remote sensing-derived vegetation and moisture indices, established Brazilian fire risk indicators, and geospatial analysis tools to capture both local conditions and large-scale climate variability, including ENSO influences. Multivariate statistical analyses and performance metrics (e.g., correlation and determination coefficients) are applied to assess index behavior and validate predictive performance. Unlike approaches that rely on isolated spectral indicators or generic fire models, this regionally adapted, multi-attribute framework integrates climatic and vegetation dynamics within a unified structure, providing new evidence on seasonal fire controls in fragmented tropical forests and strengthening early-warning and management strategies in protected areas.
2. Materials and Methods
2.1. Study Area
The study areas were selected for a more faithful representation of the ecological and environmental diversity of the Atlantic Forest biome (AFb) in Brazil, characterized by strong heterogeneity in relief, climate, and vegetation formations. For this purpose, two conservation units located in different regions of the biome were selected, the first is the Serra da Gandarela National Park (PNSG) 20°09′ S and 43°37′ W, which covers an area of 312,000 km2 and is located in the southern portion of the Espinhaço Range, in the Quadrilátero Ferrífero region of Minas Gerais state [28] (Figure 1). The park has a Cwa climate (humid subtropical), characterized by wet summers and dry winters, with an average annual rainfall ranging from 1300 mm to 1400 mm [30]. The second study site is the Campos de Palmas Wildlife Refuge (RVSCP), 26°33′ S and 26°20′ S in latitude and 51°20′ W and 51°43′ W in longitude, which covers an area of 166 km2 and is located in the natural grassland region of Paraná state, bordering Santa Catarina (Figure 1). This area is classified as Cfb climate (humid subtropical), with mild winters and cool summers [31].
Figure 1.
Geographical location of the two conservation units studied in the Atlantic Forest biome: the Serra da Gandarela National Park (PNSG), (a) in Minas Gerais, and the Campos de Palmas Wildlife Refuge (RVSCP), (b) in Paraná.
2.2. Data and Methods
2.2.1. Meteorological Data and Soil Moisture
To feed the fire risk prediction model and characterize the climatic regime of the study areas, daily data of the following meteorological variables were used: mean and maximum air temperature (°C), precipitation (mm), wind speed (m s−1), and relative humidity of the air (%), covering the period from January 2001 to December 2023. The information, with a spatial resolution of 0.1° × 0.1°, was obtained from the database provided by [32], which encompasses the entire Brazilian territory. The values were extracted and processed in RStudio version 4.5.2 [33] using custom scripts, which generated 1 km × 1 km grids for the area of interest.
It is important to note that the predictive regression models developed in this study were calibrated exclusively using climatic variables available at a spatial resolution of 0.1° × 0.1°. Variables derived from other spatial resolutions, such as Volumetric Soil Moisture (0.25°) and indices derived from the Moderate Resolution Imaging Spectroradiometer (MODIS), were not included as predictors in the regression modeling process. Consequently, no predictors with differing spatial resolutions were incorporated into the model calibration.
Furthermore, in this study, soil moisture behavior was evaluated using the Volumetric Soil Moisture (VSM) variable (m3 m−3), derived from the combination of active and passive sensors, with a monthly temporal resolution and a spatial resolution of 0.25° × 0.25°. Data covering the period from 2001 to 2022 were obtained from the Climate Data Record (CDR) repository available on the Copernicus Data Store platform, while data for 2023 were extracted from the Intermediate Climate Data Record (ICDR) repository due to an update on the platform. The files were provided in NetCDF format and processed in RStudio version 4.5.2 [33].
2.2.2. Remote Sensing and Spectral Indices
To assess the condition of local vegetation, spectral indices were used, such as the Normalized Multi-Band Drought Index (NMDI) [34], which was applied and tested in the state of Rio de Janeiro by [35]. This index is capable of detecting fire foci and monitoring vegetation moisture conditions through orbital imagery [36]. The classification is presented in Table 1, and the NMDI is described in Equation (1).
where R0.86 µm (NIR), R1.64 µm (SWIR1), and R2.13 (SWIR2) µm denote the apparent reflectance measured by the satellite sensor (MODIS) in the spectral bands centered at 0.86 µm, 1.64 µm, and 2.13 µm, respectively [35].
Table 1.
Value ranges and respective classes of the NMDI used to characterize vegetation moisture conditions.
The data were obtained from the (MODIS) sensor. For the calculation of NMDI, images from the MOD09A1 product were used, accessed through scripts developed in RStudio version 4.5.2 [33] using the MODIS Tools library. A spatial subset composed of four tiles covering the two study areas was applied, resulting in an average of 16 scenes per month.
The Normalized Difference Vegetation Index (NDVI) was also employed, which enables the assessment of vegetation vitality and canopy density [36]. Widely used in environmental studies, NDVI values range from −1 to +1, where values close to −1 indicate water bodies, those near 0 indicate little or no vegetation, and values approaching +1 indicate high plant density and vigor [37,38,39] (Equation (2)).
where NIR represents the near infrared band (0.75–0.90 µm) and R the red band (0.63–0.70 µm).
The monthly mosaic, generated by merging the four scenes into a single image, was produced using the HEG (HDF-EOS to GeoTIFF) conversion to convert satellite data into GEOTIFF, version 2.15, available at (https://wiki.earthdata.nasa.gov/display/DAS/Downloads, accessed on 7 August 2024). From the monthly rasters, NMDI values (Equation (1)) and NDVI (Equation (2)) were extracted using 1 km × 1 km grid cells and organized into .csv files for the study areas.
To quantify fire foci by land use and land cover (LULC) data from the Annual Land Use and Land Cover Mapping Series of Brazil (Collection 9), provided by the MapBiomas Project, was used. Images with a spatial resolution of 30 m × 30 m were selected [40], covering the time series from January 2001 to December 2023.
The download of land use and land cover rasters was performed using the toolkit. mapbiomas on the free Google Earth Engine (GEE) platform, which allows the user to select area, year, and data type [40]. After download, the rasters were converted into vectors in QGIS (QGIS 2024) version 3.44, and the classes were dissolved to facilitate analysis. The vectors with dissolved classes were then used for counting fire foci by land use.
For this analysis, daily fire foci data for the period 2001–2023 were used in shapefile format, obtained from the MCD14ML product of the Fire Information for Resource Management System (FIRMS), accessible at (https://firms.modaps.eosdis.nasa.gov/map/, accessed on 7 August 2024). The fire foci data assessed in this study were obtained from the NASA FIRMS platform (https://firms.modaps.eosdis.nasa.gov/, accessed on 7 August 2024). The datasets used correspond to MODIS sensor detections from the TERRA and AQUA satellites, with daily temporal resolution and 1 km × 1 km spatial resolution [41,42].
Data processing was carried out in QGIS version 3.44, where the shapefiles were clipped to the study areas. Fire foci were then counted and organized in spreadsheets, and further statistical analyses and graphical outputs were performed in RStudio version 4.5.2 [33].
2.3. Methods
2.3.1. Modeling and Statistical Analysis
To spatially visualize the fire foci in the years identified as significant by the Pettitt test, maps of fire foci distribution were created for the PNSG and RVSCP. This period was selected since the data from these years showed that fire foci occurred exclusively during the dry season in both regions. The maps were generated using the Kernel Density Estimator (Equation (3)) [43], which represents the point intensity of a given phenomenon and indicates the spatial extent (radius) of its influence [44]. For representation, a radius of 350 m and a pixel size of 100 m were adopted.
where n represents the total number of observations, b the smoothing parameter (bandwidth), p the coordinate vector indicating where the function is being estimated, oᵢ the coordinate vector representing each observation, and K the density function that satisfies the condition given by Equation (4).
In addition, spatial interpolation of meteorological data on precipitation and air temperature was carried out in the two study areas using the IDW (Inverse Distance Weighting) method, to represent the spatial variation in these variables during the dry and rainy seasons. The interpolation was carried out by selecting representative points from the study areas using QGIS, version 3.44. Points scattered throughout the area were selected whose values were consistent with those verified for the period at the site.
The Modified Monte Alegre Formula (FMA+) [45] is a cumulative fire risk index that uses the following meteorological variables: relative air humidity (%), precipitation (considered as the number of days with precipitation ≤ 13.0 mm), and wind speed (m s−1). For the calculation of FMA+, as well as for the model, it was necessary to estimate relative air humidity at 1:00 p.m. To do this, the actual water vapor pressure was calculated based on the minimum air temperature (ea = esTmin, kPa) (Equation (5)), as proposed by FAO 56 [46] and also following the methodology adopted by [29] in Itatiaia National Park.
where represents the actual water vapor pressure calculated from saturation pressure (kPa), the saturation vapor pressure calculated from the mean temperature of BR-DWGD (kPa).
The saturation vapor pressure of the air was estimated from air temperature using BR-DWG (Brazilian Daily Gridded Weather Data) obtained from [32] (Equation (6)). After that, relative air humidity was estimated following the approach proposed by [47] (Equations (7) and (8)).
where the relative humidity estimated from the actual water vapor pressure calculated from saturation pressure (Equations (5) and (6)) (%), and = Relative humidity estimated for 1:00 p.m. (%).
With the aid of the Sisclass FMA+ spreadsheet [48], available at https://www.mundogeomatica.com/sisclassfma.htm, accessed on 22 April 2026, the index is calculated from meteorological variables and the record of fire occurrence or non-occurrence on the day. According to the methodology, the FMA+ index has two classifications, one proposed by [49] and another by [45]. This study adopted the most recent, dynamic, and more regionally precise classification, suggested by [49], which includes five classes (Table 2).
Table 2.
Value ranges used for the classification of FMA+ index classes.
Since its development, the FMA+ index has been widely used in environmental studies and research in Brazil. Notable examples include [20,29,49], who tested the efficiency of fire risk indices, including FMA+, and confirmed its greater sensitivity to forest fires, reporting success rates above 60% [50,51].
To evaluate fire dynamics in the study areas, multiple linear regression models were developed using FMA+ as the dependent variable and meteorological variables, including precipitation (mm), mean and maximum air temperature (°C), relative humidity at 1:00 p.m. (%), and wind speed (m s−1), as predictors. Thus, the modeling framework aims to statistically estimate daily fire danger levels rather than directly predict fire occurrence.
In the initial phases of the study, four modeling approaches were evaluated: Linear Regression (LR), Transformed Linear Regression (TLR), Random Forest (RF), and the Generalized Additive Model (GAM). Model performance was assessed using independent validation data through three statistical metrics: the coefficient of determination (R2), the root mean square error (RMSE), and Willmott’s index of agreement (d2). Higher values of R2 and d2 indicate better model performance, whereas lower RMSE values indicate smaller prediction errors.
The evaluation was conducted considering both the overall validation period (January 2001 to December 2023) and specific phases of the El Niño-Southern Oscillation (ENSO), including Neutral conditions (2012–2013), El Niño conditions (2015–2016), and La Niña conditions (2021–2022). This approach allowed the robustness of each model to be assessed under distinct climatic conditions and different large-scale climate variability scenarios (Table 3).
Table 3.
Model performance at the PNSG and RVSCP sites considering global validation and ENSO phases (Neutral = N, El Niño = EL, and La Niña = LA) for the period January 2001 to December 2023. Values for ENSO phases are presented as N/EL/LA. The evaluated models include Linear Regression (LR), Transformed Linear Regression (TLR), Random Forest (RF), and Generalized Additive Model (GAM). Bold values indicate the best-performing model.
Data were processed in R [52] using RStudio version 4.5.2 [33]. All predictors used in the regression models were derived from the same climatic dataset with a spatial resolution of 0.1°, as described in Section 2.2.1. No variables with different spatial resolutions were included in the model calibration, ensuring spatial scale consistency among the predictors.
The script followed a structure in which the existence of NA (No data) values was verified using the dplyr library, and collinearity was checked with the aid of the olsrr library. 70% of the data was allocated for model training and 30% for testing predictive performance.
To avoid issues with negative values, reduce skewness, and mitigate the influence of outliers, a logarithmic function was applied to transform the FMA+ data. This transformation was performed for both the PNSG and RVSCP areas. The global equation of the models is given by:
where represents the logarithmic function applied to the FMA+ values, , , , … the regression coefficients, and the mean and maximum air temperature (°C), the relative humidity at 1:00 p.m. (%), the precipitation (mm), and the wind speed (m s−1).
The resulting indices represent statistically estimated fire danger conditions suitable for operational risk assessment and early-warning applications. For model validation, independent yearly subsets representing distinct ENSO phases were used. Specifically, validation was conducted for Neutral conditions (2012–2013), El Niño conditions (2015–2016), and La Niña conditions (2021–2022). The regression equations were applied separately to each subset, generating daily predicted values of the Risk Index of Serra da Gandarela National Park (IRIPNSG) and Risk Index of Campos de Palmas Wildlife Refuge (IRIRVSCP). Negative values returned by the model were corrected to 0 (zero), which represents the minimum value in the risk classification of each index. The resulting indices represent statistically estimated fire danger conditions suitable for operational risk assessment and early-warning applications under contrasting climatic regimes. The models proposed in this study are divided into five risk classes, as described in Table 4.
Table 4.
Fire risk classes are defined by the Risk Index of Serra da Gandarela National Park (IRIPNSG) and the Risk Index of Campos de Palmas Wildlife Refuge (IRIRVSCP).
Descriptive statistics were used, with results graphically represented through boxplots. To identify the existence of significant trends in the NDVI, NMDI, and Soil Moisture (VSM) data series, the non-parametric Mann–Kendall (MK) test [53,54] was applied. For this purpose, the data were tabulated and structured to be analyzed using scripts in RStudio version 4.5.2 [33] with the Kendall library. To evaluate the model’s performance, statistical metrics and tests were applied, including (Equation (10)) RMSE, the Coefficient of Determination (Equation (11)), and Willmott’s Index of Agreement (d) [55] (Equation (12)), in addition to graphical analyses.
where represents the variable, the number of non-missing data points, the observed value, the mean of observed values, and the predicted values.
2.3.2. Atmospheric and Oceanic Oscillation
To identify significant changes in the time series, the Pettitt test [56] was applied to the fire foci series for the PNSG and RVSCP study areas.
Based on the results, an investigation of large-scale climate variables with potential relationships to the observed patterns was conducted. Sea Surface Temperature (SST) data and the Niño 3.4 index were used, obtained from the NOAA (National Oceanic and Atmospheric Administration) Optimum Interpolation Sea Surface Temperature V2 High Resolution (OISSTv2) product, made available by the NOAA Physical Sciences Laboratory (NOAA PSL) at: https://psl.noaa.gov/data/gridded/data.noaa.oisst.v2.highres.html, accessed on 23 September 2025.
The SST analysis focused on the Niño 3.4 region (5° S–5° N; 170° W–120° W), using climatologies for 1981–2010 and 1991–2020, in addition to the years 2015 and 2018. The data were pre-processed in R, converted from Kelvin to °C, standardized on a spatial grid, and clipped to the area of interest. The climatologies were compared based on monthly and annual differences defined by:
where represents the monthly mean for month “m” during the 1991–2020 period; represents the monthly mean for month “m” during the 1981–2010 period.
where is the mean of the monthly differences over all 12 months of the year.
The anomalies for the years 2015 and 2018 relative to the climatology were estimated using the following expressions:
where = is the mean sea surface temperature in month “m” of year “y” (y = 2015 and 2018).
Finally, the direct comparison between the two years was obtained by:
where = represents the difference in SST in month “m” between 2015 and 2018.
These calculations were aggregated into monthly, seasonal (DJF, MAM, JJA, SON), and annual means, allowing the quantification of differences between climatologies, the identification of marked anomalies in 2015 and 2018, and the evaluation of direct contrasts between the two years on monthly and seasonal scales.
Additionally, surface atmospheric pressure data were used, obtained from the ERA5-Land reanalysis (monthly averaged data from 1950 to present), generated by combining atmospheric observations (satellites and weather stations) with numerical weather prediction models through data assimilation techniques derived from the ERA5 atmospheric reanalysis, made available by the Copernicus Climate Data Store (CDS) at: https://cds.climate.copernicus.eu/datasets/reanalysis-era5-land-monthly-means?tab=overview, accessed on 18 December 2024. Only the years 2015 and 2018 were considered, with monthly pressure values converted from Pascal (Pa) to hectoPascal (hPa). Preprocessing included reading the NetCDF files and spatial clipping to the Brazilian territory.
Subsequently, monthly mean pressure values were extracted for the two study areas (RVSCP and PNSG). The visualization of the results involved producing faceted monthly maps representing the spatial distribution of pressure, as well as constructing monthly time series for each area, including smoothing using Locally Estimated Scatterplot Smoothing (LOESS) regression and the identification of extreme values (maximum and minimum). This workflow was applied separately for the years 2015 and 2018, enabling comparative analyses between the two annual series.
3. Results
3.1. Climatic Variables
Precipitation distribution in the RVSCP occurs relatively uniformly throughout the year, with a difference of less than 50 mm between the mean values of the wet and dry seasons. The wet season, extending from October to March, shows an average precipitation of 176 mm (Figure 2a), while the dry season, from April to September, records an average of 130.0 mm (Figure 2b).
Figure 2.
Spatial distribution of precipitation in the Campos de Palmas Wildlife Refuge, highlighting (a) the wet season and (b) the dry season, and in the Serra da Gandarela National Park, highlighting (c) the wet season and (d) the dry season.
The spatial rainfall data indicate that the PNSG is located in a region characterized by a seasonal rainfall regime, with a wet season between October and March, when mean precipitation reaches 228.5 mm (Figure 2c), and a dry season from April to August, with an average of 31.0 mm (Figure 2d).
The precipitation spatial distributions shown in Figure 2 were generated using Inverse Distance Weighting (IDW) interpolation. The resulting maps show smooth spatial gradients with radial patterns located around the observation points. Such patterns are commonly associated with the interpolation process, since IDW estimates values based on the distance from the nearest points. Therefore, the spatial distribution in the figures shows an approximation of the precipitation variability in the study areas.
In the RVSCP, air temperature behavior allows the distinction of two well-defined seasons: summer, from October to March, with a mean temperature of 19.0 °C (Figure 3a), and winter, from April to September, with a mean of 13.0 °C (Figure 3b).
Figure 3.
Spatial distribution of mean air temperature in the Campos de Palmas Wildlife Refuge, considering (a) summer and (b) winter, and in the Serra da Gandarela National Park, considering (c) summer and (d) winter.
Regarding mean air temperature, the data indicate that summer in the PNSG occurs between October and March, with an average of 22 °C (Figure 3c), while winter extends from April to September, with an average of 19.0 °C (Figure 3d). It is noteworthy that the first and last months of each season are considered transition periods.
3.2. NDVI
The results of the study reveal a strong seasonality pattern in both Conservation Units (Cus), which can be observed in the annual oscillations (Figure 4). NDVI values remained predominantly above 0.6, indicating the presence of healthy vegetation cover for most of the year throughout the evaluated period.
Figure 4.
Temporal distribution of NDVI for the Serra da Gandarela National Park and the Campos de Palmas Wildlife Refuge.
The data show that the PNSG exhibits high vegetation resilience, with greater stability in cover over the analyzed period (Figure 4). The lowest values were recorded between August and October, particularly in 2007, with an index of 0.68, while the highest values occurred in 2020 and 2021, both with an index of 0.7.
In the RVSCP, greater interannual variation was observed, with more pronounced NDVI peaks, especially in July 2004, when the index reached 0.35 (Figure 4). The highest values occurred between January and March, with February standing out for presenting the highest average of the series, at 0.8.
3.3. NMDI
Despite the contrasting vegetation formations in the PNSG and the RVSCP, the NMDI time series show a similar value range in both regions. Most observations remain above the 0.4 threshold commonly associated with vegetation water stress, indicating generally low levels of water stress during the study period. The behavior of the drought index (NMDI) in the PNSG showed relatively stable oscillations throughout the evaluated period, with a seasonal pattern marked by lower values in winter and higher values in summer (Figure 5).
Figure 5.
NMDI values in the Serra da Gandarela National Park and the Campos de Palmas Wildlife Refuge throughout the time series.
March 2002 stood out as an extreme outlier, when the index reached 1.365, indicating extremely wet conditions. The lowest value of the series was recorded in August (0.38), classified as dry on the scale, while the highest occurred in November (0.5), considered wet. On an annual scale, 2019 presented the lowest mean (0.40–wet), whereas 2022 recorded the highest mean of the series (0.5–wet).
The NMDI values for the RVSCP showed greater interannual variability and a well-marked trend: between 2001 and 2010, values were lower (0.35 to 0.40), with a steady increase starting in 2011, reaching 0.55 between 2015 and 2018 (Figure 5). The index peaks in summer, in March (0.5, wet), while the lowest averages occur in the winter months, with a mean of 0.4 (wet).
3.4. Volumetric Soil Moisture
The behavior of soil moisture (VSM) in the PNSG was consistent with the type of vegetation and climate of the region, with lower values during the dry season (June to August), August being the month with the lowest average 0.20 m3 m−3 (Figure 6). Throughout the time series, values remained relatively stable, ranging from 0.20 to 0.35 m3 m−3, showing a consistent distribution without abrupt fluctuations, which suggests a regular water regime. The figure also indicates the occurrence of wetter soils in certain years, reflected by greater data dispersion during the rainy season (October to March). Nevertheless, the results point to low resilience in the face of drought risk during the dry season, when average values dropped to around 0.20 m3 m−3.
Figure 6.
Monthly volumetric soil moisture (VSM) values in the Serra da Gandarela National Park (a) and the Campos de Palmas Wildlife Refuge (b).
In the RVSCP, soil moisture values were systematically higher, with a median between 0.35 and 0.4 m3 m−3 in the last years of the series (Figure 6). Despite the predominance of high values, greater intra-annual variability was observed, especially in the more recent period (2015–2023), suggesting greater sensitivity of the area to climatic oscillations.
The data suggest that the soil in the RVSCP remains moist throughout the year, showing little variation in water availability (Figure 6). The reduction in values starting in May indicates the onset of the dry season, which extends until September, while in October, a recovery in soil moisture is observed. Even during the dry period, mean values remained around 0.30 m3 m−3, evidencing low intra-annual variability and reduced vulnerability to water deficit.
In comparison, the results indicate distinct resilience profiles to drought risk between the analyzed areas: the PNSG showed low resilience, while the RVSCP demonstrated high resilience.
3.5. Number of Fire Foci and Kernel Density
The analysis of fire foci in the PNSG revealed that September accounted for the highest number of occurrences over the 23 years evaluated, totaling 125 out of 370 records, followed by August, with 103 occurrences (Figure 7). December was the only month without records throughout the entire analyzed period. The year 2021 stood out as the most critical, with 54 occurrences, all concentrated in the dry season: 20 in June, 8 in August, and 26 in September. In contrast, no fire foci were recorded in the area in 2001.
Figure 7.
Monthly and interannual distribution of fire foci in the Serra da Gandarela National Park (a) and the Campos de Palmas Wildlife Refuge (b). Color intensity represents the number of fire foci occurrences.
The distribution of fire foci was concentrated in specific areas, with 33% of the records occurring in grassland formations, 31% in rocky outcrops, and 29% in forest formations. The results of the Pettit test indicated statistically significant change points in 2015 for the RVSCP and in 2018 for the PNSG, suggesting meaningful shifts in the behavior and temporal distribution of fire foci during the analyzed period. The test identified 2018 as the year of significant change in the time series, with 10 occurrences recorded in the dry season, of which 2 were in July and 8 in August (Figure 8).
Figure 8.
Spatial distribution of fire foci by Kernel Density during the dry season in the Serra da Gandarela National Park (a), and in the Campos de Palmas Wildlife Refuge (b). The Pettitt test identified 2018 for PNSG and 2015 for RVSCP as the year of significant change in the time series.
In the RVSCP, August had the highest number of fire foci (297 out of 432 records), followed by September, with 46 occurrences (Figure 8). The distribution of fire foci is uneven throughout the year, with low frequency in most months and a strong concentration during the dry season (July to September). Over the historical series, March was the only month without records. The year 2021 presented the highest number of occurrences, with 46 fire foci (8 in July, 36 in August, and 1 in September), while 2008 recorded the lowest value, with only 3 foci (1 in August and 2 in September).
Of the 432 foci recorded in the RVSCP, 68% occurred in pasture areas, 11% in forest formations, 7% in flooded fields and swamp areas, and 5% in grassland formations. Figure 8 shows the spatial distribution of the 19 fire foci recorded in 2015, identified by the Pettitt test as a change point in the time series; all records that year occurred between July and August.
The data analysis reveals an escalation in the number of fire foci from 2020 onwards in both study areas. Between 2001 and 2019, the annual averages were 17 occurrences in the PNSG and 14 in the RVSCP. In the more recent period, from 2020 to 2023, these values increased to 26 and 24 fire foci per year, respectively.
3.6. Non-Parametric Mann–Kendall Analysis
In the PNSG, the Mann–Kendall (MK) test revealed a significant increasing trend in NDVI during the months of March, June, July, August, and October, with March being the most expressive (p = 0.05; Zmk = 1.80). These results suggest greater vegetative vigor in different seasonal periods, reinforcing the resilience of vegetation cover. In the RVSCP, significant increasing trends were observed in January (p = 0.05; Zmk = 1.80) and October (p = 0.05; Zmk = 1.95), indicating marked seasonality, though less widespread than in the PNSG (Figure 9).
Figure 9.
Results of the Mann–Kendall test applied to the variables fire foci, NDVI, NMDI, and VSM in the Serra da Gandarela National Park (PNSG) and the Campos de Palmas Wildlife Refuge (RVSCP). The dashed lines represent the 10% and 5% significance levels, allowing the identification of statistically significant trends throughout the months.
For the PNSG, the analysis showed February (p = 0.09; Zmk = 1.7) with a positive trend and June (p = 0.08; Zmk = −1.70) with a negative trend, reflecting fluctuations in water availability throughout the year. In the RVSCP, the NMDI presented more moderate performance trends: June (p = 0.01; Zmk = 2.5) and August (p = 0.01; Zmk = 2.40) with significant growth, indicating greater water variability and sensitivity to seasonal extremes (Figure 9).
In the PNSG, the MK test indicated significant positive trends in January (p = 0.08; Zmk = 1.70), February (p = 0.03; Zmk = 2.10), and April (p = 0.05; Zmk = 1.95), highlighting periods of increasing soil moisture availability. In the RVSCP, a significant trend was identified only in February (p = 0.05; Zmk = 1.90), suggesting a more punctual and limited response of soil moisture to seasonal conditions (Figure 9).
The MK test revealed that, for the PNSG, the fire foci data showed peaks of positive trend in March (p = 0.55; Zmk = 1.1) and September (p = 0.02; Zmk = 2.4), coinciding with the transition periods between the wet and dry seasons. For the RVSCP, the test indicated peaks in May (p = 0.65; Zmk = 0.40) and September (p = 0.40; Zmk = −0.75), reinforcing the seasonality of fire occurrence (Figure 9).
3.7. Transformed Linear Regression Model
The results presented in Table 3 show consistent differences among the tested models. Among the evaluated approaches, the TLR model demonstrated the best overall performance across both study sites and under the different ENSO phases, presenting higher R2 and d2 values and lower RMSE compared to the other models. This indicates that the transformation applied to the response variable improved the predictive capacity of the model and reduced prediction errors. Based on this performance, the TLR model was selected as the most suitable approach for the subsequent analyses carried out in this study.
The evaluation of climate data associated with the FMA+ index enabled the application of multiple regression and the development of two fire risk prediction models for the Atlantic Forest conservation units: the Fire Risk Index of the IRIPNSG and the IRIRVSCP (Equations (17) and (18)). 70% of the data was allocated for model training and 30% for testing predictive performance.
where IRI represents the estimated fire risk index, β0 corresponds to the model intercept, and β1–β5 are the coefficients associated with the meteorological variables.
For the PNSG, performance remained consistently high across climatic regimes. During Neutral conditions (2012–2013), the model achieved R = 0.80 and R2 = 0.7 (Figure 10a), indicating strong explanatory capacity. Under El Niño conditions (2015–2016), performance remained stable (R = 0.75; R2 = 0.55) (Figure 10c), while during La Niña conditions (2021–2022), R reached 0.8 with R2 = 0.60 (Figure 10e). Willmott’s index of agreement (d) remained high across all phases (0.85–0.9), confirming strong agreement between estimated and observed values. Although RMSE showed slight variation among phases (0.90–1.1), dispersion remained within acceptable limits, demonstrating consistent predictive behavior under contrasting large-scale climatic forcings.
Figure 10.
Relationship between observed FMA+ values and those estimated by the fire risk models IRIPNSG (a,c,e) and IRIRVSCP (b,d,f) under different ENSO phases: Neutral, El Niño, and La Niña. Solid lines represent the linear regression between observed and estimated values. Regression equations and performance metrics (R, R2, RMSE, and d-index) are shown in each panel.
In the RVSCP, model performance was also stable and, in some ENSO phases, comparable to that observed in the PNSG. Under Neutral conditions, R = 0.70 and R2 = 0.50 indicated moderate explanatory power (Figure 10b). Performance improved during El Niño (R = 0.75; R2 = 0.6) and La Niña phases (R = 0.8; R2 = 0.60) (Figure 10d,f), with lower RMSE values (0.65–0.7) and increasing agreement indices (d = 0.80–0.85). These results suggest that the model maintains stable predictive capacity even under contrasting hydrometeorological anomalies.
Overall, the ENSO-stratified validation demonstrates that both IRIPNSG and IRIRVSCP exhibit temporal resilience across different climatic regimes. The consistency of performance metrics across Neutral, El Niño, and La Niña phases indicates that the modeling framework is not restricted to a specific interannual condition and maintains reliability under varying large-scale atmospheric patterns. These findings substantially strengthen the generalizability of the proposed fire risk indices for Atlantic Forest conservation units.
The variation in the risk index showed a clearly seasonal pattern, with lower values during the wet season and higher values in the dry period. In the PNSG, more than half of the year was classified as Medium and High fire risk (Figure 11a). Specifically, 34.5% of the days were classified as High risk, 29% as Medium, and 17.8% as Very High. The months of May, August, and September concentrated the highest risks, with more than half of the days classified as High, May being the most critical, accumulating 23 days in this category.
Figure 11.
Monthly fire risk classification according to the IRIPNSG (a) and the IRIRVSCP (b).
In the RVSCP, the classification also revealed a predominance of High risk, corresponding to 32.7% of the days, followed by 29.5% at Medium risk and 18% at Low risk (Figure 11b). Monthly analysis showed that April, June, and August were the most critical months, with the greatest number of days at High risk, while May had the largest number of days at Very High risk. In contrast, October stood out as the month with the highest number of days classified as No risk, reflecting the intra-annual variability in the region.
3.8. Niño 3.4 Analysis
The difference between the 1981–2010 and 1991–2020 climatologies (Figure 12) revealed an average annual warming of 0.06 °C, with the most notable increases in April (+0.15 °C), May (+0.14 °C), June (+0.10 °C), and July (+0.08 °C), reflecting greater intensity during the MAM (+0.12 °C) and JJA (+0.09 °C) seasons. In the other months, the differences were small, ranging from −0.01 °C in September to +0.05 °C in December.
Figure 12.
Monthly differences in Sea Surface Temperature (SST) in the Niño 3.4 region. The spatial fields of SST anomalies (∆SST, °C) between the 1991–2020 and 1981–2010 climatologies (a), and the monthly series of climatologies (blue: 1981–2010; red: 1991–2020) are compared with the years 2015 (black dashed line) and 2018 (black solid line) (b). The colored bands indicate the interannual variability associated with each climatology.
The annual and monthly anomalies of 2015, a year marked by a strong El Niño event, showed elevated temperatures, reaching almost +2.8 °C in November and exceeding +2.0 °C from September to December. In contrast, 2018 presented more neutral and La Niña conditions, with negative anomalies of up to −0.6 °C in May and values close to neutrality between August and December.
A direct comparison between 2015 and 2018 highlighted average annual differences of approximately 1.45 °C, with significant peaks in August (+1.9 °C), September (+2.1 °C), October (+2.3 °C), and November (+2.4 °C). Seasonal analysis reinforced these contrasts: during SON the mean difference reached +2.1 °C, while in the first half of the year (DJF and MAM) the differences were smaller, ranging between +0.7 °C and +1.0 °C. These results confirm that the Niño 3.4 region plays a fundamental role in global climate variability, influencing the frequency and intensity of ENSO events.
It is worth noting that these analyses of SST variability in Niño 3.4 were carried out as a complement to the study of the Atlantic Forest CU. In the case of RVSCP, the year 2015, marked by a strong El Niño and the highest anomalies in the Niño 3.4 region, coincided with the change point identified by the Pettitt test. In the PNSG, this break was observed in 2018, a year that included phases of La Niña, neutrality, and El Niño, ultimately characterized as a Weak El Niño. Thus, the results from the equatorial Pacific directly align with the statistically significant changes detected in the local series, reinforcing the link between global climate forcings and regional responses in fire risk.
3.9. Surface Atmospheric Pressure Fields for PNSG and RVSCP
The figures show the monthly distribution of surface pressure over Brazil in 2015 and 2018, highlighting the locations of PNSG and RVSCP (Figure 13 and Figure 14). The spatial pattern indicates marked seasonal variations, with maxima during winter months and minima in summer, reflecting the characteristic atmospheric circulation of South America.
Figure 13.
Surface pressure (hPa) in Brazil and in the studied Conservation Units during 2015. The monthly spatial distribution of surface pressure, highlighting the PNSG and RVSCP areas (a), and the time series of monthly mean surface pressure in each unit (b).
Figure 14.
Surface pressure (hPa) in Brazil and in the Conservation Units studied during the year 2018. The monthly spatial distribution of surface pressure, highlighting the areas of PNSG and RVSCP (a), and the time series of monthly mean pressures in each unit (b).
For the PNSG, values in 2015 ranged between 903.6 hPa (minimum) and 910.5 hPa (maximum) (Figure 13a), while in 2018 they fluctuated between 899.5 hPa and 905 hPa, indicating lower values in the latter year. For the RVSCP, in 2015 the annual variation ranged from 886.3 hPa (minimum) to 892.2 hPa (maximum), whereas in 2018 the range was slightly narrower, from 883.8 hPa to 888 hPa (Figure 14a).
In both CUs, the seasonal peak in surface pressure during winter coincides with the period of greatest fire foci events (JAS/ASO). In 2015 (RVSCP), the highest winter pressure aligns with the change point and the greater concentration of foci in August (Figure 13b and Figure 14b). In 2018 (PNSG), even with lower pressure compared to 2015, the seasonality of high winter pressure and regional drought supported the increase/redistribution of fire foci observed by the Pettitt test. Thus, the results indicate that the phase and intensity of ENSO modulate the pressure field and, together with the dry season and land use, condition the critical window of fire risk in both areas.
4. Discussion
4.1. Meteorological Variables
The climate of the South and Southeast regions of Brazil presents marked differences according to the Köppen classification, particularly in precipitation distribution. In the PNSG, the prevailing type is Cwa (tropical highland), characterized by hot summers and dry winters, whereas in the RVSCP, the type is Cfb (humid subtropical), marked by well-distributed rainfall throughout the year and mild summers [30].
This contrast highlights the strong climatic seasonality typical of southeastern Brazil, with rainy summers and dry winters [29,57]. The alternation between periods of high and low rainfall has direct implications for soil water availability, aquifer recharge, and vegetation dynamics, potentially intensifying wildfire risk during drought periods [58].
Spatial analysis of precipitation revealed strong intra and interannual variability in both study areas (Figure 2). This amplitude shows that the climate regime is conditioned by topographic factors and the local circulation of air masses, as previously noted in studies of southern Brazil [31].
These thermal gradients can be explained by differences in altitude and land cover patterns, since elevated and densely forested areas tend to display milder temperatures [59,60]. The interaction between precipitation and air temperature is a determining factor for local ecological dynamics. In both CUs, the reduction in rainfall combined with increased temperature intensifies evapotranspiration, reduces soil moisture, and consequently increases vegetation susceptibility to wildfires [61,62].
4.2. Remote Sensing
The recent trend of stability in both CUs indicates vegetation resilience to external pressures, although the slight reduction in PNSG after 2018 deserves attention, as it may be linked to increasing climatic extremes in the Atlantic Forest or intensified regional anthropogenic pressures. In this context, NDVI reaffirms its role as a moderate performance indicator for vegetation monitoring [63,64,65], allowing the evaluation of both seasonal cycles and long-term trends.
This stability suggests that the local vegetation has remained healthy and under favorable moisture storage conditions over the past two decades, most likely due to the high level of protection associated with the park, which minimizes major direct anthropogenic disturbances. Studies indicate that areas with stricter and higher levels of protection tend to exhibit greater vegetation stability and resilience [66,67].
In contrast, the RVSCP showed greater variability, with lower values until 2010 (0.3–0.4), classified as dry vegetation, followed by an increase in index values starting in 2011, reaching humid conditions between 2015 and 2018 (0.5–0.55). This shift coincides with years marked by severe droughts in Brazil [57,68,69], suggesting that although the index indicated higher moisture, the response may reflect vegetation adaptations.
The results support the applicability of the NMDI as an indicator of water stress [36], widely used in different contexts to detect agricultural and ecological droughts [70,71]. Both NMDI and NDVI respond directly to precipitation volume and can be influenced by high temperatures, which intensify evapotranspiration and reduce leaf water availability [35]. For this reason, they have been widely used in studies investigating the influence of drought on fire occurrence [34,72].
A similar pattern was also observed by [9] when evaluating VSM performance in the states of Acre and Rio de Janeiro. This behavior may be associated with the mountainous topography, the presence of deep soils, and the higher degree of protection in the area, which reduces direct anthropogenic pressures. Ecosystems that are less fragmented and maintain higher environmental integrity tend to preserve greater hydric stability, reducing the effects of extreme events on vegetation [73,74,75].
The RVSCP, however, showed greater variability. This change may be linked both to climate variability and to local vegetation recovery processes that enhance plant water retention [75,76].
During periods of low precipitation and low soil moisture, common in the dry season, there is a greater chance of dry biomass accumulation on the ground due to leaf fall and plant death. Such conditions create an ideal scenario for fire propagation, since the soil is dry and fuel material is abundant [77].
These observed patterns in the study areas, where RVSCP demonstrates greater hydric stability and PNSG greater vulnerability to climatic extremes and anthropogenic pressures, reinforce the relevance of using soil moisture as an eco-hydrological indicator of environmental change. This difference is directly related to local precipitation patterns, since the PNSG climate is marked by a well-defined dry season and a wet season, whereas in the RVSCP, precipitation is more evenly distributed throughout the year.
4.3. Fire Foci and Land Use
The results of this study indicate that meteorological elements, especially precipitation, are strongly related to the number of fire foci in the study areas (Figure 7 and Figure 8), particularly in locations where land cover has been altered. This can be explained by soil-atmosphere interactions that modify both the availability and flammability of biomass [78].
Changes in land cover create favorable conditions for fire occurrence by altering soil water storage capacity and the availability of combustible material. Human interference in forests for agriculture, livestock, and settlement has played an important role in increasing fire numbers in recent years [79], especially in the Atlantic Forest, where fragmentation patterns and anthropogenic activity enhance its susceptibility to fire [80].
Fragmentation makes Atlantic Forest remnants more accessible to fire [81], since fires spread into forest fragments and habitat edges from surrounding agricultural and pasture areas [17]. This process tends to accelerate fragmentation because the fire typically advances from the edges toward the forest interior [82].
This coincides with the seasonal peak of wildfire records in Brazil, often caused by the use of fire by farmers during crop rotation [58,83] and intensified by reduced rainfall and increased wind speed. This behavior is explained by the relationship between fuel availability arising from tree mortality landscape homogenization [84] and the fragmentation of Atlantic Forest remnants that is occurring both nationwide and in the study areas.
The Pettit text [56] identified 2018 as a year of change for RVSCP, coinciding with a weak El Niño event (2018–2019). For PNSG, Pettitt’s test indicated 2015, a year of one of the strongest El Niño events on record, which caused anomalies in both precipitation and temperature [85,86]. The MK test (Figure 9) showed that PNSG exhibits more consistent positive trends in NDVI and VSM, pointing to greater vegetation resilience, although September stood out with a significant increase in fire foci, coinciding with the dry season. In RVSCP, trends were more limited for NDVI and VSM, but NMDI revealed stronger signals of hydric variability, reflecting higher sensitivity to seasonal extremes.
In both cases identified by the Pettitt test, anomalies were detected in SST (Figure 12) and in surface atmospheric pressure fields (Figure 13 and Figure 14), both associated with the ENSO. During such events, pressure anomalies over South America are intensified, resulting in atmospheric blocking and reduced rainfall in southeastern Brazil [68,87]. These conditions generate greater water deficits, increased solar radiation, and reduced soil moisture, factors that enhance vegetation flammability and favor fire spread [88].
This trend may be linked to environmental policy changes such as weakened laws, reduced enforcement by environmental agencies, and budget cuts to regulatory institutions [89]. Beyond political and economic aspects, the increase is also related to declining soil water storage combined with high evaporative demand driven by rising global temperatures induced by climate change [90,91,92,93].
4.4. Wildfire Risk Prediction Model
Regarding the fire risk prediction indices for PNSG and RVSCP, the results indicate that the logarithmic transformation of the FMA+ variable significantly improved model performance (Figure 10), enhancing the explanatory power and agreement between observed and estimated values across distinct climatic regimes. This approach has also been applied by authors such as [94,95,96], who confirmed that logarithmic transformation of the response variable can improve model stability, reduce heteroscedasticity, and enhance predictive metrics.
The consistently moderate-to-high explanatory power observed across ENSO phases indicates that the predictive framework is not restricted to a specific year or climatic condition. Instead, it maintains stable behavior under contrasting atmospheric circulation patterns, supporting its generalizability for fire risk assessment in Atlantic Forest conservation units.
The slightly stronger performance observed in the PNSG may be associated with greater climatic variability and environmental heterogeneity in the region, which increases predictor sensitivity to fire-related drivers [55]. Conversely, the RVSCP’s smaller territorial extent and lower variability in fire occurrence may reduce the strength of detectable statistical relationships.
Despite the improved performance obtained with logarithmic transformation and ENSO-stratified validation, some dispersion remains, particularly at very low and very high observed values. This behavior is common in fire-risk modeling, where stochastic processes and anthropogenic drivers introduce nonlinearities that are difficult to capture using purely climatic predictors. Future refinements could include the incorporation of additional atmospheric variables, such as vapor pressure deficit and dry season duration, as well as anthropogenic factors (e.g., LULC), which have been identified as critical drivers of wildfire occurrence in previous studies [79,80,81,88,97].
4.5. Influence of Large-Scale Climate Systems on Wildfires in the Atlantic Forest
The year 2015, marked by one of the strongest El Niño events, coincided with the temporal break detected in the RVSCP, while PNSG showed a change in 2018, a period characterized by transitions between La Niña, neutral conditions, and a weak El Niño [98]. Similar links between Niño 3.4 anomalies, surface pressure circulations, and changes in fire activity have also been observed in the Brazilian Legal Amazon and southern Brazil [6,8,9].
Anomalous warming of tropical Pacific waters alters atmospheric circulation, directly affecting pressure regimes over South America [99]. These alterations can intensify atmospheric subsidence and increase sea-level pressure in certain regions, reducing relative humidity and prolonging dry seasons [67,100]. Ref. [101], in a study on Amazon savannization, demonstrated using fully coupled atmosphere–ice–land–ocean simulations, that both savanna expansion and global warming independently act to extend the dry season and reduce annual rainfall across large areas of South America. These teleconnection effects were also evident in the Atlantic Forest conservation units. Even with lower atmospheric pressures than in 2015, the seasonal pattern of high winter pressure and regional drought sustained the increase and redistribution of fire foci (Figure 7).
Therefore, results indicate that global climate variability expressed by equatorial Pacific SST anomalies and modulated by regional atmospheric pressure interacts with local factors such as land use and dry-season intensity. Together, these forcings create critical wildfire risk windows both in the Amazon and in Atlantic Forest ecosystems, reinforcing the importance of incorporating global-scale variables into regional fire analyses.
In a study carried out in Acre, ref. [102] found that the largest burned area occurred during La Niña episodes, while the highest number of fire foci occurred during neutral periods. These results highlight the complexity and variability of fire in Brazil, which is not always directly associated with large-scale climatic phenomena. In many cases, fire patterns also reflect socioeconomic drivers, anthropogenic pressures such as deforestation, and local environmental vulnerabilities.
Thus, it is essential to integrate analyses that simultaneously consider the influence of large-scale events like Niño 3.4 and atmospheric pressure variability, along with regional and socioeconomic factors, to more comprehensively understand fire dynamics across Brazil (Figure 12, Figure 13 and Figure 14).
5. Conclusions
The analysis demonstrated that climate seasonality is the primary conditioning factor for wildfire occurrence in the evaluated conservation units. The distribution of precipitation and the resulting soil water availability regulate vegetation vitality and fuel accumulation, making the dry season (June to September) the period of highest vulnerability to fire. Although vegetation cover generally presents relatively low fuel biomass, its interaction with climatic variability determines the intensity and frequency of fire foci.
Vegetation and moisture indices (NDVI, NMDI, and VSM) proved to be sensitive to climatic fluctuations, effectively reflecting environmental conditions in both conservation units. Based on these parameters and climatic predictors, the fire risk indices IRIPNSG and IRIRVSCP were developed and validated under distinct ENSO phases (Neutral, El Niño, and La Niña conditions). The stratified validation demonstrated stable performance across contrasting climatic regimes, with coefficients of determination ranging from 0.53 to 0.68 and consistently high agreement indices. These results confirm the temporal moderate performance and generalizability of the proposed modeling framework.
The integration of climate data, geotechnologies, and spectral indices proved to be an effective approach for constructing wildfire risk prediction models in the Atlantic Forest. Beyond capturing seasonal dynamics, the models demonstrated resilience to interannual variability associated with large-scale atmospheric phenomena such as ENSO, reinforcing their applicability under diverse hydrometeorological conditions.
Overall, IRIPNSG showed slightly stronger predictive performance, likely due to greater climatic variability and environmental heterogeneity in the Serra da Gandarela region. However, both indices maintained consistent predictive behavior across ENSO phases, indicating that the framework is not restricted to a specific year or climatic pattern.
This study contributes to advancing wildfire risk assessment in the Atlantic Forest by demonstrating that: (i) climatic factors, interacting with vegetation dynamics, are decisive drivers of fire occurrence; (ii) the proposed risk indices exhibit stable and reliable performance across distinct climatic regimes; (iii) the integration of climate data and geotechnologies strengthens predictive modeling strategies; and (iv) the resulting indices constitute valuable operational tools to support prevention, monitoring, and decision-making in protected areas.
Despite the robust performance of the proposed models, some limitations should be acknowledged. The predictive framework relies mainly on climatic variables, which do not fully represent anthropogenic drivers of fire occurrence. Additionally, the moderate coefficients of determination indicate that part of the variability in wildfire occurrence remains unexplained. Future research should incorporate socio-environmental variables related to human activities, use higher-resolution datasets, and evaluate the applicability of the proposed indices in other conservation units and tropical biomes.
Although wildfire dynamics in tropical socio-ecological systems remain influenced by anthropogenic pressures and inherent stochastic variability, the results indicate that most residual uncertainty reflects system complexity rather than structural fragility of the modeling framework. Therefore, the proposed approach provides a scientifically moderate performance and temporally resilient basis for fire risk assessment in Atlantic Forest conservation units.
Author Contributions
Conceptualization, R.C.D. and A.L.R.d.F.; methodology, A.L.R.d.F.; software, A.L.R.d.F.; formal analysis, A.L.R.d.F.; investigation, A.L.R.d.F.; resources, R.C.D. and A.L.R.d.F.; data curation, R.C.D. and A.L.R.d.F.; writing—original draft preparation, R.C.D. and A.L.R.d.F.; writing—review and editing, A.L.R.d.F., M.N.S.d.C., J.L.M.B.d.M., J.P., G.H.G.S., D.G.F.B., M.G.P. and R.C.D.; visualization, A.L.R.d.F., M.N.S.d.C., J.L.M.B.d.M., J.P., G.H.G.S., D.G.F.B., M.G.P. and R.C.D.; supervision, R.C.D.; project administration, R.C.D.; funding acquisition, R.C.D. All authors have read and agreed to the published version of the manuscript.
Funding
The authors did not receive support from any organization for the submitted work.
Data Availability Statement
The datasets generated and/or analyzed during the current study are available from the corresponding author on reasonable request.
Acknowledgments
The authors thank the National Council for Scientific and Technological Development (CNPq) for its support and for granting a research scholarship, which was fundamental for the development of this study. We also express our gratitude to the Federal University of Viçosa and to the Graduate Program in Applied Meteorology (PPGMET) for their technical support and infrastructure, as well as to our colleagues from the Integrated Center for Agricultural and Forest Meteorology (CIMAF) for their discussions and contributions throughout the development of this work.
Conflicts of Interest
The authors declare no conflicts of interest.
References
- Fidelis, A.; Rodrigues, C.A.; Dairel, M.; Blanco, C.C.; Pillar, V.D.; Pfadenhauer, J. What Matters for Vegetation Regeneration in Brazilian Subtropical Grasslands: Seeders or Resprouters? Flora 2021, 279, 151817. [Google Scholar] [CrossRef] [Scilit]
- Pivello, V.R.; Vieira, I.; Christianini, A.V.; Ribeiro, D.B.; da Silva Menezes, L.; Berlinck, C.N.; Melo, F.P.L.; Marengo, J.A.; Tornquist, C.G.; Tomas, W.M.; et al. Understanding Brazil’s Catastrophic Fires: Causes, Consequences, and Policy Needed to Prevent Future Tragedies. Perspect. Ecol. Conserv. 2021, 19, 233–255. [Google Scholar] [CrossRef] [Scilit]
- Sayad, Y.O.; Mousannif, H.; Al Moatassime, H. Predictive Modeling of Wildfires: A New Dataset and Machine Learning Approach. Fire Saf. J. 2019, 104, 130–146. [Google Scholar] [CrossRef] [Scilit]
- Krawchuk, M.A.; Moritz, M.A. Constraints on Global Fire Activity Vary across a Resource Gradient. Ecology 2011, 92, 121–132. [Google Scholar] [CrossRef] [Scilit]
- Moritz, M.A.; Parisien, M.-A.; Batllori, E.; Krawchuk, M.A.; Van Dorn, J.; Ganz, D.J.; Hayhoe, K. Climate Change and Disruptions to Global Fire Activity. Ecosphere 2012, 3, art49. [Google Scholar] [CrossRef] [Scilit]
- Andrade, C.F.; Delgado, R.C.; Barbosa, M.L.F.; Teodoro, P.E.; Junior, C.A.d.S.; Wanderley, H.S.; Capristo-Silva, G.F. Fire Regime in Southern Brazil Driven by Atmospheric Variation and Vegetation Cover. Agric. For. Meteorol. 2020, 295, 108194. [Google Scholar] [CrossRef] [Scilit]
- Machado-Silva, F.; Libonati, R.; Melo de Lima, T.F.; Bittencourt Peixoto, R.; de Almeida França, J.R.; de Avelar Figueiredo Mafra Magalhães, M.; Lemos Maia Santos, F.; Abrantes Rodrigues, J.; DaCamara, C.C. Drought and Fires Influence the Respiratory Diseases Hospitalizations in the Amazon. Ecol. Indic. 2020, 109, 105817. [Google Scholar] [CrossRef] [Scilit]
- Barbosa, M.L.F.; Delgado, R.C.; Forsad de Andrade, C.; Teodoro, P.E.; Silva Junior, C.A.; Wanderley, H.S.; Capristo-Silva, G.F. Recent Trends in the Fire Dynamics in Brazilian Legal Amazon: Interaction between the ENSO Phenomenon, Climate and Land Use. Environ. Dev. 2021, 39, 100648. [Google Scholar] [CrossRef] [Scilit]
- Arévalo, S.M.M.; Delgado, R.C.; Lindemann, D.d.S.; Gelsleichter, Y.A.; Pereira, M.G.; Rodrigues, R.d.Á.; Justino, F.B.; Wanderley, H.S.; Zonta, E.; de Santana, R.O.; et al. Past and Future Responses of Soil Water to Climate Change in Tropical and Subtropical Rainforest Systems in South America. Atmosphere 2023, 14, 755. [Google Scholar] [CrossRef] [Scilit]
- Joly, C.A.; Metzger, J.P.; Tabarelli, M. Experiences from the Brazilian Atlantic Forest: Ecological Findings and Conservation Initiatives. New Phytol. 2014, 204, 459–473. [Google Scholar] [CrossRef] [Scilit] [PubMed]
- Myers, N.; Mittermeier, R.A.; Mittermeier, C.G.; da Fonseca, G.A.B.; Kent, J. Biodiversity Hotspots for Conservation Priorities. Nature 2000, 403, 853–858. [Google Scholar] [CrossRef] [Scilit]
- Mittermeier, R.; Gil, P.; Hoffmann, M.; Pilgrim, J.; Brooks, T.; Mittermeier, C.; Lamoreux, J.; Fonseca, G. Hotspots Revisited. Earth’s Biologically Richest and Most Endangered Terrestrial Ecoregions; Cemex: Mexico City, Mexico, 2004; Volume 392, ISBN 978-968-6397-77-2. [Google Scholar]
- Carmo, M.; Moreira, F.; Casimiro, P.; Vaz, P. Land use and topography influences on wildfire occurrence in northern Portugal. Landsc. Urban Plan. 2011, 100, 169–176. [Google Scholar] [CrossRef] [Scilit]
- Santana, M.S.; Sampaio, E.V.D.S.B.; Giongo, V.; Menezes, R.S.C.; Jesus, K.N.; Albuquerque, E.R.G.M.; Nascimento, D.M.; Pareyn, F.G.C.; Cunha, T.J.F.; Sampaio, R.M.B.; et al. Carbon and nitrogen stocks of soils under different land uses in Pernambuco state, Brazil. Geoderma Reg. 2019, 16, e00205. [Google Scholar] [CrossRef] [Scilit]
- Andrade, B.O.; Koch, C.; Boldrini, I.I.; Vélez-Martin, E.; Hasenack, H.; Hermann, J.M.; Kollmann, J.; Pillar, V.D.; Overbeck, G.E. Grassland degradation and restoration: A conceptual framework of stages and thresholds illustrated by southern Brazilian grasslands. Nat. Conserv. 2015, 13, 95–104. [Google Scholar] [CrossRef] [Scilit]
- Barros, L.A.; Mendonça, B.A.F.D.; Sothe, C.; Filho, E.I.F.; Elkin, C. Fire in the Atlantic Rainforest: An analysis of 20 years of fire foci distribution and their social-ecological drivers. Geocarto Int. 2022, 37, 4737–4761. [Google Scholar] [CrossRef] [Scilit]
- Singh, M.; Huang, Z. Analysis of forest fire dynamics, distribution, and main drivers in the Atlantic Forest. Sustainability 2022, 14, 992. [Google Scholar] [CrossRef] [Scilit]
- Canale, G.R.; Peres, C.A.; Guidorizzi, C.E.; Gatto, C.A.F.; Kierulff, M.C.M. Pervasive defaunation of forest remnants in a tropical biodiversity hotspot. PLoS ONE 2012, 7, e41671. [Google Scholar] [CrossRef] [Scilit]
- Instituto Nacional de Pesquisas Espaciais (INPE). Banco de Dados de Queimadas. 2023. Available online: http://www.inpe.br/queimadas/bdqueimadas (accessed on 29 March 2024).
- Torres, F.T.P.; Lima, G.S.; Martins, S.V.; Valverde, S.R. Analysis of efficiency of fire danger indices in forest fire prediction. Rev. Árvore 2017, 41, e410209. [Google Scholar] [CrossRef] [Scilit]
- Carvalho, L.Z.G.; Massi, K.G.; Coutinho, M.P.; Magalhães, V.D. Fire effects on Atlantic Forest sites from a composition, structure, and functional perspective. Braz. J. Biol. 2023, 82, e268185. [Google Scholar] [CrossRef] [Scilit]
- Marcuzzo, S.B.; Araújo, M.M.; Gasparin, E. Plantio de espécies nativas para restauração de áreas em unidades de conservação: Um estudo de caso no sul do Brasil. Floresta 2015, 45, 129–140. [Google Scholar] [CrossRef] [Scilit]
- Santos, I.F.; Marey-Pérez, M.F.; González-Manteiga, W. Forest fire spatial pattern analysis in Galicia (NW Spain). J. Environ. Manag. 2013, 128, 30–42. [Google Scholar] [CrossRef] [Scilit] [PubMed]
- González, J.R.; Palahí, M.; Trasobares, A.; Pukkala, T. A fire probability model for forest stands in Catalonia (north-east Spain). Ann. For. Sci. 2006, 63, 169–176. [Google Scholar] [CrossRef] [Scilit]
- Minaki, C.; Montanher, O.C. Variáveis climáticas e os registros de incêndios em Maringá-PR. Rev. Bras. Climatol. 2020, 27, 518–538. [Google Scholar]
- Jesus, C.S.L.d. Risco de Incêndios Associado a Mudanças da Paisagem e Eventos Climáticos na Mata Atlântica. Fire Risk Associated with Landscape Changes and Weather Events in the Atlantic Forest. 2022. Available online: https://rima.ufrrj.br/jspui/handle/20.500.14407/11291 (accessed on 12 June 2025).
- Bonazountas, M.; Kallidromitou, D.; Kassomenos, P.A.; Passas, N. Forest fire risk analysis. Hum. Ecol. Risk Assess. 2005, 11, 617–626. [Google Scholar] [CrossRef] [Scilit]
- Abid, F. A survey of machine learning algorithms based forest fires prediction and detection systems. Fire Technol. 2021, 57, 559–590. [Google Scholar] [CrossRef] [Scilit]
- Delgado, R.C.; Wanderley, H.S.; Pereira, M.G.; Almeida, A.Q.d.; Carvalho, D.C.d.; Lindemann, D.d.S.; Zonta, E.; Menezes, S.J.M.d.C.d.; Santos, G.L.d.; Santana, R.O.d.; et al. Assessment of a New Fire Risk Index for the Atlantic Forest, Brazil. Forests 2022, 13, 1844. [Google Scholar] [CrossRef] [Scilit]
- Martins, F.B.; Gonzaga, G.; Santos, D.F.; Reboita, M.S. Classificação climática de Köppen e de Thornthwaite para Minas Gerais: Cenário atual e projeções futuras. Rev. Bras. Climatol. 2018, 1, 129–156. [Google Scholar] [CrossRef] [Scilit]
- Alvares, C.A.; Stape, J.L.; Sentelhas, P.C.; Gonçalves, J.D.M.; Sparovek, G. Köppen’s climate classification map for Brazil. Meteorol. Z. 2013, 22, 711–728. [Google Scholar] [CrossRef] [Scilit]
- Xavier, A.C.; Scanlon, B.R.; King, C.W.; Alves, A.I. New improved Brazilian daily weather gridded data (1961–2020). Int. J. Climatol. 2022, 42, 8390–8404. [Google Scholar] [CrossRef] [Scilit]
- Posit|The Open-Source Data Science Company. Available online: https://posit.co/ (accessed on 28 January 2024).
- Wang, L.; Qu, J.J.; Xiong, X.; Hao, X.; Xie, Y.; Che, N. A new method for retrieving band 6 of Aqua MODIS. IEEE Geosci. Remote Sens. Lett. 2006, 3, 267–270. [Google Scholar] [CrossRef] [Scilit]
- Santos, R.O.; Delgado, R.C.; Vilanova, R.S.; Santana, R.O.; Andrade, C.F.; Teodoro, P.E.; Junior, C.A.S.; Silva, G.F.C.; Lima, M. NMDI application for monitoring different vegetation covers in the Atlantic Forest biome, Brazil. Weather Clim. Extrem. 2021, 33, 100329. [Google Scholar] [CrossRef] [Scilit]
- Wang, L.; Qu, J.J. NMDI: A normalized multi-band drought index for monitoring soil and vegetation moisture with satellite remote sensing. Geophys. Res. Lett. 2007, 34, L20405. [Google Scholar] [CrossRef] [Scilit]
- Rouse, J.W.; Hass, J.A.; Schell, J.A. Monitoring vegetation systems in the great plains with ERTS. In NASA-Earth Resources Technology Satellite Symposium; Oxford University: Oxford, UK, 1973; Volume 1, pp. 309–317. Available online: https://ntrs.nasa.gov/citations/19740022614 (accessed on 18 December 2024).
- Oliveira, L.C.B.; Guasselli, L.A.; Antunes, R.L.S. Variação espaço temporal de NDVI no Rio Madeira, na área de aproveitamento hidrelétrico da UHE Santo Antônio—RO. Rev. Geonorte 2012, 3, 1823–1832. [Google Scholar]
- Quesada, H.; Redondo, G.; Vernasqui, L.; Magnoni, P.; Arantes, E. Análise da vegetação ripária em bacia hidrográfica utilizando Índice de Vegetação Normalizada (NDVI) no município de Maringá-PR. Geo Uerj 2017, 439–455. [Google Scholar] [CrossRef] [Scilit]
- Souza, C.M.; Shimbo, J.Z.; Rosa, M.R.; Parente, L.L.; Alencar, A.A.; Rudorff, B.F.T.; Hasenack, H.; Matsumoto, M.; Ferreira, L.G.; Souza-Filho, P.W.M.; et al. Reconstructing Three Decades of Land Use and Land Cover Changes in Brazilian Biomes with Landsat Archive and Earth Engine. Remote Sens. 2020, 12, 2735. [Google Scholar] [CrossRef] [Scilit]
- de Faria, A.L.R.; de Sousa, B.R.; Arévalo, S.M.M.; Delgado, R.C. Evolução da área de pastagem e sua relação com o clima nas mesorregiões do Acre (1985–2019). Ed. Científica Digit. 2024, 1, 79–99. [Google Scholar] [CrossRef] [Scilit]
- Zhou, L.; Wang, Y.; Chi, Y.; Wang, S.; Wang, Q. Contrasting Post-Fire Dynamics between Africa and South America Based on MODIS Observations. Remote Sens. 2019, 11, 1074. [Google Scholar] [CrossRef] [Scilit]
- Ying, L.; Shen, Z.; Yang, M.; Piao, S. Wildfire Detection Probability of MODIS Fire Products under the Constraint of Environmental Factors: A Study Based on Confirmed Ground Wildfire Records. Remote Sens. 2019, 11, 3031. [Google Scholar] [CrossRef] [Scilit]
- Smith, M.J.d.; Goodchild, M.F.; Long, P.A. A Comprehensive Guide to Principles Techniques and Software Tools; Geospatial Analysis; Winchelsea Press: Victoria, Australia, 2025; ISBN 978-1-906221-980. Available online: https://www.spatialanalysisonline.com/extractv7.pdf (accessed on 14 July 2025).
- Nunes, J.R.S.; Soares, R.V.; Batista, A.C. FMA+-Um novo índice de perigo de incêndios florestais para o estado do Paraná, Brasil. RF 2006, 36, 75–91. [Google Scholar] [CrossRef] [Scilit]
- Allen, R.G.; Pereira, L.S.; Raes, D.; Smith, M. Crop Evapotranspiration—Guidelines for Computing Crop Water Requirements; FAO—Food and Agriculture Organization of the United Nations: Rome, Italy, 1998; ISBN 92-5-104219-5. [Google Scholar]
- Alvares, C.A.; Cegatta, Í.R.; Vieira, L.A.A.; Pavani, R.F.; de Mattos, E.M.; Sentelhas, P.C.; Stape, J.L. Perigo de incêndio florestal: Aplicação da Fórmula de Monte Alegre e avaliação do histórico para Piracicaba, SP. Sci. For. 2014, 42, 521–532. [Google Scholar]
- Eugenio, F.C.; Santos, A.R.; Pedra, B.D.; Pezzopane, J.E.M.; Thiengo, C.C.; Saito, N.S. Methodology for Determining Classes of Forest Fire Risk Using the Modified Monte Alegre Formula. Ciência Florest. 2020, 30, 1085–1102. [Google Scholar] [CrossRef] [Scilit]
- Eugenio, F.C.; dos Santos, A.R.; Pedra, B.D.; Pezzopane, J.E.M.; da Silva, S.D.P.; Fantinel, R.A. System for Calculating and Defining Classes in Modified Monte Alegre Formula - FMA + Sisclass. Floresta 2022, 52, 131–139. [Google Scholar] [CrossRef] [Scilit]
- Barbosa, M.L.F.; Delgado, R.C.; Teodoro, P.E.; Pereira, M.G.; Correia, T.P.; de Mendonça, B.A.F.; de Ávila Rodrigues, R. Occurrence of Fire Foci under Different Land Uses in the State of Amazonas during the 2005 Drought. Environ. Dev. Sustain. 2019, 21, 2707–2720. [Google Scholar] [CrossRef] [Scilit]
- Soriano, B.M.A.; Daniel, O.; Santos, S.A. Eficiência de índices de risco de incêndios para o Pantanal sul-mato-grossense. Ciência Florest. 2015, 25, 809–816. [Google Scholar] [CrossRef] [Scilit]
- R: The R Project for Statistical Computing. Available online: https://www.r-project.org/ (accessed on 28 March 2024).
- Mann, H.B. Nonparametric Tests Against Trend. Econometrica 1945, 13, 245–259. [Google Scholar] [CrossRef] [Scilit]
- Kendall, K. Thin-Film Peeling-the Elastic Term. J. Phys. D Appl. Phys. 1975, 8, 1449. [Google Scholar] [CrossRef] [Scilit]
- Willmott, C.J. On the Validation of Models. Phys. Geogr. 1981, 2, 184–194. [Google Scholar] [CrossRef] [Scilit]
- Pettitt, A.N. A Non-Parametric Approach to the Change-Point Problem. J. R. Stat. Soc. Ser. C (Appl. Stat.) 1979, 28, 126–135. [Google Scholar] [CrossRef] [Scilit]
- Marengo, J.A.; Tomasella, J.; Alves, L.M.; Soares, W.R.; Rodriguez, D.A. The Drought of 2010 in the Context of Historical Droughts in the Amazon Region. Geophys. Res. Lett. 2011, 38, L12703. [Google Scholar] [CrossRef] [Scilit]
- Fonseca, C.d.O.; Valadão, R.C. Dinâmica espacial da Serra do Gandarela e entorno: Uma análise a partir de representações coremáticas. Soc. Nat. 2017, 29, 309–321. [Google Scholar] [CrossRef] [Scilit]
- Santos, A.R.d.; Chimalli, T.; Peluzio, J.B.E.; da Silva, A.G.; dos Santos, G.M.A.D.A.; Lorenzon, A.S.; Teixeira, T.R.; de Castro, N.L.M.; Soares Ribeiro, C.A.A. Influence of Relief on Permanent Preservation Areas. Sci. Total Environ. 2016, 541, 1296–1302. [Google Scholar] [CrossRef] [Scilit] [PubMed]
- Gonçalves-Souza, D.; Vilela, B.; Phalan, B.; Dobrovolski, R. The Role of Protected Areas in Maintaining Natural Vegetation in Brazil. Sci. Adv. 2021, 7, eabh2932. [Google Scholar] [CrossRef] [Scilit] [PubMed]
- Araújo, F.M.d.; Ferreira, L.G.; Arantes, A.E. Distribution Patterns of Burned Areas in the Brazilian Biomes: An Analysis Based on Satellite Data for the 2002–2010 Period. Remote Sens. 2012, 4, 1929–1946. [Google Scholar] [CrossRef] [Scilit]
- Brando, P.M.; Soares-Filho, B.; Rodrigues, L.; Assunção, A.; Morton, D.; Tuchschneider, D.; Fernandes, E.C.M.; Macedo, M.N.; Oliveira, U.; Coe, M.T. The Gathering Firestorm in Southern Amazonia. Sci. Adv. 2020, 6, eaay1632. [Google Scholar] [CrossRef] [Scilit]
- Strashok, O.; Ziemiańska, M.; Strashok, V. Evaluation and Correlation of Normalized Vegetation Index and Moisture Index in Kyiv (2017–2021). J. Ecol. Eng. 2022, 23, 212–218. [Google Scholar] [CrossRef] [Scilit]
- Tucker, C.J. Red and Photographic Infrared Linear Combinations for Monitoring Vegetation. Remote Sens. Environ. 1979, 8, 127–150. [Google Scholar] [CrossRef] [Scilit]
- Pettorelli, N.; Vik, J.O.; Mysterud, A.; Gaillard, J.-M.; Tucker, C.J.; Stenseth, N.C. Using the Satellite-Derived NDVI to Assess Ecological Responses to Environmental Change. Trends Ecol. Evol. 2005, 20, 503–510. [Google Scholar] [CrossRef] [Scilit] [PubMed]
- Zhang, X.; Friedl, M.A.; Schaaf, C.B. Global Vegetation Phenology from Moderate Resolution Imaging Spectroradiometer (MODIS): Evaluation of Global Patterns and Comparison with in Situ Measurements. J. Geophys. Res. Biogeosciences 2006, 111, G04017. [Google Scholar] [CrossRef] [Scilit]
- Coelho, C.A.S.; de Oliveira, C.P.; Ambrizzi, T.; Reboita, M.S.; Carpenedo, C.B.; Campos, J.L.P.S.; Tomaziello, A.C.N.; Pampuch, L.A.; Custódio, M.d.S.; Dutra, L.M.M.; et al. The 2014 Southeast Brazil Austral Summer Drought: Regional Scale Mechanisms and Teleconnections. Clim. Dyn. 2016, 46, 3737–3752. [Google Scholar] [CrossRef] [Scilit]
- Marengo, J.A.; Espinoza, J.C. Extreme Seasonal Droughts and Floods in Amazonia: Causes, Trends and Impacts. Int. J. Climatol. 2016, 36, 1033–1050. [Google Scholar] [CrossRef] [Scilit]
- Delbart, N.; Kergoat, L.; Le Toan, T.; Lhermitte, J.; Picard, G. Determination of Phenological Dates in Boreal Regions Using Normalized Difference Water Index. Remote Sens. Environ. 2005, 97, 26–38. [Google Scholar] [CrossRef] [Scilit]
- Gu, Y.; Brown, J.F.; Verdin, J.P.; Wardlow, B. A Five-Year Analysis of MODIS NDVI and NDWI for Grassland Drought Assessment over the Central Great Plains of the United States. Geophys. Res. Lett. 2007, 34, L06407. [Google Scholar] [CrossRef] [Scilit]
- Swathandran, S.; Aslam, M.A.M. Assessing the Role of SWIR Band in Detecting Agricultural Crop Stress: A Case Study of Raichur District, Karnataka, India. Environ. Monit. Assess. 2019, 191, 442. [Google Scholar] [CrossRef] [Scilit]
- Oliva, M.; Maffia, A.; Marra, F.; Canino, F.; Battaglia, S.; Mallamaci, C.; Muscolo, A. The complex impacts of fire on soil ecosystems: Insights from the 2021 Aspromonte National Park wildfire. J. For. Res. 2025, 36, 68. [Google Scholar] [CrossRef] [Scilit]
- Davidson, E.A.; de Araújo, A.C.; Artaxo, P.; Balch, J.K.; Brown, I.F.; Bustamante, M.M.C.; Coe, M.T.; DeFries, R.S.; Keller, M.; Longo, M.; et al. The Amazon Basin in Transition. Nature 2012, 481, 321–328. [Google Scholar] [CrossRef] [Scilit]
- Anderson, L.O.; Ribeiro Neto, G.; Cunha, A.P.; Fonseca, M.G.; Mendes de Moura, Y.; Dalagnol, R.; Wagner, F.H.; de Aragão, L.E.O.e.C. Vulnerability of Amazonian Forests to Repeated Droughts. Philos. Trans. R. Soc. Lond. B Biol. Sci. 2018, 373, 20170411. [Google Scholar] [CrossRef] [Scilit]
- Bonan, G.B. Forests and Climate Change: Forcings, Feedbacks, and the Climate Benefits of Forests. Science 2008, 320, 1444–1449. [Google Scholar] [CrossRef] [Scilit]
- Le Quéré, C.; Andrew, R.M.; Friedlingstein, P.; Sitch, S.; Hauck, J.; Pongratz, J.; Pickers, P.A.; Korsbakken, J.I.; Peters, G.P.; Canadell, J.G.; et al. Global Carbon Budget 2018. Earth Syst. Sci. Data 2018, 10, 2141–2194. [Google Scholar] [CrossRef] [Scilit]
- Brando, P.M.; Paolucci, L.; Ummenhofer, C.C.; Ordway, E.M.; Hartmann, H.; Cattau, M.E.; Rattis, L.; Medjibe, V.; Coe, M.T.; Balch, J. Droughts, Wildfires, and Forest Carbon Cycling: A Pantropical Synthesis. Annu. Rev. Earth Planet. Sci. 2019, 47, 555–581. [Google Scholar] [CrossRef] [Scilit]
- Dietze, E.; Mangelsdorf, K.; Andreev, A.; Karger, C.; Hopmans, E.C.; Schreuder, L.T.; Sachse, D.; Rach, O.; Nowaczyk, N.; Herzschuh, U. Anhydrosugars in Sediments Pf Lake El’gygytgyn—Fire Regime Reconstructions of Ne Siberia During the Last Two Interglacials; European Association of Geoscientists & Engineers: Kosterijland, The Netherlands, 2019; Volume 2019, pp. 1–2. [Google Scholar]
- Shimabukuro, Y.E.; Pereira, G.; Cardozo, F.S.; Stockler, R.; Freitas, S.R.; Coura, S.M.C. Biomass Burning Emission Estimation in Amazon Tropical Forest. In Earth Observation of Ecosystem Services; CRC Press: Boca Raton, FL, USA, 2013. [Google Scholar]
- Guedes, B.J.; Massi, K.G.; Evers, C.; Nielsen-Pincus, M. Vulnerability of Small Forest Patches to Fire in the Paraiba Do Sul River Valley, Southeast Brazil: Implications for Restoration of the Atlantic Forest Biome. For. Ecol. Manag. 2020, 465, 118095. [Google Scholar] [CrossRef] [Scilit]
- De Lima, R.A.F.; Oliveira, A.A.; Pitta, G.R.; de Gasper, A.L.; Vibrans, A.C.; Chave, J.; ter Steege, H.; Prado, P.I. The Erosion of Biodiversity and Biomass in the Atlantic Forest Biodiversity Hotspot. Nat. Commun. 2020, 11, 6347. [Google Scholar] [CrossRef] [Scilit] [PubMed]
- Armenteras, D.; González, T.M.; Retana, J. Forest Fragmentation and Edge Influence on Fire Occurrence and Intensity under Different Management Types in Amazon Forests. Biol. Conserv. 2013, 159, 73–79. [Google Scholar] [CrossRef] [Scilit]
- de Andrade, C.F.; Duarte, J.B.; Barbosa, M.L.F.; de Andrade, M.D.; de Oliveira, R.O.; Delgado, R.C.; Pereira, M.G.; Batista, T.S.; Teodoro, P.E. Fire Outbreaks in Extreme Climate Years in the State of Rio de Janeiro, Brazil. Land Degrad. Dev. 2019, 30, 1379–1389. [Google Scholar] [CrossRef] [Scilit]
- da Cruz, C.G.S.; Delgado, R.C.; Pereira, M.G.; Wanderley, H.S. Changes in Gross Primary Productivity: A Past and Future Approach to Climate, Land Use and Wildfires in the Western Amazon, Brazil. Environ. Dev. 2025, 54, 101150. [Google Scholar] [CrossRef] [Scilit]
- Rodrigues, M.; de la Riva, J.; Domingo, D.; Lamelas, T.; Ibarra, P.; Hoffrén, R.; García-Martín, A. An Empirical Assessment of the Potential of Post-Fire Recovery of Tree-Forest Communities in Mediterranean Environments. For. Ecol. Manag. 2024, 552, 121587. [Google Scholar] [CrossRef] [Scilit]
- Diniz, F.R.; Miranda, G.S.B.; Piacenti-Silva, M.; Machado, J.P. O Impacto do El Niño nos Focos de Incêndio e Desconforto Térmico Humano no Brasil no Período entre o Verão de 2014/2015 e o Outono de 2016. Anuário Inst. Geociências 2019, 42, 192–201. [Google Scholar] [CrossRef] [Scilit]
- Cavalcante, R.B.L.; Pontes, P.R.M.; Tedeschi, R.G.; Costa, C.P.W.; Ferreira, D.B.S.; Souza-Filho, P.W.M.; de Souza, E.B. Terrestrial Water Storage and Pacific SST Affect the Monthly Water Balance of Itacaiúnas River Basin (Eastern Amazonia). Int. J. Climatol. 2020, 40, 3021–3035. [Google Scholar] [CrossRef] [Scilit]
- Grimm, A.M.; Barros, V.R.; Doyle, M.E. Climate Variability in Southern South America Associated with El Niño and La Niña Events. J. Clim. 2000, 13, 35–58. [Google Scholar] [CrossRef] [Scilit]
- Chen, Y.; Morton, D.C.; Andela, N.; van der Werf, G.R.; Giglio, L.; Randerson, J.T. A Pan-Tropical Cascade of Fire Driven by El Niño/Southern Oscillation. Nat. Clim. Change 2017, 7, 906–911. [Google Scholar] [CrossRef] [Scilit]
- Monteiro, R.R.; Pinheiro, A.P.; Beijamim, A.S.; de Assis, C.F.; Schiavetti, A. Direito e Política Nacional Do Meio Ambiente: Os desafios enfrentados na atualidade no Brasil (2019–2021). Res. Soc. Dev. 2022, 11, e20611729766. [Google Scholar] [CrossRef] [Scilit]
- Abatzoglou, J.T.; Williams, A.P. Impact of Anthropogenic Climate Change on Wildfire across Western US Forests. Proc. Natl. Acad. Sci. USA 2016, 113, 11770–11775. [Google Scholar] [CrossRef] [Scilit]
- Westerling, A.L. Increasing Western US Forest Wildfire Activity: Sensitivity to Changes in the Timing of Spring. Philos. Trans. R. Soc. Lond. B Biol. Sci. 2016, 371, 20150178. [Google Scholar] [CrossRef] [Scilit]
- Kitzberger, T.; Falk, D.A.; Westerling, A.L.; Swetnam, T.W. Direct and Indirect Climate Controls Predict Heterogeneous Early-Mid 21st Century Wildfire Burned Area across Western and Boreal North America. PLoS ONE 2017, 12, e0188486. [Google Scholar] [CrossRef] [Scilit]
- Holden, Z.A.; Swanson, A.; Luce, C.H.; Jolly, W.M.; Maneta, M.; Oyler, J.W.; Warren, D.A.; Parsons, R.; Affleck, D. Decreasing Fire Season Precipitation Increased Recent Western US Forest Wildfire Activity. Proc. Natl. Acad. Sci. USA 2018, 115, E8349–E8357. [Google Scholar] [CrossRef] [Scilit] [PubMed]
- Ishikawa, N.I. Uso de Transformações em Modelos de Regressão Logística. dissertação, Universidade de São Paulo, São Paulo, Brazil, 2007. Available online: https://teses.usp.br/teses/disponiveis/45/45133/tde-05062007-202656/pt-br.html (accessed on 22 April 2026).
- Rodríguez-Barranco, M.; Tobías, A.; Redondo, D.; Molina-Portillo, E.; Sánchez, M.J. Standardizing Effect Size from Linear Regression Models with Log-Transformed Variables for Meta-Analysis. BMC Med. Res. Methodol. 2017, 17, 44. [Google Scholar] [CrossRef] [Scilit]
- Zhao, Y.; Huang, Z.; Gong, L.; Zhu, Y.; Yu, Q.; Gao, Y. Evaluating the Impact of Data Transformation Techniques on the Performance and Interpretability of Software Defect Prediction Models. IET Softw. 2023, 2023, 6293074. [Google Scholar] [CrossRef] [Scilit]
- Giglio, L.; Schroeder, W.; Justice, C.O. The Collection 6 MODIS Active Fire Detection Algorithm and Fire Products. Remote Sens. Environ. 2016, 178, 31–41. [Google Scholar] [CrossRef] [Scilit]
- Taylor, S.W.; Alexander, M.E. Science, Technology, and Human Factors in Fire Danger Rating: The Canadian Experience. Int. J. Wildland Fire 2006, 15, 121–135. [Google Scholar] [CrossRef] [Scilit]
- El Niño and La Niña Years and Intensities. Available online: https://ggweather.com/enso/oni.htm (accessed on 28 January 2026).
- Cai, W.; McPhaden, M.J.; Grimm, A.M.; Rodrigues, R.R.; Taschetto, A.S.; Garreaud, R.D.; Dewitte, B.; Poveda, G.; Ham, Y.-G.; Santoso, A.; et al. Climate Impacts of the El Niño–Southern Oscillation on South America. Nat. Rev. Earth Environ. 2020, 1, 215–231. [Google Scholar] [CrossRef] [Scilit]
- Grimm, A.M. Interannual Climate Variability in South America: Impacts on Seasonal Precipitation, Extreme Events, and Possible Effects of Climate Change. Stoch. Environ. Res. Risk Assess. 2011, 25, 537–554. [Google Scholar] [CrossRef] [Scilit]
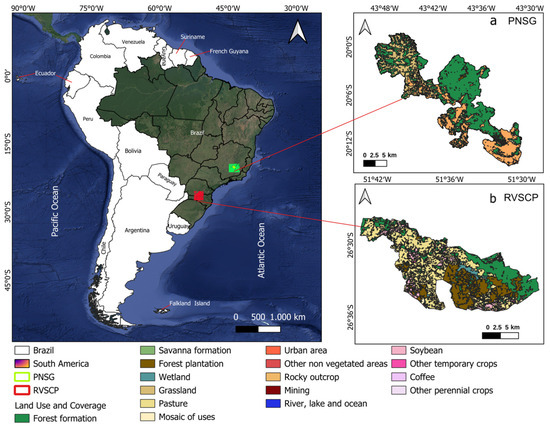
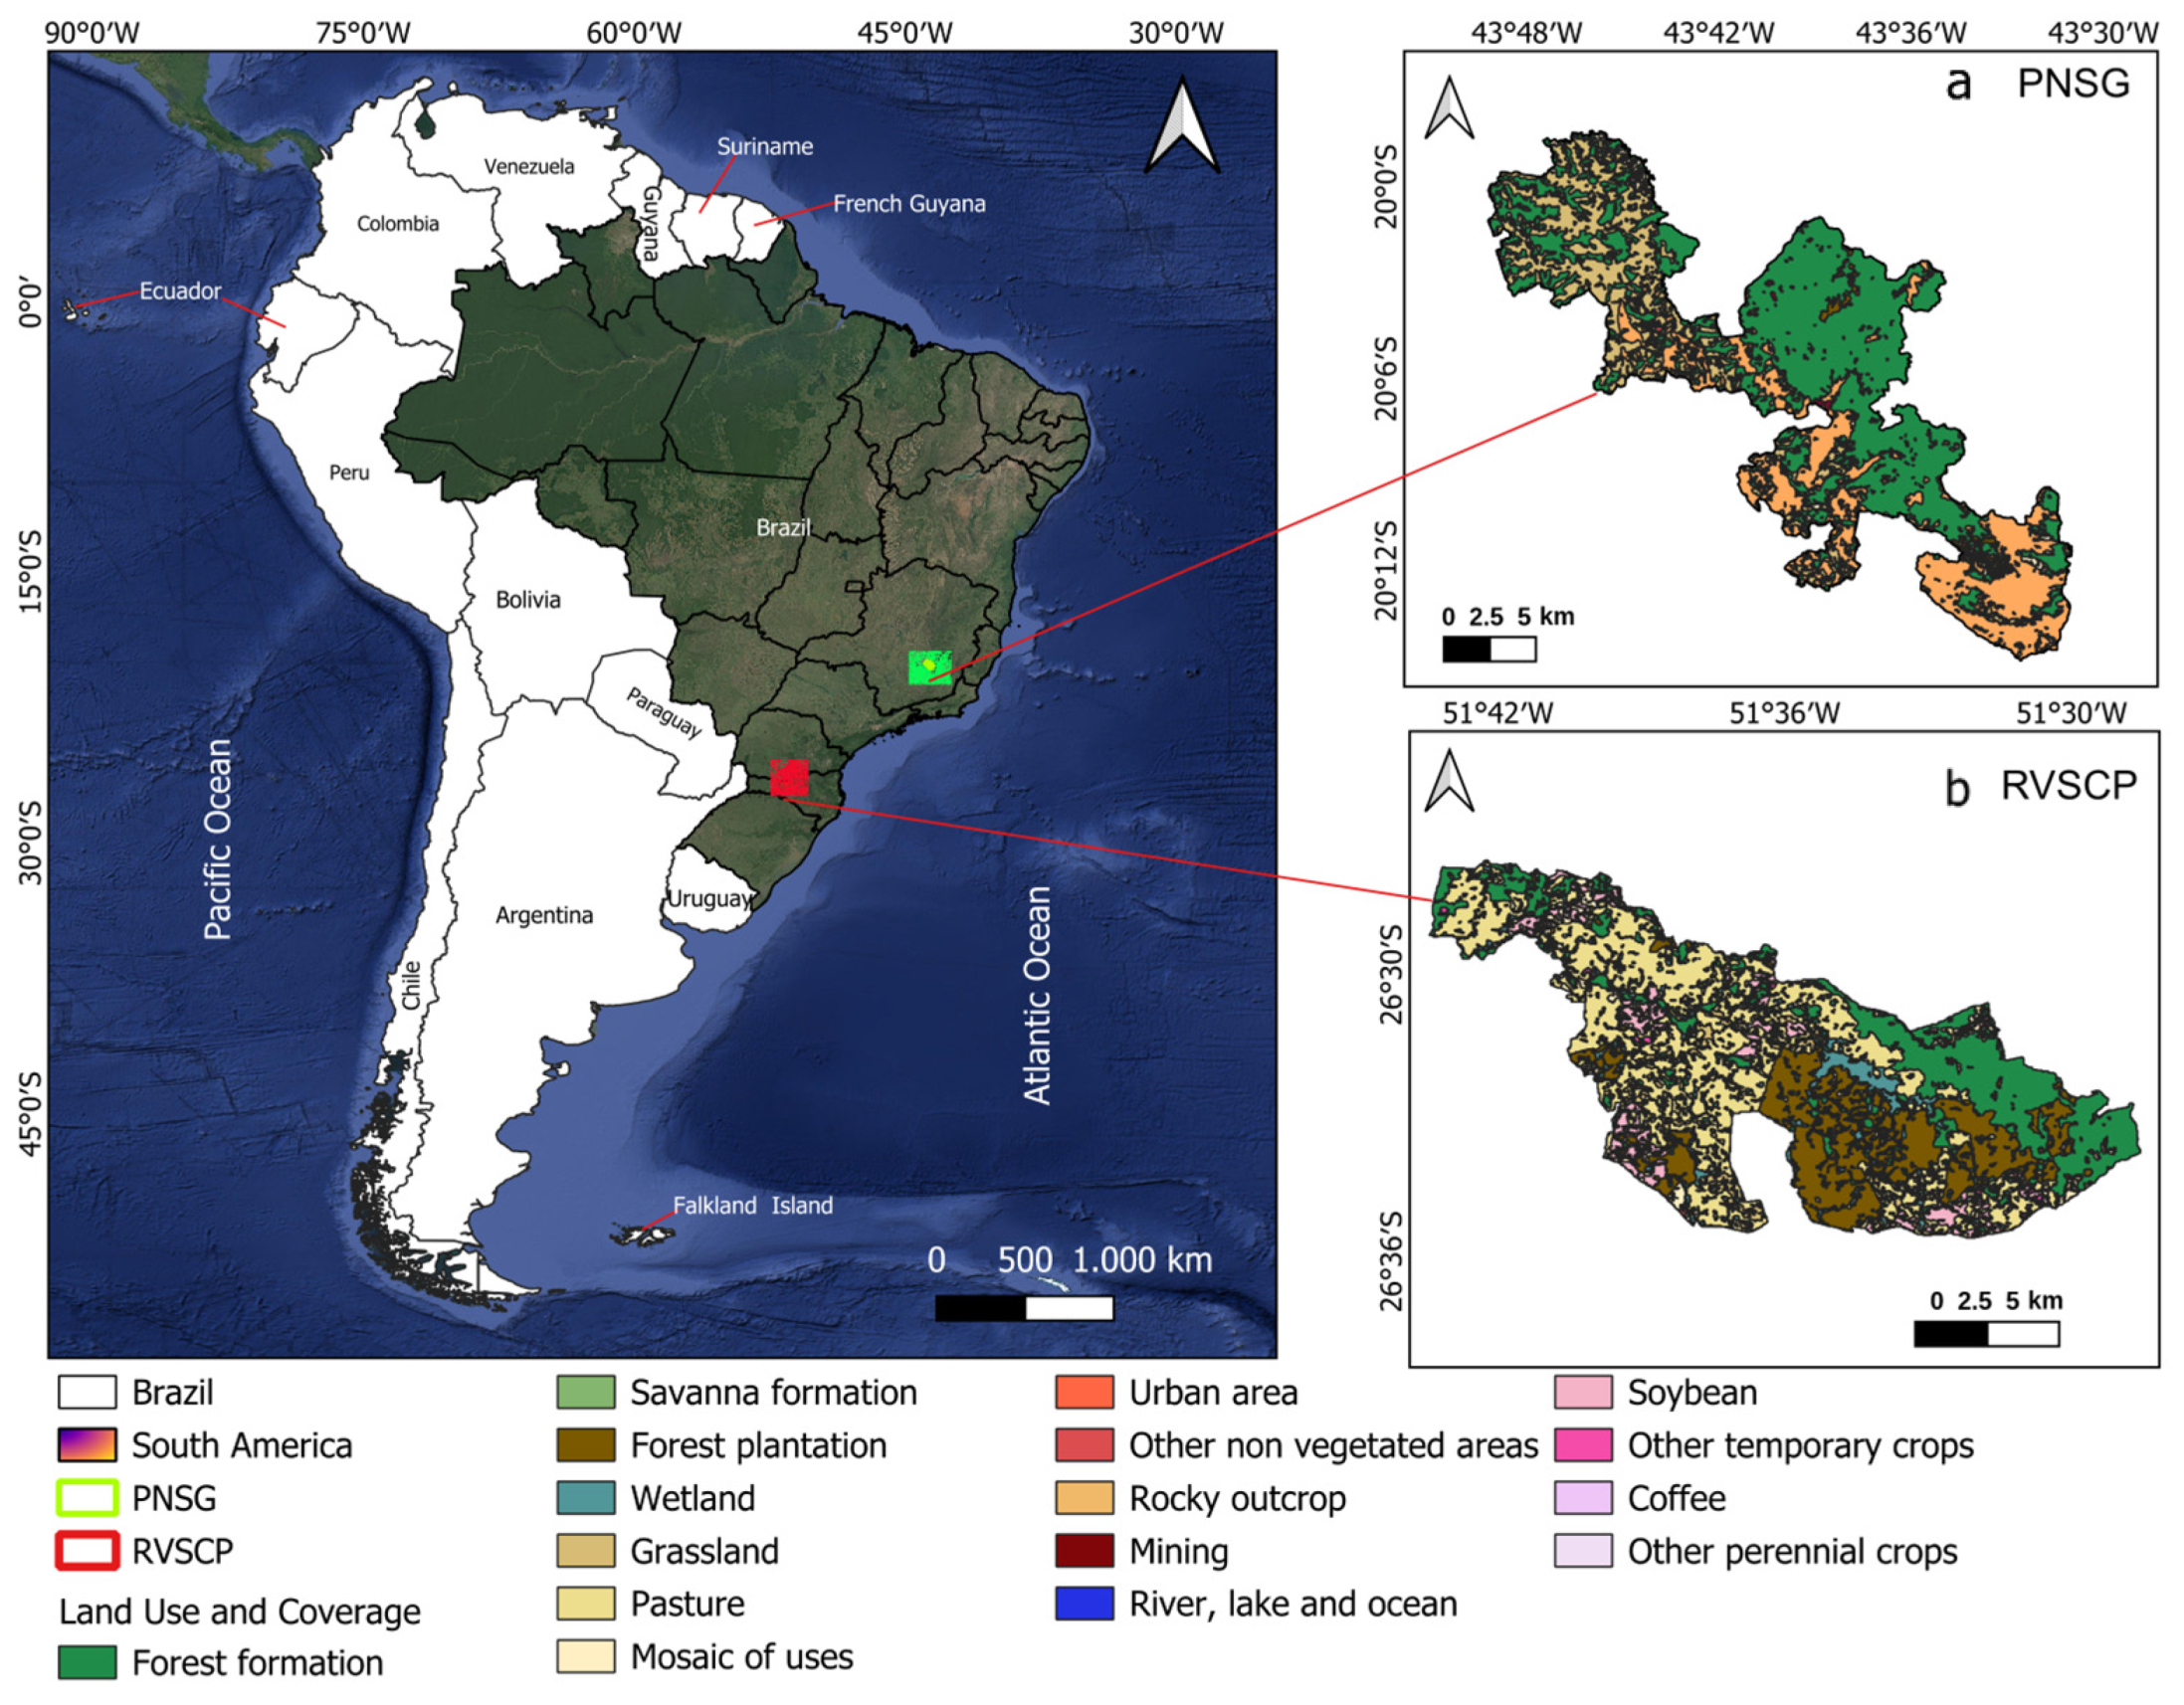
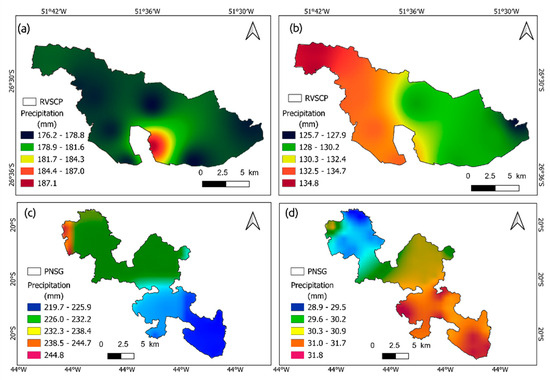
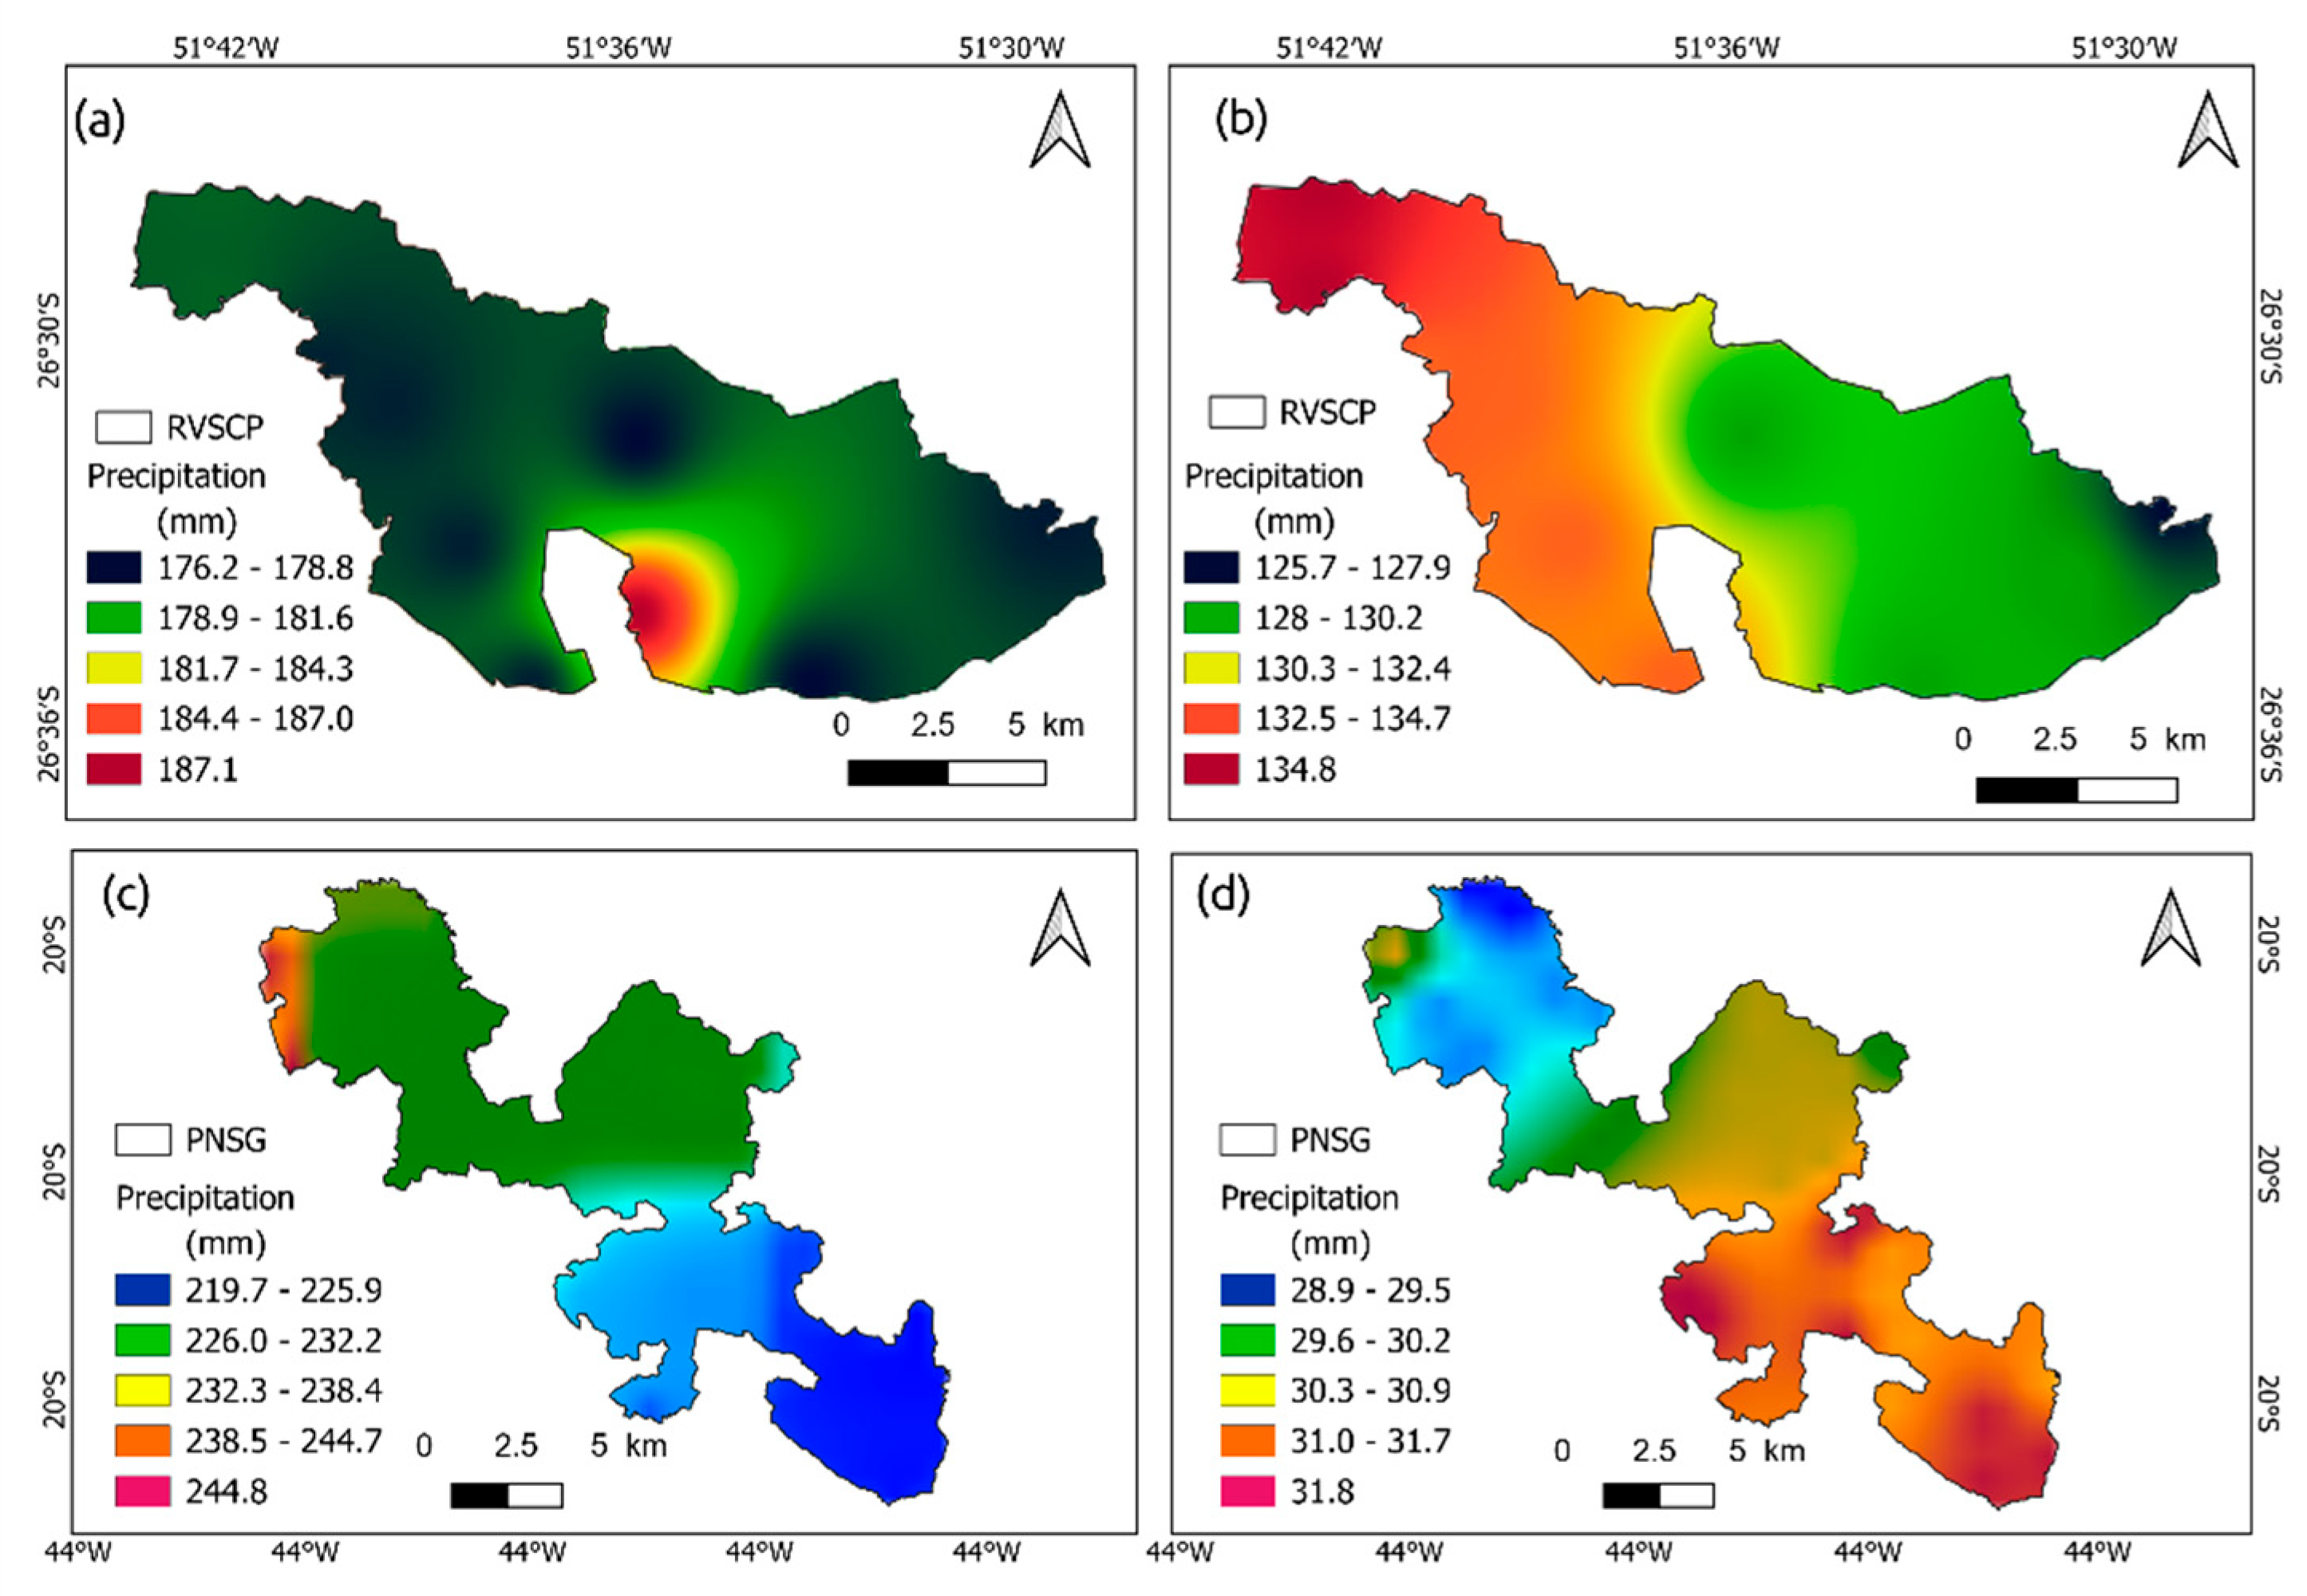
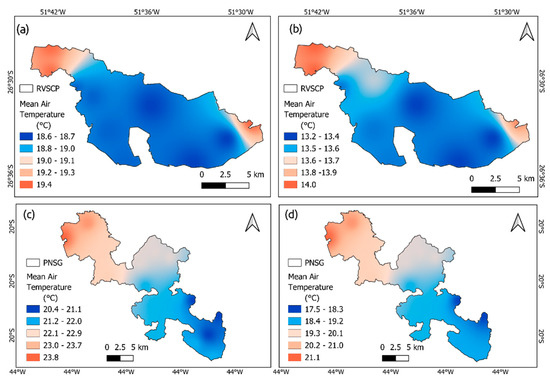
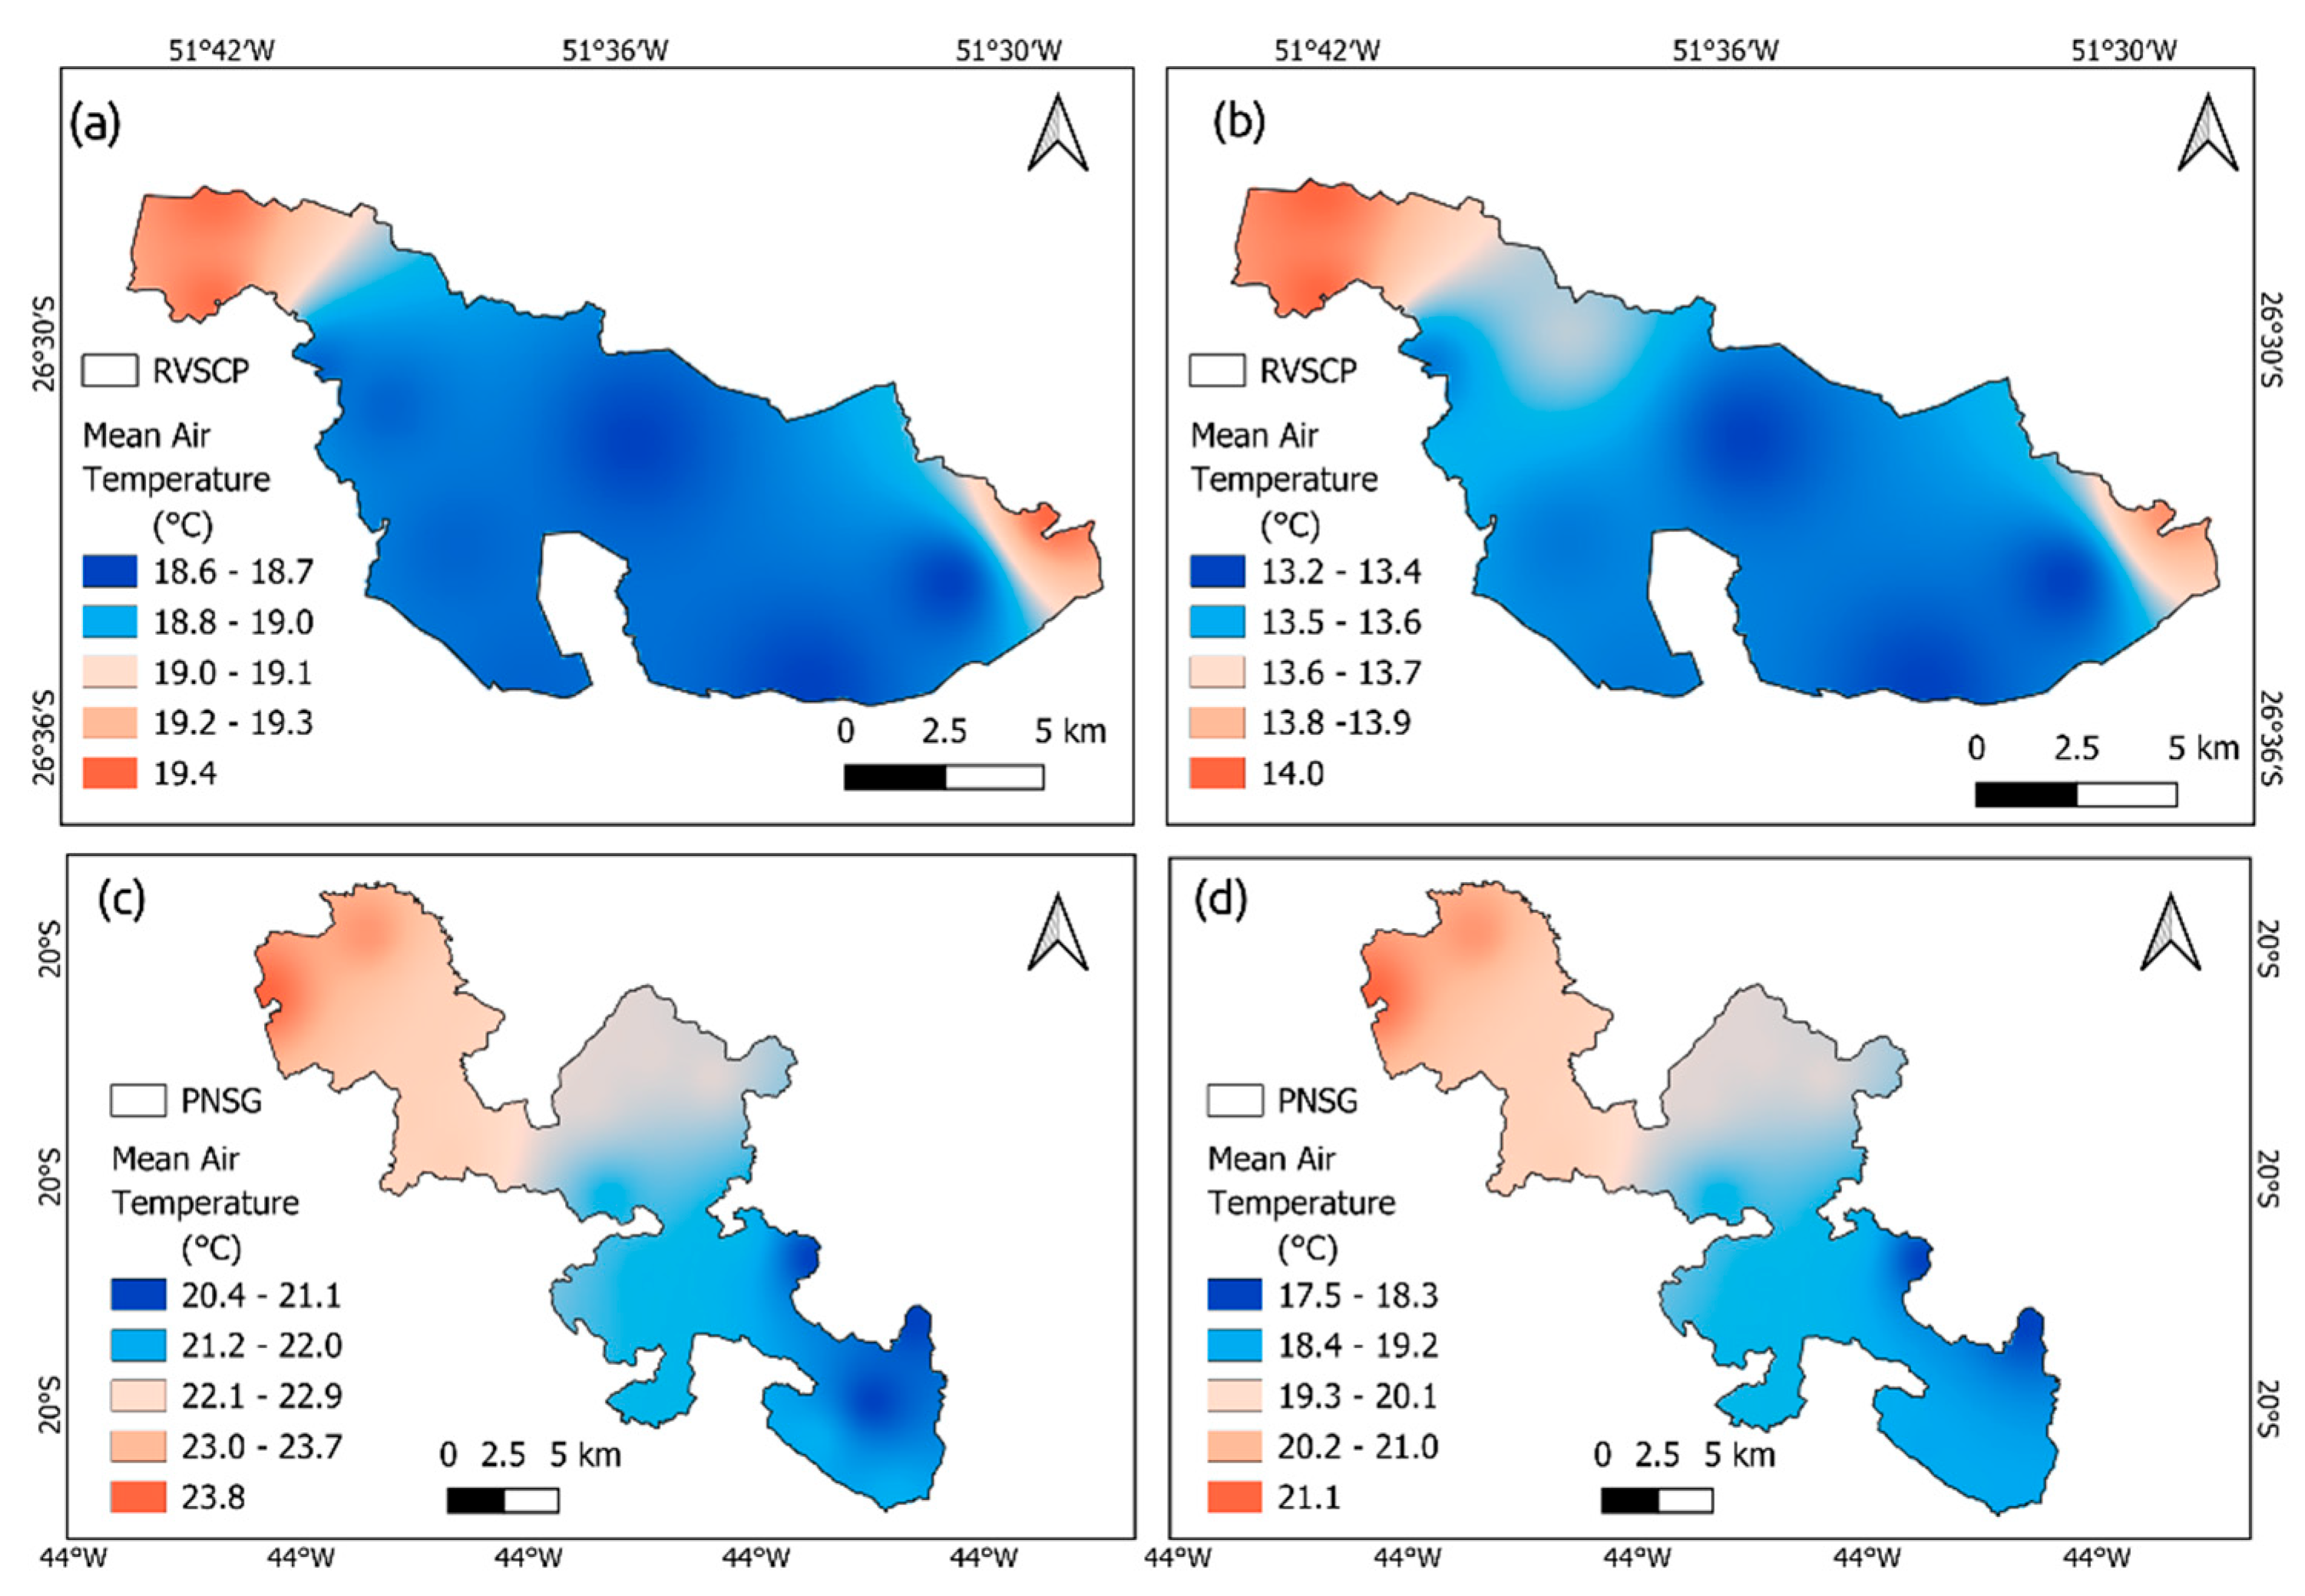
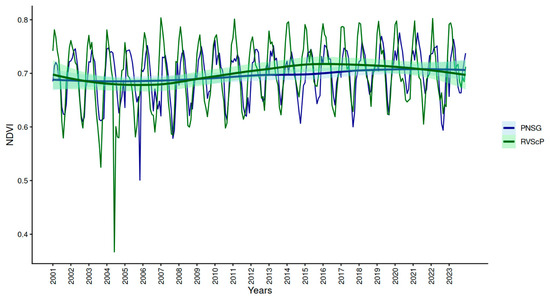
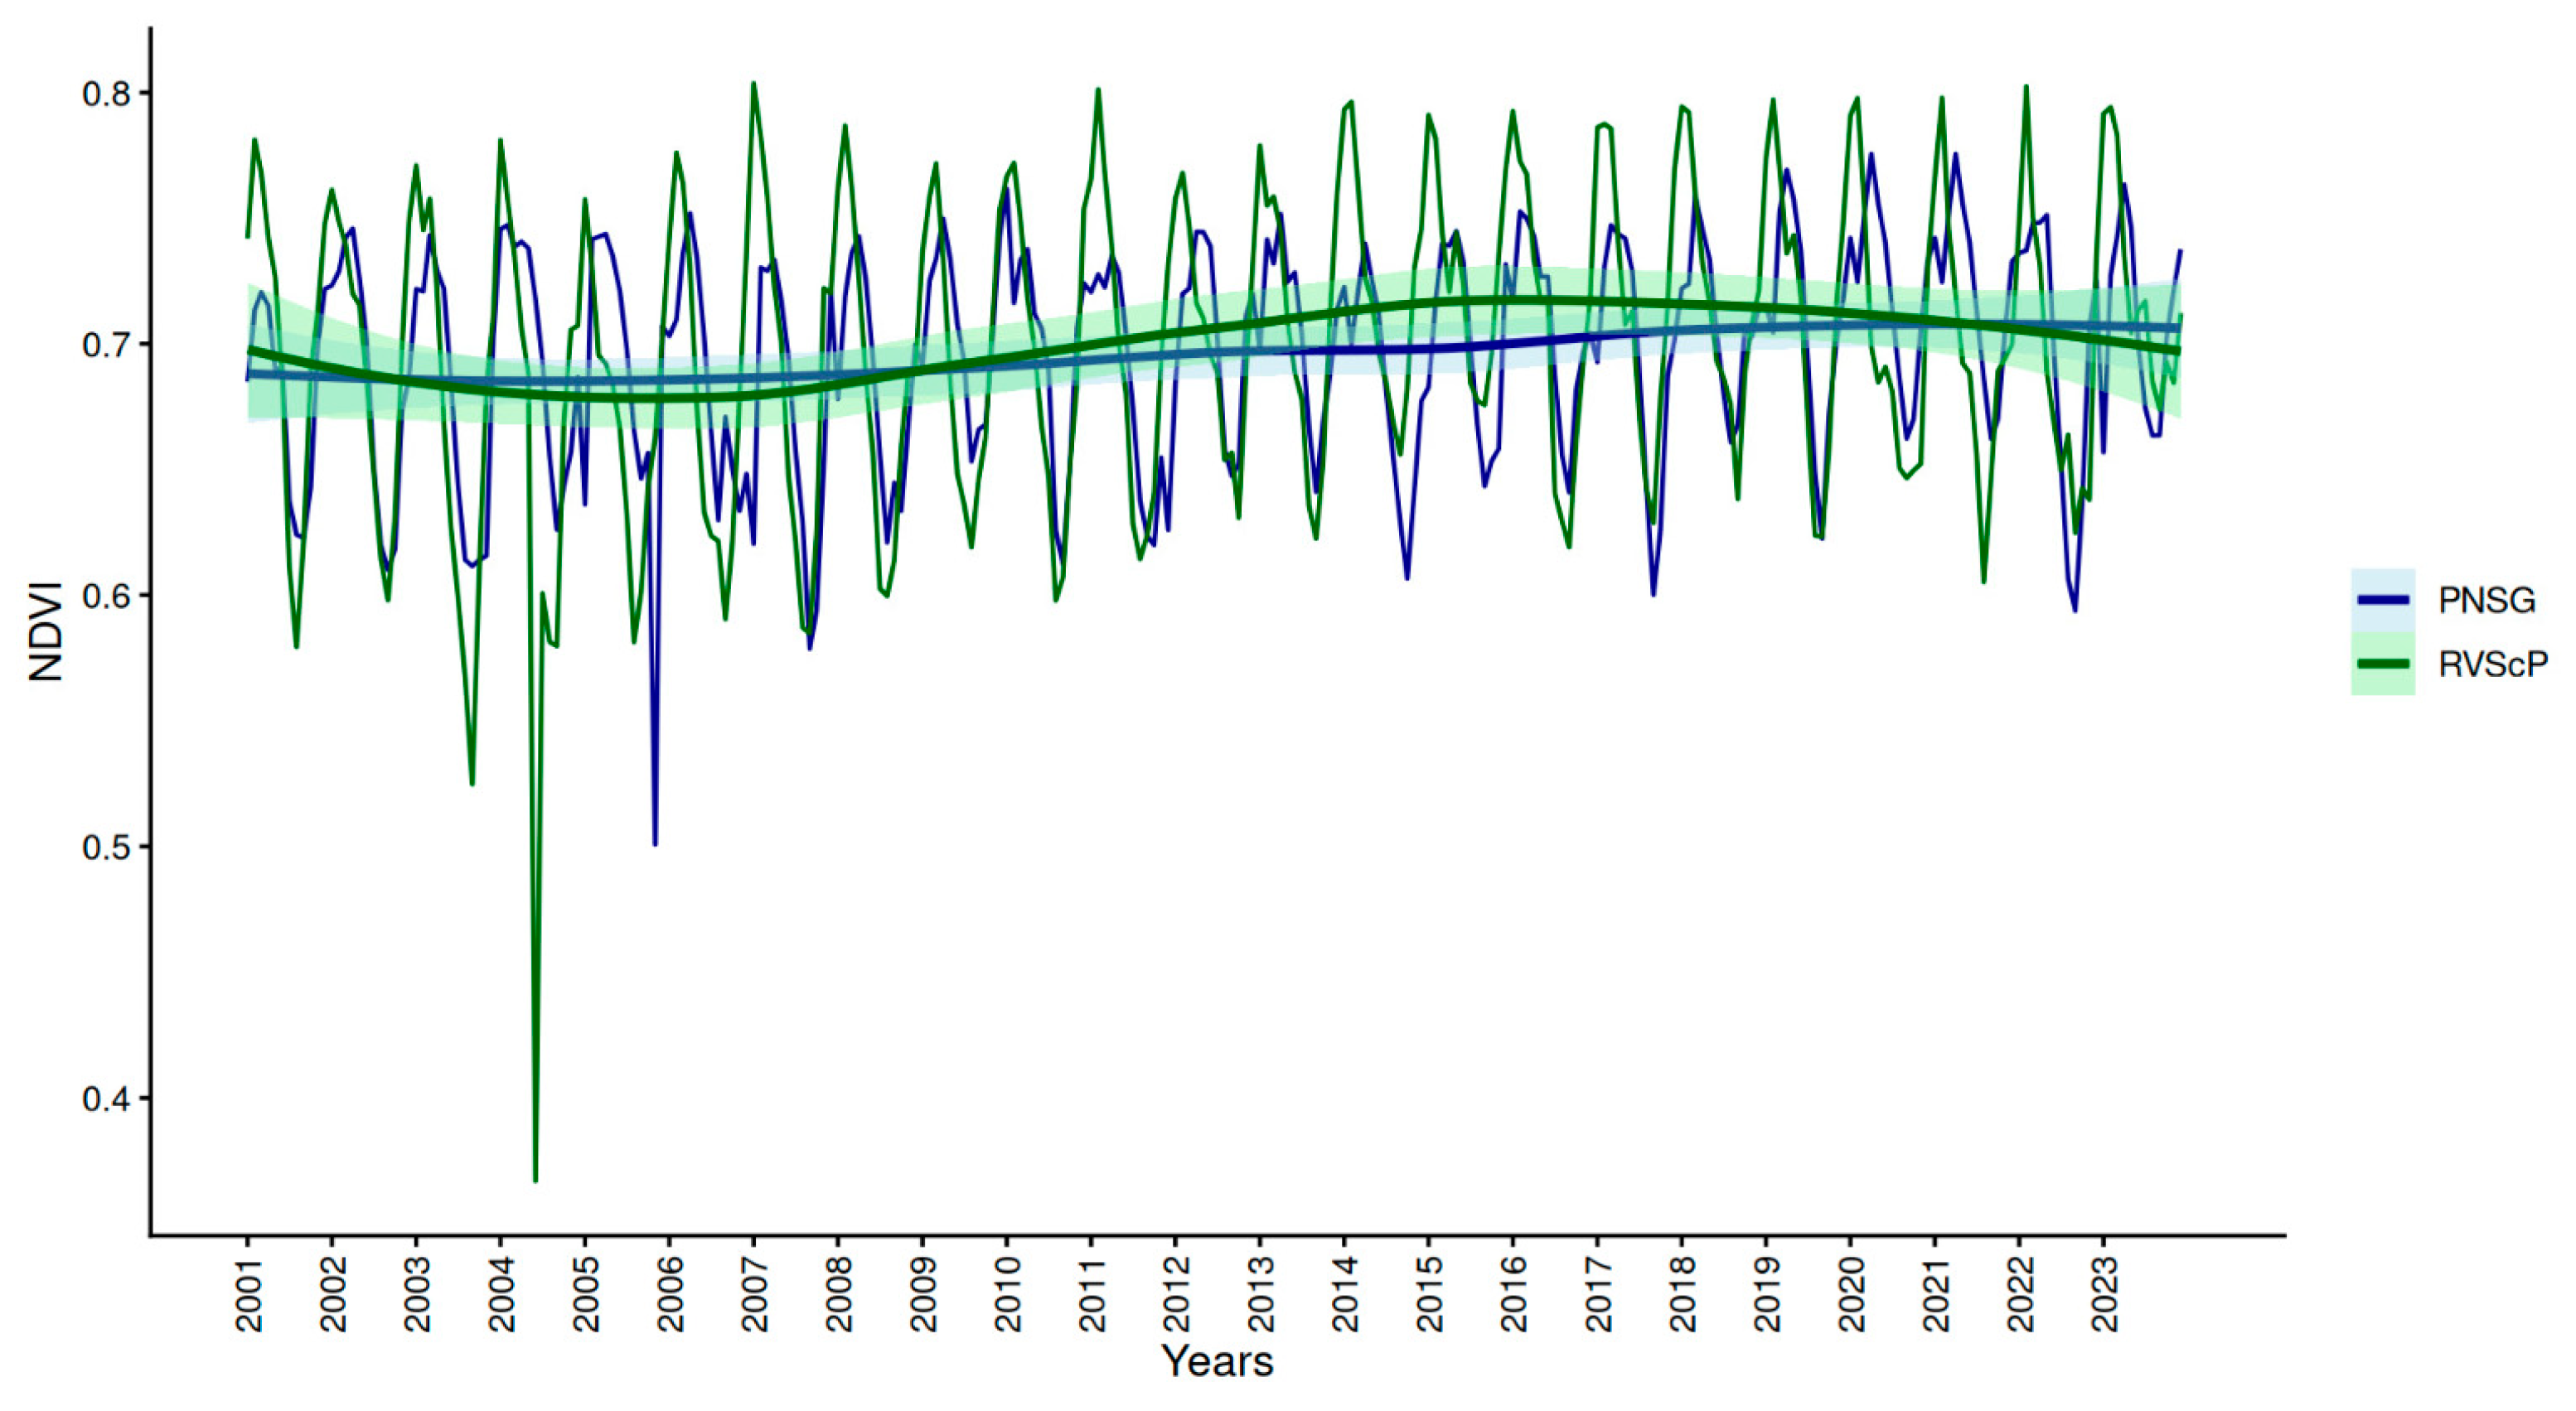
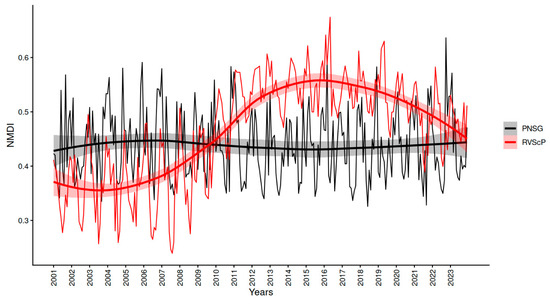
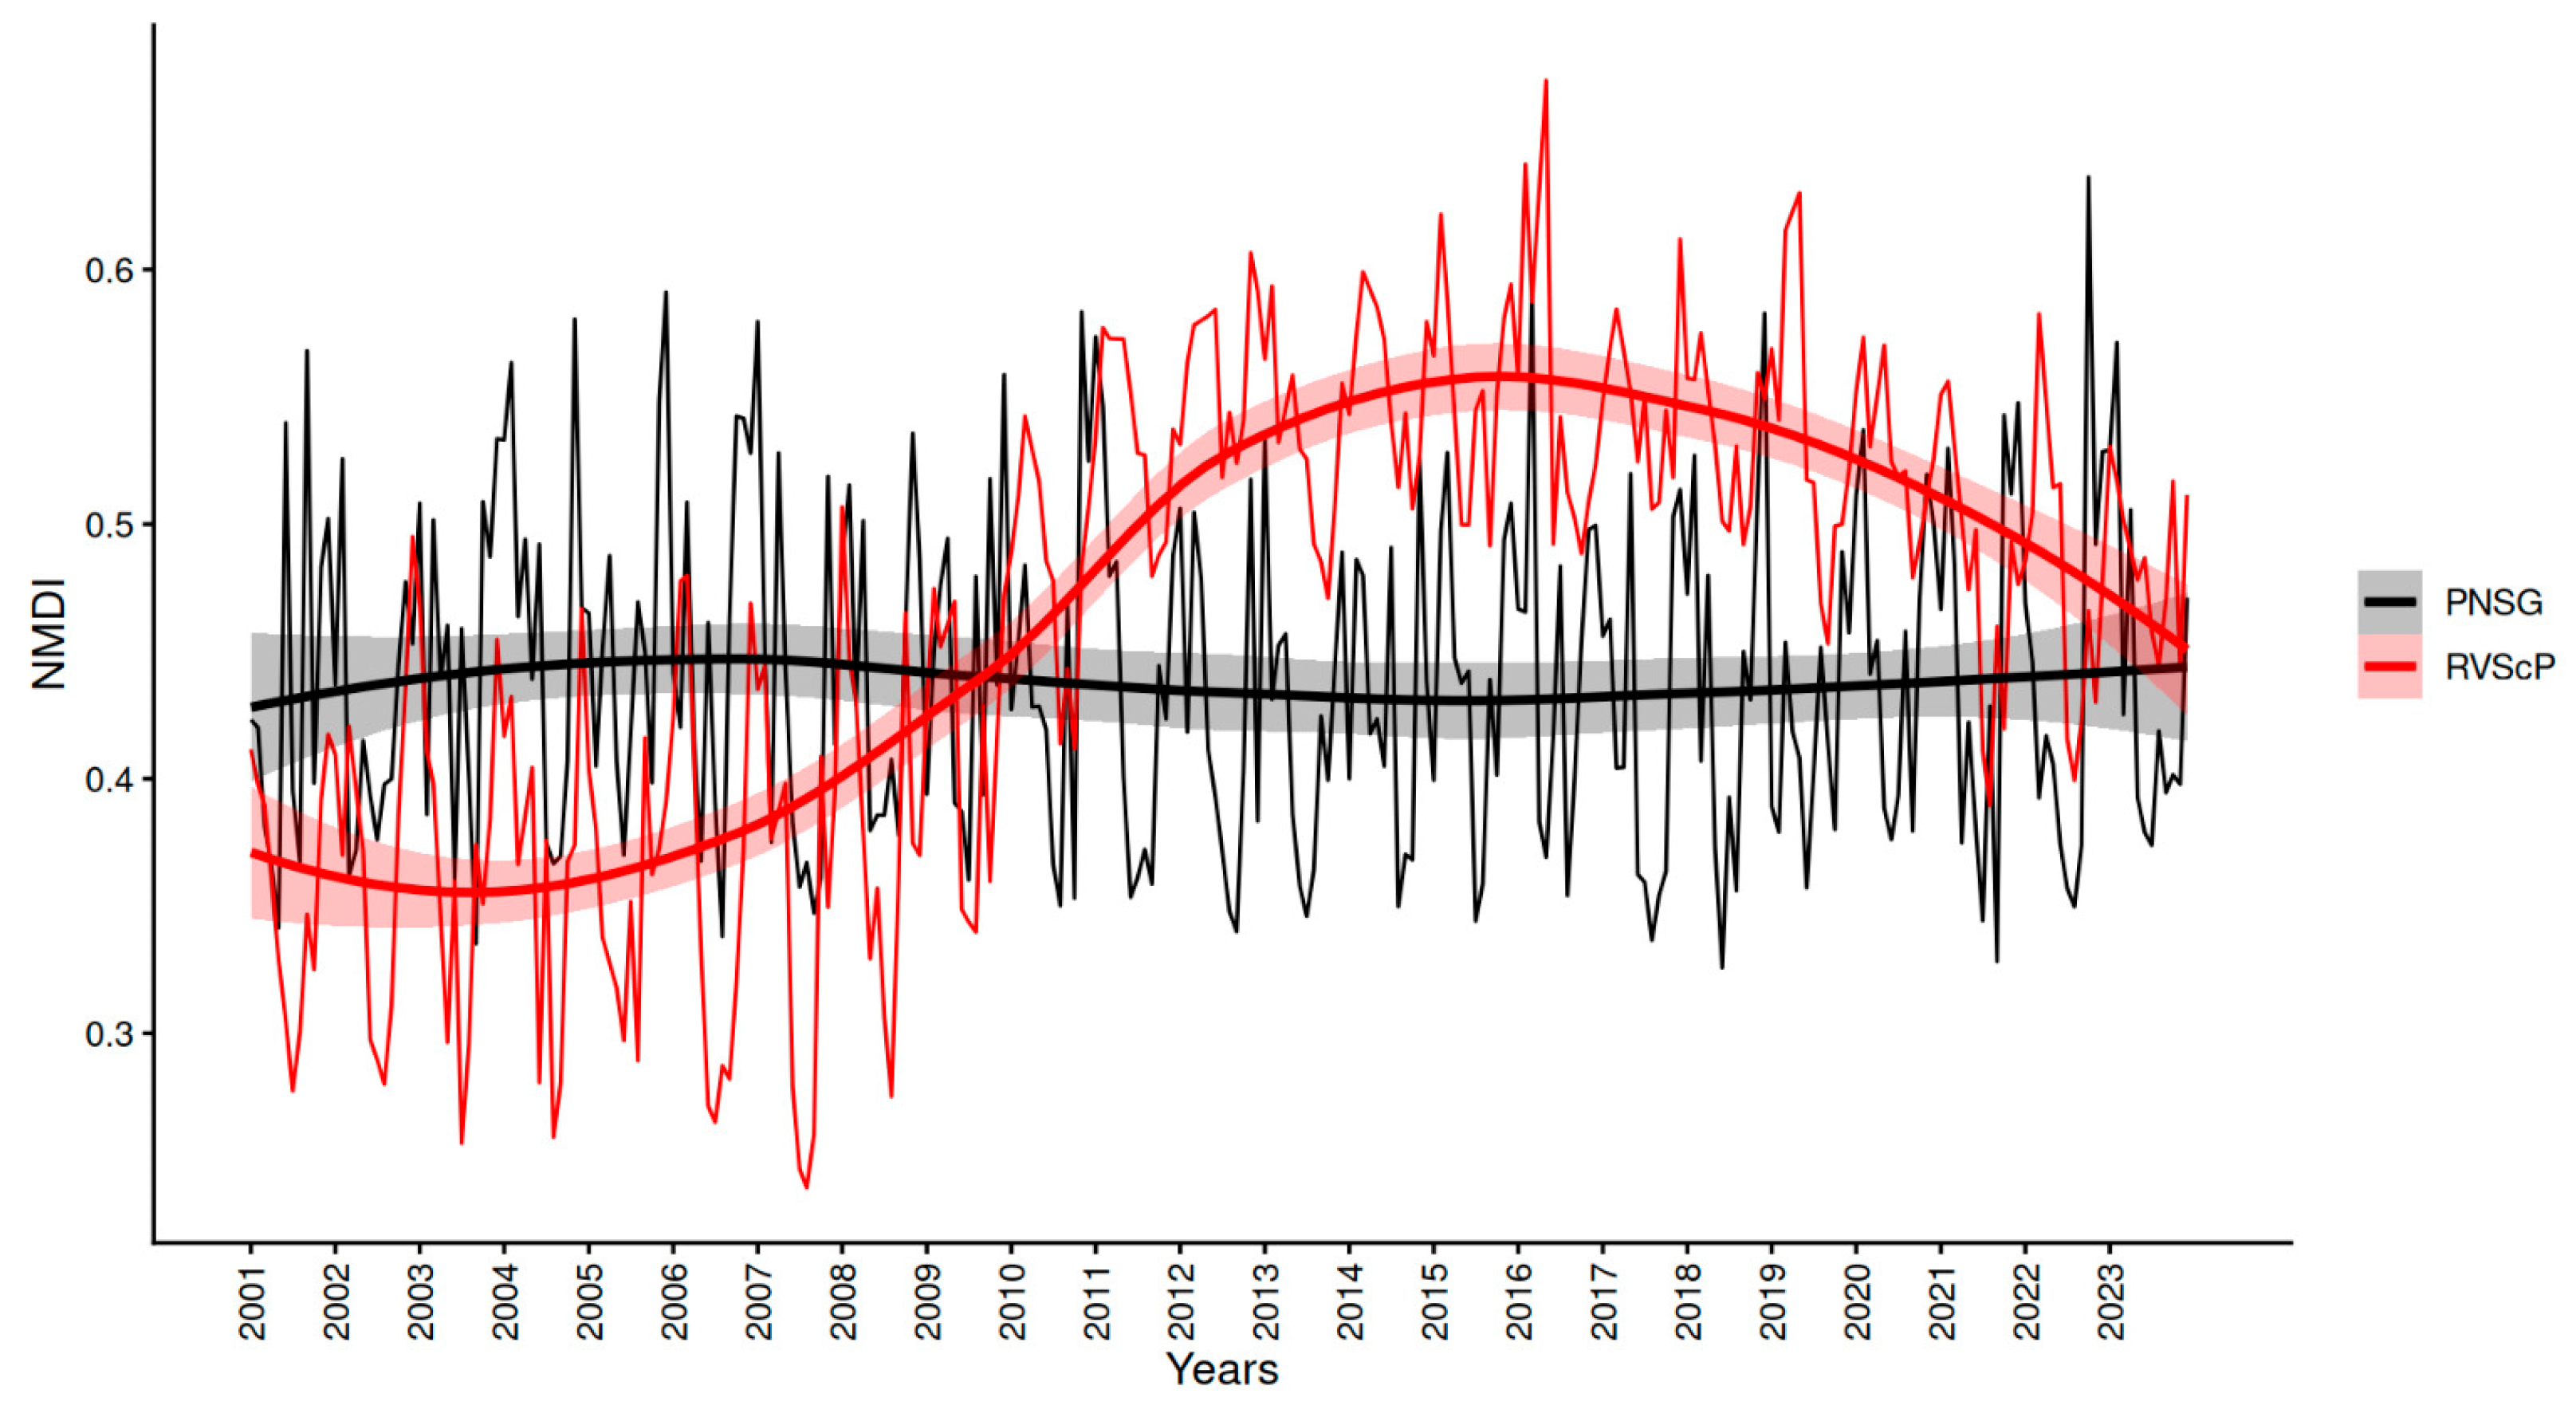
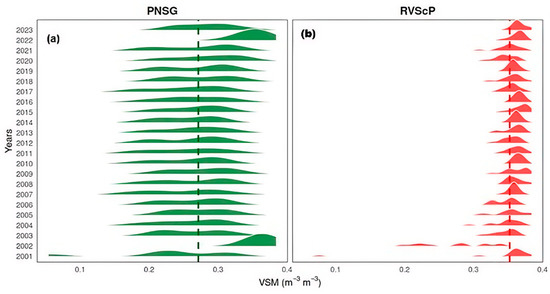
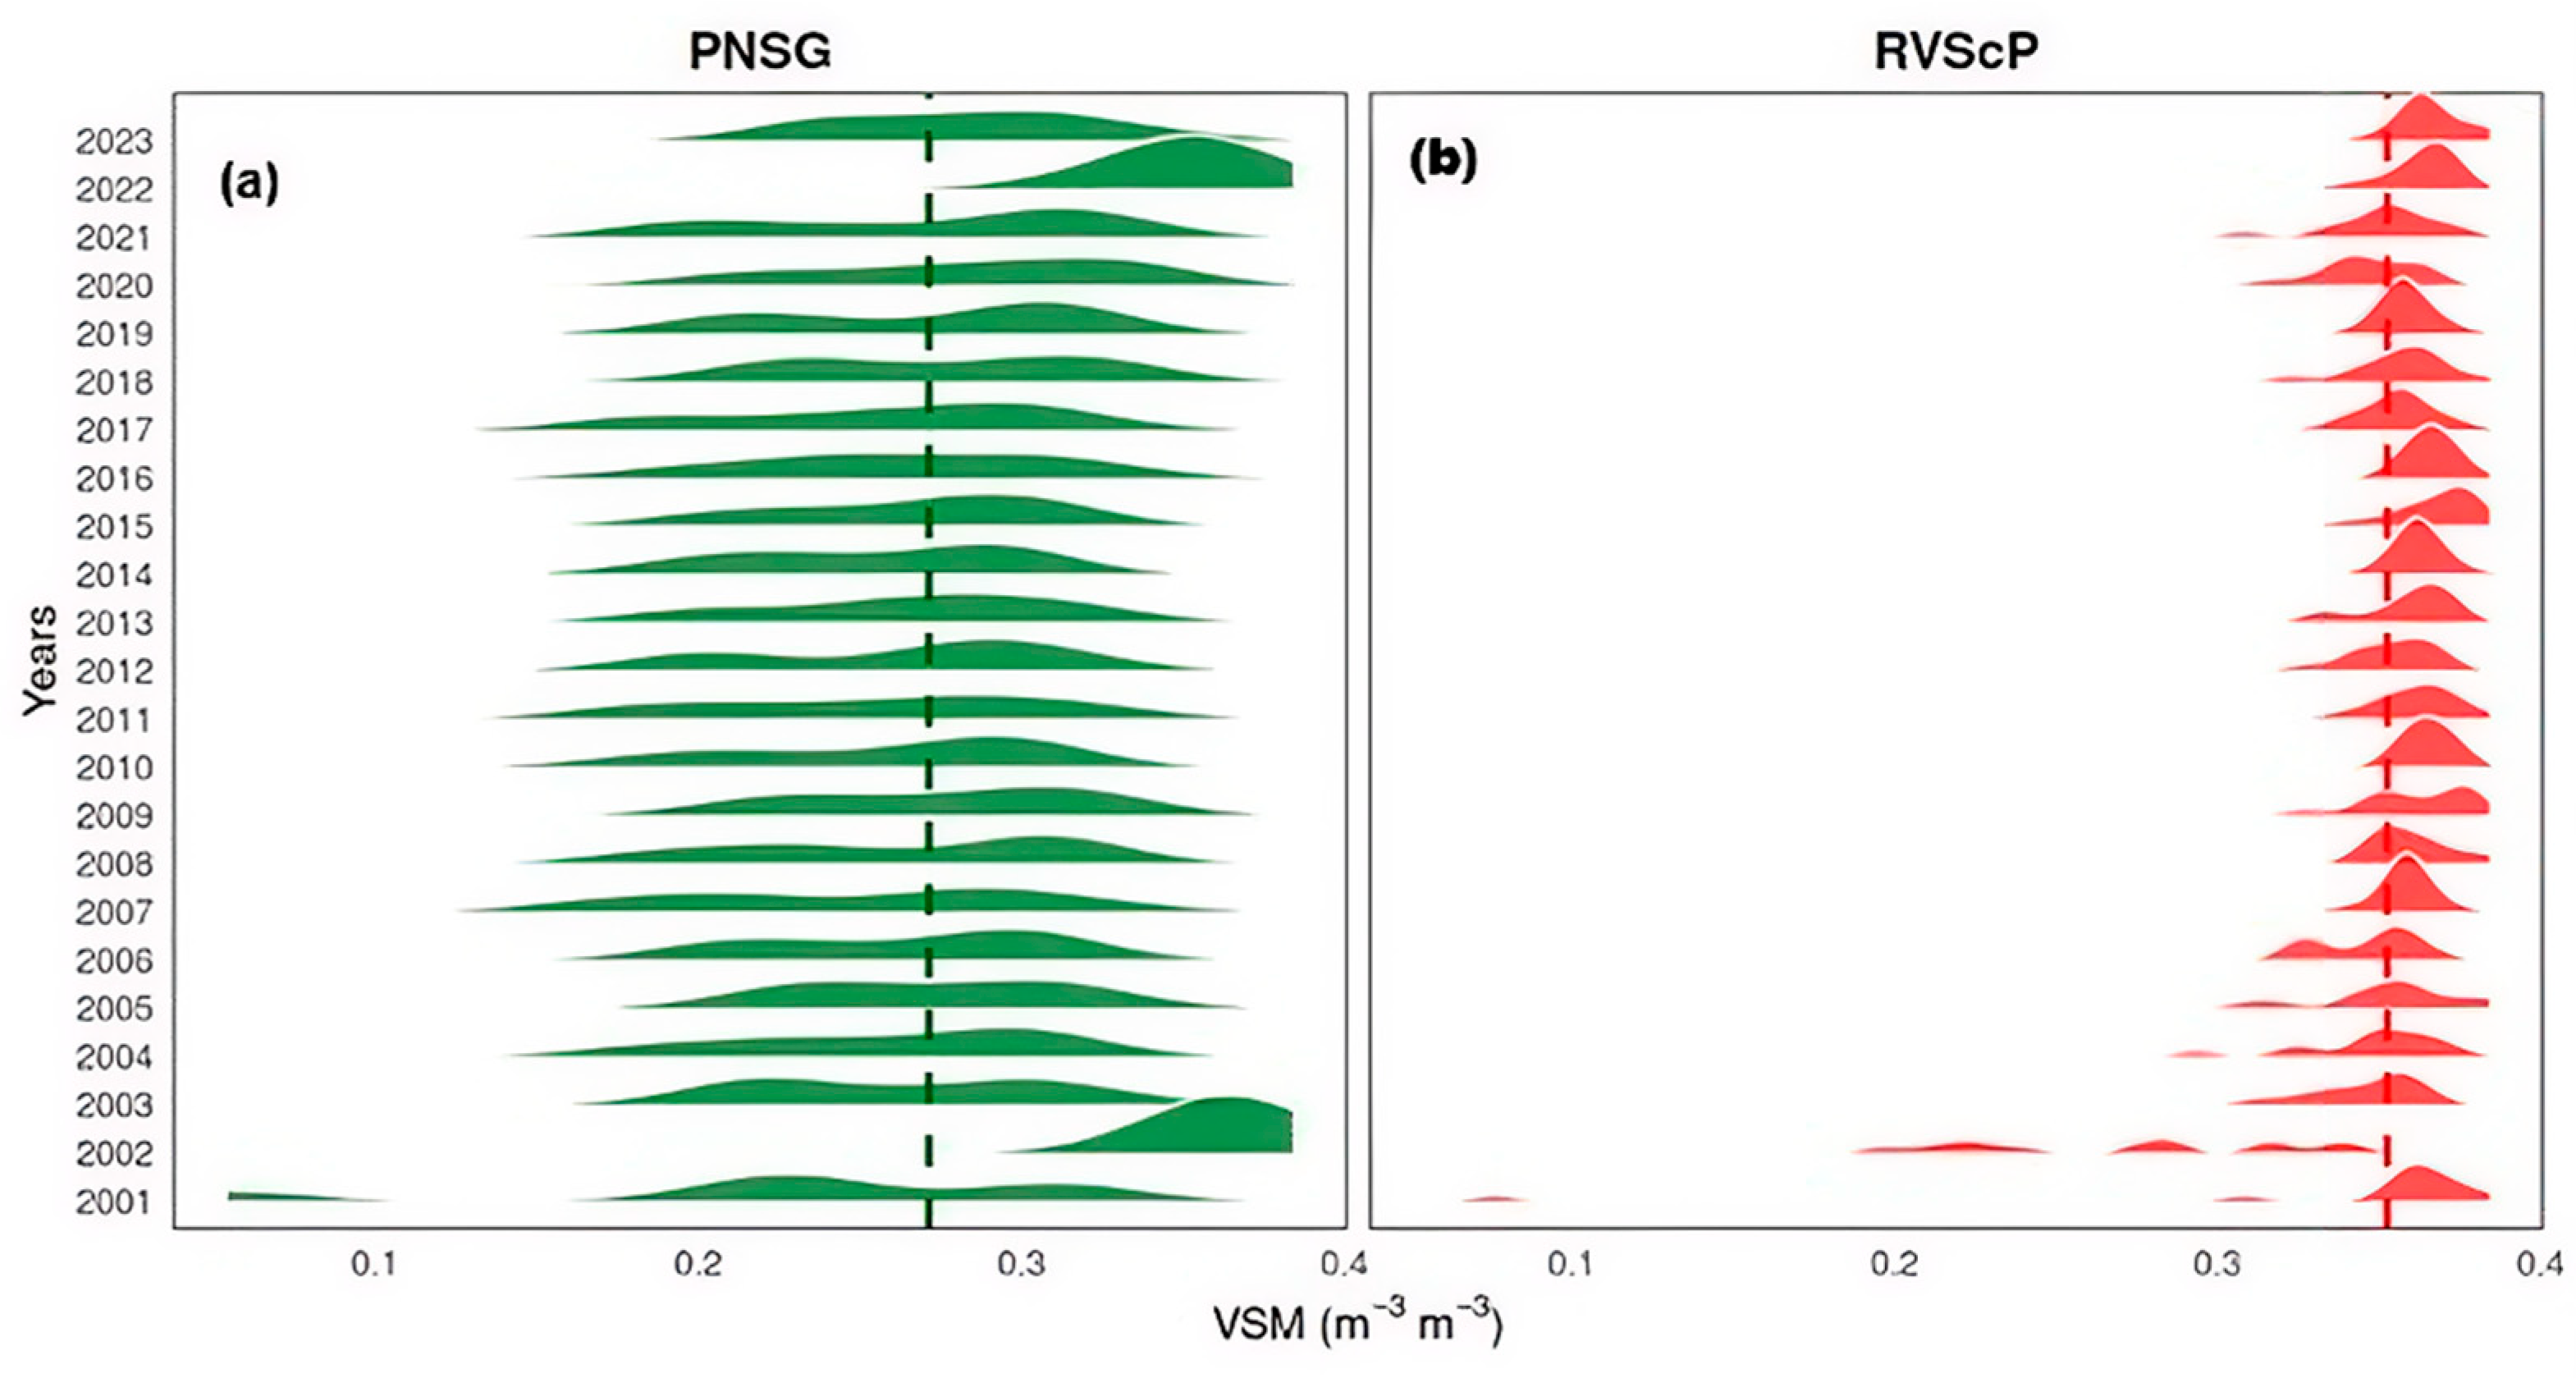
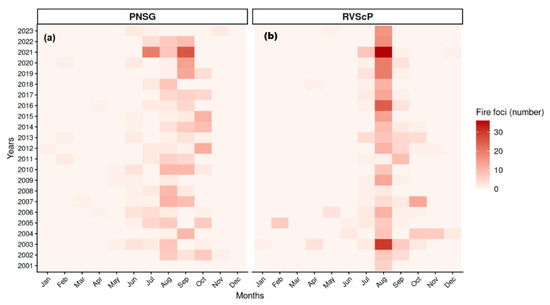
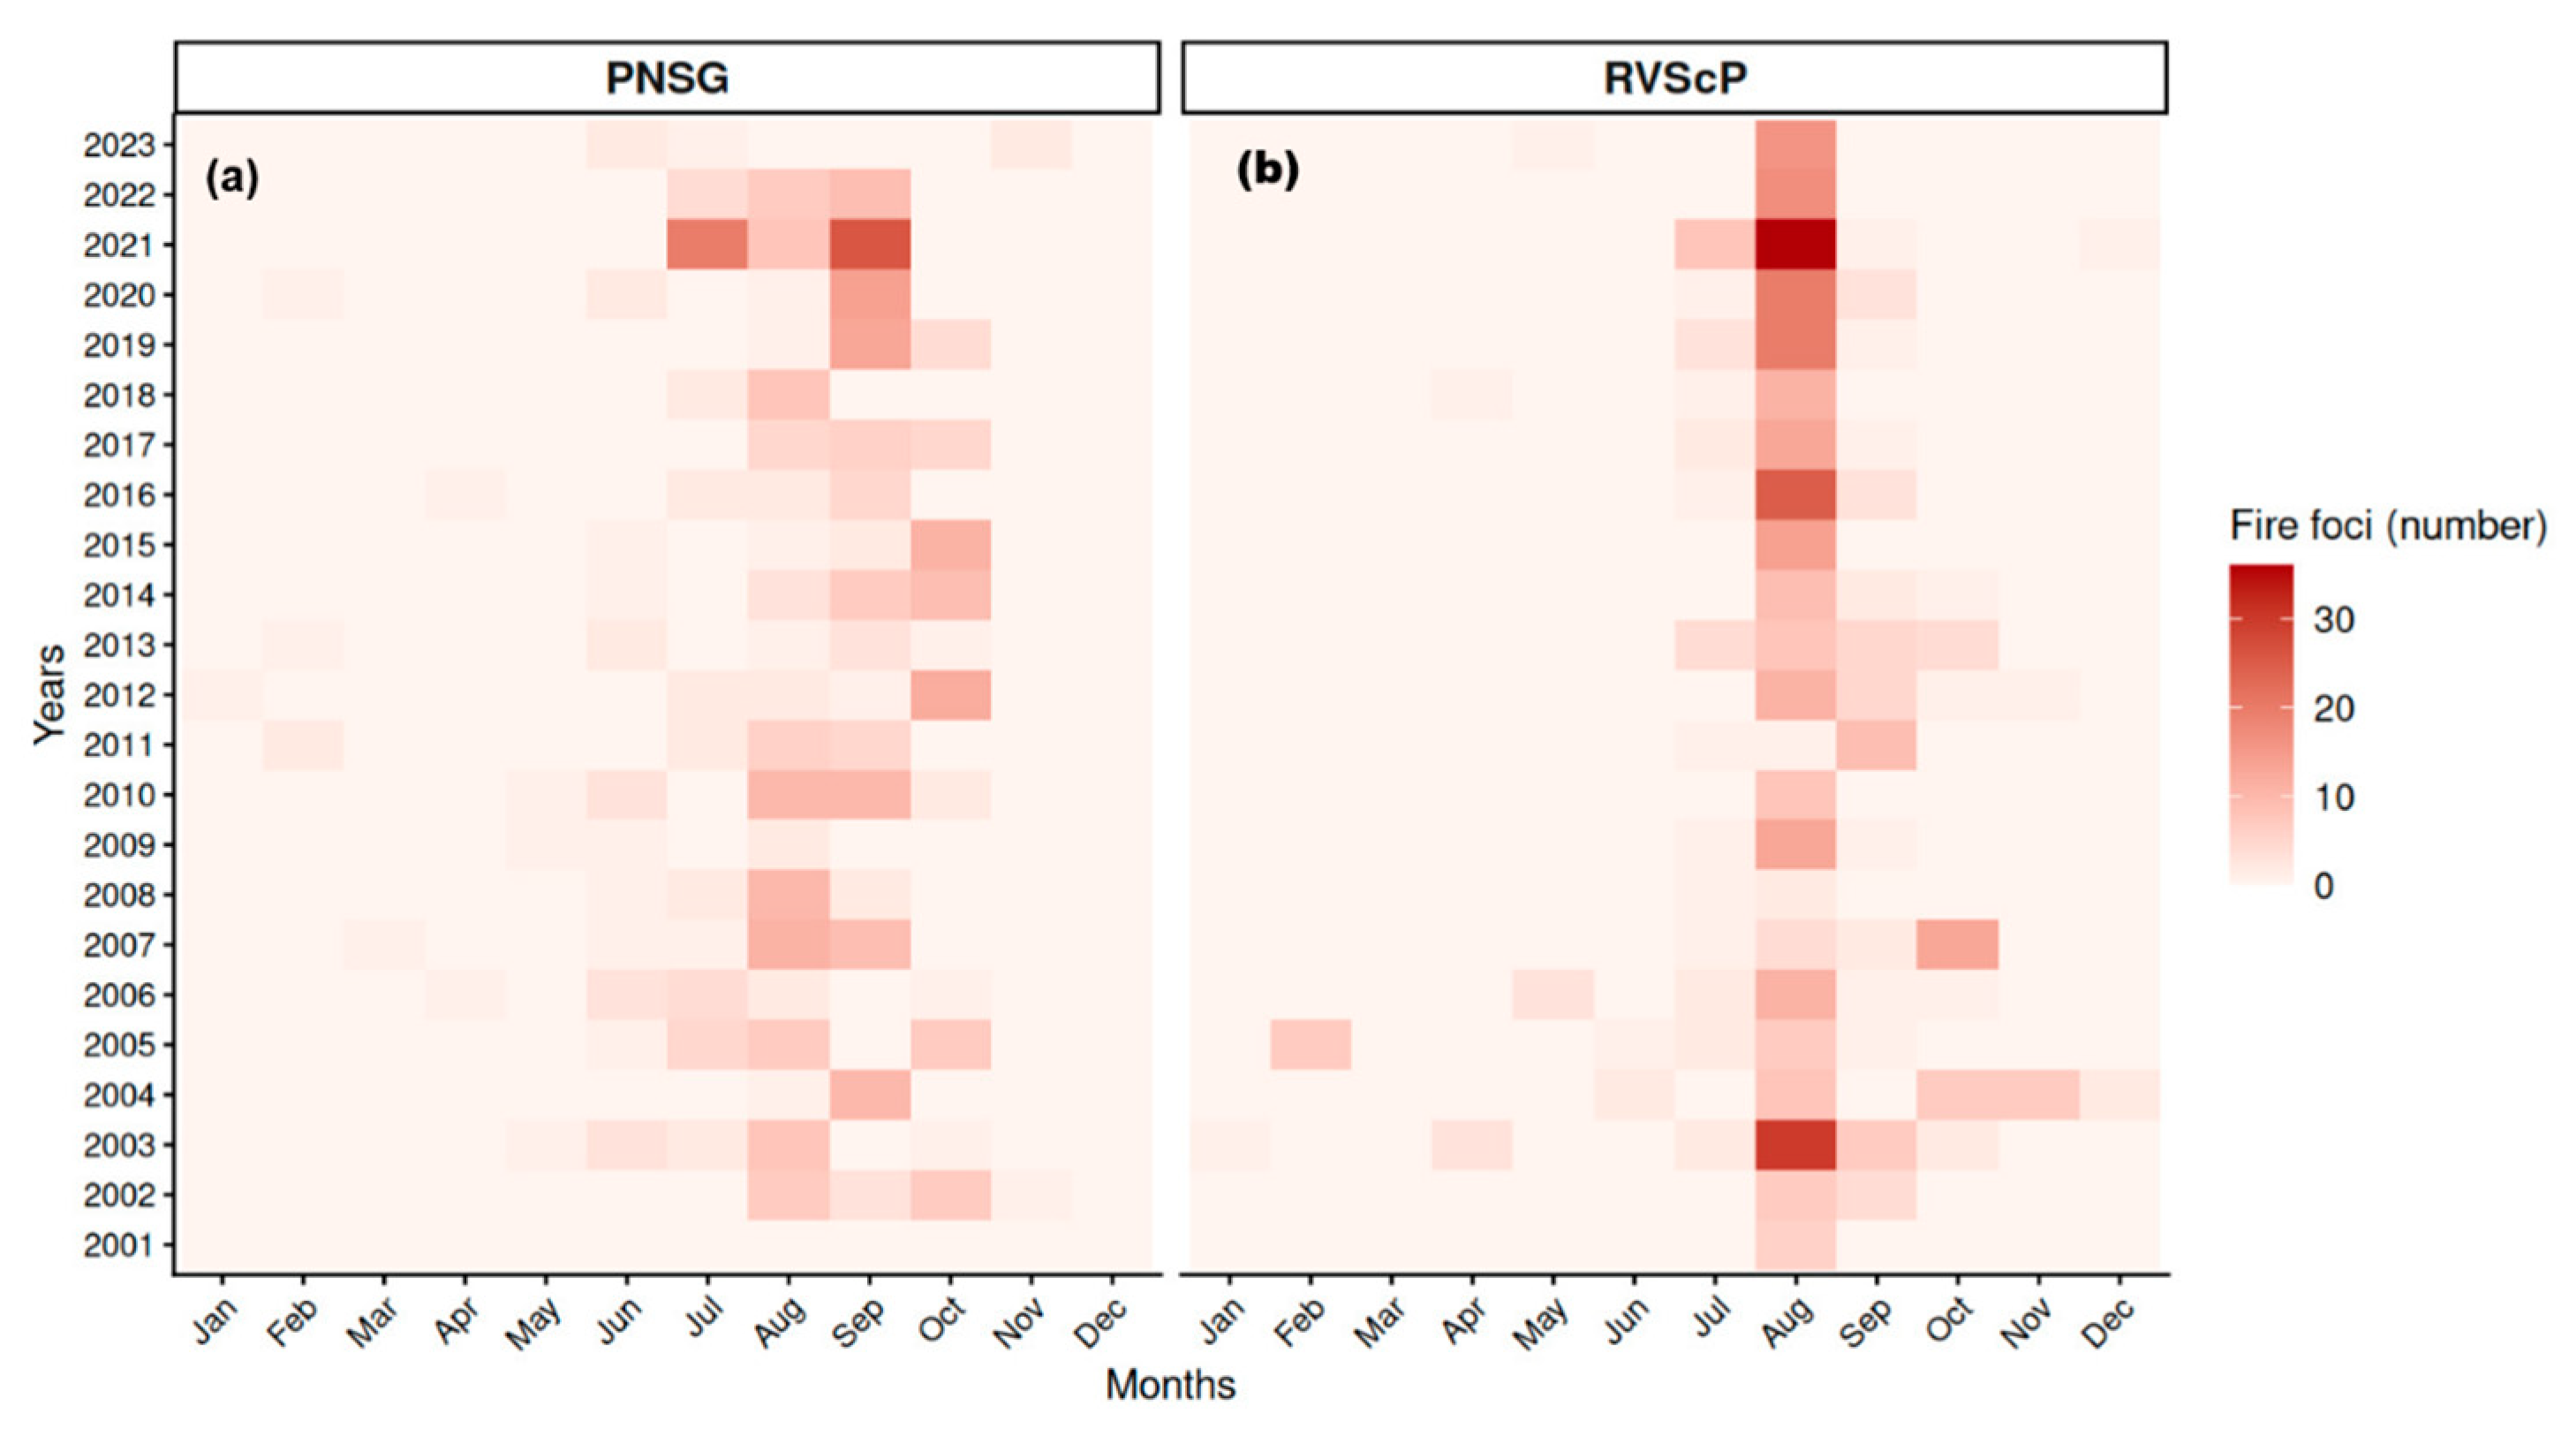
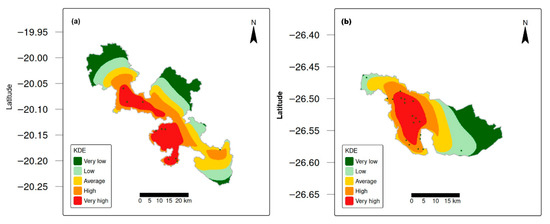
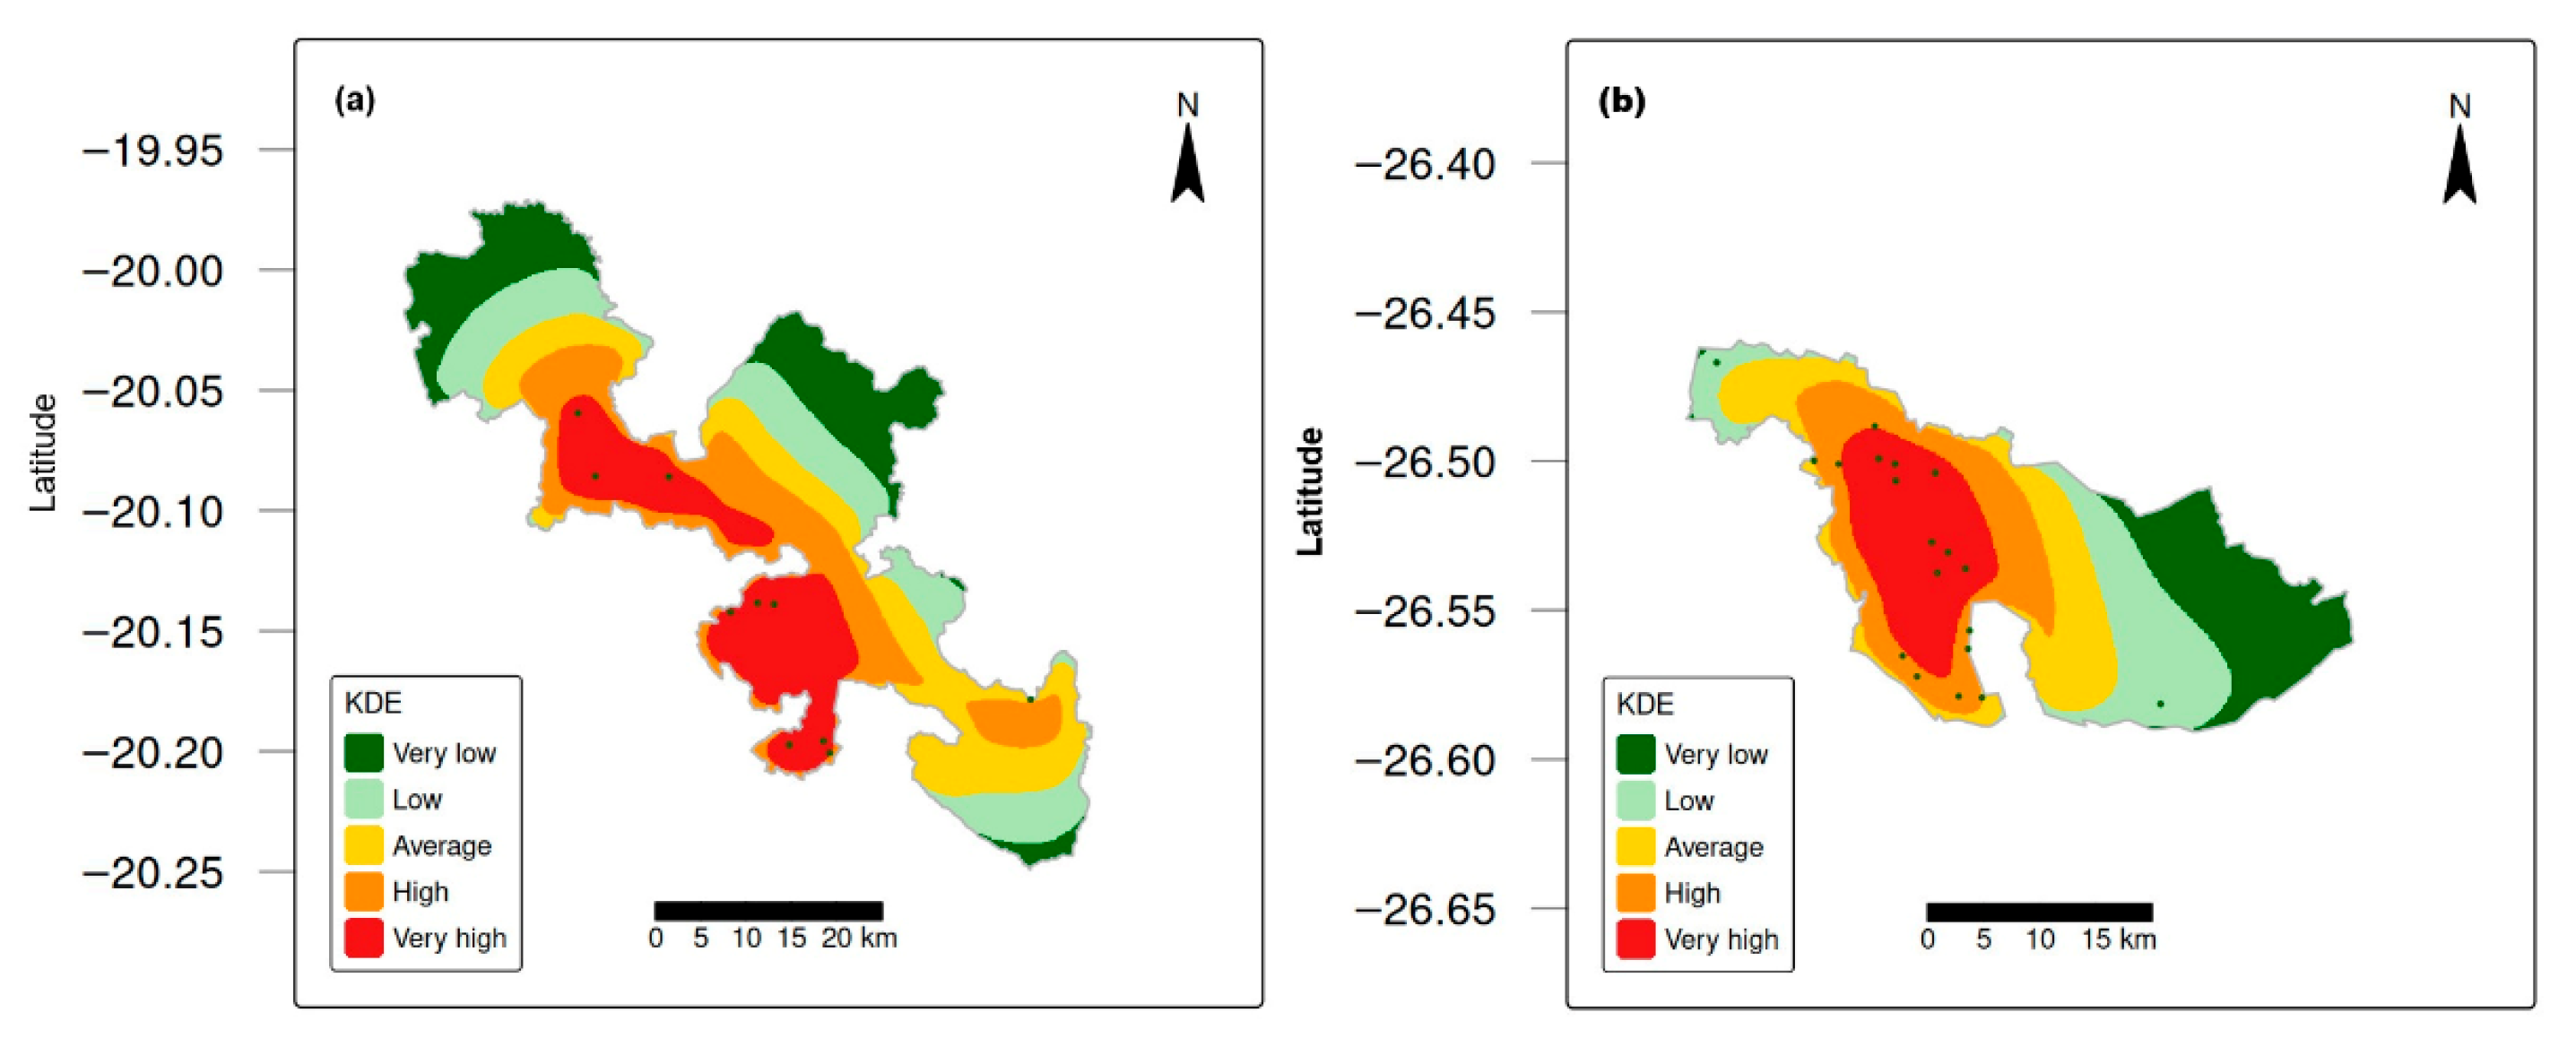
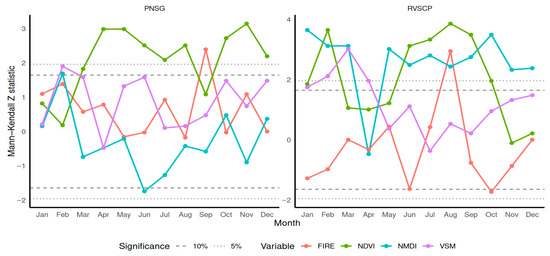
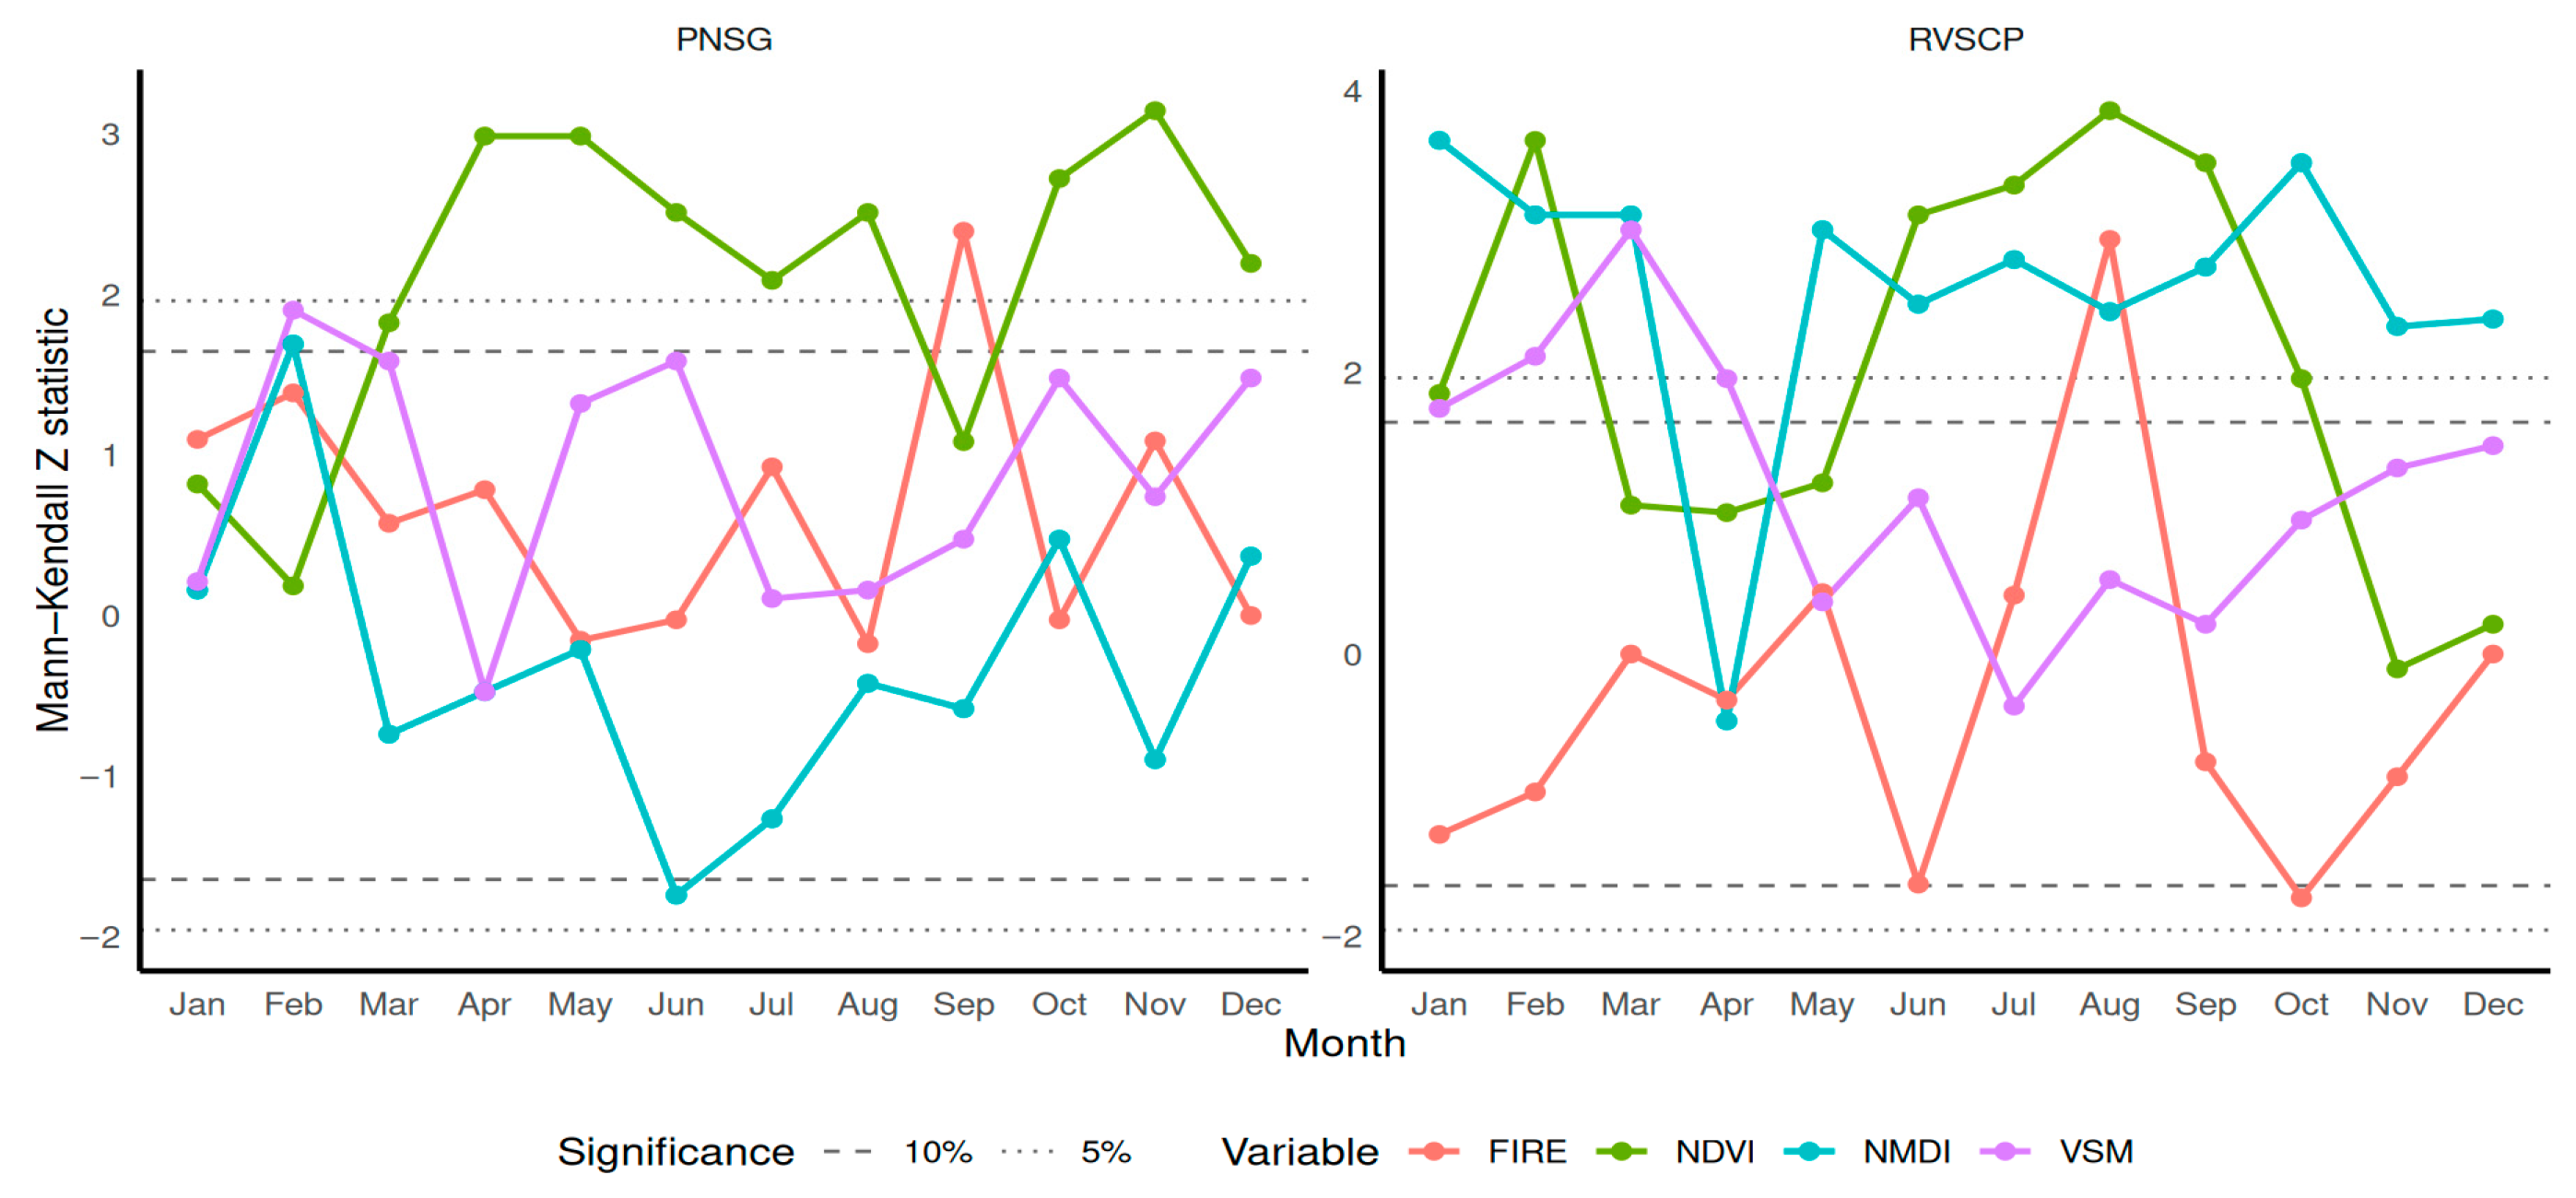
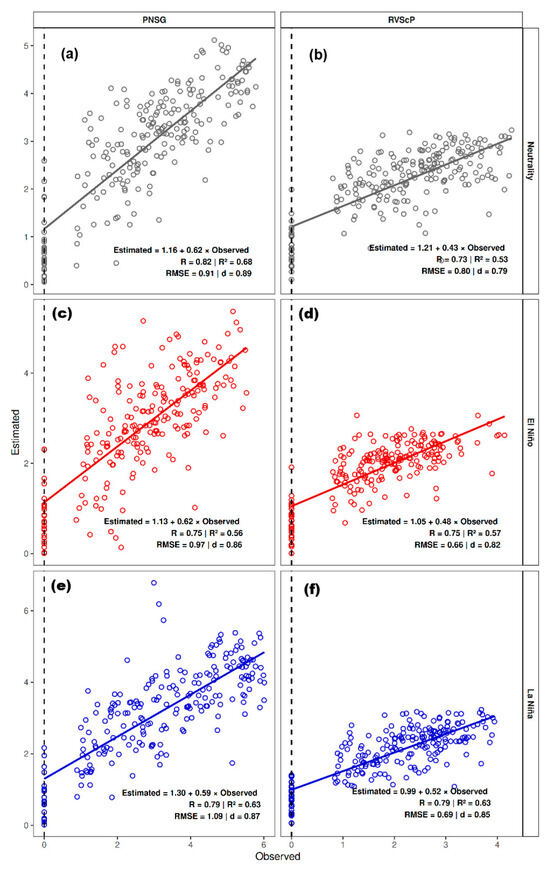
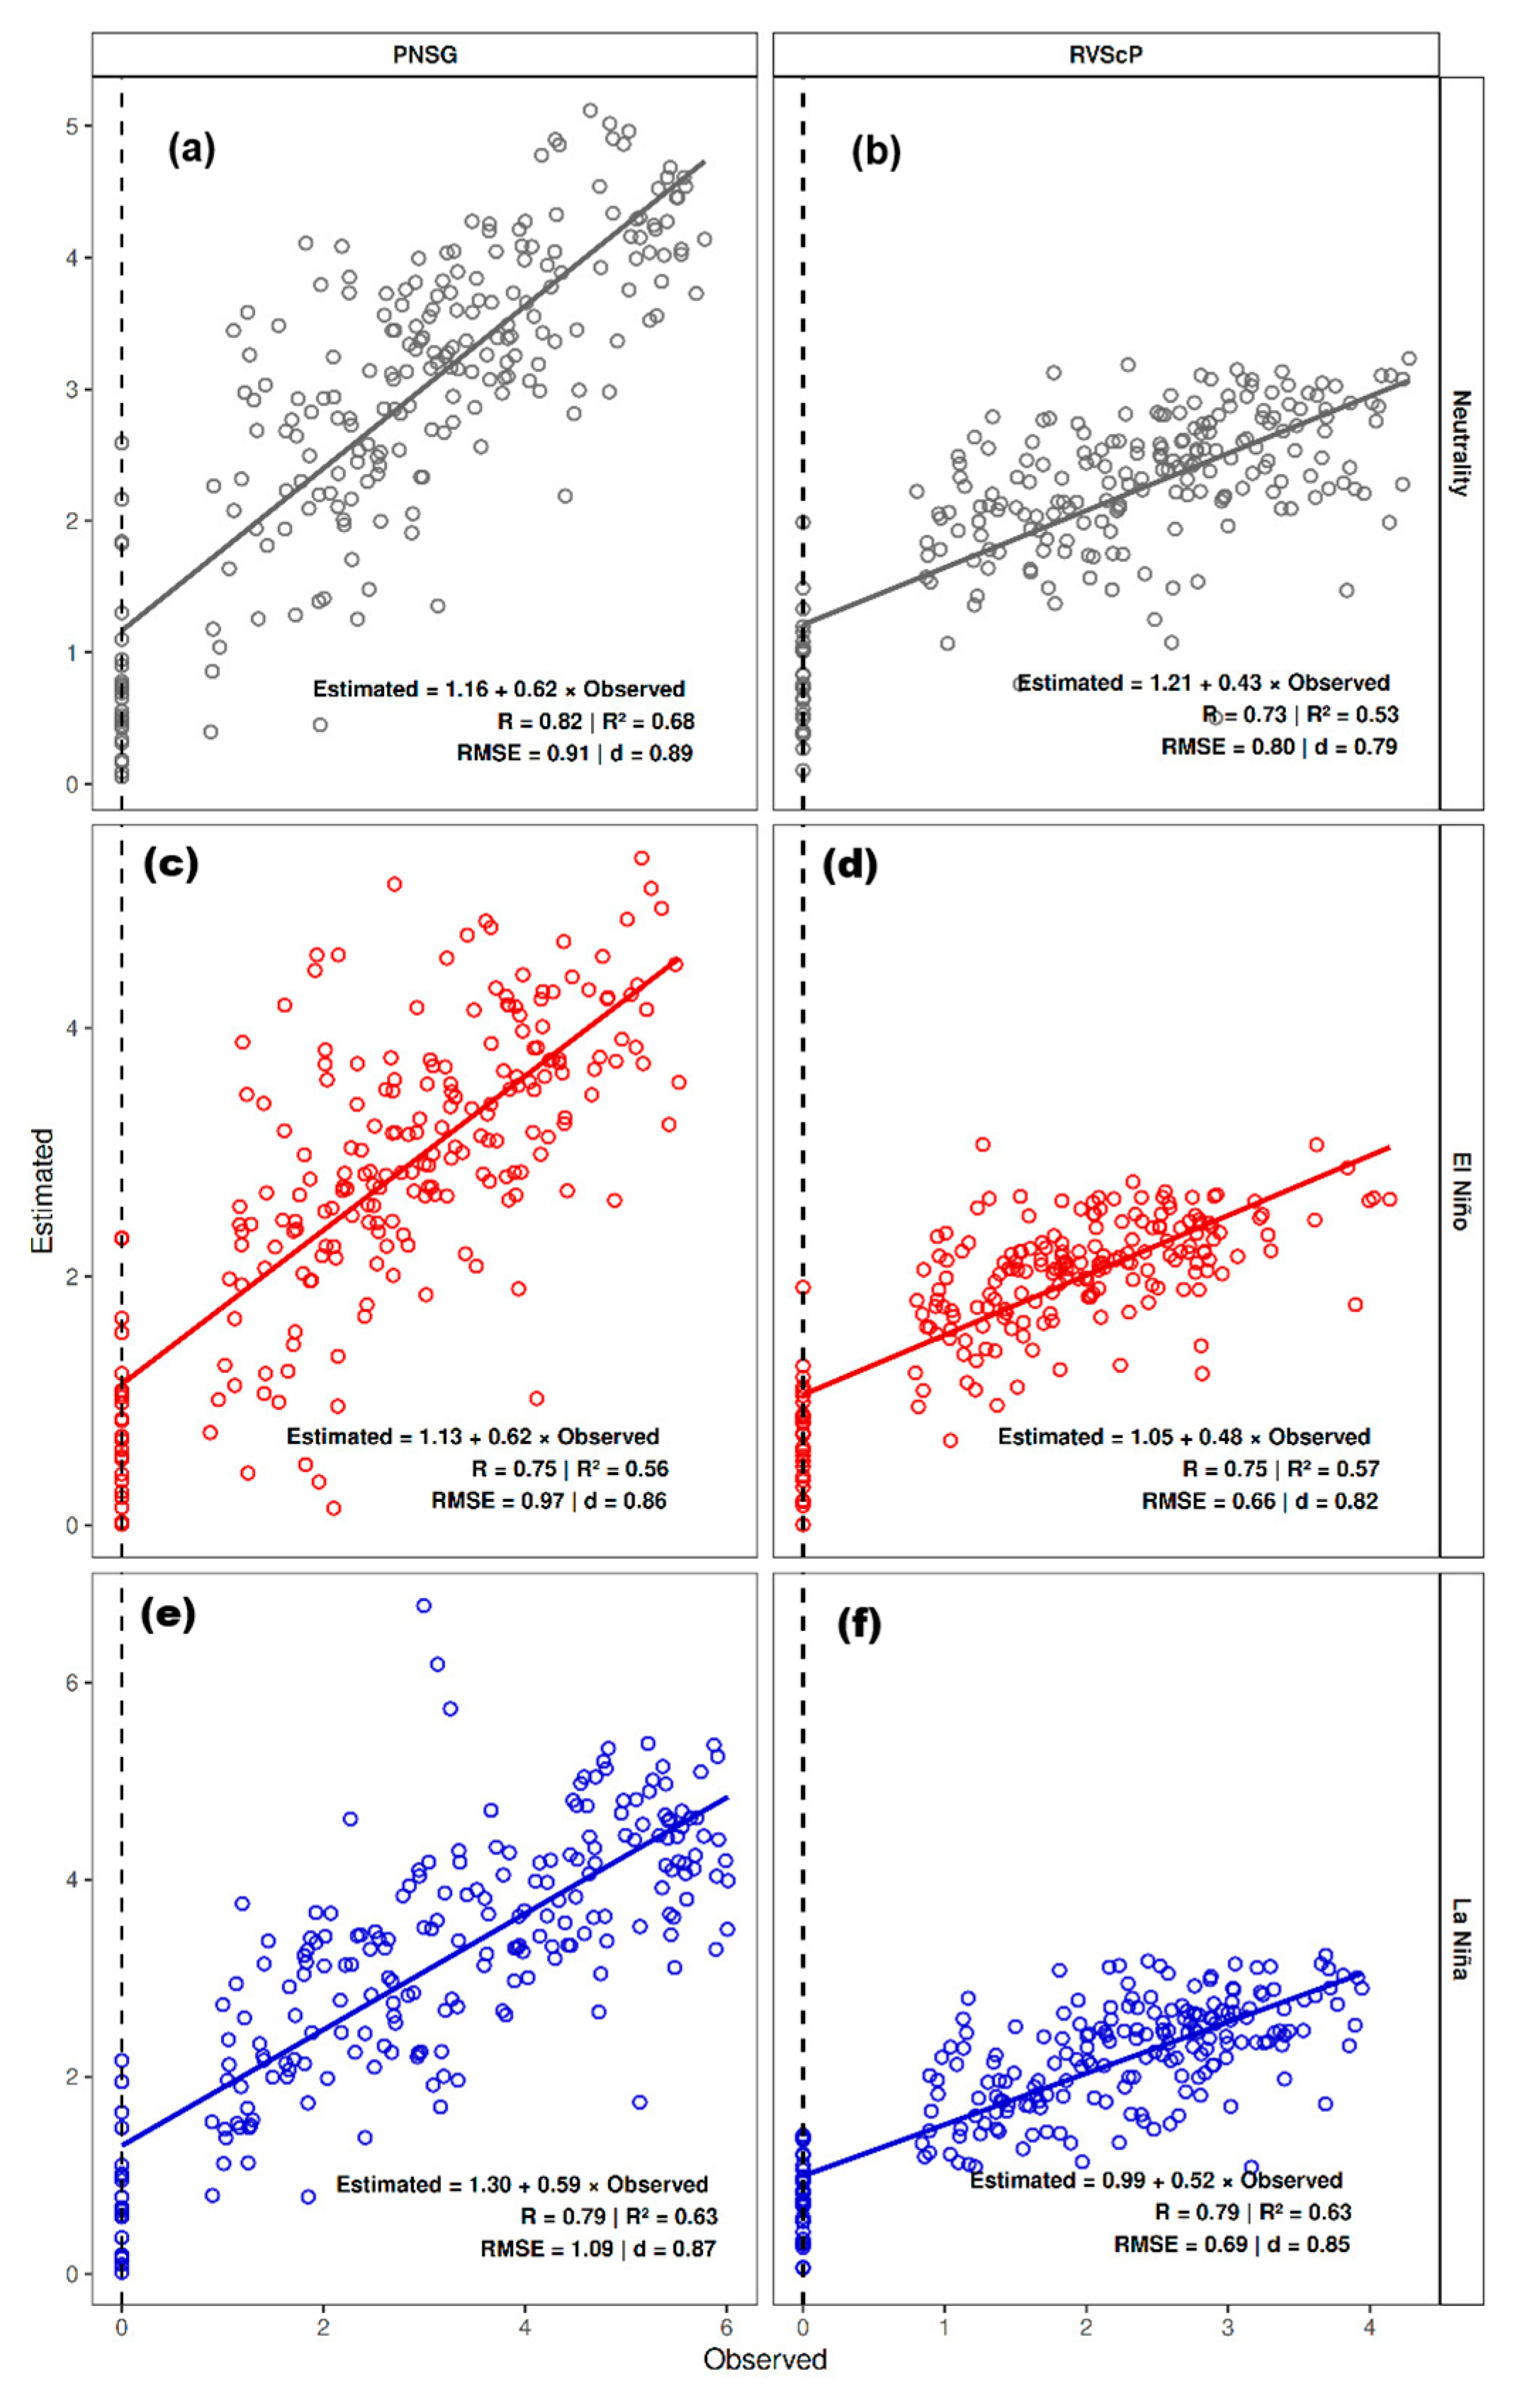
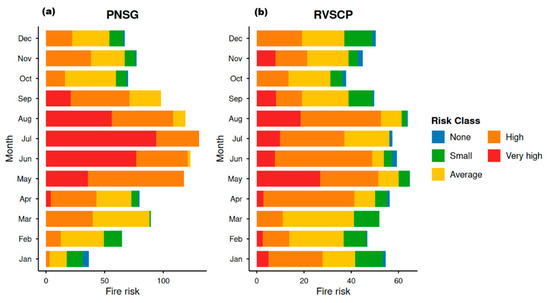
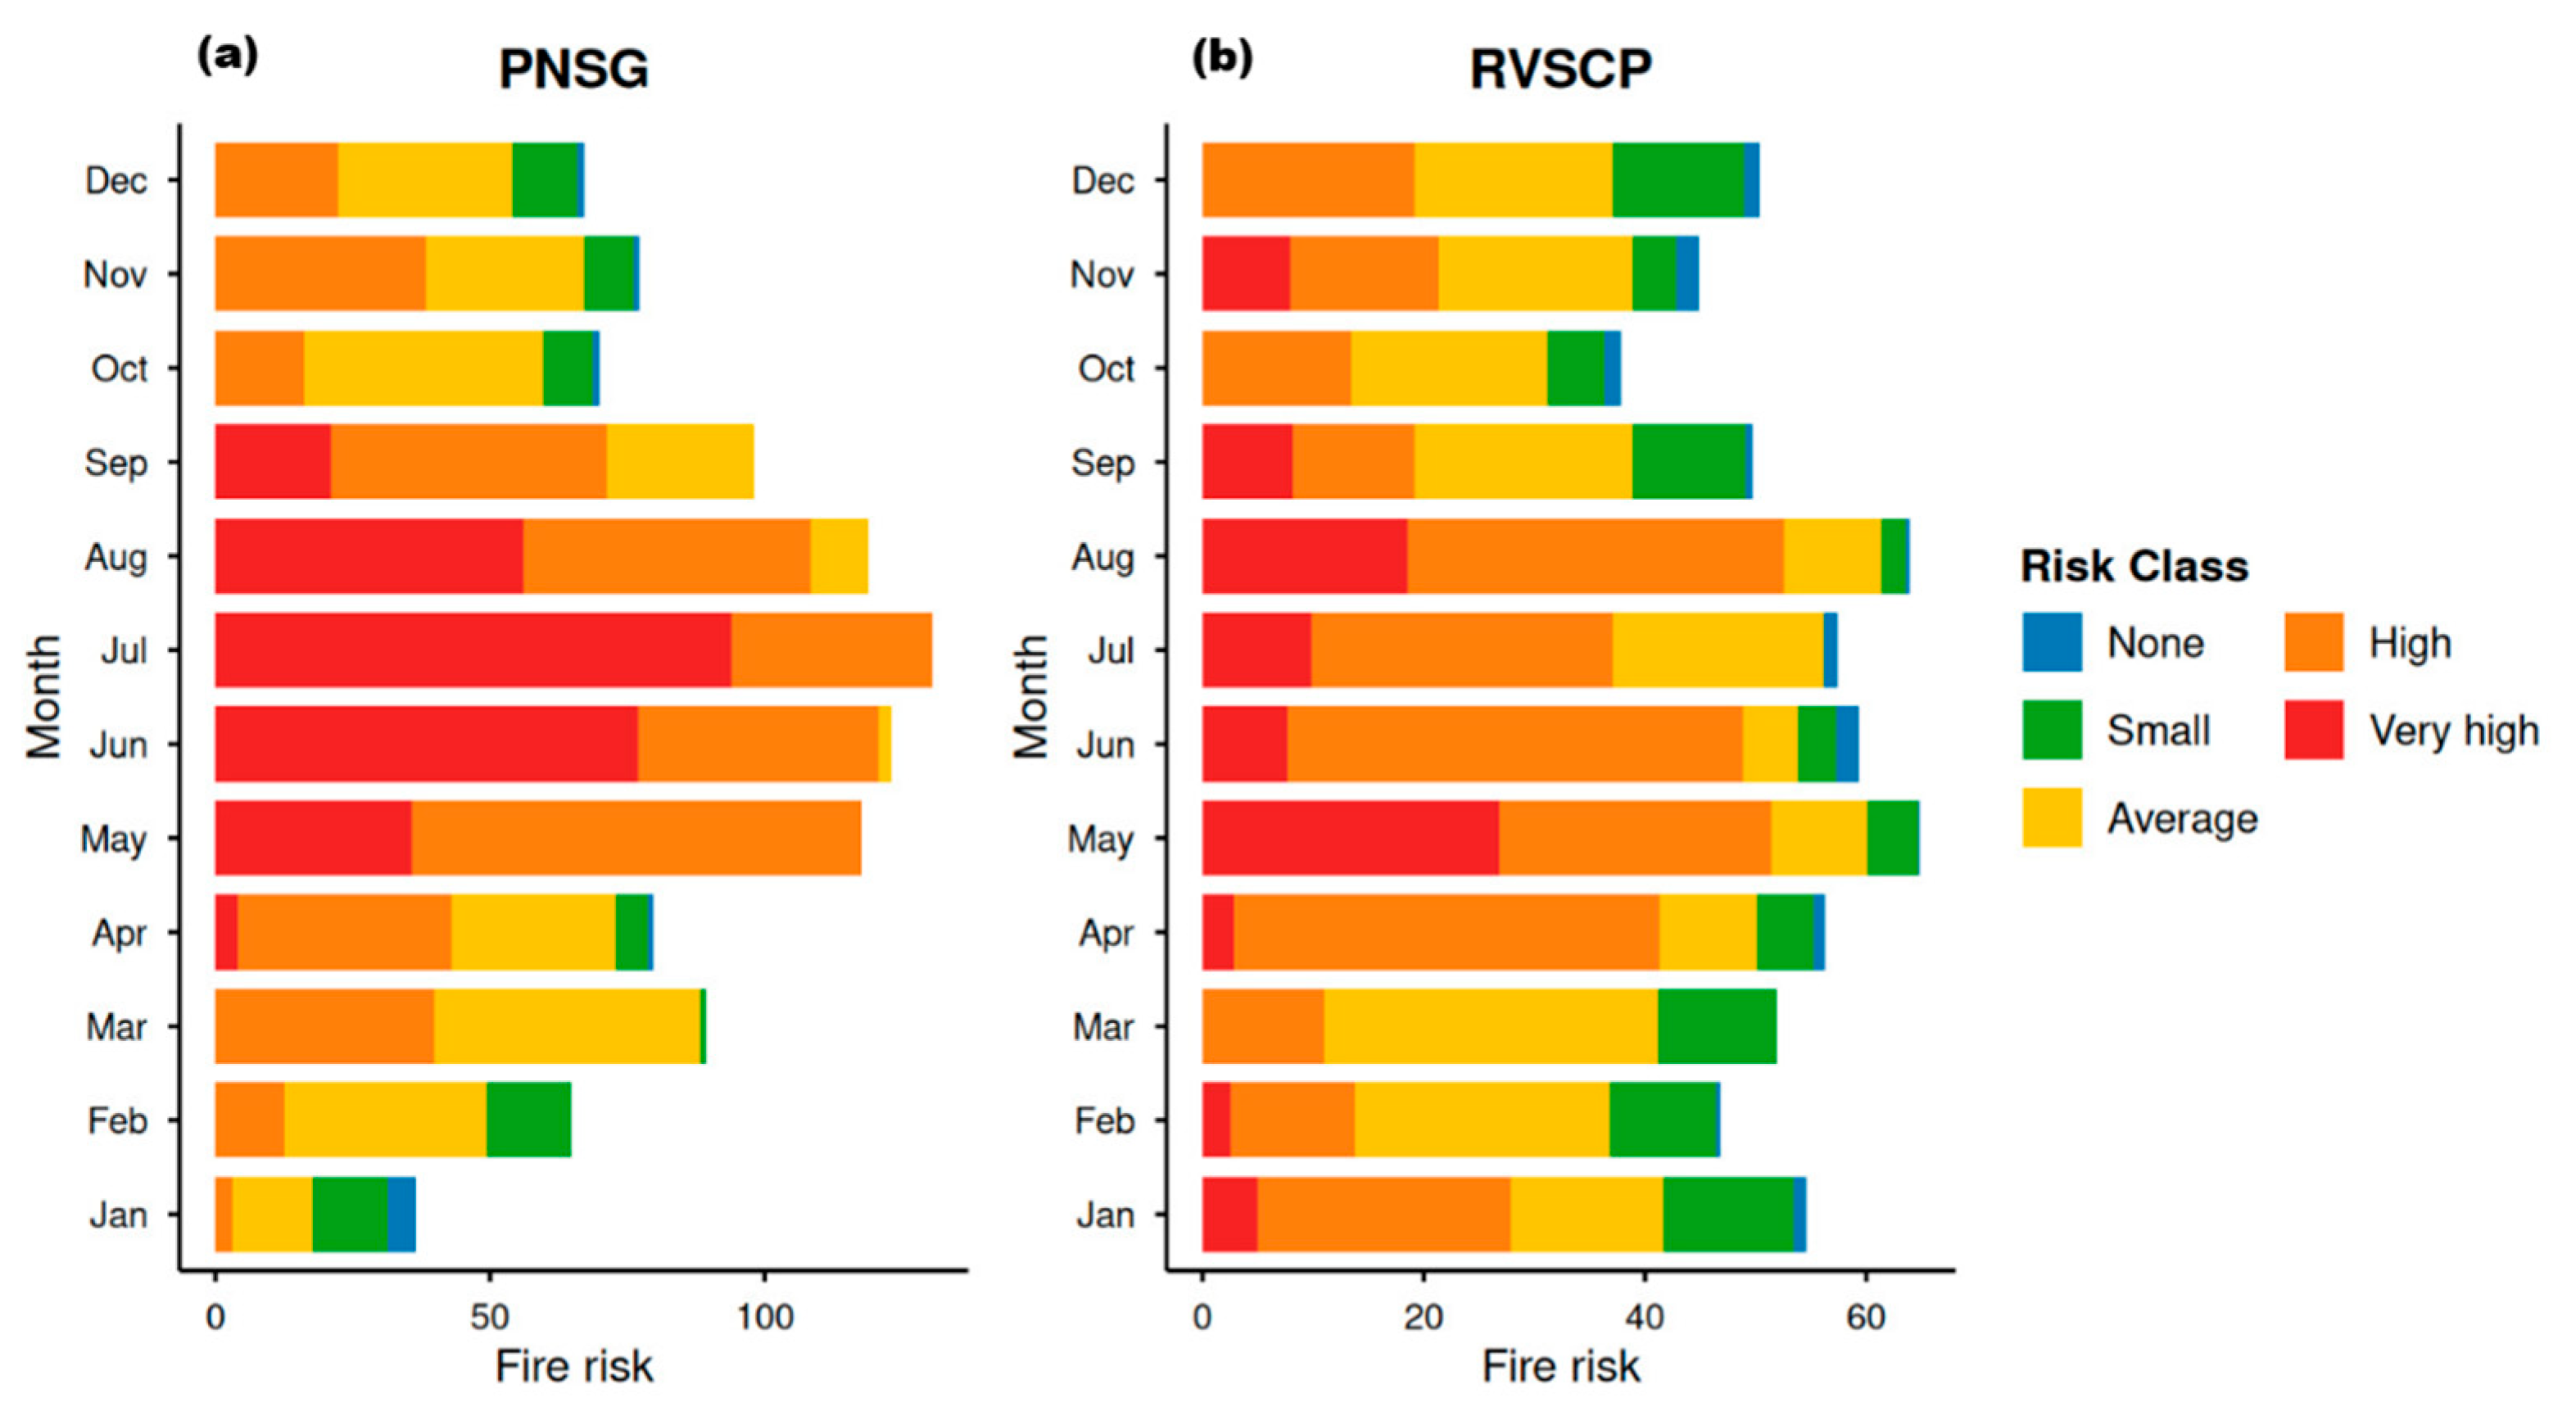
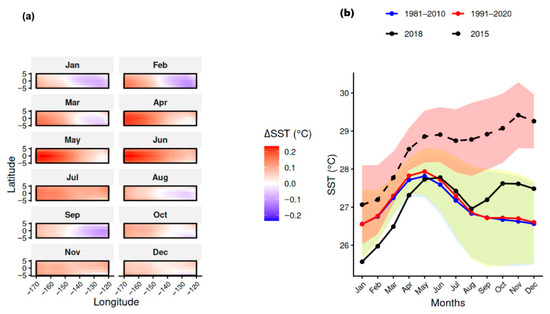
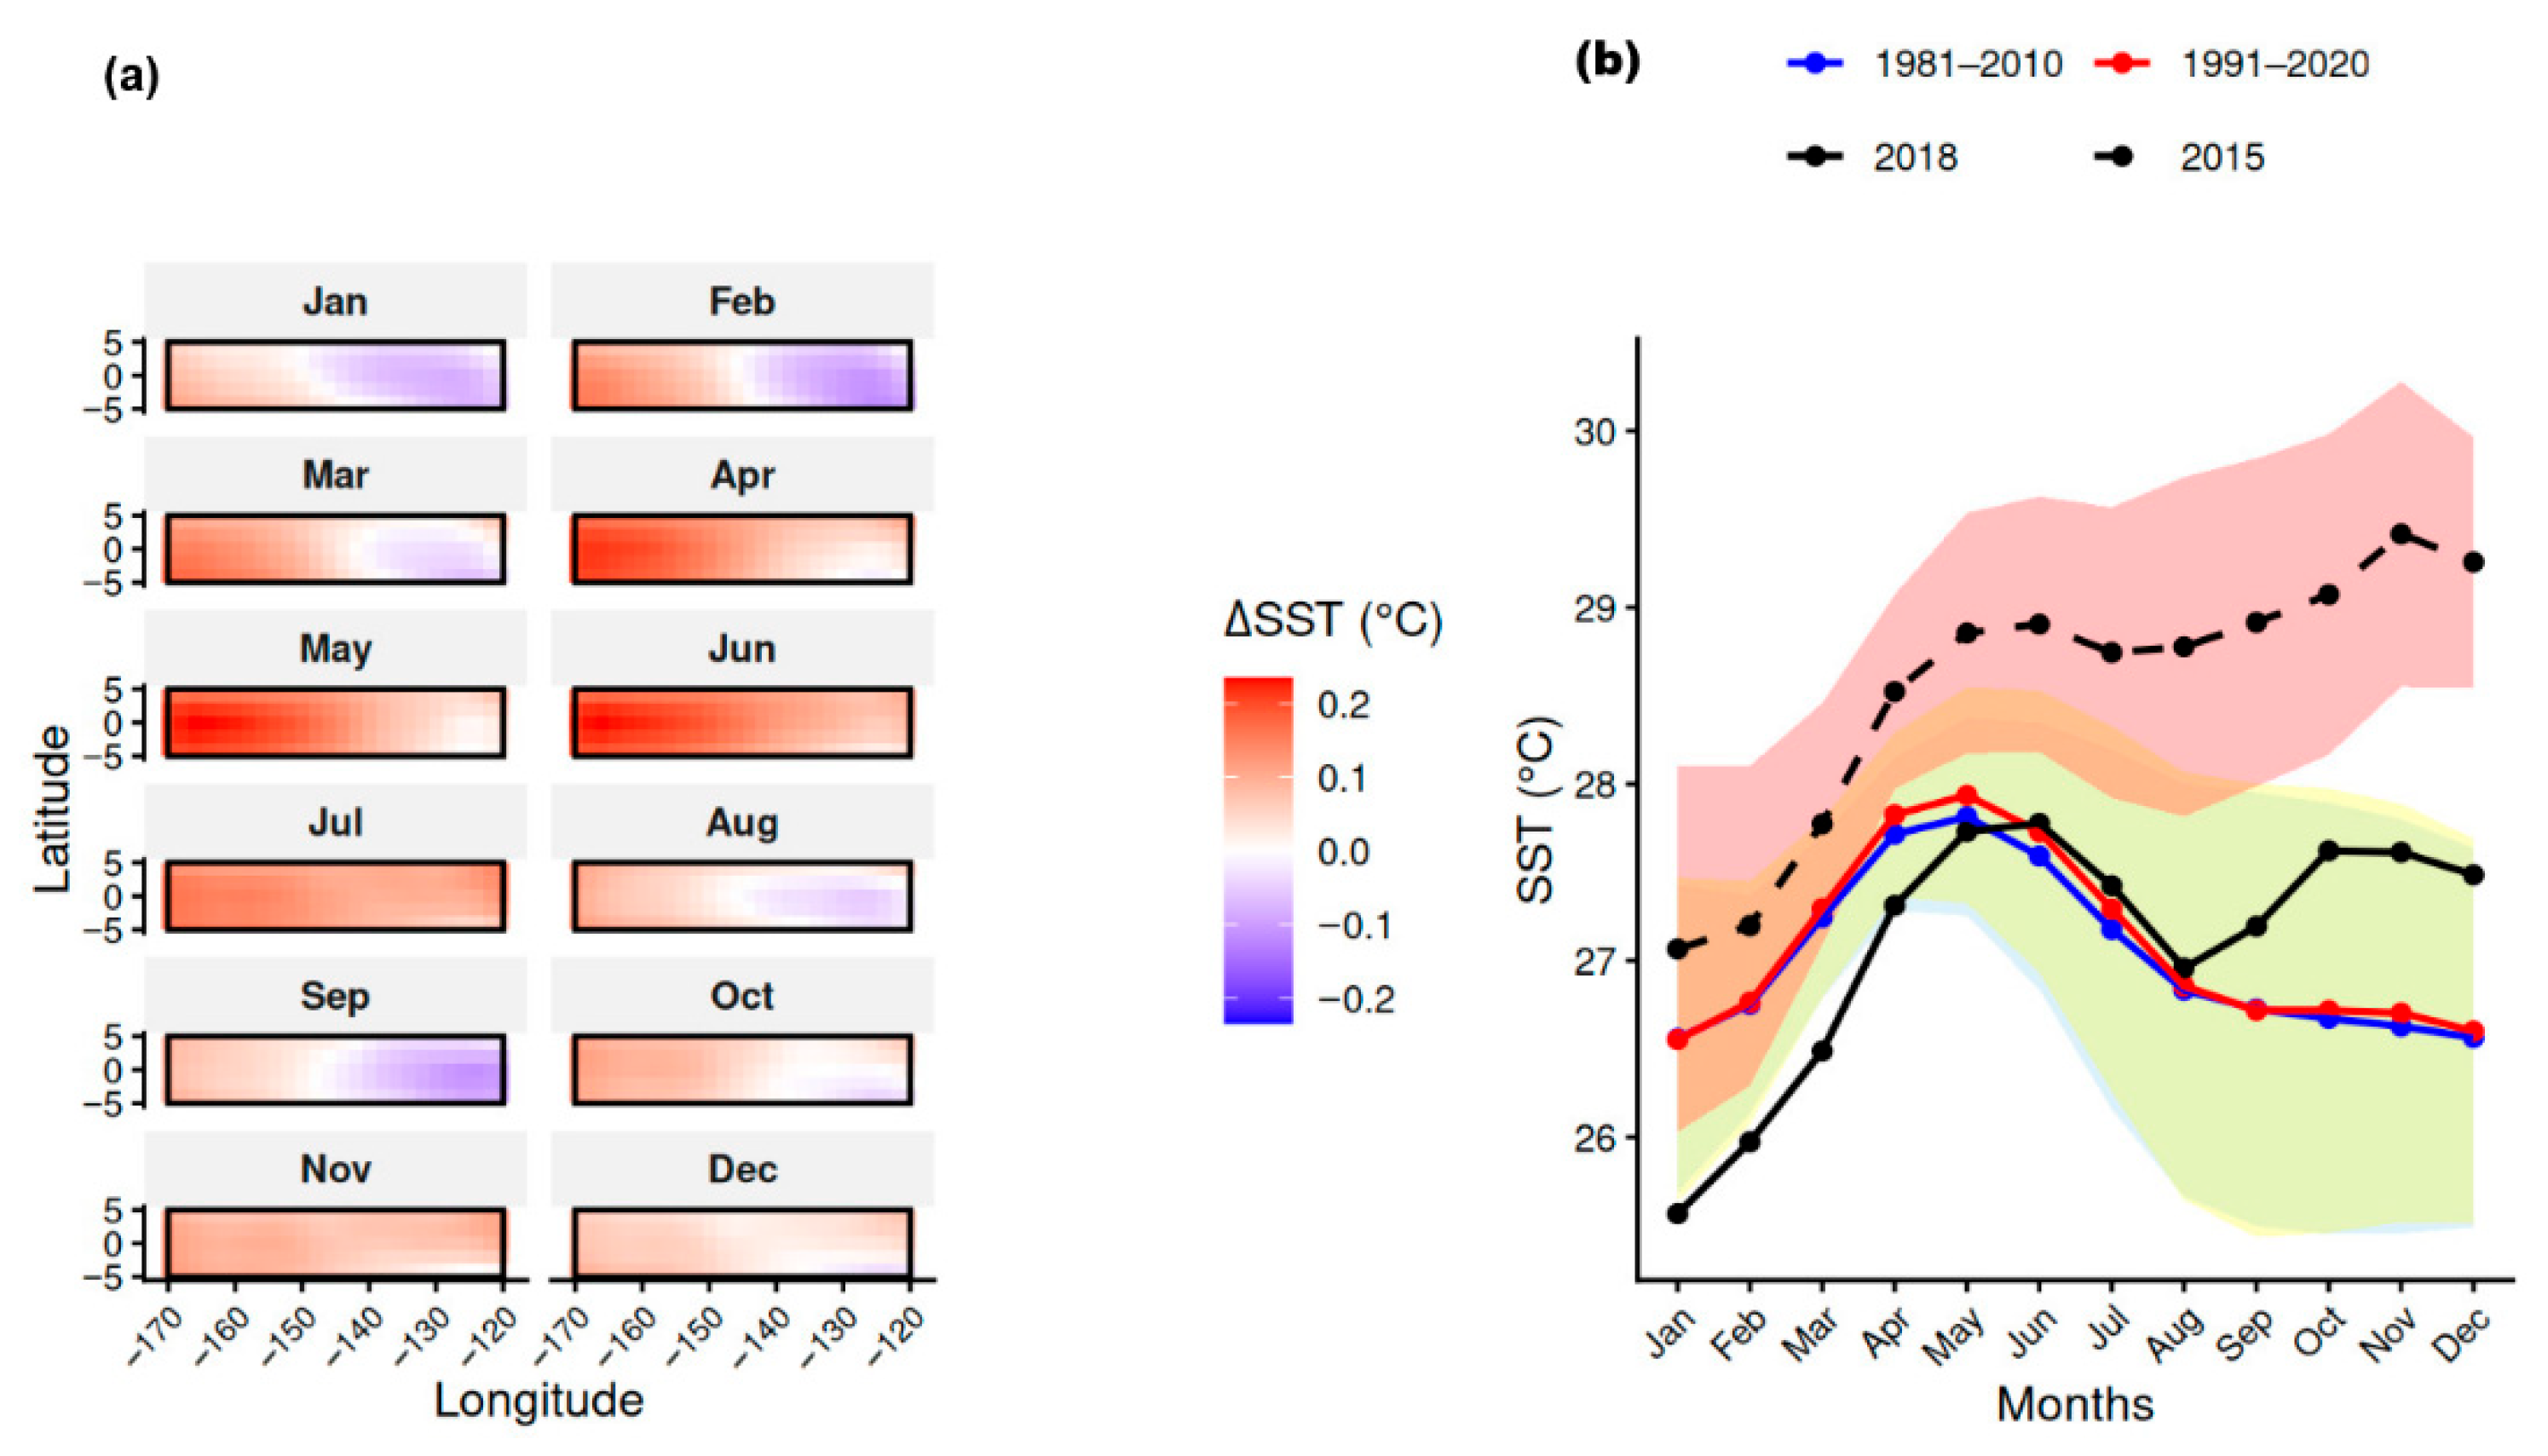
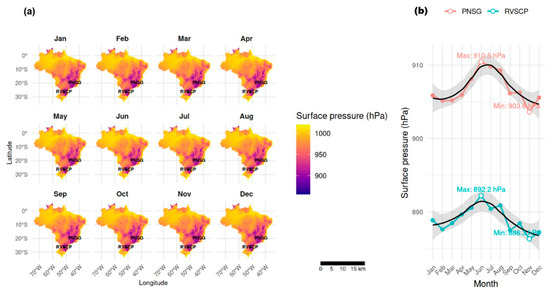
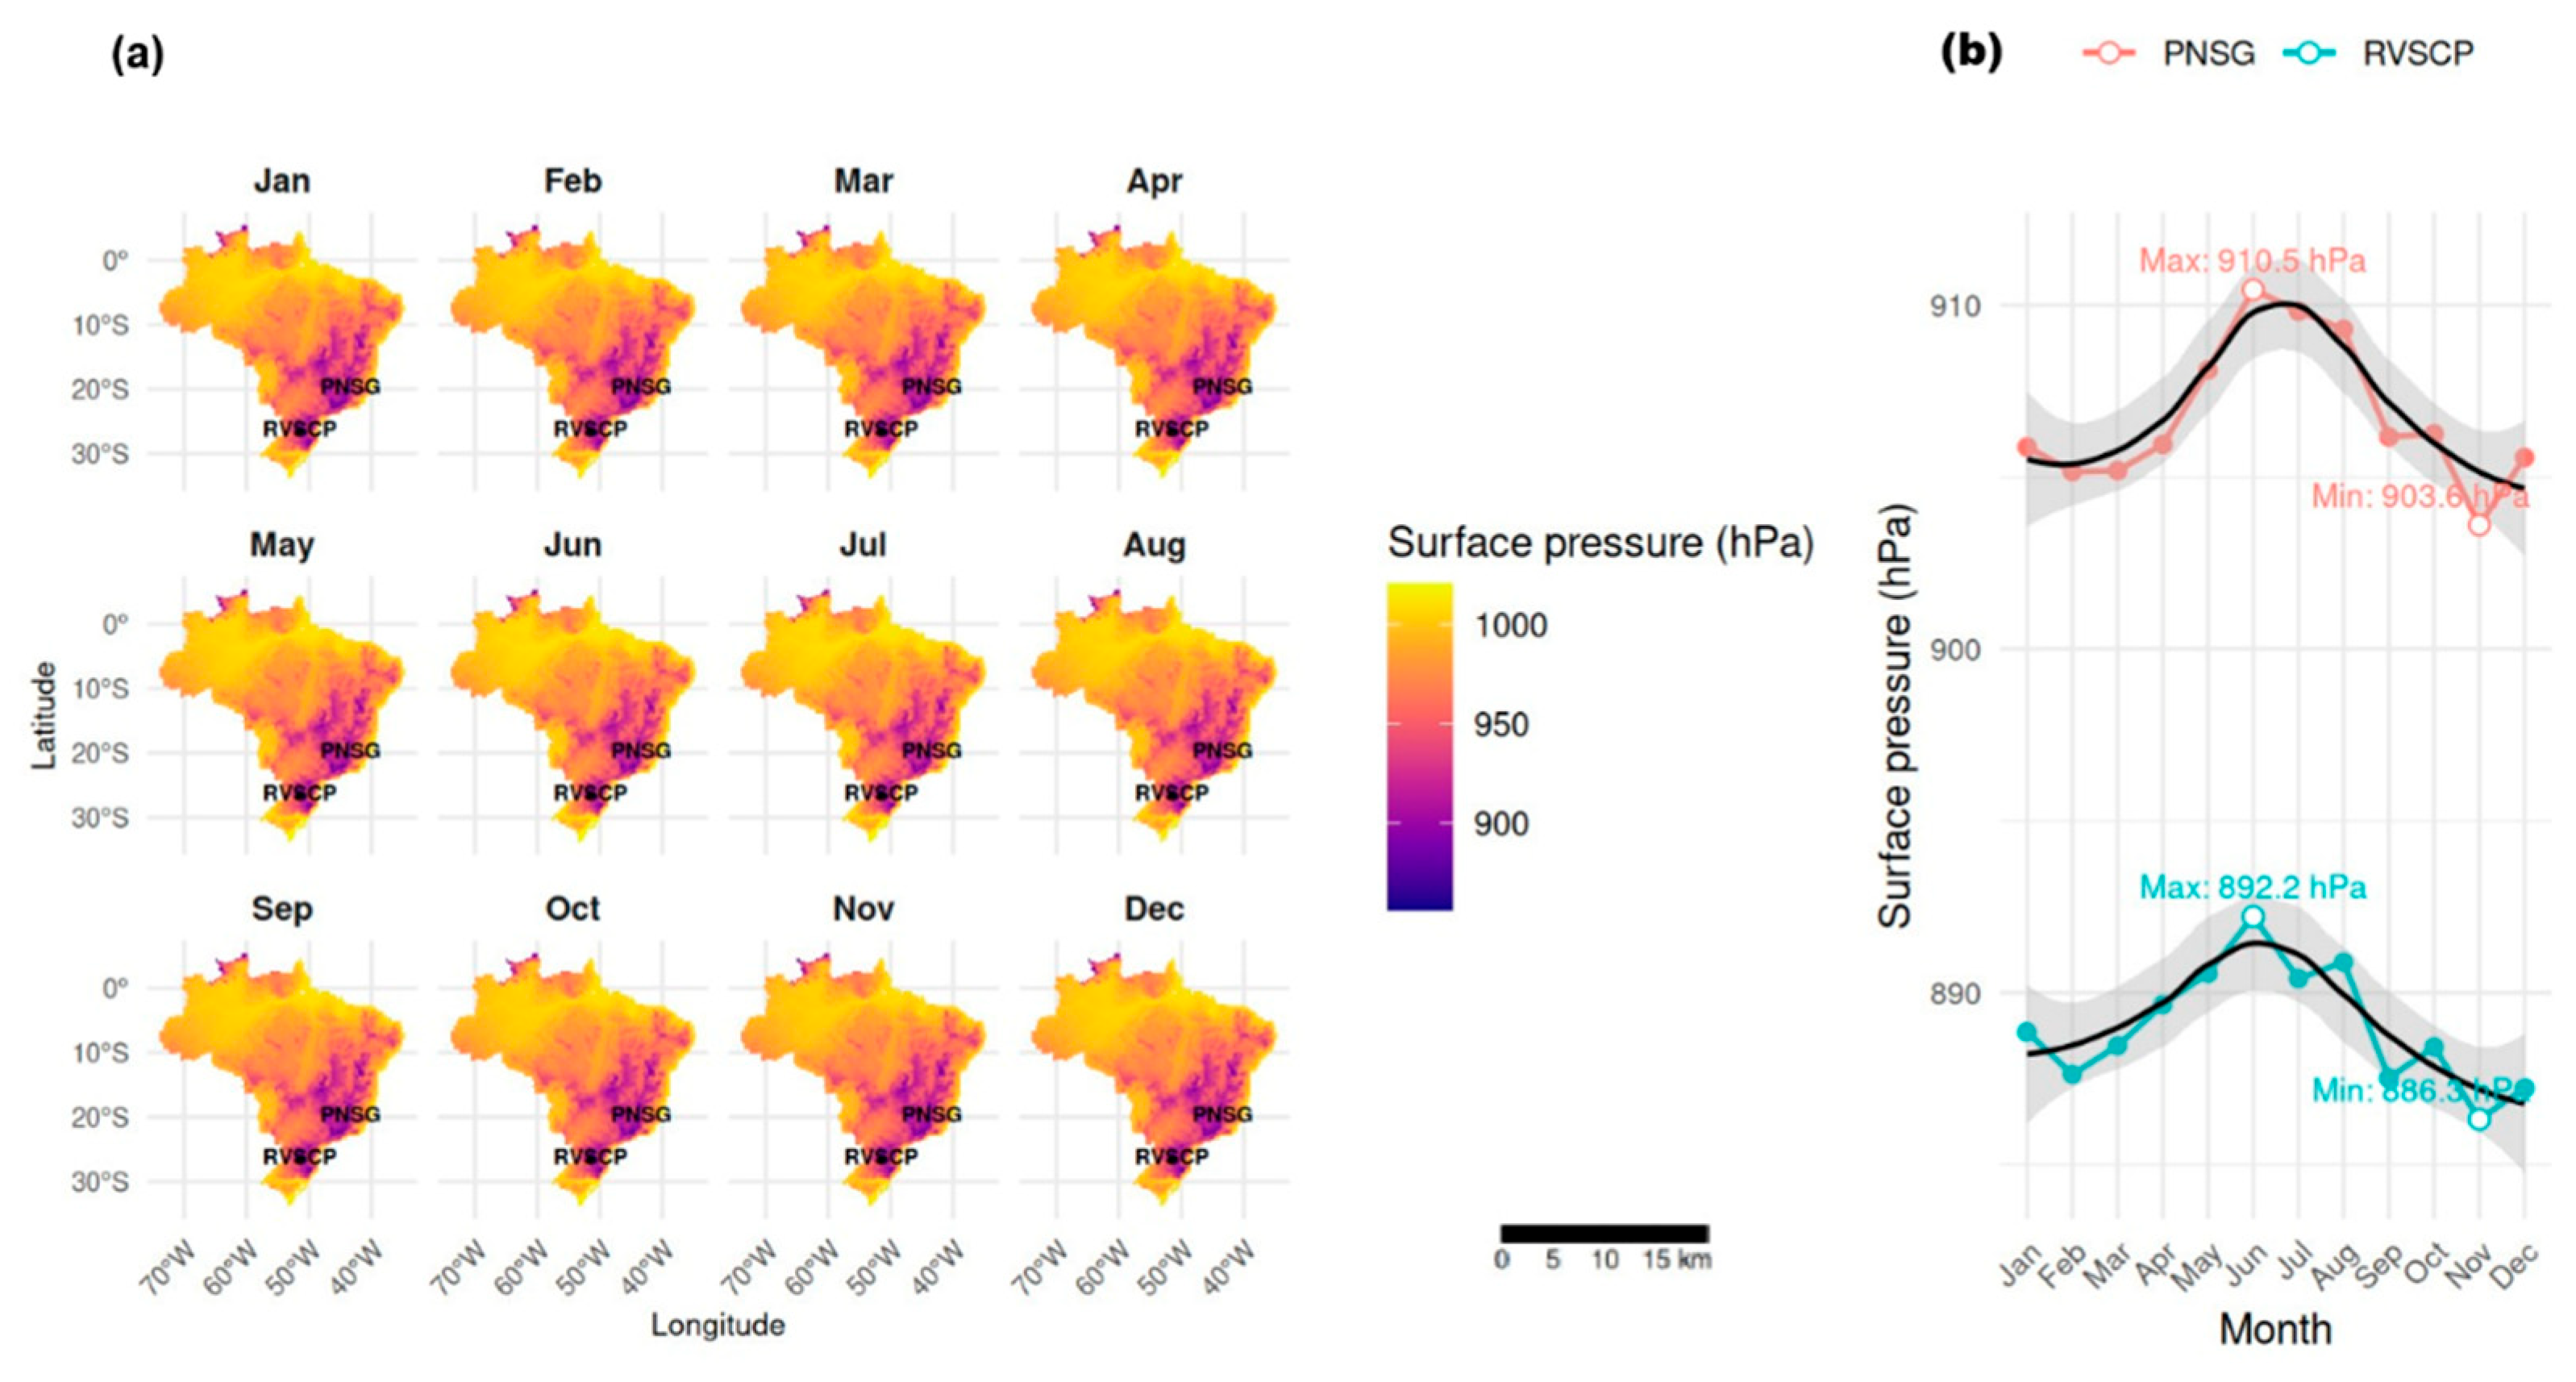
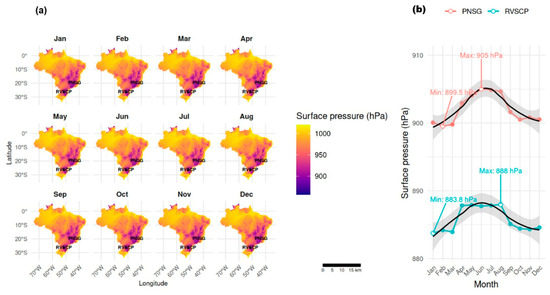
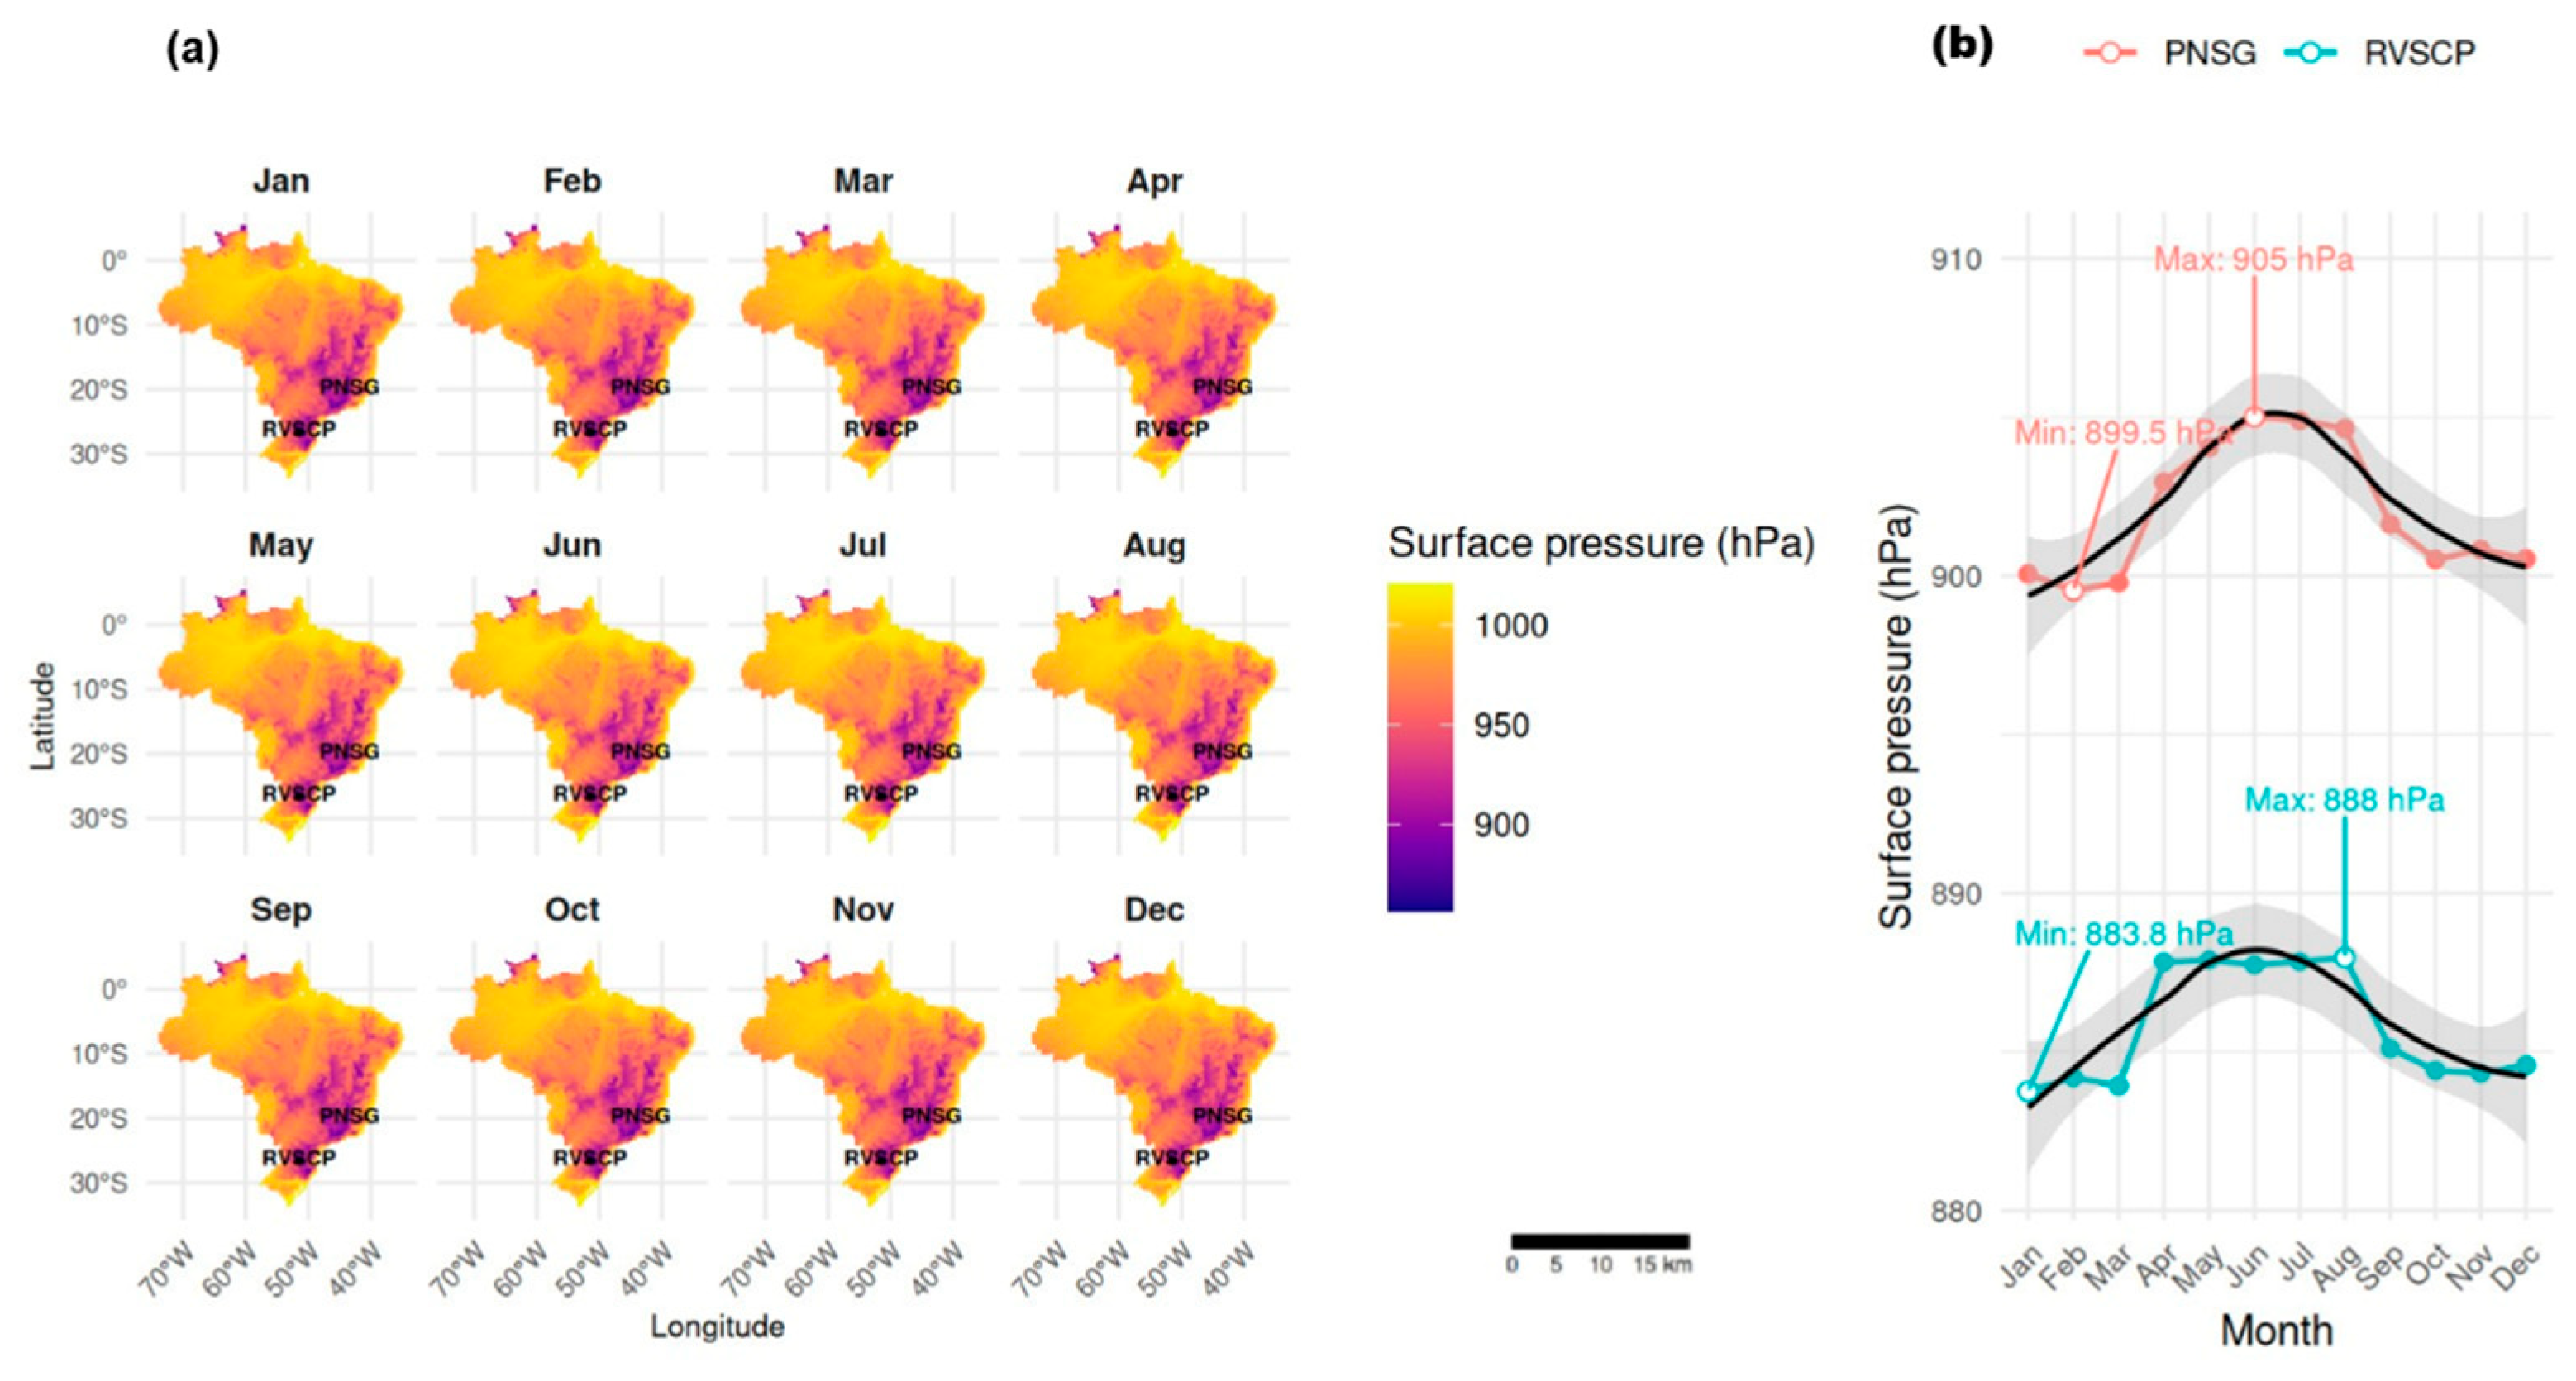

Disclaimer/Publisher’s Note: The statements, opinions and data contained in all publications are solely those of the individual author(s) and contributor(s) and not of MDPI and/or the editor(s). MDPI and/or the editor(s) disclaim responsibility for any injury to people or property resulting from any ideas, methods, instructions or products referred to in the content. |
© 2026 by the authors. Licensee MDPI, Basel, Switzerland. This article is an open access article distributed under the terms and conditions of the Creative Commons Attribution (CC BY) license.