


Abstract
Mangrove represent vital coastal ecosystems that contribute to shoreline stabilization, ecological balance, and environmental management. Nevertheless, the precise delineation of mangrove regions using remote sensing data is often impeded by spectral similarities with intertidal mudflats and aquatic features, alongside the irregular spatial patterns and intricate margins of mangrove stands. This research utilizes high-resolution Gaofen-6 (GF-6) satellite observations as the foundational data to develop Triplet Axial High-Resolution Network (TAHRNet), a semantic segmentation architecture derived from the High-Resolution Network with Object-Contextual Representations (HRNet-OCR) framework for mangrove identification. The model integrates a Triplet Attention module to facilitate cross-dimensional feature dependencies and an improved Multi-Head Sequential Axial Attention mechanism to capture long-range spatial context while maintaining structural consistency. Based on evaluations using the test dataset, TAHRNet yielded a Mean Intersection over Union (MIoU) of 92.01% and a Overall Accuracy of 96.38%. Relative to U-Net and SegFormer, the proposed approach showed MIoU improvements of 5.25% and 1.88%, with corresponding Accuracy gains of 2.68% and 0.94%. Further application to coastal mapping in Zhanjiang produced results that align with manual visual interpretation. These findings suggest that TAHRNet is a viable tool for mangrove extraction and can provide technical support for coastal monitoring and ecological analysis.
1. Introduction
Mangroves are representative coastal ecosystems that play pivotal roles in windbreak and sand fixation, wave energy attenuation, sediment entrapment, and soil and water conservation [1,2,3]. Their complex root structures effectively stabilize shorelines, improve nearshore water environments, and provide essential ecological barriers and water quality regulation for high-level pond aquaculture and coastal agricultural activities [4,5]. By promoting nutrient cycling and organic matter accumulation, mangroves enhance the productivity of coastal ecosystems, offering significant support for the development of ecological fisheries and coastal agriculture [6]. Furthermore, their extensive root systems excel at capturing suspended organic particles, which, combined with the anaerobic nature of mangrove sediments, facilitates long-term organic carbon burial and underscores the urgent need for scientific structural management to prevent ecosystem degradation [7]. However, as globally significant blue carbon sinks, mangroves are highly vulnerable to climate change—particularly sea-level rise and extreme hydrological shifts [8]—and their continuous shrinkage driven by coastal development has led to declining stability in coastal agricultural environments [9]. Therefore, establishing a high-precision spatial distribution and dynamic monitoring system for mangroves is paramount to ensuring the sustainable development of coastal agroecosystems. Remote sensing, characterized by its high spatial resolution, wide coverage, multi-temporal acquisition, and rich spectral information, has become an indispensable technical tool for mangrove monitoring.
Driven by key benefits including high spatial resolution, broad coverage, multi-temporal acquisition capability, and rich spectral information, remote sensing has emerged as a fundamental approach for evaluating mangrove ecosystems [10,11]. Regarding conventional methods for detecting these forests, R. Vidhya et al. [12] successfully mapped mangrove health and area by integrating EO-1 Hyperion hyperspectral data with Support Vector Machine (SVM) classification and the Soil-Adjusted Vegetation Index (SAVI). Junchao Qiao et al. [13] evaluated the distribution of mangroves along the Guangxi coast by applying the Random Forest algorithm to Landsat series imagery. Yongze Li et al. [14] developed a delineation technique leveraging Orthogonal Subspace Projection and Weighted Least Squares to detect mangroves in Yingluo Bay, Guangxi, utilizing Gaofen-6 (GF-6) high-resolution optical data. Although these methods have proven effective in specific regions, conventional approaches generally rely heavily on manual feature engineering, exhibit poor adaptability to complex backgrounds, and struggle to process non-linear feature variations in high-resolution imagery.
As the utilization of Convolutional Neural Networks (CNNs) expands across computer vision and remote sensing, deep learning techniques have created novel pathways for tackling semantic segmentation challenges [15,16]. As a result, a diverse array of deep learning-driven segmentation approaches has been developed, showing distinct benefits for recognizing intricate scene structures [17,18]. For instance, the U-Net framework leverages an encoder–decoder architecture coupled with skip connections to boost segmentation accuracy via the integration of multi-level features [19]. In mangrove-related remote sensing studies, Maung et al. [20] employed a U-Net-based model for mangrove classification in the Wunbaik region of Myanmar; however, its encoder–decoder architecture may still be limited in preserving fine spatial details and distinguishing fragmented mangrove patches from spectrally similar coastal features. Meanwhile, the DeepLab architecture family incorporated Atrous Convolution alongside Atrous Spatial Pyramid Pooling (ASPP) to broaden contextual understanding via multi-scale feature aggregation, thereby delivering robust results when segmenting complicated terrains [21,22]. Lixiang Fu et al. [23] presented a multi-scale fusion attention network (MSFANet) based on the DeepLabV3+ framework to improve boundary delineation and small-target segmentation in high-resolution imagery; however, this method may still face limitations in handling fragmented and irregularly shaped mangrove patches, distinguishing spectrally similar areas, learning effectively from small and sparse mangrove regions, and maintaining high-resolution feature representations throughout the network. In addition, recent Transformer-based methods have also been introduced into mangrove-related remote sensing tasks. For example, Zhenhua Wang et al. [24] presented Swin-UperNet, a semantic segmentation model based on the UperNet framework, for mangrove and Spartina alterniflora classification; however, challenges may still remain in delineating fragmented targets, preserving boundary details, and distinguishing spectrally similar coastal classes in complex scenes. Recently, the High-Resolution Network (HRNet) has emerged with a core philosophy of parallel multi-resolution feature extraction. Unlike traditional serial networks, HRNet maintains high-resolution representations throughout the process by repeatedly aggregating multi-scale information via parallel sub-networks [25]. Ying Wang et al. [26] applied the original HRNet to identify mangroves in Wenzhou, showing its effectiveness in maintaining boundary information; however, the original HRNet does not explicitly address spectral confusion between mangroves and adjacent mudflat/water regions, the spatial continuity of fragmented mangrove patches, or the learning of small and sparse mangrove areas in complex coastal environments.
The existing literature demonstrates the applicability of architectures like U-Net, DeepLabV3+, Transformers, and HRNet for identifying mangroves via remote sensing. Nevertheless, when applied to heterogeneous coastal scenes, these conventional approaches often encounter constraints in maintaining precise edge delineations. They also face difficulties in detecting highly dispersed mangrove clusters and separating target vegetation from background elements with overlapping spectral signatures, including tidal mudflats and aquatic zones. To address these limitations, the developed TAHRNet focuses on enhancing dependencies across feature dimensions and improving global context modeling. This structural design aims to retain high-resolution spatial attributes, thereby facilitating more reliable mangrove extraction amidst challenging coastal topographies.
However, accurate mangrove segmentation in high-resolution remote sensing imagery still faces several critical challenges in complex coastal scenarios involving aquaculture and agriculture: (1) spectral confusion between mangroves, mudflats, and water bodies may lead to misclassification, particularly at the land–water interface; (2) the fragmented spatial distribution and irregular structure of mangroves make it difficult to capture long-range contextual dependencies while preserving spatial continuity; and (3) the relatively small proportion of mangrove pixels compared to the background results in class imbalance, which may weaken the learning of boundary and fine-grained features.
To address these challenges, this study proposes an improved semantic segmentation model, TAHRNet, developed based on the HRNet-OCR framework [27]. First, to alleviate spectral confusion, a Triplet Attention module is incorporated to facilitate cross-dimensional feature interactions between the channel and spatial dimensions, thereby improving the discrimination of mangroves from spectrally similar backgrounds. Second, to handle the fragmented spatial distribution of mangroves, an improved axial attention mechanism featuring a multi-head sequential architecture is proposed. This refined mechanism captures long-range spatial dependencies more effectively while preserving spatial continuity, thus enhancing contextual representation for precise mangrove delineation. Third, to mitigate the class imbalance issue and improve the learning of boundary and fine-grained features, a combined loss function integrating Weighted Cross-Entropy and Dice loss is employed.
In summary, the proposed TAHRNet enhances the discrimination of spectrally similar classes, improves the representation of fragmented mangrove structures, and strengthens the learning of boundary and fine-grained features, thereby providing a practical approach for mangrove segmentation in complex coastal environments.
Given that mangrove habitats frequently form narrow and fragmented corridors at intricate land–ocean boundaries, relying on moderate-resolution products like 10-m Sentinel-2 imagery frequently introduces spectral blending within individual pixels. This limitation ultimately leads to boundary uncertainties and the omission of smaller patches. To better capture fine spatial details, this study utilizes GF-6 data by fusing 8 m multispectral bands and 2 m panchromatic bands through the NNDiffuse pan-sharpening method to generate 2 m resolution multispectral imagery. Based on this high-resolution dataset, the performance of TAHRNet is evaluated against several representative semantic segmentation models. Furthermore, to examine its practical applicability, the model is applied to map mangrove distributions in typical coastal areas of Zhanjiang, including Techeng Island and Dongtoushan Island. The comprehensive experimental and application results demonstrate that TAHRNet provides a competitive and reliable technical approach for the refined remote sensing monitoring of mangrove ecosystems.
2. Materials and Methods
2.1. Study Area
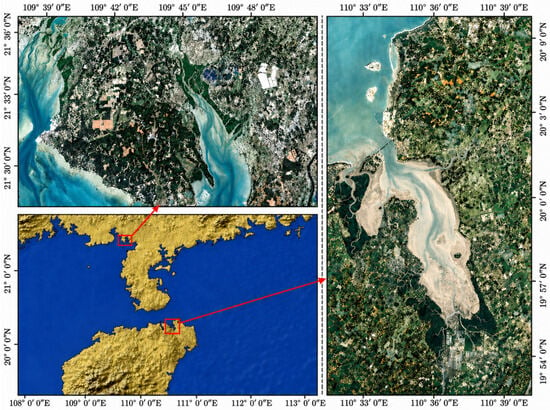
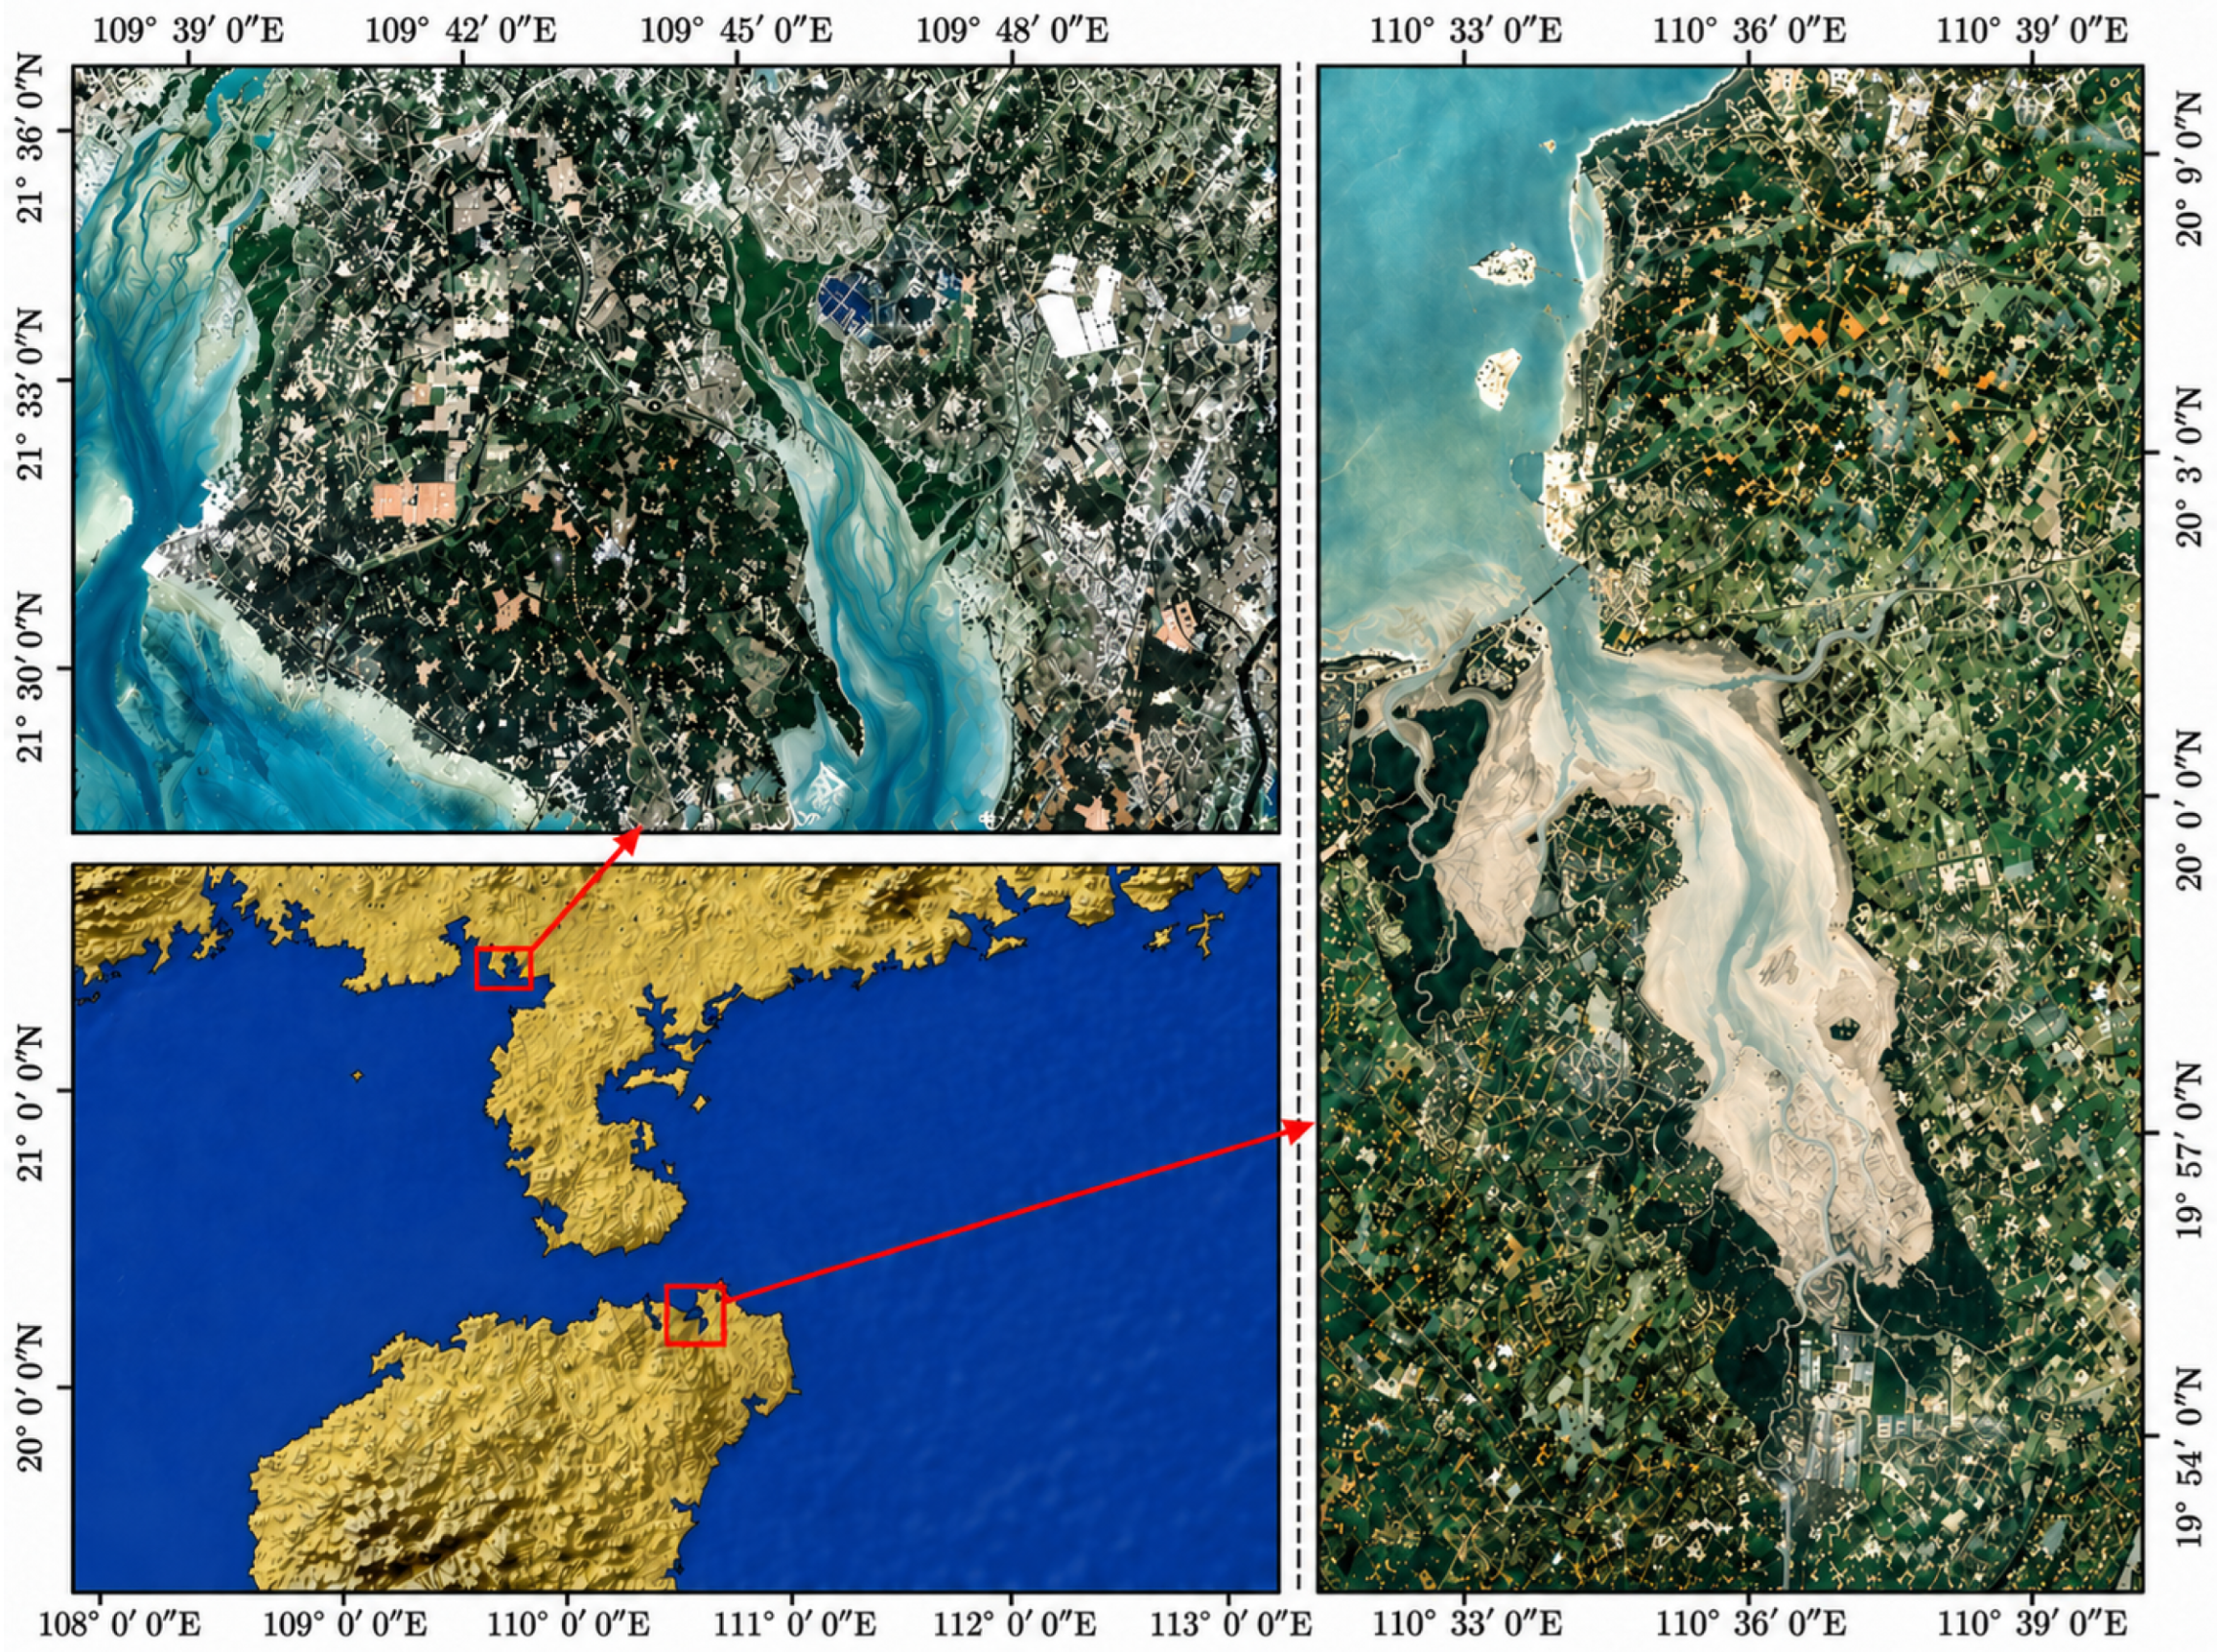
For our experimental investigations, we focused on two distinct ecological zones: the mangrove nature reserves located in Yingluo Port, Guangxi, China, and Dongzhai Port, Hainan, China (Figure 1). Yingluo Port is located in Shankou Town, Hepu County, Guangxi, China. It features a subtropical marine climate with abundant sunlight and diverse mangrove species, which are densely distributed and support a complete ecosystem. Dongzhai Port is located in the northeast of Haikou City, Hainan Province, China. This location experiences a warm and moist tropical monsoon climate, fostering well-established mangroves with diverse communities. Both areas are typical mangrove-concentration zones in China, characterized by distinct ecological features and intact mangrove resources, and thus hold high ecological and scientific research value.
Figure 1.
Location of the study areas: Yingluo Port in Guangxi, China, and Dongzhai Port in Hainan, China.
2.2. Dataset Preparation and Preprocessing Strategies
High-spatial-resolution imagery from the GF-6 satellite serves as the foundational data for this investigation. This optical observation platform features a dual-sensor configuration comprising multispectral (MS) and panchromatic (PAN) capabilities. The MS component acquires data across four wavebands—blue (0.45–0.52 μm), green (0.52–0.59 μm), red (0.63–0.69 μm), and near-infrared (0.77–0.89 μm)—with a ground sampling distance of 8 m, tailored for the extraction of vegetative features. Simultaneously, the PAN sensor provides a 2 m resolution across a 0.45–0.90 μm spectral interval, which is instrumental in resolving intricate spatial elements like textures and linear edges.
GF-6 imagery is characterized by the combination of rich spectral information and high spatial resolution, allowing effective integration of spectral and spatial features. This makes it particularly suitable for mangrove mapping, where vegetation patches are often narrow, fragmented, and distributed along complex land–water interfaces. Compared with medium-resolution data, GF-6 can better reduce mixed-pixel effects and improve the representation of boundary details in heterogeneous coastal environments.
For the Yingluo Port Mangrove Reserve in Guangxi, a multispectral image (8 m spatial resolution) and a panchromatic image (2 m spatial resolution) acquired on 30 January 2023 were selected. For the Dongzhai Port Mangrove Reserve in Hainan, a multispectral image (8 m spatial resolution) and a panchromatic image (2 m spatial resolution) acquired on 17 April 2024 were selected.
To prepare the raw datasets, a standard preprocessing pipeline was executed, consisting of radiometric calibration, atmospheric correction, and geometric rectification. To enhance the spatial resolution of the multispectral imagery, the NNDiffuse pan-sharpening method [28] was employed to fuse the 8 m multispectral images with the 2 m panchromatic images, resulting in 2 m resolution multispectral imagery while preserving spectral consistency. Following this, ground truth labels were generated through manual visual interpretation using ArcGIS 10.8.2. Finally, the finalized imagery was partitioned into -pixel segments, producing a total of 546 baseline image patches.
To mitigate overfitting and bolster the generalization capacity of our segmentation architecture, we executed eight data augmentation protocols across the image inputs and their associated annotation masks. Key transformations involved spatial shifts like horizontal and vertical flips, alongside radiometric adjustments including color jittering and brightness alterations. This workflow expanded the overall corpus, yielding a total of 1820 sample datasets. We then distributed this collection to form distinct subsets for training, validating, and testing models, adhering to an 8:1:1 allocation scheme. These specific data splits served the purposes of driving the learning process, parameter optimization, and assessing the ultimate predictive performance, respectively.
2.3. Improved HRNet-OCR Model Framework
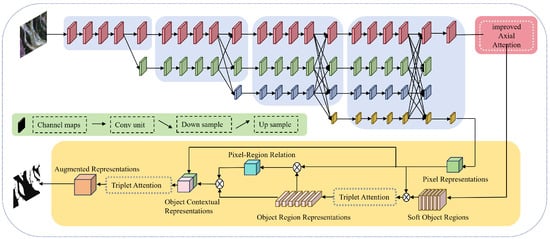
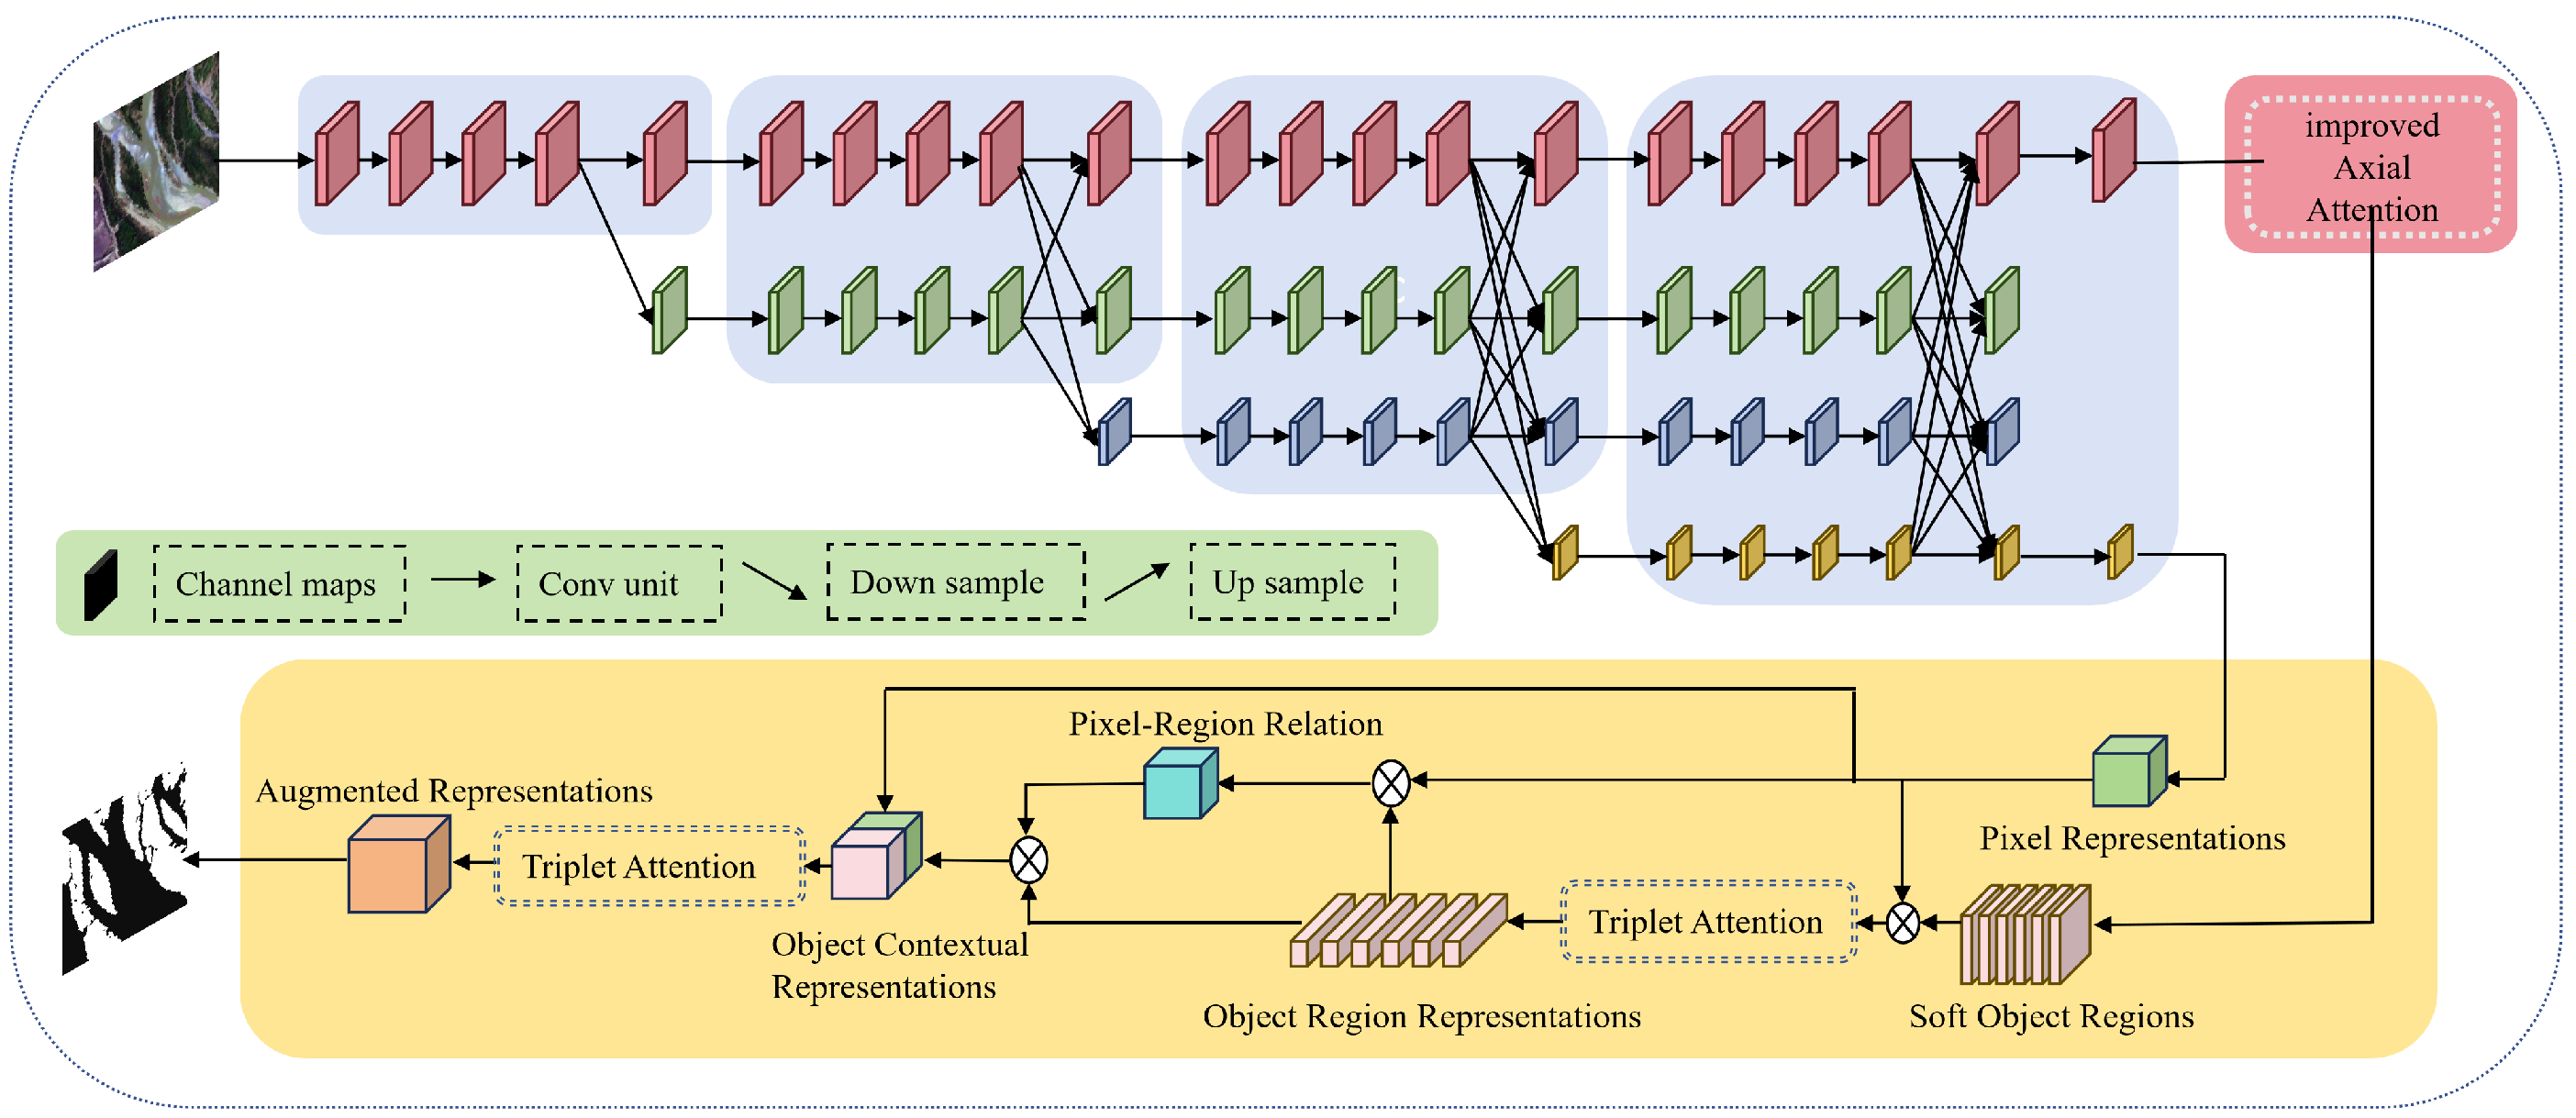
The proposed TAHRNet consists of three primary components: the HRNet high-resolution backbone, the improved Multi-Head Sequential Axial Attention mechanism, and the Object-Contextual Representations (OCR) module integrated with Triplet Attention. Initially, shallow convolutions extract primary features from the input remote sensing imagery before they enter the multi-resolution parallel structure of HRNet. Throughout this process, the network maintains parallel feature branches at various scales (high, medium, and low) and continuously exchanges information through repeated cross-scale fusion. This mechanism allows the high-resolution branch to preserve detailed spatial structural representations, while the low-resolution branches capture rich semantic context. Consequently, HRNet outputs a set of aligned multi-scale features, providing a comprehensive information basis for subsequent attention modeling and context aggregation.
Subsequent to the initial feature extraction via the backbone network, the refined Multi-Head Sequential Axial Attention module is deployed to capture extensive spatial correlations. This configuration bolsters macroscopic structural awareness, thereby assisting in the separation of mangrove targets from heterogeneous background covers, such as tidal mudflats and aquatic zones. Meanwhile, during the semantic fusion phase, the Triplet Attention unit integrated into the OCR pipeline promotes multi-axis feature interplay across the channel, height, and width domains. Such a dedicated attention strategy sharpens the representation of intricate local details and edge demarcations. A comprehensive schematic of the TAHRNet pipeline is depicted in Figure 2.
Figure 2.
TAHRNet network model structure.
2.4. Triplet Attention Mechanism
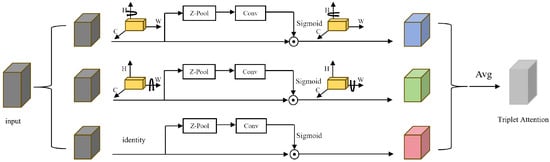
Aiming to improve the capacity of the architecture to model cross-dependencies between channel and spatial features, a Triplet Attention mechanism proposed by Misra D et al. [29] is introduced into the HRNet-OCR network. This module establishes separate attention branches along three dimensions: the channel dimension, the spatial height (row) dimension, and the spatial width (column) dimension. This design facilitates the efficient integration and analysis of multidimensional information, thereby strengthening the model’s focus on critical regions. Compared to traditional single spatial or channel attention mechanisms, Triplet Attention more comprehensively integrates global context with local details. While maintaining a low computational overhead, it effectively improves the continuity and boundary clarity of mangrove region segmentation, as illustrated in Figure 3.
Figure 3.
The detailed structure of the Triplet Attention mechanism.
Assume an incoming feature tensor , with the dimensions C, H, and W corresponding to the channel count, spatial height, and spatial width. The Triplet Attention mechanism extracts statistical features across different dimensions using average and max pooling. These pooled features are subsequently fused via convolutions to obtain weight-mapping matrices, enabling adaptive feature recalibration.
To streamline the mathematical representation, following the formulation of Triplet Attention in Misra D et al. [29], we define a unified cross-dimensional attention operator, denoted as . For a given permuted input tensor X, this operator concatenates the average-pooled and max-pooled features along the designated spatial dimension, followed by a convolution, a non-linear activation, and an element-wise multiplication with X:
where denotes the concatenation operation, represents the sigmoid activation function, and ∘ denotes element-wise multiplication.
Based on this unified operator, the Triplet Attention mechanism establishes three parallel interactive branches. Specifically, in the Channel–Height (C–H) interaction branch, the input feature F is first permuted to before applying along the width dimension. Similarly, in the Channel–Width (C–W) interaction branch, F is permuted to , and the operator is applied along the height dimension. Finally, in the Height–Width (H–W) spatial interaction branch, the original feature tensor (denoted as ) is directly utilized, and is applied along the channel dimension to capture global spatial dependencies.
Ultimately, the outputs from the three parallel branches are permuted back to their original shape (denoted by the superscript ∗) and fused via simple averaging to produce the final enhanced output Z:
By simultaneously modeling the cross-dimensional interactions across three orthogonal planes, this mechanism effectively enhances the discriminative power of the features and improves the recognition of fine-grained details along mangrove boundaries.
2.5. Improved Multi-Head Sequential Axial Attention Mechanism
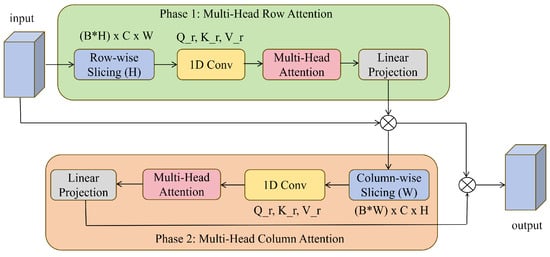
Aiming to advance the distinctiveness of feature representations and better capture extended spatial relationships, an improved Multi-Head Sequential Axial Attention mechanism inspired by the axial attention proposed by Ho J et al. [30] is introduced at the output of the HRNet-OCR backbone. Because standard 2D self-attention exhibits a quadratic increase in computational demands relative to spatial resolution, its direct application to high-resolution remote sensing data like GF-6 presents notable challenges. While standard Axial Attention mitigates these resource costs by factoring the 2D operation into distinct 1D processes, its concurrent execution framework can disrupt the inherent spatial topology of the 2D plane. Additionally, the integration of intricate relative positional encodings introduces substantial memory and processing requirements during the analysis of extensive remote sensing patches, as depicted in Figure 4.
Figure 4.
The detailed structure of the improved Multi-Head Sequential Axial Attention Mechanism.
Considering the habitat characteristics of mangroves in high-resolution imagery—which are often distributed in narrow, elongated strips and interleaved with tidal flat boundaries—this study specifically reconstructs the conventional axial attention. The modifications primarily include three aspects: (1) Multi-Head Sequential Cascade: adopting a “horizontal scanning first, vertical fusion later” approach to construct a dense, global 2D receptive field; (2) Lightweight De-biasing: removing the redundant relative positional bias terms to accommodate large-scale feature maps; (3) Dynamic Gated Residuals (Learnable Zero-Init Residuals): preventing the introduction of global features from disrupting the fine-grained, high-frequency features extracted by the backbone network.
For simplicity of expression, following the basic formulation of axial attention in Ho J et al. [30], we first define a generalized 1D multi-head attention operator, denoted as . For any input 1D feature sequence U, its attention calculation without positional bias can be expressed as:
In this context, h denotes the total count of attention heads. The tensors , , and correspond to the learned linear transformations for the query, key, and value components specific to the i-th head. Additionally, signifies the output projection weight, while defines the capacity of each reduced feature subspace.
Based on the above definition, assuming the high-resolution feature map input to this module is , the improved axial attention accomplishes feature enhancement through two sequential stages. Initially, the feature map F is treated along the horizontal direction as H independent 1D sequences of length W. We introduce a learnable gating parameter initialized to 0, which adaptively connects the output of the row-wise operator with the original features via a residual connection. This yields the intermediate feature that fuses the horizontal global context:
Subsequently, to achieve sequential information interaction in the 2D space, the intermediate output is used as the input for the column-direction attention, treating it vertically as W sequences of length H. Similarly, by introducing the learnable parameter , the module outputs the final enhanced feature map , which is then fed into the subsequent OCR module:
Through this reconstruction, the model functions as an identity mapping during the initial training phase, when and , and then gradually and adaptively absorbs global features. This mechanism decomposes the highly complex operations, which originally grow quadratically with H and W, into two sequential 1D processes. It not only achieves a dense 2D receptive field at a relatively low computational cost but also helps reduce the misclassification and omission errors of fragmented mangrove boundaries against complex tidal flat backgrounds.
2.6. Loss Function
To address the class imbalance between mangrove and background pixels and to improve the learning of boundary and fine-grained structures, a combined loss function is adopted in this study. The total loss consists of Weighted Cross-Entropy (WCE) loss and Dice loss, which provide supervision from both pixel-level classification and region-level overlap. The corresponding loss terms are defined as follows:
where N denotes the total number of pixels; denotes the predicted probability that pixel i belongs to the mangrove class; denotes the corresponding ground-truth label; is the weighting factor used to alleviate class imbalance; is the coefficient used to balance the contributions of the WCE loss and Dice loss; and is a small constant introduced to avoid division by zero and improve numerical stability.
The WCE loss emphasizes pixel-wise classification and helps the model distinguish mangrove pixels from the background, while the Dice loss focuses on the overlap between the predicted region and the reference region, which is beneficial for preserving boundary integrity and improving segmentation consistency. By combining these two loss terms, the model is guided to learn both local details and overall spatial structure.
3. Model Training and Experiments
3.1. Experimental Settings
The computational framework for all evaluations relied on a local workstation equipped with a 3.20 GHz AMD Ryzen 5 3600 hex-core CPU and 32 GB of system memory. Graphical processing and parallel acceleration were handled by a 24 GB NVIDIA GeForce RTX 3090 GPU operating alongside CUDA 11.3. Regarding the software stack, Python 3.8.19 served as the base programming language, while the construction and optimization of all neural networks were executed within the PyTorch 1.10 environment.
To guarantee an equitable evaluation, an identical training protocol was applied across all benchmarked architectures. The optimization process was driven by the Stochastic Gradient Descent (SGD) algorithm. This setup utilized a starting learning rate of 0.01, paired with a momentum of 0.9 and a weight penalty of . Network inputs were formatted to spatial dimensions of pixels. The learning phase spanned a total of 100 epochs utilizing a mini-batch capacity of 4. Additionally, the progression of the learning rate was managed through a cosine annealing schedule.
3.2. Evaluation Metrics
To thoroughly benchmark the segmentation capabilities of our framework within the context of mangrove mapping, we adopted five key statistical indicators: Mean Intersection over Union (), Precision, Recall, F1-Score, and global Accuracy. Their underlying computations proceed as follows: The index evaluates the spatial congruence by dividing the overlapping area by the total combined area of the predicted masks and the reference labels. Confined to a scale from 0 to 1, this metric directly captures the structural alignment between the model outputs and the true targets, and is formulated in Equation (9):
The Precision metric () evaluates the reliability of the positive predictions by measuring the fraction of true mangrove pixels within the entire pool of elements assigned to the mangrove class, which is determined via Equation (10):
Recall () reflects the model’s capability to identify the actual mangrove pixels. It is calculated as shown in Equation (11):
The F1-score () is utilized to evaluate the comprehensive performance of the model by balancing precision and recall. It is calculated as shown in Equation (12):
Serving as a global performance indicator, the overall accuracy () quantifies the fraction of accurately predicted pixels across the entire dataset, which is formulated in Equation (13):
In these formulations, (True Positive) denotes the count of actual mangrove pixels successfully classified by the model, whereas (False Positive) refers to background elements erroneously categorized into the mangrove class. Meanwhile, (False Negative) stands for true mangrove areas missed by the algorithm and labeled as background, and (True Negative) corresponds to non-target regions accurately recognized as such. Finally, C dictates the overall quantity of distinct classes involved in the segmentation process.
4. Results and Analysis
4.1. Ablation Study
To rigorously assess how each algorithmic modification contributes to the overall performance, a series of ablation studies was executed. Within this analysis, the original HRNet_OCR architecture serves as our foundational baseline, which is evaluated against the newly developed TAHRNet model under consistent configuration settings. The statistical outcomes derived from these structural comparisons are summarized in Table 1.
Table 1.
Quantitative experimental results of ablation studies.
In terms of quantitative segmentation performance, the baseline HRNet-OCR model yields an MIoU of 88.53%, along with Precision, Recall, F1-Score, and Accuracy of 93.20%, 94.64%, 93.87%, and 94.67%, respectively. Following the introduction of the Triplet Attention module, all metrics show an upward trend, with the MIoU increasing to 91.47% and the F1-Score to 95.52%. This indicates that the cross-dimensional interaction facilitated by this module helps distinguish mangroves from adjacent background elements, such as water bodies and mudflats. The subsequent addition of the improved Axial Attention mechanism further raises the overall performance, achieving a final MIoU of 92.01% and an Accuracy of 96.38%. By modeling long-range spatial dependencies, this mechanism supports the generation of more continuous segmentation boundaries and structurally cohesive regions, resulting in the highest segmentation accuracy among the tested configurations.
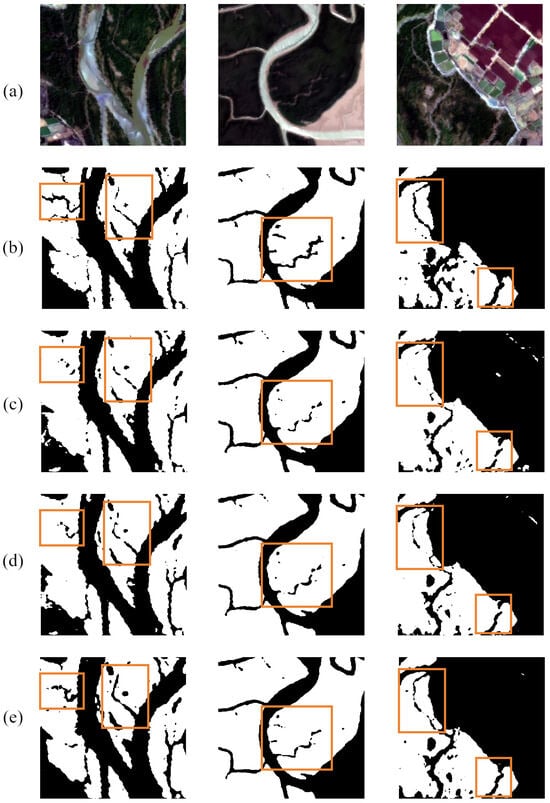
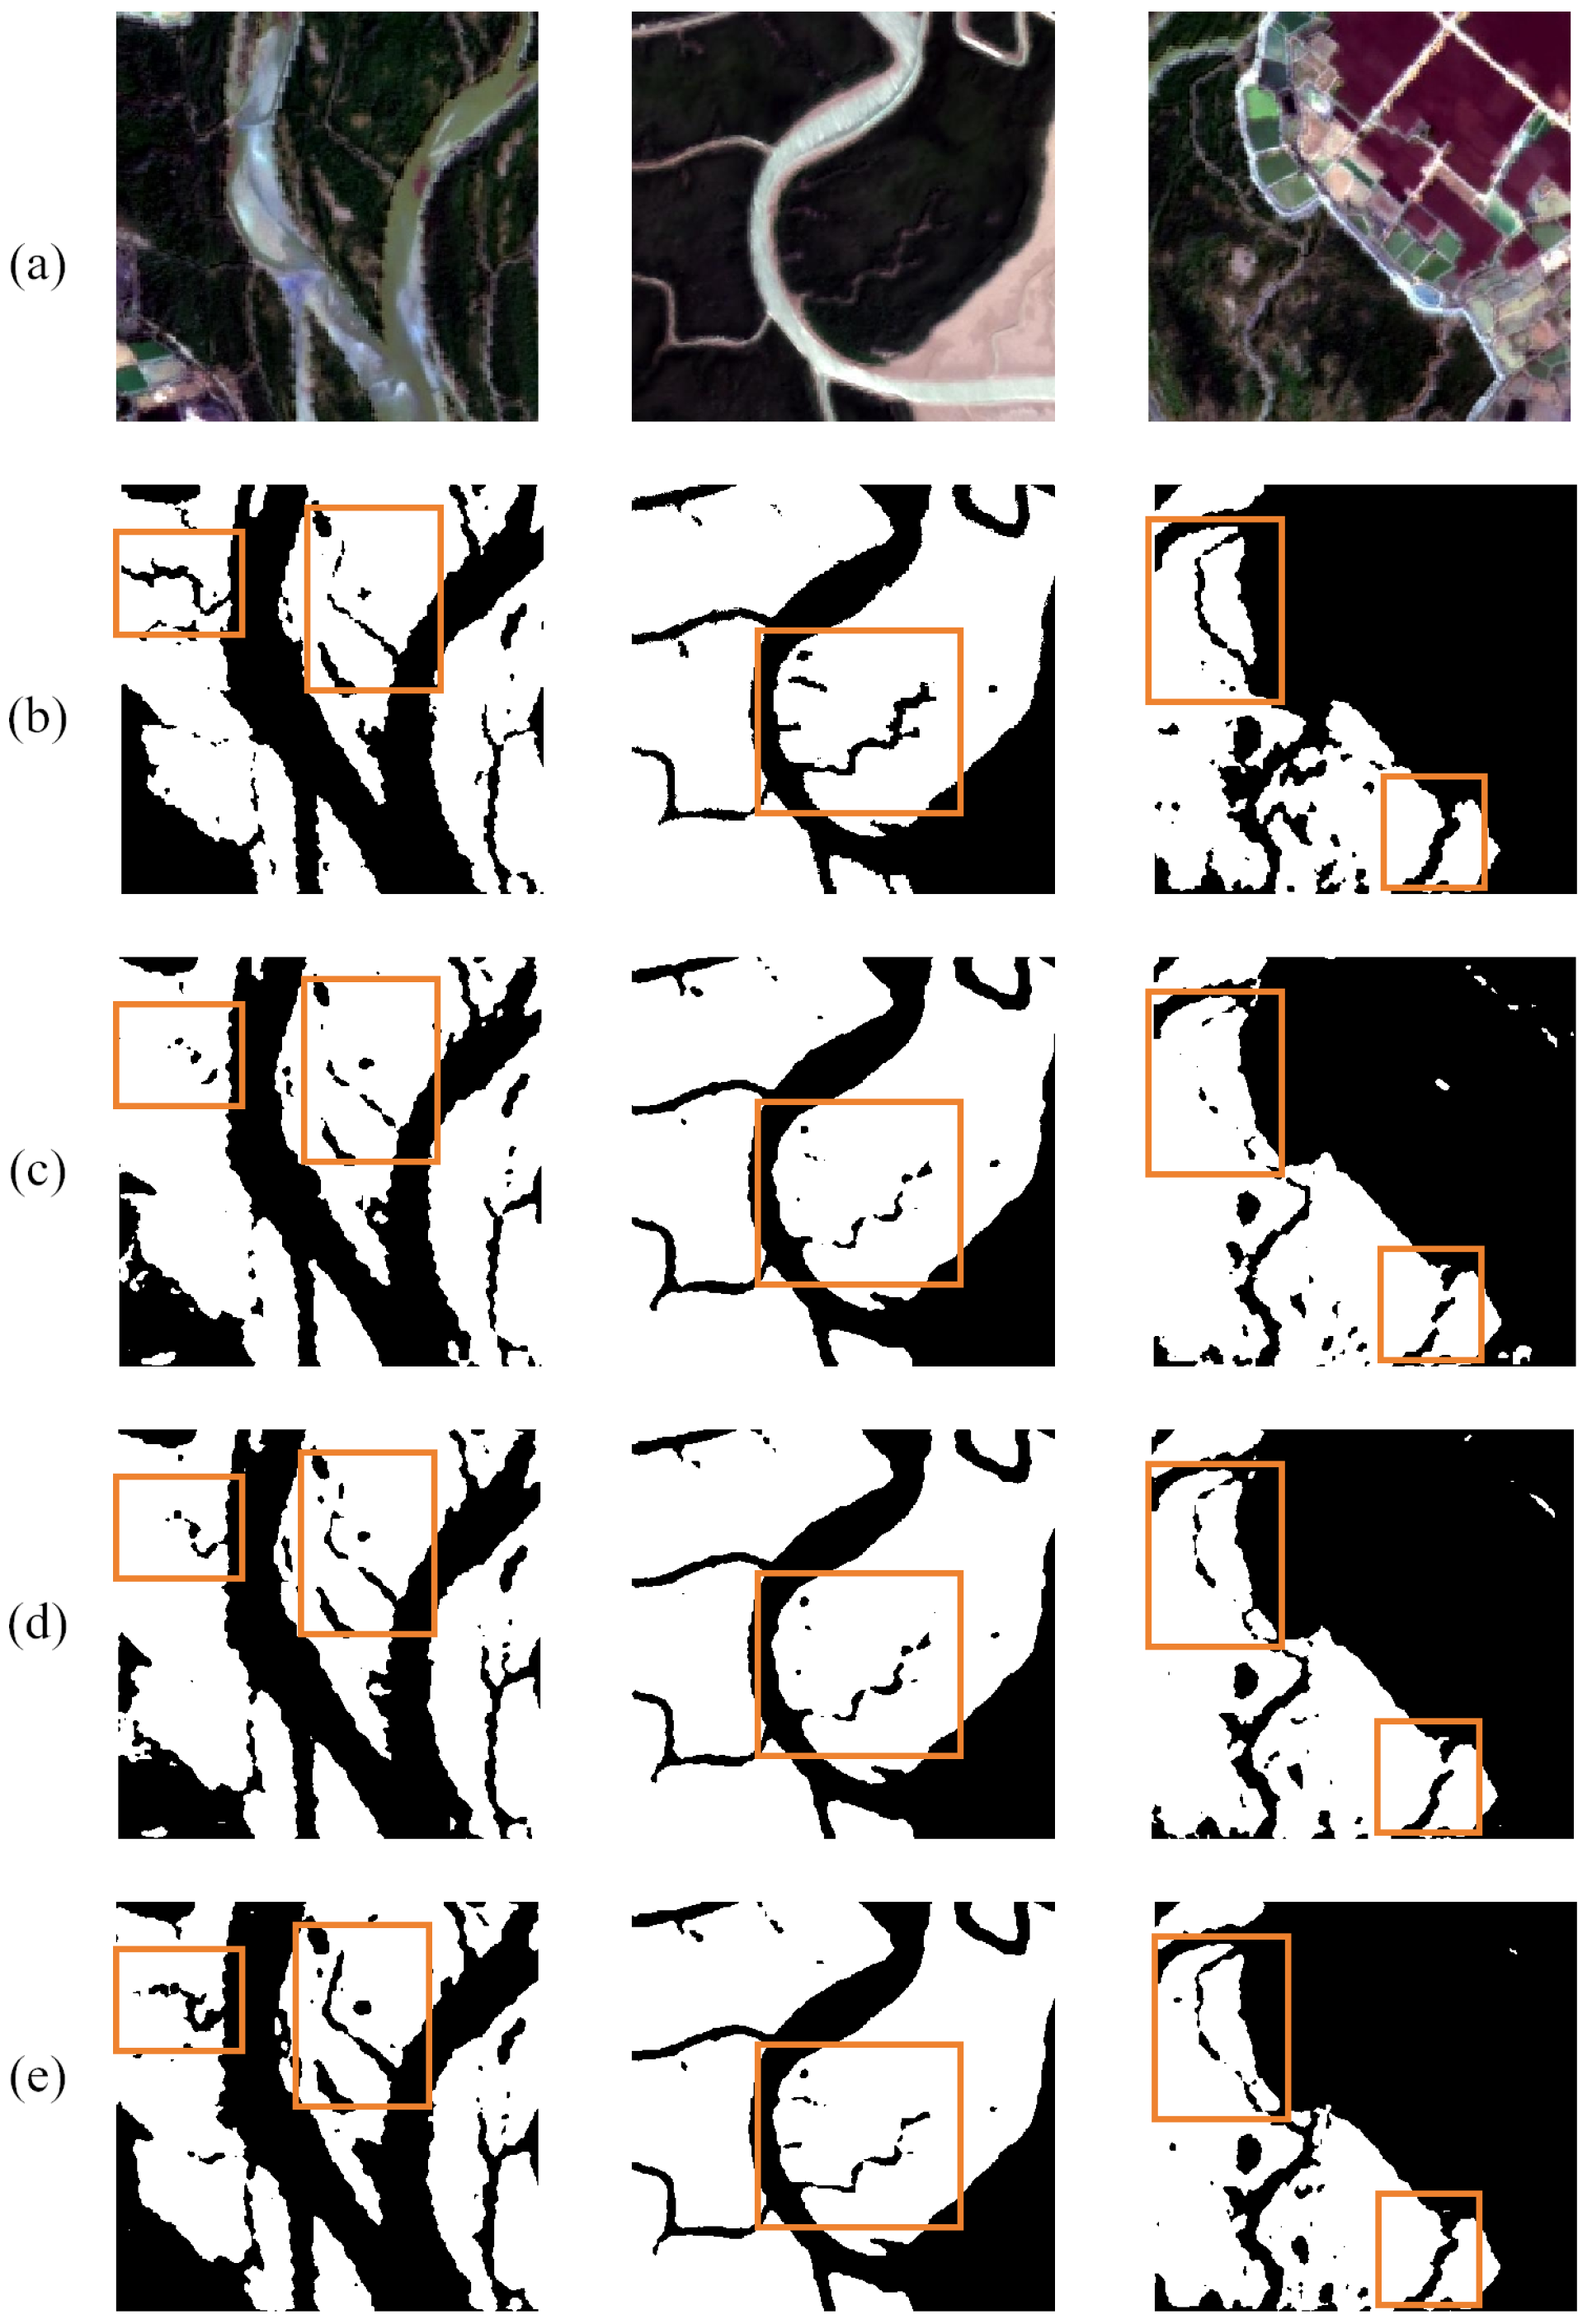
A qualitative assessment of the architectural components is provided in Figure 5. In contrast to the foundational baseline (Figure 5c), incorporating the Triplet Attention module (Figure 5d) bolsters the detection of mangrove regions. The resulting morphological structure is captured with reduced omissions, though some minor details remain unresolved. Furthermore, the integration of the improved Multi-Head Sequential Axial Attention mechanism (Figure 5e) sharpens the spatial delineation and enhances the regional continuity. This full configuration produces more defined mangrove contours and mitigates misclassifications in complex transition zones, delivering the most robust segmentation performance among the tested architectures.
Figure 5.
Qualitative assessment of individual network modules: (a) Image, (b) Ground Truth, (c) HRNet-OCR, (d) HRNet-OCR + Triplet Attention, (e) HRNet-OCR + Triplet Attention + Improved Axial Attention (TAHRNet). The orange boxes indicate representative areas selected for visual comparison among different models.
4.2. Performance Comparison Across Diverse Segmentation Models
To systematically evaluate the relative efficacy of our developed TAHRNet against contemporary leading architectures for mangrove classification, a series of benchmarking trials was executed. For a fair comparison, all benchmark models were trained and evaluated under the same hyperparameter settings unless otherwise specified. The benchmark models are arranged in Table 2 in the following order: PSPNet with a ResNet-50 backbone [31], U-Net with a ResNet-50 backbone, HRNet-W18, CFFormer with ResNet-34 and Swin Transformer V2-Tiny backbones [32], synFSNet with a ConvNeXt-Small backbone [33], DeepLabv3+ with a ResNet-18 backbone, SegFormer-B1 [34], and the proposed TAHRNet based on HRNet-W18. The detailed statistical findings derived from these evaluations on our test set are summarized in Table 2.
Table 2.
Comparative visualization of predictive performance for the tested networks.
The evaluation results across the various models indicate that the TAHRNet attained higher MIoU and Accuracy values compared to other tested methods, reaching 92.01% and 96.38%, respectively. In comparison with the second-best model, SegFormer, the proposed framework showed an increase of 1.88% in MIoU and 0.94% in Accuracy. Additionally, TAHRNet yielded favorable results in terms of Precision, Recall, and F1-Score. Compared with the original HRNet, TAHRNet improved MIoU from 87.72% to 92.01% and Accuracy from 93.68% to 96.38%, indicating that the modifications introduced on the HRNet backbone contributed to improved segmentation performance on the mangrove dataset. The performance of TAHRNet can be attributed to the architectural components designed for high-resolution data, which facilitate feature interaction and help maintain fine-grained spatial details. Specifically, the implementation of the Triplet Attention mechanism enables cross-dimensional interaction among the channel, height, and width dimensions. This mechanism integrates global context with local details, improving the continuity and boundary clarity of segmented mangrove regions in complex coastal scenes.
Furthermore, the incorporation of the improved Multi-Head Sequential Axial Attention mechanism enhances the modeling of long-range dependencies. Unlike conventional parallel axial attention that severs 2D topological connections, our sequential approach preserves spatial integrity and avoids the additional memory burden associated with complex relative positional encodings. Together with the Spatial OCR module, these enhancements strengthen the correlation between region-level contexts and target pixels. In contrast, classic CNN models like PSPNet and U-Net exhibited relatively lower MIoU scores of 86.72% and 86.76%, respectively, as they struggle to capture long-range dependencies efficiently. While Transformer-based models such as SegFormer and CFFormer showed competitive performance due to their global self-attention mechanisms, they may still be less effective in recovering precise boundary details in complex backgrounds compared with our approach. In terms of computational cost, TAHRNet required 10.70 M parameters, 34.69 G FLOPs, 57.63 ms inference time, and 248.77 MB GPU memory usage. Compared with SegFormer-B1, TAHRNet used fewer parameters and less GPU memory, but required higher FLOPs and longer inference time. This indicates that the performance improvement of TAHRNet was accompanied by increased computational cost and reduced inference efficiency. Compared with the original HRNet-W18, the parameter count of TAHRNet increased from 9.64 M to 10.70 M, the FLOPs increased from 18.66 G to 34.69 G, the inference time increased from 51.72 ms to 57.63 ms, and the GPU memory usage increased from 153.18 MB to 248.77 MB. These results show that the performance improvement over HRNet-W18 was obtained with additional computational cost, while the increase in parameter count remained relatively limited. Compared with CFFormer and synFSNet, TAHRNet maintained substantially lower parameter count, FLOPs, and GPU memory usage while achieving higher segmentation accuracy. Ultimately, rather than maximizing execution speed, TAHRNet is optimized to deliver superior segmentation accuracy and precise boundary delineation. This makes the architecture particularly advantageous for deployments where structural fidelity outweighs the need for minimal resource expenditure.
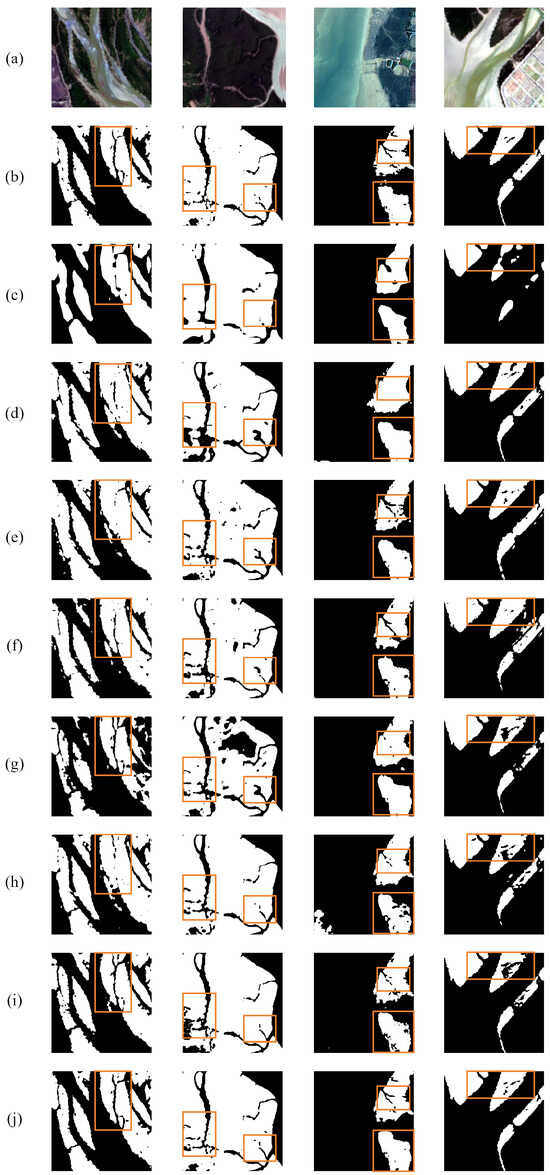
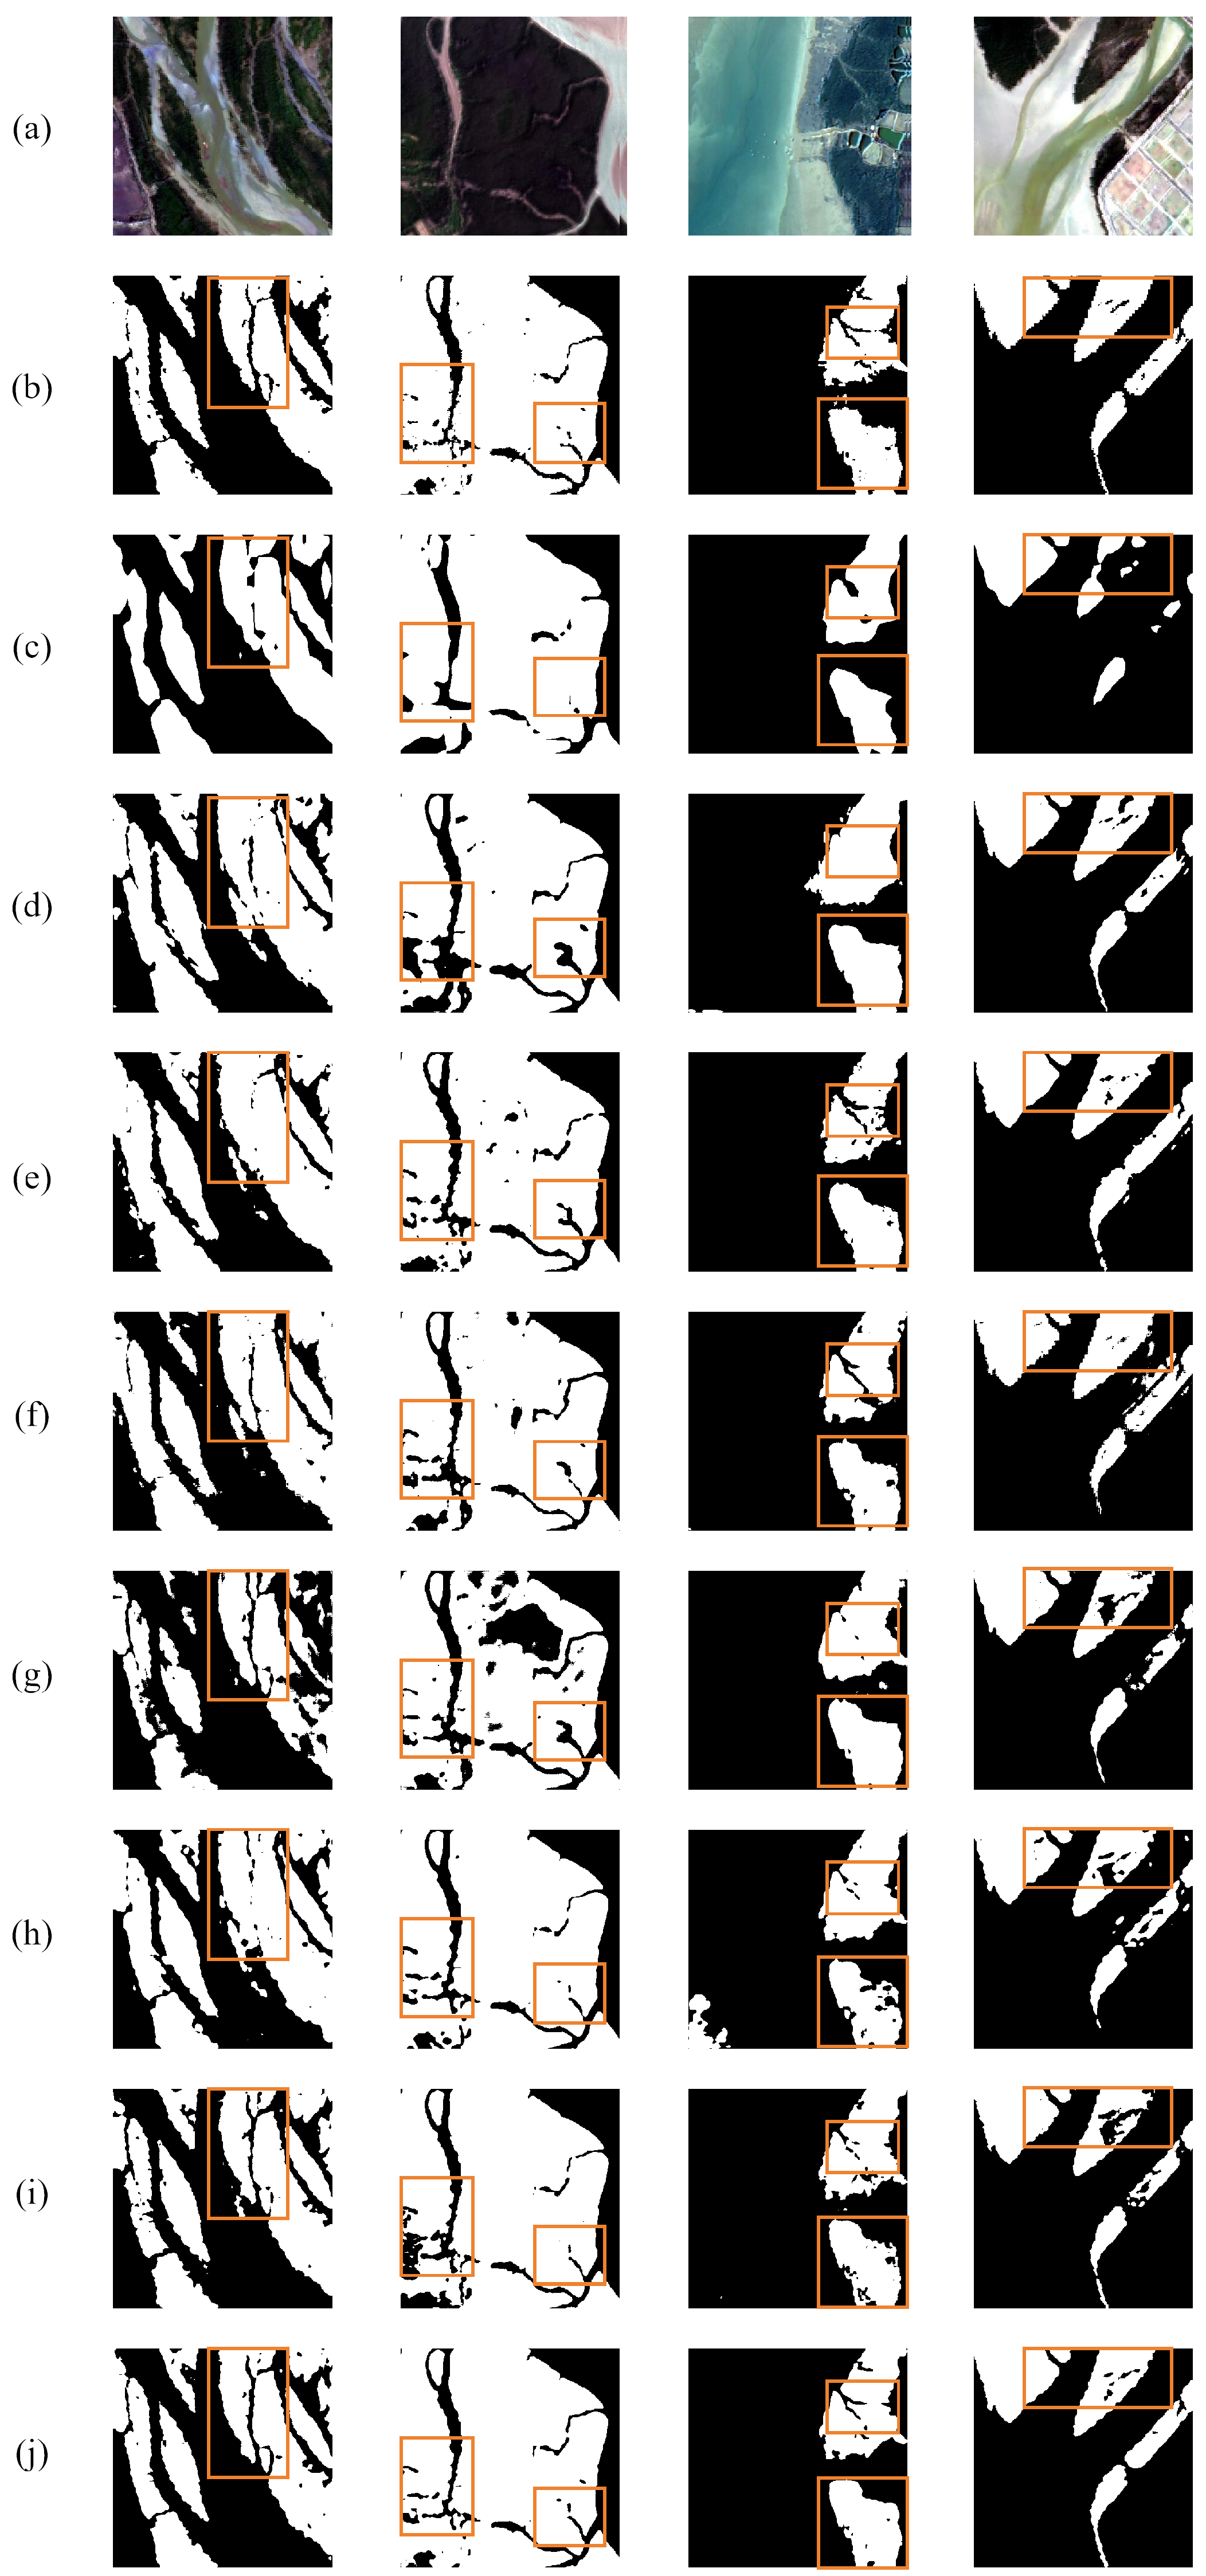
Figure 6 presents a qualitative comparison of the predictive capabilities across the tested architectures. Evidence from the visual samples suggests that baseline frameworks encounter varying levels of morphological distortion and boundary errors. In particular, U-Net, PSPNet, and synFSNet demonstrate constrained recognition effectiveness within heterogeneous landscapes, often resulting in obscured edges or localized categorization mistakes. While DeepLabv3+ and SegFormer offer enhanced regional coherence, they still struggle to precisely resolve delicate boundary features. Relative to the standard HRNet, TAHRNet yields superior structural completeness and sharper boundary definitions throughout challenging mangrove environments. Furthermore, TAHRNet exhibits enhanced stability in both margin extraction and integrated feature characterization. By effectively capturing the dependencies between discrete pixels and thematic regions, the proposed network maintains the geometric fidelity of target objects while refining edge details. These graphical observations align with the numerical data reported in Table 2, confirming that TAHRNet facilitates a highly precise delineation of mangrove habitats in ecologically diverse settings.
Figure 6.
Comparative visualization of model-derived prediction masks: (a) Image, (b) Ground Truth, (c) PSPNet, (d) UNet, (e) HRNet, (f) CFFormer, (g) synFSNet, (h) DeepLabv3+, (i) SegFormer, (j) TAHRNet (Ours). The orange boxes indicate representative areas selected for visual comparison among different models.
5. Applications
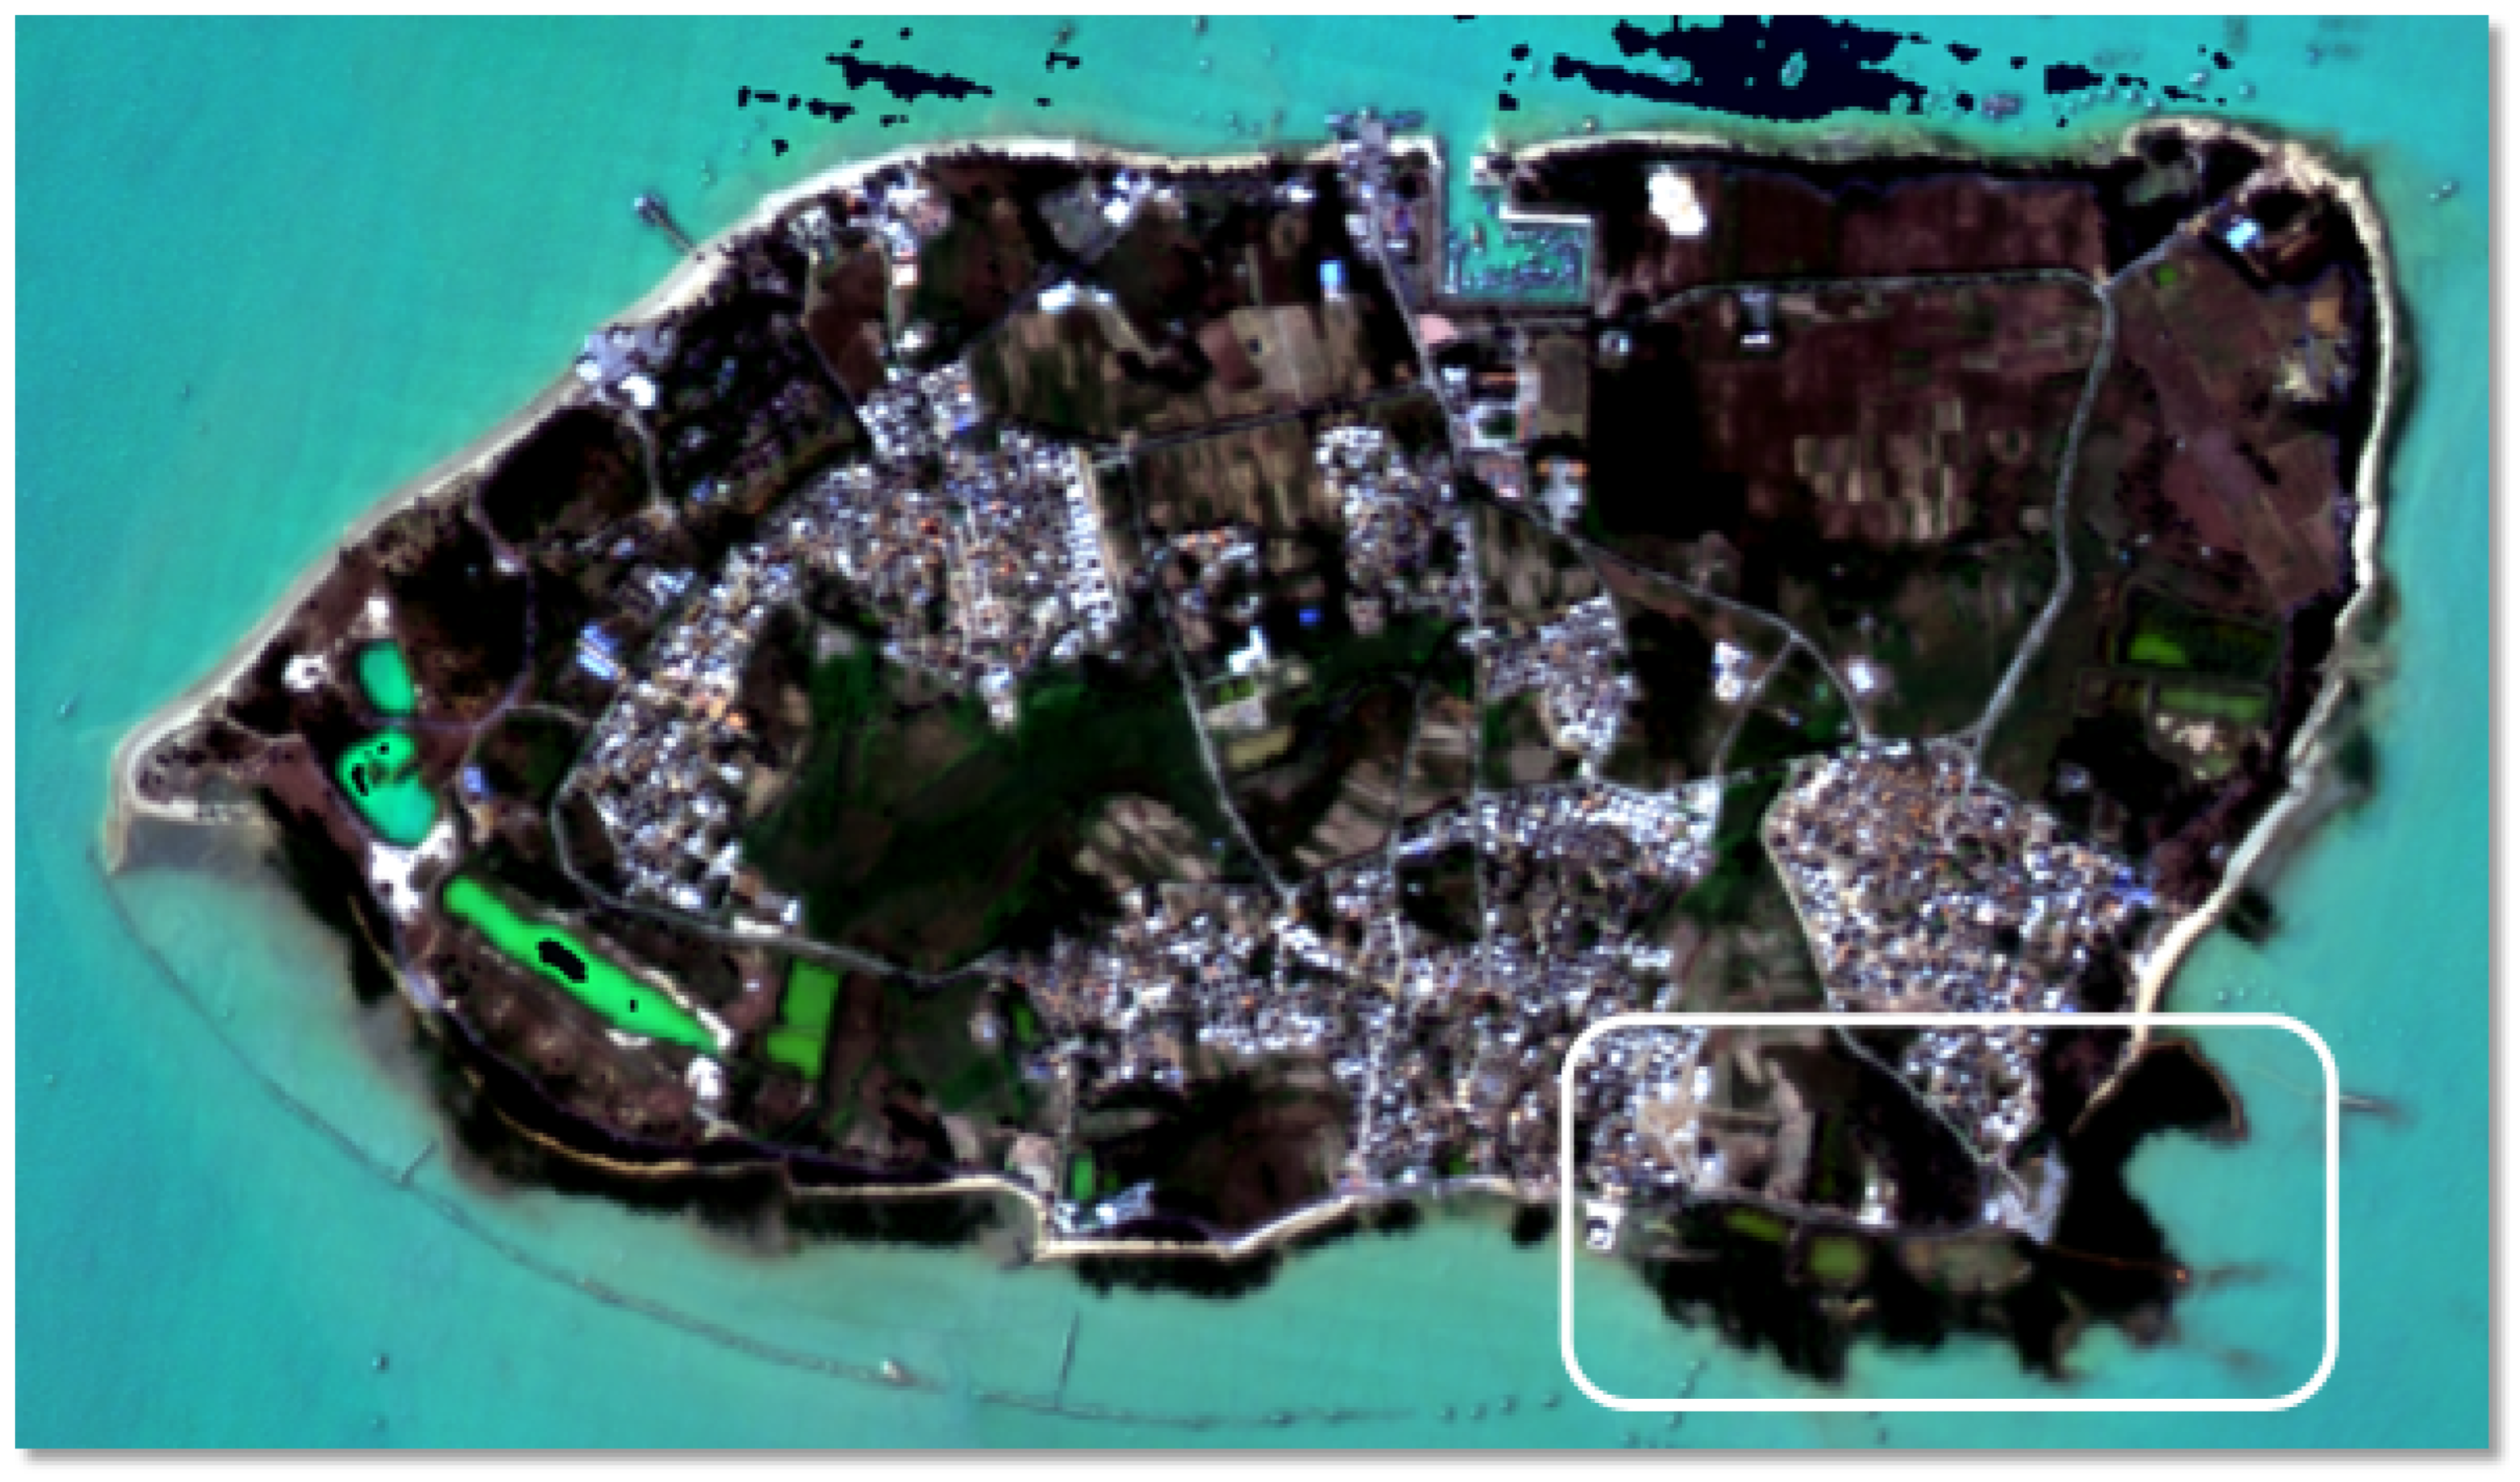
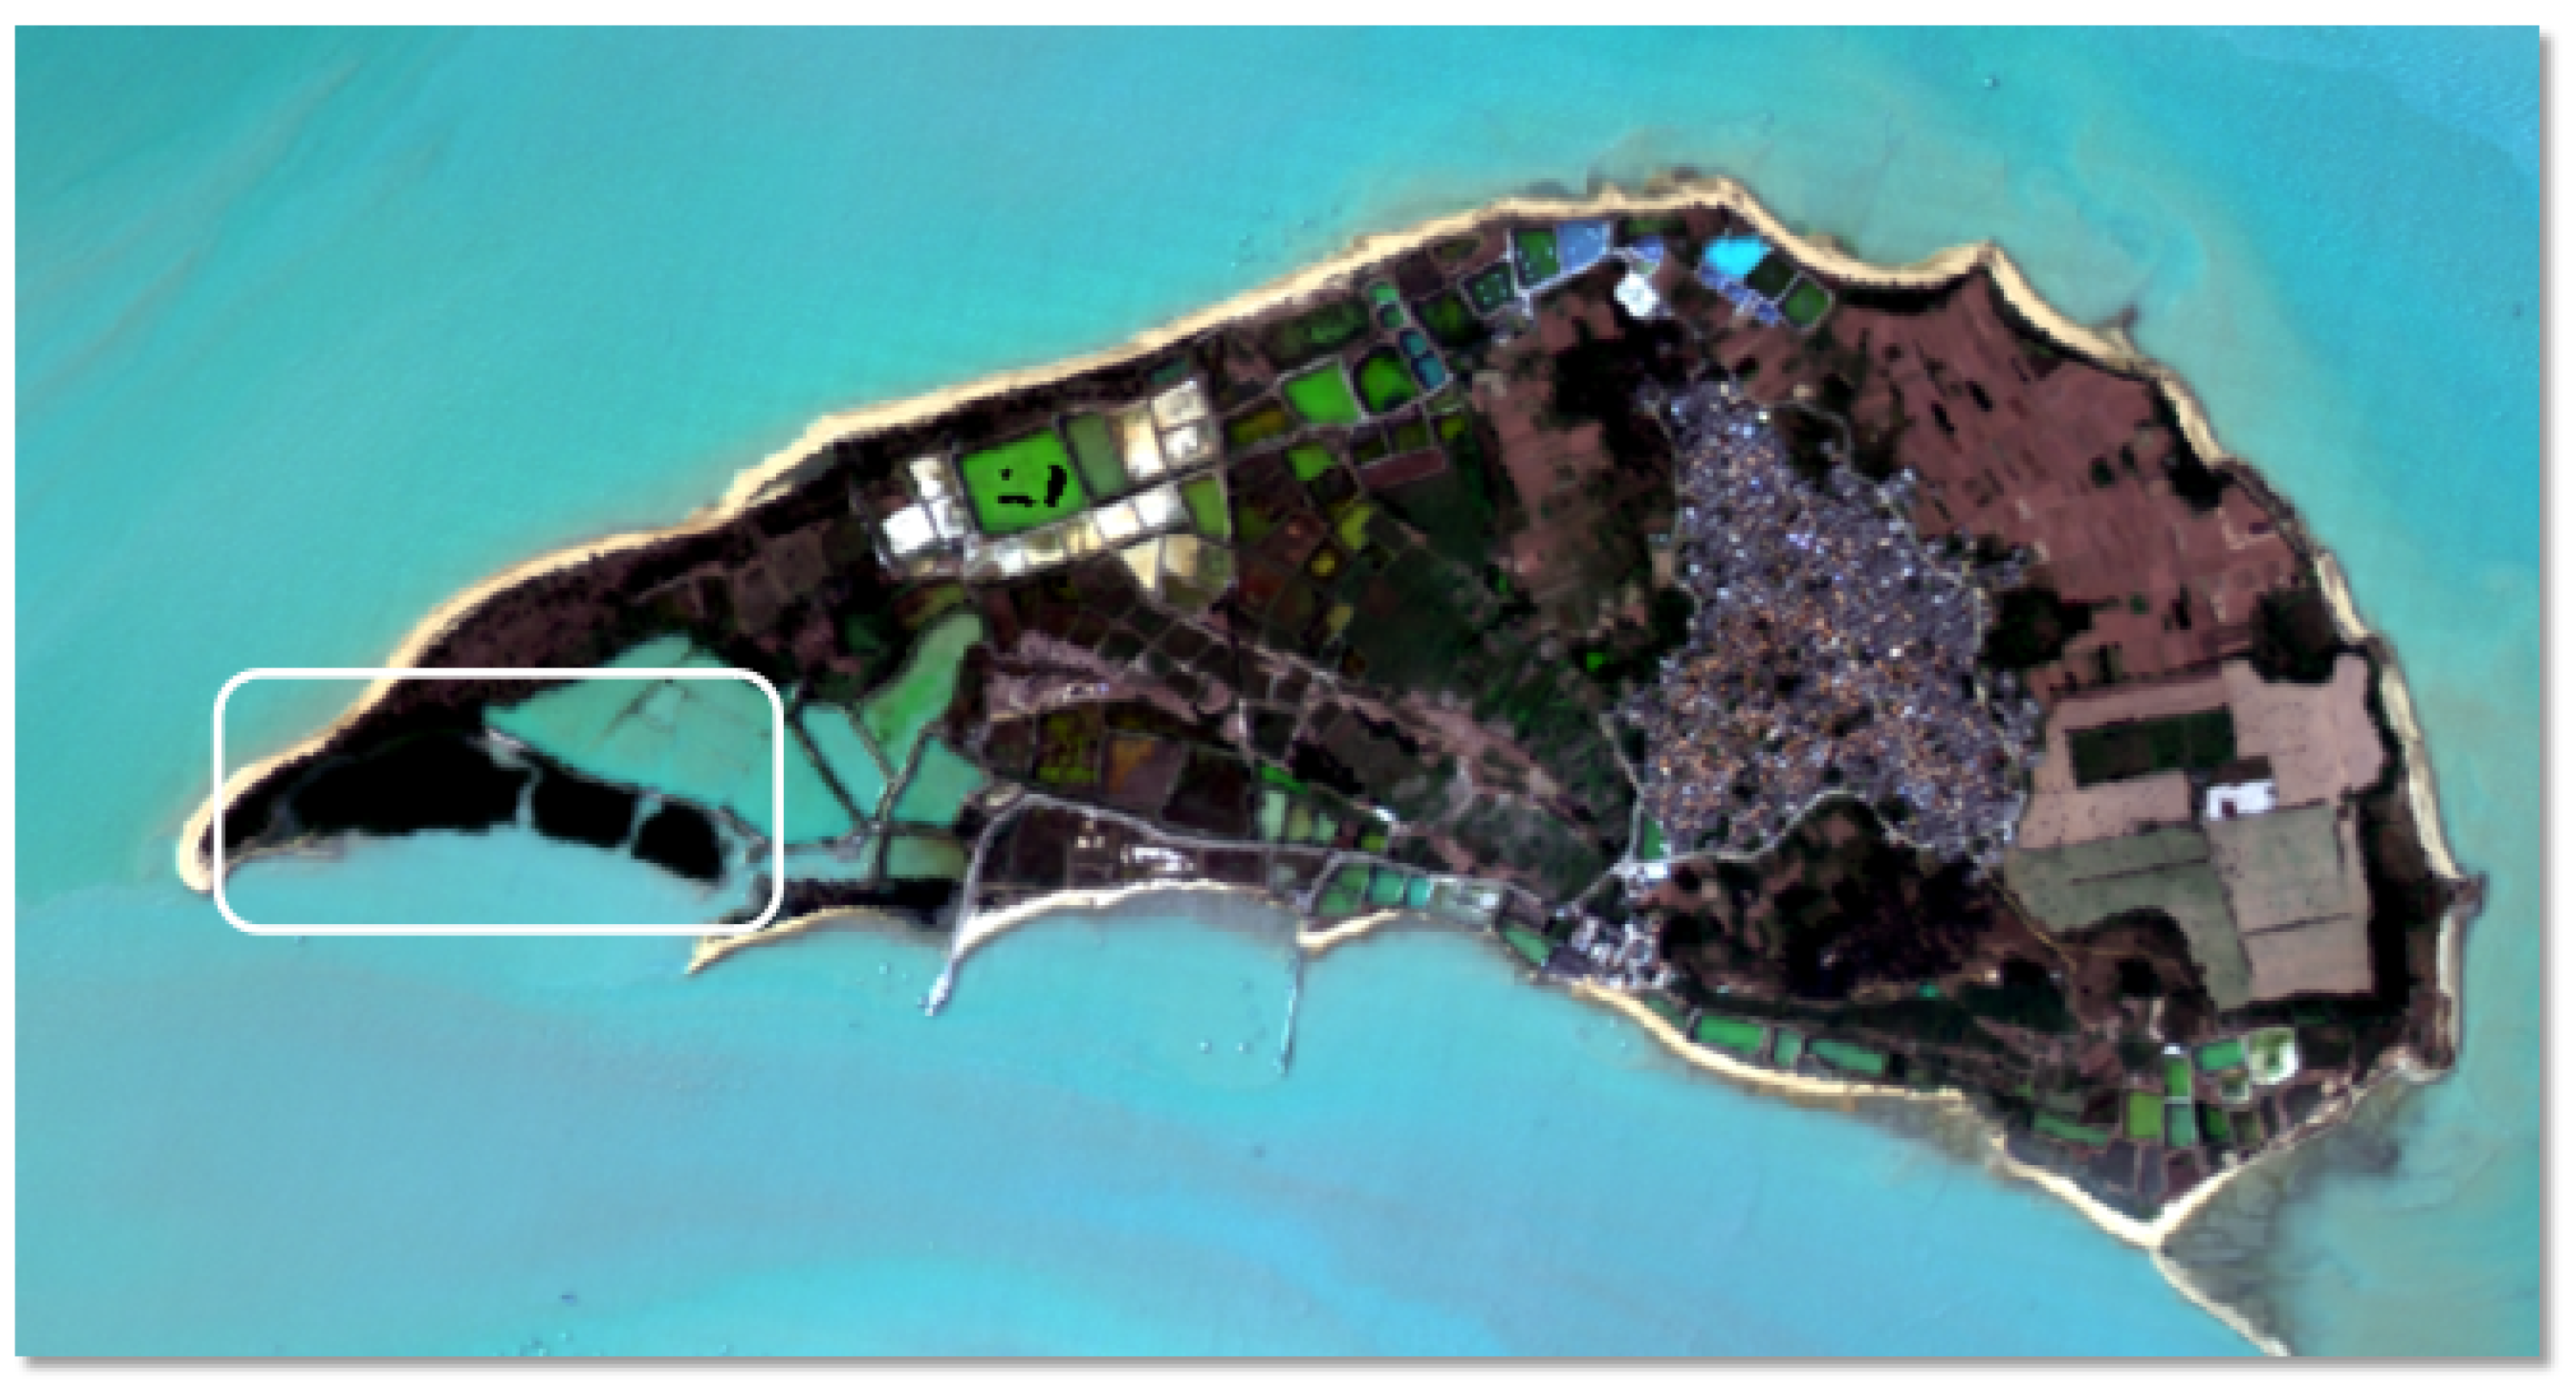
To further evaluate the practical potential and generalization capability of the proposed model for real-world mangrove monitoring, we extended its application to map the spatial distribution of mangroves along the coast of Zhanjiang, Guangdong Province, China. Specifically, Techeng Island and Dongtoushan Island, Zhanjiang, Guangdong Province, China, were selected as application sites due to their diverse coastal topographies and representative ecological environments. By deploying the model in these varied scenarios, we aimed to observe its performance in handling complex backgrounds. The geographical overviews and remote sensing basemaps for the two selected regions are shown in Figure 7 and Figure 8.
Figure 7.
Techeng Island, Zhanjiang City, Guangdong Province, China. The white box indicates the mangrove growth distribution area on the island.
Figure 8.
Dongtoushan Island, Zhanjiang City, Guangdong Province, China. The white box indicates the mangrove growth distribution area on the island.
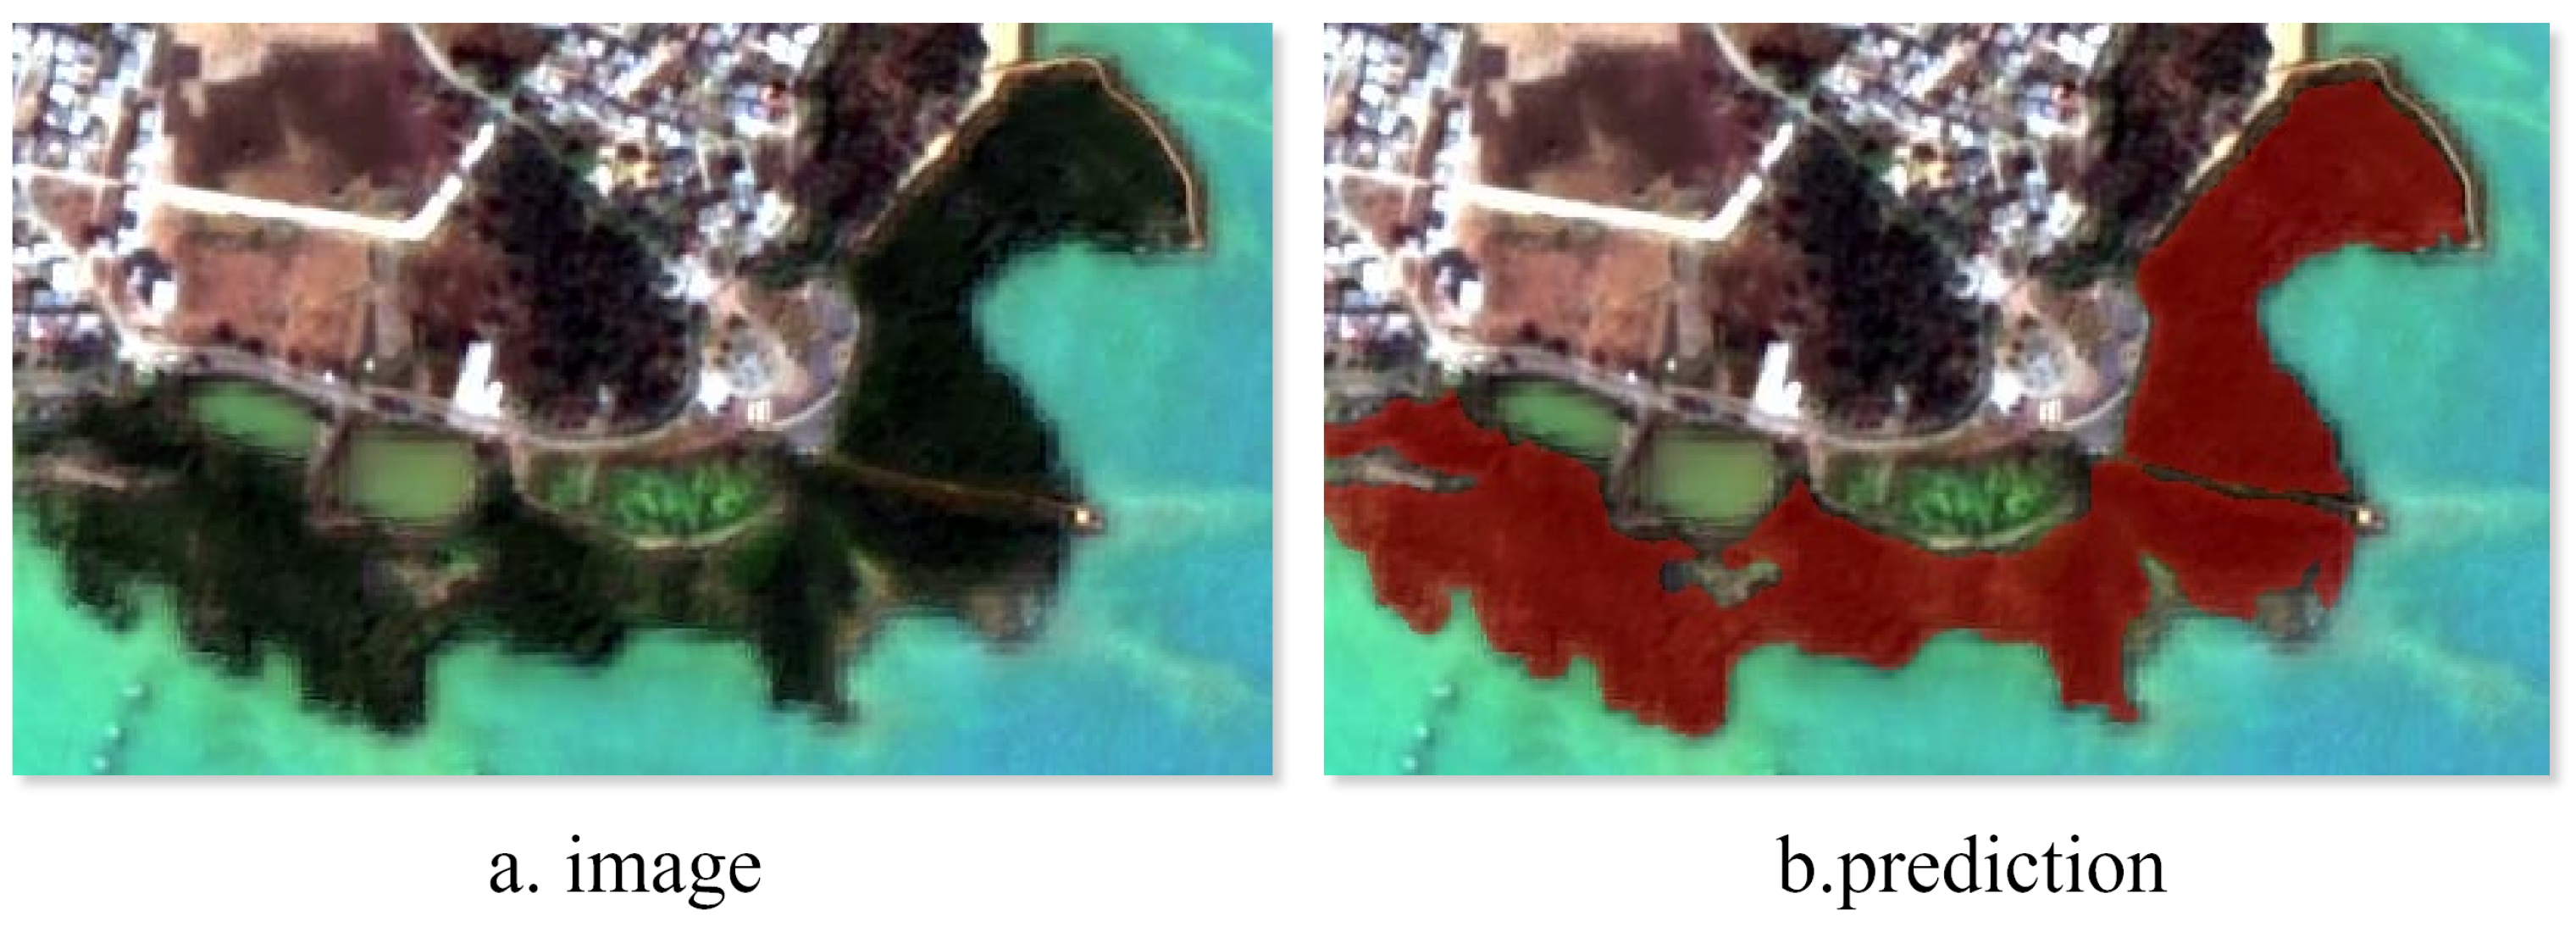
The spatial distribution of mangroves across Techeng Island, as extracted by our developed architecture, is depicted in Figure 9. In this region, the mangrove communities grow along the land–water interface and border multiple distinct land cover types. The visual results demonstrate that the model delineates the spatial extent of the mangrove canopy while preserving clear boundary lines. Specifically, the model effectively separates the target mangrove vegetation from nearby non-mangrove features, including elevated aquaculture ponds, the surrounding coastlines, and small roads adjacent to the vegetation. The prediction mask aligns with the mangrove visual distribution and excludes adjacent artificial and natural structures. Based on this classification output, the total estimated mangrove area on Techeng Island is 9.6796 hectares.
Figure 9.
Visualization of the area of Techeng Island.
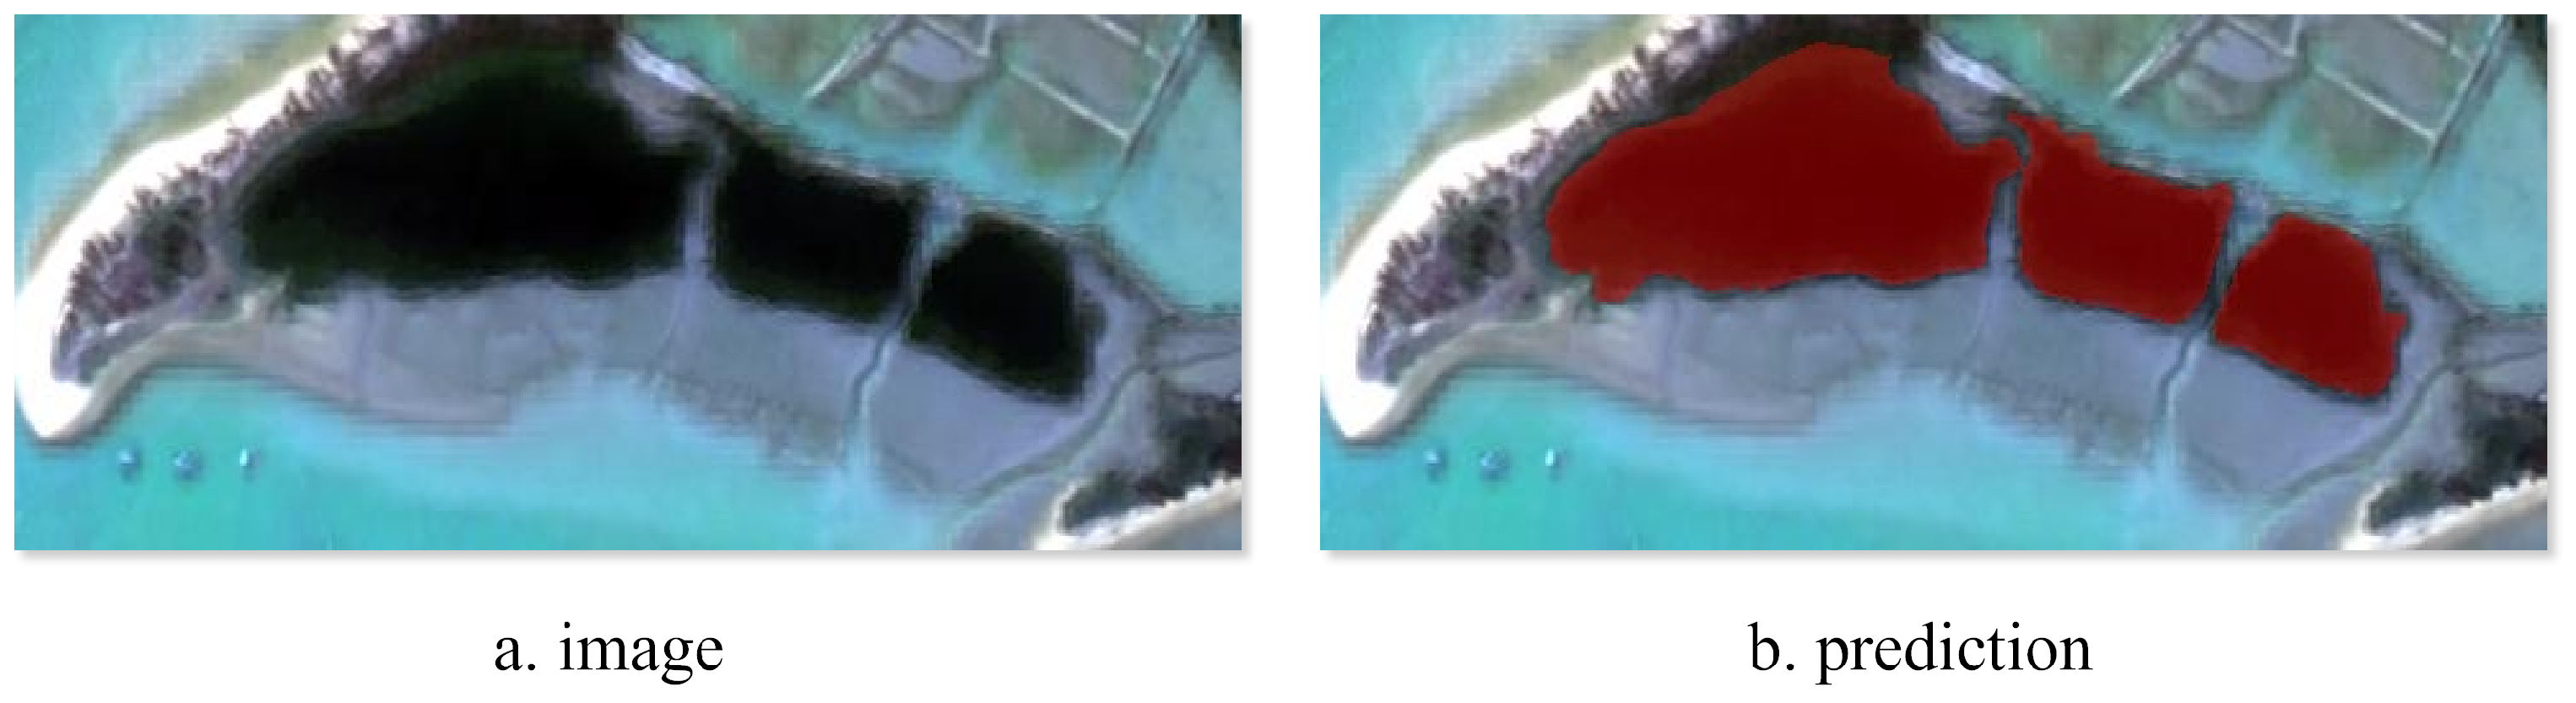
Similarly, the classification outcomes achieved by TAHRNet on Dongtoushan Island are displayed in Figure 10. Within this specific site, the mangrove patches are spatially distributed near various natural and artificial structures. The visual delineations indicate that the model identifies the mangrove areas and separates them from adjacent land cover types. Specifically, the extraction process distinguishes the target mangrove vegetation from surrounding non-mangrove vegetation, elevated aquaculture ponds, and the adjacent coastlines. The generated prediction mask corresponds to the spatial extent of the mangroves in the optical image and excludes surrounding background features. Consequently, the automated extraction yields an estimated mangrove coverage of 7.2780 hectares for Dongtoushan Island.
Figure 10.
Visualization of the area of Dongtoushan Island.
The extraction of mangrove extents across Techeng Island and Dongtoushan Island indicates the applicability of the proposed model framework in coastal environments. By separating mangrove communities from heterogeneous backgrounds and adjacent artificial structures, the model facilitates the quantitative assessment of vegetation coverage. These extraction outcomes suggest that the proposed approach can assist in routine mangrove monitoring tasks and offer spatial references for regional ecological conservation planning.
6. Discussion
To support the automated monitoring of coastal ecosystems, this study presents TAHRNet, a semantic segmentation framework for mangrove classification using high-resolution remote sensing imagery. While the developed approach shows competitive segmentation performance on the test dataset, certain limitations remain in complex real-world applications. For instance, spectral similarity between dispersed mangrove patches and proximal intertidal vegetation, as well as varying inundation levels driven by tidal dynamics, can affect the segmentation process. Although the inclusion of the Triplet Attention module and the improved Multi-Head Sequential Axial Attention mechanism helps reduce interference from heterogeneous backgrounds, the ability to delineate highly fragmented mangrove patches under extreme tidal conditions remains a subject for further exploration.
The results indicate that TAHRNet is capable of differentiating mangroves from complex coastal land covers, such as aquaculture ponds and artificial structures. These findings are consistent with previous literature emphasizing that extensive spatial context modeling is vital for high-spatial-resolution earth observation assignments. The successful implementation of the model on Techeng Island and Dongtoushan Island demonstrates its viability for quantitative ecological assessment. From a wider perspective, precise spatial distribution mapping of mangroves provides essential baseline information for blue carbon sequestration analysis, coastal defense strategies, and the preservation of biological diversity.
Consequently, future investigations may explore several avenues to address the current limitations. First, to mitigate the effects of tidal variations and cloud cover common in optical imagery, prospective studies could incorporate supplementary remote sensing data, including Synthetic Aperture Radar (SAR) and LiDAR. Such a multi-modal approach would provide additional structural and environmental details, potentially enhancing the robustness of the results. Second, although TAHRNet shows competitive accuracy, refining its internal architecture could be considered to improve the trade-off between computational efficiency and segmentation precision, supporting potential use on resource-constrained platforms, including edge computing devices or Unmanned Aerial Vehicles (UAVs). Finally, future work could transition from static spatial extraction to long-term dynamic monitoring, enabling an evaluation of mangrove ecosystem health and temporal evolution.
7. Conclusions
Accurate monitoring of mangroves is crucial for coastal ecological protection, yet complex spectral features and intertidal interference often hinder their extraction from remote sensing imagery. To address these challenges, this study proposed and validated TAHRNet, an improved semantic segmentation model. The main conclusions drawn are as follows:
- Architectural Configuration and Validation: To address the requirements of mangrove classification, this study incorporated Triplet Attention and an improved Multi-Head Sequential Axial Attention module within the HRNet-OCR backbone. This design facilitates the interplay between channel and spatial dimensions while simultaneously broadening long-range dependency capture. Ablation analysis indicates that the TAHRNet achieves gains in both MIoU and global Accuracy amounting to 3.48% and 1.71%, respectively, when compared against the HRNet-OCR baseline. Such architectural modifications contribute to more consistent boundary formation and cohesive regional segmentation without requiring further complex constraints.
- Effectiveness in Comparative Evaluation: The proposed TAHRNet achieved the highest segmentation accuracy among the compared models in the mangrove semantic segmentation task, with an MIoU of 92.01% and an Accuracy of 96.38%. Compared with SegFormer, TAHRNet improved MIoU by 1.88% and Accuracy by 0.94%. In addition, compared with the original HRNet-W18, TAHRNet further improved MIoU from 87.72% to 92.01% and Accuracy from 93.68% to 96.38%, which supports the effectiveness of the proposed improvements over the backbone architecture. TAHRNet also obtained the highest Precision (95.25%), Recall (96.45%), and F1-Score (95.82%) among the compared models. Although the proposed model required higher FLOPs and longer inference time than some lighter baselines, it maintained substantially lower parameter count, FLOPs, and GPU memory usage than heavier models such as CFFormer and synFSNet, indicating that the proposed architecture achieves a superior equilibrium between predictive performance and computational resource demands.
- Practical Application and Future Prospects: To evaluate its generalization capability in real-world scenarios, TAHRNet was deployed to map mangrove distributions along the coastal areas of Zhanjiang, specifically on Techeng Island and Dongtoushan Island. The model successfully delineated mangrove canopies from highly heterogeneous backgrounds, effectively separating the target vegetation from adjacent aquaculture ponds, coastlines, and artificial roads. This automated extraction yielded quantitative coverage estimates of 9.6796 hectares and 7.2780 hectares for the respective study areas. These results verify the model’s practical applicability for routine ecological monitoring and quantitative assessment. Building upon these findings, future research will integrate multi-temporal and multi-source remote sensing data to explore the framework’s potential for large-scale, long-term dynamic monitoring of coastal ecosystems.
Author Contributions
Conceptualization, H.L. and D.F.; methodology, H.L. and C.W.; software implementation, H.L. and Y.H.; experimental validation, H.L., H.W. and J.H.; formal analysis, H.L. and L.X.; investigation, H.L.; resources, H.L.; data curation, H.L. and Y.H.; preparation of the initial manuscript draft, H.L.; writing—review and editing, H.L. and D.F.; visualization, H.L. and J.H.; supervision, C.W.; project administration, D.F.; funding acquisition, D.F. All authors have read and agreed to the published version of the manuscript.
Funding
This work was supported by the Scientific Research Start-up Fund of Guangdong Ocean University (Grant No. 060302102304), the National Key Research and Development Program of China (Grant No. 2022YFC3103101), the Key Special Project for Introduced Talent Teams of the Southern Marine Science and Engineering Guangdong Laboratory (Grant No. GML2021GD0809), the National Natural Science Foundation of China (Grant No. 42206187), and the Key Project of the Guangdong Provincial Department of Education (Grant No. 2023ZDZX4009).
Data Availability Statement
The raw data supporting the conclusions of this article will be made available by the authors on request.
Conflicts of Interest
The authors declare no conflicts of interest.
References
- Bimrah, K.; Dasgupta, R.; Hashimoto, S.; Saizen, I.; Dhyani, S. Ecosystem services of mangroves: A systematic review and synthesis of contemporary scientific literature. Sustainability 2022, 14, 12051. [Google Scholar] [CrossRef] [Scilit]
- Jia, M.; Wang, Z.; Mao, D.; Ren, C.; Song, K.; Zhao, C.; Wang, C.; Xiao, X.; Wang, Y. Mapping global distribution of mangrove forests at 10-m resolution. Sci. Bull. 2023, 68, 1306–1316. [Google Scholar] [CrossRef] [Scilit]
- Abidin, Z.; Setiawan, B.; Muhaimin, A.W.; Shinta, A. The role of coastal biodiversity conservation on sustainability and environmental awareness in mangrove ecosystem of southern Malang, Indonesia. Biodivers. J. Biol. Divers. 2021, 22, 648–658. [Google Scholar] [CrossRef] [Scilit]
- Dang, A.T.N.; Reid, M.; Kumar, L. Assessing potential impacts of sea level rise on mangrove ecosystems in the Mekong Delta, Vietnam. Reg. Environ. Change 2022, 22, 70. [Google Scholar] [CrossRef] [Scilit]
- Fu, B.; Sun, J.; Li, Y.; Zuo, P.; Deng, T.; He, H.; Fan, D.; Gao, E. Estimation of LAI of mangrove species based on multispectral images and machine learning algorithms. Trans. Chin. Soc. Agric. Eng. 2022, 38, 218–228. (In Chinese) [Google Scholar] [CrossRef]
- Liu, S.; Zhu, Y.; Xiao, H.; Ye, J.; Yang, T.; Ma, J.; Liu, D. A CiteSpace-Based Analysis of the Impact of Sea-Level Rise and Tropical Cyclones on Mangroves in the Context of Climate Change. Water 2024, 16, 3662. [Google Scholar] [CrossRef] [Scilit]
- Liu, S.; Liu, X.; Chen, Q.; Xin, W.; Yang, S.; Wang, J. Short-Term Effects of Thinning on Stand Carbon Density and Sediment Carbon Burial Indicators in Kandelia obovata Sheue & al. Plantation. Forests 2026, 17, 356. [Google Scholar] [CrossRef] [Scilit]
- Yang, J.; Xu, Y.; Chai, Y.; Cheng, X.; Wu, H.; He, J.; Wu, Y.; Chen, Z.; Ni, Z.; Shi, Y. Mechanisms, Processes, and Climate Change Responses of Carbon Cycling in Chinese Subtropical Forest Ecosystems. Forests 2026, 17, 330. [Google Scholar] [CrossRef] [Scilit]
- Wang, Y.-S.; Gu, J.-D. Ecological responses, adaptation and mechanisms of mangrove wetland ecosystem to global climate change and anthropogenic activities. Int. Biodeterior. Biodegrad. 2021, 162, 105248. [Google Scholar] [CrossRef] [Scilit]
- Deng, S.; Yang, F.; Wang, Y.; Zhang, W.; Wang, W. Research progress on remote sensing monitoring of mangrove carbon pools. J. Remote Sens. 2024, 28, 2448–2468. (In Chinese) [Google Scholar] [CrossRef] [Scilit]
- Maurya, K.; Mahajan, S.; Chaube, N. Remote sensing techniques: Mapping and monitoring of mangrove ecosystem—A review. Complex Intell. Syst. 2021, 7, 2797–2818. [Google Scholar] [CrossRef] [Scilit]
- Vidhya, R.; Vijayasekaran, D.; Ahamed Farook, M.; Jai, S.; Rohini, M.; Sinduja, A. Improved classification of mangroves health status using hyperspectral remote sensing data. Int. Arch. Photogramm. Remote Sens. Spat. Inf. Sci. 2014, 40, 667–670. [Google Scholar] [CrossRef] [Scilit]
- Qiao, J.; Yao, H.; Wen, K.; Wang, M.; Zhong, M.; Chen, M. Analysis of spatial extent changes of mangroves based on random forest algorithm: A case study of Guangxi coastal zone. J. Appl. Oceanogr. 2025, 44, 794–804. (In Chinese) [Google Scholar] [CrossRef]
- Li, Y.; Ma, J.; Fu, D.; Yuan, J.; Liu, D. Mangrove Extraction Algorithm Based on Orthogonal Matching Filter-Weighted Least Squares. Sensors 2024, 24, 7224. [Google Scholar] [CrossRef] [Scilit]
- Chen, X.; Li, D.; Liu, M.; Jia, J. CNN and transformer fusion for remote sensing image semantic segmentation. Remote Sens. 2023, 15, 4455. [Google Scholar] [CrossRef] [Scilit]
- Zhang, H.; Jiang, Z.; Zheng, G.; Yao, X. Semantic segmentation of high-resolution remote sensing images with improved U-Net based on transfer learning. Int. J. Comput. Intell. Syst. 2023, 16, 181. [Google Scholar] [CrossRef] [Scilit]
- Yuan, X.; Shi, J.; Gu, L. A review of deep learning methods for semantic segmentation of remote sensing imagery. Expert Syst. Appl. 2021, 169, 114417. [Google Scholar] [CrossRef] [Scilit]
- Lv, J.; Shen, Q.; Lv, M.; Li, Y.; Shi, L.; Zhang, P. Deep learning-based semantic segmentation of remote sensing images: A review. Front. Ecol. Evol. 2023, 11, 1201125. [Google Scholar] [CrossRef] [Scilit]
- Ronneberger, O.; Fischer, P.; Brox, T. U-net: Convolutional networks for biomedical image segmentation. In Proceedings of the International Conference on Medical Image Computing and Computer-Assisted Intervention; Springer: Cham, Switzerland, 2015; pp. 234–241. [Google Scholar] [CrossRef] [Scilit]
- Maung, W.S.; Tsuyuki, S.; Guo, Z. Improving land use and land cover information of Wunbaik mangrove area in Myanmar using U-Net model with multisource remote sensing datasets. Remote Sens. 2023, 16, 76. [Google Scholar] [CrossRef] [Scilit]
- Chen, L.-C.; Zhu, Y.; Papandreou, G.; Schroff, F.; Adam, H. Encoder-decoder with atrous separable convolution for semantic image segmentation. In Proceedings of the European Conference on Computer Vision (ECCV); Springer: Cham, Switzerland, 2018; pp. 801–818. [Google Scholar] [CrossRef] [Scilit]
- Liu, Z.; Sun, Y.; Zhang, X.; Liu, Y.; Bao, R. Extraction method of litchi planting area based on improved DeepLabV3+ network. Trans. Chin. Soc. Agric. Eng. 2025, 41, 191–197. (In Chinese) [Google Scholar] [CrossRef]
- Fu, L.; Chen, J.; Wang, Z.; Zang, T.; Chen, H.; Wu, S.; Zhao, Y. MSFANet: Multi-scale fusion attention network for mangrove remote sensing image segmentation using pattern recognition. J. Cloud Comput. 2024, 13, 27. [Google Scholar] [CrossRef] [Scilit]
- Wang, Z.; Li, J.; Tan, Z.; Liu, X.; Li, M. Swin-UperNet: A semantic segmentation model for mangroves and Spartina alterniflora Loisel Based UperNet. Electronics 2023, 12, 1111. [Google Scholar] [CrossRef] [Scilit]
- Wang, J.; Sun, K.; Cheng, T.; Jiang, B.; Deng, C.; Zhao, Y.; Liu, D.; Mu, Y.; Tan, M.; Wang, X.; et al. Deep high-resolution representation learning for visual recognition. IEEE Trans. Pattern Anal. Mach. Intell. 2020, 43, 3349–3364. [Google Scholar] [CrossRef] [Scilit] [PubMed]
- Wang, Y.; Liao, M.; Chu, N.; Chen, X.; Li, S.; Zhou, J. Mangrove recognition method and time-series change analysis in Wenzhou City based on semantic segmentation model. Remote Sens. Technol. Appl. 2025, 40, 545–556. (In Chinese) [Google Scholar] [CrossRef]
- Yuan, Y.; Chen, X.; Wang, J. Object-contextual representations for semantic segmentation. In Proceedings of the European Conference on Computer Vision (ECCV); Springer: Cham, Switzerland, 2020; pp. 173–190. [Google Scholar] [CrossRef] [Scilit]
- Padwick, C.; Deskevich, M.; Pacifici, F.; Smallwood, S. Fusion and assessment of high-resolution WorldView-3 satellite imagery using NNDiffuse and Brovey algorithms. In Proceedings of the IEEE International Geoscience and Remote Sensing Symposium (IGARSS), Beijing, China, 10–15 July 2016; pp. 1918–1921. [Google Scholar] [CrossRef] [Scilit]
- Misra, D.; Nalamada, T.; Arasanipalai, A.U.; Hou, Q. Rotate to attend: Convolutional triplet attention module. In Proceedings of the IEEE/CVF Winter Conference on Applications of Computer Vision (WACV); IEEE: Piscataway, NJ, USA, 2021; pp. 3139–3148. [Google Scholar] [CrossRef] [Scilit]
- Ho, J.; Kalchbrenner, N.; Weissenborn, D.; Salimans, T. Axial attention in multidimensional transformers. arXiv 2019, arXiv:1912.12180. [Google Scholar] [CrossRef] [Scilit]
- Zhao, H.; Shi, J.; Qi, X.; Wang, X.; Jia, J. Pyramid scene parsing network. In Proceedings of the IEEE Conference on Computer Vision and Pattern Recognition (CVPR); IEEE: Honolulu, HI, USA, 2017; pp. 2881–2890. [Google Scholar] [CrossRef] [Scilit]
- Zhao, J.; Zhang, M.; Zhou, Z.; Wang, Z.; Lang, F.; Shi, H.; Zheng, N. CFFormer: A cross-fusion transformer framework for the semantic segmentation of multisource remote sensing images. IEEE Trans. Geosci. Remote Sens. 2024, 63, 4401117. [Google Scholar] [CrossRef] [Scilit]
- Hui, J.; Mi, W.; Wang, J.; Cao, Y.; Zhou, Z.; Zheng, N. AFSIFormer: Adaptive Frequency-Spatial Interaction Attention Mechanism for Aerial Image Semantic Segmentation. IEEE Trans. Geosci. Remote Sens. 2025, 63, 5638419. [Google Scholar] [CrossRef] [Scilit]
- Xie, E.; Wang, W.; Yu, Z.; Anandkumar, A.; Alvarez, J.M.; Luo, P. SegFormer: Simple and efficient design for semantic segmentation with transformers. In Advances in Neural Information Processing Systems (NeurIPS); Curran Associates, Inc.: Red Hook, NY, USA, 2021; Volume 34, pp. 12077–12090. [Google Scholar]

Disclaimer/Publisher’s Note: The statements, opinions and data contained in all publications are solely those of the individual author(s) and contributor(s) and not of MDPI and/or the editor(s). MDPI and/or the editor(s) disclaim responsibility for any injury to people or property resulting from any ideas, methods, instructions or products referred to in the content. |
© 2026 by the authors. Licensee MDPI, Basel, Switzerland. This article is an open access article distributed under the terms and conditions of the Creative Commons Attribution (CC BY) license.