


Abstract
Scots pine (Pinus sylvestris L.) spans most of Eurasia, yet southern and mountainous populations may retain distinctive genetic components shaped by long-term isolation and complex postglacial dynamics. We genotyped 186 trees from four Scots pine stands in Armenia (AM1-AM4) and reference stands from Germany, Russia and Montenegro with the PiSy50k SNP array and integrated these data with published European array datasets from Finland, Poland and the Baltic region. After quality checks and conservative SNP filtering, 627 individuals from 47 populations and 3659 SNP loci were retained. Within-population diversity was generally high; Armenian stands AM2–AM4 were among the most diverse, whereas AM1 showed reduced diversity and the highest differentiation relative to the remainder of the dataset (FST vs. rest = 0.0047). Direct pairwise FST and hierarchical AMOVA confirmed pronounced heterogeneity among Armenian stands, with AM1 the most differentiated stand, AM2 and AM4 closest to the broader Eurasian background, and AM3 intermediate. Principal component analysis (PC1 = 1.42%, PC2 = 0.76%) again separated AM1 strongly from all non-Armenian samples, while AM2 overlapped with the central/eastern European cluster and AM3 and AM4 combined continental-like and AM1-like individuals. Structure-like inference with LEA/sNMF showed a broad cross-entropy plateau from approximately K = 4 to K = 6; we therefore use K = 5 as a practical summary, which highlighted a dominant AM1-associated ancestry component and variable continental admixture in AM2–AM4. KING kinship estimates provided little evidence for within-stand family clustering in Armenian stands; no second-degree-or-closer pairs were observed in AM1–AM4. Together, the results reveal pronounced heterogeneity among Armenian Scots pine stands and identify AM1 as a highly differentiated but unresolved genomic component, providing a genomic baseline to support conservation planning, provenance evaluation and the management of forest reproductive material in the Lesser Caucasus.
Keywords:
Scots pine; Caucasus; kinship; population structure; SNP array; LEA/sNMF; conservation genetics 1. Introduction
Scots pine (Pinus sylvestris L.) is among the most widely distributed conifers of Eurasia and a keystone species in boreal and temperate forest ecosystems. Its distribution spans strong gradients in temperature, moisture, continentality, and edaphic conditions, making the species a model for studying how demographic history, gene flow, and selection shape genetic variation over large spatial scales [1]. Range-wide genomic analyses consistently report high within-population diversity and low-to-moderate differentiation across much of the continuous range, a pattern consistent with large effective population sizes and extensive wind-driven pollen dispersal [1,2].
Importantly, low genome-wide differentiation does not imply genetic uniformity. Scots pine frequently shows subtle but repeatable spatial signals at continental scales, including isolation-by-distance and weak geographic clines in allele frequencies. These gradients can coexist with deeper historical structure, because lineage divergence and secondary contact may predate the last glaciation and persist despite high present-day gene flow [2]. For example, SNP-array analyses indicate that major lineages likely diverged during the Mid-Pleistocene and that parts of Europe form admixture zones shaped by multiple recolonization sources [3]. In addition, in regions with a long silvicultural history, present-day admixture can be reinforced by human-mediated transfer of forest reproductive material, further reducing apparent structure in Central Europe and parts of Fennoscandia [2,4].
These demographic features also contribute to an often-noted “phenotype–genotype paradox” in forest trees: pronounced phenotypic differentiation and local adaptation can occur even when neutral differentiation is weak [5]. In Scots pine, genome-wide scans detected only limited numbers of robust genotype–environment associations [1], which has been interpreted as consistent with highly polygenic and/or functionally redundant adaptation under strong gene flow. Consequently, placing regionally sampled populations into a broad geographic context is essential for separating historical structure and admixture from signals that could be related to local adaptation.
The South Caucasus forms a biogeographic crossroads between Europe and Western Asia and is characterized by complex topography and strong climatic gradients [6]. For Scots pine, the Caucasus and adjacent Black Sea regions have been discussed as potentially important reservoirs of genetic diversity, but also as regions where populations may be fragmented and differentiated because dispersal among mountain massifs and valleys is constrained [7]. Marker-based studies in the Greater Caucasus and Crimea reported spatially structured variation and strong differentiation of isolated high-mountain groups [8]. Cytoplasmic-marker analyses further suggest that Scots pine populations in the eastern Black Sea region (Crimea–Caucasus–Asia Minor) share a common origin and are deeply divergent from the main Eurasian range, with evidence for past north-to-south migration and hybridization in the Caucasus during glacial periods [9]. Complementary mtDNA phylogeographic analyses also point to distinct refugial contributions around the northern Black Sea basin and broader Eurasian lineage contrasts [10]. Together, these studies imply long-term regional distinctiveness and motivate testing whether Armenian material contains unusual genomic components, although strong historical interpretations require adequate regional reference sampling.
High-density SNP genotyping now enables more detailed evaluation of these patterns and facilitates cross-study comparison. The PiSy50k SNP array was developed to provide a standardized, genome-wide platform for Scots pine, demonstrating robust genotyping performance despite the species’ massive genome and enabling reproducible population-genomic analyses [11]. Together with related SNP-array resources used in European studies, such tools make it feasible to integrate datasets across projects using shared markers and to place Armenian material into a broader Eurasian comparative context.
Beyond reconstructing structure, genomic datasets are increasingly used to assess adaptive potential and vulnerability to climate change. Recent work combining SNP-array data with genotype–environment relationships has quantified genomic vulnerability (genomic offset) in Scots pine and discussed how these metrics could inform climate-adaptive management, including assisted gene flow or assisted migration [12]. In parallel, genomic evidence has been used to reassess provenance-region delimitations, emphasizing that management units based on traditional regionalization may not always align with observed genomic structure [13]. These issues are especially pertinent for southern and mountainous populations, where reduced connectivity and strong environmental gradients may increase both the conservation value of distinct gene pools and their sensitivity to climate change [7].
Armenia lies within the Lesser Caucasus and hosts a local pine variety, currently considered as Pinus sylvestris var. hamata [14]. Small stands of this taxon are geographically isolated from the continuous boreal forests of northern Eurasia, scattered throughout the northern part of the country. Displaced by other forest tree species, they occupy very narrow ecological niches (steep southern and south-western rocky slopes). Their total area of the variety was less than 1000 hectares (pure stands) and 2400 hectares (mixed forests) a century ago [15]. Of the current 17.7 thousand hectares of pine forests in Armenia, nearly 95% of stands are plantations established during the Soviet period, using seed sources of P. sylvestris var. hamata and P. nigra subsp. pallasiana from Crimea, as well as typical P. sylvestris [16] from other parts of the species’ distribution range.
Accordingly, present-day Armenian plantation stands are relevant management units, but they cannot automatically be interpreted as direct proxies for undisturbed native regional gene pools.
Genome-wide data for Armenian Scots pine remain scarce, limiting inference on whether Armenian plantation stands are gnomically similar to the broadly shared continental gene pool, differentiated within the eastern Black Sea/Caucasus context, or mixtures shaped by planting history and historical connectivity. Here, we use PiSy50k genotypes from four Armenian stands and integrate them with newly genotyped comparative stands and published European SNP datasets to analyse Armenian material in a broader Eurasian context. Specifically, we aim to (1) quantify genetic diversity and kinship within Armenian stands; (2) assess their differentiation and hierarchical position relative to reference populations; and (3) describe their affinities using principal component analysis (PCA) and LEA/sNMF admixture inference. Throughout, we interpret the Armenian material conservatively as plantation stands of uncertain provenance and evaluate whether any distinct genomic component is robustly supported by the data.
2. Materials and Methods
2.1. Sampling and Study Material
We analysed Scots pine from eight focal sampling locations: four stands in Armenia (AM1–AM4), two in Germany (GER1–GER2), one in Russia (RU1), and one in Montenegro (MOT1).
The four Armenian stands were selected to represent geographically separated plantation stands that currently define the main management units available for this study, rather than an exhaustive sample of all natural Scots pine occurrences in Armenia. Armenian samples were collected from planted stands, with sampled trees spaced by more than 50 m. Because historical records were lost following the collapse of the Soviet Union, the provenance of the planting material remains uncertain, although it was regarded locally as putatively Armenian. Three populations (GER1, MOT1, RU1) were sampled from material of an international Scots pine provenance trial located in Waldsieversdorf, Germany [17]. The seed material of these provenances has been collected from at least 25 different trees in natural stands. The material of GER2 is from the seed orchard Waldsieversdorf-Guestrow (register number: 123851040044). The trees of this seed orchard represent more than 50 plus trees of a local natural stand near Guestrow. These non-Armenian populations were included as comparative reference material rather than as a second primary study system.
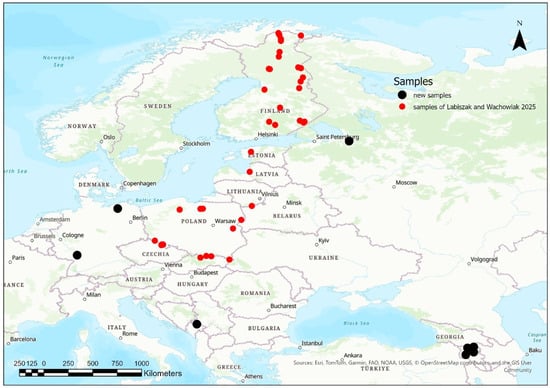
To provide a broader comparative context, we additionally used published genotype data from 428 individuals across 39 populations in Finland, Poland, and the Baltic region [12]. These published samples were collected in natural stands and served as additional reference populations for placing the Armenian plantation material into a broader Eurasian context. The initial merged dataset comprised 627 individuals from 47 populations (Table 1, Figure 1).
Table 1.
Samples used in the study, group 1 = own new samples, group 2 = published data taken from Labiszak and Wachowiak [12]; arc = acronym of the location, N = number of genotypes used for the analysis.
Figure 1.
Map of new genotyped eight Scots pine locations (black circles) and location of the added populations from the study of Labiszak and Wachowiak [12] represented by red circles.
2.2. SNP Genotyping and Data Integration
DNA was extracted from needles following the protocol of Bruegmann et al. [18]. The in-house dataset was genotyped using the PiSy50k SNP array [11]. The array includes 47,712 SNPs derived from exome capture, transcriptome resources, and candidate-gene resequencing in P. sylvestris. Genotyping and initial quality control were carried out at the University of Bristol Genomics Facility (Bristol, UK), and genotype calling was performed in Axiom Analysis Suite. In the in-house dataset, we initially retained samples with QC call rate ≥ 90% and markers with call rate ≥ 97%; under these criteria, 25,339 SNPs were classified by Axiom Analysis Suite as “Best and Recommended”.
Published European genotypes were obtained from Labiszak and Wachowiak [12] and originated from a dataset that had already been quality filtered in the source study. Datasets were merged by intersecting SNPs with shared identifiers. Variant identifiers in the in-house VCF included an INFO tag containing the original SNP identifier (originalsnpid), enabling harmonization with the published marker set. The merged variant set contained 3733 shared SNP loci before post-merge filtering.
2.3. Quality Control and Filtering
Quality control (QC) of the merged dataset was conducted in R using a sequential workflow applied to the shared SNP panel. Only biallelic loci were retained. Loci were first filtered by call rate (≥0.90) and polymorphism, after which individuals were filtered by call rate (≥0.90). Locus call rate and polymorphism were then recalculated on the retained individuals and loci were filtered a second time. We additionally screened for exact genotype duplicates, defined as pairs showing no discordant genotype calls across all shared non-missing loci, and removed any such pairs if present. Because targeted kinship diagnostics identified one AM3 near-duplicate pair that did not meet this strict exact-duplicate definition, one member of that pair (P07_PISYL_7917_1.CEL) was removed manually for the analyses. A global minor allele frequency filter of MAF ≥ 0.05 was then applied and the remaining loci were LD pruned using a greedy within-chromosome sliding-window procedure. All revised downstream analyses were conducted on this stricter filtered dataset, which comprised 3127 SNPs.
2.4. Population Genetic Summary Statistics
All population genetic analyses were performed in R (R Core Team) using a workflow that parses variant call format (VCF) data with vcfR and converts genotypes into analysis-ready objects for multivariate and population-genetic computations [19]. Genotypes were treated as diploid biallelic SNPs coded as the number of alternative alleles per individual and locus (0, 1, 2; missing genotypes retained as NA).
For each population, we computed the proportion of polymorphic loci, observed heterozygosity (Ho), expected heterozygosity (He), and the mean effective number of alleles (Ae) across loci. Allele frequencies were calculated per locus as p = mean(G)/2 (ignoring missing values), where G is the genotype code. A locus was considered polymorphic when 0 < p < 1. Expected heterozygosity was computed as He = 2p(1 − p) and summarised as the mean across loci. Observed heterozygosity was computed as the mean fraction of heterozygous genotypes (G = 1) per locus, averaged across loci. The effective number of alleles for biallelic loci was calculated as Ae = 1/(p2 + (1 − p)2) and averaged across loci.
As a descriptive summary, population differentiation was summarised as FST versus the remainder of the dataset (FST_vsRest). For each focal population, we partitioned samples into two groups (focal vs. rest) and computed per-locus heterozygosities using allele frequencies estimated from observed genotype counts. Total heterozygosity was computed as Ht = 2pt(1 − pt), where pt is the pooled allele frequency, and within-group heterozygosities were computed as H1 = 2p1(1 − p1) and H2 = 2p2(1 − p2). Within-group heterozygosity was combined as a sample-size–weighted mean Hs = w1H1 + w2H2 with weights proportional to allele counts. Locus-specific differentiation was then calculated as FST = (Ht − Hs)/Ht [20,21], excluding loci with Ht = 0 or non-finite values. FST was reported as the mean FST across loci.
To strengthen inference on population differentiation, we additionally recalculated direct pairwise FST values among the four Armenian stands (AM1–AM4) and between each Armenian stand and a reduced set of selected reference populations on the revised filtered dataset. Pairwise FST was estimated using the same heterozygosity-based formulation as above. Uncertainty was assessed by non-parametric bootstrap resampling across loci (1000 replicates); for each comparison, loci were resampled with replacement and pairwise FST was recalculated to obtain percentile 95% confidence intervals.
We complemented the pairwise differentiation analyses with analysis of molecular variance (AMOVA) on the same revised filtered dataset. For the selected comparison panel, individuals were assigned hierarchically to Region (Armenia vs. reference populations) and Population nested within Region; in addition, an Armenia-only AMOVA was performed across AM1–AM4 using Population as the grouping factor. AMOVA was calculated from individual Nei genetic distances with 999 permutations, and variance components, the proportion of total variance explained at each hierarchical level, and Phi-statistics were extracted.
2.5. Kinship Statistics
To characterise within-population relatedness and detect potential family structure consistent with a narrow seed basis, we estimated pairwise kinship coefficients using the KING robust method-of-moments estimator [22]. Genotypes from the filtered SNP set were converted to GDS format and kinship was computed with the r-package SNPRelate [23], which implements a KING-style estimator that is comparatively robust to population stratification. For each population, we retained only within-population pairs and summarised the distribution of kinship values (mean, median, and the 95th percentile). We additionally quantified the proportion of pairs falling into standard KING relationship ranges: duplicate/near-identical (kinship ≥ 0.354), first-degree relatives (0.177 ≤ kinship < 0.354; parent–offspring or full-sibs), and second-degree relatives (0.0884 ≤ kinship < 0.177; including half-sibs, avuncular, or grandparent–grand-offspring), treating an excess of second-degree-or-closer pairs as indicative of sampling dominated by a limited number of seed parents or seed lots.
To clarify an observed pair in AM3 that was classified in the kinship analysis as “nearly duplicate”, we complemented the exact-duplicate check with targeted pairwise similarity diagnostics. For the pair with the highest KING kinship coefficient, we calculated the rrBLUP genomic relationship, the number of shared non-missing loci, the numbers of concordant and discordant loci, genotype concordance and discordance rates, and an IBS-style mismatch summary including the number of opposite homozygotes. We also ranked all within-AM3 pairs by KING kinship to assess whether the flagged pair represented an extreme outlier within that stand.
2.6. Approach for Principal Component Analysis
Genome-wide structure among individuals was examined using principal component analysis (PCA) of SNP genotypes implemented in adegenet [24]. PCA was computed with adegenet::glPca on centred and scaled genotypes (center = TRUE, scale = TRUE), retaining 10 principal components for computation. Individuals were coloured by population to facilitate interpretation of geographic patterns. In addition to the main PC1–PC2 plot, we examined scree plots and supplementary PC1–PC3 and PC2–PC3 plots, and we repeated PCA on the Armenia-only subset as a robustness check. Plots were produced with ggplot2 as part of the tidyverse workflow [25].
2.7. Admixture Inference Using LEA/sNMF
We inferred STRUCTURE-like ancestry coefficients using the sparse non-negative matrix factorization (sNMF) algorithm implemented in the LEA package [26,27]. For the analysis, genotypes were exported to LEA’s. geno format after removal of P07_PISYL_7917_1.CEL, application of the global MAF ≥ 0.05 filter, and LD pruning; the resulting filtered dataset comprised 3127 SNPs. Diploid biallelic genotypes were encoded as 0/1/2 and missing values as 9, matching LEA input requirements.
Admixture models were fitted for K = 1–10 ancestral clusters using 100 replicate runs per K (repetitions = 100), diploid ploidy (ploidy = 2), and regularisation parameter alpha = 100. Computations used multi-core parallelism with the CPU set to the number of physical cores minus one. Model fit was assessed using the cross-entropy criterion computed on masked genotypes, and for each K, the best run was selected as the replicate with minimum cross-entropy [26]. To evaluate run stability, we summarised the cross-entropy distribution for each K by its minimum, mean, median, standard deviation, interquartile range, and maximum, together with the difference between the best and second-best runs and the number of runs falling within 0.1% and 1% of the best cross-entropy value. Admixture bar plots were compared across neighbouring K values to assess whether the broad structure was robust rather than dependent on a single K-specific solution.
3. Results
3.1. Dataset After Merging and QC
After merging the in-house and published datasets and applying the revised filtering pipeline, including removal of one near-duplicate AM3 sample, global MAF ≥ 0.05 filtering, and LD pruning, the final dataset contained 627 individuals from 47 locations and 3659 SNP loci. Armenian sample sizes were 24 in AM1, 14 in AM2, 24 in AM3, and 25 in AM4.
3.2. Population Summary Statistics
Across the merged dataset (627 individuals, 47 populations; Table 2), within-population diversity was high and broadly comparable among most locations. The proportion of polymorphic loci (Poly) ranged from 0.834 to 0.995 (mean 0.946), while observed heterozygosity (Ho) varied within a narrow interval (0.309–0.335; mean 0.329). Expected heterozygosity (He) and the effective number of alleles (Ae) showed similarly restricted ranges (He 0.296–0.325, mean 0.313; Ae 1.502–1.544, mean 1.525). Differentiation of each population relative to the remainder of the dataset was generally low (FST vs. rest 0.0009–0.0021 for 46/47 populations; mean 0.0012).
Table 2.
Population summary statistic (N = number of genotyped individuals, Poly = proportion of polymorphic loci, Ho = mean observed heterozygosity, He = mean expected heterozygosity, Ae = mean effective number of alleles, FST = genetic differentiation against all other samples.
Armenian stands (AM1–AM4) fell within the overall diversity range and, for three of the four stands, exhibited diversity metrics at the upper end of the European distribution. Poly was high in AM2–AM4 (0.973–0.995), with AM4 showing the highest value observed across all populations (0.995). AM2 also displayed the highest Ho (0.335) and elevated He (0.320) and Ae (1.536), indicating no reduction of within-stand diversity compared with northern and central European populations. AM3 and AM4 likewise showed high He (0.322 and 0.325, respectively) and Ae (1.541 and 1.544), consistent with a broad allelic basis in these stands.
In contrast, AM1 differed from the other Armenian stands by showing reduced within-population diversity. AM1 had lower Poly (0.934), the lowest Ho in the dataset (0.309), and low He and Ae (0.301 and 1.509), placing it at the lower end of the overall distribution for these metrics (Table 2).
Differentiation patterns were similarly heterogeneous among Armenian locations. AM2 and AM4 showed very low differentiation relative to the remainder of the dataset (FST = 0.0009 and 0.0010, respectively), comparable to the lowest values observed among European populations. AM3 showed moderately elevated differentiation (FST = 0.0018), while AM1 was a clear outlier with markedly higher differentiation (FST = 0.0047), approximately fourfold higher than the dataset mean and more than twice the next-highest population value (Table 2).
Pairwise FST analyses on the dataset refined these patterns while preserving the same overall ranking (Supplementary Table S1). AM1 showed the highest pairwise differentiation, particularly relative to AM2 (FST = 0.03819, 95% bootstrap CI 0.03660–0.03983) and AM4 (0.02992, 0.02870–0.03111), whereas differentiation between AM1 and AM3 was lower but still clearly elevated (0.01660, 0.01592–0.01728). Among the remaining Armenian stands, AM2 and AM4 were the least differentiated pair (0.01331, 0.01276–0.01390), with AM3 showing intermediate differentiation to both AM2 (0.01883, 0.01797–0.01964) and AM4 (0.01430, 0.01369–0.01493). In comparisons with reference populations, AM1 remained consistently more differentiated (0.03623–0.04369) than AM2 (0.01398–0.02356), AM3 (0.01791–0.02600), or AM4 (0.01242–0.02027). Bootstrap confidence intervals were narrow throughout, indicating that these differences were stable across loci.
Hierarchical AMOVA further showed that 4.0% of total genetic variance in the selected panel was attributable to differences between Armenian and reference regions, 5.7% to differences among populations within regions, and 90.3% to variation within populations (Supplementary File S1). Both the regional component (sigma2 = 0.00105; Phi_CT = 0.0396; p < 0.001) and the population-within-region component (sigma2 = 0.00151; Phi_SC = 0.0594; global Phi_ST = 0.0967; p < 0.001) were significant. In an Armenia-only AMOVA, 9.0% of total variance was explained by differences among the four Armenian stands (sigma2 = 0.00224; Phi = 0.0904; p < 0.001), confirming substantial within-Armenia structuring.
3.3. Kinship
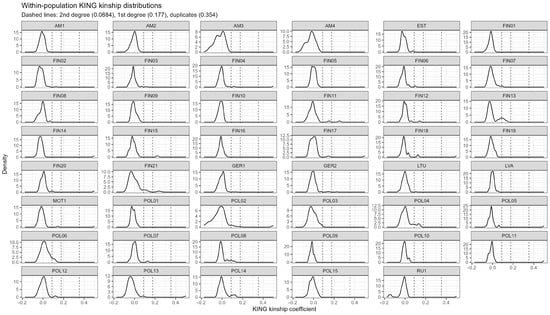
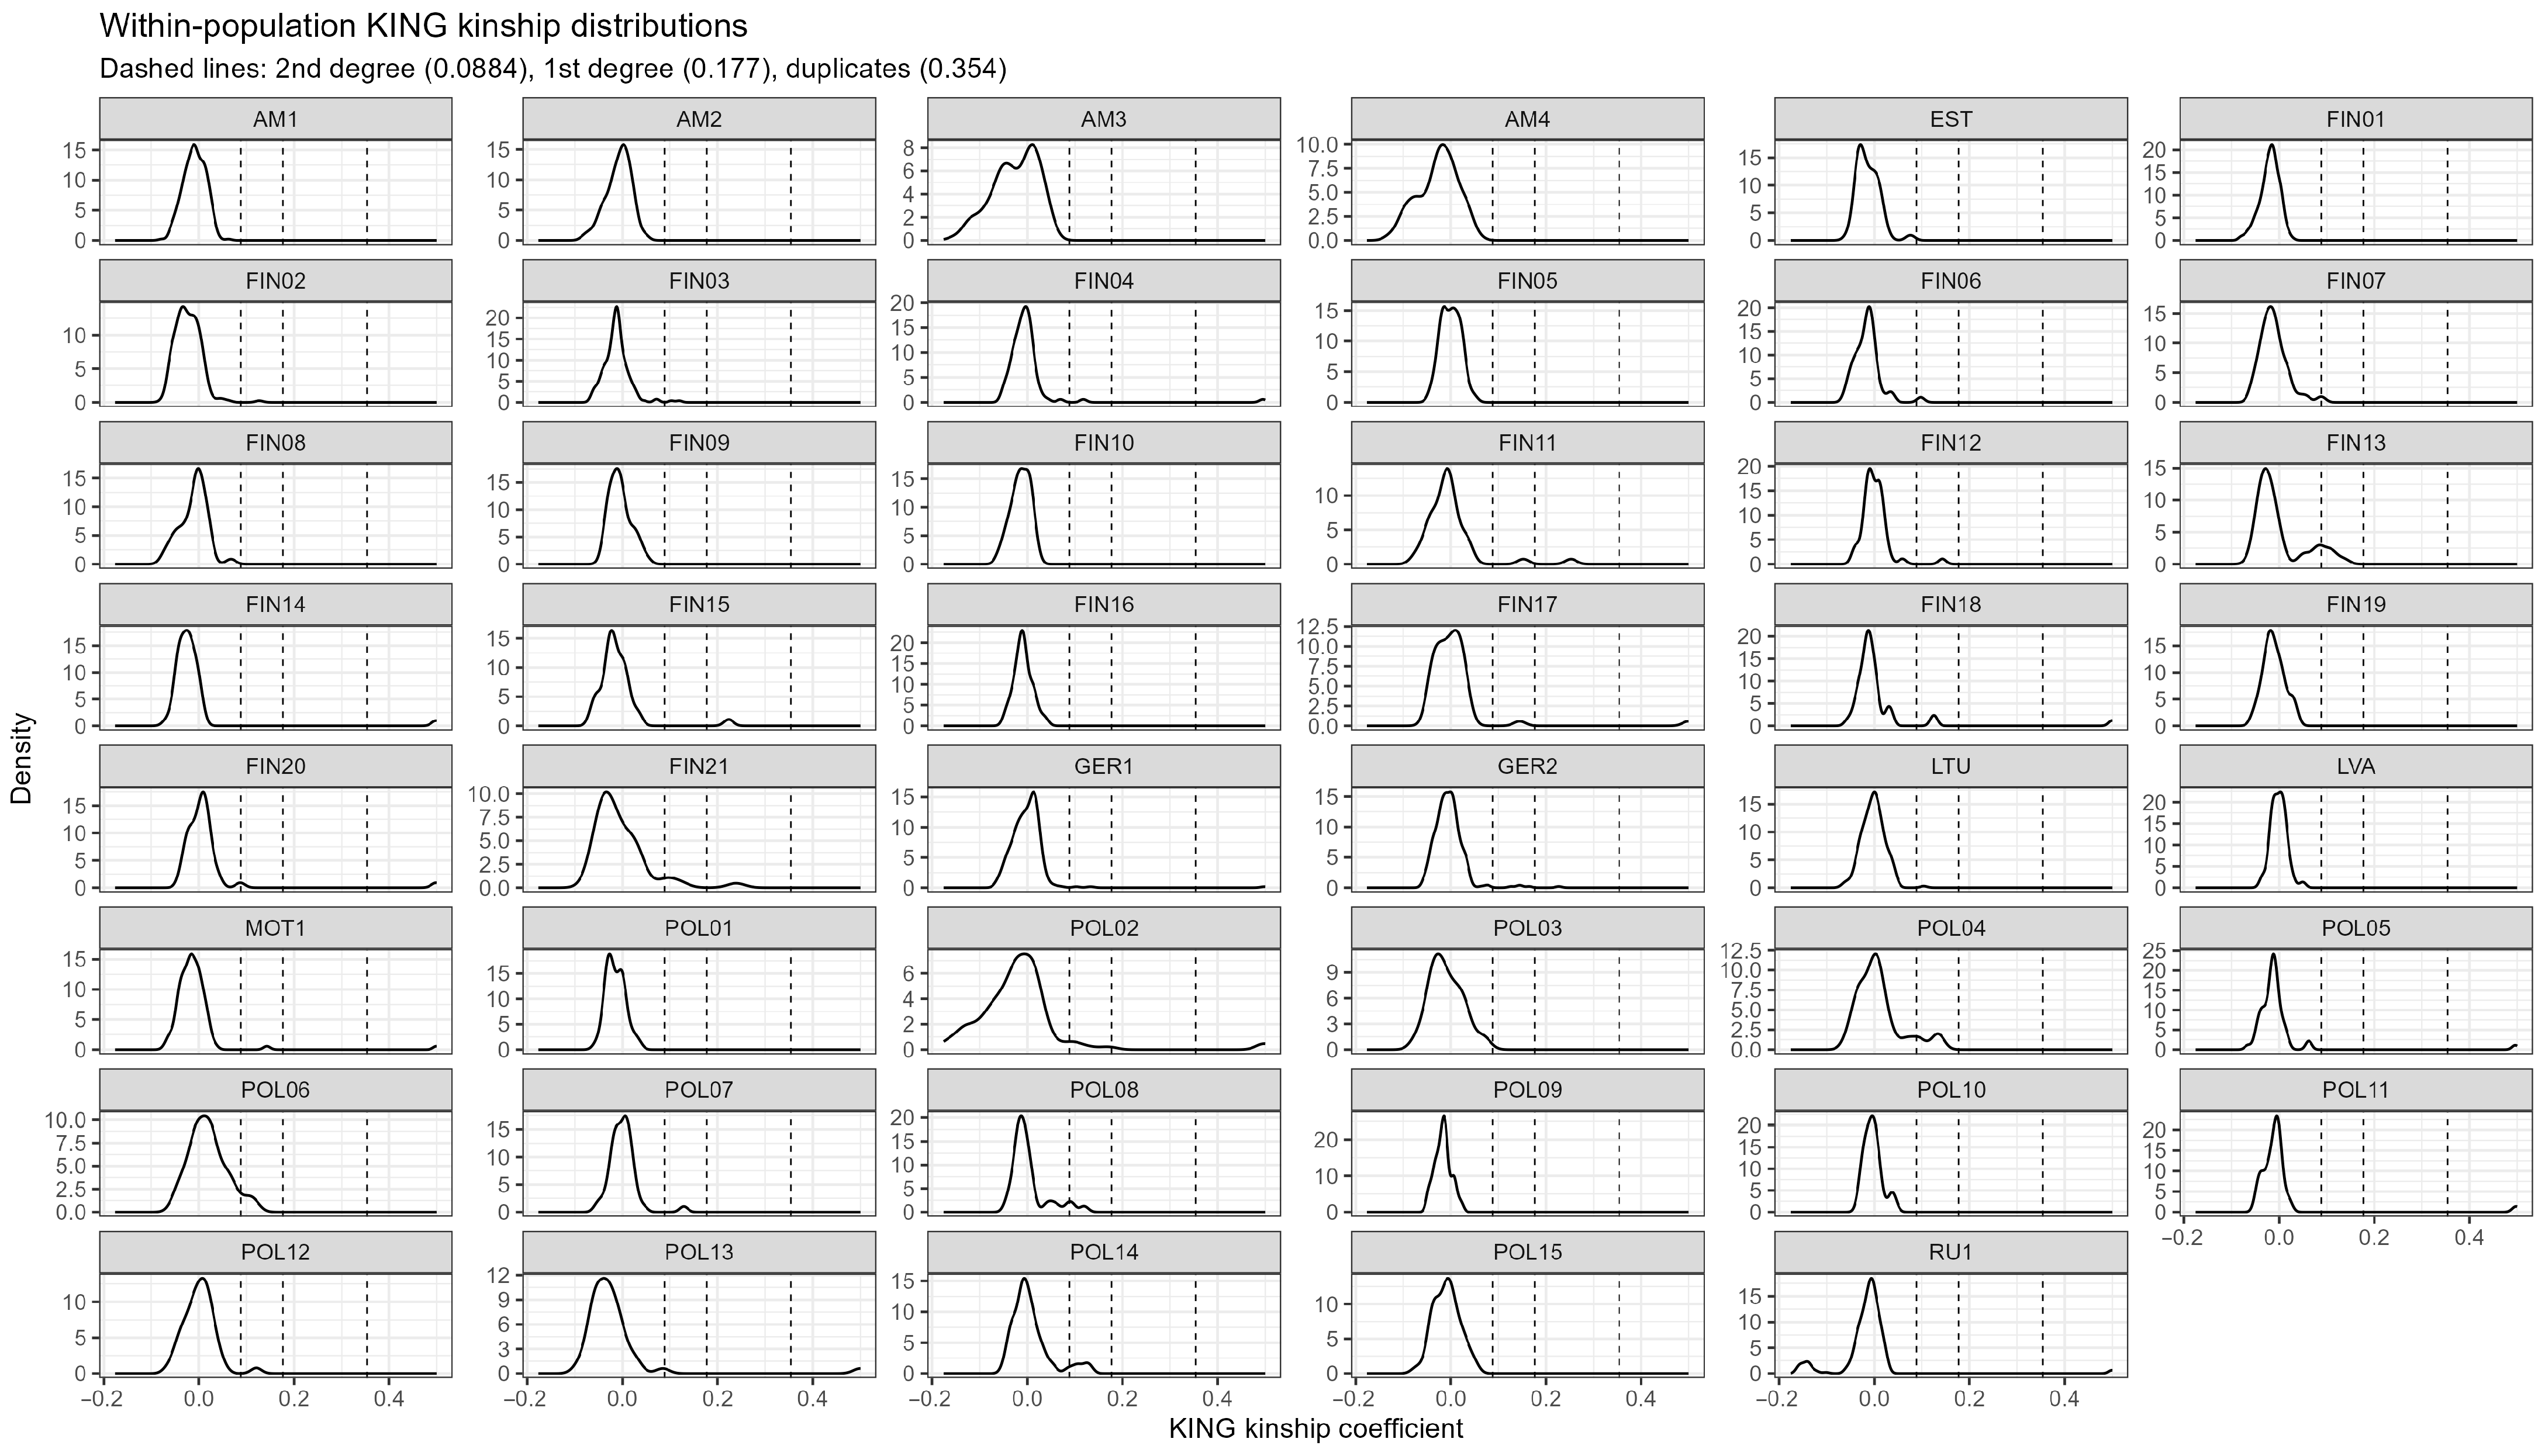
Within-population relatedness was generally low across the dataset. KING kinship coefficients were centred close to zero, and the vast majority of within-population pairs fell below the second-degree cutoff (kinship < 0.0884; Table 3). Accordingly, the density curves in Figure 2 are typically sharply peaked around zero with only limited right tails.
Table 3.
Proportion of different levels of relatives based on the kinship analysis (N = number of genotyped individuals, Npairs = number of pairs with each location, closer as 1stDegree = proportion of individuals with kinship values higher than full-sibs, 1stDegree = proportion of full-sibs, 2ndDegree = proportion of half-sibs, unrelated = proportion of unrelated individuals.
Figure 2.
Distribution of kinship among individuals in the different locations.
All four Armenian stands showed little evidence of close relatives. For AM1 (N = 24), AM2 (N = 14), AM3 (N = 24), and AM4 (N = 25), none of the within-population pairs (Npairs = 276, 91, 276, and 300, respectively) exceeded the second-degree threshold (Table 3). In contrast, a small number of reference populations showed detectable second-degree or closer relationships, including POL02 (closer than first-degree = 0.020; second-degree = 0.036), POL04 (second-degree = 0.111), and FIN13 (second-degree = 0.089), which correspond to visible right-shifted tails in Figure 2. Overall, Armenian stands were comparable to the majority of Eurasian populations and did not show pronounced within-stand family clustering.
3.4. Principal Component Analysis
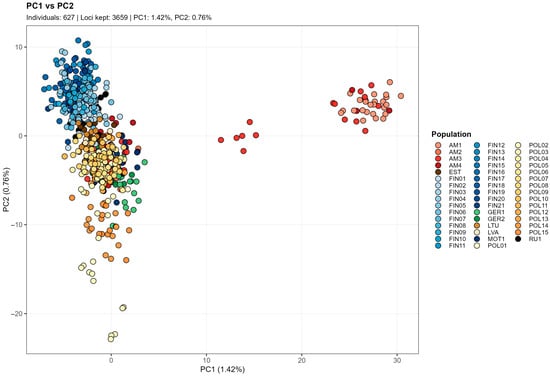
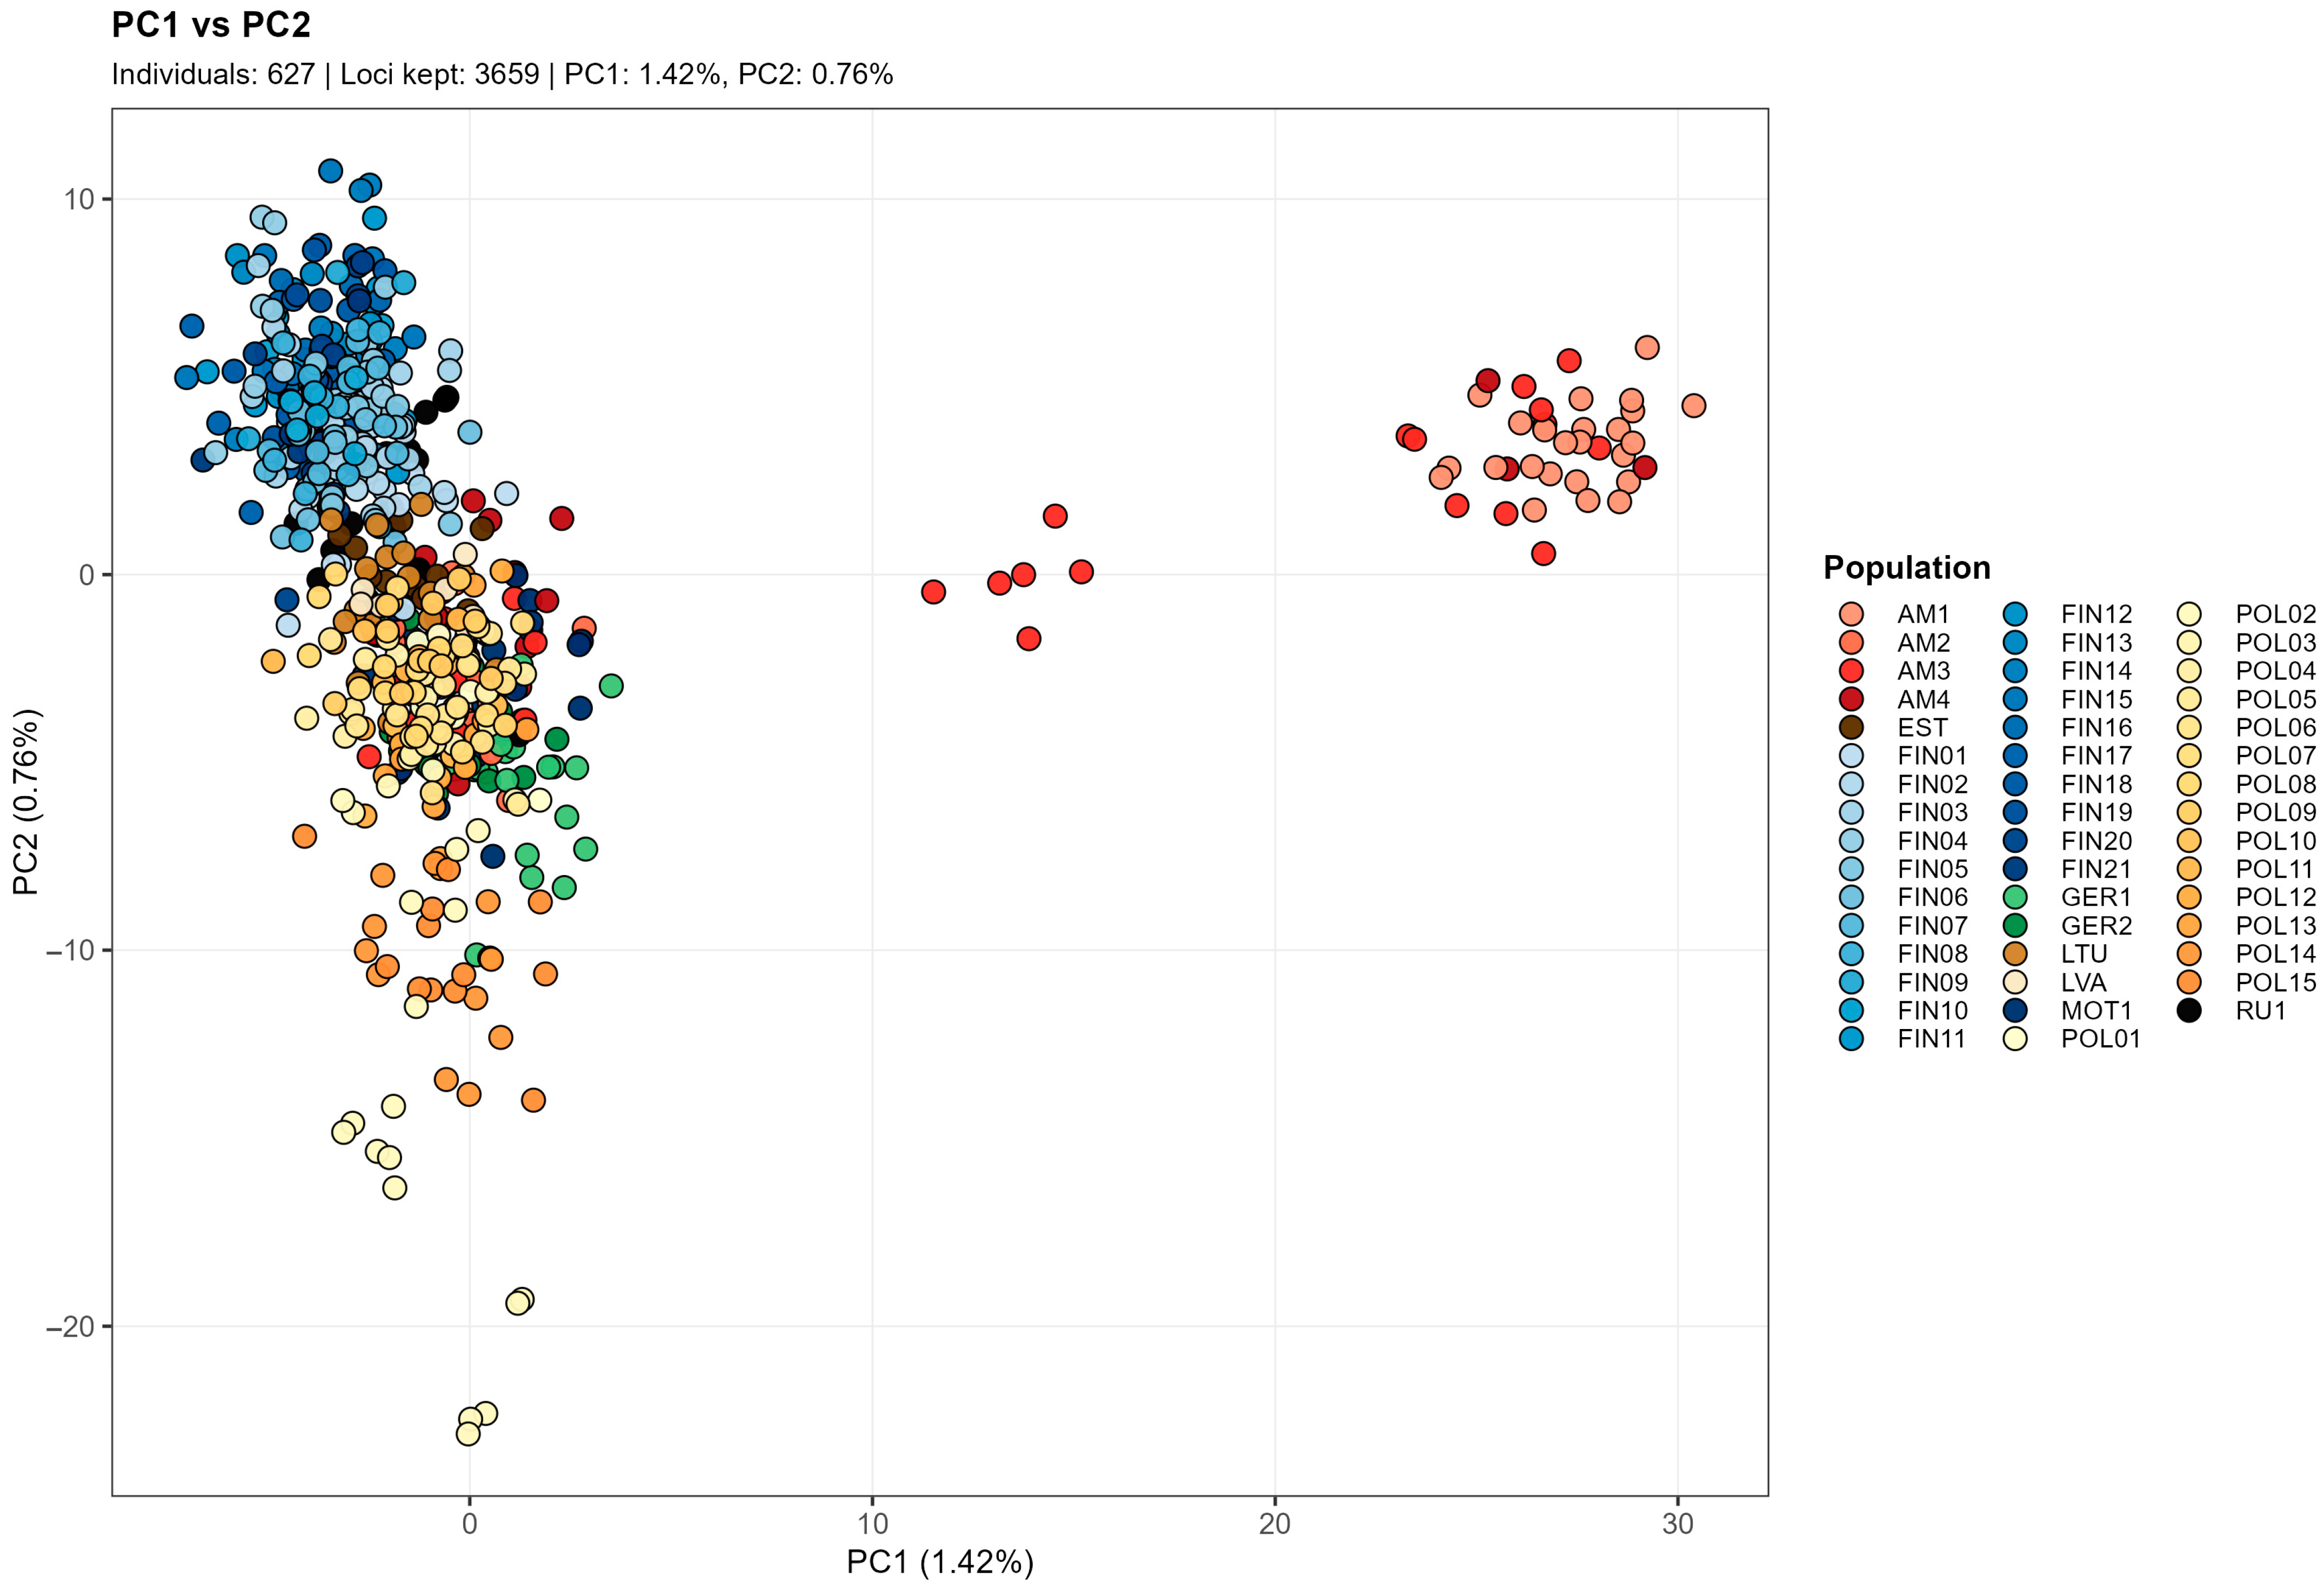
PCA of 3659 SNP loci across 627 individuals again revealed weak but interpretable genome-wide structure (Figure 3). PC1, PC2, and PC3 accounted for 1.42%, 0.76%, and 0.59% of the total genetic variance, respectively. Despite the low variance explained, the ordination and the supplementary axis combinations showed consistent broad contrasts between Armenian and non-Armenian samples (Supplementary Figure S1).
Figure 3.
PCA of 627 individuals from 47 locations (PC1 vs. PC2).
Along PC1, all non-Armenian reference individuals fell within a narrow range (−7.03 to 3.51; Supplementary File S2), whereas the Armenian stand AM1 formed a clearly separated cluster with uniformly high PC1 scores (24.12–30.40; mean 27.39 ± 1.60 SD). This strong displacement of AM1 was retained across the PC1–PC2 and PC1–PC3 projections, supporting AM1 as the most distinct Armenian stand in the revised dataset.
The remaining Armenian stands were again heterogeneous. AM2 overlapped entirely with the European cloud on PC1 (−2.20 to 2.84) and showed negative PC2 values (mean −2.51), placing it closest to the central/eastern European background. AM4 was largely similar to this continental group (22 of 25 individuals with PC1 between −5 and 5), but included three individuals with high PC1 values (>20) that clustered with AM1. AM3 showed the largest within-stand spread, spanning nearly the full PC1 range of the dataset (−2.50 to 28.04) and including 10 individuals with PC1 > 20 that co-localised with AM1, while eight AM3 individuals fell within the central European cloud (PC1 between −5 and 5; Figure 3; Supplementary File S2).
PC2 captured additional geographic structure among the reference populations, separating northern from central/eastern Europe: Finnish populations were concentrated at positive mean PC2 values (2.39–6.66), whereas Polish populations extended towards strongly negative values (population means down to −12.13; individual minima to −22.87). Armenian samples spanned this axis, with AM1 plotting in the upper part of the ordination (PC2 1.72–6.05) and AM2–AM4 distributed across both negative and positive PC2 values, consistent with variable affinities to different parts of the Eurasian gene pool. PC3 did not reveal a contradictory separation pattern, but the supplementary PC1–PC3 and PC2–PC3 plots supported the same broad structure (Supplementary Figure S1).
The Armenia-only PCA increased the visibility of within-Armenia differentiation (Supplementary Figure S2). In this subset, PC1, PC2, and PC3 explained 5.44%, 1.58%, and 1.52% of the variance, respectively. AM1 and AM2 occupied opposite ends of PC1, AM4 was largely closer to AM2 but remained widely dispersed, and AM3 spanned much of the within-Armenia range, confirming that the Armenian material is internally heterogeneous and that AM1 remains the most differentiated stand. Scores for the first ten principal components for each individual are provided in Supplementary File S2.
3.5. Structure-like Admixture Results LEA
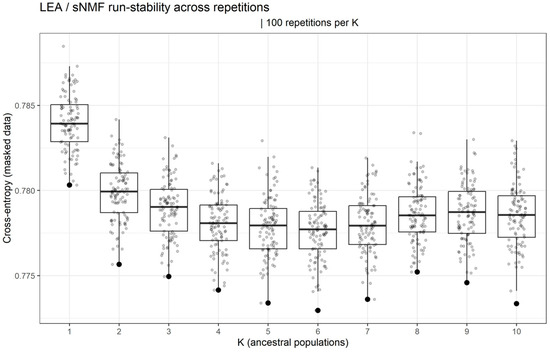
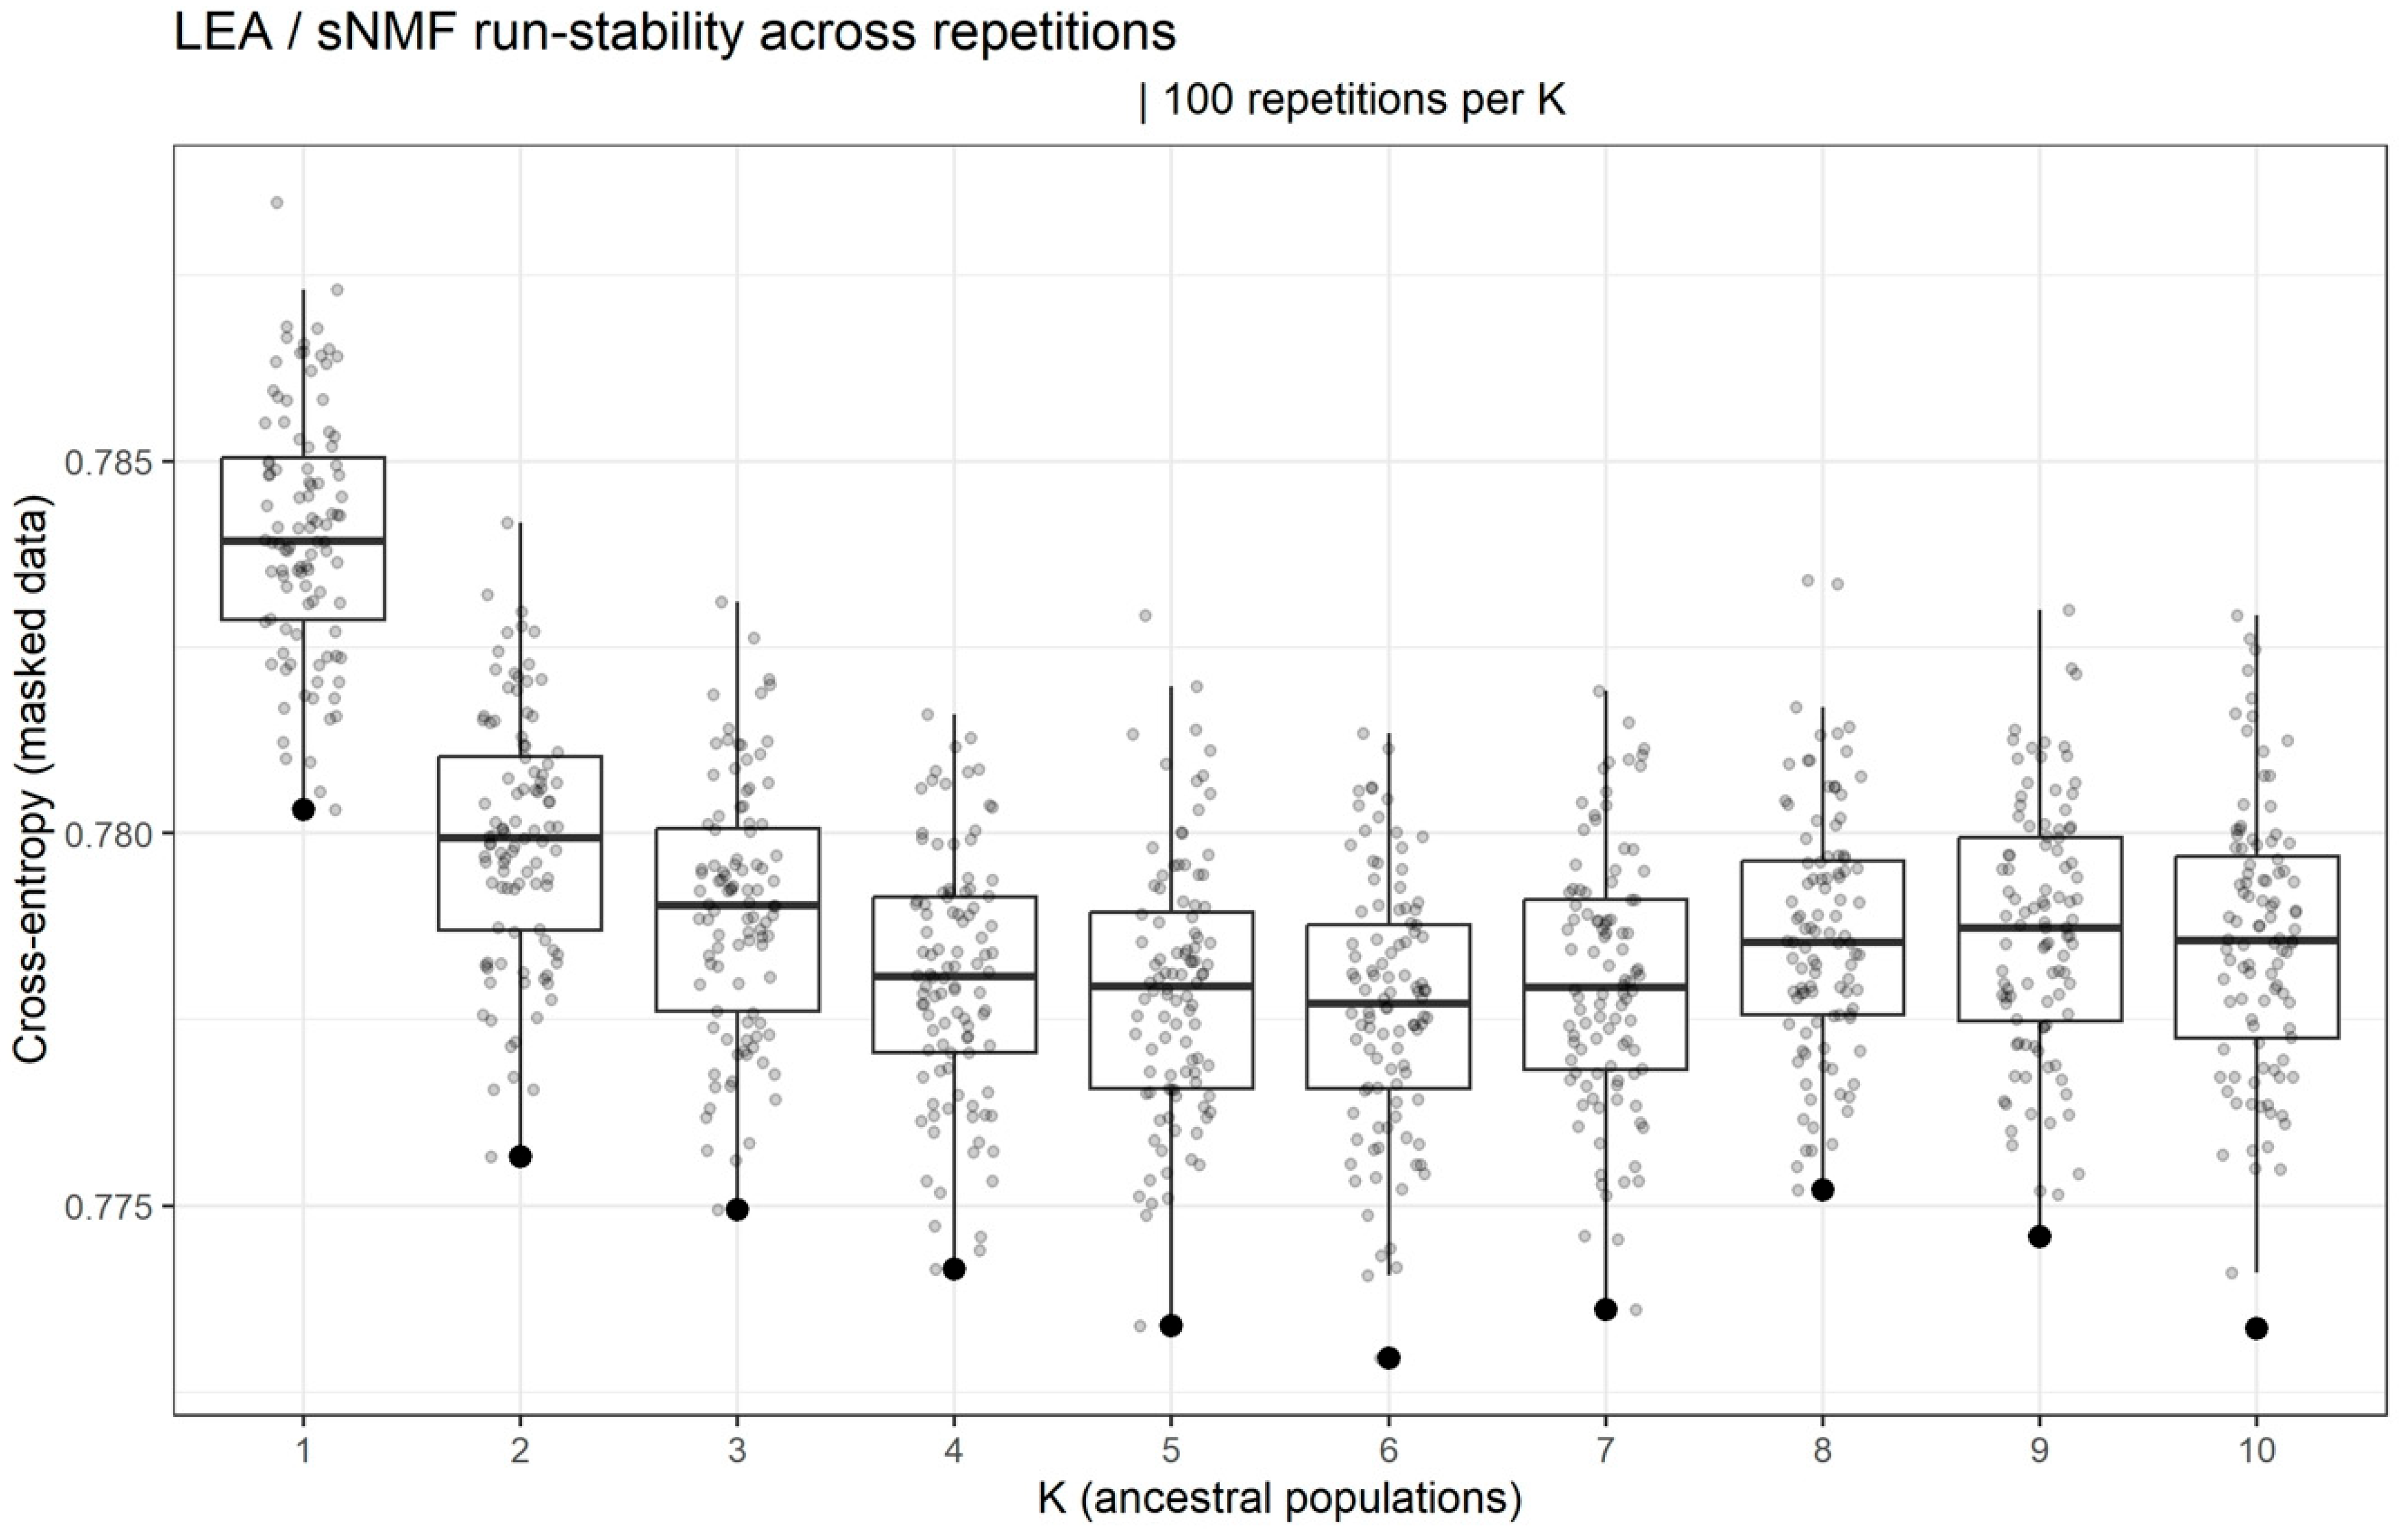
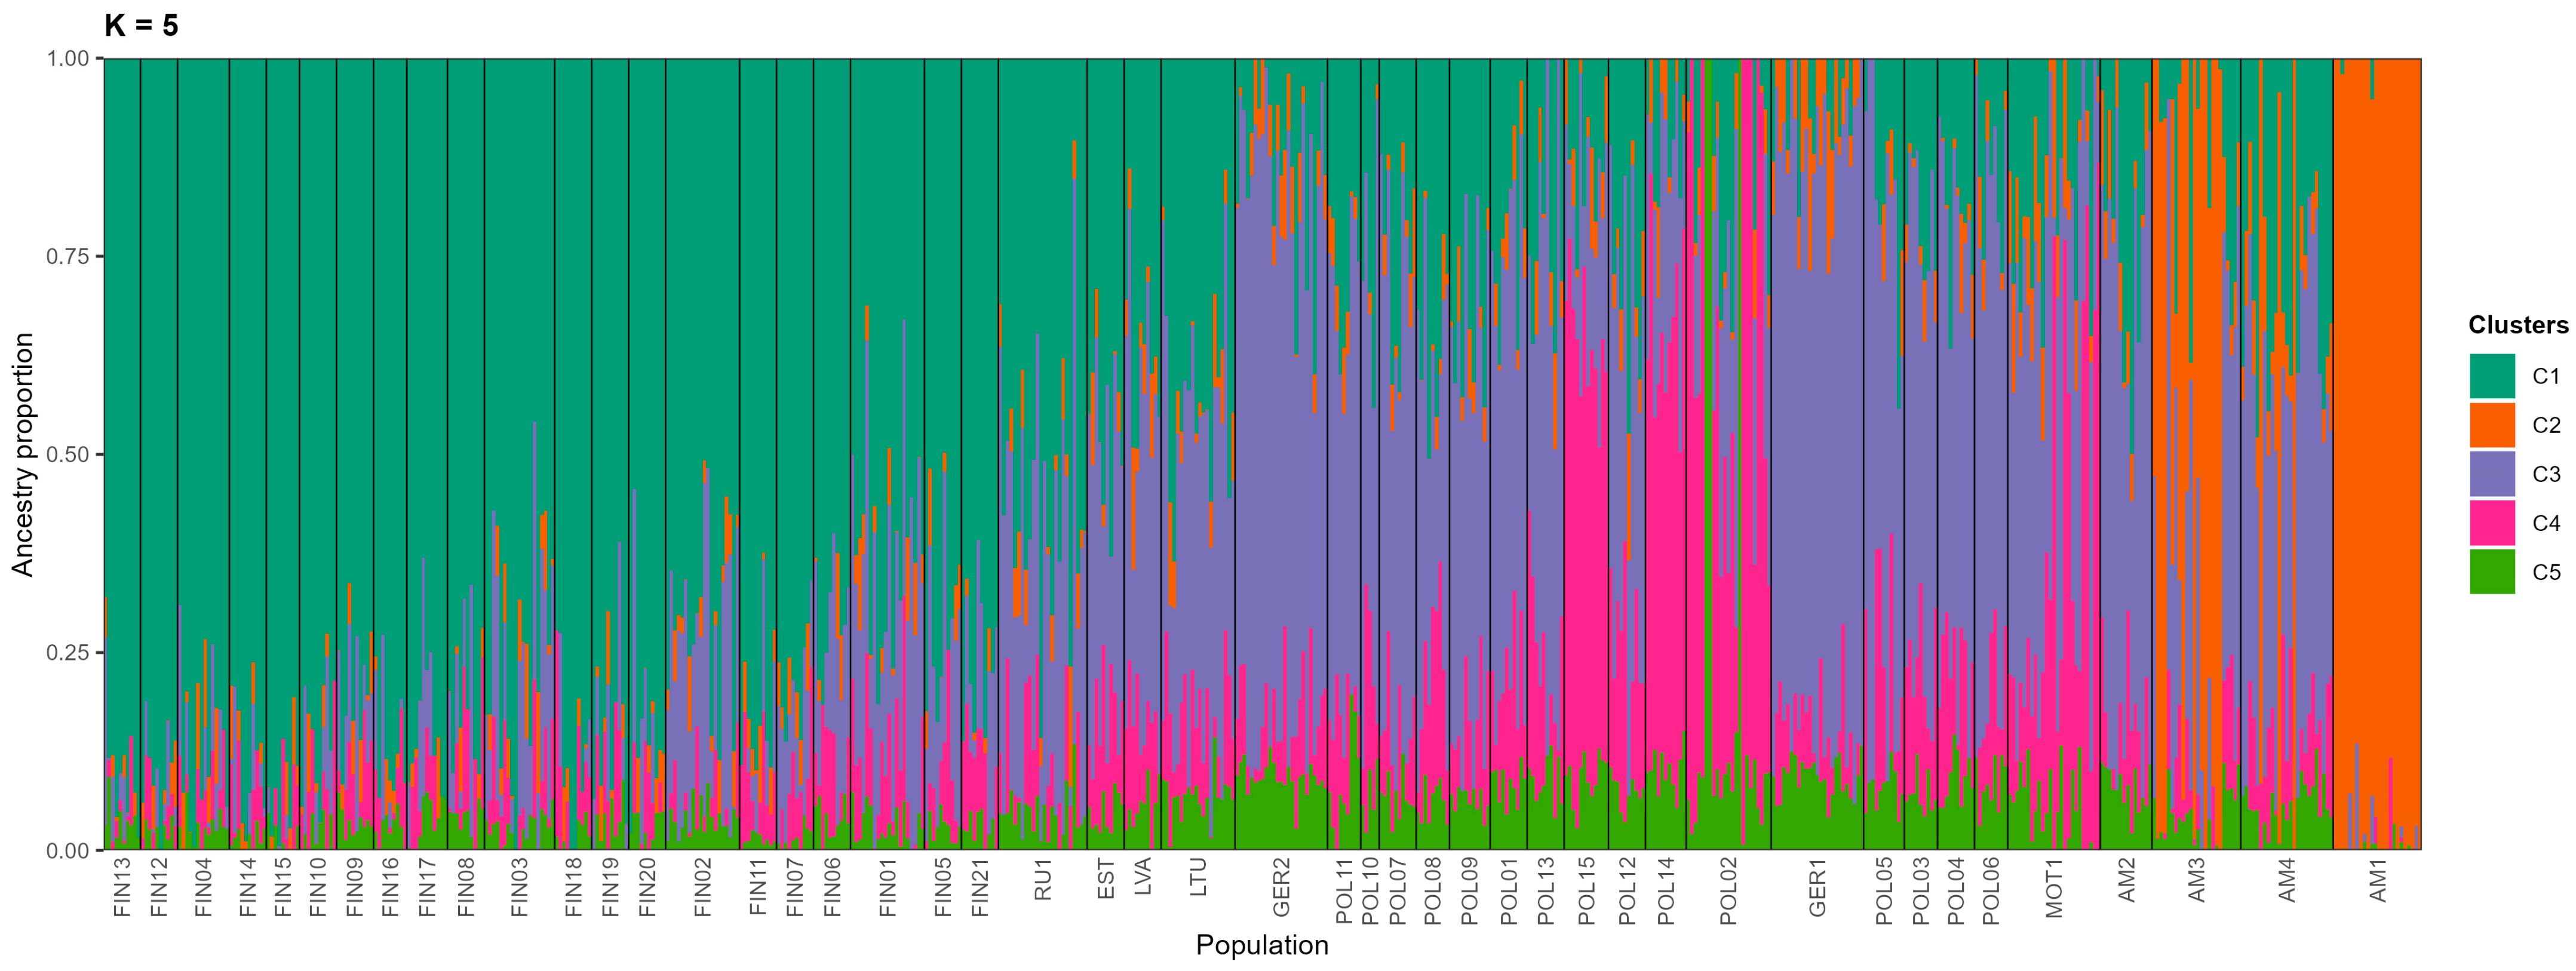
Cross-entropy was highest for K = 1 and declined strongly up to approximately K = 4–6, confirming that the dataset contains population structure (Figure 4). However, the cross-entropy differences among K = 4–10 were small and formed a broad plateau across repeated runs, indicating that the data do not support one uniquely resolved number of ancestry components. We therefore interpret K = 5 as a practical and visually informative summary of the broad structure shown in Figure 5 and Figure 6, while recognising that neighbouring solutions in the same range receive similar support.
Figure 4.
Cross-entropy for LEA/sNMF models across K = 1–10 (100 runs per K).
Figure 5.
LEA/sNMF ancestry bar plot (K = 5) for all populations; individuals ordered by population.
Figure 6.
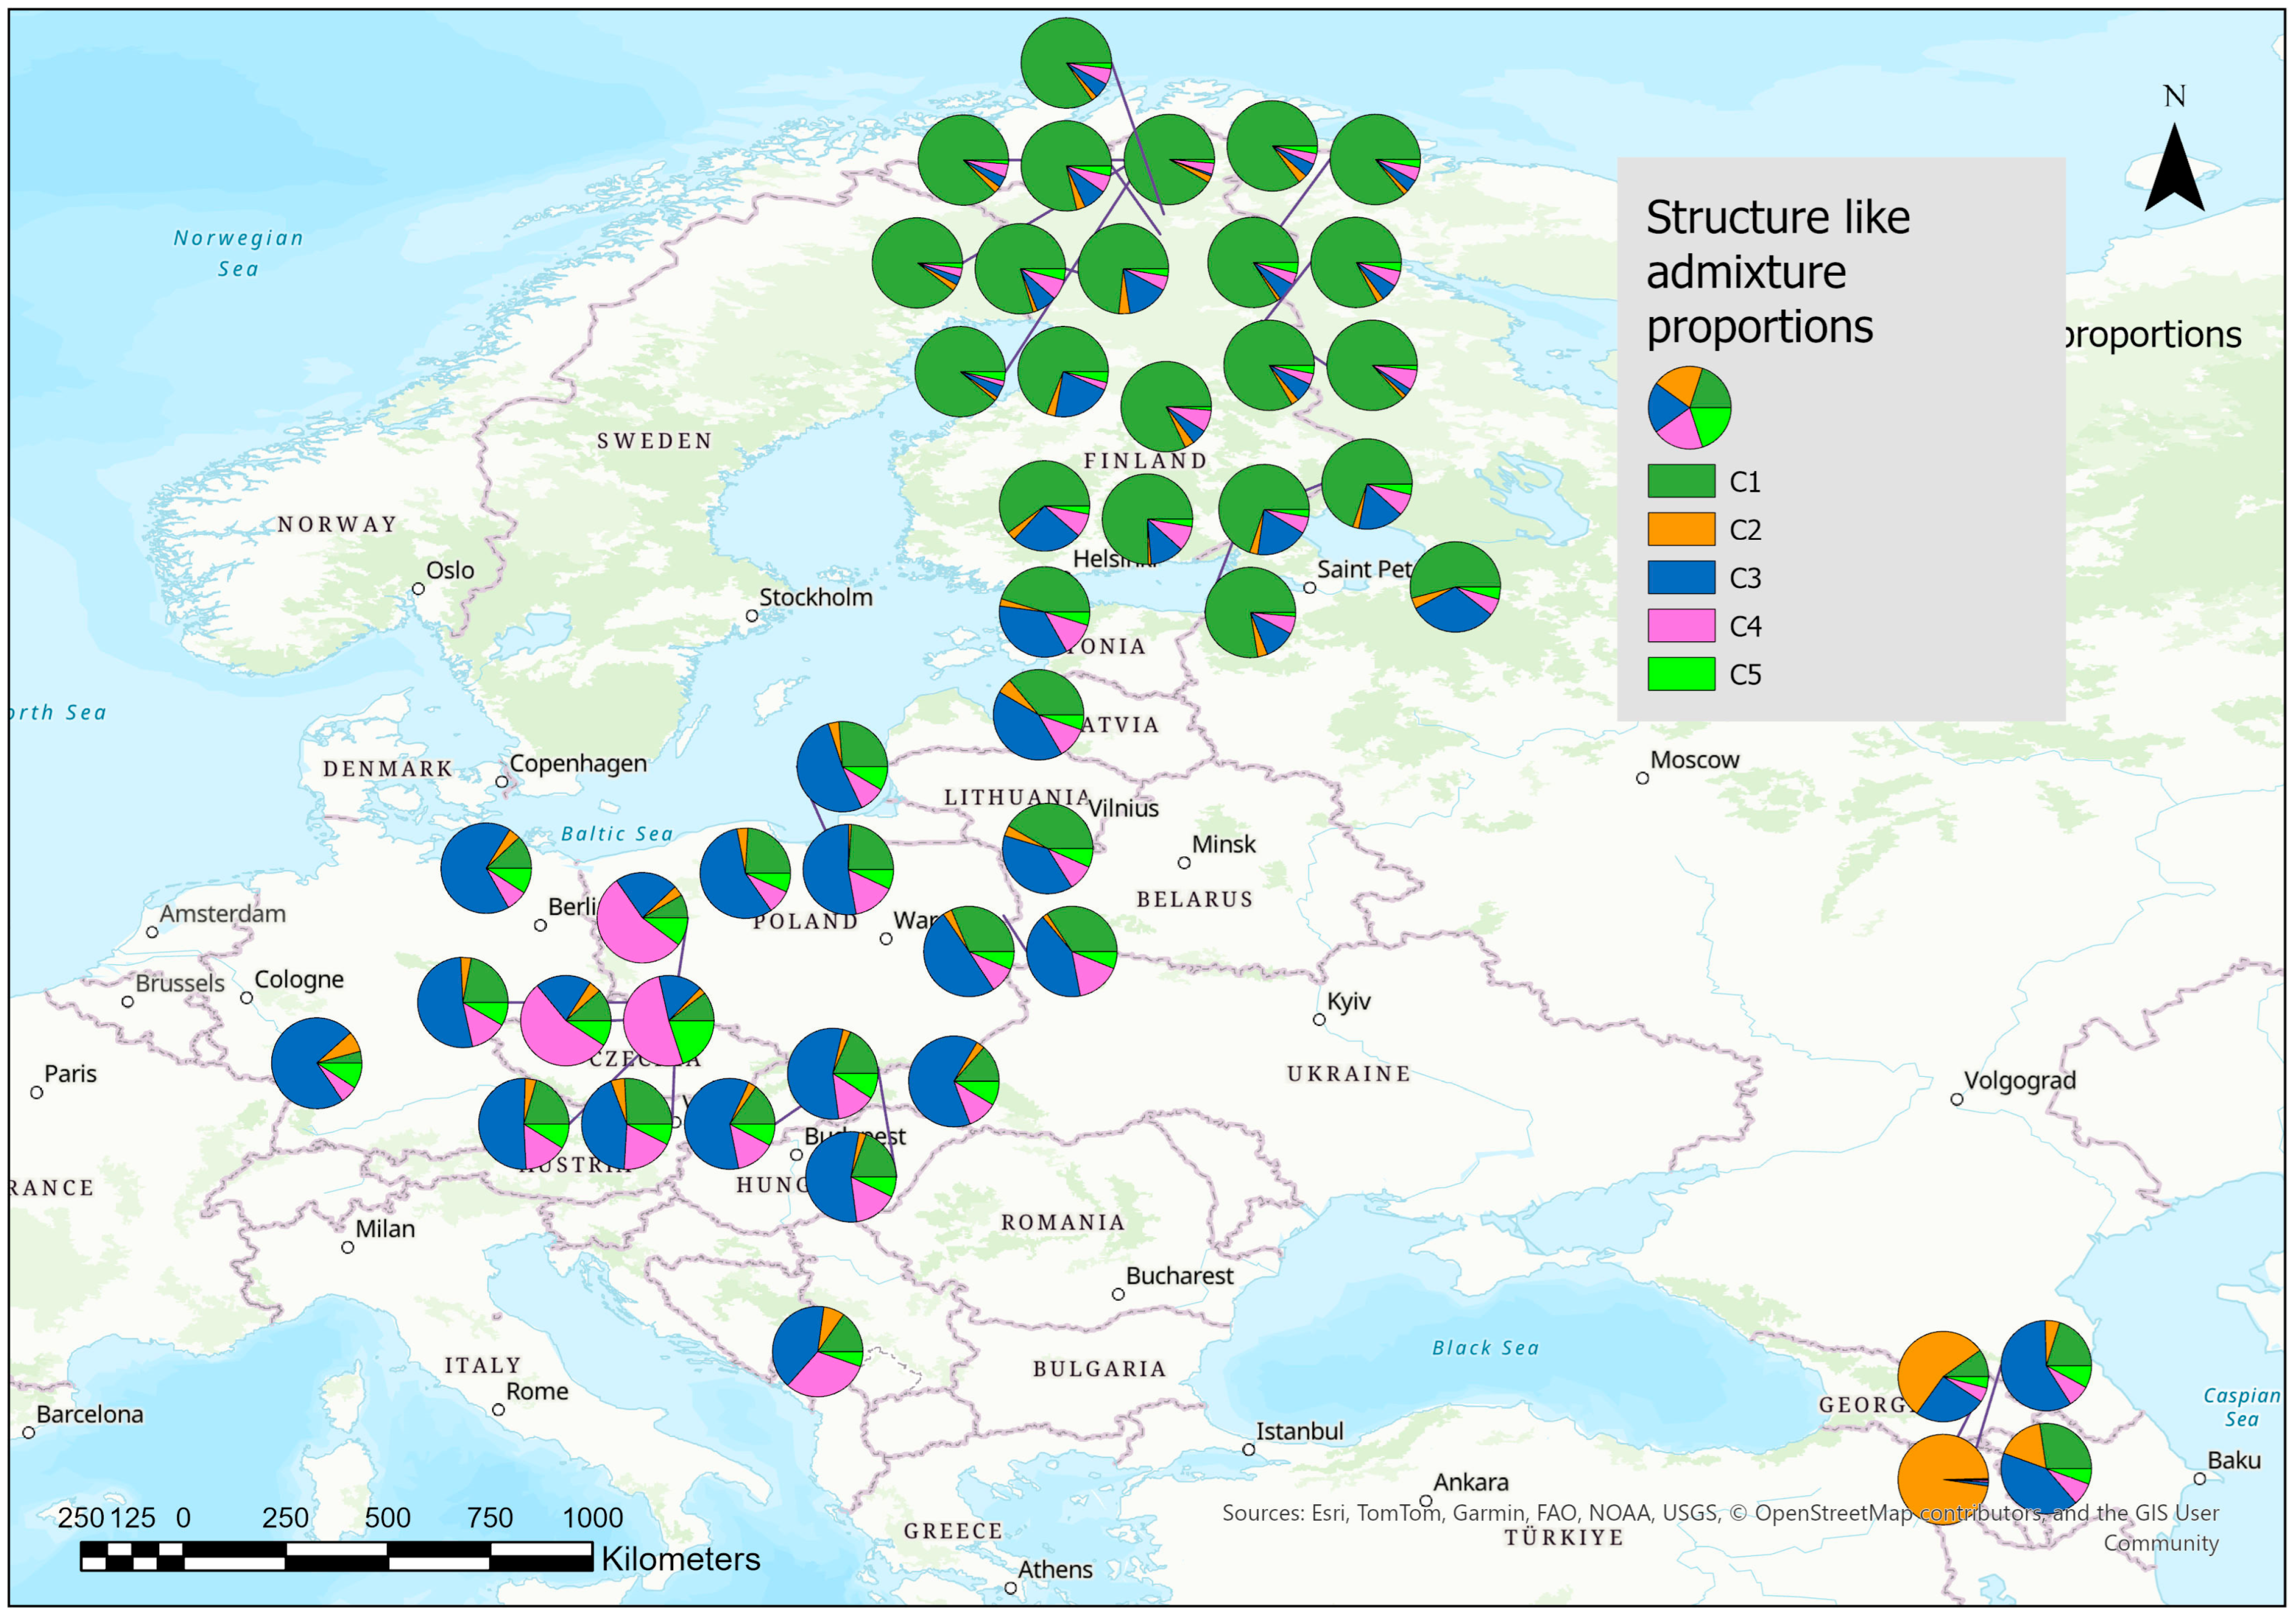
Map with distribution of the Structure like admixture clusters in 47 Scots pine populations.
At K = 5, ancestry proportions showed a clear, broad geographic organisation across Europe (Figure 5) that was also reflected in the map presentation (Figure 6). Finnish populations were dominated by one northern component, whereas most central and southeastern European reference populations were dominated by a different widespread continental component. The Baltic populations and RU1 were intermediate, showing mixed ancestry proportions consistent with a transition zone between the northern and continental patterns.
Within Poland, most locations also showed a predominant continental ancestry component, but several populations exhibited stronger contributions from an additional component, indicating finer substructure within the Polish sampling. Across the best-run bar plots from K = 1 to K = 10 (Supplementary Figure S3), these finer subdivisions varied more than the main north-versus-continental contrast, reinforcing that detailed admixture partitions are less stable than the broad structure.
Armenian stands were heterogeneous and contrasted strongly with the Finland-dominated and central European patterns. AM1 was nearly fixed for one Armenia-associated ancestry component in the representative K = 5 solution and remained distinct across neighbouring K values. AM2 showed ancestry dominated by the widespread continental component and clustered closest to the central/eastern European reference populations, whereas AM3 displayed the strongest admixture between the AM1-associated and continental components. AM4 was intermediate, containing mainly continental-like individuals but also a smaller subset with substantial AM1-like ancestry. Thus, the LEA analysis supports robust broad subdivision and marked heterogeneity among Armenian stands, while the exact number and composition of fine-scale ancestry components should be interpreted cautiously.
4. Discussion
Across the Eurasian range, Scots pine typically shows weak to moderate genetic structure, reflecting large effective population sizes and extensive pollen-mediated gene flow, with subtle clines and isolation-by-distance rather than sharp lineage breaks. Our SNP dataset is consistent with this general picture: although the first PCA axes explain only a small fraction of genome-wide variance and the LEA cross-entropy surface enters a broad plateau from approximately K = 4 to K = 6, the combined PCA, pairwise FST, and AMOVA results still indicate structured but modest regional differentiation rather than sharp lineage breaks [1,3,10].
In this continental context, the Armenian stands are the most distinctive part of the dataset, but they also illustrate that divergence in Scots pine is often expressed as shifts in ancestry proportions and pairwise differentiation rather than complete isolation. Among the four Armenian locations, AM1 is consistently the most differentiated stand in the analyses, whereas AM2 and AM4 are much closer to the broader Eurasian reference variation and AM3 remains intermediate. The pairwise FST and AMOVA results strengthen this interpretation by showing stable differentiation patterns and significant hierarchical structure.
The pronounced distinctiveness of AM1, together with intermediate admixture in AM3 and AM4, is compatible with the broader view that southern, mountainous and/or fragmented parts of the range can harbour more differentiated gene pools than the boreal core. Marker-based work in the Greater Caucasus and Crimea reported spatially structured variation consistent with regional differentiation [8], and cytoplasmic-marker analyses suggested that Caucasus populations did not contribute recently to the postglacial recolonisation of the main Eurasian range, supporting long-term regional distinctiveness [9]. Range-wide phylogeographic syntheses likewise emphasise that multiple refugial areas and complex colonisation routes can generate geographically localized lineages or allele-frequency shifts in southern Europe and around major mountain systems [10,28]. Together, these studies motivate testing whether Armenian material contains unusual genomic components, but they do not by themselves demonstrate that AM1 represents a confirmed long-term Armenian lineage. This broader interpretation is also consistent with Dering et al., [7], who concluded from Caucasus-wide mtDNA, microsatellite, and species-distribution analyses that Scots pine in the Caucasus ecoregion reflects a distinctive glacial and postglacial history relative to the main European range.
Recent genomic work further highlights that these patterns can be tracked with dense SNP resources. The PiSy50k array provides a standardised genotyping platform for Scots pine, enabling cross-study comparability and efficient integration of datasets [11]. Analyses of rare-allele distributions across Europe indicate that signals of demographic expansion and refugial persistence can remain detectable in current variation, even when overall differentiation is low [29]. Within this framework, the strong Armenian-associated component in AM1 is best interpreted as evidence for a highly differentiated genetic group within the present dataset rather than as proof of a confirmed rear-edge lineage; its origin remains unresolved because the analysed stands are plantations of uncertain provenance and adjacent regional reference sampling is still sparse.
At the same time, admixture patterns in a species with long-distance pollen dispersal can also be shaped by anthropogenic seed transfer. Across Eurasia, Scots pine has a long history of forest management and planting, and genomic studies increasingly point to human-mediated gene transfer as an additional driver of non-local ancestry signals, superimposed on postglacial history and isolation-by-distance [2,4]. The fact that AM2–AM4 carry large proportions of widespread Eurasian ancestry is therefore consistent with two non-exclusive scenarios: (i) natural connectivity among Caucasus mountain stands via pollen flow and stepping-stone dispersal, or (ii) partial establishment from non-local seed sources followed by local gene flow. Distinguishing these scenarios will require denser regional sampling (e.g., Georgia, eastern Turkey, northern Iran) and, ideally, historical information on stand origin and planting.
The LEA results are consistent with weak but repeatable broad-scale structure across Europe, but they do not uniquely resolve one biologically definitive number of ancestry components. In the analysis, cross-entropy decreased strongly from K = 1 to approximately K = 4–6 and then formed a broad plateau, indicating that broad subdivision is robust, whereas finer admixture partitions are more model-dependent. We therefore treat the cluster profiles in Figure 5 and Figure 6 as exploratory summaries of structure rather than as direct evidence for specific refugia or migration routes, although the dominant Finnish component and regionally varying contributions in central and eastern Europe remain compatible with previously reported postglacial and management-related history [3,28].
Kinship analyses provide an important check on whether within-location sampling could bias inference of population structure. Using the KING robust estimator on the revised filtered marker set, we detected virtually no close relatives within any Armenian location. These results suggest that the Armenian sampling captured multiple, apparently unrelated genotypes rather than a few family groups, and that the pronounced AM1 signal is unlikely to be an artefact of sampling many siblings or clones [22,23,30].
Nevertheless, the interpretability of kinship summaries depends on sample size. For small populations (e.g., N ≈ 10), the number of pairwise comparisons is limited (45 pairs), so estimated proportions of close relatives can change substantially with a single additional related pair. In such cases, kinship analysis remains useful as a screening tool to identify extreme situations (e.g., plantations dominated by a few families) and to flag duplicates, but absence of detected close kin should not be over-interpreted as proof of a broad founder base. Wherever possible, kinship results should therefore be considered alongside stand history and other indicators of genetic diversity (e.g., heterozygosity, polymorphism rate).
From a management and conservation perspective, the analyses indicate that the Armenian plantations should not be treated as a single homogeneous unit. AM1 deserves particular attention because it is consistently the most differentiated stand in the present dataset, whereas AM2 and AM4 show much stronger affinities to widespread Eurasian reference material and AM3 is intermediate. However, these genomic patterns alone are not sufficient to define seed-transfer zones or to infer adaptive distinctiveness, because plantation provenance is uncertain and direct evidence on adaptive traits is still lacking. Integrating Armenian material into common-garden trials and expanding regional reference sampling would therefore be a logical next step to test whether the differentiated AM1-associated genomic component corresponds to distinctive phenotypes or locally relevant adaptive variation [17,31,32,33,34]. This caution is reinforced by Dering et al., [7], who emphasized both the evolutionary distinctiveness of Scots pine in the Caucasus ecoregion and the conservation relevance of its southern mountain populations under ongoing climate change.
Finally, several limitations should be acknowledged more explicitly. Our study focuses on plantation stands of uncertain provenance rather than verified natural source populations, and the merged dataset is constrained to the set of SNPs shared across studies. SNP arrays can introduce ascertainment bias that may reduce sensitivity to rare, region-specific variation. In addition, sampling density is uneven across Eurasia, with limited representation from regions directly adjacent to Armenia. Future work that combines dense regional sampling, organellar markers, and explicit genotype–environment association analyses would help to disentangle demographic history, ongoing gene flow and potential local adaptation in the South Caucasus, and to refine conservation and seed-transfer recommendations for Scots pine in this region [11,12,13]. In this regard, the severe future habitat contraction projected for Caucasian Scots pine by Dering et al., [7] further underscores the need to resolve provenance and to evaluate differentiated Armenian material within a broader regional conservation framework.
5. Conclusions
Genome-wide SNP data demonstrate that Scots pine plantations in Armenia are not genetically homogeneous. Across all revised analyses, AM1 emerges as the most differentiated stand within the present dataset, whereas AM2 and much of AM4 align more closely with widespread Eurasian variation and AM3 remains intermediate. Pairwise FST, hierarchical AMOVA, PCA robustness checks, and repeated LEA analyses all support this broad pattern, and it remains stable after removal of a near-duplicate AM3 sample and stricter SNP filtering. At the same time, because the Armenian stands are plantations of uncertain origin and regional reference sampling remains incomplete, the AM1-associated genomic component should be interpreted as a highly differentiated but unresolved genetic signal rather than as proof of a distinct long-term Armenian lineage. For conservation and management of forest reproductive material, the most defensible implication is that Armenian stands should be treated as non-equivalent management units and prioritized for further provenance verification, regional sampling, and common-garden evaluation before specific deployment recommendations are made.
Supplementary Materials
The following supporting information can be downloaded at https://www.mdpi.com/article/10.3390/f17040417/s1. Supplementary Table S1: Pairwise FST estimates with bootstrap confidence intervals. Supplementary File S1: AMOVA results. Supplementary File S2: PCA results for all individuals, including scores for PC1–PC10. Supplementary Figure S1: PCA panel for all individuals. Supplementary Figure S2: PCA panel for Armenian individuals only. Supplementary Figure S3: LEA structure-like results, showing the panel of best-run bar plots for K = 1–10.
Author Contributions
Conceptualization, B.D. and Y.Y.; methodology, B.D., Y.Y., A.K.; software, A.P.L.M., B.D.; validation, Y.Y., A.K.; investigation, B.D., Y.Y., A.K., A.S.; data curation, A.P.L.M., B.D.; writing—original draft preparation, B.D.; writing—review and editing, Y.Y., A.K., A.S., and A.P.L.M.; funding acquisition, A.K., Y.Y. and B.D. All authors have read and agreed to the published version of the manuscript.
Funding
This research was funded by the German Federal Ministry of Agriculture, Food and Regional Identify (BMLEH) via the funding agency FNR, grant number 2223NR023X and it was funded by a grand from the Higher Education and Science Committee of the Republic of Armenia (project 23RL-1F017 «Study of ecological adaptation of forest plant species under climate change conditions»).
Data Availability Statement
The genotype data (vcf-file) and the geographic co-ordinates are available at Zenodo: https://doi.org/10.5281/zenodo.19221032, accessed on 25 March 2026.
Acknowledgments
We are thankful to Ute Straßburg-Käßler for technical assistance (sampling, DNA extraction, DNA quality control) and we thank Gnel Poghosyan for support in the sampling in Armenia. We thank Volker Schneck for support with the sampling in the IUFRO Scots pine provenance trial and his comments on a former version of the manuscript. We are thankful to the three anonymous reviewers for their valuable comments and suggestions on a former version of the manuscript. We used AI (ChatGPT version 5.4) to polish the language.
Conflicts of Interest
The authors declare no conflicts of interest.
References
- Bruxaux, J.; Zhao, W.; Hall, D.; Curtu, A.L.; Androsiuk, P.; Drouzas, A.D.; Gailing, O.; Konrad, H.; Sullivan, A.R.; Semerikov, V.; et al. Scots pine—Panmixia and the elusive signal of genetic adaptation. New Phytol. 2024, 243, 1231–1246. [Google Scholar] [CrossRef] [Scilit] [PubMed]
- Zukowska, W.B.; Wójkiewicz, B.; Lewandowski, A.; László, R.; Wachowiak, W. Genetic variation of Scots pine (Pinus sylvestris L.) in Eurasia: Impact of postglacial recolonization and human-mediated gene transfer. Ann. For. Sci. 2023, 80, 42. [Google Scholar] [CrossRef] [Scilit]
- Labiszak, B.; Wachowiak, W. Mid-Pleistocene events influenced the current spatial structure of genetic diversity in Scots pine (Pinus sylvestris L.). J. Syst. Evol. 2024, 62, 561–576. [Google Scholar] [CrossRef] [Scilit]
- Jansen, S.; Konrad, H.; Geburek, T. Crossing borders—European forest reproductive material moving in trade. J. Environ. Manag. 2019, 233, 308–320. [Google Scholar] [CrossRef] [Scilit]
- Hall, D.; Olsson, J.; Zhao, W.; Kroon, J.; Wennström, U.; Wang, X. Divergent patterns between phenotypic and genetic variation in Scots pine. Plant Commun. 2021, 2, 100139. [Google Scholar] [CrossRef] [Scilit]
- Sekiewicz, K.; Danelia, I.; Farzaliyev, V.; Gholizadeh, H.; Iszkulo, G.; Naqinezhad, A.; Ramezani, E.; Thomas, P.; Tomaszewski, D.; Walas, L.; et al. Past climatic refugia and landscape resistance explain spatial genetic structure in Oriental beech in the South Caucasus. Ecol. Evol. 2022, 12, e9320. [Google Scholar] [CrossRef] [Scilit]
- Dering, M.; Baranowska, M.; Beridze, B.; Chybicki, I.; Danelia, I.; Iszkulo, G.; Kvartskhava, G.; Kosinski, P.; Raczka, G.; Thomas, P.; et al. The evolutionary heritage and ecological uniqueness of Scots pine in the Caucasus ecoregion is at risk of climate changes. Sci. Rep. 2021, 11, 22845. [Google Scholar] [CrossRef] [Scilit]
- Petrova, I.V.; Sannikov, S.N.; Tembotova, F.I.; Sannikova, N.S.; Farzaliev, V.S.; Mollaeva, M.Z.; Egorov, E.V. Genogeography of Pinus sylvestris L. populations in the greater Caucasus and Crimea. Russ. J. Ecol. 2017, 48, 524–531. [Google Scholar] [CrossRef] [Scilit]
- Semerikov, N.V.; Petrova, I.V.; Sannikov, S.N.; Semerikova, S.A.; Tashev, A.N.; Lascoux, M.; Semerikov, V.L. Cytoplasmic DNA variation does not support a recent contribution of Pinus sylvestris L. from the Caucasus to the main range. Tree Genet. Genomes 2020, 16, 59. [Google Scholar] [CrossRef] [Scilit]
- Wachowiak, W.; Zukowska, W.B.; Perry, A.; Lewandowski, A.; Cavers, S.; Labiszak, B. Phylogeography of Scots pine in Europe and Asia based on mtDNA polymorphisms. J. Syst. Evol. 2023, 61, 315–327. [Google Scholar] [CrossRef] [Scilit]
- Kastally, C.; Niskanen, A.K.; Perry, A.; Kujala, S.T.; Avia, K.; Cervantes, S.; Haapanen, M.; Kesälahti, R.; Kumpula, T.A.; Mattila, T.M.; et al. Taming the massive genome of scots pine with PiSy50k, a new genotyping array for conifer research. Plant J. 2022, 109, 1337–1350. [Google Scholar] [CrossRef] [Scilit] [PubMed]
- Labiszak, B.; Wachowiak, W. Adaptive potential and genomic vulnerability of keystone forest tree species to climate change: A case study in Scots pine. Evol. Appl. 2025, 18, e70180. [Google Scholar] [CrossRef] [Scilit] [PubMed]
- Lasek, M.; Zaborowska, J.; Labiszak, B.; Chmura, D.J.; Wachowiak, W. Genomic data support the revision of provenance regions delimitation for Scots pine. Evol. Appl. 2024, 17, e70038. [Google Scholar] [CrossRef] [Scilit] [PubMed]
- Arbuzova, E.; Karagyan, G.; Kozyreva, N.; Shchukovskaya, A.; Ghrejyan, T.; Kalashian, M.; Akopyan, K. First finding of Bursaphelenchus xylophilus in pine plantations of the Republic of Armenia. J. Nematol. 2025, 57, 20250004. [Google Scholar] [CrossRef] [Scilit]
- Magakian, A. The Vegetation of the Armenian SSR; Publishing House of the USSR Academy of Sciences: Moscow, Russia; Leningrad, Russia, 1941; p. 271. [Google Scholar]
- Abrahamyan, A. On the issue of restoration and reconstruction of the forests of the upper mountain belt of the Armenian SSR. Proc. Armen. SSR Acad. Sci. 1957, 10, 13–24. [Google Scholar]
- Oleksyn, J. Report on the IUFRO-1982 provenance experiment on Scots pine (Pinus sylvestris L.). Arbor. Kórnickie 1988, 33, 211–229. [Google Scholar]
- Bruegmann, T.; Fladung, M.; Schroeder, H. Flexible DNA isolation procedure for different tree species as a convenient lab routine. Silvae Genet. 2022, 71, 20–30. [Google Scholar] [CrossRef] [Scilit]
- Knaus, B.J.; Grünwald, N.J. VCFR: A package to manipulate and visualize variant call format data in R. Mol. Ecol. Resour. 2017, 17, 44–53. [Google Scholar] [CrossRef] [Scilit]
- Nei, M. Analysis of gene diversity in subdivided populations. Proc. Natl. Acad. Sci. USA 1973, 70, 3321–3323. [Google Scholar] [CrossRef] [Scilit]
- Nei, M. F-Statistics and analysis of gene diversity in subdivided populations. Ann. Hum. Genet. 1977, 41, 225–233. [Google Scholar] [CrossRef] [Scilit]
- Manichaikul, A.; Mychaleckyj, J.C.; Rich, S.S.; Daly, K.; Sale, M.; Chen, W.M. Robust relationship inference in genome-wide association studies. Bioinformatics 2010, 26, 2867–2873. [Google Scholar] [CrossRef] [Scilit] [PubMed]
- Zheng, X.W.; Levine, D.; Shen, J.; Gogarten, S.M.; Laurie, C.; Weir, B.S. A high-performance computing toolset for relatedness and principal component analysis of SNP data. Bioinformatics 2012, 28, 3326–3328. [Google Scholar] [CrossRef] [Scilit] [PubMed]
- Jombart, T. adegenet: A R package for the multivariate analysis of genetic markers. Bioinformatics 2008, 24, 1403–1405. [Google Scholar] [CrossRef] [Scilit] [PubMed]
- Ginestet, C. ggplot2: Elegant Graphics for Data Analysis. J. R. Stat. Soc. Ser. A Stat. Soc. 2011, 174, 245. [Google Scholar] [CrossRef] [Scilit]
- Frichot, E.; Mathieu, F.; Trouillon, T.; Bouchard, G.; François, O. Fast and efficient estimation of individual ancestry coefficients. Genetics 2014, 196, 973–983. [Google Scholar] [CrossRef] [Scilit]
- Frichot, E.; François, O. LEA: An R package for landscape and ecological association studies. Methods Ecol. Evol. 2015, 6, 925–929. [Google Scholar] [CrossRef] [Scilit]
- Tóth, E.G.; Köbölkuti, Z.A.; Pedryc, A.; Höhn, M. Evolutionary history and phylogeography of Scots pine (Pinus sylvestris L.) in Europe based on molecular markers. J. For. Res. 2017, 28, 637–651. [Google Scholar] [CrossRef] [Scilit]
- Kastally, C.; Tyrmi, J.S.; Bastien, C.; Cervera, M.T.; Vendramin, G.G.; Savolainen, O.; Pyhäjärvi, T. Tracing Scots pine expansion in Europe using patterns of rare alleles. Ecol. Evol. 2025, 15, e72433. [Google Scholar] [CrossRef] [Scilit]
- Iwaizumi, M.G.; Mukasyaf, A.A.; Tamaki, I.; Nasu, J.; Miyamoto, N.; Tamura, M.; Watanabe, A. Genetic diversity and structure of seed pools in an old planted Pinus thunbergii population and seed collection strategy for gene preservation. Tree Genet. Genomes 2023, 19, 9. [Google Scholar] [CrossRef] [Scilit]
- Neuwirthová, E.; Stejskal, J.; Lhotáková, Z.; Korecky, J.; Cepl, J.; Nikodem, A.; Panzarová, K.; Albrechtová, J.; Lstiburek, M. Drought response and genetic variation in Scots pine seedlings’ provenances: Insights from high-throughput phenotyping for climate-resilient forestry. Evol. Appl. 2025, 18, e70157. [Google Scholar] [CrossRef] [Scilit]
- Perry, A.; Wachowiak, W.; Beaton, J.; Iason, G.; Cottrell, J.; Cavers, S. Identifying and testing marker-trait associations for growth and phenology in three pine species: Implications for genomic prediction. Evol. Appl. 2022, 15, 330–348. [Google Scholar] [CrossRef] [Scilit]
- Provazník, D.; Stejskal, J.; Lhotáková, Z.; Cepl, J.; Neuwirthová, E.; Nofrizal, A.Y.; Korecky, J.; Cervená, L.; Kupková, L.; Klápste, J.; et al. Needle- and canopy-level genetic variation in Scots pine (Pinus sylvestris L.) revealed by hyperspectral phenotyping across sites and seasons. Evol. Appl. 2025, 18, e70176. [Google Scholar] [CrossRef] [Scilit]
- Taeger, S.; Sparks, T.H.; Menzel, A. Effects of temperature and drought manipulations on seedlings of Scots pine provenances. Plant Biol. 2015, 17, 361–372. [Google Scholar] [CrossRef] [Scilit]

Disclaimer/Publisher’s Note: The statements, opinions and data contained in all publications are solely those of the individual author(s) and contributor(s) and not of MDPI and/or the editor(s). MDPI and/or the editor(s) disclaim responsibility for any injury to people or property resulting from any ideas, methods, instructions or products referred to in the content. |
© 2026 by the authors. Licensee MDPI, Basel, Switzerland. This article is an open access article distributed under the terms and conditions of the Creative Commons Attribution (CC BY) license.