


Abstract
In response to the challenges of low detection efficiency, high omission rate in small target detection and high model complexity in wood surface defect detection, this study proposes a lightweight detection model based on YOLO, which integrates a dual-path integrated attention network (DFA-Net). The model is built on the enhanced YOLOv5 framework and achieves a balance of accuracy and efficiency through the collaborative optimization of multiple modules. Specifically, this paper designs a dual-path downsampling convolutional module (DP-DCM), combining wavelet transform with dual-path feature fusion to improve multi-scale feature extraction capabilities while reducing the number of parameters. Next, a fusion attention module (FAM) is designed to dynamically focus on defect features in complex backgrounds through channel and spatial attention mechanisms. Furthermore, a focal modulation network (FMNet) is introduced to enhance the robustness of the augmentation model in detecting small defects. Finally, the NWD Loss function is used to mitigate the localization bias of small targets. Experimental results show that the improved model achieves a 92.8% mAP rate on five types of defect datasets (dead knots, live knots, cracks, notches, and marrow). Compared with the baseline model, YOLOv5s, the performance of this model has been improved by 6.5%. The model runs at a detection speed of 105 FPS, and the number of parameters is only 5.8 million, which is better than models such as YOLOv8 and YOLOv9-t. While maintaining a lightweight design, this method achieves high precision and real-time performance on a consumer-grade GPU platform, indicating its practical applicability in automated wood inspection scenarios. The proposed approach provides an efficient solution for intelligent wood sorting, contributing to improved wood utilization and enhanced processing automation.
1. Introduction
Wood is a renewable material widely found in nature, which is widely used in architecture, furniture and various handicrafts. However, due to the influence of factors such as light, soil quality, humidity and climate, trees may grow unevenly, resulting in natural defects. In addition, pests and diseases can also affect the health of trees, causing defects such as decay [1]. Different tree species also have different growth characteristics, and some tree species are more prone to wood cracking, joint scarring or deformation. With the rapid development of the wood processing industry, the demand for wood has increased significantly. Wood defect detection is a key step before processing. Historically, visual detection has always been the main method, but this method has a low defect identification rate and poor detection efficiency, resulting in a large amount of waste of wood resources. Therefore, improving the technology of wood defect detection is an urgent problem to be solved.
Non-destructive testing methods are often used for defect detection [2]. With the development of automation and intelligent systems, researchers have applied a variety of technologies to wood defect detection, including ultrasonic detection [3], stress wave detection [4,5,6], X-ray detection [7] and infrared thermal imaging [8]. However, these methods are often affected by environmental factors and require expensive equipment and professional operators. In addition, the test results may not meet the standards required for industrial production, resulting in poor cost-effectiveness and limited practical application.
With the development of computer technology, more and more researchers are beginning to use computer vision and deep learning methods to explore the field of object recognition. Among them, visual transformers (ViTs) and target detection algorithms based on convolutional neural networks (CNNs) show particularly significant potential. Models such as Adavit [9], CrossVit [10] and DETR [11] perform well in tasks such as traffic sign recognition and medical image classification. However, these models usually require longer training time and have poor real-time performance, so they are not suitable for defect detection tasks that require rapid processing. In contrast, target detection algorithms based on convolutional neural networks (CNNs) have been continuously improved and have become the mainstream method in the field of defect detection. Notable examples include regression-based single-stage detection algorithms, such as the YOLO series [12], SSD [13] and EfficientDet [14]. In addition, two-stage detection algorithms that rely on candidate boundary boxes, such as Fast R-CNN [14], Faster R-CNN [15] and Cascade R-CNN [16], have also been widely used. Gao et al. [17] proposed the ResNet-18 model based on ResNet [18], which improved the detection accuracy and convergence speed of certain wood defects. However, its high model complexity requires strong computing support, which limits its application in resource-limited environments. Kato et al. [19] used ResNet50-CNN to classify cross-sectional images of unpainted wood, which achieved high classification accuracy and improved the efficiency and accuracy of wood evaluation. Nevertheless, further improvement is needed, especially in terms of light adaptability, complex scene handling and practical application. Ye et al. [20] proposed the WCU-Net model, which combines the position attention mechanism (PAM) and the feature enhancement mechanism (FEM) to highlight the crack position and enhance the detection of tiny cracks. Despite these advances, detecting complex backgrounds and tiny cracks remains a challenging task. Wang et al. [21] proposed a BPN-YOLO model based on YOLOv7, which has achieved significant performance improvements in wood defect detection. However, due to the introduction of the BiFormer attention mechanism, the model still faces challenges such as increased model complexity and slower detection speed. Similarly, An et al. [22] proposed the CWB-YOLOv8 model, which improved the performance of defect detection, but the computational complexity increased, resulting in a slightly longer processing time than the original YOLOv8 algorithm. Zheng et al. [23] proposed the GBCD-YOLO model, which integrates the Ghost Bottleneck and BiFormer modules. However, the model has limitations such as low detection accuracy, high computational complexity and difficulty in detecting small targets. Meng et al. [24] developed SGN-YOLO, which is an improved version of YOLOv5, introducing technologies such as the semi-global network (SGN) and extended high-efficiency layer aggregation network (E-ELAN), thus improving the accuracy and efficiency of wood defect detection. Kong et al. [25] improved accuracy by using empty frequency domain fusion. Despite these advances, the model still has room for improvement, and its performance may still be limited, especially in detecting very small defects. In addition, the introduced modules (such as SGN and E-ELAN) may increase the complexity and computing costs of the model, thus posing a potential challenge to the deployment of resource-limited embedded devices.
In summary, although wood surface defect detection algorithms have made remarkable progress, there are still some urgent challenges to be solved, such as poor real-time performance, high model complexity, and limited detection accuracy of minor defects in complex contexts. In order to overcome these challenges, this study specifically designed an improved YOLOv5s model based on the dual-path fusion attention network (DFA-Net). The optimization of the model structure aims to reduce computational complexity, improve real-time performance, and enhance the detection ability of minor defects in complex contexts. The integration of multiple detection methods and the improvement of the attention mechanism have further enhanced the robustness of the model. The following are the improvements made to the model.
A lightweight dual-path sampling convolution module (DP-DCM) is designed, which reduces model parameters while maintaining accuracy, improves computing efficiency, and ensures real-time performance.
A fusion attention module (FAM) is created to effectively improve the detection accuracy, calculation efficiency and model robustness, so that the model is suitable for real-world wood quality control applications.
The lightweight focal modulation network (FMNet) is introduced, which improves the model’s generalization ability and enhances detection performance for different defect sizes.
We modified the loss function to NWD Loss, enhanced small target detection, accelerated convergence speed, and improved performance in complex environments.
2. Materials and Methods
2.1. Datasets and Preprocessing
We integrated an open wood defect dataset from Kaggle, Google’s world-leading data science community, and datasetninja, a platform dedicated to dataset discovery, to build a new wood defect dataset with 3000 images. The dataset mainly consists of softwood species commonly used in industrial production. To avoid any overlap between the training, validation, and test sets, we first randomly split the original 3000 images into training, validation, and test sets following an 8:1:1 ratio, resulting in 2400, 300, and 300 images, respectively. Subsequently, we applied a variety of image enhancement techniques—including lighting change, noise injection, occlusion simulation, rotation, cropping, translation and horizontal/vertical flipping—to enrich the training set. This augmentation expanded the training set to 14,400 images, while the validation and test sets remained unchanged at 300 images each, yielding a total dataset of 15,000 images. Importantly, all augmented versions derived from the same original image were confined to the training partition, thereby eliminating any risk of near-duplicate images appearing across different splits. The image resolution is 2800 × 1024 pixels, containing a total of 25,370 examples of defects (see Table 1 for details). The original images have a resolution of 2800 × 1024 pixels, while the model requires a square input size of 640 × 640. To meet this requirement, we adopted a direct resizing strategy, which compresses the horizontal dimension from 2800 to 640 pixels. Although this approach inevitably leads to information loss for extremely fine defects—particularly those with an original area smaller than 10 pixels, which are reduced to less than 2 pixels after resizing—our experimental results show that the impact on detection performance remains acceptable. Using YOLOv5 as the baseline detector, we achieved a recall of 85.2% for these extremely small defects, only slightly lower than that for larger defects. We attribute this to the preservation of global contextual information provided by direct resizing, which helps compensate for the loss of fine details. As an alternative, we considered a sliding window tiling strategy to preserve original resolution; however, this approach was ultimately rejected due to issues such as missed detections of defects crossing tile boundaries, reduced inference speed, and loss of local context. In future work, we will explore methods such as adaptive resolution scaling or variable-size positional encoding to preserve details while maintaining end-to-end inference efficiency. Defects are divided into five categories, as shown in Figure 1: dead knots, live knots, cracks, notches and marrow. To facilitate analysis, we define small targets as defects with an original pixel area of less than 32 × 32 pixels (i.e., 1024 pixels). According to our statistics, such small defects account for approximately 18.7% of all defect instances, most of which are dead knots and live knots. It is worth noting that after direct resizing to 640 × 640, these defects are further compressed; for example, defects with an original area of less than 10 pixels are reduced to less than 2 pixels. Despite this extreme compression, our detector maintained reasonable recall on these instances, as discussed above. In order to make an accurate evaluation, we used the LabelImg tool to annotate the dataset. In addition, in order to facilitate training, we converted the annotation data from TXT files to XML files in VOC (Visual Object Class) format. After the conversion was completed, we used the VOC format dataset representing various wood surface defects for follow-up experiments.
Table 1.
The type and number of surface defects in wood.
Figure 1.
Types of wood defects.
2.2. Overview of the YOLOv5 Algorithm
The YOLO (You Only Look Once) algorithm is widely recognized for its high efficiency, high precision and lightweight architecture and is one of the most popular target detection algorithms at present. YOLOv5 was released by the Ultralytics team in 2020. It is an important version of the YOLO series and contains four different variants. Among them, YOLOv5s achieves the best balance between model compactness and accuracy, making it very suitable for resource-limited environments or application scenarios that require real-time reasoning.
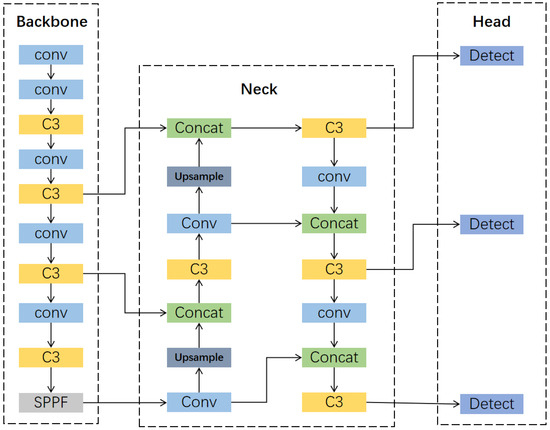
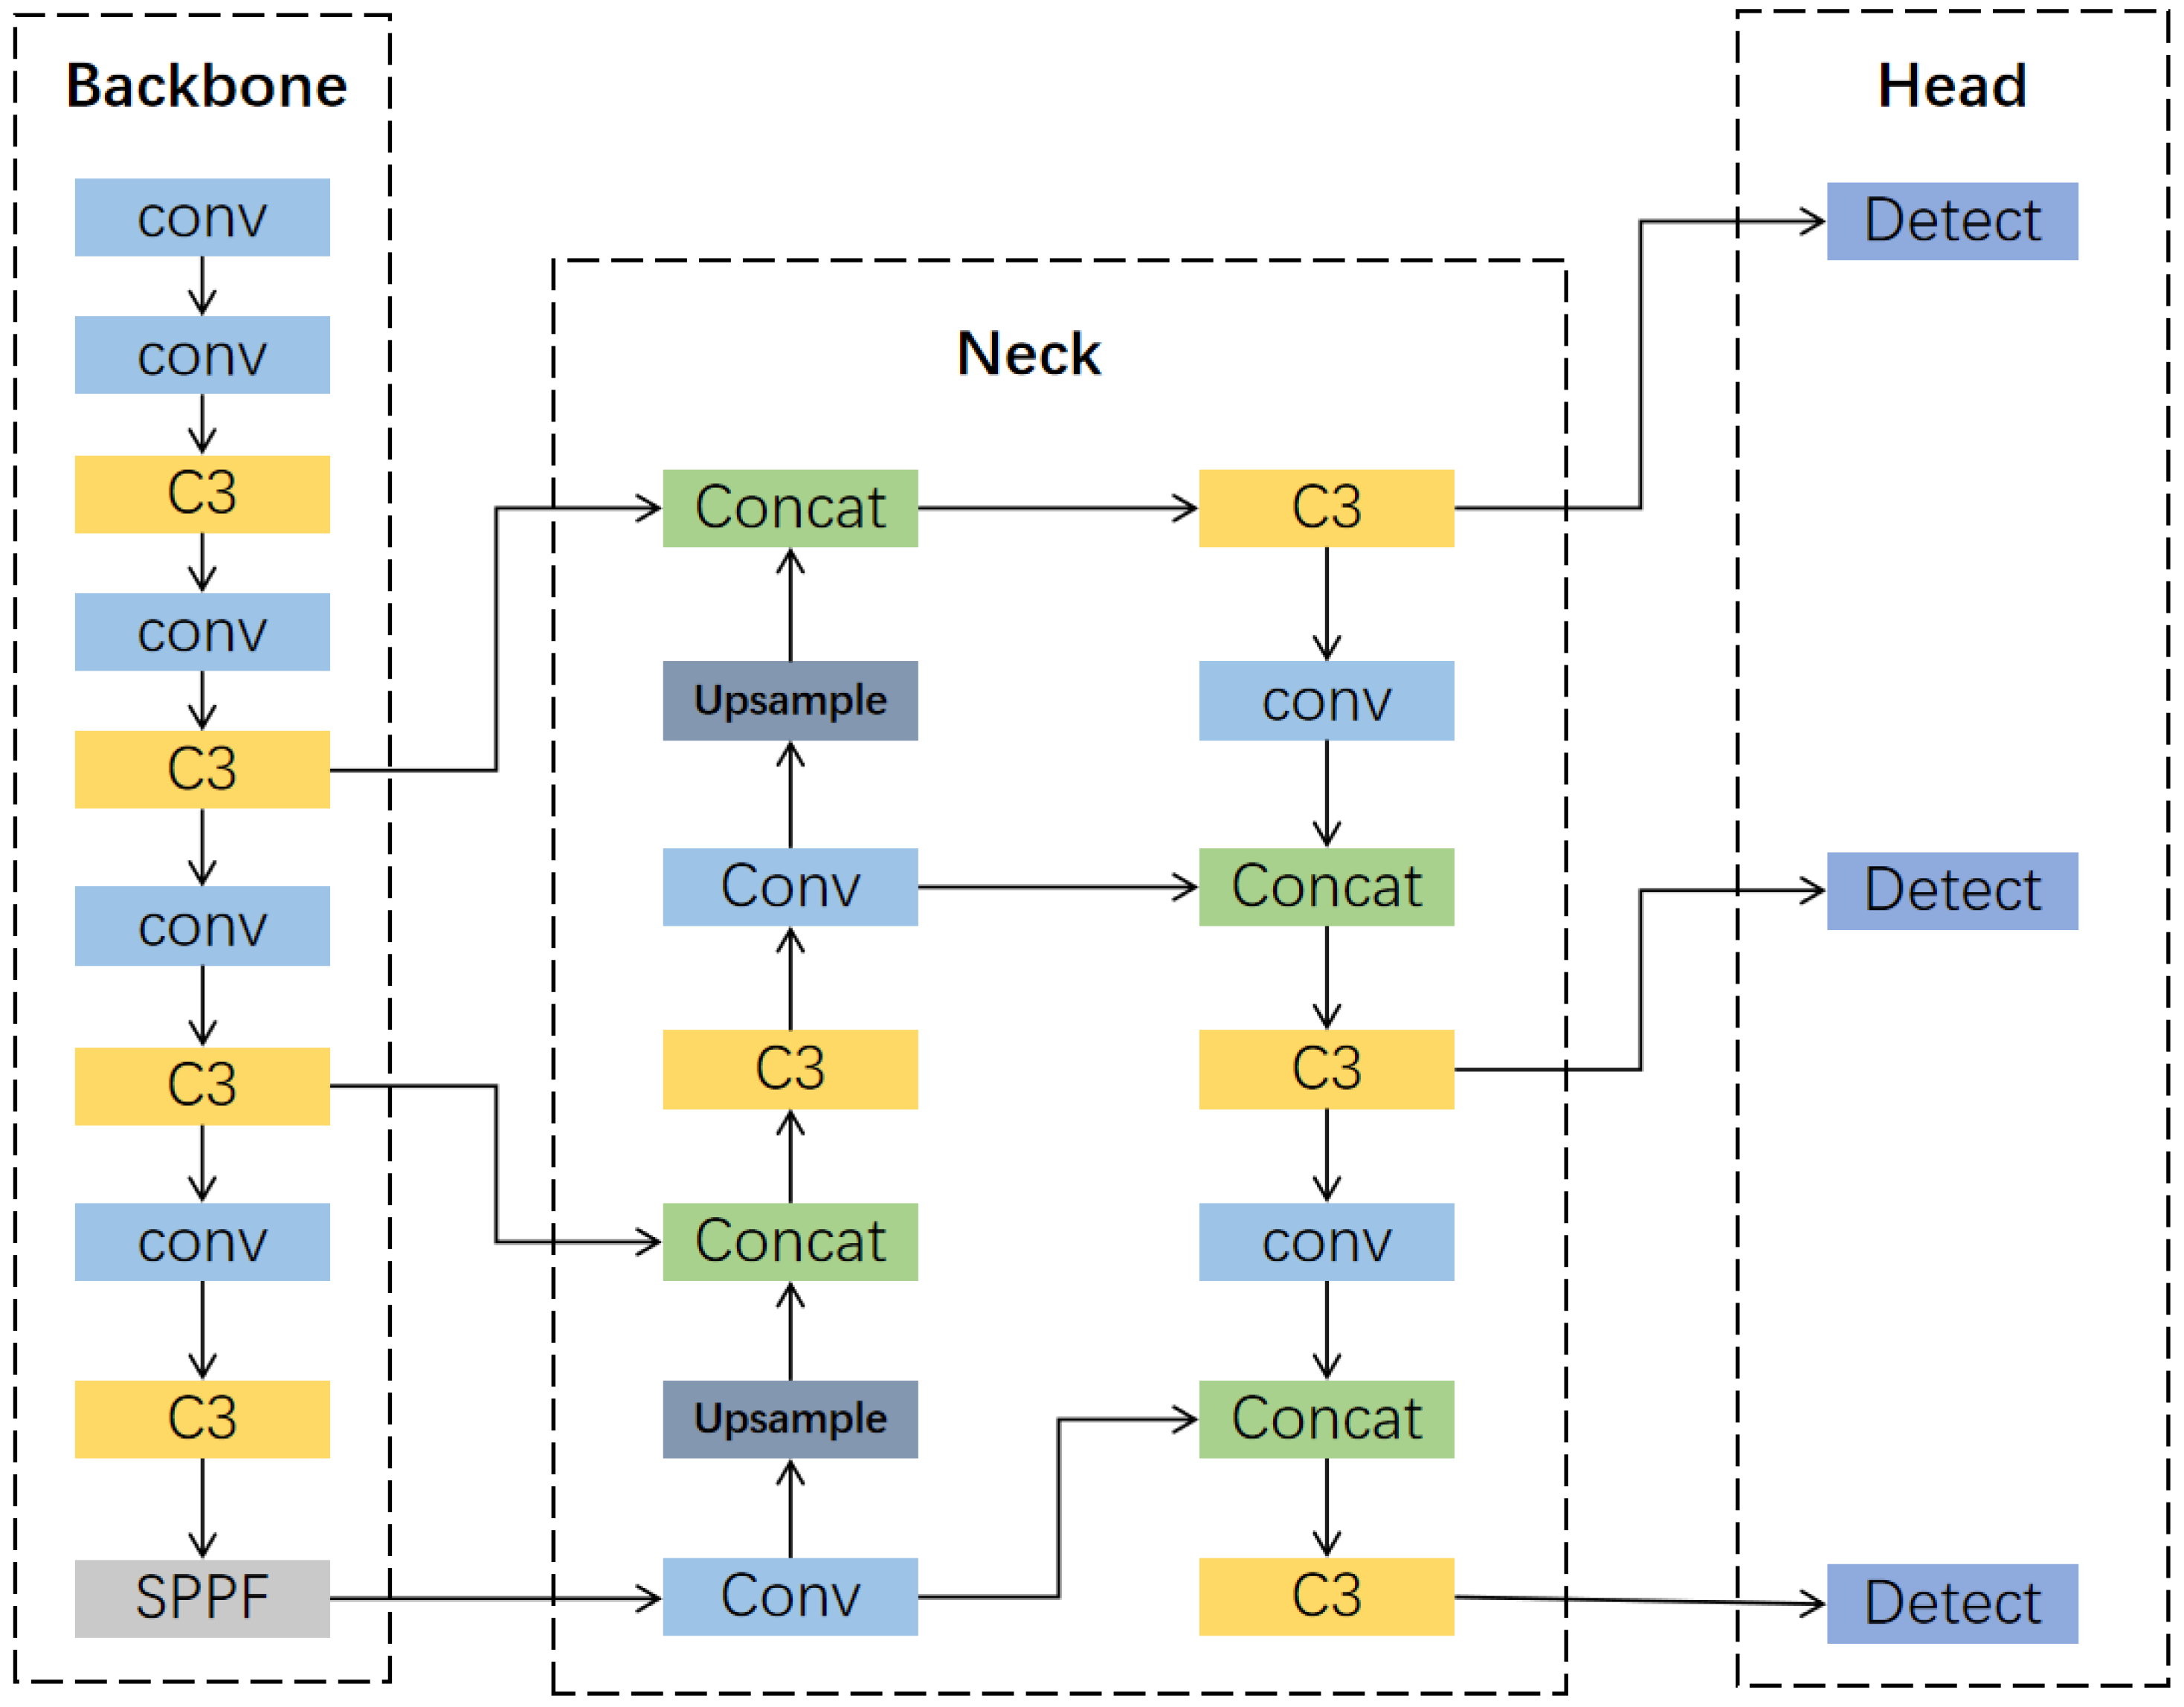
This study chose YOLOv5s as the baseline model. The YOLOv5s architecture is divided into five parts: input, backbone, neck, head and output, as shown in Figure 2. This modular design can effectively carry out feature extraction, information fusion and target detection. The backbone network adopts CSPNet (cross-stage partial network) to reduce the computing volume and improve the feature representation ability through cross-stage feature reuse. The neck uses FPN (feature pyramid network) for feature fusion and multi-scale information processing, thus enhancing the ability to detect small targets. The head is responsible for classification and boundary box regression, and it outputs the probability, boundary box coordinates and confidence of each target category. In addition, the CIoU (complete intersection ratio) loss function is also used to improve the accuracy of boundary box regression.
Figure 2.
YOLOv5s network structure.
The original YOLOv5s model contains a large number of convolutional layers, and each convolutional layer has a large number of parameters, resulting in high computational complexity and high memory requirements. These challenges limit the performance of the model in actual industrial applications, and efficiency is crucial in actual industrial applications.
2.3. An Improved YOLO Model Integrated with DFA-Net
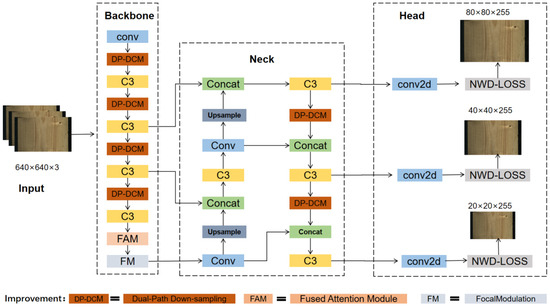
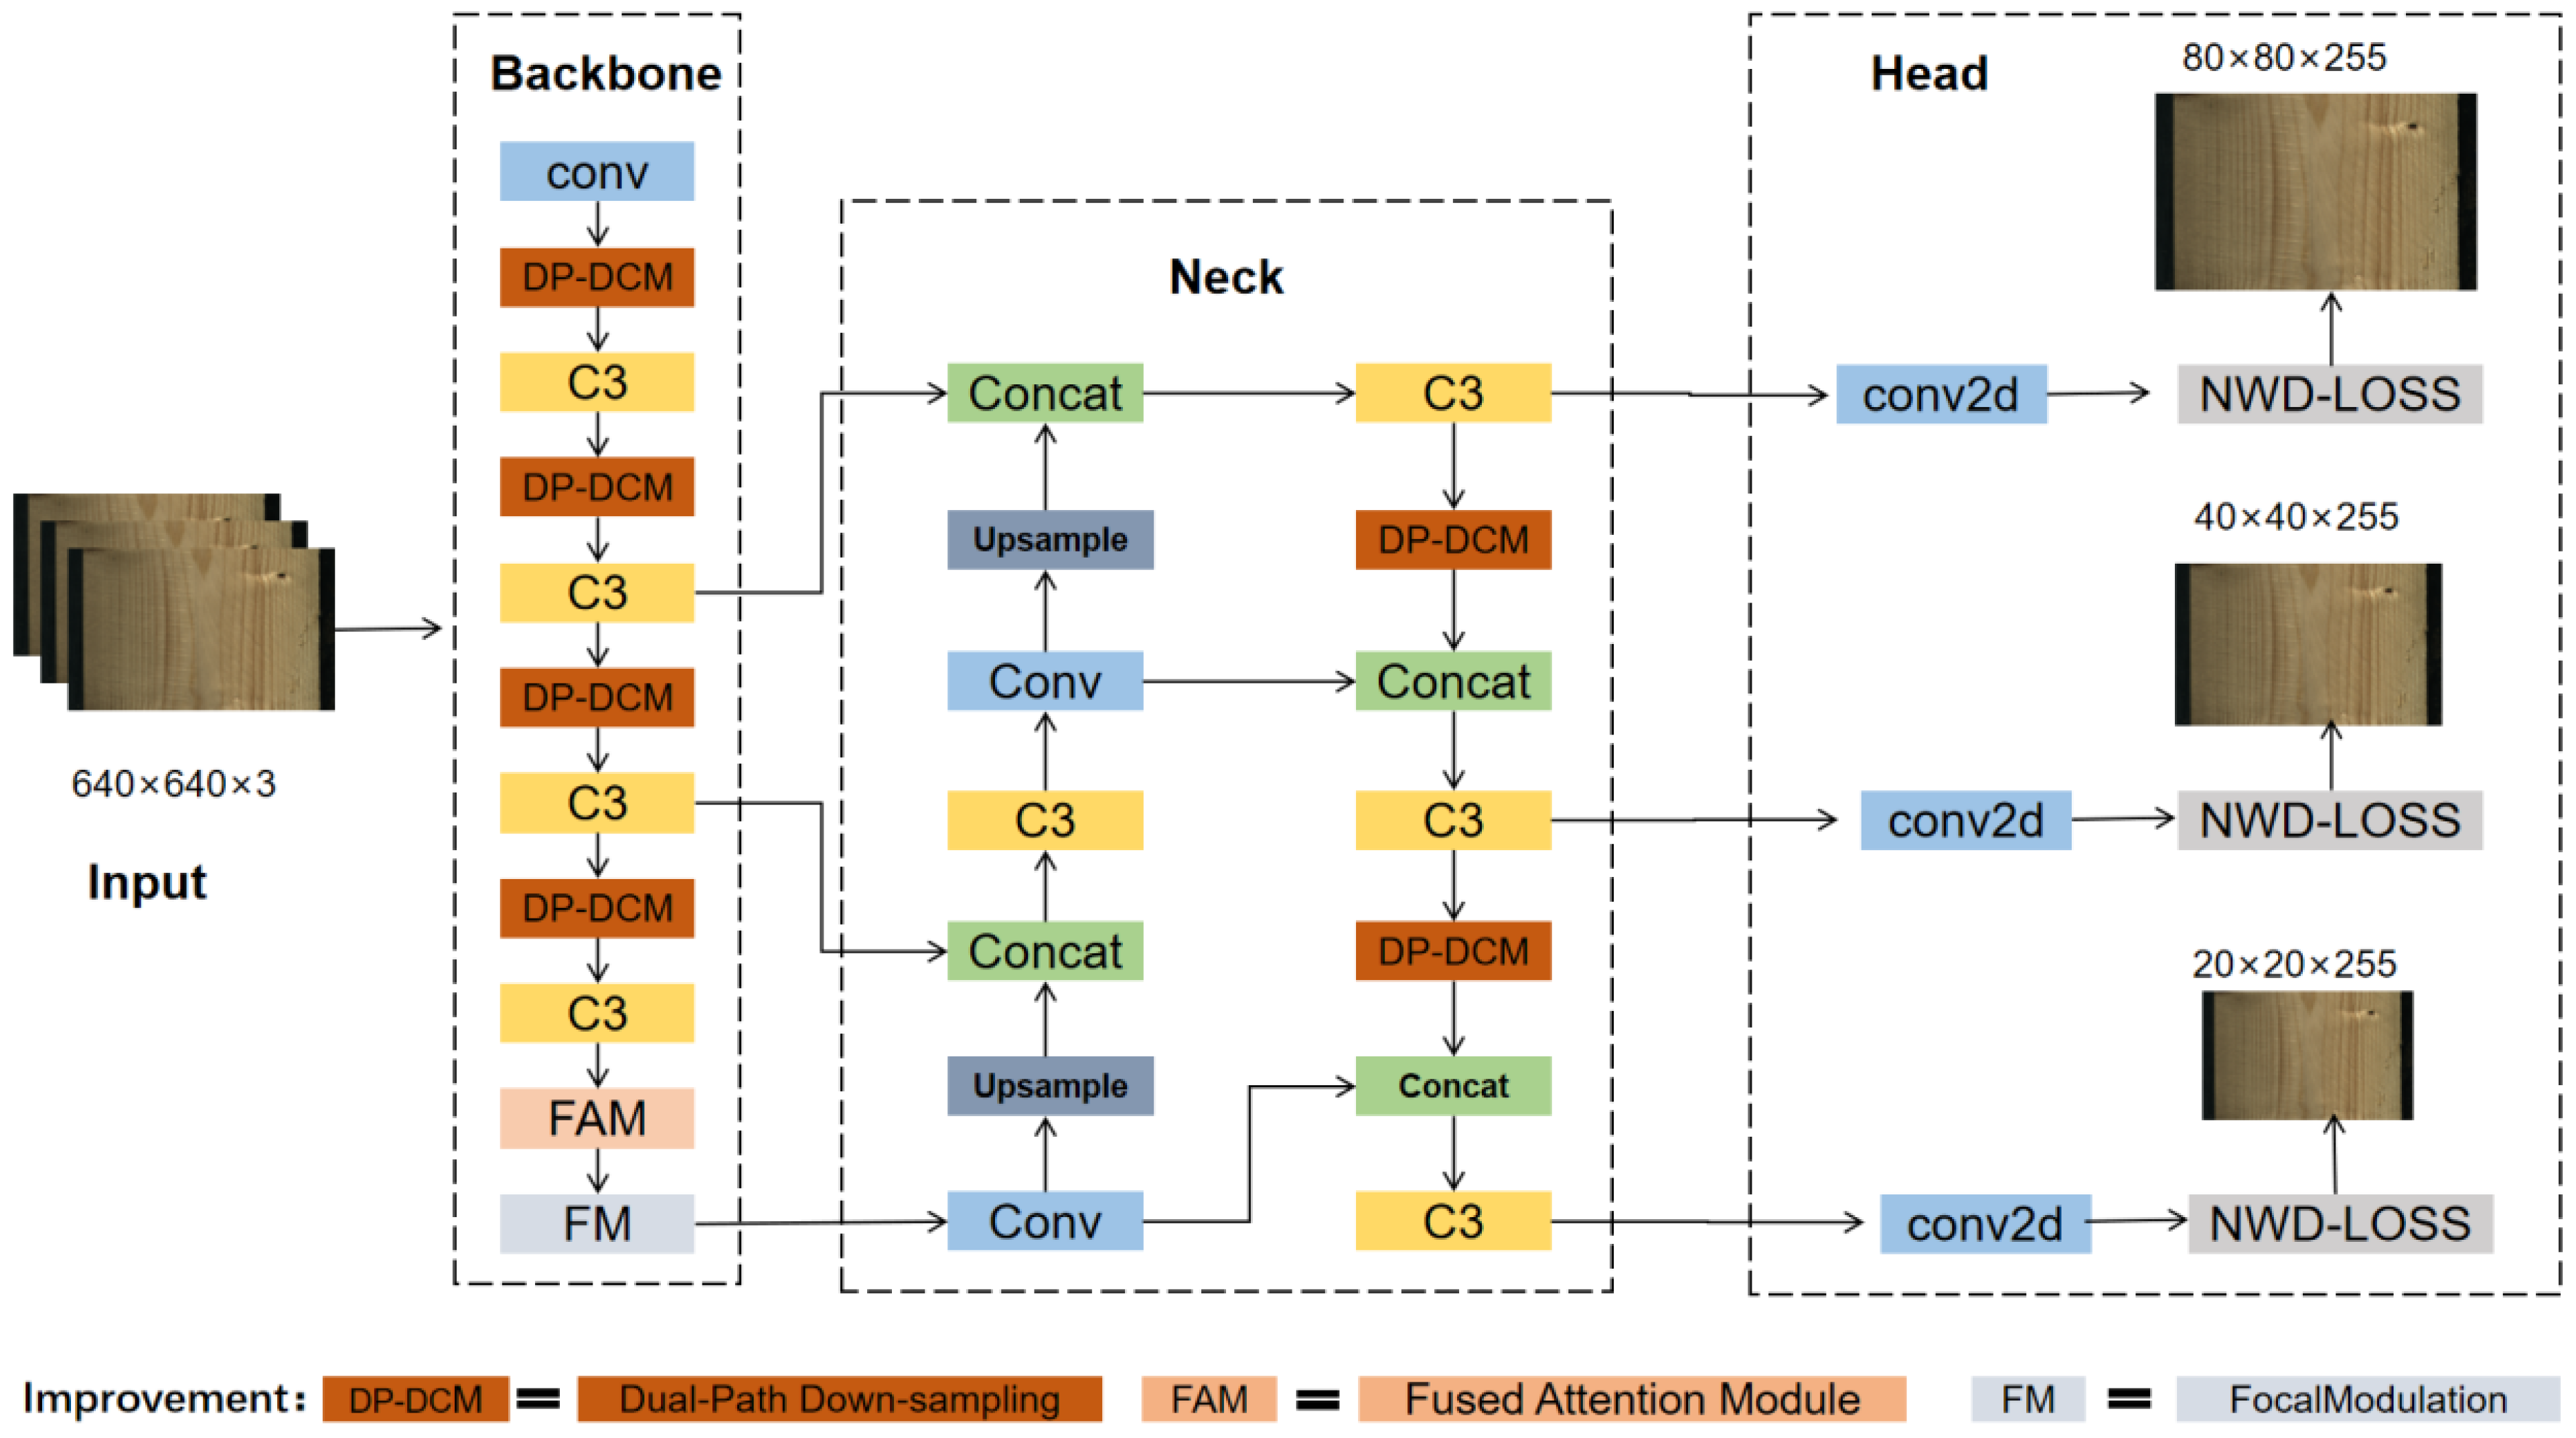
In view of the problems of low detection efficiency, high omission rate of small target detection and high model complexity in YOLOv5 in wood surface defect detection, this study proposes an improved YOLO model, which integrates the dual-path fusion attention network (DFA-Net) (Figure 3). In this detection model, the input image size is 640 × 640 × 3. The backbone network consists of a convolutional layer (Conv), a dual-path sampling convolution module (DP-DCM), a C3 module, a fusion attention module (FAM) and a focal modulation module (FMNet). Image features are gradually extracted and refined through the network and then processed by FAM and FMNet to obtain enhanced feature representation. The neck integrates multi-scale features through Upsample, Conv, Concat and C3 modules, of which DP-DCM generates a feature pyramid. Finally, the head component generates prediction results of different resolutions (80 × 80 × 255, 40 × 40 × 255 and 20 × 20 × 255) for small, medium and large targets, respectively. These components, especially DP-DCM, FAM and FMNet, are key improvements that significantly improve the accuracy of feature extraction and detection.
Figure 3.
Dual-path fused attention network.
2.3.1. Dual-Path Downsampling Convolution Module
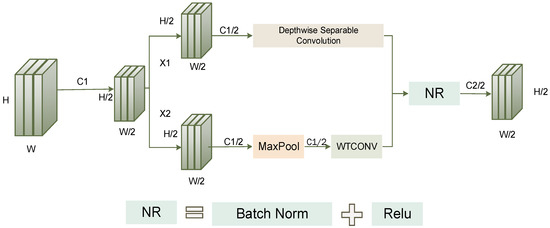
The dual-path downsampling convolution module (DP-DCM) is a specially designed component to enhance the downsampling process, which is essential for detecting complex wood surface defects. It adopts the dual-path feature separation–merge mechanism and wavelet transform convolution, which significantly improves the detection performance. As shown in Figure 4, DP-DCM first uses average pooling to reduce the spatial dimension of the feature map, thus reducing the calculation volume of subsequent layers and reducing the risk of overfitting. Then, it divides the channel into two equal parts: x1 and x2.
Figure 4.
Dual-path downsampling convolution module.
The x1 path is deeply convolved to reduce the number of parameters while maintaining the spatial resolution of the feature map. This process is mainly used to capture extreme local features.
The x2 path is maximized to extract significant features by selecting the maximum value in each local area. This makes the model robust to small offsets and deformations. After pooling, wavelet convolution (WTConv) is used to extract local image features of different scales. The WTConv branch adopts the Haar wavelet as the basis function to perform a one-level discrete wavelet transform (DWT), decomposing the input feature map into four sub-bands, the low-frequency approximation component (LL), the horizontal detail component (LH), the vertical detail component (HL), and the diagonal detail component (HH), each with half the spatial resolution of the original feature map. Subsequently, a 3 × 3 depthwise convolution (consistent with the original depthwise kernel size) is applied to each sub-band independently, followed by an inverse discrete wavelet transform (IDWT) to reconstruct the feature map to its original resolution. The wavelet filter coefficients are fixed and not involved in training, ensuring the determinism of the transform and the lightweight design of the module. This branch operates in parallel with the average pooling and max pooling branches on partitioned input features, and the outputs are concatenated to fuse multi-scale information. By leveraging the multi-resolution analysis capability of wavelets, the module enhances the model’s sensitivity to high-frequency details (e.g., subtle cracks) while maintaining computational efficiency.
The output of dual-path convolution is followed by normalization and ReLU activation function processing, which helps the model to accelerate training and learn more complex feature representation. Finally, two characteristic paths are spliced together to ensure that the model can make full use of the information of different scales to improve the detection accuracy, especially for the detection effect of small or irregular defects.
2.3.2. Fusion Attention Module
The original YOLOv5s model contains a large number of convolutional layers, and each convolutional layer has a large number of parameters, resulting in high computational complexity and high memory requirements. These challenges limit the performance of the model in actual industrial applications, as efficiency is crucial in actual industrial applications.
In wood defect detection, defects often show different characteristics in different channels and spatial locations. For example, wood cracks may show a higher response in some channels, while they may show a weaker response in other channels. Similarly, there may be significant differences in the spatial position and shape of cracks, presenting a unique pattern, thus increasing the difficulty of detection.
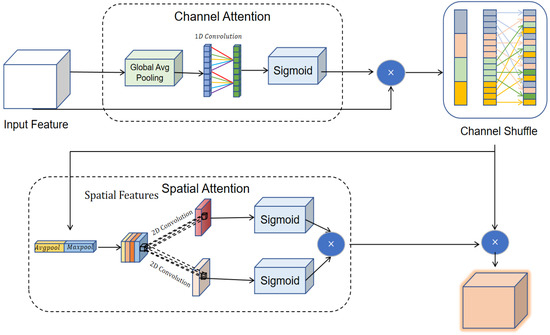
The dual attention mechanism in FAM effectively solves the problem of suppressing defect characteristics caused by complex wood grain, as shown in Figure 5. Spatial attention focuses on the priority treatment of defect areas, while channel attention inhibits irrelevant feature maps. This dual priority mechanism ensures that the model can focus on the most prominent features while filtering out noise and irrelevant information, thus significantly improving the accuracy of defect detection.
Figure 5.
Fused attention module (FAM).
By adopting one-dimensional and two-dimensional convolution, the FAM module can effectively model channel and spatial features with fewer parameters, thus ensuring computing efficiency. The lightweight design of this module makes it very suitable for deployment in resource-limited environments, such as real-time wood defect detection systems.
2.3.3. Focal Modulation Networks
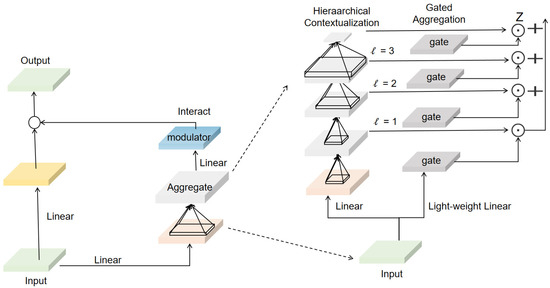
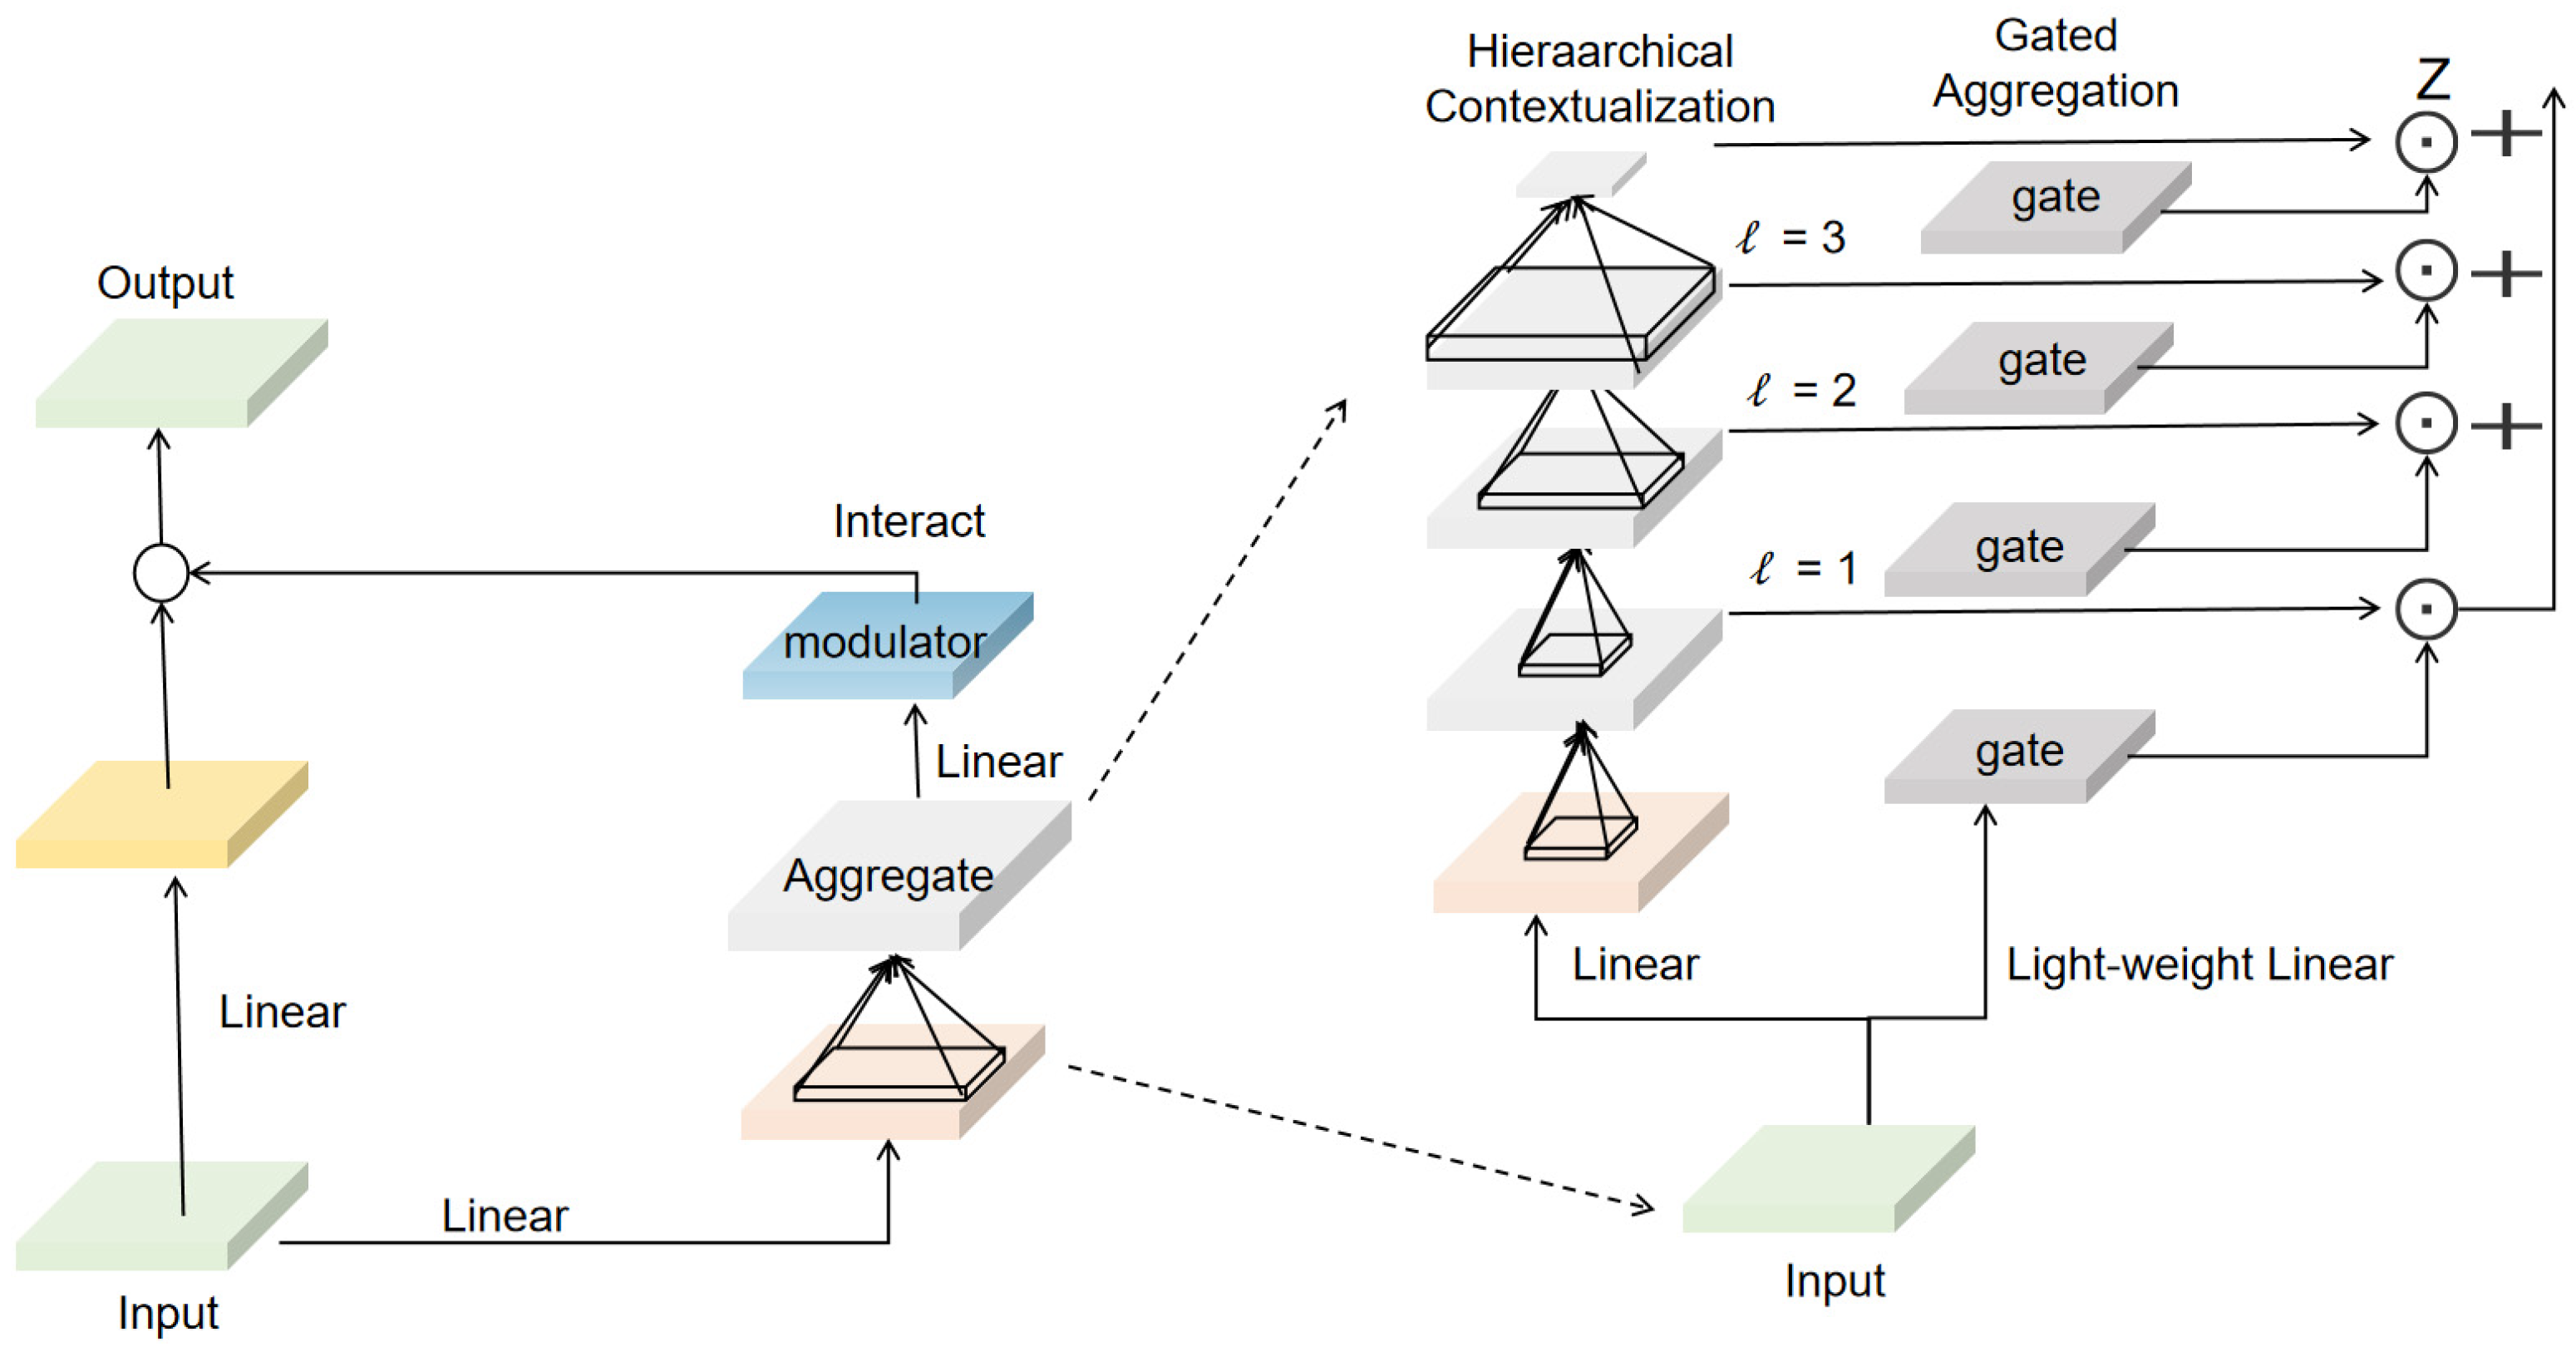
As shown in Figure 6, the focal modulation network (FMNet) introduces a module for performing spatial feature modulation and aggregation. This module can achieve multi-scale information fusion and deep separable convolution, thus enhancing the model’s ability to capture long-range dependencies and contextual information, which is much more efficient than the traditional self-attention mechanism. By dynamically focusing on multi-scale features and decoupling texture and defect features, FMNet significantly improves the detection accuracy of wood surface defects.
Figure 6.
The structure of focal modulation.
FMNet’s lightweight design and robustness to light changes make it ideal for industrial wood sorting systems. The model uses layered convolutional cores of different sizes (3 × 3, 5 × 5, 7 × 7) to deal with defects of different scales, from small cracks to large decay areas. Specifically, small-sized convolutional kernels are used to detect tiny targets such as knots, medium-sized convolutional kernels are used to identify extensions of cracks, and large-sized convolutional kernels cover a wider range of color changes. The multi-scale dynamic focus mechanism enables the model to better distinguish between defects and complex background textures.
In addition, the high computing efficiency of the focal modulation network can reduce parameters and speed up the processing speed, making it suitable for real-time wood defect detection, especially for resource-limited scenarios. Its ability to integrate local and global features enhances the model’s perception of defects on different scales, thus improving the detection accuracy. In summary, the focal modulation network is efficient, adaptable and reliable, suitable for various wood defect detection tasks. While providing excellent performance, it can also effectively save computing resources.
2.3.4. NWD Loss Function
The YOLOv5s framework usually adopts the complete intersection ratio (CIoU) loss function, which quantifies the alignment of the boundary box through the intersection ratio (IoU) index. For small targets (for example, objects spanning dozens of pixels), a small positioning deviation will cause the IoU value to fluctuate sharply (for example, from 0.9 to 0.2), resulting in gradient instability and poor model optimization.
To overcome this limitation, the normalized Wasserstein distance (NWD) models [26] bounding boxes as Gaussian distributions and quantifies their similarity by computing the distribution distance between predicted and ground-truth boxes. Even with a small target position deviation, NWD can provide smoother loss feedback, effectively alleviate gradient mutations, and achieve more accurate positioning optimization.
The NWD Loss is a loss function based on the normalized Wasserstein distance metric, specifically designed for small object detection. In wood defect detection applications, replacing CIoU Loss with NWD Loss offers distinct advantages. First, NWD Loss demonstrates superior detection capabilities for small targets, which is critical for identifying subtle defects in wood materials. These defects are typically characterized by small sizes and irregular geometries, scenarios where NWD Loss outperforms traditional approaches. Second, NWD Loss exhibits scale invariance and reduced sensitivity to positional shifts. This ensures robust similarity measurements between non-overlapping and non-nested bounding boxes, even when positional offsets exist between predictions and ground truths.
Furthermore, NWD Loss excels in label assignment and postprocessing stages by supplying higher-quality training samples for small targets and maintaining accurate screening and fusion of these targets during postprocessing. In contrast, CIoU Loss exhibits insufficient sensitivity to small targets and instability when handling detection boxes with imbalanced aspect ratios, ultimately compromising model convergence and performance. Replacing CIoU Loss with NWD Loss enhances detection accuracy for small targets and improves model generalization, achieving more stable and precise performance in wood defect detection tasks. The mathematical derivation of the NWD Loss function proceeds as follows:
① Gaussian distribution modeling of bounding boxes
A horizontal bounding box , where , w, and h represent the center coordinates, width, and height, respectively, can be modeled as a two-dimensional Gaussian distribution , where , are the mean vector and the covariance matrix of Gaussian distribution, respectively. Therefore, the similarity between two bounding boxes can be transformed into the distribution distance between two Gaussian distributions.
② Calculating the normalized Wasserstein distance
Given a predicted box and a ground-truth box following the two-dimensional Gaussian distribution and , respectively, the second-order Wasserstein distance between and is defined as:
where || · ||F represents the Frobenius norm.
Expanding Equation (1), we can obtain:
By normalizing the above equation to the range [0, 1] using its exponential form, a new metric called the normalized Wasserstein distance (NWD) is obtained:
where C is the normalization parameter, which needs to be adjusted according to the specific dataset. In this study, the normalization parameter C was set to 14.3 based on the average diagonal length of all 25,370 ground-truth bounding boxes in our dataset.
③ NWD Loss function formula
The NWD Loss function is defined as:
Implementation details.
The NWD Loss is implemented as a drop-in replacement for the box regression loss in YOLOv5s. During training, the gradient of with respect to the predicted box parameters is computed via automatic differentiation; the loss is well-behaved and numerically stable, as verified by the convergence curves in our experiments. No additional hyperparameter tuning was required beyond the selection of C.
Sensitivity of the normalization parameter C.
To assess the robustness of the chosen C = 14.3, we performed a sensitivity analysis by varying C by ±20% (i.e., C ∈ {11.44,14.3,17.16}) on the validation set. The resulting mAP@0.5 varied by less than 0.5% (e.g., 92.6% for C = 11.44 and 92.5% for C = 17.16), indicating that the NWD Loss is not highly sensitive to the exact value of C. Moreover, using C computed solely from the training set avoids any data leakage from the test set.
This loss function enhances the model’s sensitivity to the position and size of small targets, thereby improving detection performance.
3. Results
The experimental environment configuration is as follows: 32.00 GB memory, Intel Core i9-13900HX CPU (running frequency 2.2 GHz), and NVIDIA GeForce RTX 4060 Ti graphics card. The proposed model was implemented based on the Ultralytics YOLOv5 framework (version 8.2.35), with PyTorch 1.13.1 and CUDA 11.7.
The network was trained for 300 epochs with a batch size of 16 and an input image resolution of 640 × 640. The optimizer used was stochastic gradient descent (SGD) with momentum 0.937 and weight decay 0.0005. The initial learning rate was set to 0.01 and adjusted using a cosine annealing schedule with a warm-up phase of three epochs. During warm-up, the learning rate increased linearly from 0 to the initial value.
For data augmentation, Mosaic augmentation was applied with a probability of 1.0, MixUp with a probability of 0.15, random horizontal flipping with a probability of 0.5, and random HSV color space augmentation (hgain = 0.015, sgain = 0.7, vgain = 0.4). Scaling was performed within a range of 0.5–1.5, and translation was set to 0.1. No additional custom augmentation strategies were introduced to ensure fair comparison.
In order to evaluate the effectiveness of the enhanced model, this study selects the three key indicators of accuracy, efficiency and complexity. These indicators include classification accuracy (P), recall rate (R) (used to reflect missed inspection), average accuracy (AP) (measure of single-category detection ability), average accuracy mean (mAP) (measures the overall performance of multiple categories), frame rate (FPS) (quantifies real-time performance), model complexity parameters (parameters and floating-point operations) and the scale of the model. The intersection ratio (IoU) threshold is uniformly set to 0.5 to balance the detection sensitivity and false-alarm rate.
The following is a detailed introduction to the definition and calculation methods of these indicators, and their mathematical expressions correspond to Equations (5)–(10):
Among them, TP stands for true positive (correct test), FN stands for false negative (missed test), and FP stands for false positive (wrong test). P(R) is the exact rate function of the recall rate R at different confidence levels. AP represents the performance of the algorithm in a single-category classification. The higher the AP value, the better the performance of the algorithm. mAP is the average of the AP values of all categories C, which is used to measure the overall performance of algorithms in multi-class classification scenarios.
Network complexity is quantified by the parameters (Params) and the floating-point operations (FLOPs). The former depends on the dimension of the convolutional kernel, where “i”, “k”, and “o” represent input channels, the size of the convolutional kernel, and the output channels, respectively. FLOPs represent the computing efficiency of the algorithm network. The model scale is used to measure the weight of the algorithm. For frame rate (FPS) calculation, tN represents the reasoning time required for the algorithm to detect N-frame images.
These indicators are crucial for determining the weight and speed of the algorithm.
3.1. Ablation Experiments
In order to evaluate the effectiveness of the proposed architecture modification and loss design, a series of comparative and ablation experiments were carried out to evaluate the effectiveness of DFA-Net.
Under the same hardware configuration and hyperparameter settings, we carried out a systematic ablation study (named Group X) to quantify the contribution of each proposed module to the performance of wood defect detection. All variants are compared with the standard YOLOv5s baseline, and the results are shown in Table 2.
Table 2.
Results of an ablation experiment.
Compared with the original YOLOv5s model, the introduction of the dual-path sampling convolution module (DP-DCM) alone increases mAP0.5 by 0.6% (from 89.4% to 90.0%), and the parameters are reduced by 17.1% (from 7 million to 5.8 million), and the amount is reduced by 20.3% (from 15.8 G to 12.6 G). This shows that DP-DCM not only improves the efficiency of feature extraction but also helps to build a lighter architecture and reduce computing overhead.
When the fusion attention module (FAM) was introduced, mAP0.5 was further increased to 91.3%, an increase of 1.3%. At the same time, it did not increase the number of parameters or computational complexity. This indicates that the FAM effectively enhances the ability to extract defect-related features without adding extra burden to the network.
After integrating the focal modulation network (FMNet), the average accuracy (mAP0.5) was further increased to 92.5%; the reasoning speed was also significantly increased from 75 frames per second to 91 frames per second; and the frame rate was increased by 21.3%. This shows that the module enhances the context perception ability and detection response speed of the model, especially in complex visual scenarios.
Finally, replacing the conventional CIoU Loss with the NWD Loss function resulted in an additional 0.3% improvement in mAP0.5 (from 92.5% to 92.8%) and elevated the inference speed to 105 FPS, achieving a 15.4% speedup. This confirms that NWD Loss provides more stable gradient feedback for small target localization, further optimizing model convergence and real-time performance. Table 2 shows the complete experiment.
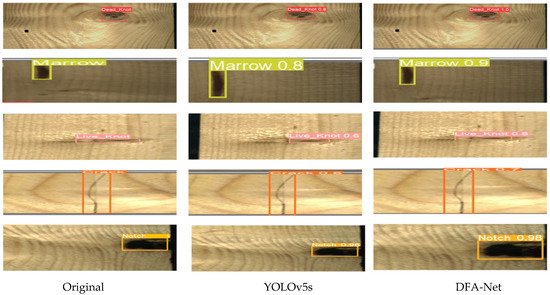
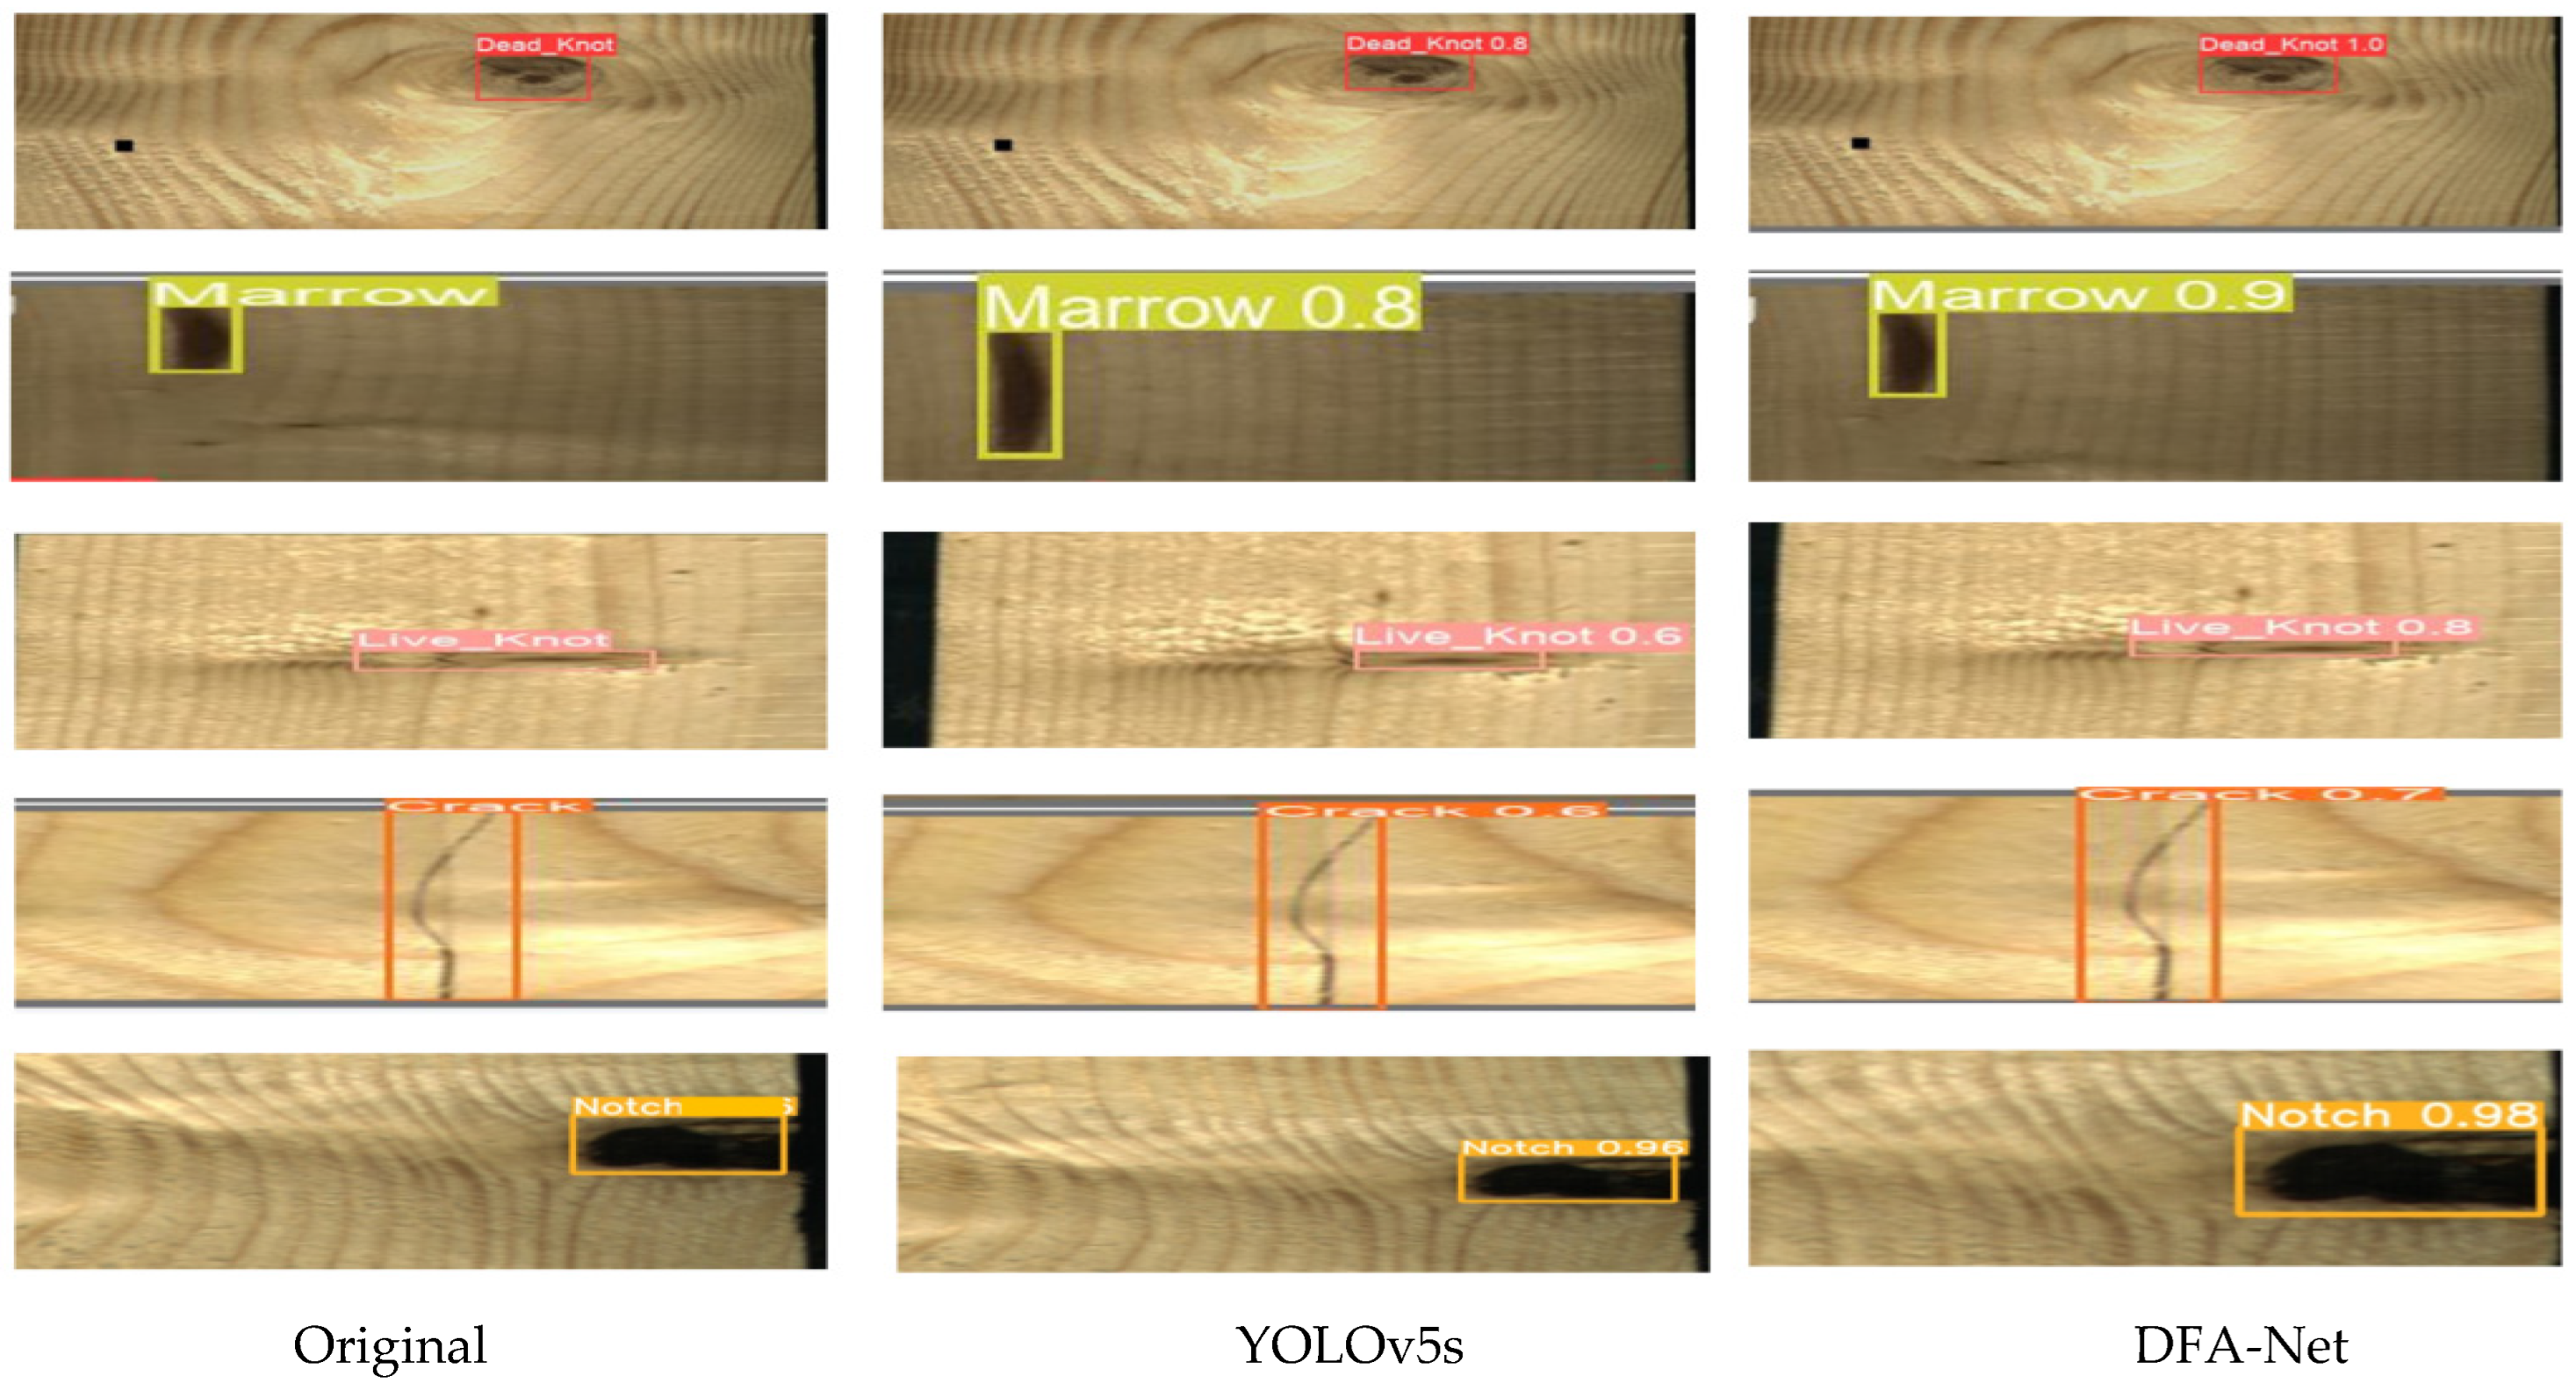
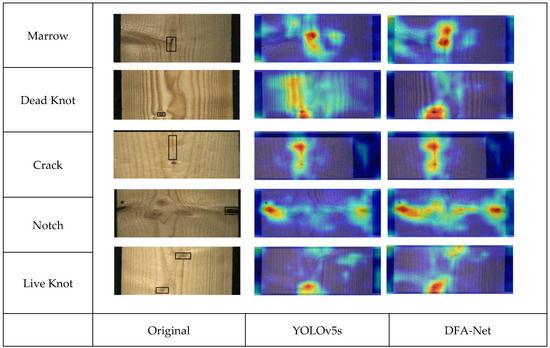
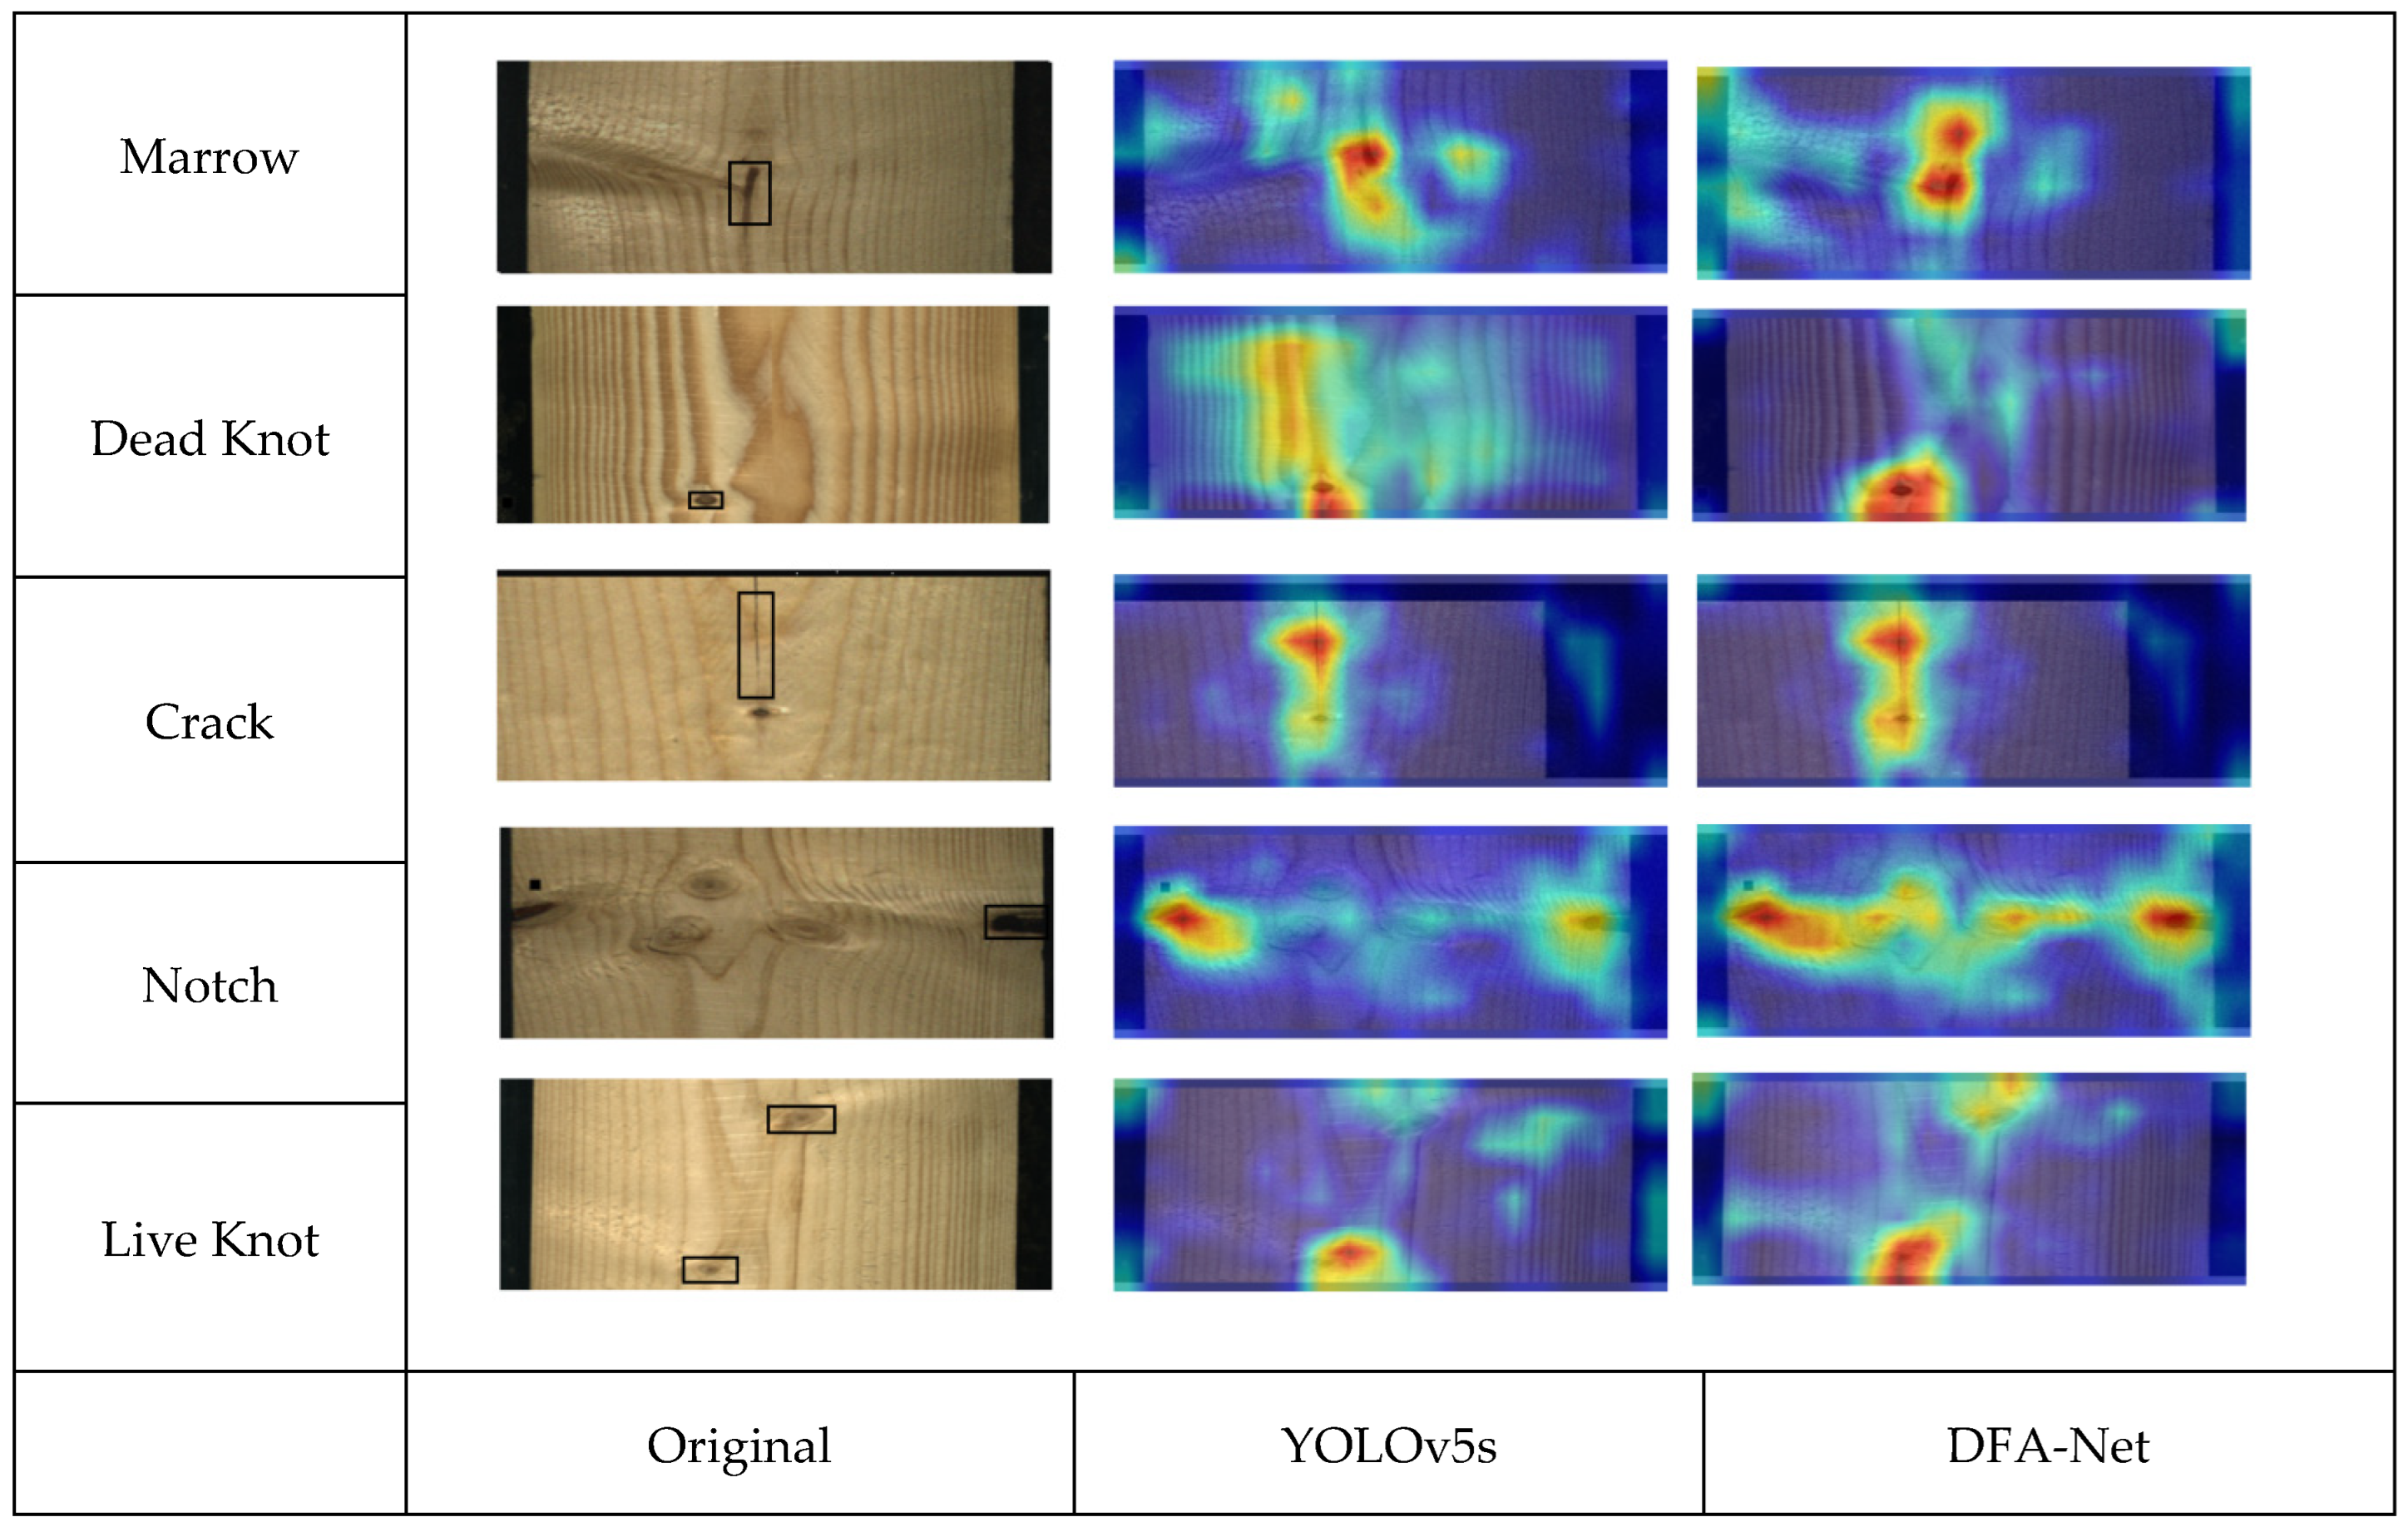
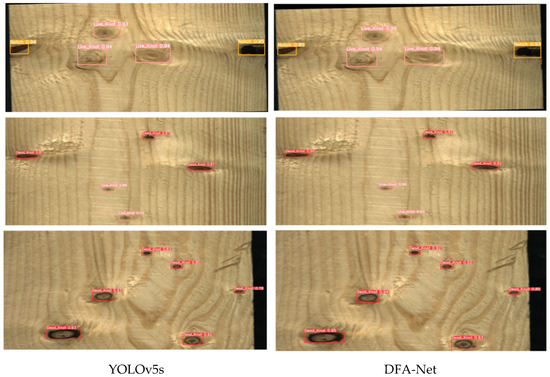
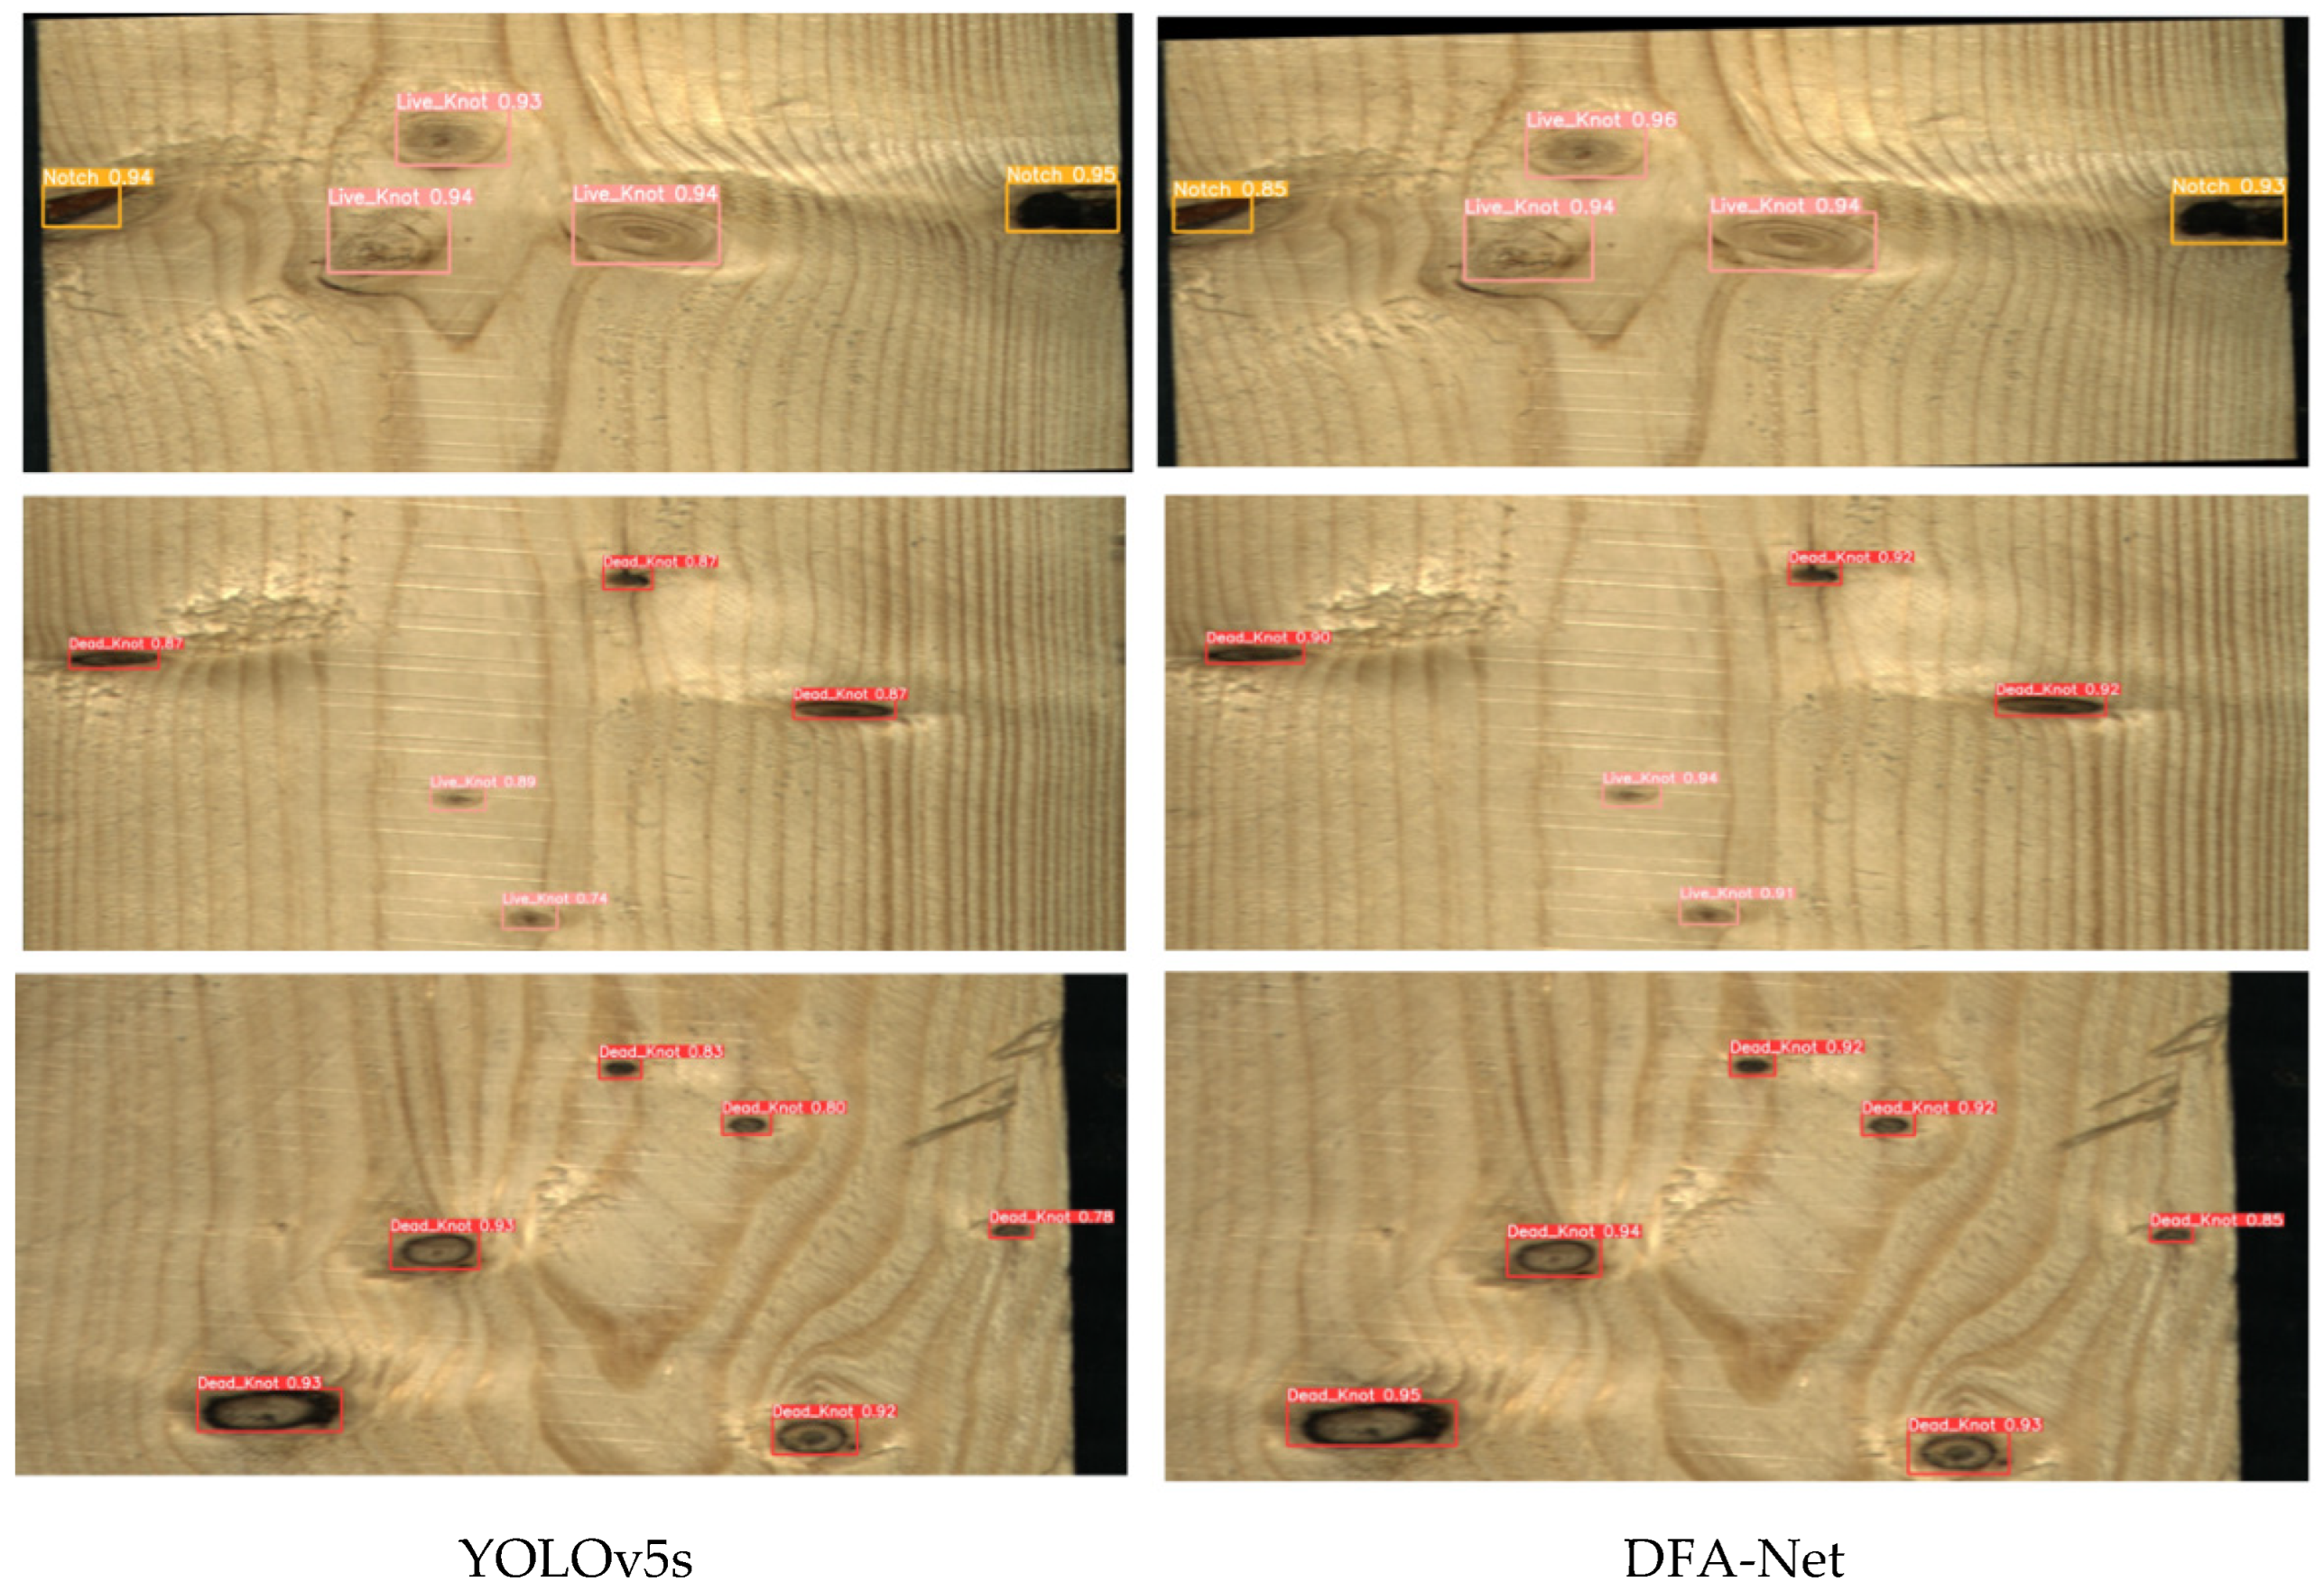
In general, the method proposed in this study significantly reduces the number of parameters while maintaining high accuracy. As shown in Figure 7, these results confirm the excellent accuracy and compact design of the proposed model. Figure 8, the heatmap, clearly shows the significant improvement of the DFA-Net model in different defect detection scenarios. In order to further visually demonstrate the performance advantages of the proposed model relative to the YOLOv5s model in the multi-surface defect detection task, we randomly selected a sub-dataset for comparative testing. Experimental results (Figure 9) show that the DFA-Net model is superior to YOLOv5s in detecting various types of defects. It is worth noting that the boundary box generated by DFA-Net can more accurately align with the true contour of the defect and maintain a more stable detection confidence (mostly higher than 0.90). This significantly reduces the omissions and mischecks in YOLOv5s, especially when dealing with complex textures or small-size defects.
Figure 7.
Comparison among produced detection defects.
Figure 8.
Original image and heatmaps.
Figure 9.
Comparison among multiple defect detections.
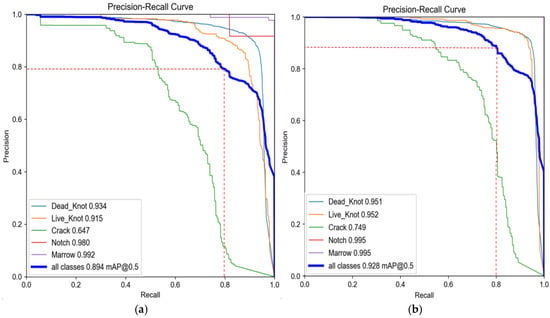
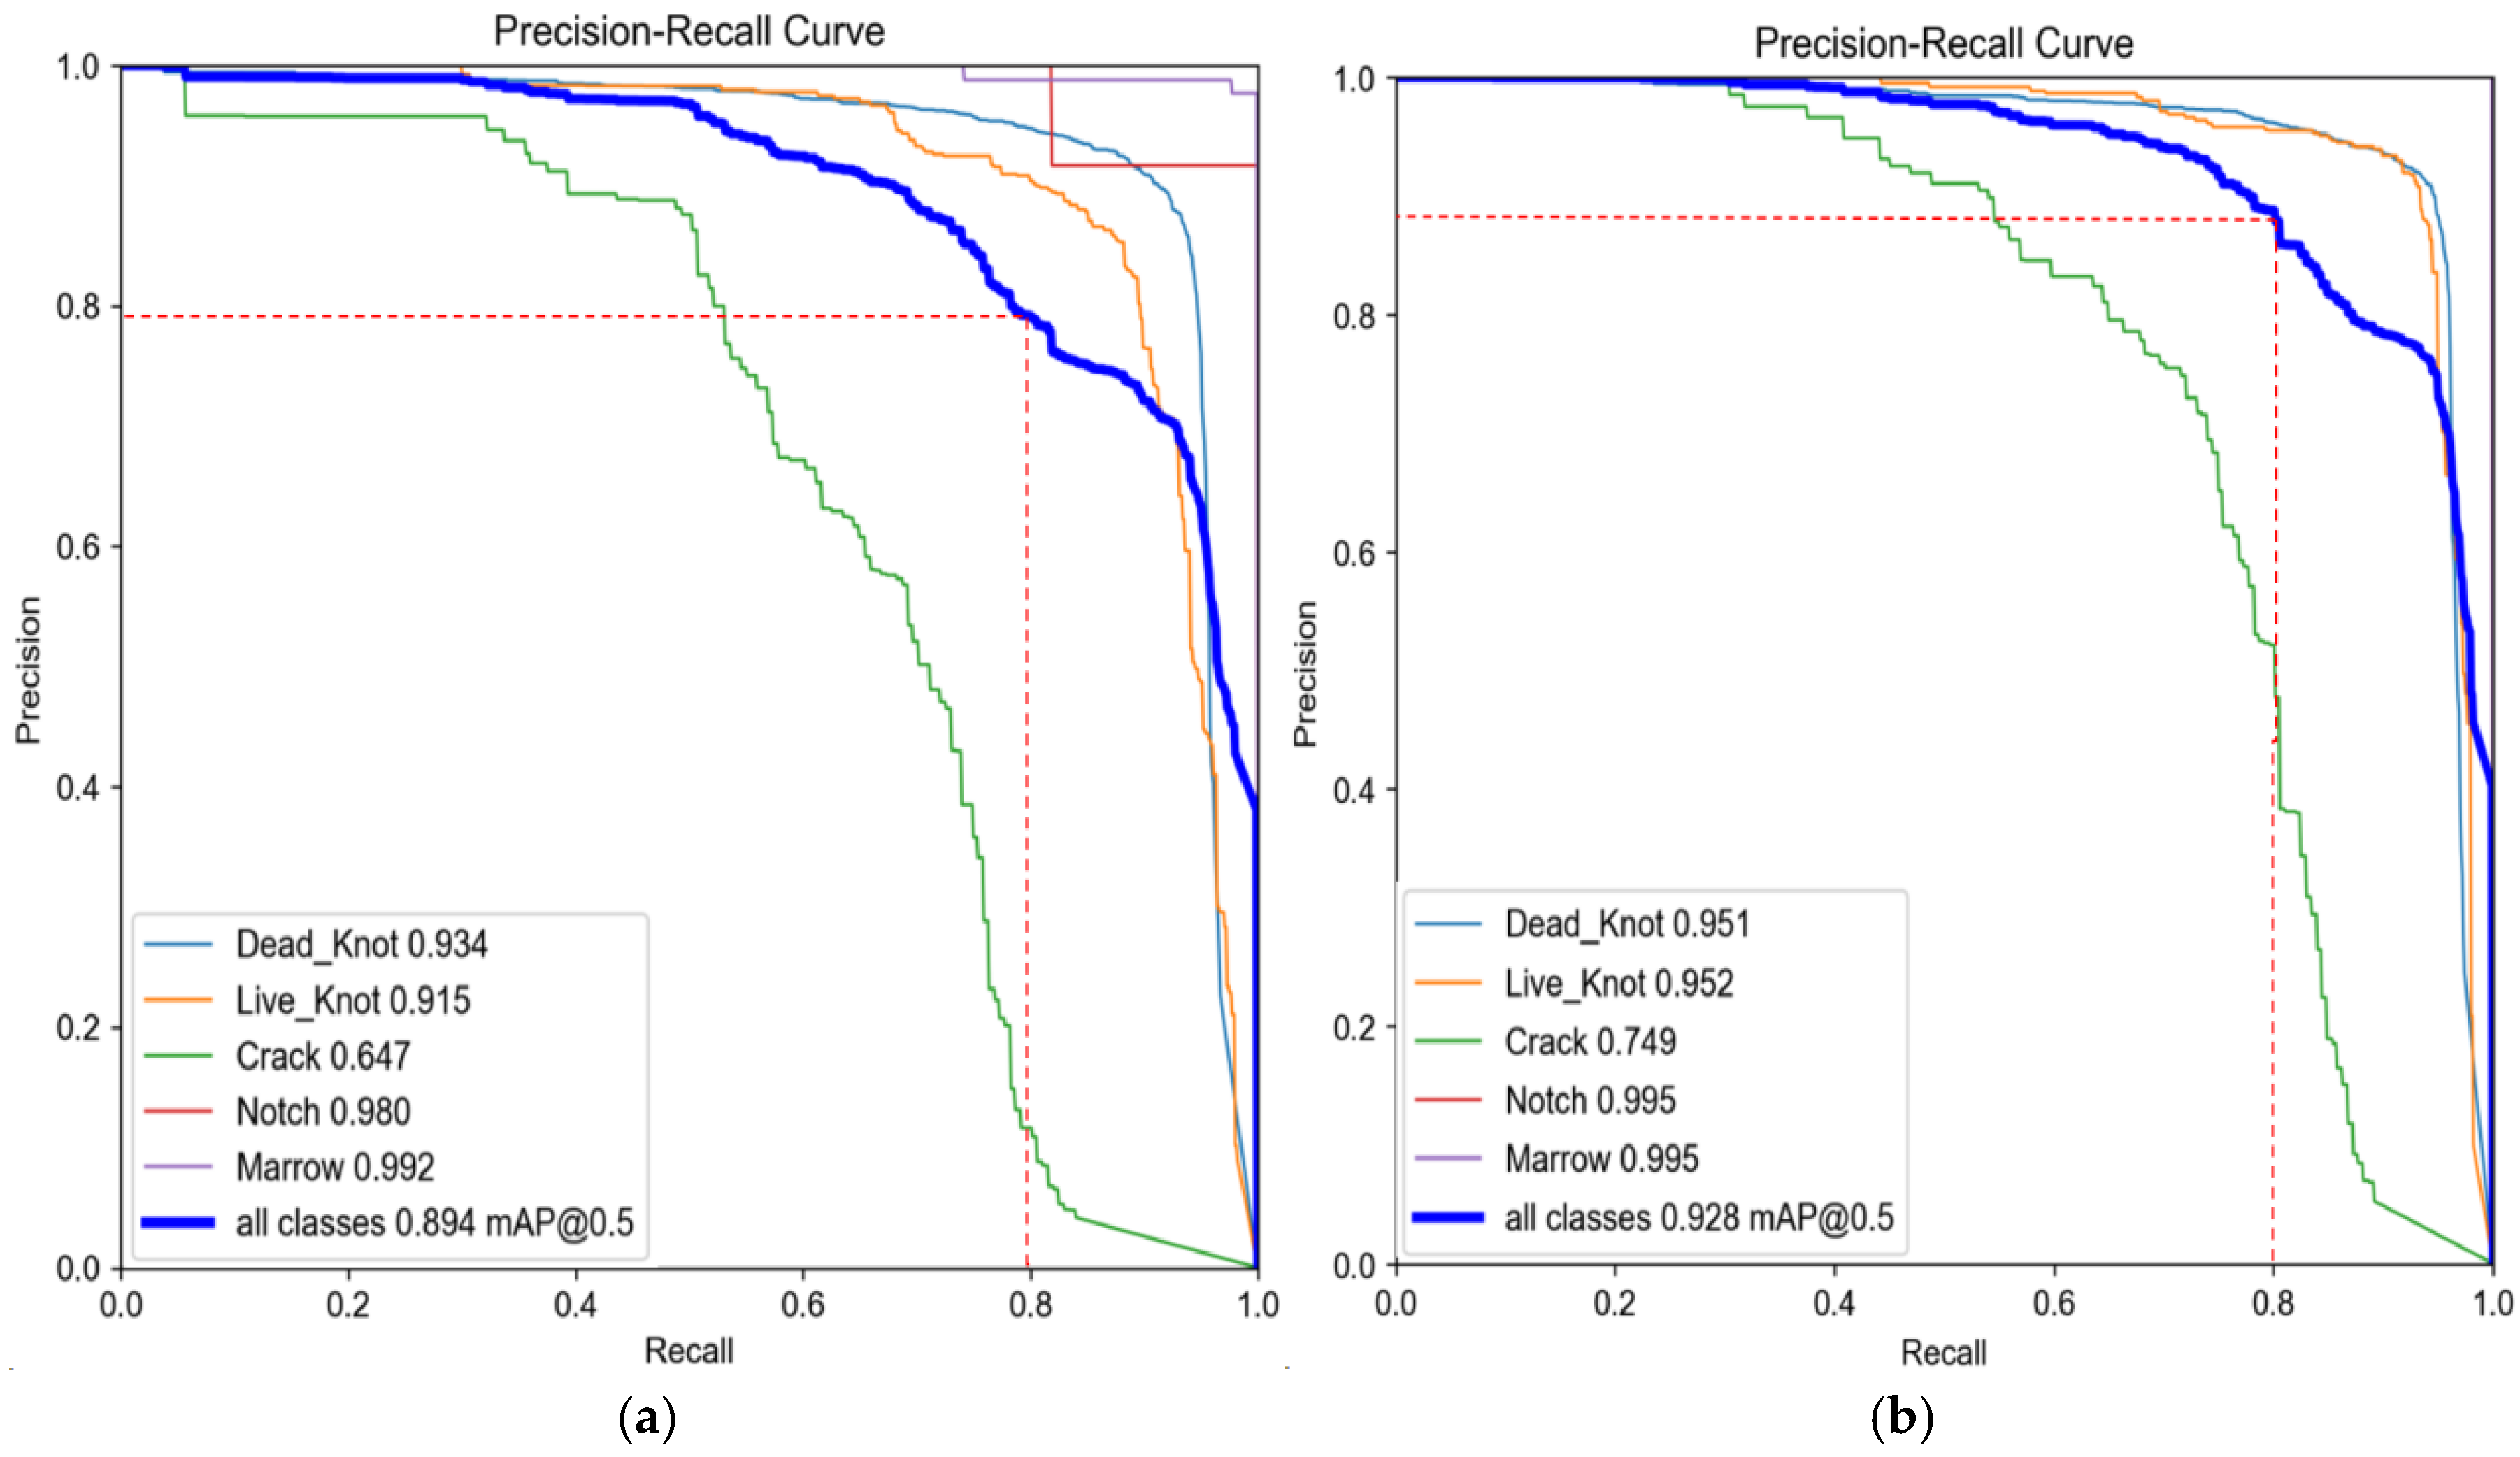
As shown in Figure 10, the PR curve of YOLOv5s and DFA-Net shows that DFA-Net has better detection performance. Specifically, the PR curve of DFA-Net (Figure 10b) completely envelops the PR curve of YOLOv5s (Figure 10a), indicating that the area under the curve (AUC-PR) value is higher. In areas with high recall rate (recall rate > 0.8), the average accuracy of DFA-Net is more than 10% higher than that of YOLOv5s, which highlights its enhanced ability to detect minor defects. In addition, the smoother PR curve of DFA-Net indicates that it has more stable detection performance under different confidence thresholds. The average accuracy (mAP0.5) results shown in Table 3 confirm these observations, among which the mAP0.5 of DFA-Net is 92.8%, which is significantly better than YOLOv5s’s mAP0.5 of 89.4%.
Figure 10.
PR curve. (a) PR curve of YOLOv5s; (b) PR curve of DFA-Net.
Table 3.
Results of an algorithmic comparison experiment.
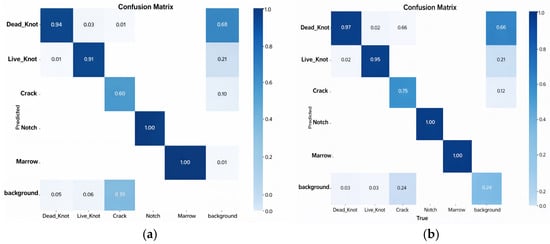
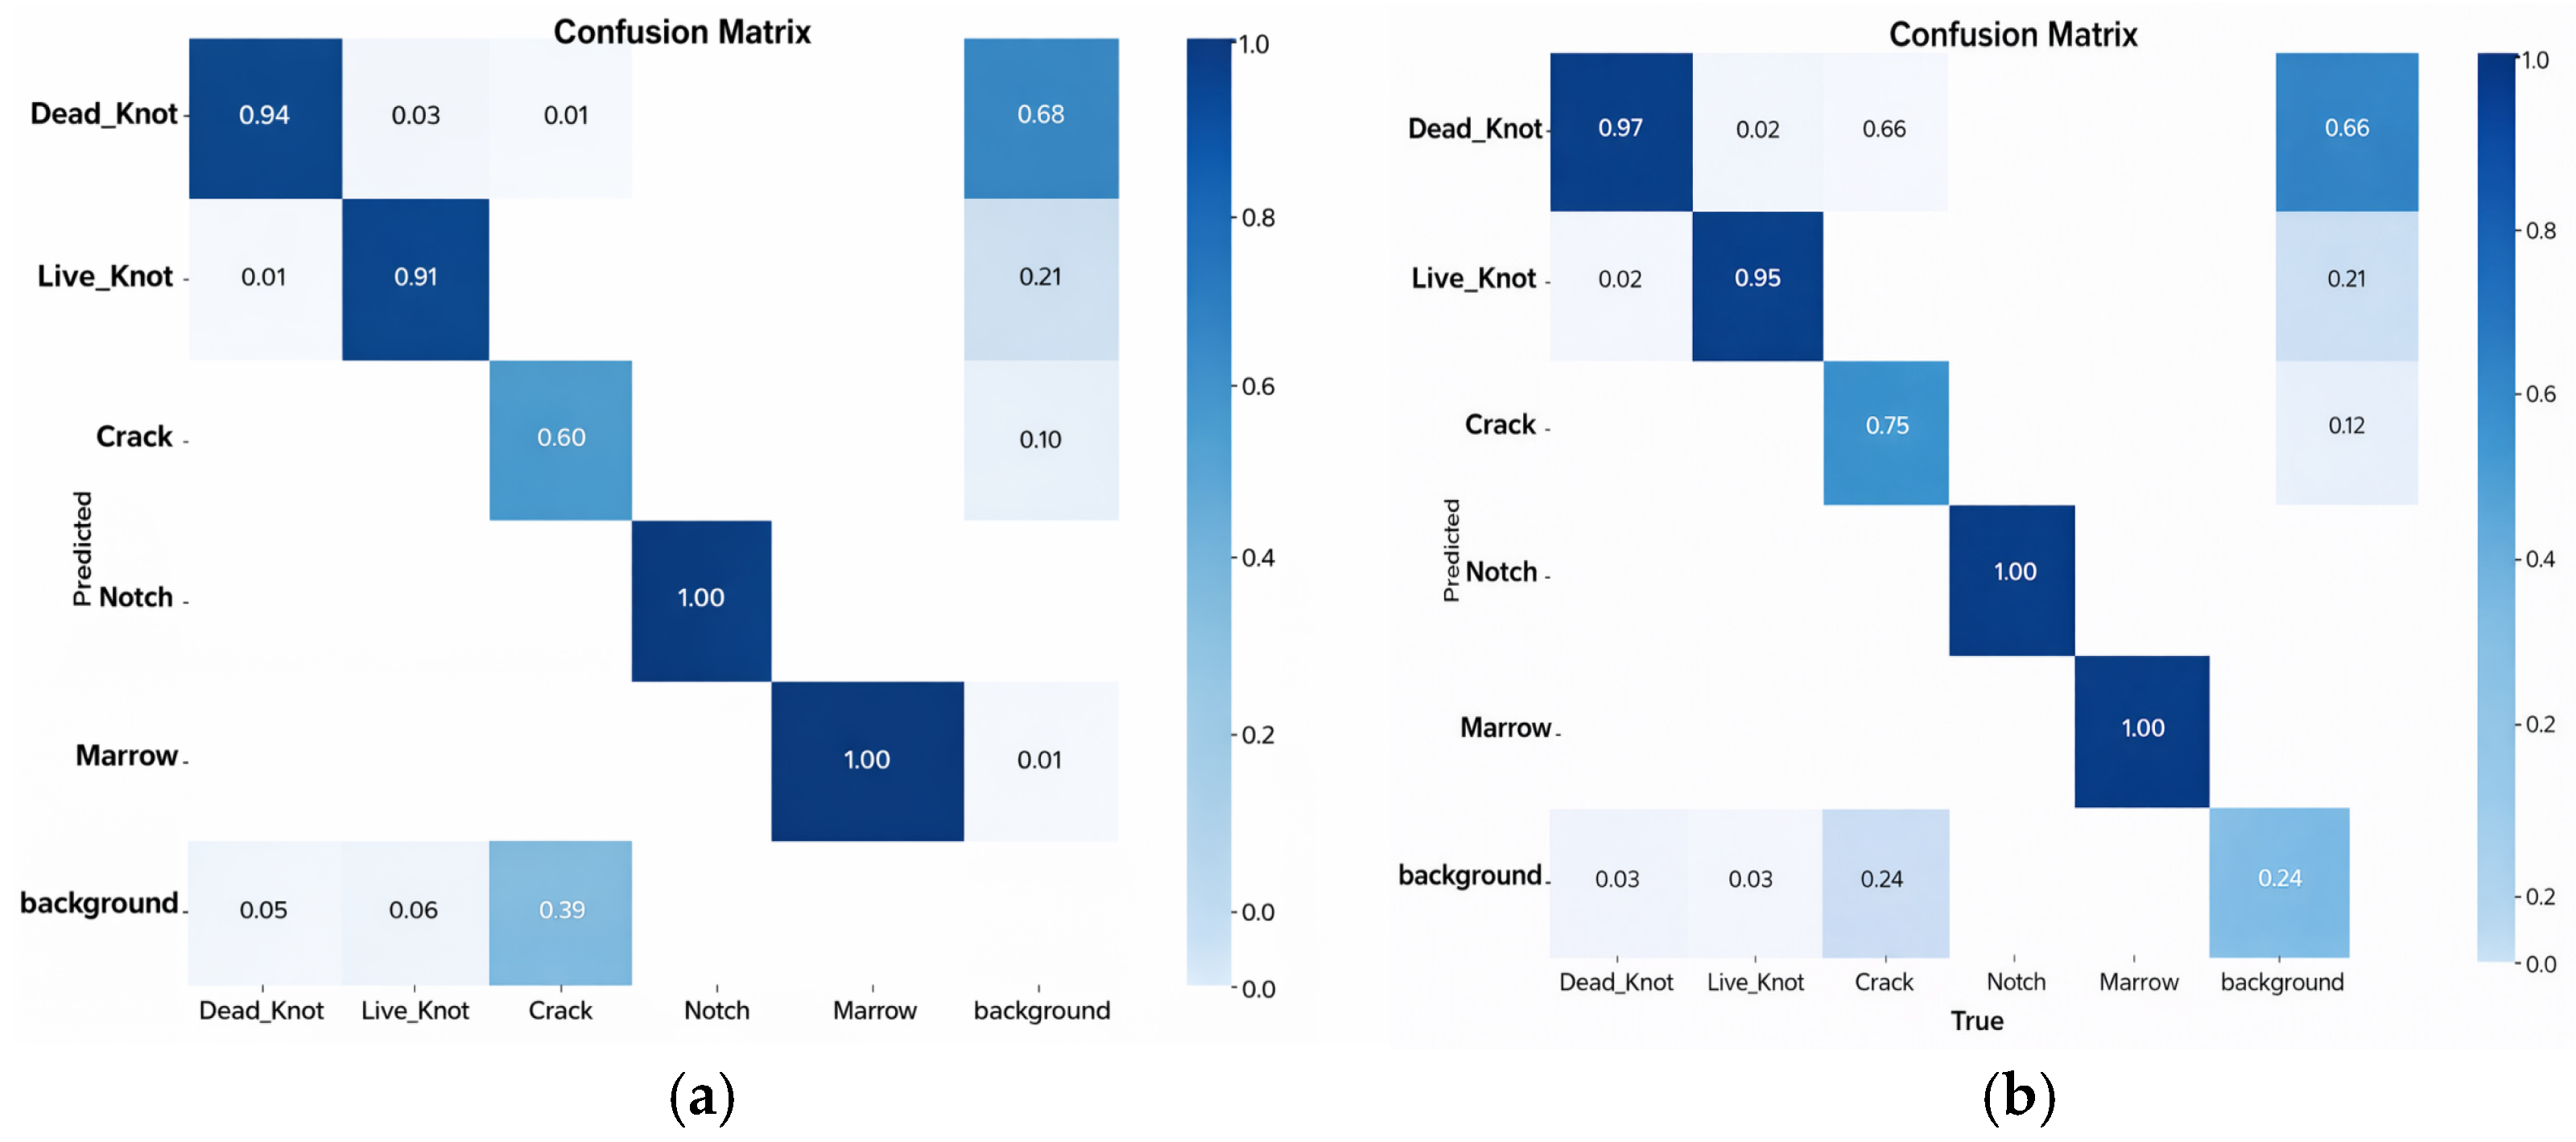
Although DFA-Net shows excellent overall detection performance, there are significant differences in detection accuracy between different defect categories. As shown in Figure 11, through the comparative analysis of two confusion matrices, the model we proposed achieved significant performance improvement in multiple defect categories: the identification accuracy of dead knots was improved from 0.94 to 0.97, the identification accuracy of live knots improved from 0.91 to 0.95, and the identification accuracy of cracks improved from 0.60 to 0.75. The recognition accuracy of categories such as notches and marrow remained at a perfect level of 1.00, which shows that the model enhances the ability to identify more challenging defect types without reducing the performance of well-identified categories. In addition, the number of background samples being misclassified as defects was also significantly reduced. Specifically, the proportion of background samples that were misclassified as dead knots, live knots and cracks was reduced from 0.05 to 0.03, from 0.06 to 0.03, and from 0.39 to 0.24, respectively. This decline in false positives highlights the model’s strengthened robustness against background interference. Collectively, these improvements confirm that the proposed approach offers not only higher classification accuracy but also greater reliability in real-world scenarios.
Figure 11.
Confusion matrix of models: (a) YOLOv5s; (b) DFA-Net.
Among all defect categories, crack represents a typical slender small-scale object, which imposes higher requirements on multi-scale feature extraction and bounding-box regression accuracy. As shown in the ablation study, the baseline YOLOv5s achieves an AP of 64.7% on the crack category, exhibiting missed detections under complex wood grain backgrounds. After introducing the DP-DCM module, the crack AP improves to 67.2%. The dual-path downsampling strategy combined with wavelet decomposition enhances high-frequency detail representation, effectively preserving fine-grained structural features of crack defects. With the integration of the FAM module, the AP further increases to 69.0%, demonstrating that the channel–spatial joint attention mechanism can dynamically emphasize crack regions while suppressing redundant background textures.
When FMNet is incorporated, the crack AP significantly rises to 72.6%, indicating that multi-scale feature aggregation strengthens the semantic representation of slender structures and improves detection stability. Finally, by replacing the conventional IoU-based loss with NWD Loss, the crack AP reaches 74.2%, and the full model achieves 74.9%. This result confirms that NWD Loss provides more robust localization optimization for small objects, alleviating the gradient instability issue commonly observed in IoU-based regression for tiny targets.
Overall, the proposed method achieves a cumulative improvement of 10.2% in crack AP, validating the synergistic effectiveness of dual-path frequency enhancement, attention-based feature fusion, and small-object-friendly loss optimization in detecting slender wood defects.
As shown in Figure 10, the detection accuracy of each defect was improved to varying degrees. The accuracy of the model in crack detection was average. Nevertheless, compared with the baseline model, DFA-Net also improved by nearly 15 percentage points in crack detection. The reasons for the low accuracy in crack detection are as follows: (1) Morphological complexity: Defects related to nodes usually present a regular round or oval shape, with clear boundaries and uniform texture, which is convenient for the model when learning features. In contrast, cracks have a variety of forms, including linear, curved and branched, and the width varies greatly, which makes the feature representation complex. (2) Differences in scale distribution: Statistical analysis shows that about 85% of crack instances in the dataset belong to the small target category (area < 32 × 32 pixels), while only 45% of node defects belong to this category. The inherent challenges of small target detection further aggravate the difficulty of crack identification. (3) Background interference: Cracks usually have low contrast in complex wood grain backgrounds, and it is difficult to distinguish them from natural textures. In order to alleviate these problems, we improved the FAM module, improved the sensitivity to slender features, and adopted the NWD Loss function to improve the accuracy of small target positioning. Nevertheless, the crack detection performance is still an aspect that needs to be improved in the future.
3.2. Comparative Experiments
In order to strictly evaluate the overall performance of the proposed DFA-Net, we comprehensively compared it with several of the most advanced YOLO-based target detection models, including YOLOv3, YOLOv4, YOLOv5s, YOLOv8, YOLOv9-t and YOLOv 10n (Table 3). To ensure a fair comparison across YOLO versions from v3 to v10n, all models were trained from scratch on the same dataset split using an identical input resolution (640 × 640) and a unified training recipe. This includes the same optimizer (SGD with momentum 0.937 and weight decay 0.0005), a cosine annealing learning rate scheduler (initial LR 0.01), a total of 300 training epochs, and consistent data augmentation pipelines. For anchor-based models, anchor boxes were recomputed on our dataset using the same k-means clustering procedure. All models were implemented based on official or widely adopted open-source repositories, with only the number of classes adjusted in the detection head. By maintaining strictly identical training conditions, preprocessing, and evaluation protocols, we ensured that the reported differences in mAP, parameters, FLOPs, and FPS genuinely reflect architectural improvements rather than discrepancies arising from training strategies or data handling.
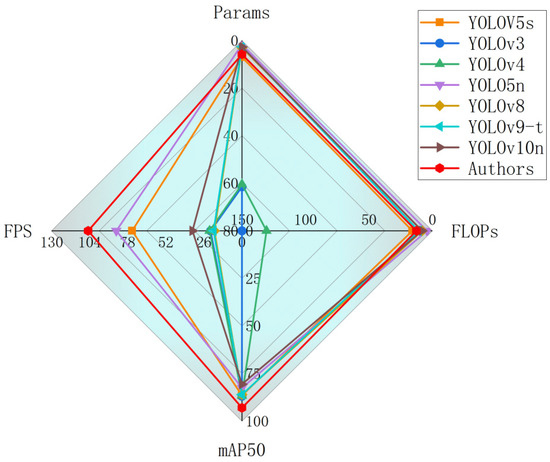
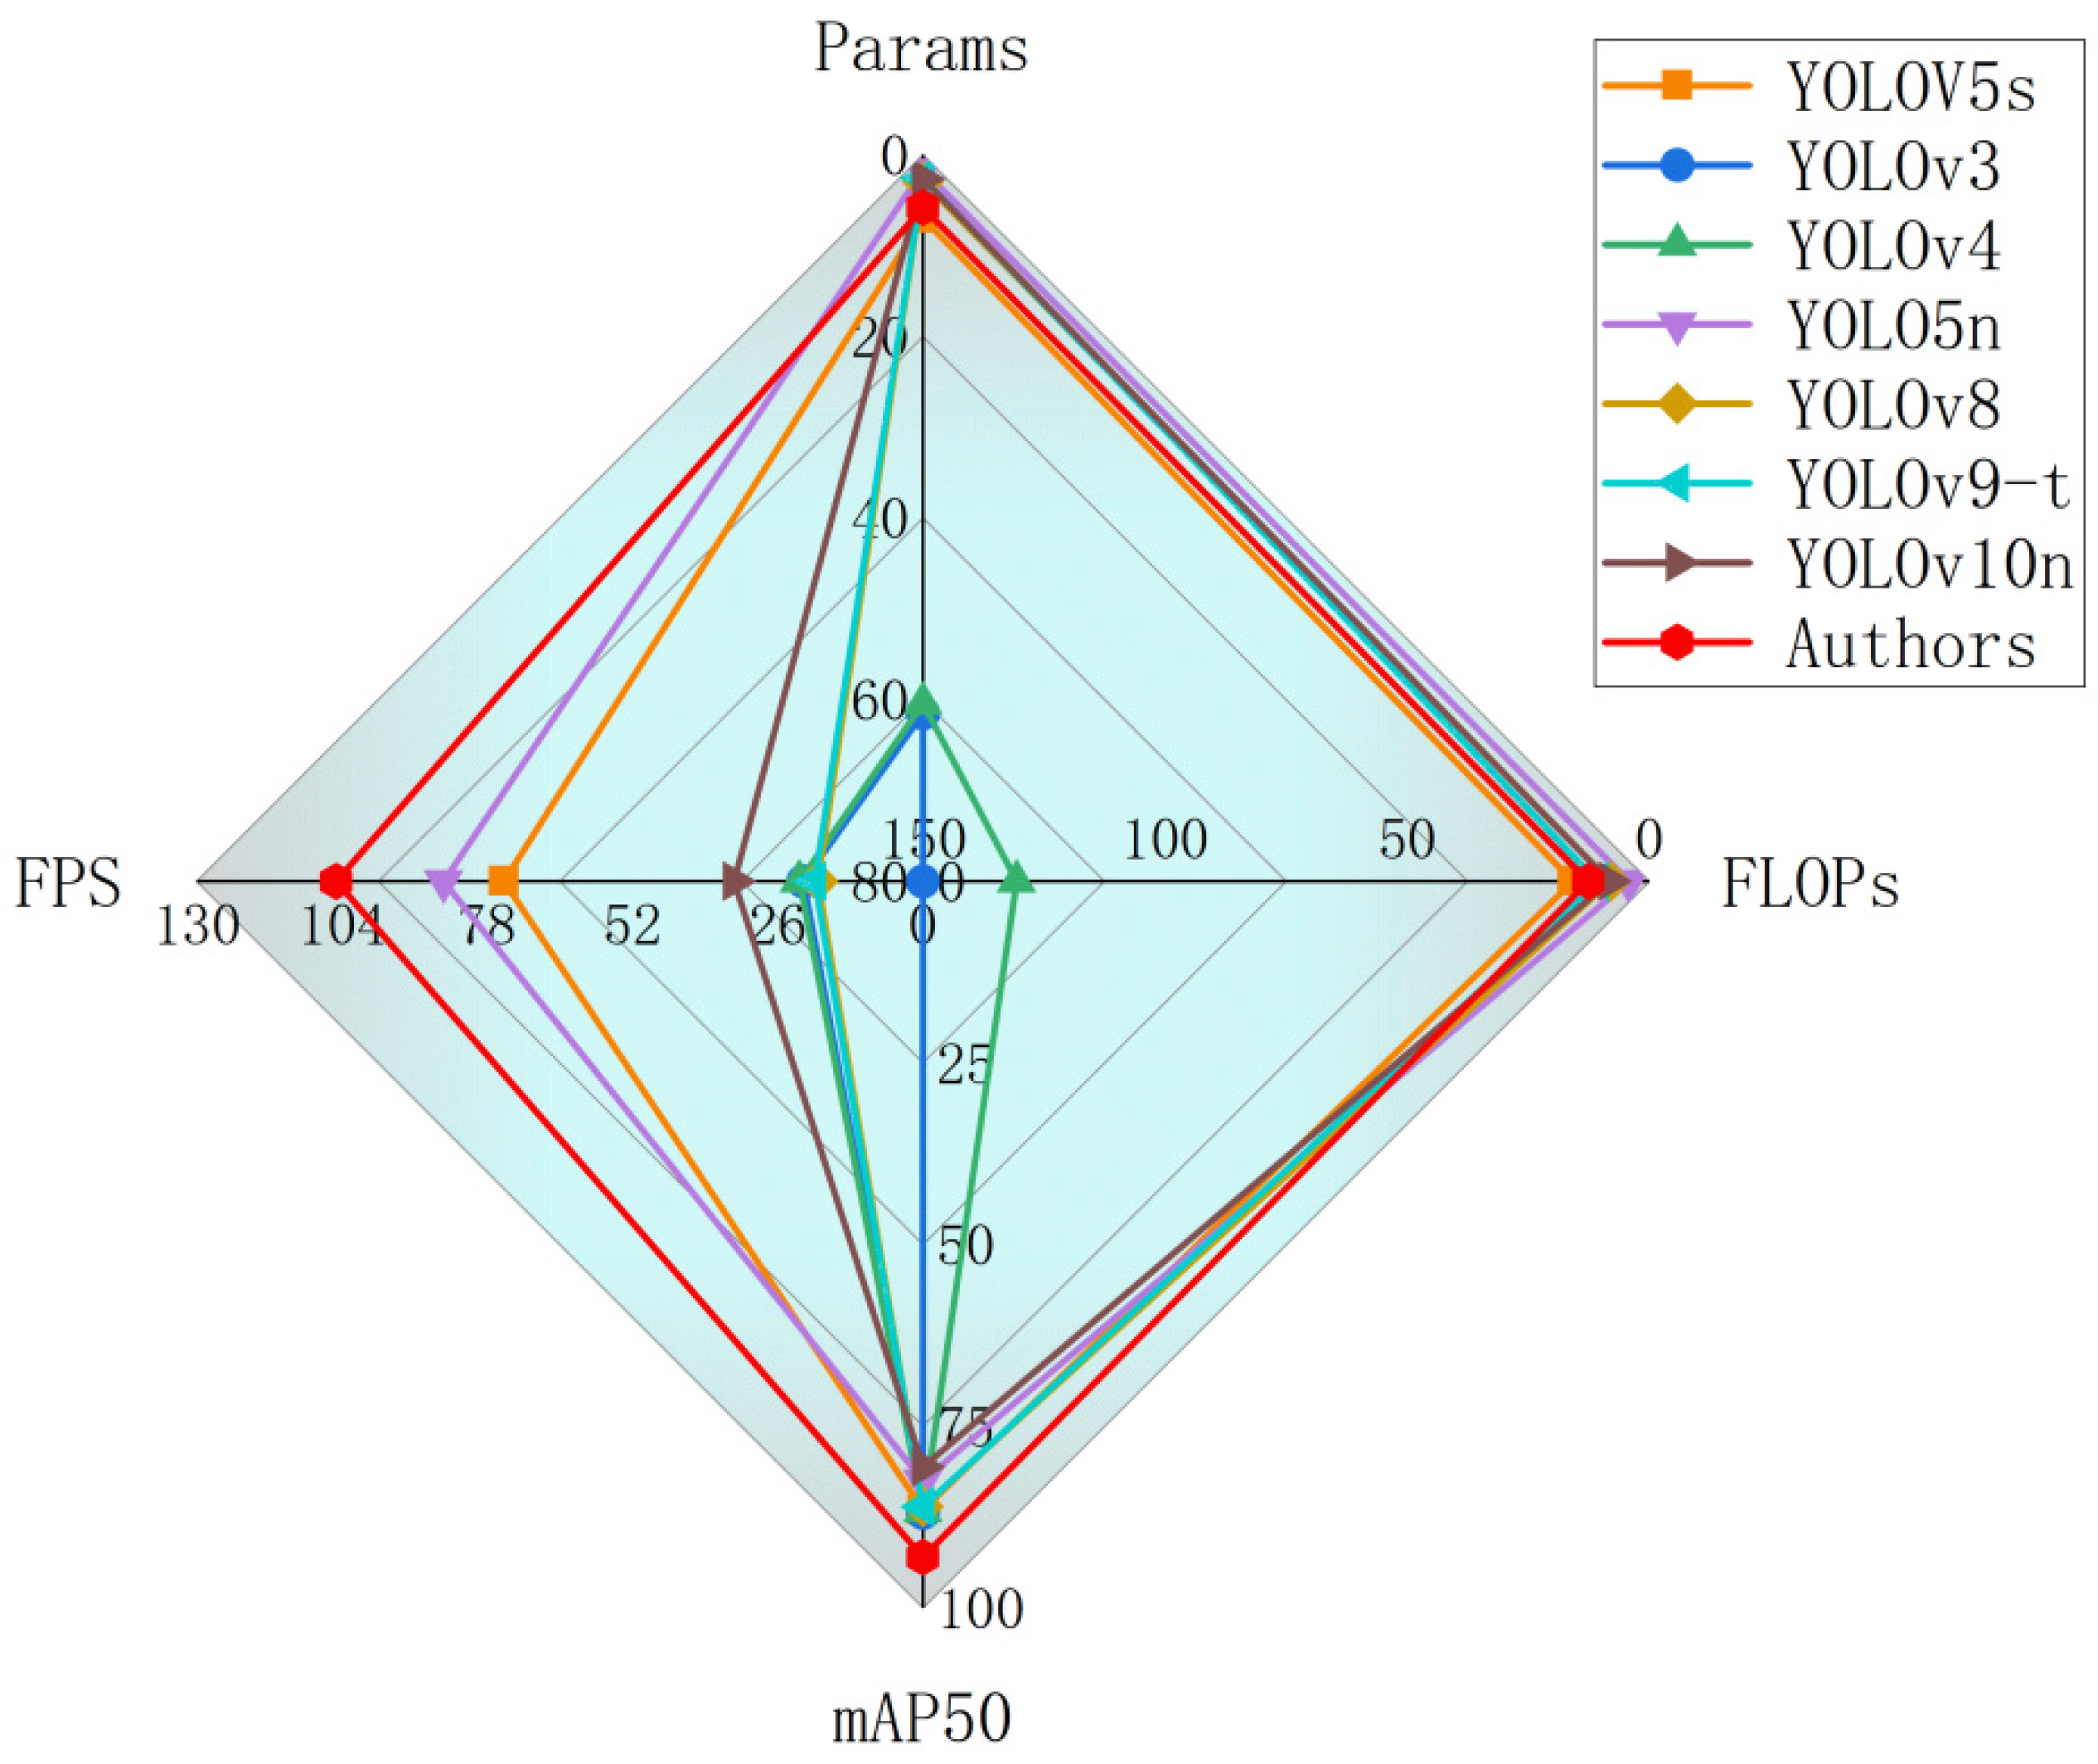
The results show that DFA-Net can achieve 92.8% mAP with only 5.8 million parameters and 12.6 G FLOPs while maintaining a real-time reasoning speed of 105 FPS. Compared with the benchmark model YOLOv5s (mAP: 89.4%, parameters: 7 million, FLOPs: 15.8 G, FPS: 75), the detection accuracy of DFA-Net is improved by 3.8 percentage points, the number of parameters is reduced by about 17.1%, and the reasoning speed is increased by 40%. These improvements come from a well-designed architecture, rather than simple module stacking, thus achieving an effective balance between precision and efficiency. In order to avoid lengthy enumeration, Figure 12 summarizes the performance indicators of all models—accuracy, number of parameters, calculation complexity and reasoning speed—into a radar chart, which complements the typical cases discussed above, thus providing a comprehensive and intuitive comparison and evaluation.
Figure 12.
Model parameter comparison.
The reduction in the number of parameters and computing load is mainly due to the replacement of standard convolution blocks with depth-separable convolution and channel division mechanisms in the lower sampling path. This design significantly compresses redundant channels while retaining key spatial features, thus forming a more compact and computationally efficient model, which is very suitable for edge deployment.
The significant improvement in detection accuracy, especially when detecting small and complex defects, comes from the integration of wavelet-based convolution algorithms in the lower sampling module. This component can extract high-frequency texture details and low-frequency structural outlines, which are often difficult to fully capture with traditional convolutional algorithms. Therefore, the model shows higher positioning accuracy and discrimination ability, especially under chaotic or low-contrast background conditions.
In addition to the multi-scale advantages based on wavelet convolution, the improvement of detection accuracy—especially for small and complex defects—also comes from the integrated effect of the fusion attention module (FAM), focal modulation (FM) and normalized Wasserstein distance loss (NWD Loss). The FAM adopts a mixed channel–space attention mechanism, which can adaptively enhance the activation associated with the defect area while suppressing background interference, thus improving the visibility of subtle features such as knots and fine cracks that are usually covered by complex wood grain patterns. FM captures long-range context dependencies through lightweight hierarchical core architecture, thus further improving the above functions; it can accurately describe defects on different scales without adding additional computing overhead. At the same time, NWD Loss regards the boundary box as a two-dimensional Gaussian distribution and applies a smooth Wasserstein distance metric to reduce the instability of the loss gradient caused by small positioning errors, especially in small target regression scenarios. FAM ensures the enhancement of target characteristics, FMNet provides global context perception, and NWD Loss provides higher positioning accuracy. This collaborative process—covering significance refinement, context aggregation and geometric alignment—allows the model to always achieve high-trust and high-precision detection results even in images with low contrast or visual clutter.
In addition, the improvement of reasoning speed can be attributed to the reorganization of the model’s forward propagation path, which avoids the common computing bottlenecks in Transformer-based or multi-head attention architectures. This streamlined modular design achieves faster processing speed without affecting the robustness of detection and feature expression ability.
In summary, compared with the existing YOLO variants, the proposed DFA-Net achieved better performance in all key indicators. Its lightweight structure, improved feature representation and real-time detection ability make it particularly advantageous in industrial wood surface defect detection applications, because these applications need to take into account both computing efficiency and detection accuracy.
4. Discussion
The experimental results presented in Section 3 demonstrate that the proposed DFA-Net achieves a compelling balance between accuracy and efficiency for wood surface defect detection, attaining an mAP@0.5 of 92.8% at 105 FPS with only 5.8 M parameters. However, a finer-grained analysis of per-class performance reveals that crack detection remains the principal bottleneck, with an AP of merely 74.9%—substantially lower than that of dead knots (97%), live knots (95%), notches (100%), and marrow (100%). This disparity necessitates a dedicated examination of the underlying causes and a critical reflection on the suitability of a detection-only framework for slender, low-contrast defects.
The sources of difficulty in crack detection are multifaceted. First, morphological complexity plays a significant role: unlike knots, which typically exhibit compact, oval shapes with relatively distinct boundaries, cracks appear in diverse forms—linear, curved, or branched—with considerable width variations. This inherent variability hinders the learning of a consistent and discriminative feature representation. Second, scale distribution poses a substantial challenge: as detailed in Section 2.1, approximately 85% of crack instances in our dataset fall into the small target category (original area < 32 × 32 pixels). Following direct resizing to 640 × 640, many of these defects are reduced to less than 2 pixels, pushing them to the resolvability limit of shallow CNN layers. Our size-based recall analysis corroborates this, showing that cracks smaller than 10 pixels achieve only 85.2% recall. Third, background interference further compounds the difficulty: cracks often exhibit low contrast against the surrounding wood grain, and the visual similarity between genuine cracks and certain grain textures—both linear and low-contrast—leads to frequent false positives, as evidenced by the confusion matrices (Figure 11) and the failure case visualizations (Figure 11a). Conversely, true cracks that blend into the background are easily missed (Figure 11b). The per-class precision–recall curves (Figure 12) further quantify this challenge, showing that the crack curve encloses a noticeably smaller area than those of other classes, and its steep precision drop at high recall indicates that many false positives emerge when the model attempts to retrieve all crack instances.
These observations raise the question of whether conventional detection-only frameworks are optimal for slender defects such as cracks. Standard object detectors based on horizontal bounding boxes exhibit inherent limitations when applied to thin, elongated objects. Representation redundancy arises because a horizontal box enclosing a diagonal crack inevitably encompasses a substantial background area, which dilutes the foreground signal and renders the intersection over union an unreliable quality metric—a slight angular misalignment can yield zero IoU even when the crack is correctly localized. Feature misalignment occurs because standard square convolution kernels are ill-suited to capture the directional nature of cracks, resulting in attenuated responses to fine linear structures. Moreover, extreme scale imbalance—with 85% of cracks being small targets—means the model struggles to allocate sufficient representational capacity to this minor yet critically important category. These limitations motivate the exploration of alternative paradigms that may offer substantial improvements for crack detection. Oriented object detection, for instance, replaces horizontal boxes with rotated boxes that tightly fit the crack geometry, reducing background contamination and enabling rotation-aware IoU computation [27]. Thin-structure priors, such as deformable convolutions or Hough-transform-guided attention, can enhance sensitivity to linear patterns without altering the box representation [28,29], introducing few additional parameters and integrating seamlessly into existing backbones. While these approaches offer clear potential, they also introduce additional complexity—whether in annotation requirements, training overhead, or architectural modifications. In the present work, we deliberately focused on a lightweight, real-time detector suitable for industrial deployment; therefore, we retained the detection-only framework while optimizing it through DP-DCM, FAM, FMNet, and NWD Loss. Nevertheless, we acknowledge that crack detection could benefit from the specialized designs outlined above.
Building on the strong baseline established by DFA-Net, future research will systematically explore several directions to elevate crack AP beyond 80% without compromising real-time performance. A hybrid detection–segmentation architecture could integrate a lightweight segmentation head into the YOLO neck, trained jointly with the detection head so that the segmentation loss guides the network to emphasize crack boundaries, thereby improving localization accuracy. Crack-tailored data augmentation strategies—including random thin-plate spline transformations, elastic deformations, or cutout-style augmentations—could simulate the variability of crack shapes, thereby enhancing generalization. Finally, if rotation-annotated data become available, adopting a lightweight-oriented detector would allow systematic evaluation of the trade-off between accuracy gain and computational cost. We believe that combining these strategies with the already robust DFA-Net framework can further narrow the performance gap between cracks and other defect types, ultimately yielding a more reliable system for real-world wood inspection applications.
5. Conclusions
To address the dilemma of balancing real-time performance, lightweight design, and small target detection in wood surface defect detection, this study proposes the DFA-Net based on YOLO5s. By integrating a dual-path downsampling convolution module (DP-DCM), a fused attention module (FAM), and a focal modulation mechanism, as well as replacing the conventional loss function with NWD Loss, the proposed model significantly improves feature extraction capabilities and the detection performance for small-scale defects. Experimental evaluations conducted on a dataset comprising five types of wood surface defects demonstrate that the improved model achieves a mean Average Precision (mAP) of 92.8%, representing a 6.5 percentage point increase over the baseline YOLOv5. Moreover, the average detection time is reduced to 9.5 milliseconds, fully satisfying the real-time requirements of industrial wood surface inspection. These results indicate that the proposed model delivers outstanding performance in both accuracy and inference speed, highlighting its potential for practical deployment in real-world applications.
However, the model still exhibits suboptimal efficiency in detecting crack-type defects, and the overall detection accuracy leaves room for further enhancement. The limitations of this study primarily manifest as insufficient detection efficiency for crack-related defects, and the model parameters still have room for optimization. Future work will focus on optimizing the network architecture to reduce parameter count and model size, thereby improving detection speed and lowering deployment costs. In addition, future work will focus on introducing crack-specific data augmentation and high-resolution feature refinement modules to further improve the recognition accuracy and completeness of this defect category, and targeted improvements will be made to enhance the model’s ability to detect specific defect types, making it better suited to the precision demands of industrial inspection scenarios.
Author Contributions
Q.Y.: Conceptualization, Methodology Design, Investigation, Data Curation, Visualization, Writing—Original Draft. S.C.: Software, Methodology Design, Investigation, Validation. J.Z.: Investigation, Data Curation, Formal Analysis. Y.W.: Investigation, Resources, Writing—Review and Editing. F.X.: Conceptualization, Funding Acquisition, Supervision, Writing—Review and Editing. All authors have read and agreed to the published version of the manuscript.
Funding
This work was supported in part by the National Natural Science Foundation of China (No. 32171788).
Data Availability Statement
Data will be made available on request.
Conflicts of Interest
The authors declare no conflicts of interest.
References
- Barmpoutis, P.; Stathaki, T.; Kamperidou, V. Monitoring of trees’ health condition using a uav equipped with low-cost digital camera. In Proceedings of the 44th IEEE International Conference on Acoustics, Speech and Signal Processing (ICASSP), Brighton, UK, 12–17 May 2019. [Google Scholar] [CrossRef] [Scilit]
- Karlinasari, L.; Wahyuna, M.E.; Nugroho, N. Non-destructive ultrasonic testing method for determining bending strength properties of gmelina wood (Gmelina arborea). J. Trop. For. Sci. 2008, 20, 99–104. [Google Scholar]
- Mousavi, M.; Taskhiri, M.S.; Gandomi, A.H. Standing tree health assessment using contact-ultrasonic testing and machine learning. Comput. Electron. Agric. 2023, 209, 15. [Google Scholar] [CrossRef] [Scilit]
- Xu, F.; Wu, Y.; Lin, H.F.; Liu, Y.F.; Wang, X.P.; Ross, R.J.; Tian, G.Y. IPSO-VMD based signal feature extraction and internal defect detection of hardwood logs through acoustic impact test. NDT E Int. 2023, 139, 102942. [Google Scholar] [CrossRef] [Scilit]
- Xu, F.; Liu, Y.F.; Wang, X.P.; Brashaw, B.K.; Yeary, L.A.; Ross, R.J. Evaluating internal condition of hardwood logs based on AR-minimum entropy deconvolution combined with wavelet based spectral kurtosis approach. Holzforschung 2021, 75, 237–249. [Google Scholar] [CrossRef] [Scilit]
- Xu, F.; Liu, Y.F.; Wang, X.P.; Brashaw, B.K.; Yeary, L.A.; Ross, R.J. Assessing internal soundness of hardwood logs through acoustic impact test and waveform analysis. Wood Sci. Technol. 2019, 53, 1111–1134. [Google Scholar] [CrossRef] [Scilit]
- Krähenbühl, A.; Kerautret, B.; Debled-Rennesson, I.; Longuetaud, F.; Mothe, F. Knot detection in X-Ray CT images of wood. In Proceedings of the 8th International Symposium on Visual Computing (ISVC), Rethymnon, Greece, 16–18 July 2012. [Google Scholar]
- Costa, A.; Pitarma, R. Performance evaluation of colour codes on thermal image analysis—Application in the wood damage detection. In Proceedings of the World Conference on Information Systems and Technologies (WorldCIST), Budva, Montenegro, 12–14 April 2022. [Google Scholar] [CrossRef] [Scilit]
- Meng, L.C.; Li, H.D.; Chen, B.C.; Lan, S.Y.; Wu, Z.X.; Jiang, Y.G.; Lim, S.N. AdaViT: Adaptive vision transformers for efficient image recognition. In Proceedings of the IEEE/CVF Conference on Computer Vision and Pattern Recognition (CVPR), New Orleans, LA, USA, 18–24 June 2022. [Google Scholar] [CrossRef] [Scilit]
- Chen, C.F.; Fan, Q.F.; Panda, R. CrossViT: Cross-attention multi-scale vision transformer for image classification. In Proceedings of the 18th IEEE/CVF International Conference on Computer Vision (ICCV), Online, 11–17 October 2021. [Google Scholar]
- Zhu, X.; Su, W.; Lu, L.; Li, B.; Wang, X.; Dai, J. Deformable DETR: Deformable transformers for end-to-end object detection. arXiv 2021, arXiv:2010.04159. [Google Scholar]
- Jiang, P.Y.; Ergu, D.; Liu, F.Y.; Cai, Y.; Ma, B. A review of yolo algorithm developments. In Proceedings of the 8th International Conference on Information Technology and Quantitative Management (ITQM)—Developing Global Digital Economy after COVID-19, Chengdu, China, 9–11 July 2021. [Google Scholar] [CrossRef] [Scilit]
- Liu, W.; Anguelov, D.; Erhan, D.; Szegedy, C.; Reed, S.; Fu, C.Y.; Berg, A.C. SSD: Single shot multiBox detector. In Proceedings of the 14th European Conference on Computer Vision (ECCV), Amsterdam, The Netherlands, 11–14 October 2016. [Google Scholar] [CrossRef] [Scilit]
- Tan, M.X.; Pang, R.M.; Le, Q. EfficientDet: Scalable and efficient object detection. In Proceedings of the IEEE/CVF Conference on Computer Vision and Pattern Recognition (CVPR), Seattle, WA, USA, 13–19 June 2020. [Google Scholar] [CrossRef] [Scilit]
- Girshick, R. Fast R-CNN. In Proceedings of the IEEE International Conference on Computer Vision, Santiago, Chile, 7–13 December 2015. [Google Scholar] [CrossRef] [Scilit]
- Cai, Z.W.; Vasconcelos, N. Cascade R-CNN: High quality object detection and instance segmentation. IEEE Trans. Pattern Anal. Mach. Intell. 2021, 43, 1483–1498. [Google Scholar] [CrossRef] [Scilit] [PubMed]
- Gao, M.Y.; Song, P.; Wang, F.; Liu, J.Y.; Mandelis, A.; Qi, D.W. A novel deep convolutional neural network based on resnet-18 and transfer learning for detection of wood knot defects. J. Sens. 2021, 2021, 8109496. [Google Scholar] [CrossRef] [Scilit]
- He, K.M.; Zhang, X.Y.; Ren, S.Q.; Sun, J. Deep residual learning for image recognition. In Proceedings of the 2016 IEEE Conference on Computer Vision and Pattern Recognition (CVPR), Las Vegas, NV, USA, 27–30 June 2016; IEEE: New York, NY, USA, 2016. [Google Scholar] [CrossRef] [Scilit]
- Kato, S.; Wada, N.; Shiogai, K.; Tamaki, T.; Kagawa, T.; Toyosaki, R.; Nobuhara, H. Crack severity classification from timber cross-sectional images using convolutional neural network. Appl. Sci. 2023, 13, 1280. [Google Scholar] [CrossRef] [Scilit]
- Lin, Y.; Xu, Z.Z.; Chen, D.; Ai, Z.J.; Qiu, Y.; Yuan, Y.Z. Wood crack detection based on data-driven semantic segmentation network. IEEE-CAA J. Autom. Sin. 2023, 10, 1510–1512. [Google Scholar] [CrossRef] [Scilit]
- Wang, R.J.; Chen, Y.S.; Liang, F.L.; Wang, B.; Mou, X.W.; Zhang, G.H. BPN-YOLO: A novel method for wood defect detection based on yolov7. Forests 2024, 15, 1096. [Google Scholar] [CrossRef] [Scilit]
- An, H.; Liang, Z.H.; Qin, M.M.; Huang, Y.X.; Xiong, F.; Zeng, G.J. Wood defect detection based on the cwb-yolov8 algorithm. J. Wood Sci. 2024, 70, 14. [Google Scholar] [CrossRef] [Scilit]
- Zheng, Y.C.; Wang, M.F.; Zhang, B.; Shi, X.N.; Chang, Q. GBCD-YOLO: A high-precision and real-time lightweight model for wood defect detection. IEEE Access 2024, 12, 12853–12868. [Google Scholar] [CrossRef] [Scilit]
- Meng, W.; Yuan, Y.L. SGN-YOLO: Detecting wood defects with improved yolov5 based on semi-global network. Sensors 2023, 23, 8705. [Google Scholar] [CrossRef] [Scilit] [PubMed]
- Kong, X.Y.; Liu, Y.F.; Han, R.P.; Li, S.; Liu, H. Forest fire image deblurring based on spatial-frequency domain fusion. Forests 2024, 15, 18. [Google Scholar] [CrossRef] [Scilit]
- Wang, J.; Xu, C.; Yang, W.; Yu, L. A Normalized Gaussian Wasserstein Distance for Tiny Object Detection. arXiv 2021, arXiv:2110.13389. [Google Scholar] [CrossRef] [Scilit]
- Wang, K.; Wang, Z.; Li, Z.; Su, A.; Teng, X.; Pan, E.; Liu, M.; Yu, Q. Oriented object detection in optical remote sensing images using deep learning: A survey. Artif. Intell. Rev. 2025, 58, 350. [Google Scholar] [CrossRef] [Scilit]
- do Nascimento, M.G.; Fawcett, R.; Prisacariu, V.A. DSConv: Efficient convolution operator. In Proceedings of the 2019 IEEE/CVF International Conference on Computer Vision (ICCV), Seoul, Republic of Korea, 27 October–2 November 2019; IEEE: New York, NY, USA, 2019; pp. 5147–5156. [Google Scholar] [CrossRef] [Scilit]
- Song, C.; Chen, J.; Lu, Z.; Li, F.; Liu, Y. Steel surface defect detection via deformable convolution and background suppression. IEEE Trans. Instrum. Meas. 2023, 72, 5017709. [Google Scholar] [CrossRef] [Scilit]



Disclaimer/Publisher’s Note: The statements, opinions and data contained in all publications are solely those of the individual author(s) and contributor(s) and not of MDPI and/or the editor(s). MDPI and/or the editor(s) disclaim responsibility for any injury to people or property resulting from any ideas, methods, instructions or products referred to in the content. |
© 2026 by the authors. Licensee MDPI, Basel, Switzerland. This article is an open access article distributed under the terms and conditions of the Creative Commons Attribution (CC BY) license.