


Abstract
Wildfire activity is intensifying under climate change, particularly in temperate East Asia where human-driven ignitions interact with extreme fire-weather conditions. This study examines wildfire risk during the March 2025 large wildfire event in Korea by applying explainable machine-learning models to assess ignition-prone environments and their spatial relationship with socio-environmental features relevant to exposure and management. CatBoost and LightGBM models were used to estimate wildfire susceptibility based on climatic, topographic, vegetation, and anthropogenic predictors, with SHAP analysis employed to interpret variable contributions. Both models showed strong predictive performance (CatBoost AUC = 0.910; LightGBM AUC = 0.907). Temperature, relative humidity, and wind speed emerged as the dominant climatic drivers, with ignition probability increasing under hot (>25 °C), dry (<25%), and windy (>6 m s−1) conditions. Anthropogenic factors—including proximity to graves, mountain trails, forest roads, and contiguous coniferous stands (≥30 ha)—were consistently associated with elevated ignition likelihood, reflecting the role of human accessibility within pine-dominated landscapes. The socio-environmental overlay analysis further indicated that high-susceptibility zones were spatially aligned with arboreta, private commercial forests, and campsites, highlighting areas where ignition-prone environments coincide with active human use and forest management. These results suggest that wildfire risk in Korea is shaped by the spatial concurrence of climatic extremes, fuel continuity, and socio-environmental exposure. By situating explainable susceptibility modeling within an event-conditioned risk perspective, this study provides practical insights for identifying Wildfire Priority Management Areas (WPMAs) and supporting risk-informed prevention, preparedness, and spatial decision-making under ongoing climate change.
1. Introduction
Wildfires have become a major climate-related disturbance across many regions of the world, including temperate zones that were historically considered less fire-prone. Rising temperatures, changing precipitation regimes, land-use transitions, and increasing human activity have contributed to more frequent and damaging wildfire events in southern Europe, the western United States, and parts of East Asia [1,2]. In wildfire research, susceptibility commonly refers to the spatial tendency for ignition based on environmental conditions, hazard describes the probability and potential intensity of fire occurrence, and risk encompasses both hazard and the exposure and vulnerability of affected human and ecological systems [3,4,5]. Consistent with the IPCC framework, wildfire risk is therefore understood as a function of hazard, exposure, and vulnerability, providing a conceptual basis for climate adaptation and land-management planning [6,7].
In the Republic of Korea, wildfire activity has increased over the past two decades, with both the number of fires and the total burned area showing upward trends. Spring wildfires account for more than 60% of annual events and are typically associated with dry atmospheric conditions, strong winds, and limited precipitation [8,9]. These climatic drivers interact closely with human activities, including agricultural residue burning, debris disposal, and memorial fires, particularly along expanding wildland–urban interface (WUI) zones [10,11]. The large wildfires that occurred in March 2025 in Gyeongsangbuk-do exemplify this interaction, where pine-dominated forest structures, persistent spring winds, and human accessibility combined to facilitate rapid fire spread and substantial socio-economic losses [12]. Recent attribution and extreme-weather studies further suggest that synoptic dry fronts and foehn-type wind events—conditions projected to intensify under continued warming—play an important role in elevating fire-weather severity on the Korean Peninsula [13,14].
Recent bibliometric and review studies have shown a rapidly growing body of literature on the socio-environmental impacts of wildfires, highlighting increasing attention to human exposure, social vulnerability, and governance dimensions beyond biophysical hazard assessment [15,16,17]. In Korea, previous wildfire susceptibility studies have provided valuable insights into the role of biophysical factors such as fuel moisture, topography, and vegetation characteristics, often using statistical or machine-learning approaches [18,19]. However, many of these studies place relatively greater emphasis on environmental drivers than on the spatial configuration of human-related ignition sources. Although anthropogenic factors such as cemetery burning, recreational activities along mountain trails, and settlement proximity are known to influence spring wildfire occurrence, their role is often treated indirectly or aggregated at coarse spatial scales. In addition, socio-environmental vulnerability—linked to demographic structure, infrastructure exposure, and land-management context—has received comparatively less attention in spatial wildfire assessments, particularly in rapidly changing rural and WUI landscapes [16]. As a result, existing models tend to characterize wildfire hazard effectively but provide more limited insight into how ignition-prone environments overlap with socially relevant exposure conditions.
Building on this context, the present study examines wildfire risk during the March 2025 large wildfire event in Gyeongsangbuk-do by focusing on the spatial alignment between ignition-prone environments and socio-environmental features relevant to exposure and management. Rather than aiming to derive long-term, generalized wildfire risk patterns, this study adopts an event-conditioned perspective, using an extreme wildfire episode to explore how climatic stress, landscape structure, and human accessibility jointly shape wildfire risk at the regional scale. CatBoost and LightGBM models are applied to estimate wildfire susceptibility based on climatic, topographic, vegetation, and anthropogenic predictors, and SHAP analysis is used to examine the relative contribution of these factors. The resulting susceptibility patterns are then compared with selected socio-environmental indicators to evaluate where wildfire-prone areas coincide with human-managed or infrastructure-related landscapes.
Specifically, this study aims to:
- (1)
- examine the relative influence of climatic, topographic, vegetation, and anthropogenic factors on wildfire ignition during the March 2025 event;
- (2)
- identify spatial patterns of wildfire susceptibility under extreme fire-weather conditions; and
- (3)
- assess how these susceptibility patterns overlap with socio-environmental features relevant to exposure and wildfire management.
By situating machine-learning-based susceptibility modeling within a disaster risk perspective, this study contributes empirical evidence on how wildfire hazard and spatial exposure intersect in a fire-prone region of East Asia. In this study, wildfire susceptibility is primarily modeled as a proxy for hazard, and wildfire risk is interpreted through the combined lens of hazard and spatial exposure, rather than as a full impact-based risk estimate. The findings are intended to support wildfire risk governance in Korea, particularly in the designation of priority management areas and the interpretation of risk information under extreme fire-weather conditions, while also offering insights applicable to other regions experiencing similar climate–human interactions [20,21].
The remainder of this paper is organized as follows. Section 2 describes the study area, Section 3 outlines the data and methodological approach, Section 4 presents the results of the wildfire susceptibility and socio-environmental analyses, Section 5 discusses implications for wildfire risk management, and Section 6 concludes with key findings and directions for future research.
2. Study Area
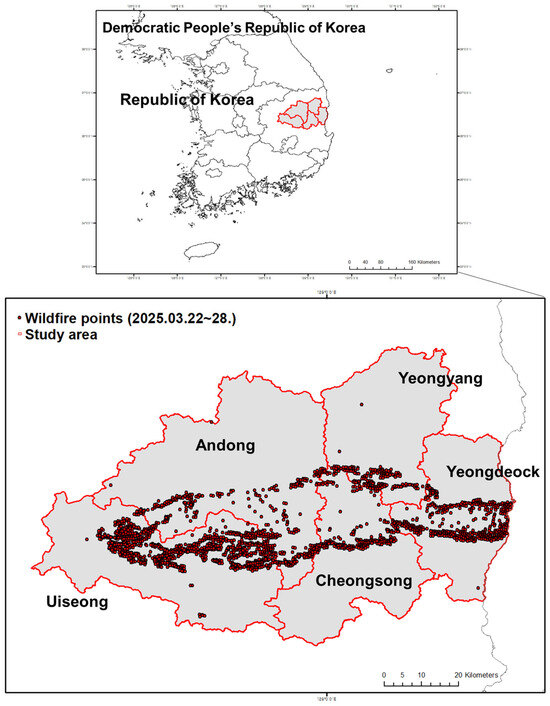
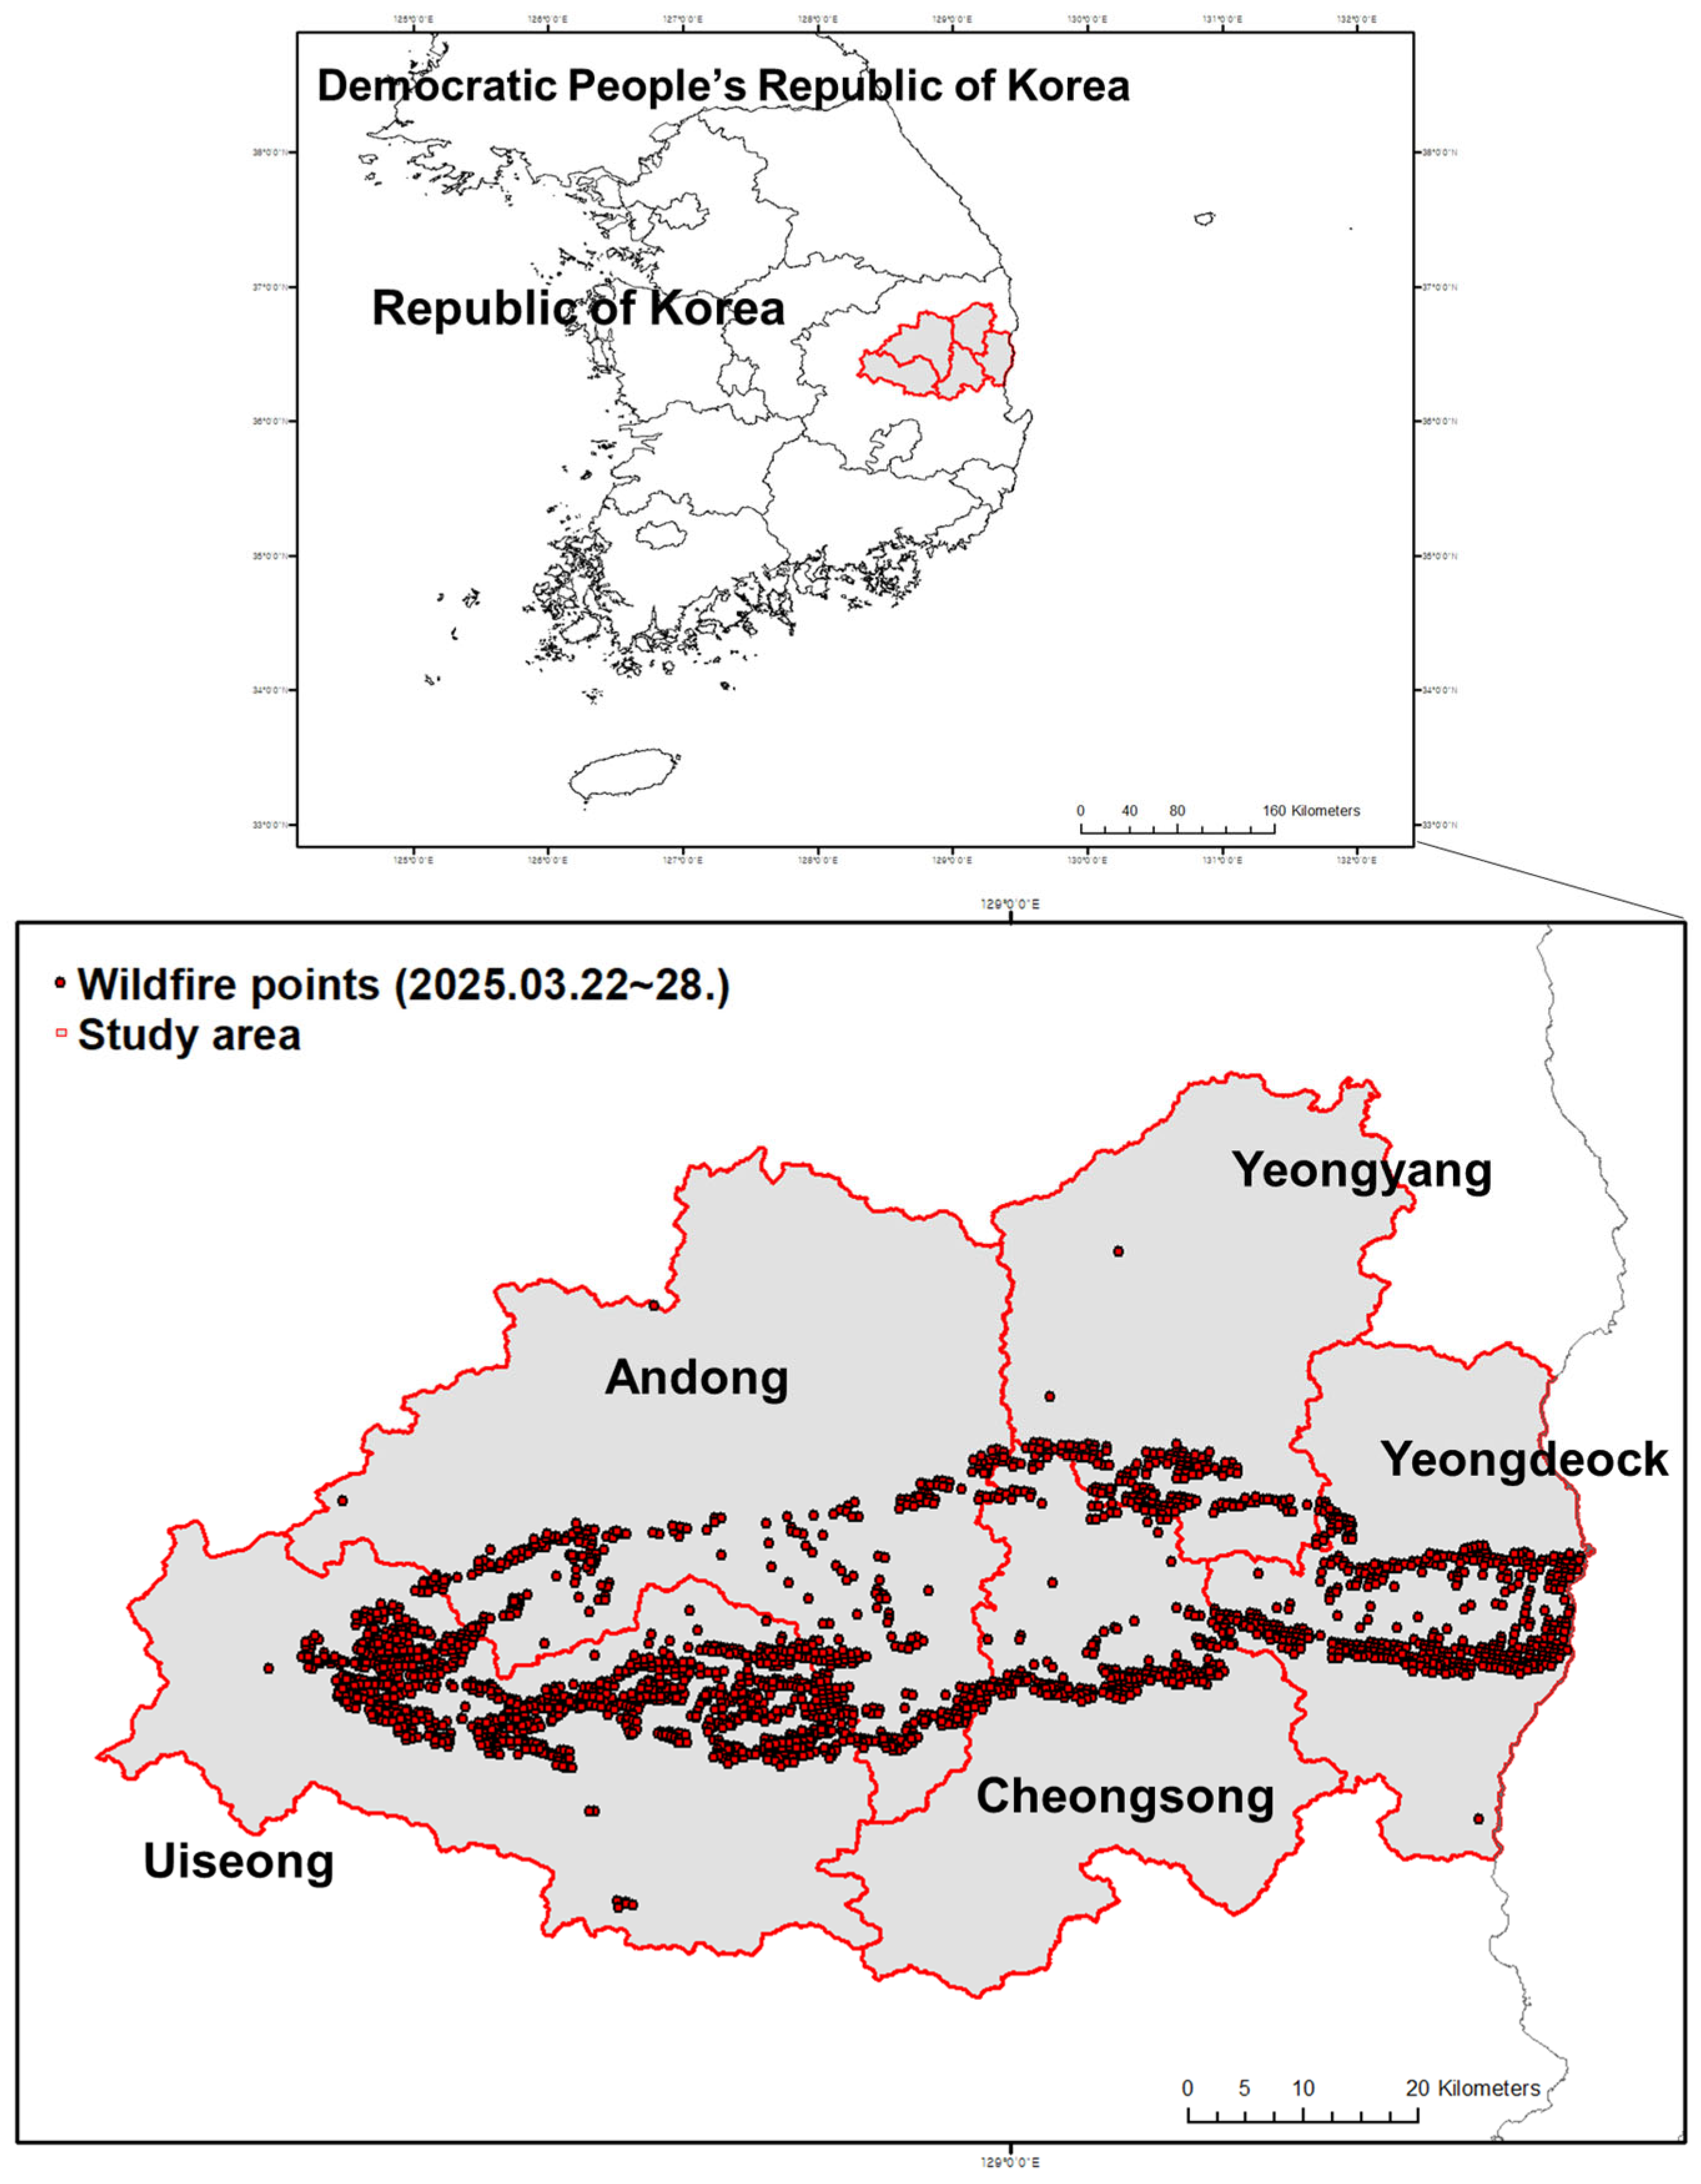
The study area encompasses five contiguous counties—Andong, Yeongyang, Uiseong, Cheongsong, and Yeongdeok—within Gyeongsangbuk-do Province, southeastern Republic of Korea (Figure 1). This region, covering approximately 19,000 km2, represents one of the country’s most forested and fire-prone provinces, with more than 70% of its land covered by mountainous forests dominated by Pinus densiflora and Pinus koraiensis. The Taebaek and Sobaek mountain ranges traverse the province in a north–south orientation, creating steep slopes, narrow valleys, and small agricultural basins that form a complex topographic setting conducive to rapid fire spread under dry conditions. This leeward topographic configuration also favors the development of Foehn-type downslope winds under strong westerly or northwesterly flow, producing warm, dry, and gusty conditions that further exacerbate spring wildfire outbreaks in eastern Korea.
Figure 1.
Location of the study area and wildfire distribution in Gyeongsangbuk-do Province, Korea.
Climatically, Gyeongbuk experiences a continental temperate climate characterized by cold, dry winters and strong spring winds. In March 2025, preceding and during the mega-fire event, the province recorded relative humidity below 20% and wind speeds exceeding 15 m s−1, conditions that collectively produced extreme fire-weather episodes comparable to those observed during Korea’s 2019 Gangwon wildfire [7,16]. Between 22 and 28 March 2025, a series of large wind-driven wildfires swept through the five target counties, burning approximately 16,000 ha of forest and damaging more than 400 structures. Fire-location data compiled from the Korea Forest Service and NASA FIRMS J2 VIIRS C2 datasets identified 2544 fire points, primarily distributed along mid-eastern ridgelines and valley corridors where dense coniferous stands and rural settlements intersect. Socio-environmentally, the study area exemplifies Korea’s aging rural landscape. As of 2023, 27.6% of residents were aged 65 years or older [22]. Many elderly inhabitants live in isolated villages adjacent to forests, where limited mobility, declining population density, and aged wooden housing heighten both ignition exposure and evacuation difficulty. Open burning of agricultural residues, maintenance fires near cemeteries, and unmanaged vegetation along the forest–village boundary further intensify the wildland–human interface (WUI) risk [23,24].
3. Methods
3.1. Study Framework
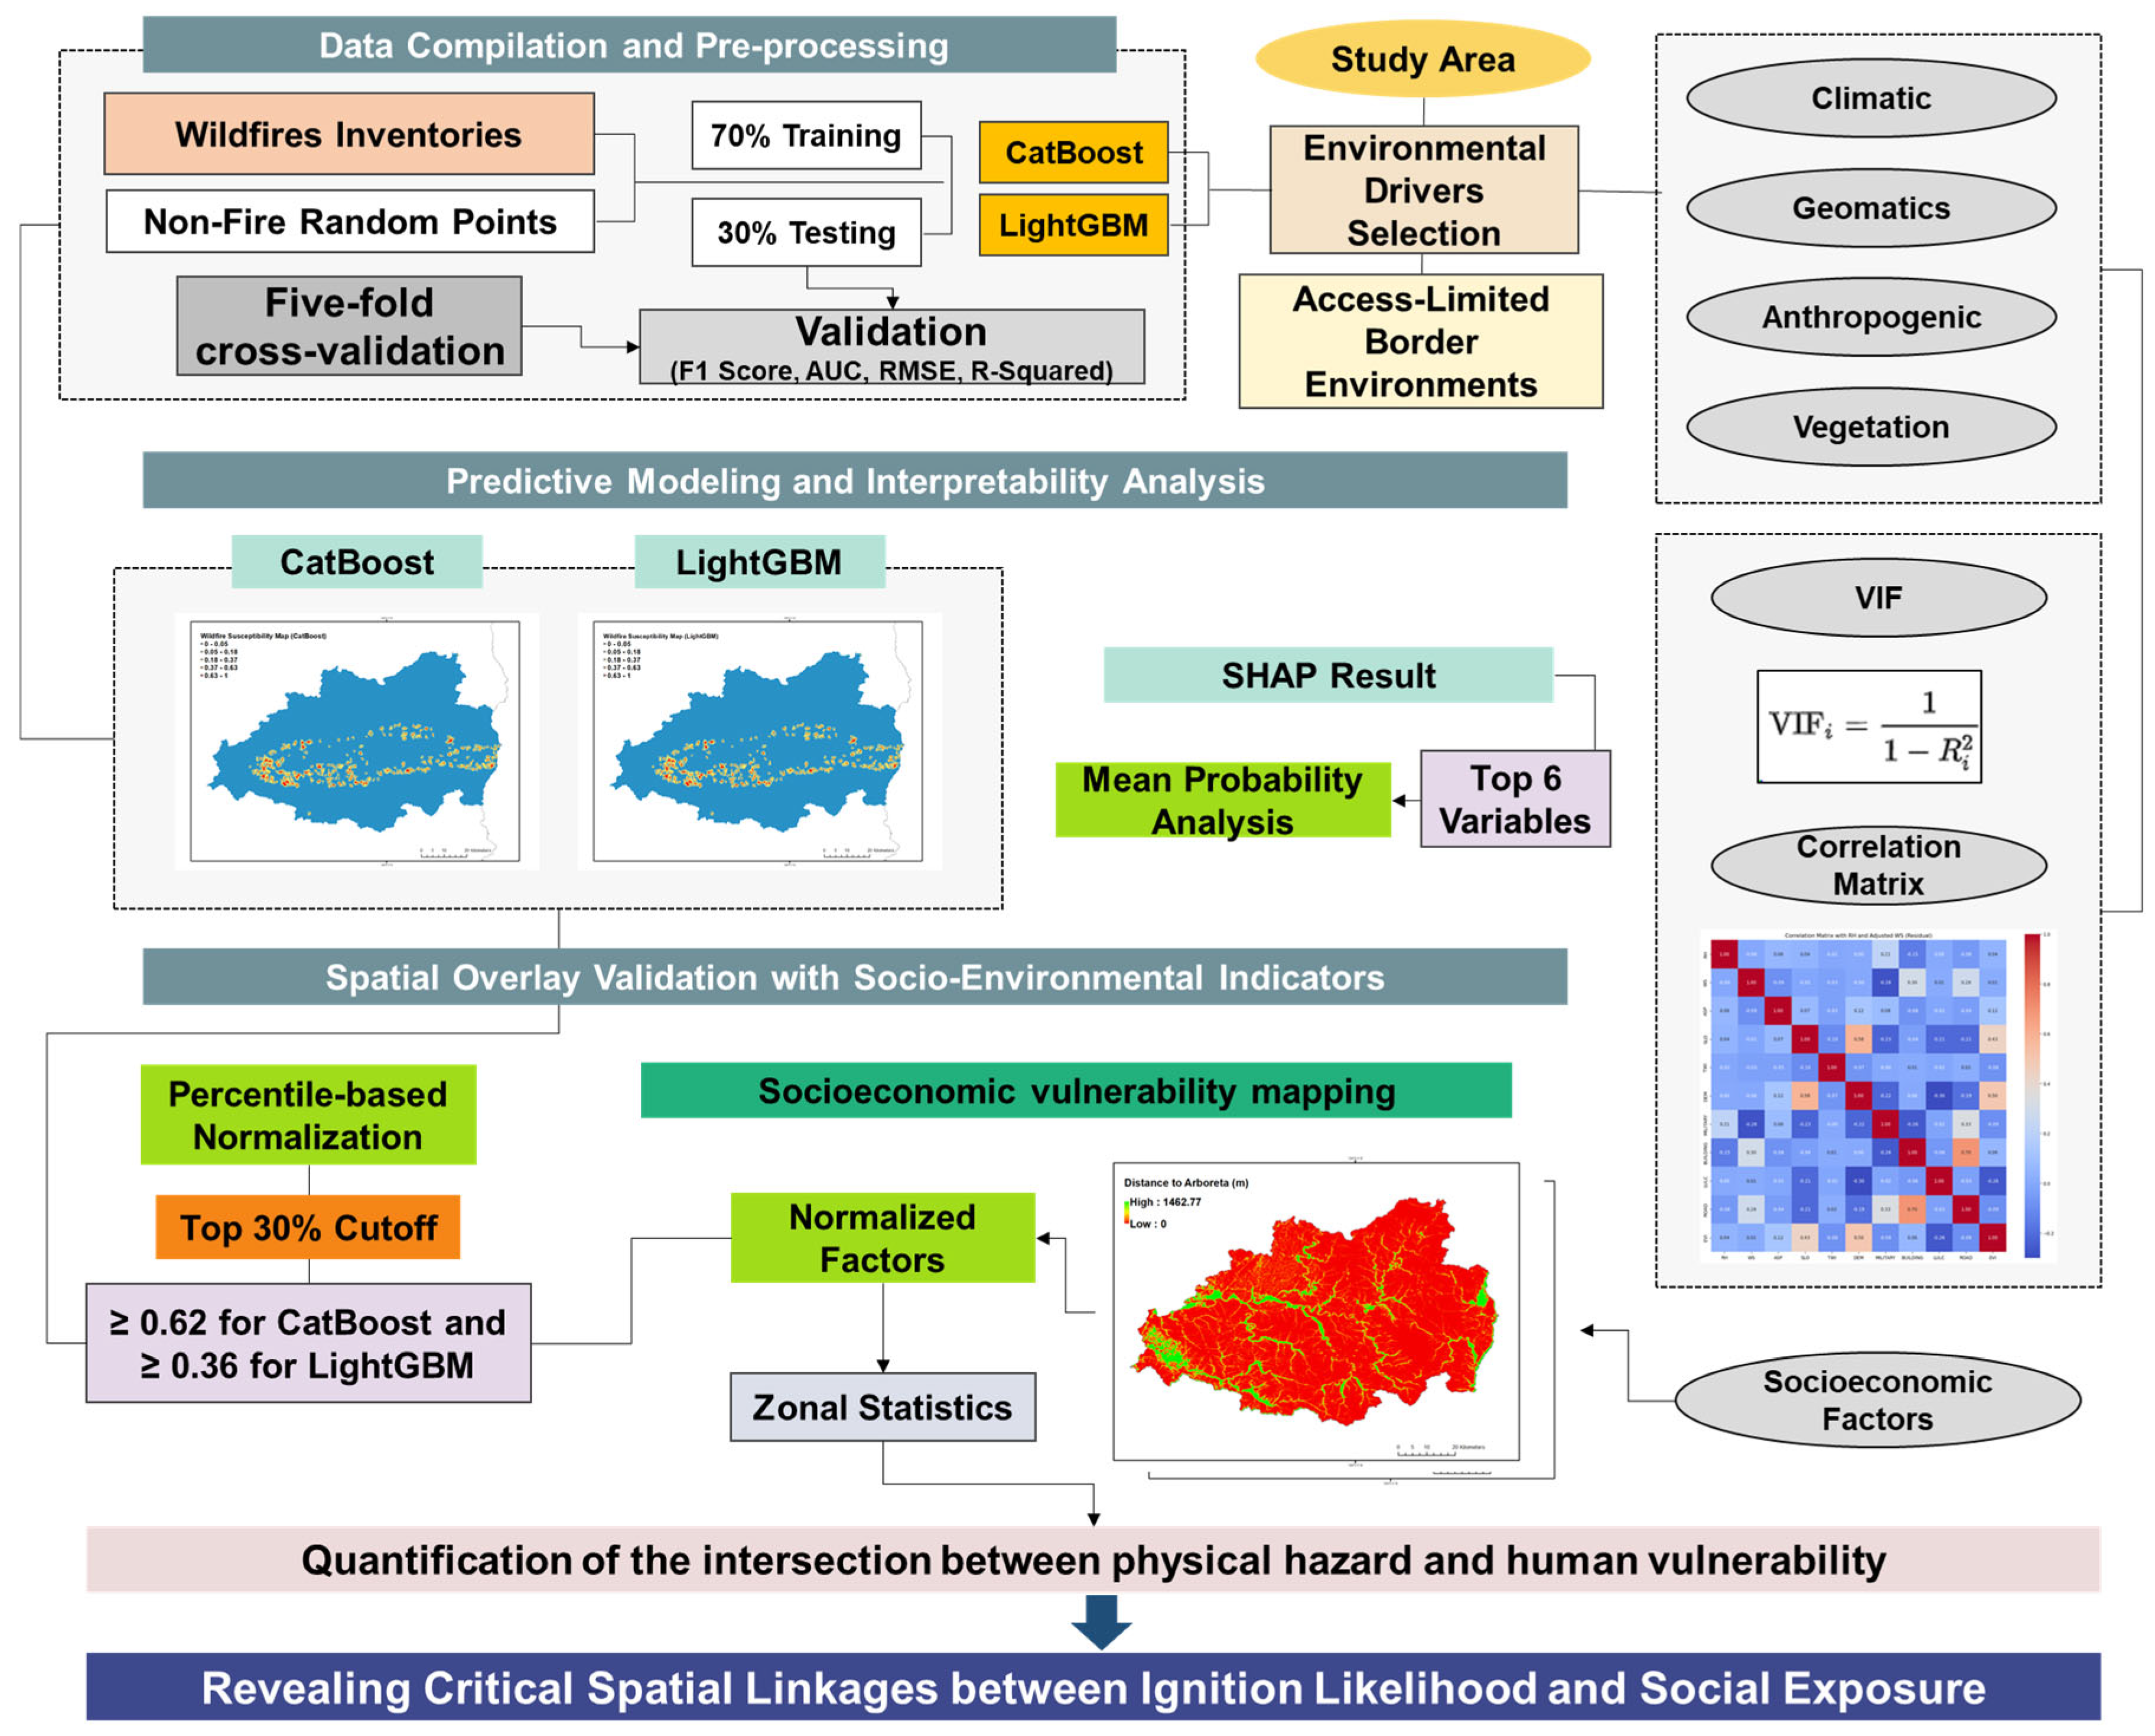
This study established a multi-stage analytical framework integrating environmental drivers, explainable machine-learning modeling, and socio-environmental vulnerability assessment to predict and interpret wildfire susceptibility across Gyeongsangbuk-do, Korea (Figure 2). The framework was designed to capture both the physical and human dimensions of wildfire ignition processes through three sequential phases: (1) data compilation and pre-processing, (2) predictive modeling and interpretability analysis, and (3) spatial overlay validation with socio-environmental indicators.
Figure 2.
Modeling framework.
In the first phase, climatic, topographic, vegetation, and anthropogenic variables were compiled from multi-source geospatial datasets. Climatic parameters—including relative humidity (RH), wind speed (WS), and temperature (TEMP)—were interpolated to a 1 km spatial resolution using Ordinary Kriging to ensure accurate surface representation. Terrain-related variables (elevation, slope, aspect, and topographic wetness index) and vegetation metrics (NDVI, land-cover type, and coniferous forest area > 30 ha) were extracted from digital elevation models and satellite-based products. Anthropogenic factors—including distance to roads, graves, mountain trails, and settlements—were derived from Euclidean distance rasters. All spatial layers were standardized to a common spatial reference system, extent, and resolution to ensure model compatibility.
In the second phase, wildfire occurrence data from 22 to 28 March 2025 (2544 ignition points) were integrated with threefold non-fire samples (7632 points) to achieve balanced class representation. The compiled dataset was used to train CatBoost and LightGBM models—two advanced gradient boosting algorithms capable of handling heterogeneous predictors. Model optimization was conducted through five-fold cross-validation to minimize overfitting and assess predictive stability. To enhance interpretability, the SHAP approach was applied to quantify both global and local feature contributions, providing transparent insights into how climatic and anthropogenic variables jointly influence ignition probability.
In the third phase, wildfire susceptibility maps derived from the models were classified using the Youden-optimal cutoff value (0.37) and the top 30% quantile to delineate high-susceptibility zones. These spatially explicit zones were subsequently overlaid with ten normalized socio-environmental indicators, including proximity to arboreta, campsites, commercial forest, cultural heritage sites, incineration facilities, national protected areas, forest recreation areas, substations, and wind power facilities. All overlay analyses and spatial summarization were conducted in ESRI ArcGIS Pro (version 10.4.1) using distance-to-feature calculations and the Zonal Statistics as Table tool. The overlay analysis enabled quantification of the intersection between physical hazard and human vulnerability, and statistical summarization produced mean proximity scores for each indicator within high-susceptibility cells, revealing critical spatial linkages between ignition likelihood and social exposure.
3.2. Predictor Variables for Wildfire Risk Modeling
We selected predictor variables representing climatic, topographic, vegetation/land-use, and anthropogenic factors relevant to wildfire ignition and early spread (Table 1, Figure A1). All variables and abbreviations used in this study are defined in Appendix A Table A1 for clarity and reproducibility. Climatic variables included minimum relative humidity, maximum wind speed, and maximum temperature from KMA, and land surface temperature from Landsat. Although solar radiation intensity is an important driver of fuel drying, it was not included as a separate predictor because its effects are largely captured by temperature- and humidity-related variables and because high-resolution daily radiation data were not consistently available for the study period. With respect to vegetation characteristics, tree species and intraspecific variations can influence fuel moisture and flammability; however, species-level fuel parameters were not explicitly included due to limitations in the spatial resolution and consistency of available forest inventory data. Instead, fuel condition was represented using land-cover type, NDVI, and the distance to large contiguous coniferous stands (PINE30), which capture the dominant fuel structure and continuity at the regional scale. Regarding topographic influences on wind, parameters specifically designed to diagnose Foehn-type or downslope wind formation were not explicitly included because such winds are mesoscale phenomena that depend on dynamic atmospheric conditions as well as terrain. Instead, their potential effects were indirectly represented through observed maximum wind speed and basic terrain attributes (slope and aspect), which reflect local exposure to wind forcing during the event. Point-based meteorological observations were spatially interpolated using ordinary and universal kriging to minimize cross-validated Root Mean Square Error (RMSE) and ensure unbiased residuals. Prior to interpolation, large-scale spatial trends were examined and universal kriging was tested for selected variables, but cross-validation showed no systematic improvement over ordinary kriging; therefore, ordinary kriging was adopted as the primary method for consistency and numerical stability. Topographic variables (DEM, slope, aspect, topographic wetness index) and vegetation/land-use parameters (NDVI, land-use/land-cover from Sentinel-2, coniferous stand area > 30 ha) were compiled from national and satellite sources. Anthropogenic factors included distances to roads, buildings, forest roads, mountain trail density, distance to graves, and population density.
All raster layers were resampled to a 1 km grid and projected to a common coordinate reference system. This spatial resolution was adopted to balance regional-scale climatic gradients and human accessibility patterns, and to capture spatial exposure gradients while reducing noise from fine-scale positional uncertainty in ignition records, as widely applied in regional wildfire susceptibility studies [25,26]. Wildfire presence points (n = 2544) were obtained from Korea Forest Service records and NASA FIRMS (22–28 March 2025), and non-fire background points (n = 7632) were randomly selected at a 1:3 ratio, avoiding proximity to fire pixels to preserve environmental comparability and dataset balance.
Table 1.
Selected list of environmental drivers, data sources, period, and references used for fire risk.
3.3. Modeling Approaches
We employed two gradient-boosting decision tree models—CatBoost and LightGBM—to predict wildfire presence probability for each 1 km grid cell using climatic, topographic, vegetation/land-use, and anthropogenic predictors. CatBoost was selected for its ordered boosting mechanism, native handling of categorical variables, and robustness to missing data, whereas LightGBM was chosen for its leaf-wise splitting strategy, histogram-based binning, and scalability for large datasets, allowing robust cross-model validation of both predictive performance and interpretability across two complementary boosting frameworks. Continuous predictors were standardized where appropriate, categorical predictors were used directly, and class imbalance (1:3 fire to non-fire samples) was mitigated through balanced sampling and class-weighting. Although XGBoost is a widely used gradient-boosting algorithm in wildfire susceptibility studies, it was not included in the present comparison for two main reasons. First, CatBoost and LightGBM already represent complementary state-of-the-art boosting frameworks with distinct algorithmic advantages—ordered boosting in CatBoost and histogram-based, leaf-wise optimization in LightGBM—providing a balanced basis for methodological comparison. Second, preliminary tests indicated that XGBoost produced highly similar performance to LightGBM for this dataset, and including an additional, closely related boosting model would add limited methodological insight while increasing computational redundancy.
Hyperparameters were optimized using five-fold stratified cross-validation—randomized search for CatBoost and Bayesian optimization for LightGBM—with the final tuned values summarized in Table A2. Calibration was evaluated using reliability curves and the Brier score, where reliability curves assess the agreement between predicted probabilities and observed event frequencies and the Brier score summarizes the mean squared error of probabilistic predictions, with lower values indicating better calibration. Sensitivity analyses varying background sampling ratios (1:1, 1:2, and 1:3) and spatial folds demonstrated stable performance, with only marginal variation in key metrics including AUC, recall, and precision (AUC variation < 0.02), indicating that model performance was robust to moderate changes in class balance owing to the combined use of balanced sampling and class-weighting strategies. Model interpretation relied on SHAP values to derive global and local feature contributions, identify nonlinear responses, and map spatial heterogeneity, supported by partial dependence and accumulated local effects plots. To classify susceptibility, two complementary thresholding strategies were used: (1) a Youden Index cutoff (0.37) derived from ROC optimization to establish an optimal binary decision boundary for model validation, and (2) a top 30% probability quantile applied to each model to delineate high-susceptibility zones in a scale-independent manner for spatial overlay analyses. The Youden-optimal cutoff value (0.37) was determined from the ROC curve as the probability threshold that maximizes the Youden Index (sensitivity + specificity − 1), thereby providing the best trade-off between false positives and false negatives for binary classification performance. This value does not correspond to a high-probability percentile, but reflects the point of maximum discriminatory power given the class imbalance in the dataset. In contrast, the top 30% quantile threshold was not used for statistical classification, but was introduced solely to delineate relatively high-susceptibility zones for spatial comparison and socio-environmental overlay analysis in a scale-independent manner; the two thresholds therefore serve complementary but analytically distinct purposes, namely statistical validation versus spatial prioritization.
Performance metrics—including AUC, PR curves, F1 score, and calibration statistics—confirmed high predictive accuracy (CatBoost AUC = 0.910; LightGBM AUC = 0.907), and spatial validation showed that more than 80% of observed burned pixels occurred within the top 30% susceptibility zones, demonstrating robustness and operational utility of the modeling framework. These two thresholds therefore serve complementary but non-overlapping analytical roles.
To classify susceptibility, two complementary thresholding strategies were used: (1) a Youden Index cutoff (0.37) derived from ROC optimization to establish an optimal binary decision boundary for model validation, and (2) a top 30% probability quantile applied to each model to delineate high-susceptibility zones in a scale-independent manner for spatial overlay analyses. Performance metrics—including AUC, PR curves, F1 score, and calibration statistics—confirmed high predictive accuracy (CatBoost AUC = 0.910; LightGBM AUC = 0.907), and spatial validation showed that more than 80% of observed burned pixels occurred within the top 30% susceptibility zones, demonstrating robustness and operational utility of the modeling framework. Two thresholds were applied for distinct purposes. The Youden Index cutoff (0.37) was used solely for statistical validation to define an optimal decision boundary for binary classification. In contrast, the top 30% quantile of predicted probabilities was used to delineate relatively high-susceptibility zones in the spatial analyses, enabling model-agnostic comparison across CatBoost and LightGBM despite their differing probability scales. These thresholds therefore serve complementary but non-overlapping analytical roles.
3.4. Post-Model Analysis of Key Variable Responses
To interpret how environmental and anthropogenic predictors influenced wildfire susceptibility, a post-model comparative analysis was performed using the CatBoost and LightGBM outputs. The seven most influential SHAP-ranked variables—maximum temperature (TEMP), relative humidity (RH), wind speed (WS), distance to mountain trail (MT_TRAIL), distance to grave (GRAVE), distance to forest road (FOREST_ROAD), and distance to large coniferous forest (PINE30)—were selected to explore how climatic stress, vegetation structure, and human accessibility collectively shaped ignition patterns across Gyeongsangbuk-do.
Predicted wildfire susceptibility maps from both models were first standardized and combined with the spatial predictor layers. Cells falling within the top 30% quantile of predicted probability were classified as high-susceptibility zones, while the remaining 70% were grouped as lower-susceptibility zones. The 30% threshold was derived from receiver-operating-characteristic (ROC) optimization using the Youden Index, ensuring balanced sensitivity and specificity across the two models.
For each variable, mean values were calculated within both susceptibility classes to quantify the direction and magnitude of change (Δ = Top 30% − Others). These contrasts were compared between CatBoost and LightGBM results to evaluate model consistency and interpretability. Statistical summarization was implemented in Python 3.9 using the Spyder integrated development environment (version 5.5.1; Anaconda distribution), with pandas, NumPy, and Matplotlib libraries, and spatial verification was performed using the Zonal Statistics tool, enabling integration of the post-model metrics into the socio-environmental vulnerability framework (Section 4.5).
3.5. Socio-Environmental Vulnerability Integration
To ensure consistent spatial coverage across models with different probability scales, the high-susceptibility threshold was defined as the top 30% of predicted wildfire probabilities within each model (≥0.62 for CatBoost and ≥0.36 for LightGBM). This percentile-based normalization allowed direct spatial comparison between models.
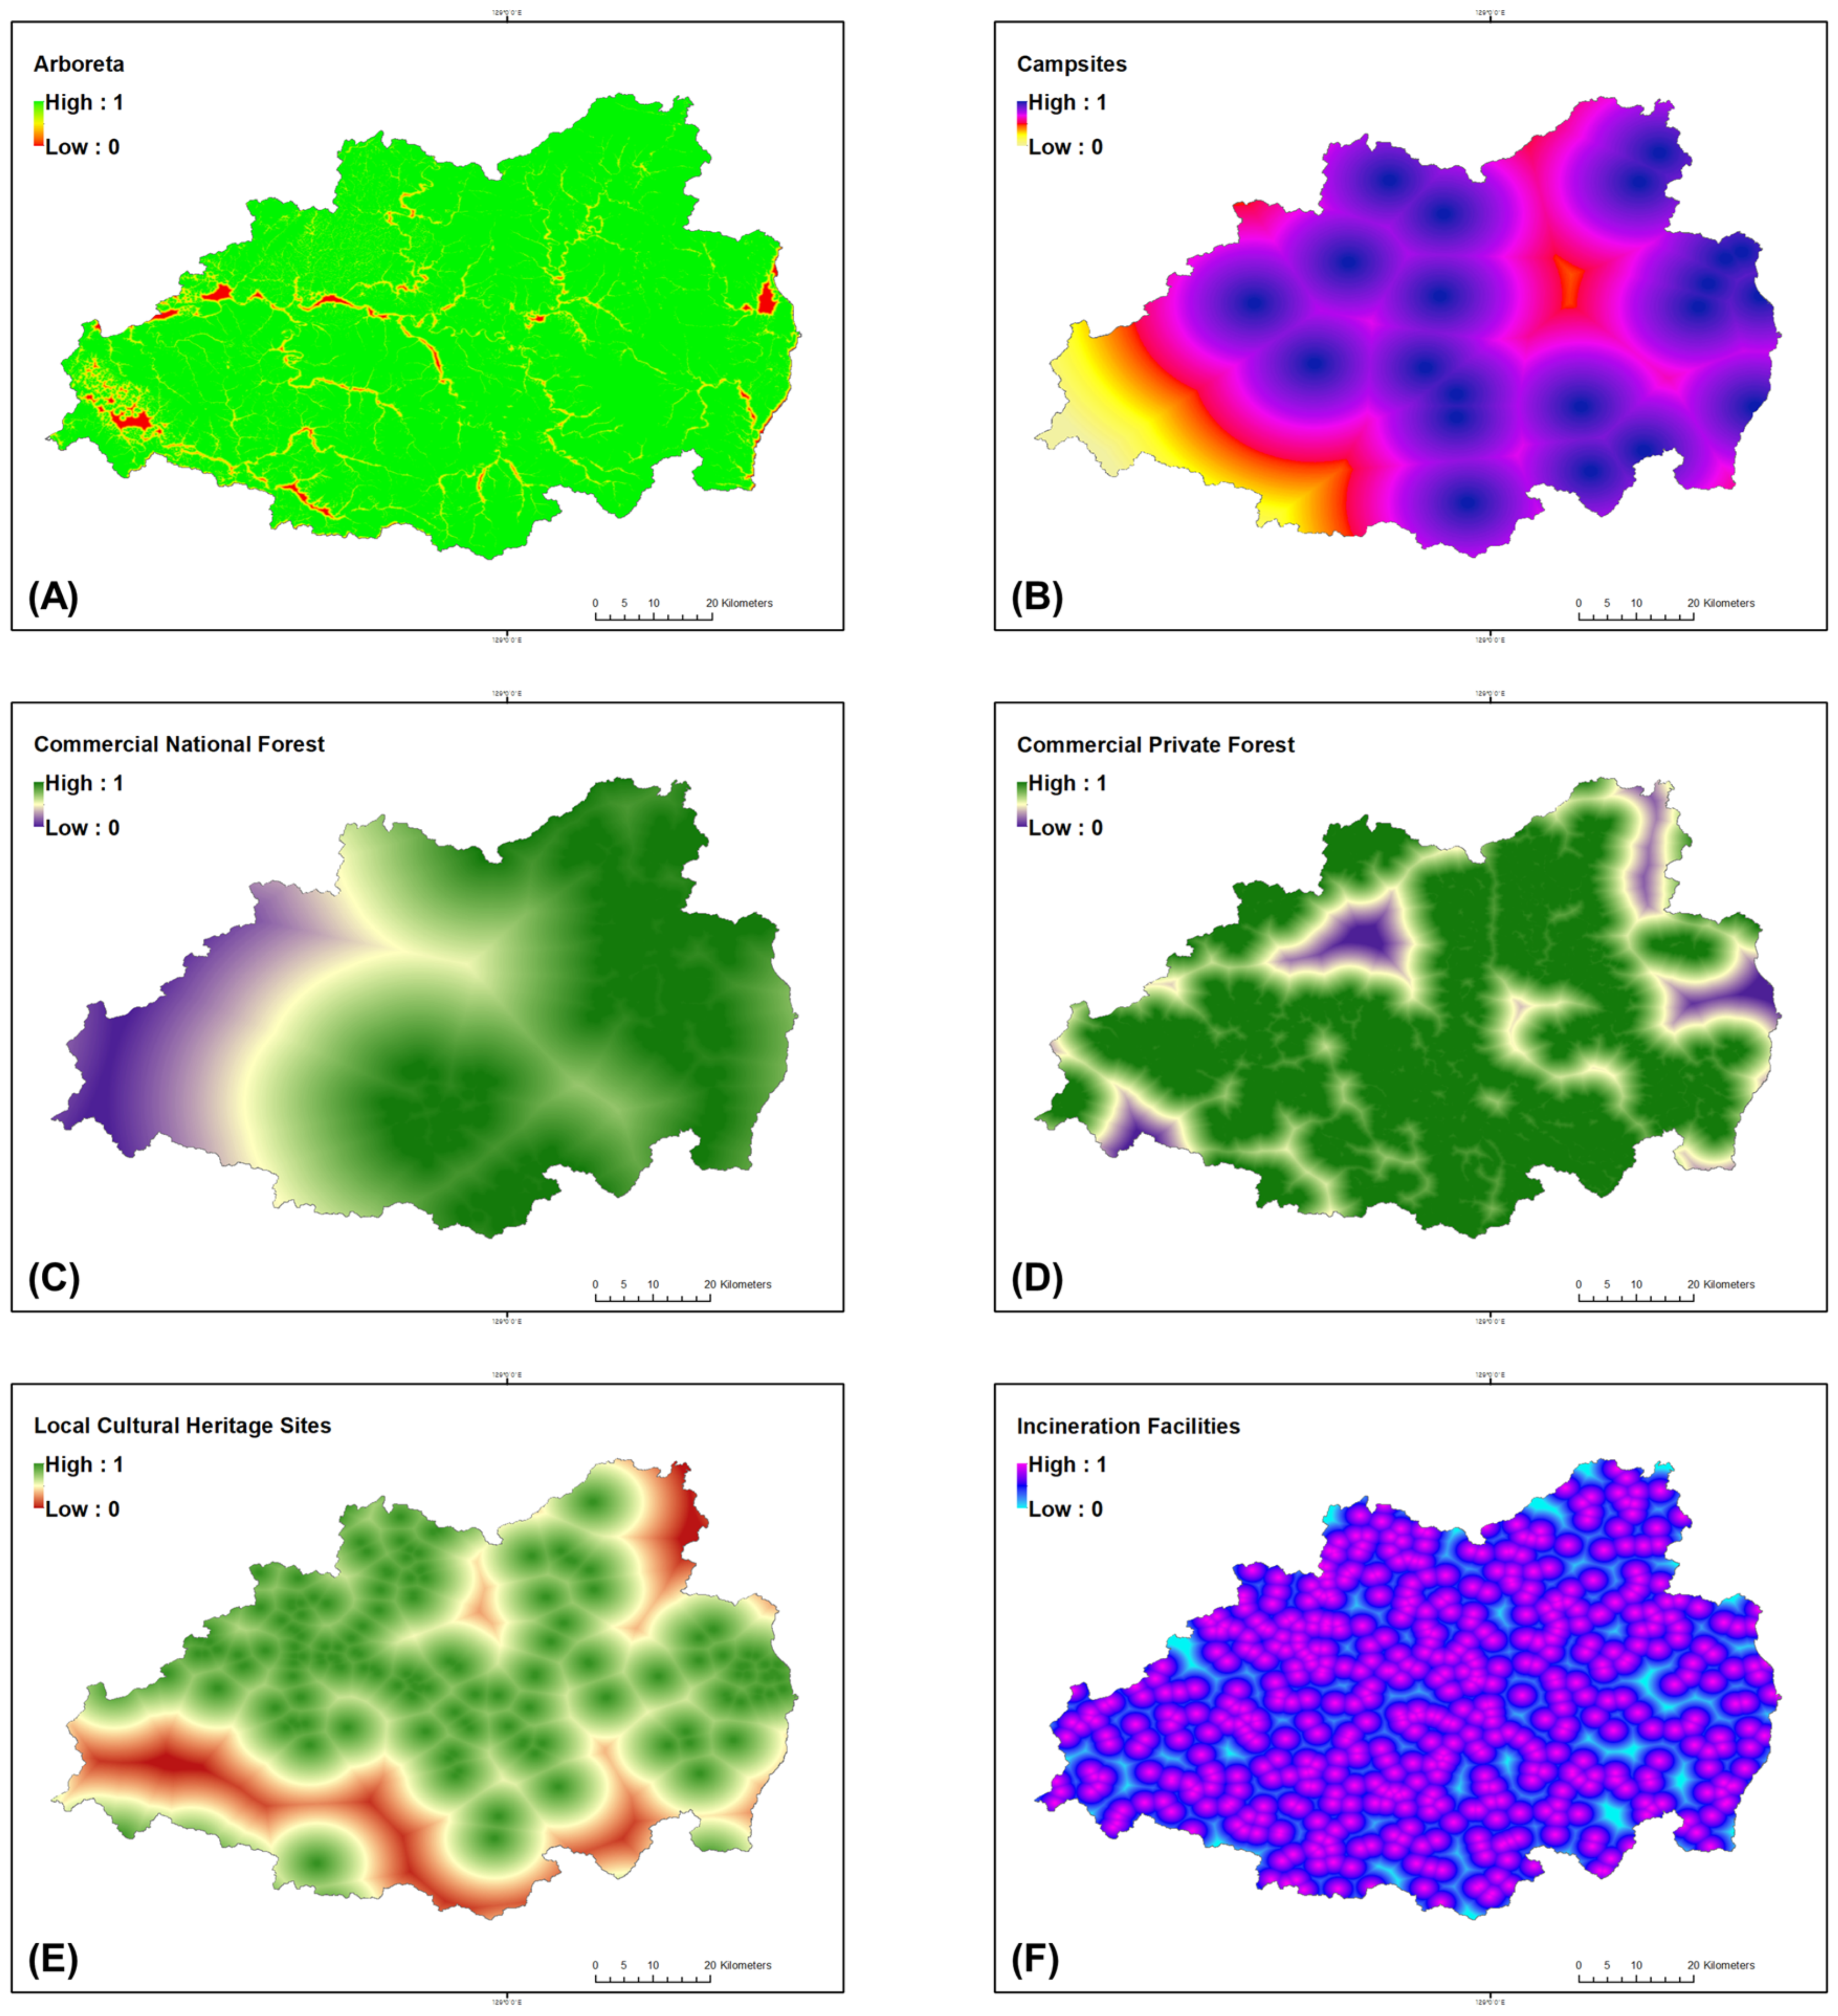
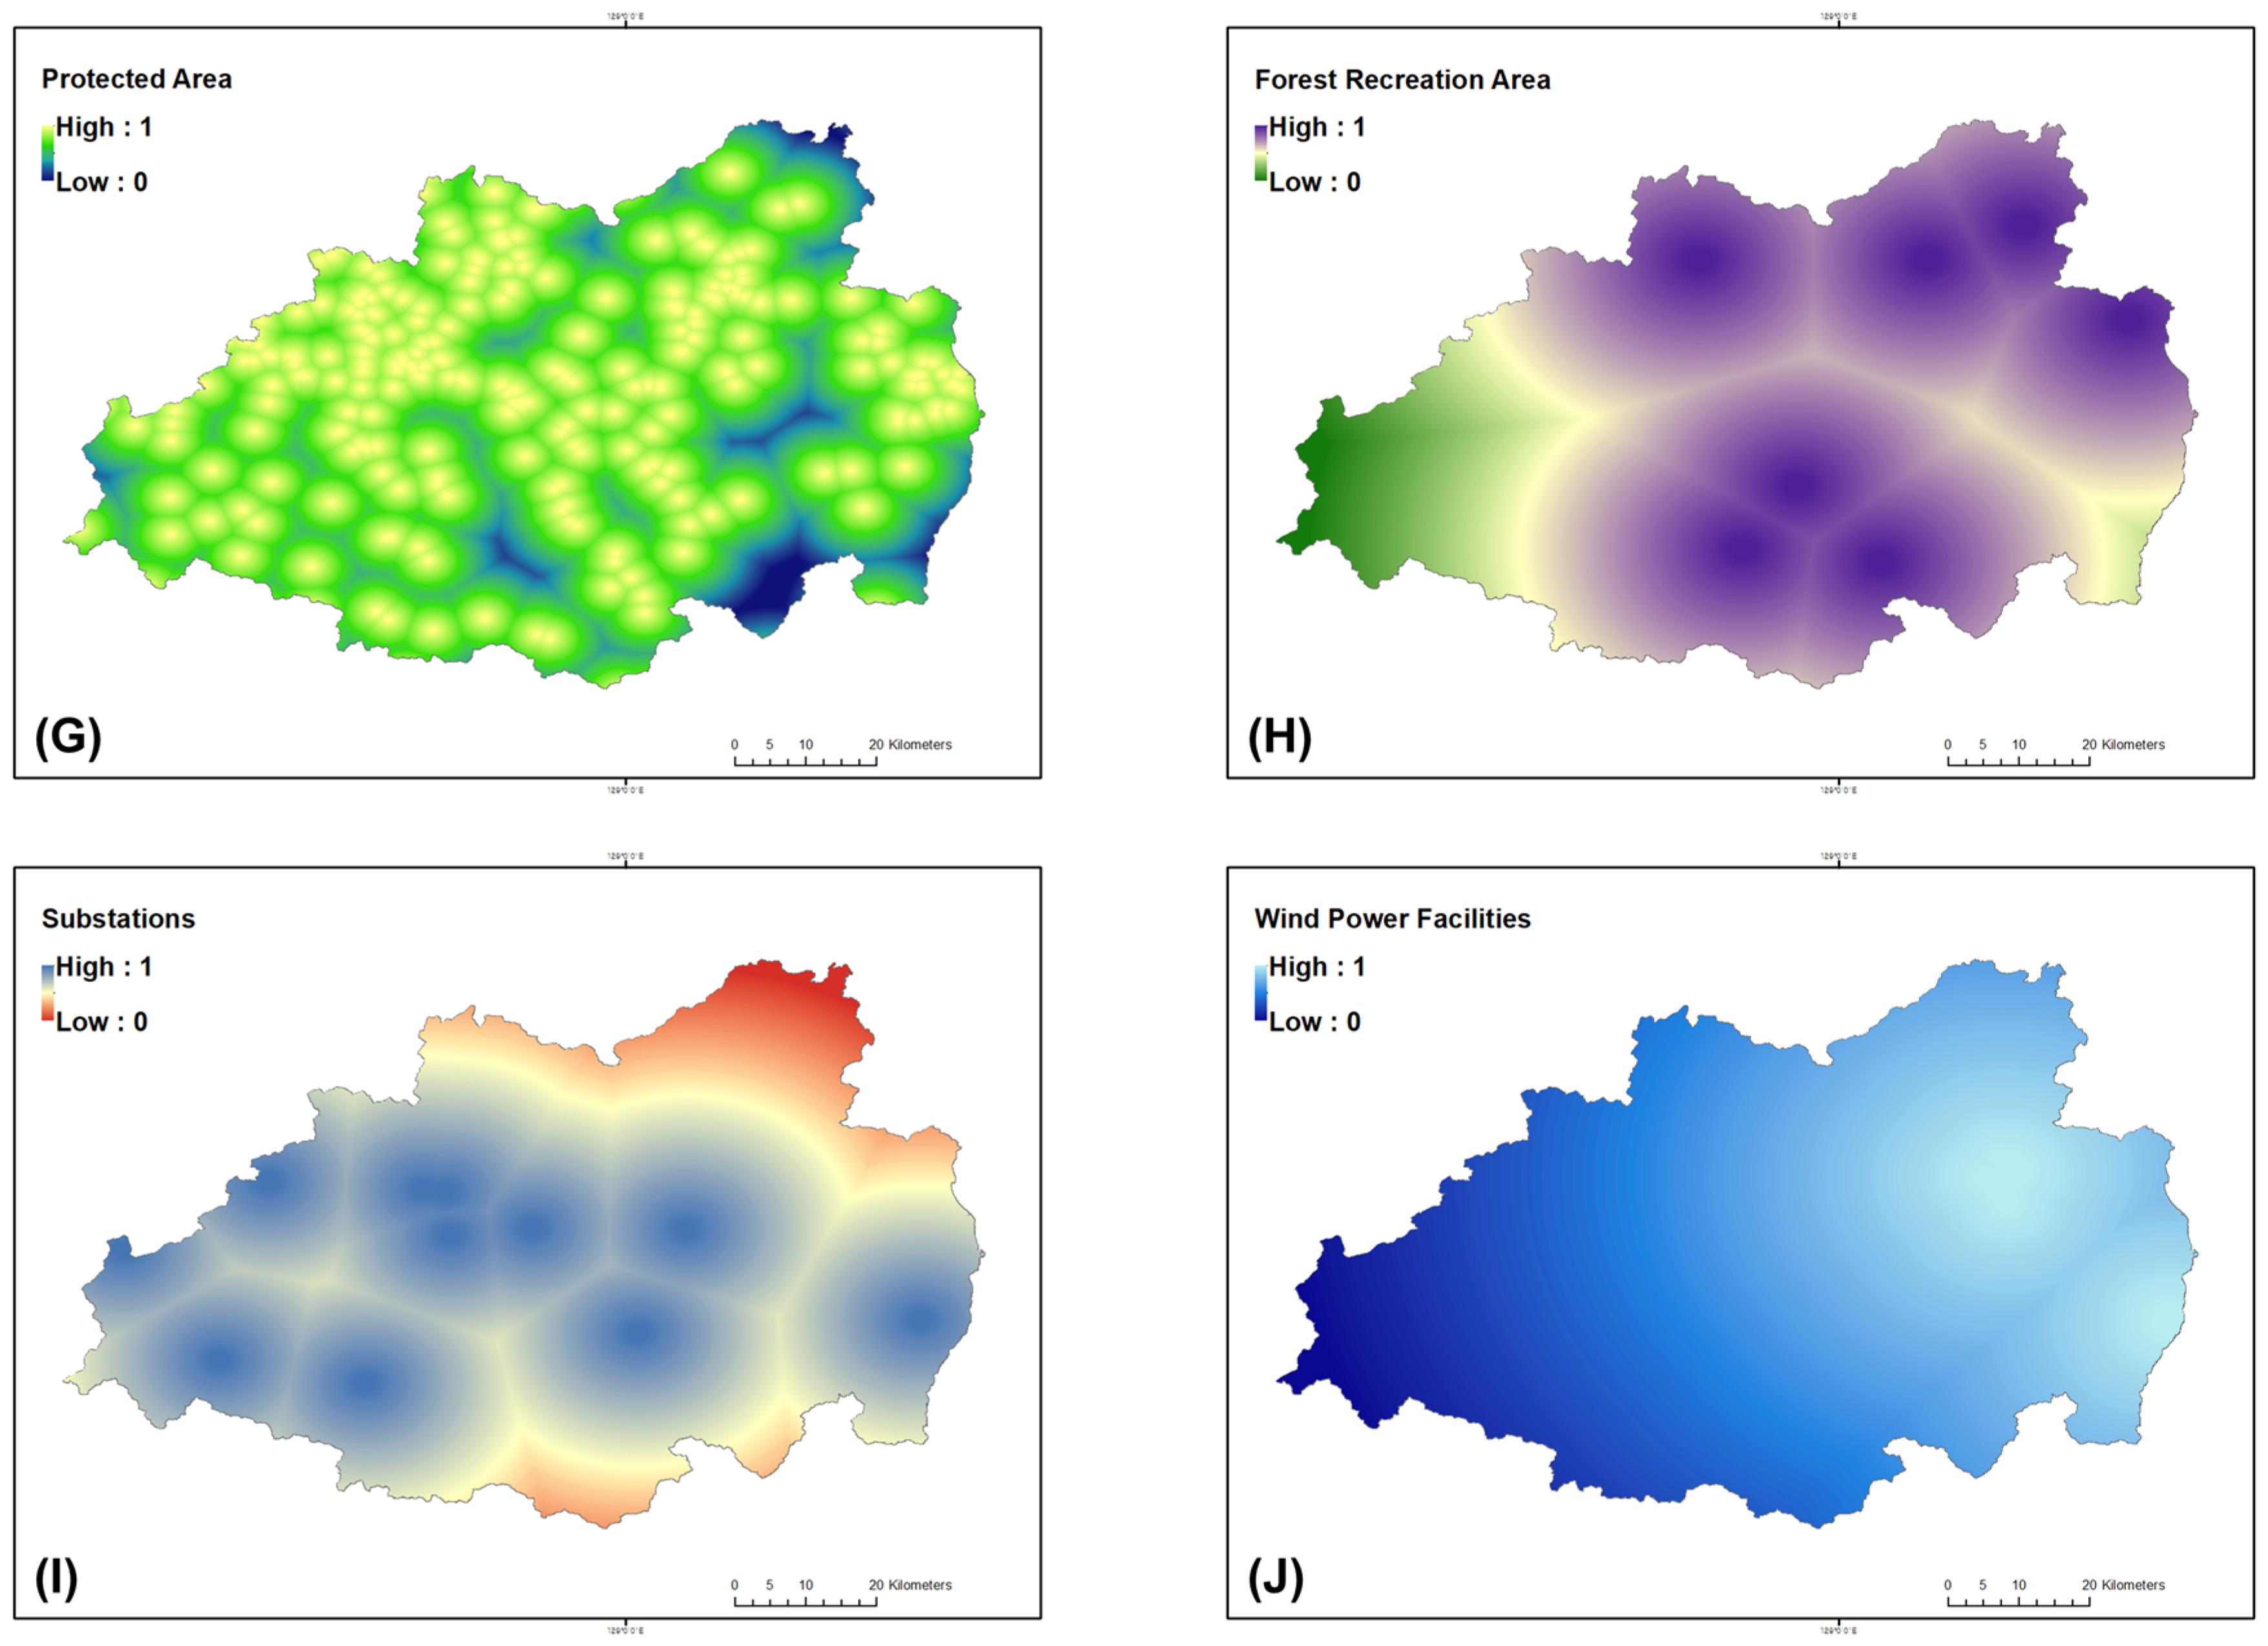
To evaluate the spatial alignment between wildfire susceptibility and human-related exposure, ten socio-environmental indicators (Figure A2)—including distances to arboreta, campsites, commercial forests (national and private), cultural heritage sites, incineration facilities, protected areas, forest recreation areas, substations, and wind power plants—were converted into Euclidean distance rasters. Each layer was then normalized to a 0–1 scale using min–max normalization in the Raster Calculator (Figure A3), where smaller distances yielded higher normalized proximity values (Equation (1)). Min–max scaling was adopted to facilitate direct comparison and spatial overlay among heterogeneous distance-based variables and to preserve relative spatial contrasts for intuitive susceptibility mapping.
where is the Euclidean distance raster, and P denotes the normalized proximity index.
Subsequently, the Zonal Statistics as Table tool was applied to calculate the mean normalized proximity values of each indicator within the high- and low-susceptibility zones. This process quantified the degree of spatial overlap between wildfire-prone areas and socio-environmental features, forming the analytical foundation for the socio-vulnerability comparison presented in Section 4.
4. Results
4.1. Model Validation and Multicollinearity Assessment
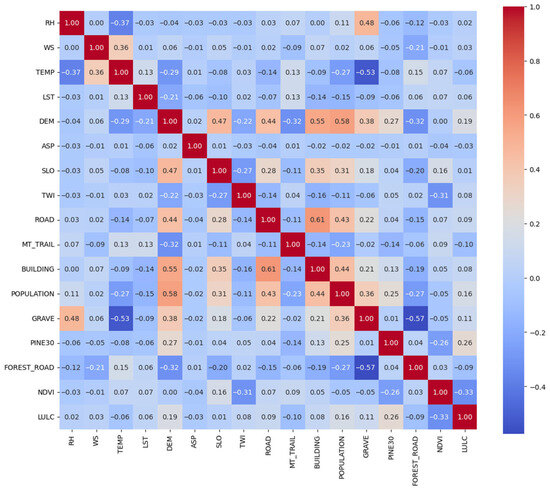
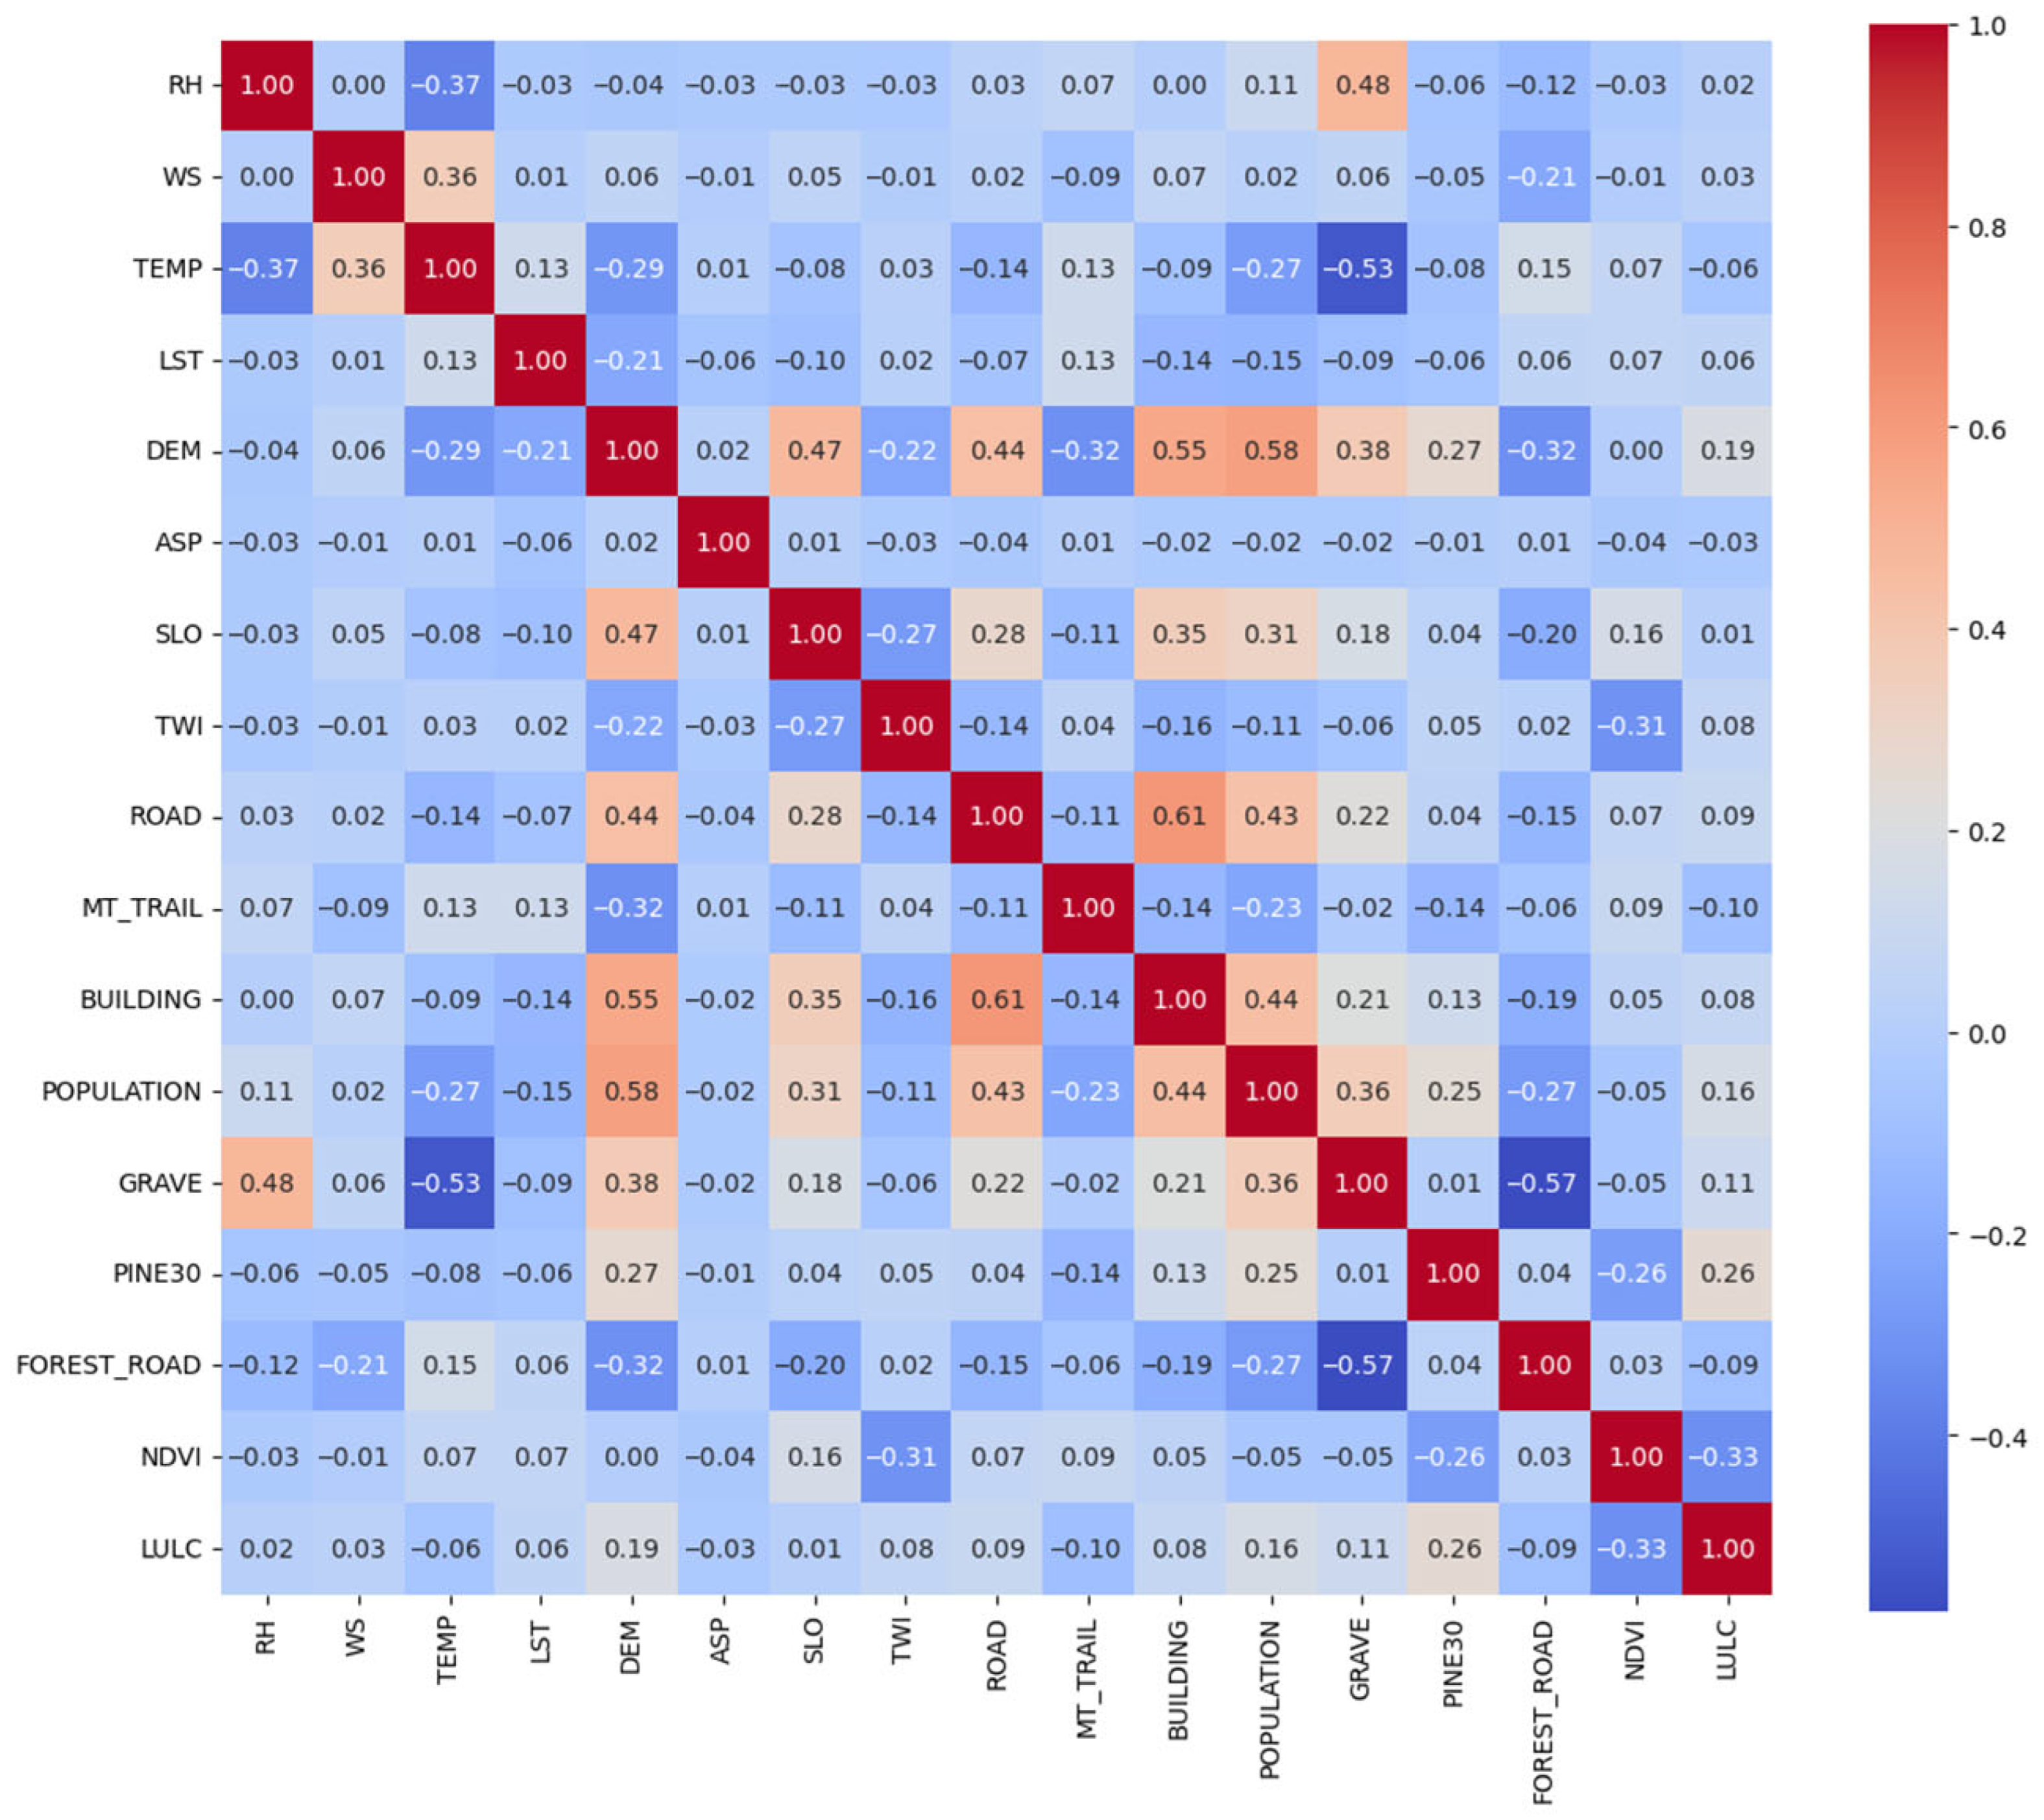
Pairwise correlation analysis and Variance Inflation Factor (VIF) tests were performed to assess multicollinearity among the 17 environmental predictors (Table 2). Most pairwise correlation coefficients were below |0.5| (Figure 3), indicating low to moderate inter-variable relationships. The strongest negative correlation was detected between relative humidity (RH) and maximum temperature (TEMP) (r = −0.37). Wind speed (WS) showed moderate positive correlations with elevation (r = 0.29) and slope (r = 0.28). Anthropogenic variables such as distance to buildings, population density, and distance to forest roads exhibited weak correlations (|r| < 0.3) with climatic and topographic predictors.
Table 2.
VIF results for selected predictors. All variables fall below the collinearity threshold (VIF < 5), confirming independence suitable for machine-learning modeling and SHAP interpretation.
Figure 3.
Correlation matrix of the 17 environmental drivers used in wildfire prediction. Low to moderate inter-variable correlations (|r| < 0.5) indicate minimal redundancy and balanced representation across climatic, topographic, vegetation, and human-related factors.
VIF values ranged from 1.02 to 2.77, all below the common multicollinearity threshold of 5. The highest VIF was observed for distance to grave (2.77), whereas aspect (ASP) and land cover (LULC) exhibited the lowest values (1.02 and 1.22, respectively). These results confirm that no predictor showed excessive linear dependency, and all variables were retained for subsequent modeling.
4.2. Model Performance and SHAP Interpretation
4.2.1. Predictive Performance
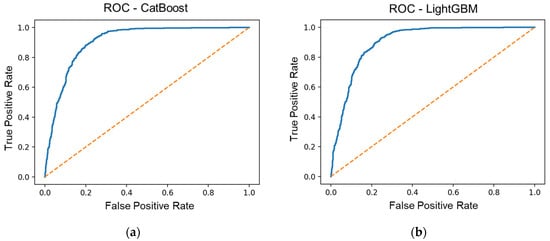
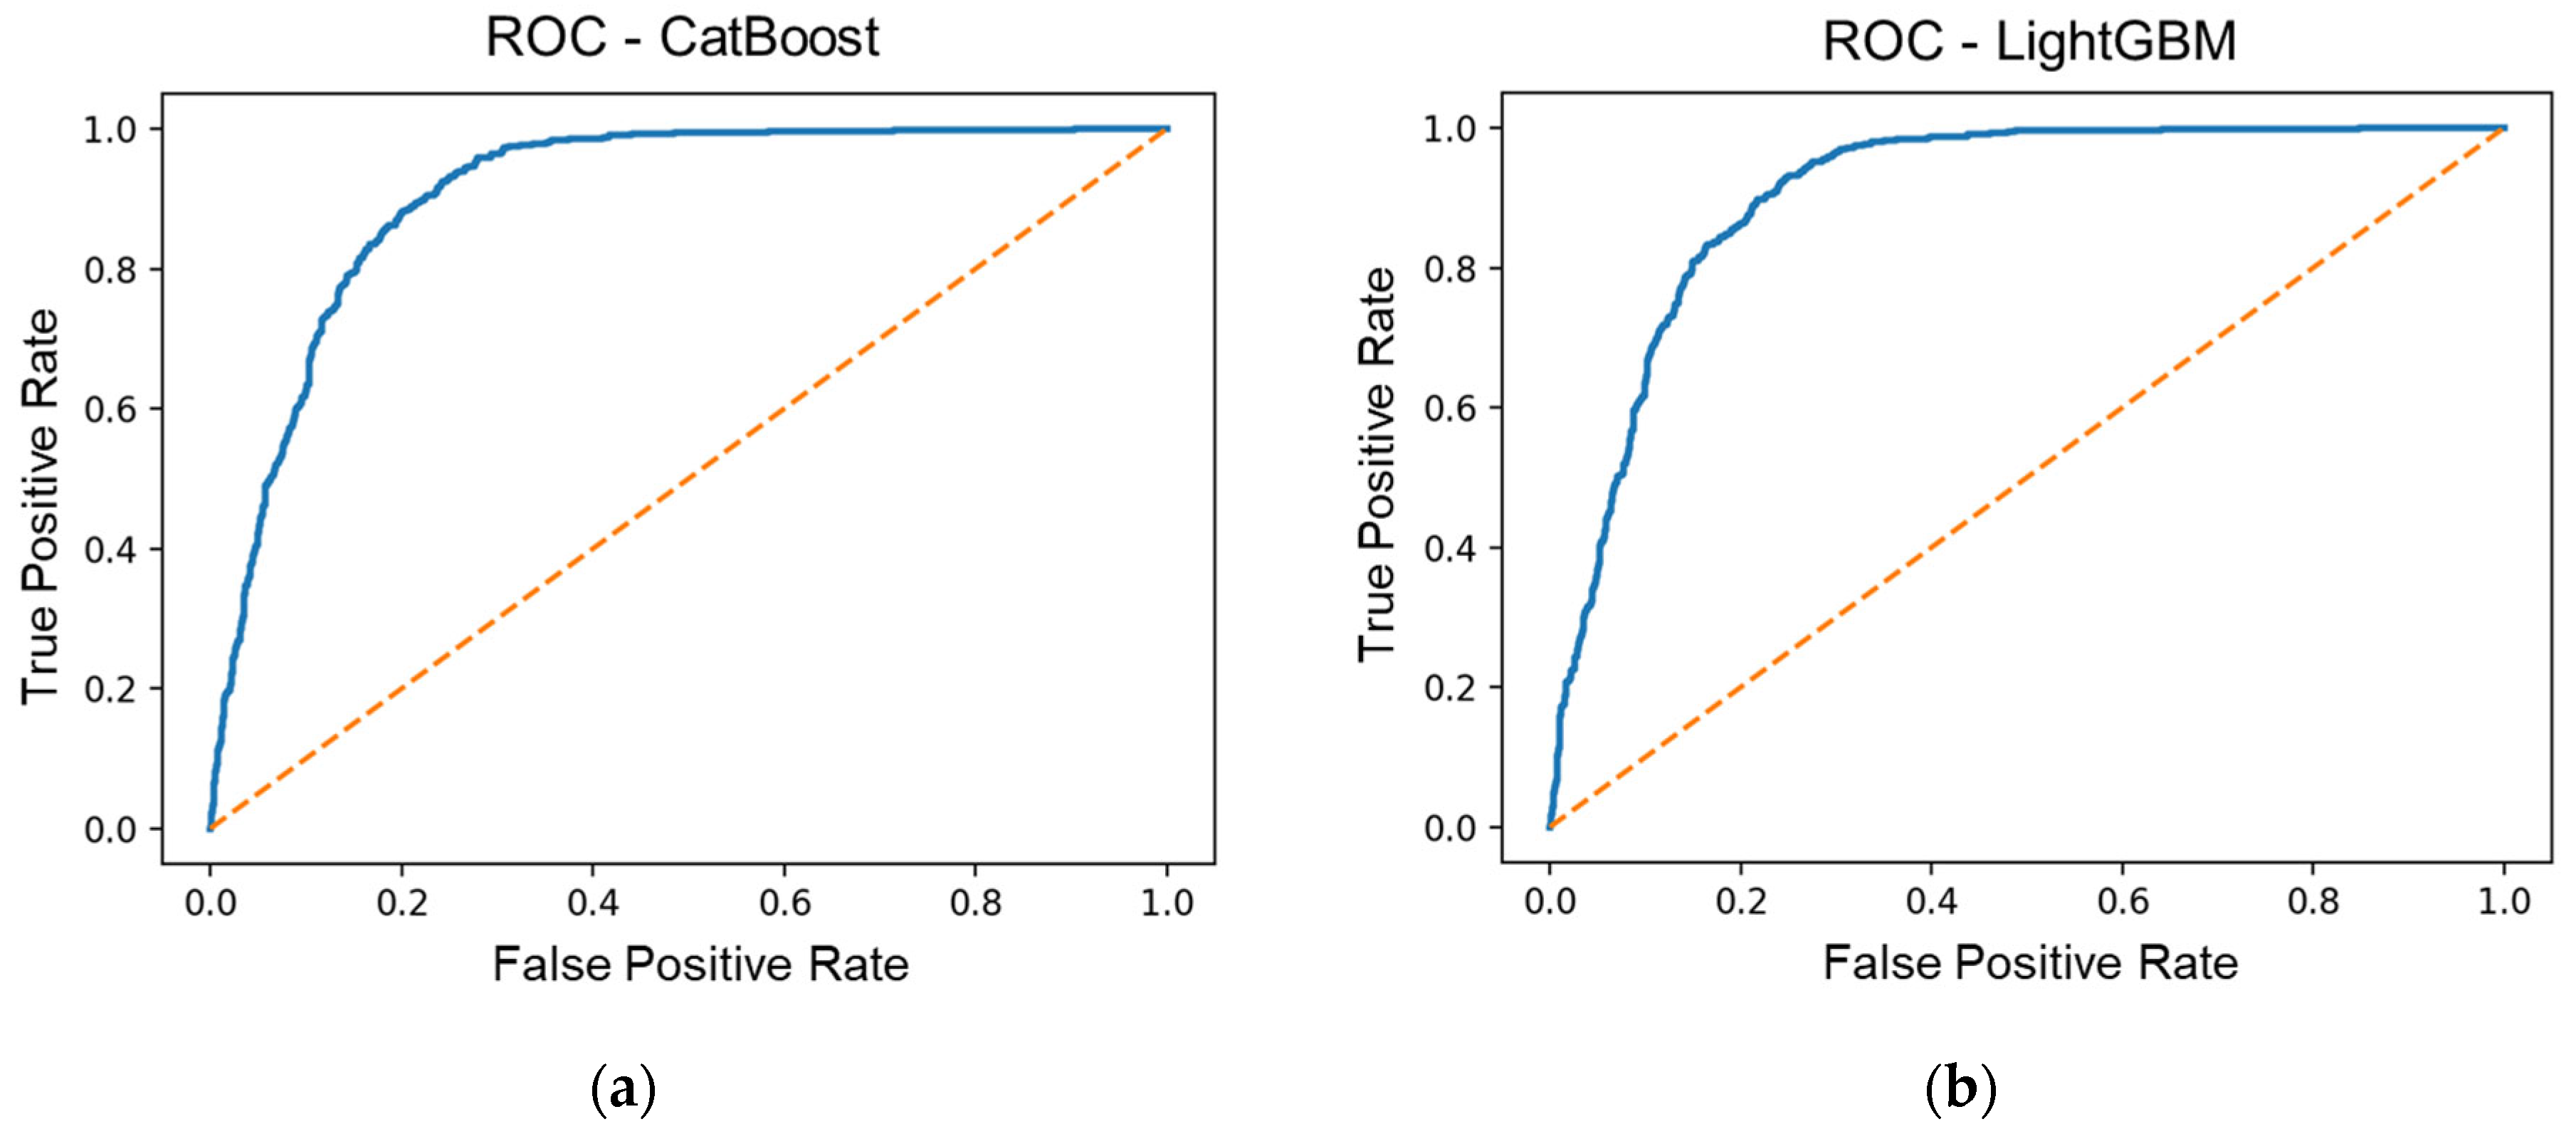
Both CatBoost and LightGBM achieved strong predictive accuracy for wildfire occurrence during the March 2025 event (Figure 4). The PR curves demonstrate robust discrimination capacity, particularly under high recall (>0.8) thresholds. CatBoost achieved slightly higher average precision (0.81) compared to LightGBM (0.78), suggesting superior sensitivity to minority (fire) samples and better handling of the moderate class imbalance.
Figure 4.
Receiver operating characteristic (ROC) curves for (a) the CatBoost and (b) the LightGBM models. The solid blue lines represent model performance, and the dashed diagonal line indicates the performance of a random classifier. Both models show strong discriminative ability, with AUC values of 0.910 (CatBoost) and 0.907 (LightGBM).
The consistent precision level above 0.7 across most recall ranges indicates that both gradient-boosting models effectively captured the complex relationships between climatic, topographic, and anthropogenic factors influencing wildfire ignition. Model stability across cross-validation folds was confirmed by low standard deviations in AUC and PRC scores (<0.03), as summarized in the validation metrics (Table A3). In comparison with previous wildfire susceptibility studies, conventional statistical and machine-learning models typically report AUC values in the range of 0.70–0.90 at the regional scale [57,58,59]. The AUC values exceeding 0.90 obtained by both CatBoost and LightGBM in the present study therefore indicate state-of-the-art predictive performance under extreme fire-weather conditions, while the use of SHAP-based interpretation provides an additional advantage in terms of model transparency.
The performance difference between models was marginal, confirming that both algorithms are well suited for mixed-type environmental data. CatBoost’s categorical encoding advantage and LightGBM’s histogram-based learning contributed to efficient convergence and low overfitting, as evidenced by consistent training–test loss trajectories.
4.2.2. SHAP-Based Variable Importance
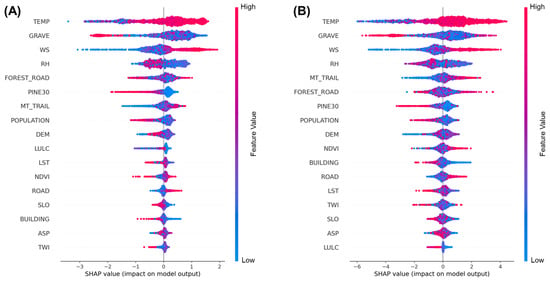
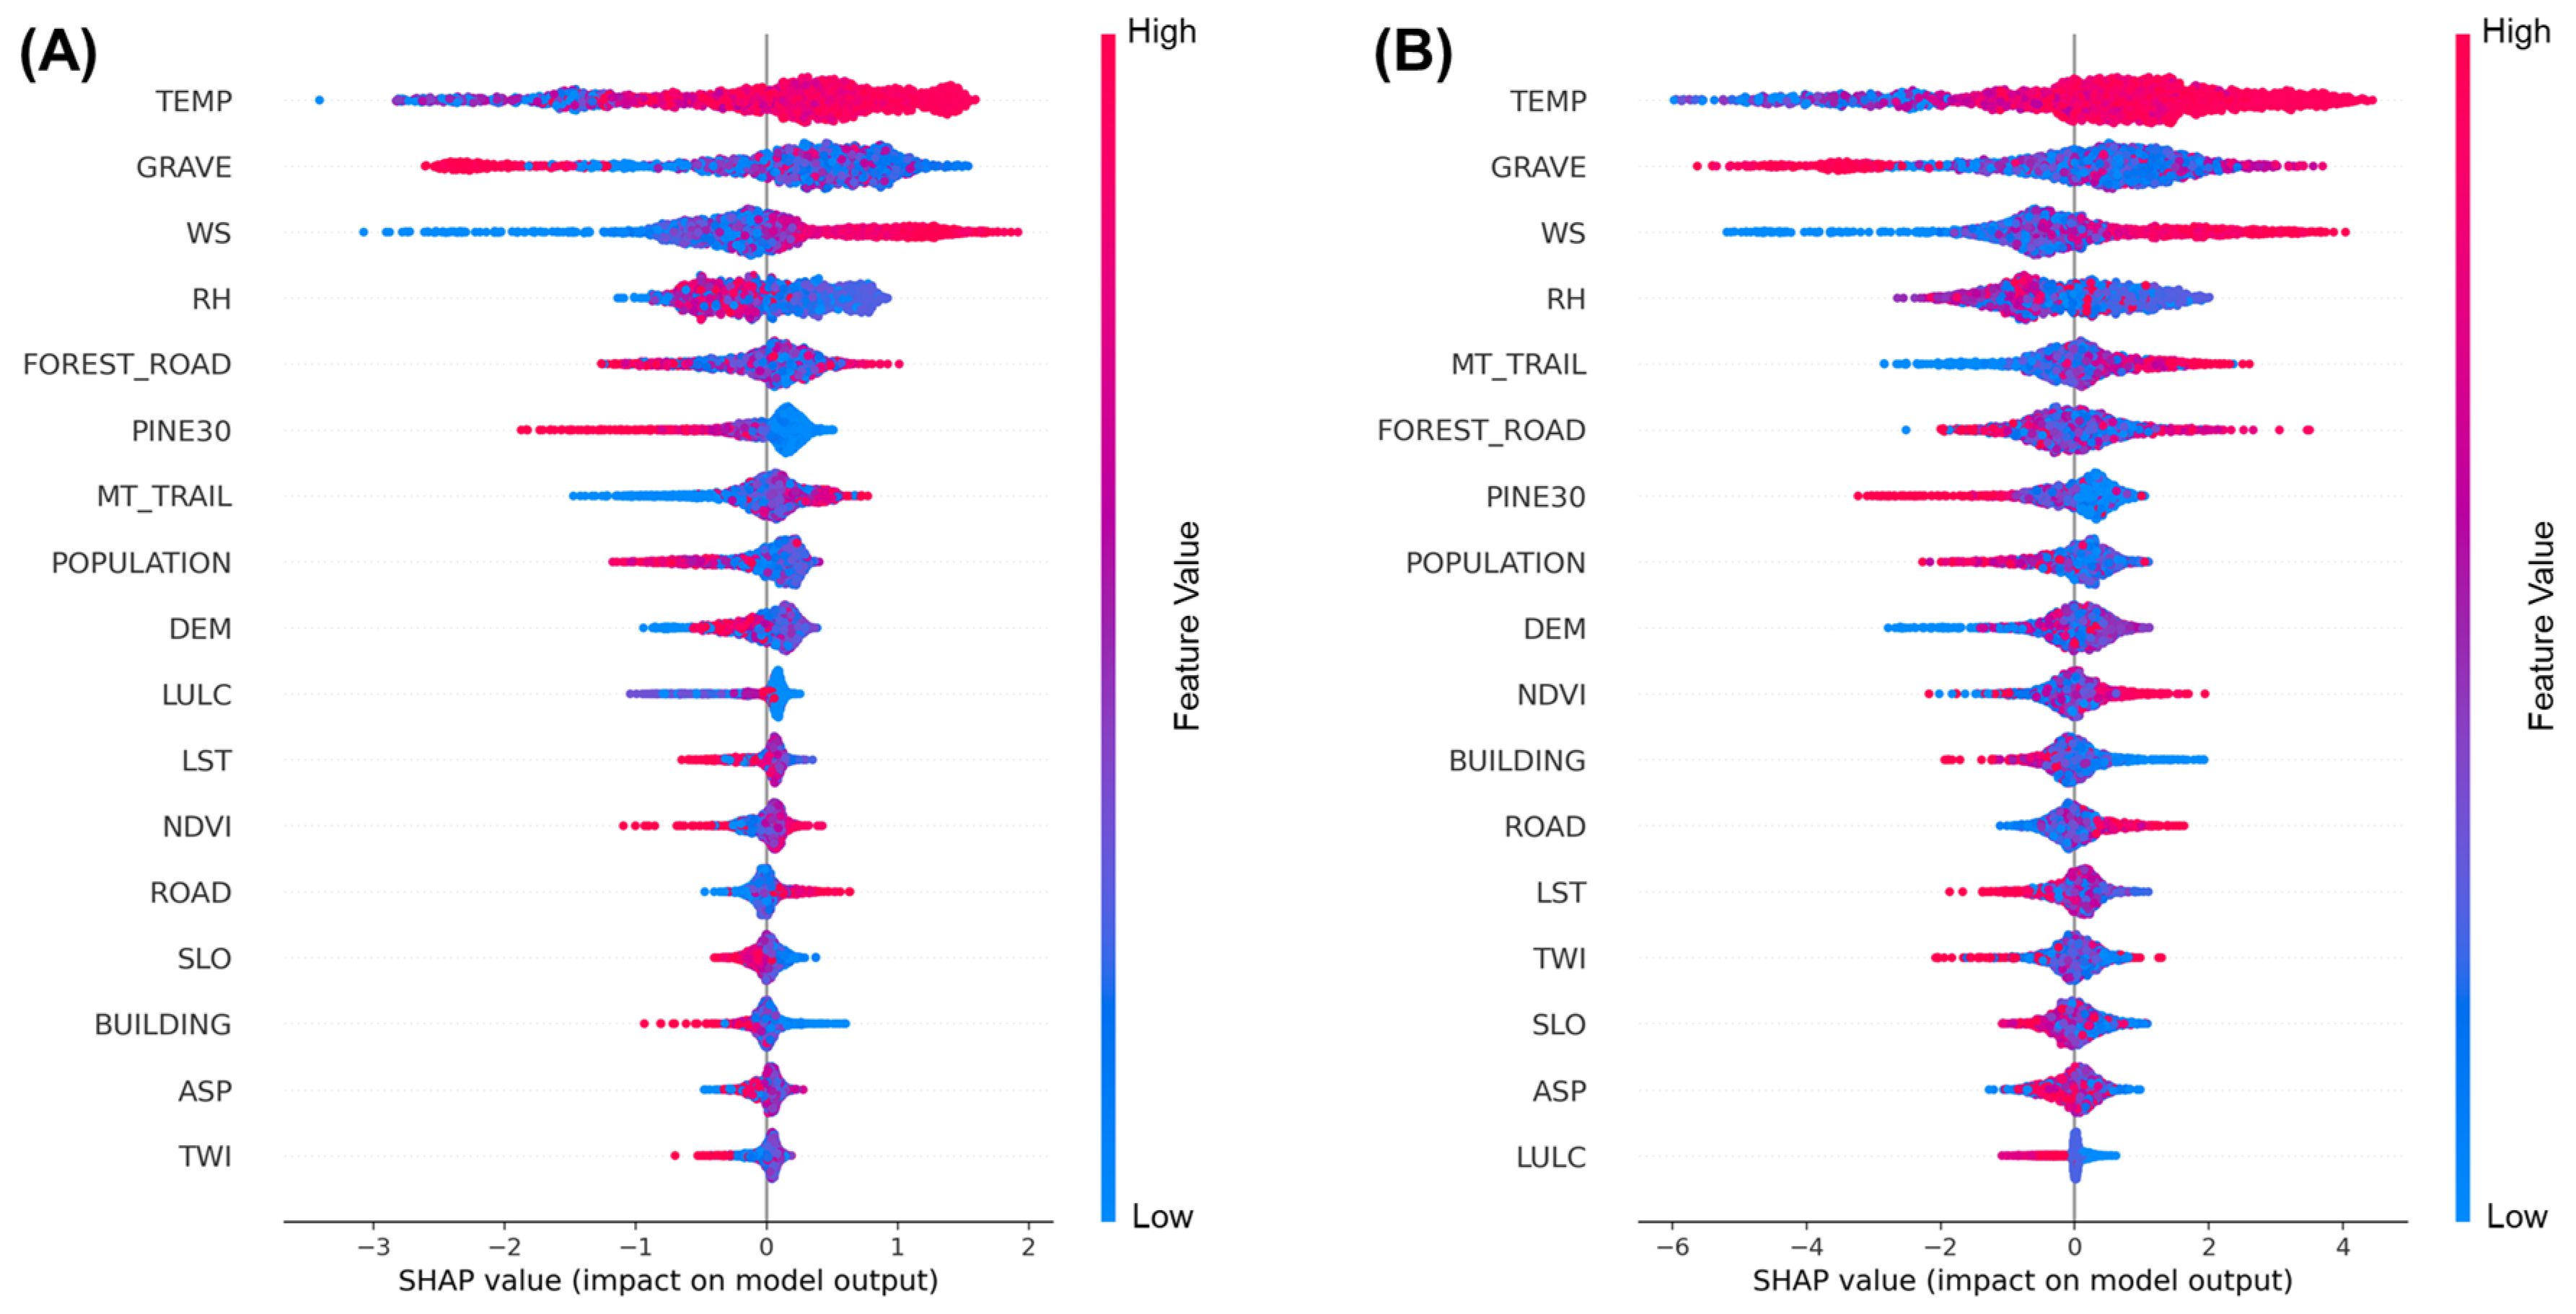
Figure 5A,B present the SHAP summary plots for the CatBoost and LightGBM models, showing consistent variable-importance structures despite algorithmic differences. Both models identified temperature (TEMP), relative humidity (RH), wind speed (WS), and proximity-based anthropogenic variables as the dominant drivers of wildfire ignition probability.
Figure 5.
SHAP summary plots for (A) the CatBoost model and (B) the LightGBM model. Each point represents a single observation; color indicates normalized feature values (red = high, blue = low). Positive SHAP values correspond to increased wildfire probability.
In the CatBoost model, high temperature and low humidity strongly increased predicted fire probability, highlighting the central role of hot, dry weather during the March 2025 events. Proximity to graves (GRAVE) was the most influential human-related factor, indicating that memorial and debris-burning activities served as primary ignition sources in early spring. Wind speed further amplified ignition likelihood by enhancing flame spread potential under extreme atmospheric conditions.
LightGBM produced nearly identical importance rankings, confirming model robustness. Its SHAP patterns reinforced that climatic extremes—especially high temperature, strong wind, and low humidity—interacted with anthropogenic accessibility to elevate ignition risk. Features such as proximity to forest roads (FOREST_ROAD), mountain trails (MT_TRAIL), and extensive pine-dominated stands (PINE30 > 30 ha) showed moderate but consistent positive SHAP contributions, implying that wildfire susceptibility rises where human access overlaps with continuous flammable vegetation.
4.3. Spatial Patterns of Predicted Wildfire Susceptibility
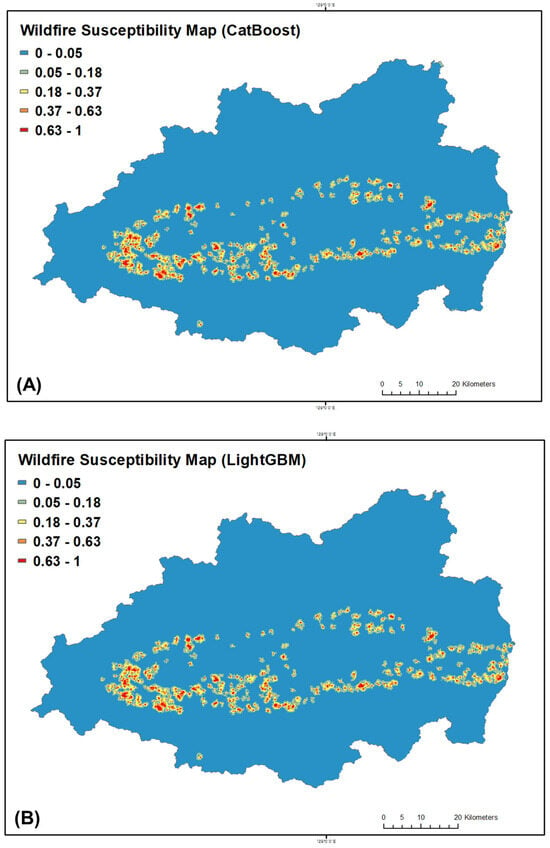
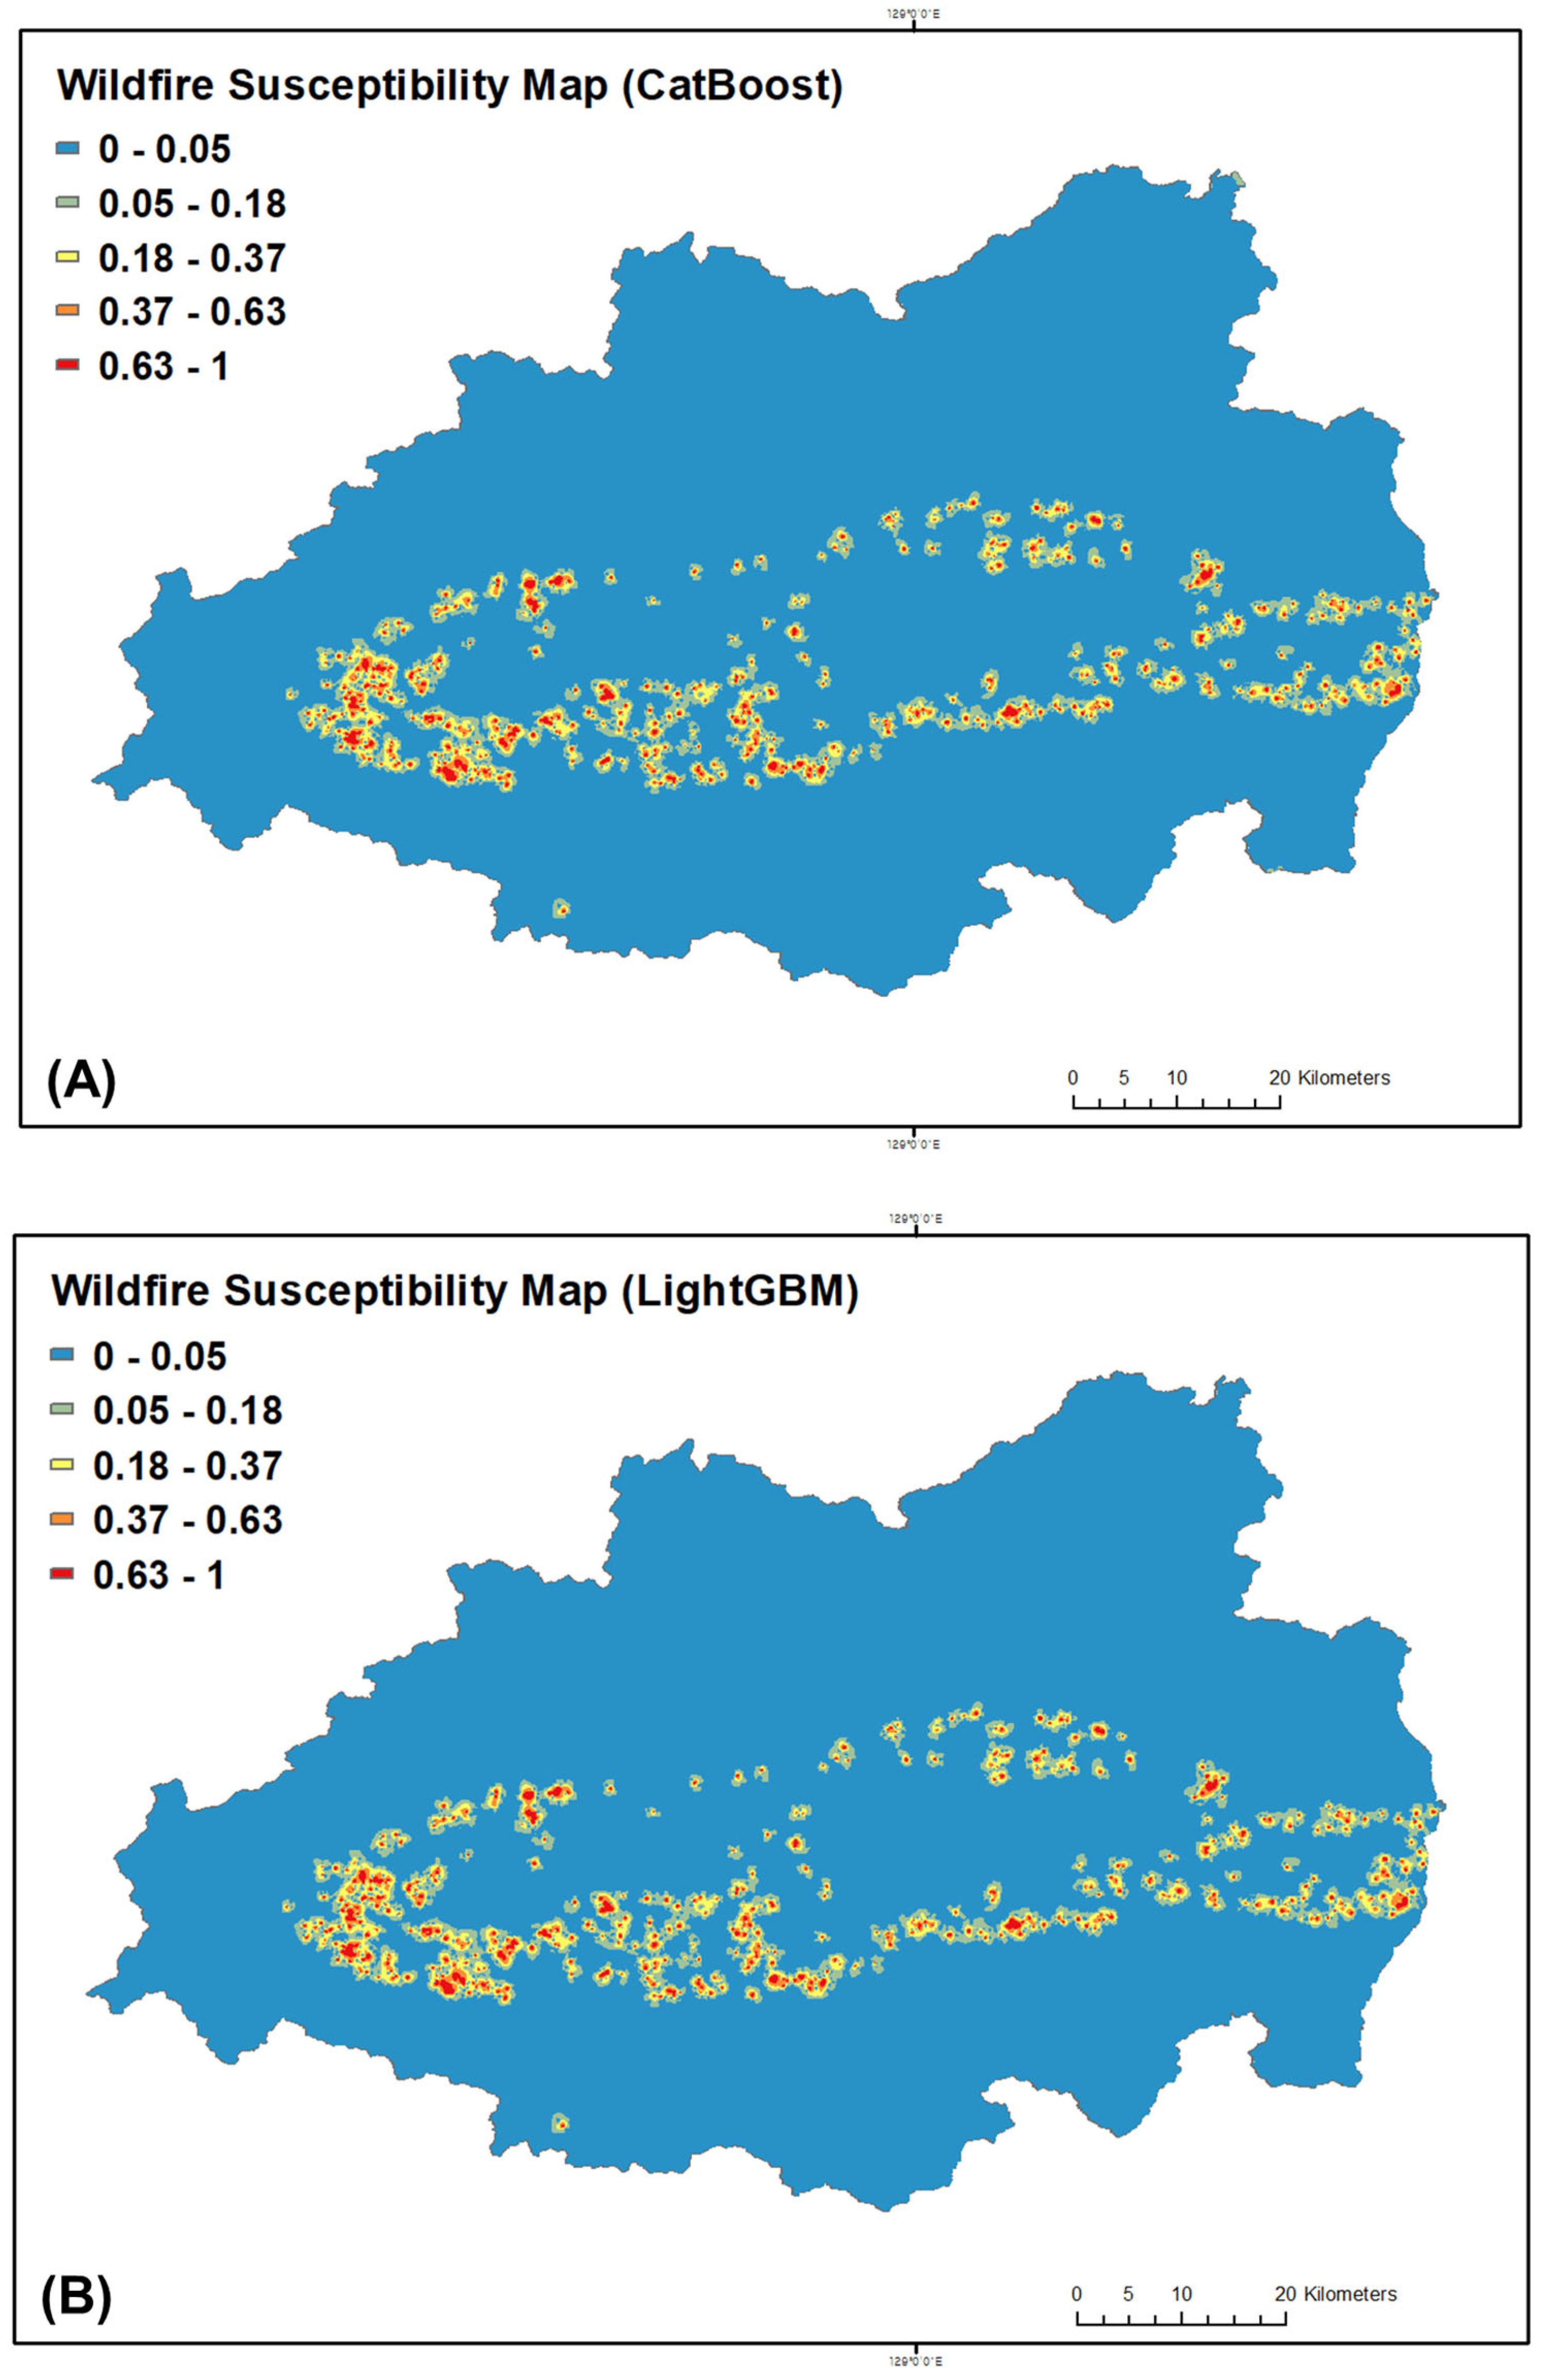
The spatial distribution of wildfire susceptibility across the five target counties in Gyeongsangbuk-do (Figure 6)—Andong, Yeongyang, Uiseong, Cheongsong, and Yeongdeok—was mapped using the final CatBoost (Figure 6A) and LightGBM models (Figure 6B). Both models produced consistent spatial patterns, with the highest predicted probabilities concentrated along the central mountainous corridor extending from Andong through Cheongsong to Yeongdeok. These high-susceptibility areas closely coincided with actual burn perimeters recorded between 22 and 28 March 2025, confirming strong spatial agreement between model outputs and observed events.
Figure 6.
Wildfire susceptibility maps generated using CatBoost (A) and LightGBM (B) for Gyeongsangbuk-do Province. High-susceptibility zones (red to orange) are concentrated along the central mountainous belt and correspond closely with the actual fire occurrence in March 2025.
High and very-high susceptibility zones (probability > 0.37) were primarily located within mid-elevation ridges and intermountain valleys dominated by dense coniferous forests (>30 ha) and increased accessibility via forest roads and mountain trails. Moderate- and low-susceptibility areas (<0.05) were concentrated in urban cores, irrigated croplands, and riparian lowlands characterized by higher fuel moisture and fragmented land use. This spatial differentiation indicates that the models accurately captured both environmental and anthropogenic gradients influencing ignition likelihood.
Despite differences in algorithmic structure, CatBoost and LightGBM produced nearly identical susceptibility gradients. The CatBoost model generated slightly broader and more fragmented high-susceptibility patches, particularly along the Cheongsong–Yeongdeok boundary, reflecting its enhanced sensitivity to nonlinear interactions among climatic and anthropogenic factors. By contrast, LightGBM produced smoother transitions and more conservative high-susceptibility zones consistent with its leaf-wise optimization approach. Quantitative evaluation showed that more than 80% of the recorded burned locations were captured within the top 30% of predicted susceptibility scores, demonstrating high predictive reliability and stable spatial performance across model architectures.
4.4. Mean Probability Analysis of Key Environmental Drivers
Both the CatBoost and LightGBM models exhibited consistent probability gradients across the seven key SHAP-ranked predictors—temperature (TEMP), relative humidity (RH), wind speed (WS), distance to mountain trail (MT_TRAIL), distance to grave (GRAVE), distance to forest road (FOREST_ROAD), and distance to large coniferous forests (PINE30)—highlighting the combined influence of climatic stress, vegetation structure, and anthropogenic accessibility on wildfire susceptibility in Gyeongsangbuk-do. The mean probability analysis revealed (Table 3) that wildfire likelihood increased sharply under high-temperature (>25 °C), low-humidity (<25%), and high-wind (>6 m/s) conditions, which correspond closely to the extreme weather observed during the March 2025 wildfire events. Both models showed that proximity to large coniferous stands (within 500–1000 m) significantly elevated ignition probability, suggesting that the continuity and flammability of pine-dominated forests amplify fire spread potential once ignition occurs. Anthropogenic proximity factors, particularly graves and mountain trails within 500 m, recorded more than double the mean probability compared to the overall sample, underscoring the strong influence of human-induced ignition behaviors such as debris burning and memorial fires. The top 30% of high-susceptibility cells were characterized by higher temperature (+7.4 °C), lower humidity (−19.3%), stronger wind (+1.5 m/s), and shorter distances to ignition-related features, validating the spatial coupling between thermal–hydrologic extremes, human accessibility, and vegetation continuity. While FOREST_ROAD exhibited a moderate U-shaped pattern, with risk peaking at mid-range distances (500–1000 m) where access and fuels intersect, and PINE30 highlighted areas of dense, connected coniferous cover as key structural corridors for ignition propagation, all seven variables collectively delineate high-susceptibility ridges and rural–forest interface zones.
Table 3.
Comparison of mean variable values between top 30% high-susceptibility cells and remaining samples (CatBoost and LightGBM).
4.5. Socio-Environmental Vulnerability Patterns
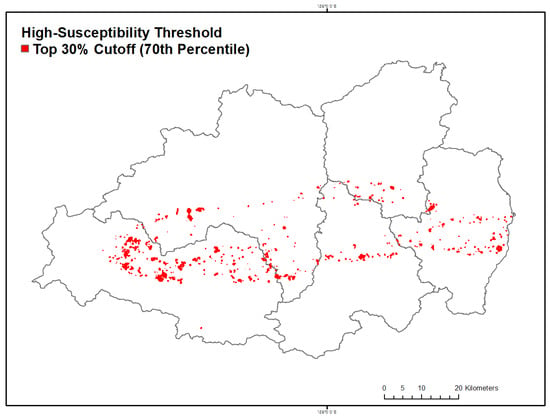
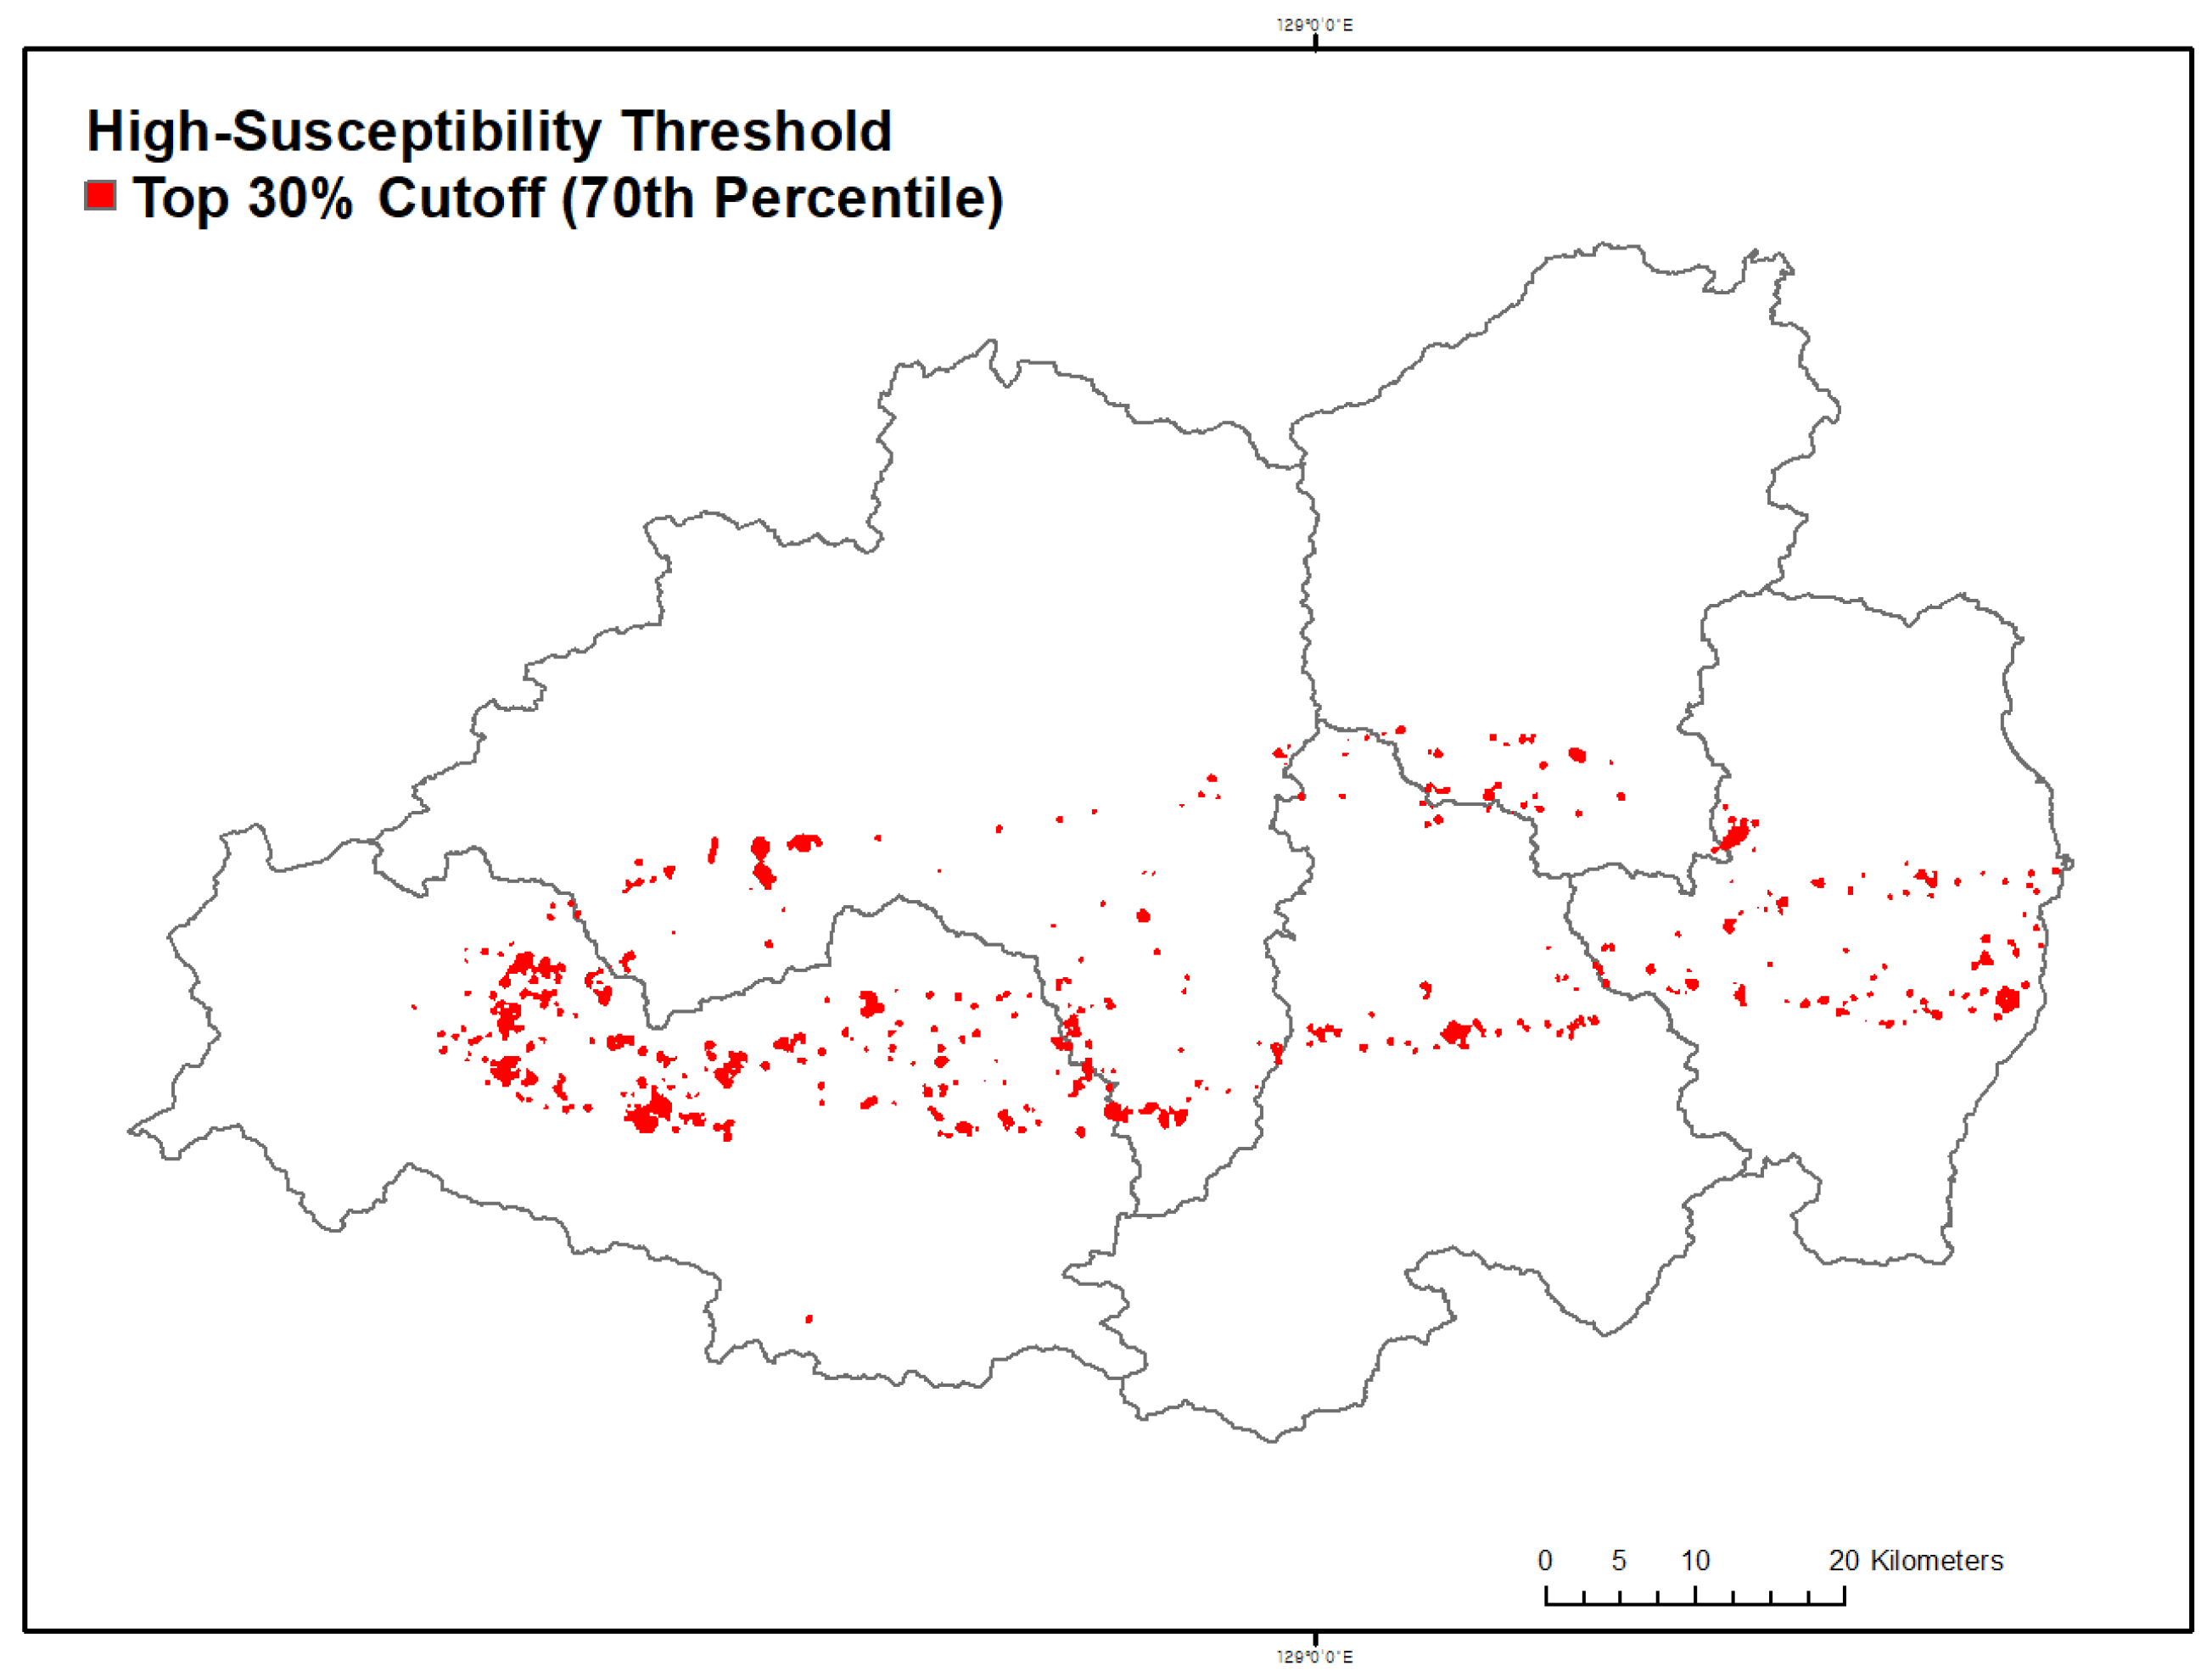
To spatially relate model-predicted wildfire susceptibility to human exposure, the high-susceptibility threshold was defined as the top 30% of predicted probabilities within each model (≥0.62 for CatBoost and ≥0.36 for LightGBM). This percentile-based normalization ensured comparability across models with different probability scales (Figure 7).
Figure 7.
Spatial distribution of high-susceptibility wildfire zones based on the top 30% cutoff (70th percentile) of model-predicted probabilities. Red polygons represent cells exceeding the high-susceptibility threshold (≥0.62 for CatBoost), indicating zones prioritized for overlay validation with socio-environmental indicators.
Figure 7 illustrates the spatial distribution of high-susceptibility wildfire zones across Gyeongsangbuk-do, showing red polygons corresponding to grid cells above the 70th percentile cutoff. These clusters delineate the principal ignition corridors extending from Andong to Yeongdeok, which coincide with the actual burn perimeters observed during the March 2025 wildfire events. The spatial alignment between model-predicted high-susceptibility cells and historical fire occurrences validates the models’ predictive reliability and highlights the structural continuity of the WUI as a dominant ignition environment. To further quantify how socio-environmental conditions interact with these high-susceptibility areas, Zonal Statistics were performed using ten human-related spatial indicators (e.g., arboreta, campsites, private forests, cultural heritage sites, substations; see Table A4). Each indicator was converted into a Euclidean distance raster and min–max normalized (0–1), where higher values indicate closer proximity.
Table 4 summarizes the zonal statistics for the ten socio-environmental factors selected to represent human activities and land-management features directly related to ignition exposure. Infrastructure reflecting emergency response capacity, such as hospitals, schools, and evacuation facilities, was not included because the present analysis focuses on susceptibility rather than post-ignition impact or response. The results show particularly high mean proximity values for arboreta (0.99), commercial private forests (0.93), and campsites (0.73), indicating that wildfire-prone cells are concentrated around areas of active human management and recreational use. Moderate proximity values were observed for incineration facilities, protected areas, and substations (≈0.70–0.80), suggesting vulnerability of infrastructure located near forest–settlement boundaries. In contrast, lower proximity to wind power plants (0.56) and cultural heritage sites (0.61) indicates that exposure around these features is more localized and less systematically associated with ignition risk.
Table 4.
Zonal statistics summary of 10 socio-environmental factors within high-susceptibility zones.
Beyond infrastructure and management-related exposure, the high-susceptibility zones also systematically overlapped with rural settlements characterized by pronounced demographic vulnerability. In particular, the majority of high-susceptibility corridors coincide with counties exhibiting high proportions of elderly residents and declining population density, as described in Section 2. This spatial configuration indicates that wildfire-prone environments in Gyeongsangbuk-do are not only environmentally hazardous but are also concentrated in communities with limited mobility, reduced evacuation capacity, and constrained local response resources.
5. Discussion
Interpreted through the IPCC disaster-risk framework, the results can be structured along three interacting components: (i) hazard, represented by climate-driven ignition susceptibility; (ii) exposure, captured by spatial coincidence with socio-environmental and infrastructure-related assets; and (iii) vulnerability, reflected in the demographic and land-management characteristics of rural WUI landscapes. Within this framework, the high predictive performance of CatBoost and LightGBM (AUC > 0.90), together with SHAP-based interpretation and socio-environmental overlay, provides a consistent empirical basis for examining how ignition likelihood emerges from the interaction between meteorological stress, landscape structure, and human accessibility.
Climatic variables—temperature, relative humidity, and wind speed—were consistently identified as the dominant drivers of wildfire susceptibility. Ignition probability increased markedly under hot (>25 °C), dry (<25%), and windy (>6 m s−1) conditions, closely matching the atmospheric characteristics observed during the March 2025 wildfire episode. This pattern is consistent with previous studies showing that synoptic dry fronts and foehn-type winds substantially intensify fire-weather severity in East Asian mountainous regions [60,61], confirming the central role of short-term meteorological extremes in shaping ignition-prone environments during spring wildfire outbreaks in Korea.
Anthropogenic factors exerted a comparable influence on wildfire susceptibility. Proximity to graves, mountain trails, and forest roads was strongly associated with elevated ignition probability, reflecting human activities such as agricultural burning, cemetery management, and recreational use that intensify during the dry spring season [7,8,16]. The nonlinear relationship for forest-road distance suggests that intermediate accessibility (approximately 500–1000 m) represents a critical zone where human presence and fuel continuity intersect. In pine-dominated landscapes, this configuration likely facilitates both ignition and early fire spread under strong wind conditions. These findings indicate that wildfire susceptibility is driven not by climate or human activity alone, but by their spatial concurrence within flammable forest structures.
The socio-environmental overlay analysis clarifies how these ignition-prone environments intersect with managed and socially relevant landscapes. High proximity values for arboreta, private commercial forests, and campsites indicate that elevated wildfire susceptibility coincides with zones of active forest management, recreation, and public access. Moderate proximity to incineration facilities, protected areas, and substations highlights potential exposure of infrastructure along forest–settlement boundaries, whereas lower proximity for wind power plants and cultural heritage sites suggests spatially selective vulnerability. These patterns reflect broader socio-demographic and land-use characteristics of rural Korea, including population aging, limited mobility, and increased recreational forest use. Accordingly, vulnerability in this study is not limited to land-management context alone but is strongly shaped by socio-demographic conditions. Comparable interactions between rural depopulation, land abandonment, and wildfire vulnerability have been reported in Mediterranean Europe, Japan, and parts of southern China [62,63,64].
From a wildfire risk governance perspective, the identified susceptibility corridors offer practical insights for spatial prioritization. The concentration of high-susceptibility zones along pine-dominated ridges and WUI corridors supports the designation of Wildfire Priority Management Areas (WPMAs) for targeted prevention and preparedness measures, including fuel treatment, patrol allocation, and seasonal access restrictions. In particular, cemetery-adjacent settlements and heavily used mountain trails emerge as locations where focused patrols, public awareness campaigns, and early-warning dissemination may be most effective during the March–April fire season [7,9]. The strong association between wildfire susceptibility and proximity to cemeteries reflects not only spatial accessibility but also culturally embedded practices—such as memorial-season burning, vegetation clearing, and informal waste incineration—often conducted near dry forest fuels and weakly regulated in remote burial areas [25,65]. The strong overlap between high-susceptibility zones and aging rural communities highlights the need for community-based fire prevention strategies tailored to demographic vulnerability [66]. In such villages, susceptibility information can guide volunteer fire brigade placement, agricultural burning restrictions, and participatory monitoring systems [67,68]. The use of SHAP-based interpretation further provides a transparent basis for communicating why specific areas are classified as high susceptibility, facilitating the integration of interpretable machine-learning outputs into Korea’s forest management and fire prevention policies [69].
Several limitations should be noted. Model training and evaluation were based on a single extreme wildfire episode in March 2025; although this provides a valuable testbed under severe fire-weather conditions, generalization across seasons and climatic regimes has not yet been fully assessed. Under such extremes, climatic forcing likely exerts a dominant control on ignition probability, whereas under more moderate conditions anthropogenic and land-management factors may play a relatively larger role [70]. At the same time, key predictors—such as proximity to roads, graves, and mountain trails, and pine-dominated fuel structure—are structurally persistent features and are therefore expected to remain important determinants of wildfire susceptibility across multiple seasons and fire regimes. The socio-environmental indicators are static and do not capture short-term variations in human mobility or fuel conditions, and the 1 km resolution inevitably smooths fine-scale ignition processes near settlement edges or narrow access routes [71].
Future research should extend the framework to multi-season and multi-year fire inventories, incorporate dynamic datasets (e.g., traffic mobility, night-time light intensity, temporally resolved vegetation indices), and couple susceptibility modeling with process-based studies on human behavior and land management to clarify causal mechanisms underlying anthropogenic ignition [72]. Coupling high-resolution atmospheric modeling with topographic diagnostics could further resolve downslope wind effects, and applying the approach to other fire-prone regions of East Asia would strengthen robustness and international relevance [73].
Overall, wildfire susceptibility during extreme events in Gyeongsangbuk-do emerges from the convergence of meteorological extremes, flammable vegetation structure, and human accessibility within a complex socio-environmental landscape. By situating explainable machine-learning-based susceptibility modeling within a disaster-risk perspective, the findings extend beyond hazard identification to highlight where ignition-prone environments and socially relevant exposure coincide. This approach provides an empirical basis for risk-informed spatial prioritization and supports more targeted, context-sensitive wildfire management under ongoing climate change.
6. Conclusions
This study examined wildfire susceptibility during the March 2025 extreme wildfire event in Gyeongsangbuk-do by combining explainable machine-learning models with socio-environmental indicators relevant to human exposure and land management. The results show that ignition-prone environments emerge where extreme climatic conditions—characterized by high temperature, low relative humidity, and strong winds—coincide with flammable forest structure and human accessibility. In particular, proximity to graves, mountain trails, forest roads, and contiguous coniferous stands was consistently associated with elevated ignition likelihood, highlighting the combined influence of climate stress, fuel continuity, and human activity.
The socio-environmental overlay analysis further indicates that areas of high wildfire susceptibility are spatially aligned with landscapes of active human use and forest management, rather than with remote or inaccessible forest areas. This pattern reinforces the interpretation that wildfire susceptibility in Korea reflects a socio-environmental configuration in which ignition hazard and exposure are closely intertwined. Within this context, susceptibility mapping serves not only as a representation of ignition likelihood, but also as a means of identifying locations where wildfire impacts are more likely to intersect with socially and infrastructurally relevant assets.
From a wildfire risk management perspective, the identified susceptibility corridors provide practical support for spatial prioritization. These corridors offer an empirical basis for designating WPMAs and for directing preventive patrols, fuel management efforts, and risk communication toward locations where human-caused ignitions are most likely under spring fire-weather conditions. In addition, the use of SHAP-based interpretation enhances the transparency of model outputs, supporting clearer communication of risk drivers and facilitating their potential integration into existing operational systems such as Korea’s FFDRI. While the proposed approach is grounded in a single extreme wildfire episode and relies on static socio-environmental indicators, it demonstrates how event-conditioned susceptibility analysis can inform wildfire risk assessment under climate extremes. Future research should extend this framework by incorporating temporally dynamic weather, vegetation, and human mobility data, and by applying it to additional wildfire events across East Asia to further evaluate its robustness and transferability under diverse climatic and socio-demographic conditions.
Taken together, this study provides empirical evidence on how wildfire hazard and socio-environmental exposure intersect during extreme fire events in Korea. By explicitly linking hazard (ignition susceptibility), exposure (socio-environmental overlap), and vulnerability (rural and management contexts), the explainable machine-learning outputs can be directly interpreted within the IPCC climate risk framework. This integrated perspective supports more targeted and context-sensitive wildfire risk governance, and provides a practical foundation for improved prevention, preparedness, and resilience-oriented spatial decision-making under ongoing climate change.
Author Contributions
S.H. designed the analytical framework, developed the explainable machine-learning models, conducted data curation and statistical analyses, performed spatial and socio-environmental overlay analyses, generated all figures and maps, and drafted the manuscript. S.A. contributed to data preprocessing, assisted with spatial data construction, and supported the interpretation of modeling results. Y.-E.L. contributed to the compilation of wildfire inventory data and assisted in the interpretation of wildfire occurrence patterns. S.-C.J. provided methodological advice on wildfire risk assessment and contributed to critical review of the manuscript. M.J. conceptualized the study, supervised the overall research design and implementation, provided critical revisions of the manuscript, managed the project, and secured funding. All authors have read and agreed to the published version of the manuscript.
Funding
This research was supported by the National Institute of Forest Science (Project No. FE0500-2025-02-2025).
Institutional Review Board Statement
This study does not involve human participants or animals and therefore did not require ethics approval. All data used were publicly available and secondary in nature.
Data Availability Statement
The data that support the findings of this study are available from the corresponding author upon reasonable request.
Conflicts of Interest
The authors declare that there is no conflict of interest regarding the publication of this manuscript.
Appendix A
Figure A1.
Selected environmental drivers. (A) Mean relative humidity; (B) Max Wind Speed; (C) Max temperature; (D) Land surface temperature; (E) Digital elevation model; (F) Slope aspect; (G) Slope degree; (H) Topographic wetness index; (I) Distance to road; (J) Distance to mountain trail; (K) Distance to building infrastructure; (L) Distance to populated area; (M) Distance to grave; (N) Distance to forest road; (O) Distance to Pinus densiflora-dominated forests (≥30ha); (P) Normalized Difference Vegetation Index; and (Q) Land use and land cover.
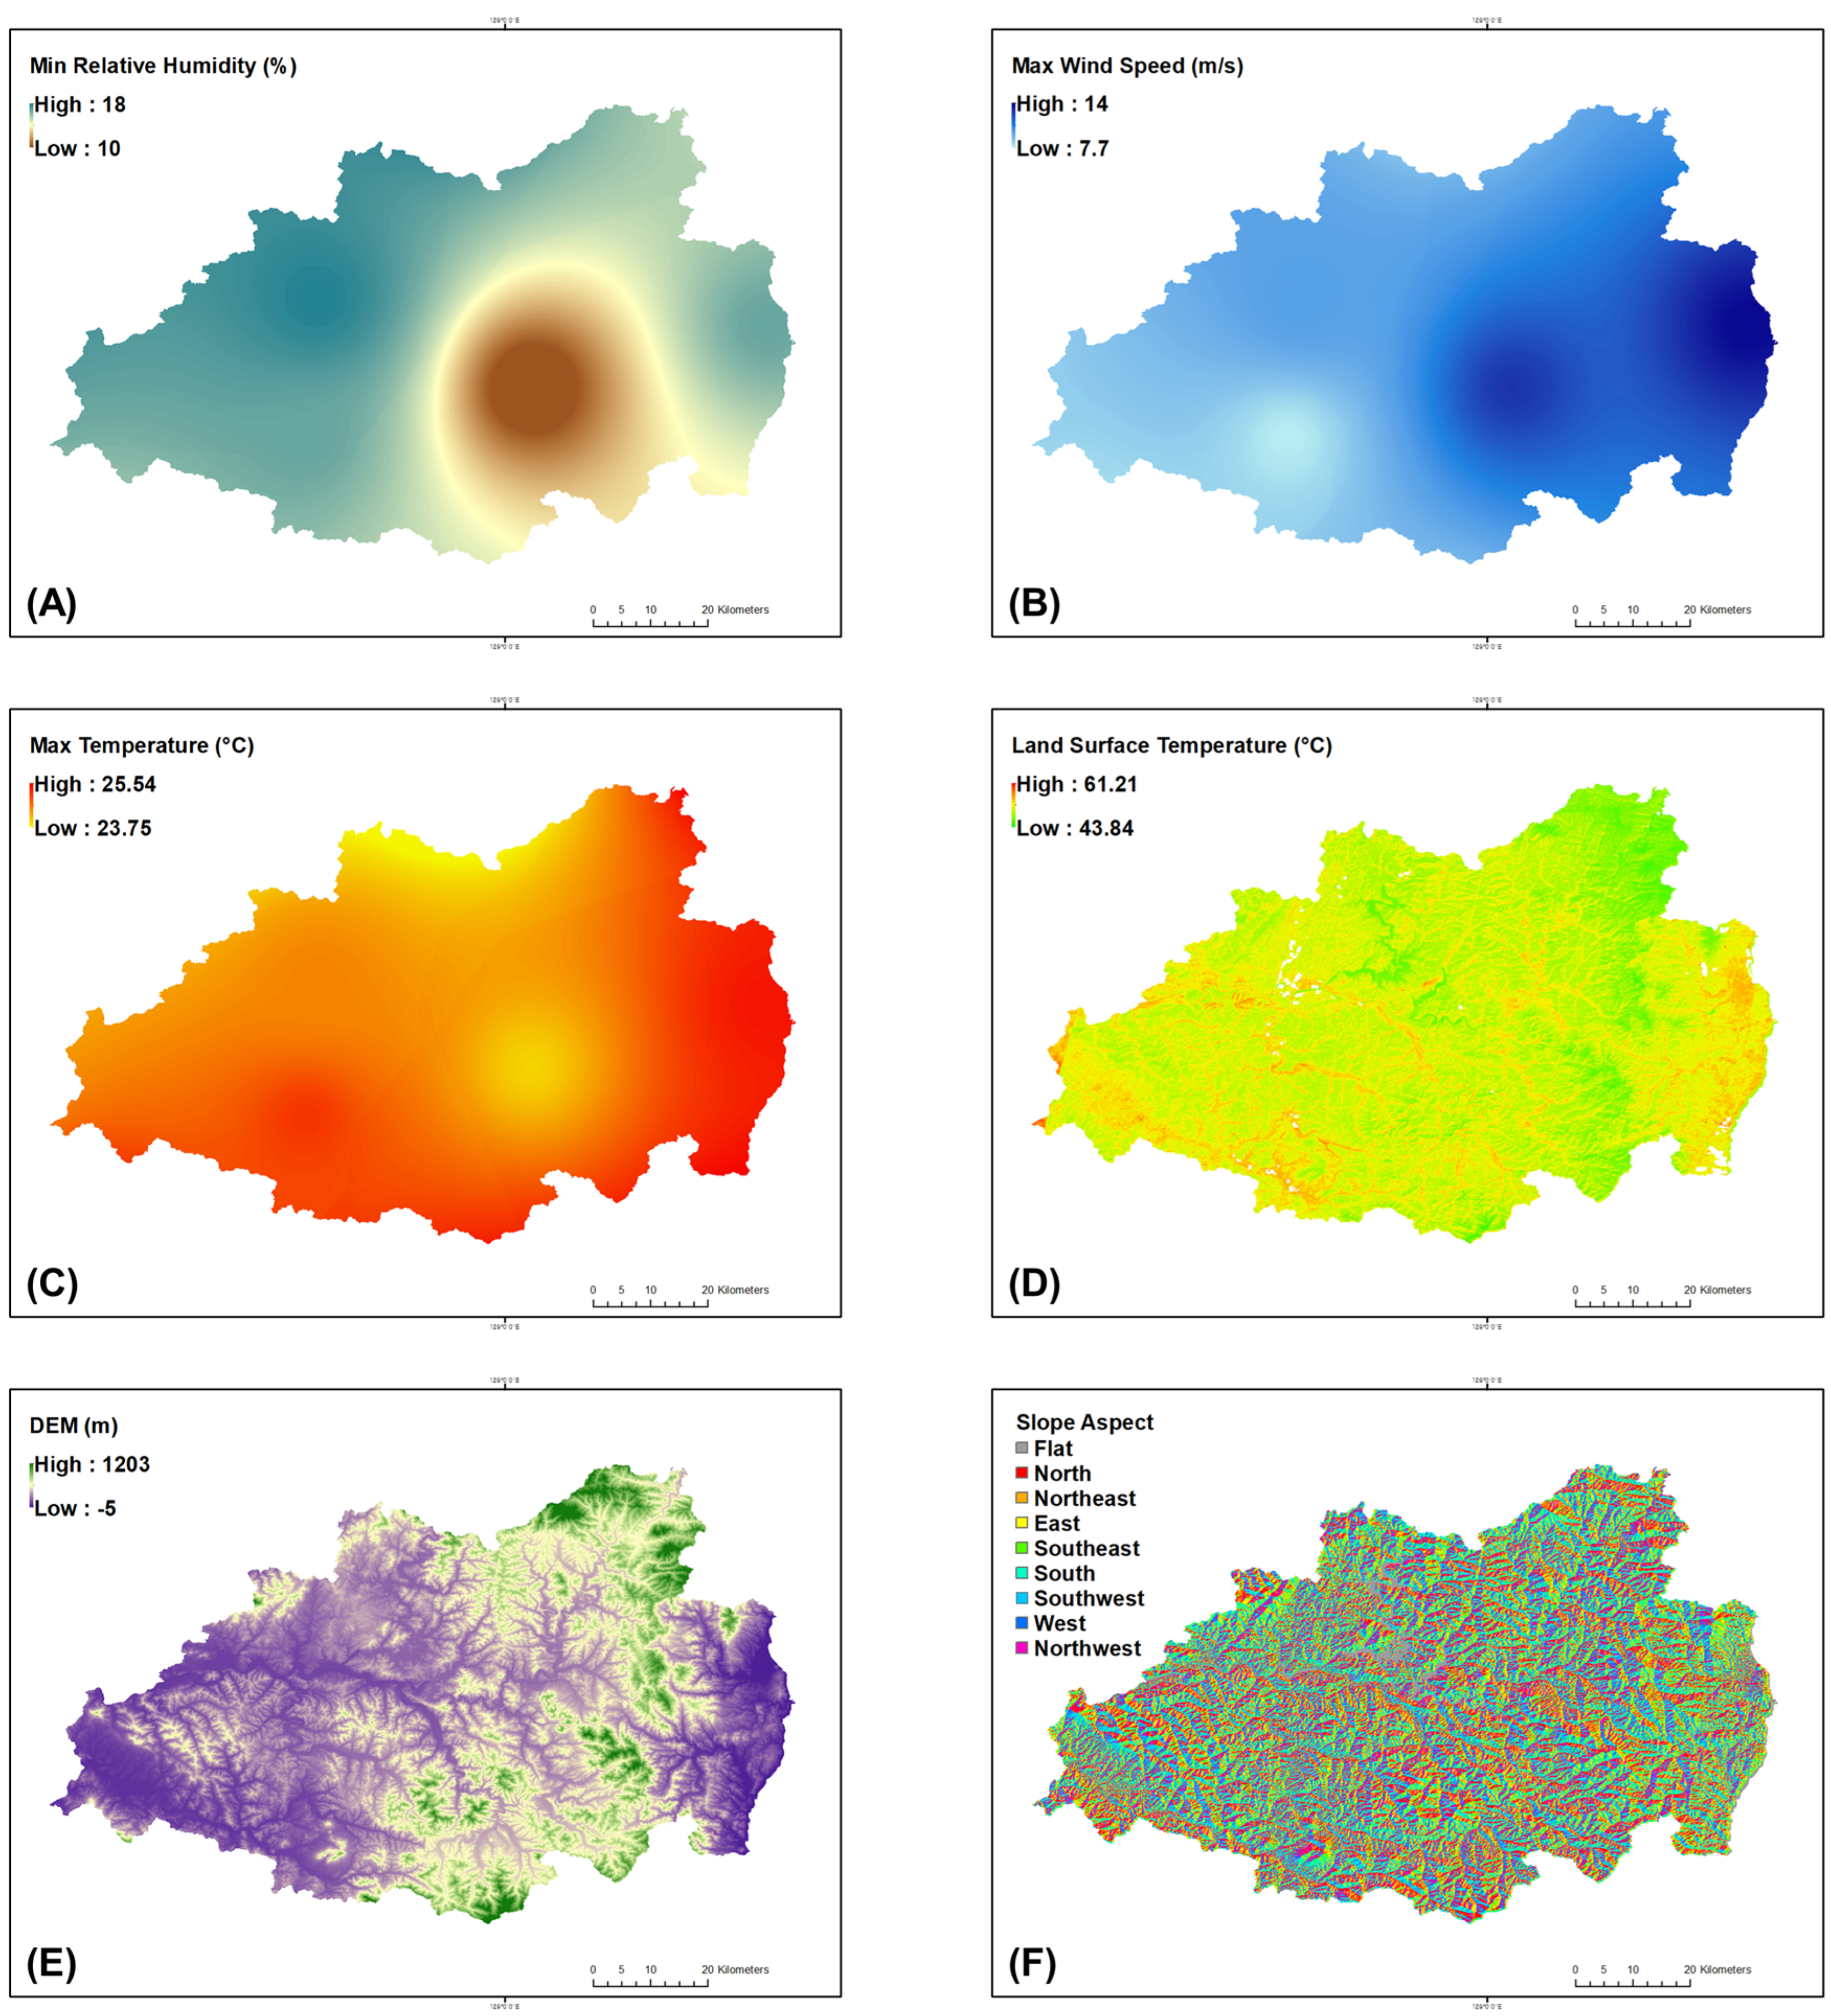
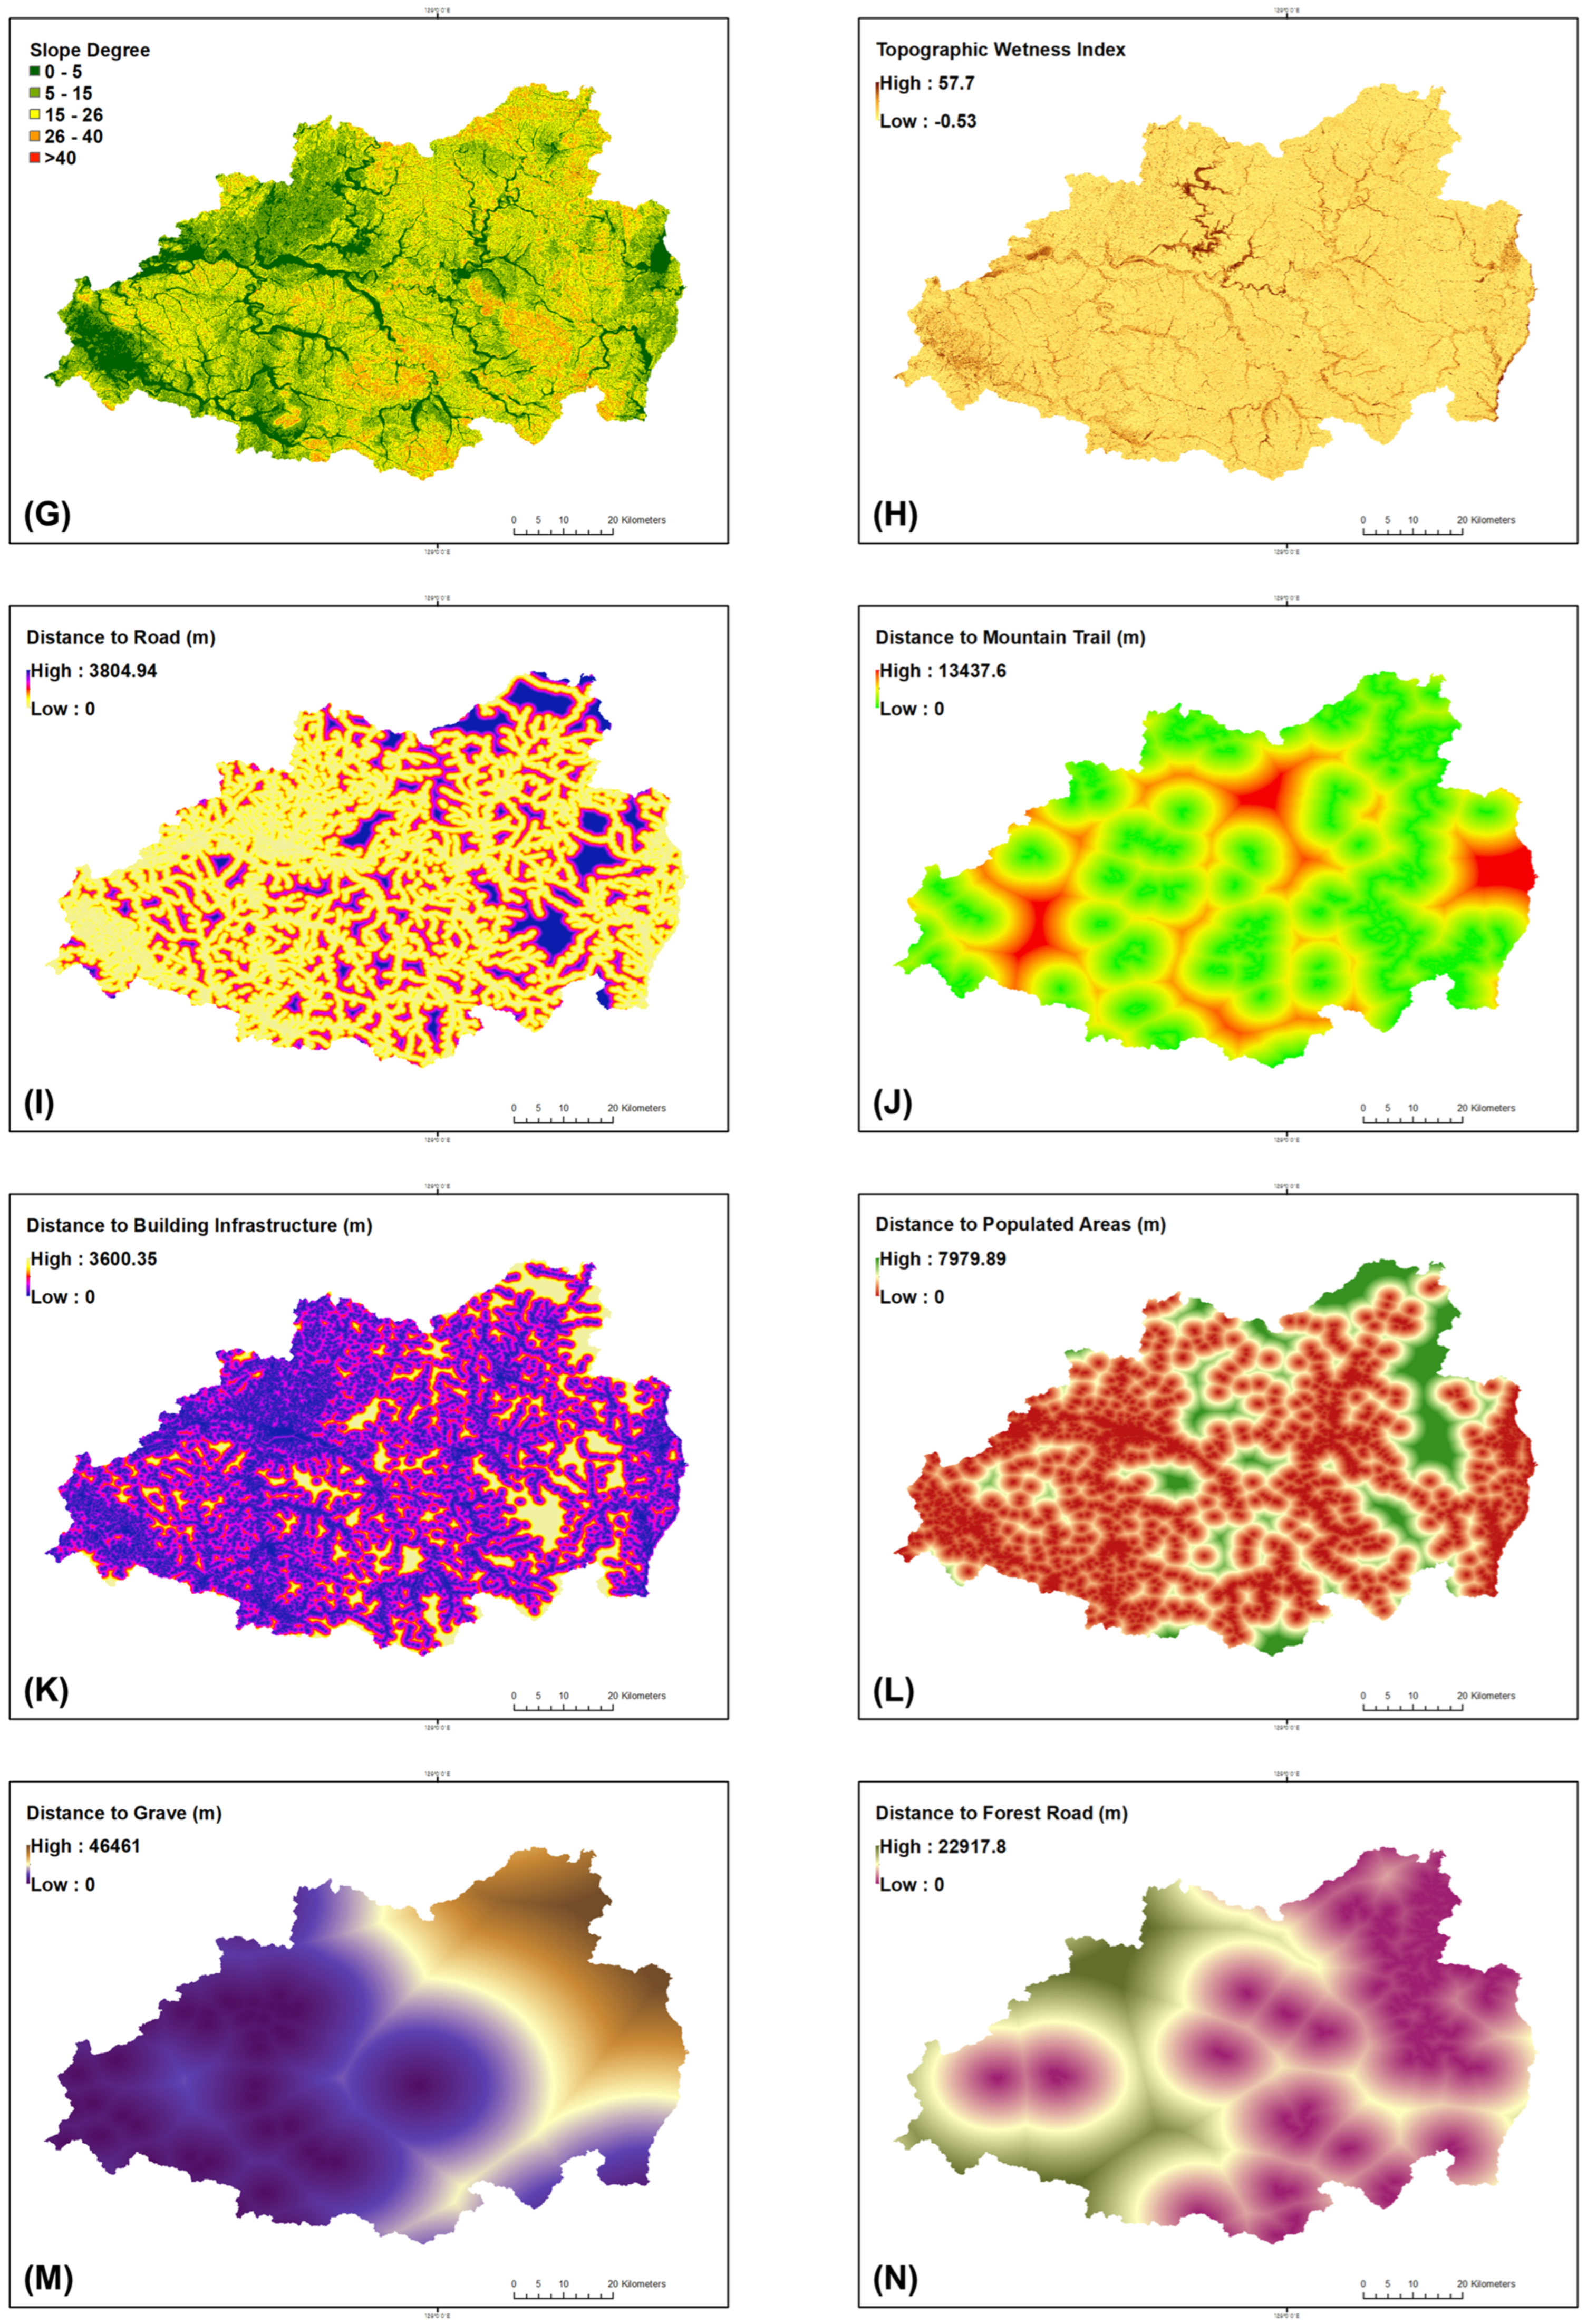
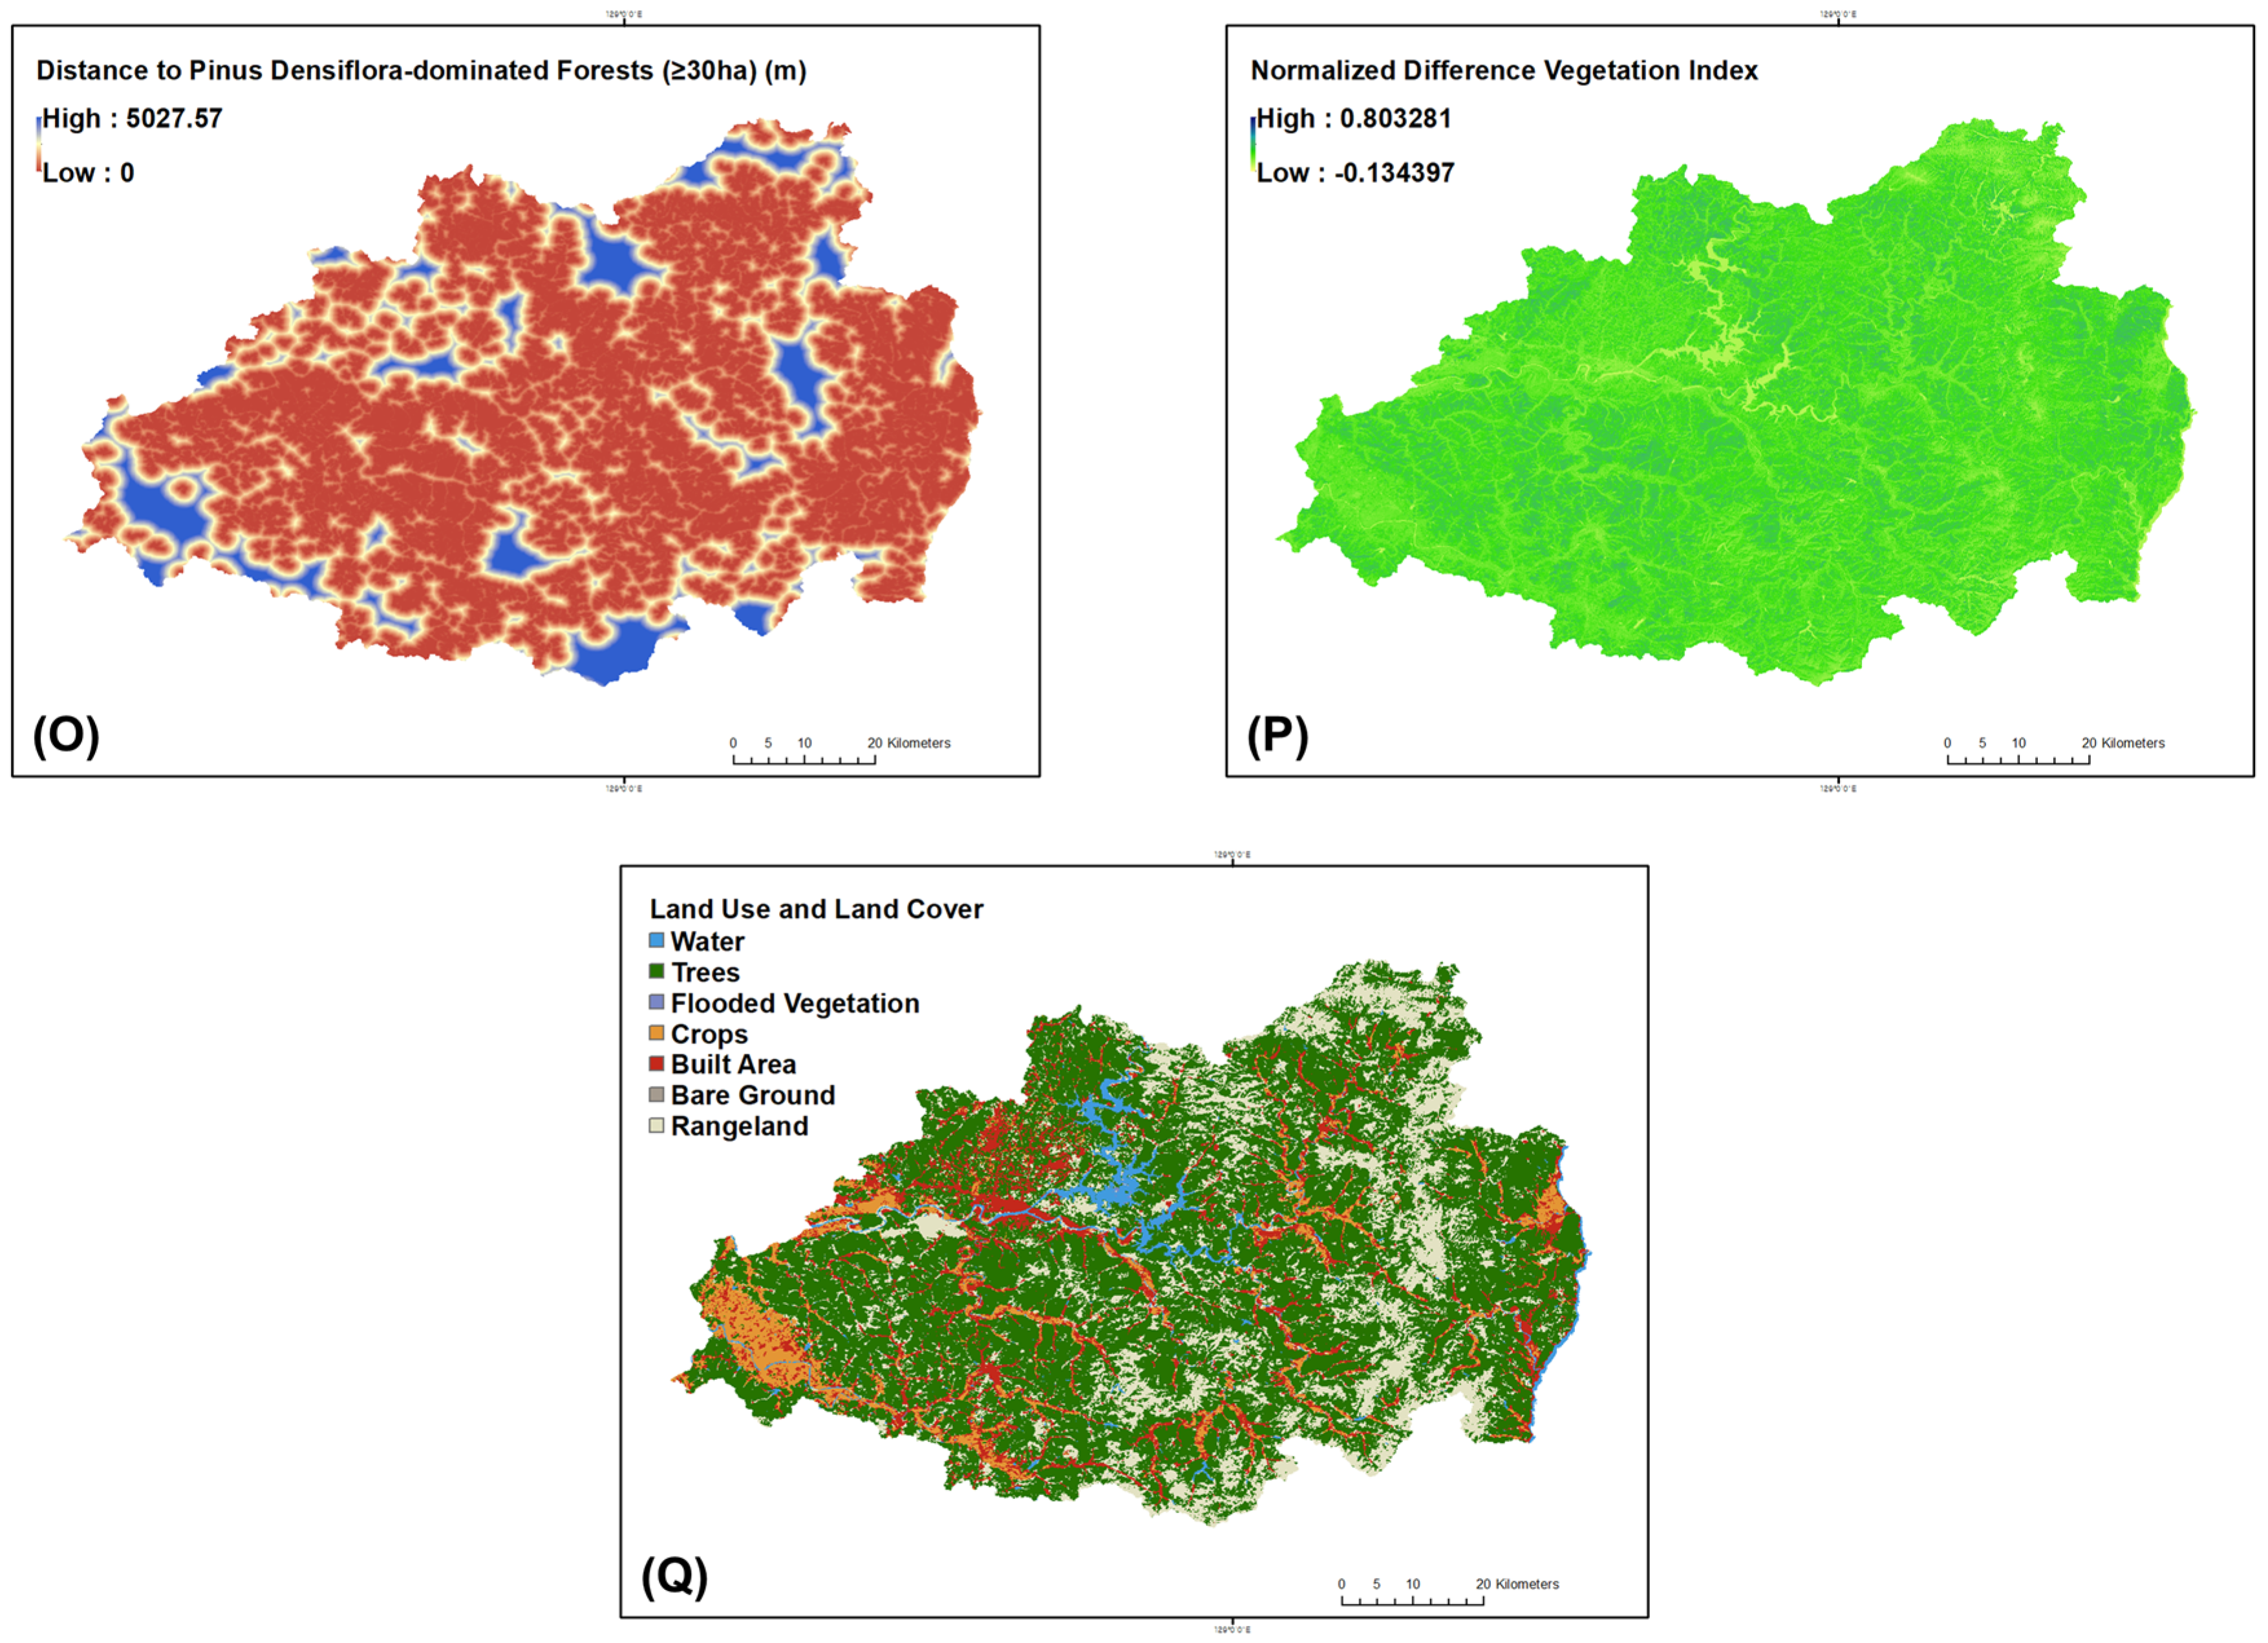
Table A1.
Glossary of variables, abbreviations, and technical terms.
Table A2.
Summary of final hyperparameters used in CatBoost and LightGBM models.
Table A3.
Cross-validation performance metrics for the CatBoost and LightGBM models in wildfire susceptibility prediction.
Table A4.
List of additional socio-environmental indicators and spatial data sources used for overlay validation.
Figure A2.
Spatial distribution of ten socio-environmental indicators converted to Euclidean distance rasters. Each indicator represents proximity to human-related or management features including (A) Arboreta; (B) Campsites; (C) Commercial national forest; (D) Commercial private forest; (E) Cultural heritage sites; (F) Incineration facilities; (G) Protected areas; (H) Forest recreation areas; (I) Substations; and (J) wind power plants across Gyeongsangbuk-do.
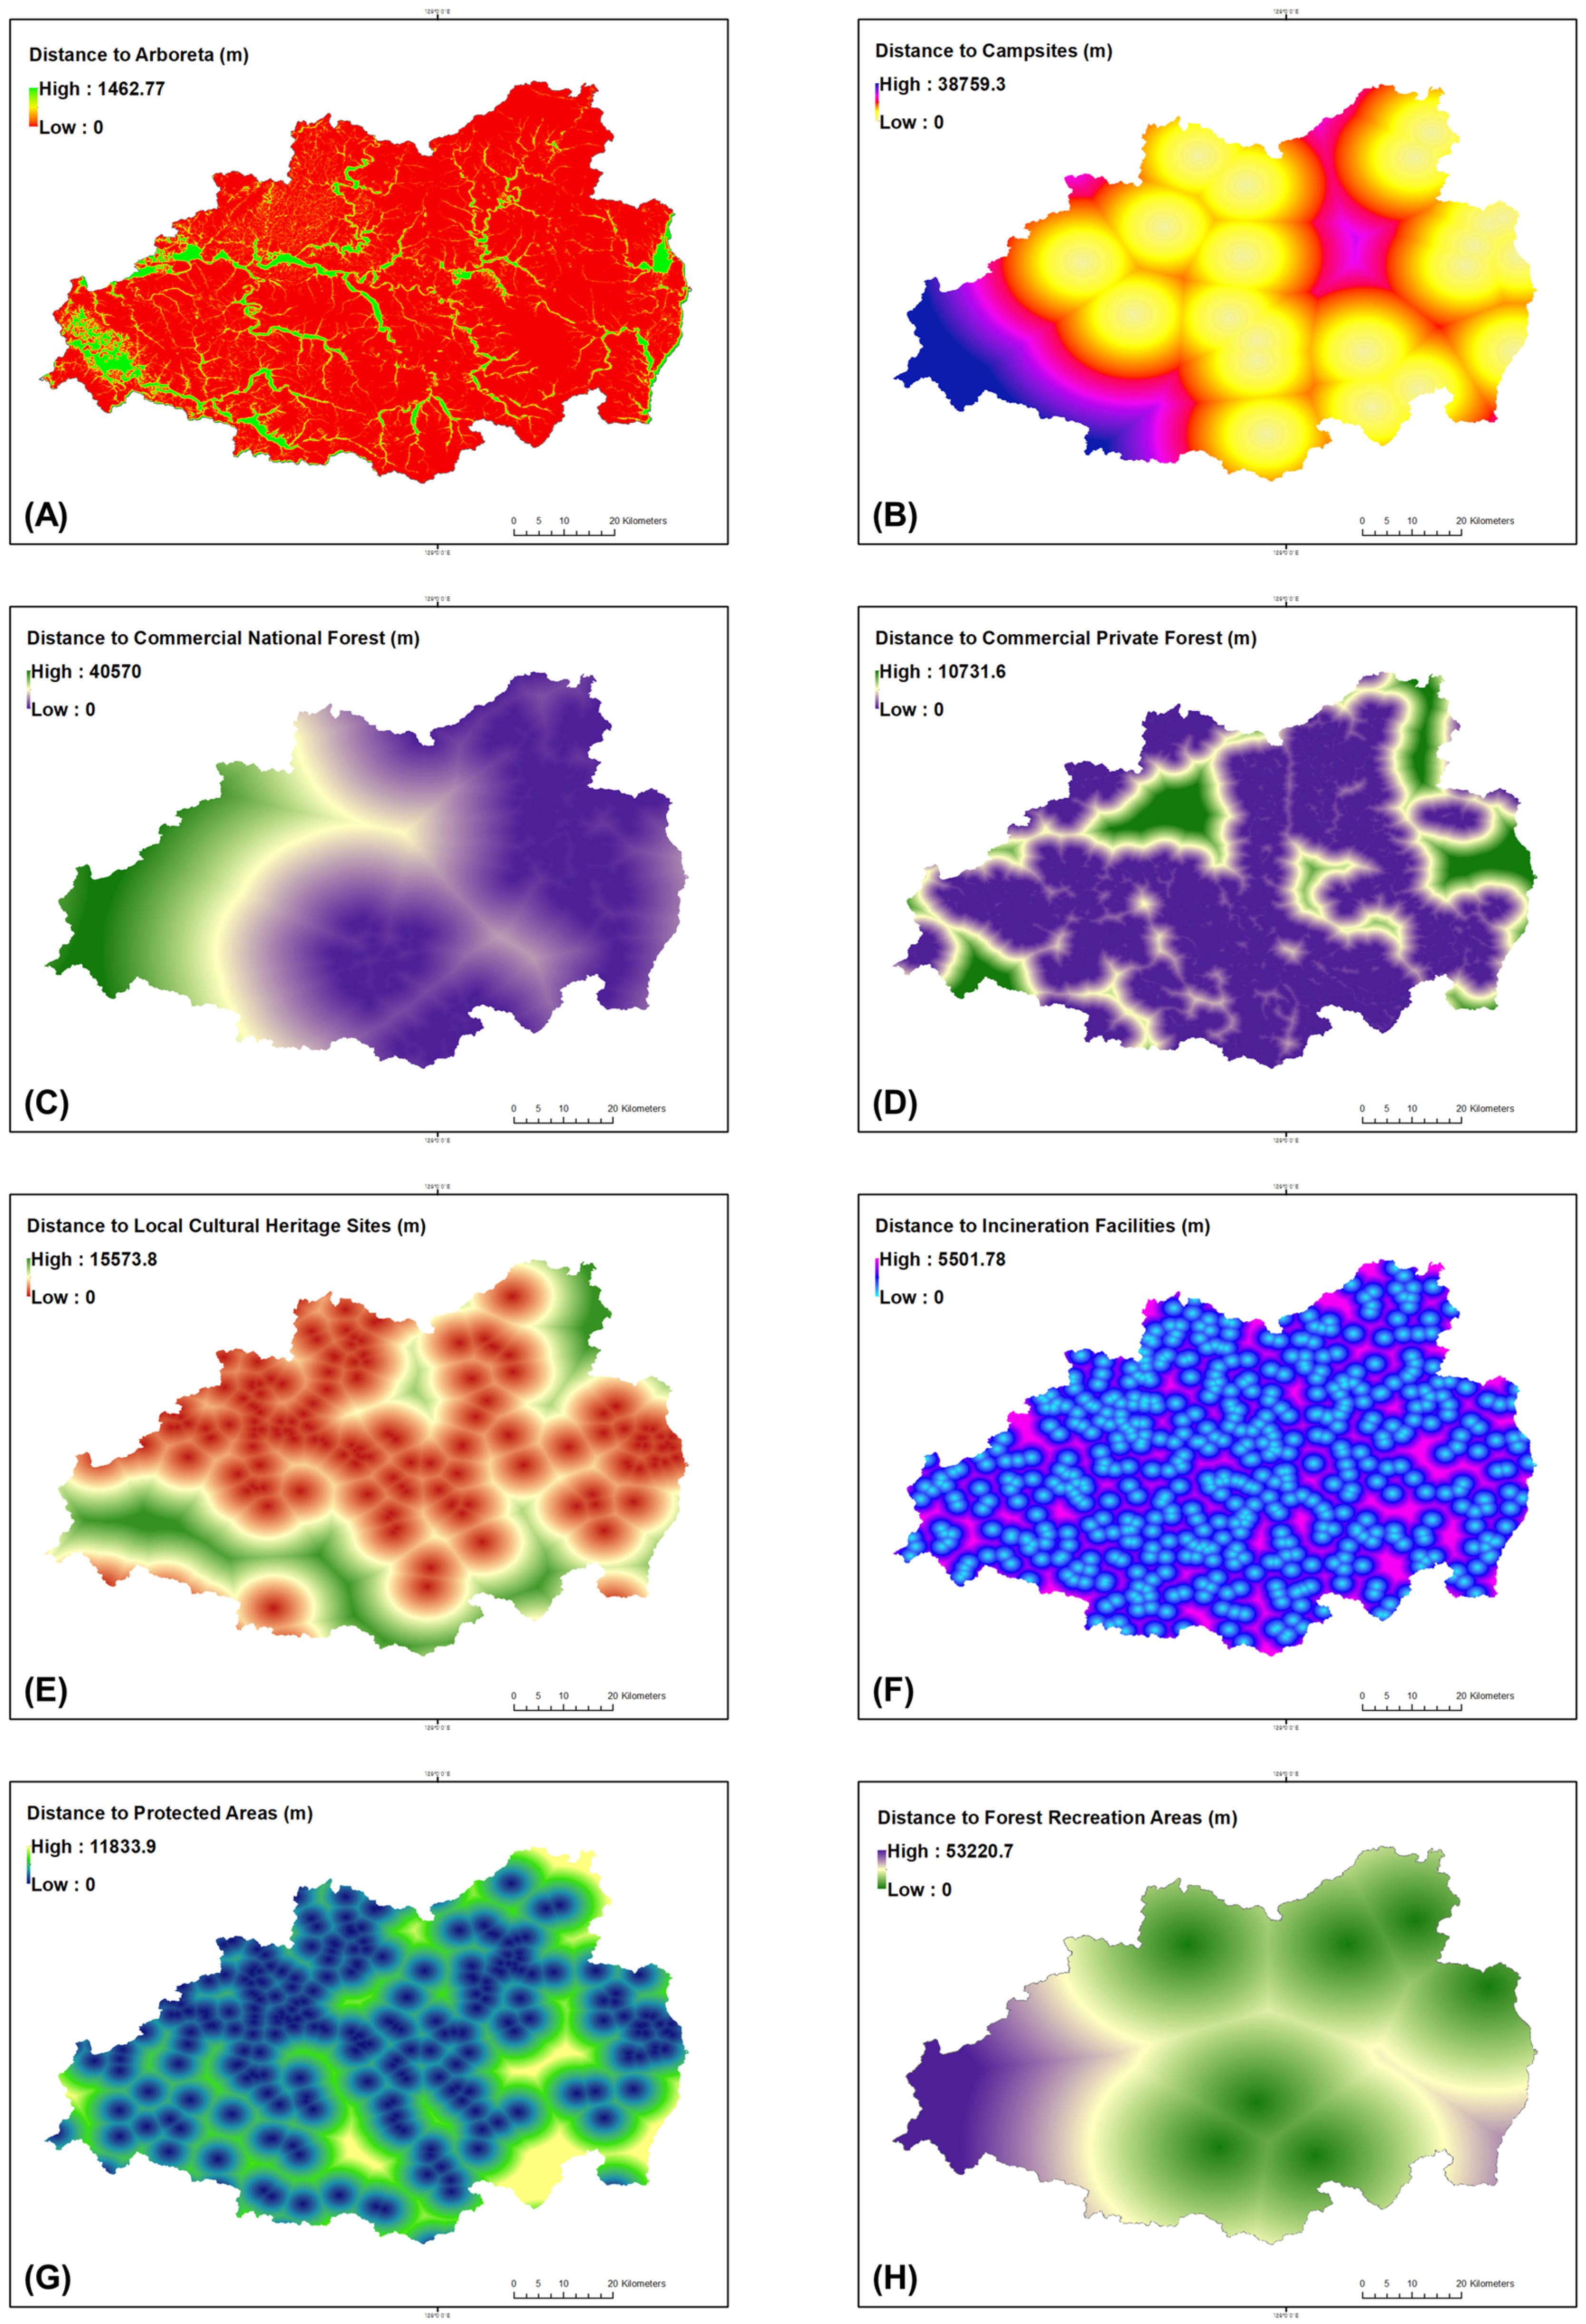
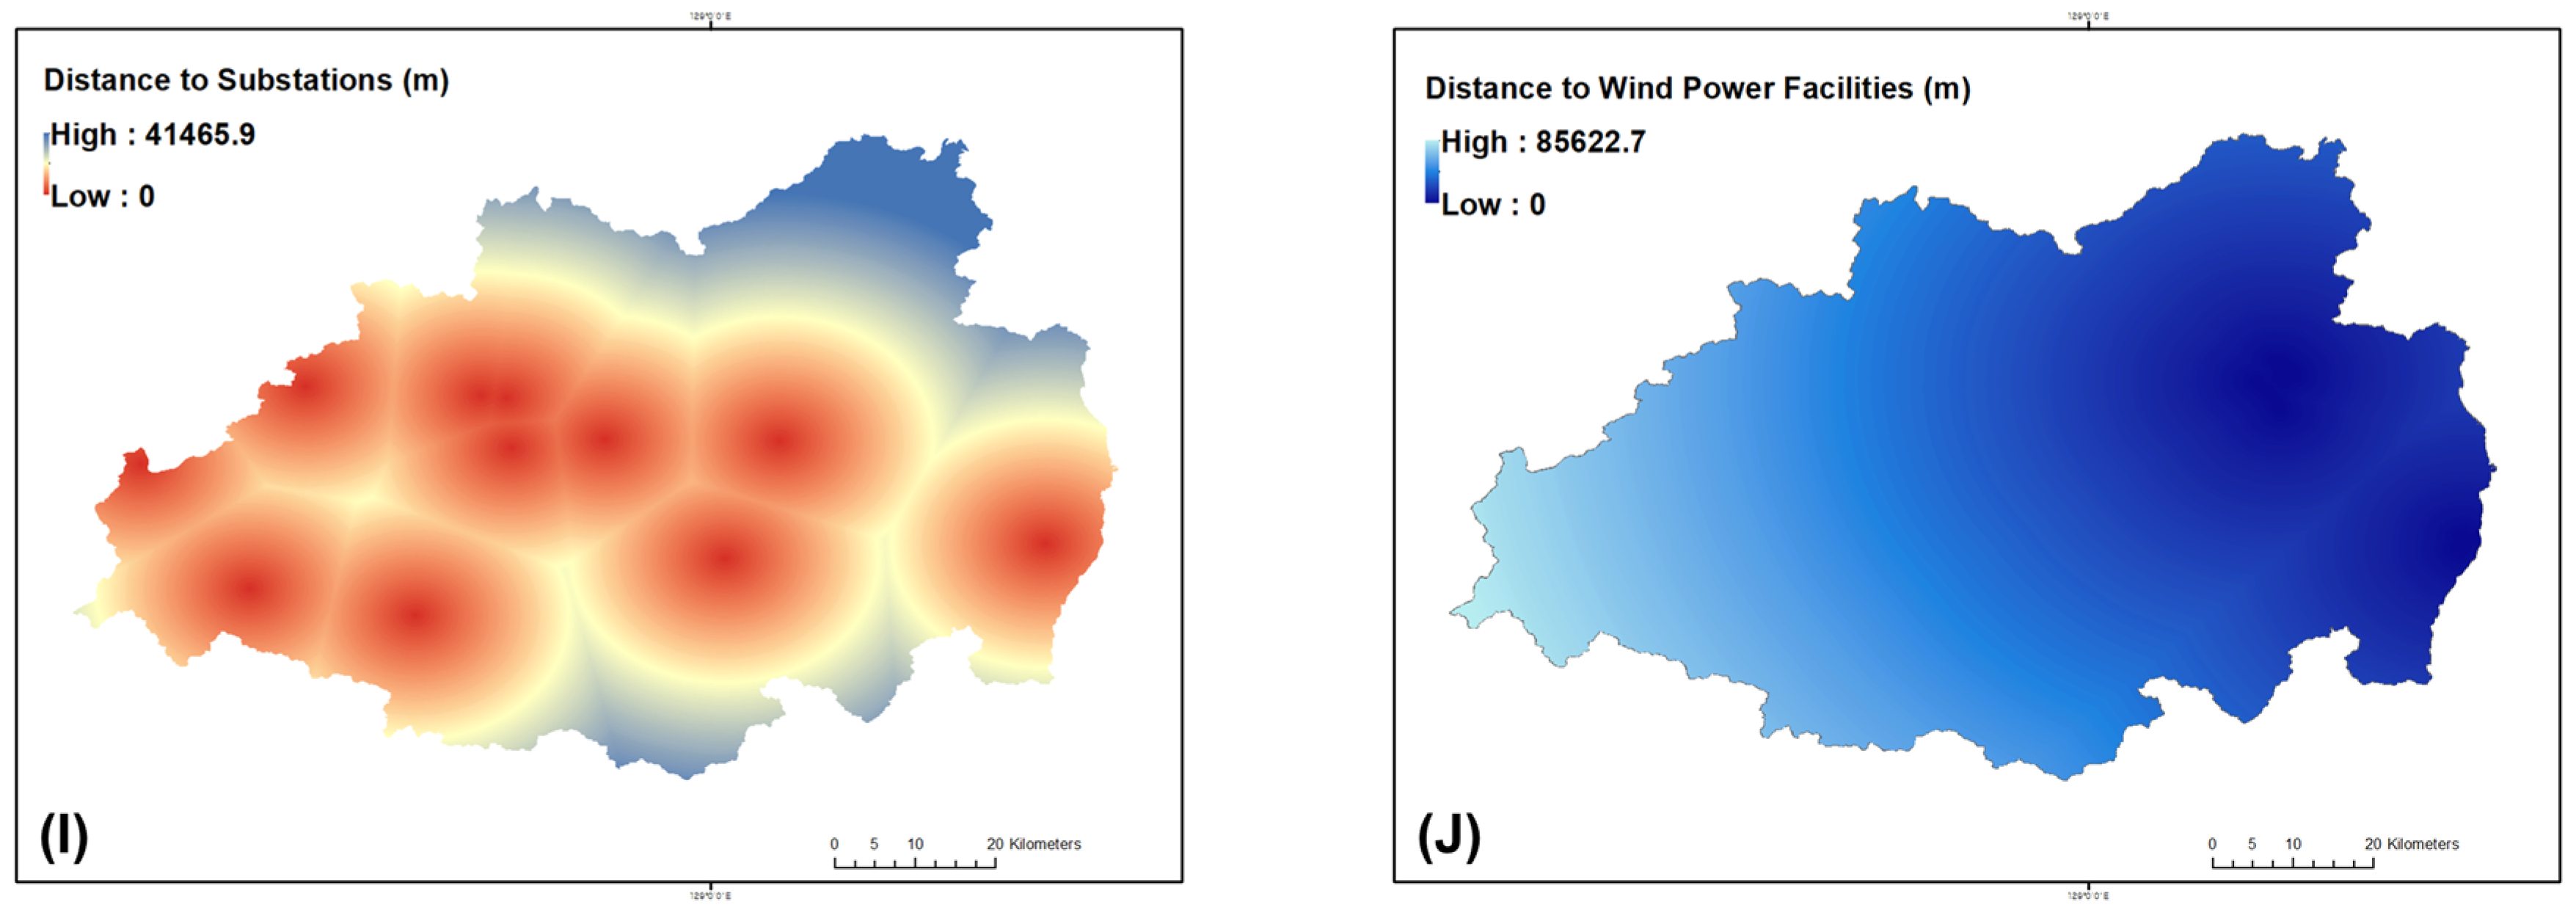
Figure A3.
Normalized socio-environmental proximity indices (0–1) derived from min–max transformation of Euclidean distance rasters. (A) Arboreta; (B) Campsites; (C) Commercial national forest; (D) Commercial private forest; (E) Cultural heritage sites; (F) Incineration facilities; (G) Protected areas; (H) Forest recreation areas; (I) Substations; and (J) wind power plants across Gyeongsangbuk-do. Higher values indicate closer proximity to anthropogenic or infrastructural features, highlighting human exposure gradients aligned with wildfire-susceptible zones.
References
- Okrah, A.; Magara, G.; Mensah, C.; Yeboah, E.; Prempeh, N.A.; Yawlui, I.S.Y.; Nyasulu, M.; Asante, V.A.; Junior, I.J.; Sarfo, I. Quantifying anthropogenic impacts on CO2 and CH4 emissions: Statistical insights and hotspot detection in East Africa. Environ. Monit. Assess. 2025, 197, 876. [Google Scholar] [CrossRef] [Scilit]
- Hussain, S.; Hussain, E.; Saxena, P.; Sharma, A.; Thathola, P.; Sonwani, S. Navigating the impact of climate change in India: A perspective on climate action (SDG13) and sustainable cities and communities (SDG11). Front. Sustain. Cities 2024, 5, 1308684. [Google Scholar] [CrossRef] [Scilit]
- Pausas, J.G.; Keeley, J.E. Wildfires and global change. Front. Ecol. Environ. 2021, 19, 387–395. [Google Scholar] [CrossRef] [Scilit]
- Pereira, M.G.; Parente, J.; Amraoui, M.; Oliveira, A.; Fernandes, P.M. The role of weather and climate conditions on extreme wildfires. In Extreme Wildfire Events and Disasters; Elsevier: Amsterdam, The Netherlands, 2020; pp. 55–72. [Google Scholar]
- Sykas, D.; Zografakis, D.; Demestichas, K. Deep learning approaches for wildfire severity prediction: A com-parative study of image segmentation networks and visual transformers on the eo4wildfires dataset. Fire 2024, 7, 374. [Google Scholar] [CrossRef] [Scilit]
- Liang, X.; Yu, S.; Meng, B.; Wang, X.; Yang, C.; Shi, C.; Ding, J. Multi-Source Remote Sensing and GIS for Forest Carbon Monitoring Toward Carbon Neutrality. Forests 2025, 16, 971. [Google Scholar] [CrossRef] [Scilit]
- Lee, C.; Choi, E.H.; Han, Y.; Lee, Y. Year-round daily wildfire prediction and key factor analysis using machine learning: A case study of Gangwon State, South Korea. Sci. Rep. 2025, 15, 29910. [Google Scholar] [CrossRef] [Scilit]
- Kim, J.; Kim, T.; Lee, Y.E.; Im, S. Spatial and temporal variability of forest fires in the Republic of Korea over 1991–2020. Nat. Hazards 2025, 121, 9801–9821. [Google Scholar] [CrossRef] [Scilit]
- Chang, D.Y.; Jeong, S.; Park, C.E.; Park, H.; Shin, J.; Bae, Y.; Park, H.; Park, C.R. Unprecedented wildfires in Korea: Historical evidence of increasing wildfire activity due to climate change. Agric. For. Meteorol. 2024, 348, 109920. [Google Scholar] [CrossRef] [Scilit]
- Attri, V.; Dhiman, R.; Sarvade, S. A review on status, implications and recent trends of forest fire management. Arch. Agric. Environ. Sci. 2020, 5, 592–602. [Google Scholar] [CrossRef] [Scilit]
- Wepukhulu, D.W. Impacts of Climate Change and Human Activities on Fire Hazards in Kakamega Forest, Kenya. Ph.D. Thesis, University of Nairobi, Nairobi, Kenya, 2024. [Google Scholar]
- Jeong, J.C.; Son, J.H. Analysis of Andong Wildfire Extent Using Random Forest and Forest Type Map. J. Cadastre Land Inf. 2025, 55, 157–171. [Google Scholar]
- Clarke, B.; Otto, F.; Jones, R. When don’t we need a new extreme event attribution study? Clim. Chang. 2023, 176, 60. [Google Scholar] [CrossRef] [Scilit]
- Liu, H.; Shu, L.; Liu, X.; Cheng, P.; Wang, M.; Huang, Y. Advancements in Artificial Intelligence Applications for Forest Fire Prediction. Forests 2025, 16, 704. [Google Scholar] [CrossRef] [Scilit]
- Geetha, V. Environmental Hazards, Vulnerability, and Disaster Research for Development: A Review. Multidiscip. Res. Area Arts Sci. Commer. 2025, 2, 18. [Google Scholar]
- Montoya Alvis, J.; Orozco Mendoza, G.L.; Zartha Sossa, J.W. Extreme Fire Events in Wildland–Urban Interface Areas: A Review of the Literature Concerning Determinants for Risk Governance. Sustainability 2025, 17, 4505. [Google Scholar] [CrossRef] [Scilit]
- Rezvani, S.; Falcão, M.J.; Komljenovic, D.; de Almeida, N.M. A systematic literature review on urban resilience enabled with asset and disaster risk management approaches and GIS-based decision support tools. Appl. Sci. 2023, 13, 2223. [Google Scholar] [CrossRef] [Scilit]
- Lee, S.H.; Lee, M.H.; Kang, T.H.; Cho, H.R.; Yun, H.S.; Lee, S.J. Comparative Analysis of dNBR, dNDVI, SVM Kernels, and ISODATA for Wildfire-Burned Area Mapping Using Sentinel-2 Imagery. Remote Sens. 2025, 17, 2196. [Google Scholar] [CrossRef] [Scilit]
- Choi, J.; Chae, H. Assessing wildfire risk in South Korea under climate change using the Maximum Entropy model and Shared Socioeconomic Pathway scenarios. Atmosphere 2024, 16, 5. [Google Scholar] [CrossRef] [Scilit]
- Xu, H.; Zlatanova, S.; Liang, R.; Canbulat, I. Generative AI as a Pillar for Predicting 2D and 3D Wildfire Spread: Beyond Physics-Based Models and Traditional Deep Learning. Fire 2025, 8, 293. [Google Scholar] [CrossRef] [Scilit]
- Karahan, A.; Demircan, N.; Özgeriş, M.; Gökçe, O.; Karahan, F. Integration of Drones in Landscape Research: Technological Approaches and Applications. Drones (2504-446X) 2025, 9, 603. [Google Scholar] [CrossRef] [Scilit]
- Varga, K.; Jones, C.; Trugman, A.; Carvalho, L.M.V.; McLoughlin, N.; Seto, D.; Thompson, C.; Daum, K. Megafires in a warming world: What wildfire risk factors led to California’s largest recorded wildfire. Fire 2022, 5, 16. [Google Scholar] [CrossRef] [Scilit]
- KOSTAT, Statistics Korea. 2024. Available online: https://kostat.go.kr/index.es?sid=a1 (accessed on 2 December 2025).
- Benefield, A.; Chen, J. Does Human Accessibility Affect Lightning-Caused Wildfires? A Case Study of the Southern Rocky Mountains. Fire Technol. 2023, 59, 2355–2374. [Google Scholar] [CrossRef] [Scilit]
- Kuntzemann, C.E.; Whitman, E.; Lewis, D.; Stralberg, D. Climate, topography, or fuels? Top-down versus bottom-up controls on fire refugia across British Columbia, Canada. Ecosphere 2025, 16, e70385. [Google Scholar] [CrossRef] [Scilit]
- Fusco, E.J.; Balch, J.K.; Mahood, A.L.; Nagy, R.C.; Syphard, A.D.; Bradley, B.A. The human–grass–fire cycle: How people and invasives co-occur to drive fire regimes. Front. Ecol. Environ. 2022, 20, 117–126. [Google Scholar] [CrossRef] [Scilit]
- Ying, L.; Cheng, H.; Shen, Z.; Guan, P.; Luo, C.; Peng, X. Relative humidity and agricultural activities dominate wildfire ignitions in Yunnan, Southwest China: Patterns, thresholds, and implications. Agric. For. Meteorol. 2021, 307, 108540. [Google Scholar] [CrossRef] [Scilit]
- Bayani, R.; Waseem, M.; Manshadi, S.D.; Davani, H. Quantifying the risk of wildfire ignition by power lines under extreme weather conditions. IEEE Syst. J. 2022, 17, 1024–1034. [Google Scholar] [CrossRef] [Scilit]
- Yang, X.; Jin, X.; Zhou, Y. Wildfire risk assessment and zoning by integrating Maxent and GIS in Hunan province, China. Forests 2021, 12, 1299. [Google Scholar] [CrossRef] [Scilit]
- Richardson, D.; Black, A.S.; Irving, D.; Matear, R.J.; Monselesan, D.P.; Risbey, J.S.; Squire, D.T.; Tozer, C.R. Global increase in wildfire potential from compound fire weather and drought. NPJ Clim. Atmos. Sci. 2022, 5, 23. [Google Scholar] [CrossRef] [Scilit]
- İban, M.C.; Şahin, E. Monitoring burn severity and air pollutants in wildfire events using remote sensing data: The case of Mersin wildfires in summer 2021. Gümüşhane Üniversitesi Bilim. Derg. 2022, 12, 487–497. [Google Scholar] [CrossRef] [Scilit]
- Su, Y.; Zhang, C.; Ciais, P.; Zeng, Z.; Cescatti, A.; Shang, J.; Chen, J.M.; Liu, J.; Wang, Y.-P.; Yuan, W.; et al. Asymmetric influence of forest cover gain and loss on land surface temperature. Nat. Clim. Chang. 2023, 13, 823–831. [Google Scholar] [CrossRef] [Scilit]
- Adhikari, B.; Xu, C.; Hodza, P.; Minckley, T. Developing a geospatial data-driven solution for rapid natural wildfire risk assessment. Appl. Geogr. 2021, 126, 102382. [Google Scholar] [CrossRef] [Scilit]
- Sakellariou, S.; Sfougaris, A.; Christopoulou, O.; Tampekis, S. Integrated wildfire risk assessment of natural and anthropogenic ecosystems based on simulation modeling and remotely sensed data fusion. Int. J. Disaster Risk Reduct. 2022, 78, 103129. [Google Scholar] [CrossRef] [Scilit]
- Nasiri, V.; Sadeghi, S.M.M.; Bagherabadi, R.; Moradi, F.; Deljouei, A.; Borz, S.A. Modeling wildfire risk in western Iran based on the integration of AHP and GIS. Environ. Monit. Assess. 2022, 194, 644. [Google Scholar] [CrossRef] [Scilit]
- Zhai, J.; Ning, Z.; Dahal, R.; Yang, S. Wildfire susceptibility of land use and topographic features in the Western United States: Implications for the landscape management. Forests 2023, 14, 807. [Google Scholar] [CrossRef] [Scilit]
- Xu, Y.; Guo, H.; Liu, J.; Sun, R.; Li, X. Wildfire risks under a changing climate: Synthesized assessments of wildfire risks over southwestern China. Front. Environ. Sci. 2023, 11, 1137372. [Google Scholar] [CrossRef] [Scilit]
- Salma; Nikhil, S.; Danumah, J.H.; Prasad, M.K.; Nazar, N.; Saha, S.; Mammen, P.C.; Ajin, R.S. Prediction capability of the MCDA-AHP model in wildfire risk zonation of a protected area in the Southern Western Ghats. Environ. Sustain. 2023, 6, 59–72. [Google Scholar] [CrossRef] [Scilit]
- Gentilucci, M.; Barbieri, M.; Younes, H.; Rihab, H.; Pambianchi, G. Analysis of Wildfire Susceptibility by Weight of Evidence, Using Geomorphological and Environmental Factors in the Marche Region, Central Italy. Geosciences 2024, 14, 112. [Google Scholar] [CrossRef] [Scilit]
- Niu, C.; Nair, D.J.; Zhang, T.; Dixit, V.; Murray-Tuite, P. Are wildfire fatalities related to road network characteristics? A preliminary analysis of global wildfire cases. Int. J. Disaster Risk Reduct. 2022, 80, 103217. [Google Scholar] [CrossRef] [Scilit]
- Bjånes, A.; De La Fuente, R.; Mena, P. A deep learning ensemble model for wildfire susceptibility mapping. Ecol. Inform. 2021, 65, 101397. [Google Scholar] [CrossRef] [Scilit]
- Kretsch-York, C. The Effect of Wildfires on Local Tick Populations and Human Disease Risk Along Popular Hiking Trails in Northern California. Master’s Thesis, University of California, Davis, CA, USA, 2024. [Google Scholar]
- Naser, M.Z.; Kodur, V. Vulnerability of structures and infrastructure to wildfires: A perspective into assessment and mitigation strategies. Nat. Hazards 2025, 121, 9995–10015. [Google Scholar] [CrossRef] [Scilit]
- Papathoma-Köhle, M.; Schlögl, M.; Garlichs, C.; Diakakis, M.; Mavroulis, S.; Fuchs, S. A wildfire vulnerability index for buildings. Sci. Rep. 2022, 12, 6378. [Google Scholar] [CrossRef] [Scilit]
- Hwang, S.N.; Meier, K. Associations between wildfire risk and socio-economic-demographic characteristics using GIS technology. J. Geogr. Inf. Syst. 2022, 14, 365–388. [Google Scholar] [CrossRef]
- Chas-Amil, M.L.; Nogueira-Moure, E.; Prestemon, J.P.; Touza, J. Spatial patterns of social vulnerability in relation to wildfire risk and wildland-urban interface presence. Landsc. Urban Plan. 2022, 228, 104577. [Google Scholar] [CrossRef] [Scilit]
- McConnell, K.; Braneon, C.V. Post-wildfire neighborhood change: Evidence from the 2018 Camp Fire. Landsc. Urban Plan. 2024, 247, 104997. [Google Scholar] [CrossRef] [Scilit]
- Wang, B.; Li, W.; Lai, G.; Chang, N.; Chen, F.; Bai, Y.; Liu, X. Forest Fire Spread Hazard and Landscape Pattern Characteristics in the Mountainous District, Beijing. Forests 2023, 14, 2139. [Google Scholar] [CrossRef] [Scilit]
- Thompson, M.P.; Gannon, B.M.; Caggiano, M.D. Forest roads and operational wildfire response planning. Forests 2021, 12, 110. [Google Scholar] [CrossRef] [Scilit]
- Mostafa, M.; Elia, M.; Giannico, V.; Lafortezza, R.; Sanesi, G. Assessing forest road network suitability in relation to the spatial occurrence of wildfires in mediterranean forest ecosystems. Fire 2024, 7, 175. [Google Scholar] [CrossRef] [Scilit]
- Davis, K.T.; Peeler, J.; Fargione, J.; Haugo, R.D.; Metlen, K.L.; Robles, M.D.; Woolley, T. Tamm review: A meta-analysis of thinning, prescribed fire, and wildfire effects on subsequent wildfire severity in conifer dominated forests of the Western US. For. Ecol. Manag. 2024, 561, 121885. [Google Scholar] [CrossRef] [Scilit]
- Zumr, V.; Remeš, J.; Nakládal, O. Immediate Response of Carabids to Small-Scale Wildfire Across a Healthy-Edge-Burnt Gradient in Young Managed Coniferous Forest in Central Europe. Fire 2024, 7, 436. [Google Scholar]
- Yi, T.; Lee, J. Evaluating and Predicting Wildfire Burn Severity Through Stand Structure and Seasonal NDVI: A Case Study of the March 2025 Uiseong Wildfire. Fire 2025, 8, 363. [Google Scholar] [CrossRef] [Scilit]
- Ba, R.; Song, W.; Lovallo, M.; Zhang, H.; Telesca, L. Informational analysis of MODIS NDVI and EVI time series of sites affected and unaffected by wildfires. Phys. A Stat. Mech. Its Appl. 2022, 604, 127911. [Google Scholar]
- Seydi, S.T.; Akhoondzadeh, M.; Amani, M.; Mahdavi, S. Wildfire damage assessment over Australia using sentinel-2 imagery and MODIS land cover product within the google earth engine cloud platform. Remote Sens. 2021, 13, 220. [Google Scholar] [CrossRef] [Scilit]
- Vilar, L.; Herrera, S.; Tafur-García, E.; Yebra, M.; Martínez-Vega, J.; Echavarría, P.; Martín, M.P. Modelling wildfire occurrence at regional scale from land use/cover and climate change scenarios. Environ. Model. Softw. 2021, 145, 105200. [Google Scholar] [CrossRef] [Scilit]
- Nikolaychuk, O.; Pestova, J.; Yurin, A. Wildfire susceptibility mapping in baikal natural territory using random forest. Forests 2024, 15, 170. [Google Scholar] [CrossRef] [Scilit]
- Sheriff, R.; Meer, M.S.; Aslam, R.W.; Said, Y. Machine learning-based forest fire susceptibility mapping using random forest and CART models. Rangel. Ecol. Manag. 2025, 102, 96–109. [Google Scholar] [CrossRef] [Scilit]
- Moayedi, H.; Khasmakhi, M.A.S.A. Wildfire susceptibility mapping using two empowered machine learning algorithms. Stoch. Environ. Res. Risk Assess. 2023, 37, 49–72. [Google Scholar] [CrossRef] [Scilit]
- Mony, C. Evaluating Foehn Development in a Changing Climate Using Machine Learning and Investigating the Impact of Foehn on Forest Fire Occurrence and Severity. Master’s Thesis, ETH Zurich, Zürich, Switzerland, 2020. [Google Scholar]
- Sharples, J.J. An overview of mountain meteorological effects relevant to fire behaviour and bushfire risk. Int. J. Wildland Fire 2009, 18, 737–754. [Google Scholar] [CrossRef] [Scilit]
- Rodríguez Fernández-Blanco, C.; Muys, B.; Winkel, G.; Parra, C. Revisiting wildfire resilience from a territorial perspective: Insights from Mediterranean Spain. J. Environ. Plan. Manag. 2025, 68, 3091–3120. [Google Scholar] [CrossRef] [Scilit]
- Touge, Y.; Shi, K.; Nishino, T.; Sun, C.; Sekizawa, A. Spatial-temporal characteristics of more than 50,000 wildfires in Japan from 1995 to 2020. Fire Saf. J. 2024, 142, 104025. [Google Scholar] [CrossRef] [Scilit]
- Jiao, M.; Quan, X.; Yao, J.; Wang, W. How does the management paradigm contain wildfire over Southwest China? Evidence from remote sensing observation. IEEE Geosci. Remote Sens. Lett. 2023, 20, 1–5. [Google Scholar]
- Yue, W.; Ren, C.; Liang, Y.; Lin, X.; Yin, A.; Liang, J. Wildfire risk assessment considering seasonal differences: A case study of Nanning, China. Forests 2023, 14, 1616. [Google Scholar] [CrossRef] [Scilit]
- Croker, A.R.; Woods, J.; Kountouris, Y. Community-Based Fire Management in East and Southern African Savanna-Protected Areas: A Review of the Published Evidence. Earth’s Future 2023, 11, e2023EF003552. [Google Scholar] [CrossRef] [Scilit]
- Alam, S.; Nurhidayah, L.; Lim, M. Towards a transnational approach to transboundary haze pollution: Governing traditional farming in fire-prone regions of Indonesia. Transnatl. Environ. Law 2023, 12, 424–450. [Google Scholar] [CrossRef] [Scilit]
- Purnomo, H.; Puspitaloka, D.; Okarda, B.; Andrianto, A.; Qomar, N.; Sutikno, S.; Muhammad, A.; Basuki, I.; Jalil, A.; Yesi; et al. Community-based fire prevention and peatland restoration in Indonesia: A participatory action research approach. Environ. Dev. 2024, 50, 100971. [Google Scholar] [CrossRef] [Scilit]
- Iban, M.C.; Aksu, O. SHAP-driven explainable artificial intelligence framework for wildfire susceptibility mapping using MODIS active fire pixels: An in-depth interpretation of contributing factors in Izmir, Türkiye. Remote Sens. 2024, 16, 2842. [Google Scholar] [CrossRef] [Scilit]
- Mansoor, S.; Farooq, I.; Kachroo, M.M.; Mahmoud, A.E.D.; Fawzy, M.; Popescu, S.M.; Alyemeni, M.; Sonne, C.; Rinklebe, J.; Ahmad, P. Elevation in wildfire frequencies with respect to the climate change. J. Environ. Manag. 2022, 301, 113769. [Google Scholar] [CrossRef] [Scilit] [PubMed]
- Oikonomou, A.; Avramidou, M.; Psomiadis, E. Earth Observation and Geospatial Analysis for Fire Risk Assessment in Wildland–Urban Interfaces: The Case of the Highly Dense Urban Area of Attica, Greece. Remote Sens. 2025, 17, 4052. [Google Scholar] [CrossRef] [Scilit]
- Edgeley, C.M.; Evans, A.M.; Devenport, S.E.; Kohler, G.; Zamudio, Z.M.; DeGrandpre, W.D. Preventing Human-Caused Wildfire Ignitions on Public Lands: A Review of Best Practices. For. Sci. 2025, 71, 493–521. [Google Scholar] [CrossRef] [Scilit]
- Lee, J.Y.; Lee, D.Y. Variability and changes of wildfire potential over East Asia from 1981 to 2020. J. Korean Earth Sci. Soc. 2022, 43, 30–40. [Google Scholar] [CrossRef] [Scilit]

Disclaimer/Publisher’s Note: The statements, opinions and data contained in all publications are solely those of the individual author(s) and contributor(s) and not of MDPI and/or the editor(s). MDPI and/or the editor(s) disclaim responsibility for any injury to people or property resulting from any ideas, methods, instructions or products referred to in the content. |
© 2026 by the authors. Licensee MDPI, Basel, Switzerland. This article is an open access article distributed under the terms and conditions of the Creative Commons Attribution (CC BY) license.