


Abstract
Understanding the formation mechanisms of plant hydrothermal niches is a core issue in ecology. This study focused on 362 woody plant species in eastern China to investigate the effects of leaf nitrogen (N), phosphorus (P), and their ratio (N/P) on hydrothermal niches and to assess the role of phylogenetic signals. Our results showed that all niche parameters exhibited significant yet varying strengths of phylogenetic signals, with thermal niche signals generally stronger than those of hydric niches. Leaf N and P were significantly correlated with thermal niche dimensions (e.g., breadth and lower limits), whereas leaf N/P and P primarily drove variation in hydric niche dimensions (e.g., breadth and upper limits). This study confirms the asymmetric and dimension-specific influences of leaf nutrients on hydrothermal niches, highlights the necessity of controlling for phylogenetic history in trait-niche research, and provides new perspectives for understanding plant environmental adaptation and evolution.
1. Introduction
How plants adapt to and distribute across diverse environments is a central question in ecology. A plant’s niche, particularly its distribution-based tolerance to temperature and moisture (i.e., its hydrothermal niche), directly determines its geographical distribution and survival strategy [1,2,3]. Concurrently, leaf nitrogen (N) and phosphorus (P), as key plant functional traits, are involved in regulating core physiological processes such as photosynthesis and respiration, and are often considered indicators of plant resource investment strategy and growth rate [4,5,6]. The classic “plant economics spectrum” theory posits that these functional traits are closely linked to plants’ environmental adaptation strategies [7]. However, most current research has focused on exploring the relationships between traits and single environmental factors or overall distribution patterns (e.g., [7,8]). Studies that directly link leaf chemical traits with quantitative, multi-dimensional hydrothermal niche parameters, including niche breadth and its upper/lower limits, remain relatively scarce [9,10,11]. In particular, the underlying mechanisms of how key traits distinctly influence different niche dimensions are still unclear, which limits our ability to accurately predict species’ responses to environmental change. Additionally, it should be noted that the thermal and hydric niche boundaries of plants are determined by a complex network of factors, including—but not limited to—other functional traits (e.g., specific leaf area, xylem hydraulic conductivity, root architecture), biotic interactions (such as competition, symbiosis, and herbivory), soil physicochemical properties, disturbance regimes, as well as species’ dispersal capacity and evolutionary history [12,13,14]. Therefore, leaf N and P, as core stoichiometric traits, can be regarded as a critical entry point for understanding this complex network. This study focuses on investigating the specific relationships between these two key traits and multidimensional niche parameters, aiming to clarify their distinct roles in shaping the environmental adaptive ranges of species.
Specifically, leaf N and P likely influence plant distribution-based tolerance thresholds to temperature and moisture stress—and thus shape their thermal and hydric niches—through distinct physiological pathways. In the thermal dimension, higher leaf N and P concentrations generally support greater enzyme concentrations and metabolic rates [4]. This may enhance a plant’s ability to maintain essential physiological functions (such as photosynthesis and membrane stability) under low-temperature conditions, potentially broadening its thermal tolerance range, particularly by improving cold tolerance (i.e., lowering the lower thermal niche limit) [15]. In contrast, tolerance to high temperatures likely depends more strongly on leaf morphological and anatomical traits (e.g., cuticular wax, mesophyll thickness) and the expression of heat-shock proteins, which may be only weakly linked directly to leaf nutrient concentration [16]. In the hydric dimension, the leaf N/P serves as a key indicator of the type of nutrient limitation a plant experiences [17], and different nutrient limitation regimes (e.g., nitrogen vs. phosphorus limitation) can drive plants to adopt contrasting water-acquisition and -use strategies. For instance, under phosphorus-limited (i.e., high N/P) conditions, plants tend to allocate more biomass to root growth, enabling exploration of a larger soil volume—a strategy that concurrently enhances water uptake during dry periods and may thereby widen the hydric niche [18]. Moreover, phosphorus plays a central role in energy metabolism (ATP), which directly affects the plant’s capacity to perform energy-demanding physiological processes under drought stress, such as stomatal regulation and osmotic adjustment [19]. Thus, leaf N, P, and their stoichiometric ratio are likely to exert asymmetric, dimension-specific effects on different aspects of thermal and hydric niches—such as niche breadth, and upper and lower limits.
In this study, the core concept of “asymmetry” specifically refers to three interrelated levels used to describe the complex patterns through which leaf nutrient traits influence plant thermal and hydric niches: (1) Dimension-specific asymmetry: This indicates that leaf N, P, and N/P exert differing weights and patterns of influence on different niche dimensions (thermal vs. hydric). For example, a given trait may strongly affect thermal niche breadth yet have little effect on hydric niche breadth. (2) Directional asymmetry: This refers to the situation in which the same trait exerts opposing or differential effects on different boundaries of a given niche dimension (e.g., upper vs. lower limits). For instance, leaf N may be associated with a lower limit of thermal niche (negative correlation) while showing no significant relationship with the upper limit of thermal niche. (3) Mechanistic asymmetry: This describes differences in the underlying physiological and ecological mechanisms driving the statistical relationships mentioned above across different dimensions or boundaries. For example, thermal tolerance may be more closely linked to nutrient-supported metabolic processes, whereas moisture tolerance may rely more on nutrient-driven morphological adaptations (e.g., root architecture). The present study aims to test the first two levels of asymmetry and to discuss and review potential mechanistic asymmetry in Section 4, thereby providing a comprehensive perspective on the complex ways in which leaf nutrient traits shape multidimensional niches.
When exploring the relationship between traits and niches, an essential factor that cannot be overlooked is phylogenetic history. Due to the influence of common ancestry, traits among species may not be entirely independent but rather exhibit phylogenetic signals [20,21]. This implies that observed trait-niche associations may partly stem from phylogenetic conservatism rather than purely ecological adaptation [22]. For instance, closely related species may share similar heat tolerance due to conserved physiological structures (e.g., leaf anatomical features, enzyme thermal stability), while their drought tolerance may rapidly diverge under strong natural selection, manifesting as weaker phylogenetic signals. Therefore, when evaluating the role of functional traits in shaping niches, clarifying the strength of phylogenetic signals carried by different niche parameters becomes a critical prerequisite for disentangling the influences of historical evolutionary constraints and contemporary ecological adaptation. This is essential for understanding the evolutionary mechanisms underlying trait-niche relationships.
Therefore, the primary aim of this study was to quantify the specific and asymmetric influences of leaf N, P, and N/P on multiple dimensions of the hydrothermal niches of 362 woody plant species, while rigorously accounting for the role of phylogenetic history. Based on evolutionary biology, plant physiological ecology and ecological stoichiometry theories, we proposed the following hypotheses:
H1:
Thermal and hydric niche parameters exhibit statistically significant yet varying strengths of phylogenetic signals, with thermal niche signals generally stronger than those of hydric niches.
H2:
Leaf N and P concentrations are positively associated with thermal niche breadth and contribute to a lower thermal limit (greater cold tolerance), owing to their roles in supporting metabolic processes.
H3:
The leaf N/P ratio is a key predictor of hydric niche breadth and its upper limit (wetter tolerance), reflecting strategic trade-offs in nutrient use and water acquisition under different nutrient limitation scenarios.
H4:
The influences of leaf nutrients on thermal versus hydric niche dimensions are asymmetric and dimension-specific.
To test these hypotheses, we investigated 362 woody plant species in eastern China by integrating species distribution, leaf traits, and phylogenetic data. We specifically addressed two questions: (1) Do thermal and hydric niche parameters (e.g., niche breadth, upper and lower limits) exhibit significant phylogenetic signals, and do these signals differ systematically between niche dimensions and their limits? (2) After accounting for phylogenetic history, to what extent are leaf N, P, and N/P significant predictors of thermal and hydric niche dimensions, and how do these predictive effects vary across dimensions?
The significance of this study lies in its ability to enhance the understanding of plant adaptive evolution mechanisms by analyzing the relationship between leaf nutrients and multidimensional niches within a phylogenetic framework. Furthermore, this study seeks to provide insights that could support the development of mechanistic species distribution models theoretically and help elucidate the potential capacity and direction of range shifts for plant groups with different nutrient strategies under global climate change, thereby potentially informing biodiversity conservation and ecosystem management.
2. Materials and Methods
2.1. Leaf Nitrogen and Phosphorus Data for Woody Plants
Leaf nitrogen (N) and phosphorus (P) concentrations, as well as the nitrogen to phosphorus ratio (N/P), for the 362 woody plant species from eastern China used in this study were obtained from Chen et al. [22]. The 362 woody plant species belong to 74 families (with dominant families including Fabaceae, Rosaceae, etc.) and 194 genera. The sample encompasses the principal evergreen and deciduous trees and shrubs within the regional forest communities, essentially covering the dominant and common woody plant components across major forest vegetation types from the cold-temperate to the tropical zones. These species were collected from 14 sampling sites along a significant forest transect in eastern China. This transect exhibits a vast geographical span, with a latitudinal range from 18.7° N to 50.9° N, covering approximately 32 degrees of latitude. The altitudinal range extends from 80 m to 1857 m above sea level. Corresponding climatic conditions vary significantly across these sites. Mean annual temperature ranges from −5.7 °C to 25.3 °C, and annual precipitation ranges from 423 mm to 2031 mm. Soil types also show substantial variation, ranging from brown soils with high organic matter content to tropical red soils with low organic matter content. Vegetation types change progressively from north to south, including temperate coniferous forests, temperate deciduous broadleaf forests, subtropical evergreen broadleaf forests, and tropical seasonal rainforests.
Leaf samples were collected following the standardized protocol proposed by Cornelissen et al. [23]. Mature sun-exposed leaves were obtained from four or five distinct individuals of each species, all located at the same sampling site, during the growing period (July–August) over three consecutive years (2005–2007). Samples were dried for 72 h at 60 °C and then ground using a ball mill (NM200, Retsch, Haan, Germany) for the measurement of N and P concentrations. Leaf N concentration was determined using an elemental analyzer (Model 2400 II CHNS/O, PerkinElmer Inc., Waltham, MA, USA) with a combustion temperature of 950 °C and a reduction temperature of 640 °C. Leaf P concentration was measured by the molybdenum antimony anti colorimetric method [24] after digestion with sulfuric perchloric acid, and the absorbance of each sample was measured at 700 nm after 20 min of adding molybdenum-antimony-ascorbic acid reagent. Detailed procedures for sampling and chemical analysis are described in Chen et al. [22].
2.2. Hydrothermal Niche Data
Hydrothermal niche data for the 362 woody plant species were derived from Fang et al. [25], which provided three key environmental variables across each species’ distribution range: the coldest month temperature (TCM, in °C), the warmest month temperature (TWM, in °C), and the moisture index (MI). The MI, representing regional moisture conditions, was calculated based on Thornthwaite’s (1948) water balance method [26], with detailed computation procedures described in Fang and Yoda [27]. The species distribution data were compiled at the county-level administrative unit. This compilation integrated multiple information sources, including national, provincial, and local floras and checklists, field investigation monographs, academic literature, and herbarium specimen records (referencing the Chinese Virtual Herbarium, http://www.cvh.ac.cn (accessed on 15 December 2025)) [25]. To ensure data accuracy, 21 experts in botany and ecology were invited to systematically review and revise the collected species distribution information for each region, along with the Chinese names and Latin scientific names (covering species, genus, and family levels) [25].
For the thermal niche, the lower TCM corresponds to the lower thermal niche limit; the upper TWM corresponds to the upper thermal niche limit; and the difference between the upper TWM and lower TCM defines the thermal niche breadth. For the hydric (moisture) niche, the lower MI corresponds to the lower hydric niche limit; the upper MI corresponds to the upper hydric niche limit; and the difference between the upper MI and lower MI defines the hydric niche breadth.
Specifically, the moisture index (MI) values used to calculate the lower and upper hydric niche limits, and subsequently the hydric niche breadth (upper MI–lower MI), were based on the original scale as provided in the source data [25] and were not normalized prior to the breadth calculation. Similarly, the thermal niche breadth was calculated directly from the temperature difference (°C) between the upper (TWM) and lower (TCM) limits. None of the resulting niche breadth variables (thermal or hydric) was log-transformed for the primary phylogenetic regression analyses presented in the main text. All variables were, however, standardized (Z-score transformation) prior to being entered into the multiple phylogenetic generalized linear models (PGLMs) for the estimation and comparison of effect sizes.
This operational definition follows the widely used approach in macroecology of estimating species’ realized climatic niches from distribution data [28,29]. Specifically, the minimum value of an environmental variable (e.g., TCM, MI) recorded across a species’ known distributional range is used as a proxy for its lower tolerance limit, and the maximum value (e.g., TWM, MI) as a proxy for its upper tolerance limit. The difference between these limits quantifies the niche breadth, representing the range of conditions the species is known to occupy [30].
2.3. Statistical Methods
2.3.1. Phylogenetic Signal
We obtained phylogenetic information for all studied species using the phylo.maker function in the R package “V.PhyloMaker2” [31]. Specifically, we used the GBOTB.extended.TPL megatree (originally comprising 74,531 species) and applied scenario S3 to extract a phylogeny for our species subset [31]. The resulting phylogeny provided sufficient resolution to examine relationships among genera and families.
We acknowledge that phylogenetic reconstruction for large species sets inevitably involves some degree of phylogenetic uncertainty, particularly regarding the exact branching order and branch lengths among closely related species. This uncertainty arises from limitations in genetic data availability and the complexities of evolutionary history. However, for the purpose of this study—which focuses on testing for broad-scale phylogenetic signals and controlling for phylogenetic non-independence in trait-niche regression analyses across hundreds of species—a phylogeny resolved to the genus and family level provides sufficient statistical power and evolutionary context. This is because the phylogenetic generalized least squares framework used in our phylogenetic regressions is primarily sensitive to the overall phylogenetic structure and the depth of shared ancestry (i.e., the covariance structure among species), rather than requiring perfectly resolved species-level topologies. Numerous comparative studies have successfully used family- or genus-level phylogenies to detect significant phylogenetic signals and correct for phylogeny in macroecological analyses, demonstrating that higher taxonomic levels can adequately capture the relevant evolutionary history for such questions (e.g., [32,33]). Therefore, while our phylogeny may not resolve all species-level relationships, it is appropriate for estimating and correcting for phylogenetic effects at the scale of our investigation.
The significance of phylogenetic signals in leaf N, leaf P, leaf N/P, thermal niche breadth, lower thermal niche limit, upper thermal niche limit, hydric niche breadth, lower hydric niche limit, and upper hydric niche limit was evaluated using Pagel’s λ [34]. This metric employs a Brownian motion-based evolutionary model to quantify the degree of phylogenetic signal in specific traits. Estimates were performed using the phytools package in R [35]. The 95% confidence interval for Pagel’s λ was calculated via the bootstrap method using the R package “boot” [36].
2.3.2. Phylogenetic Generalized Linear Models and Linear Models
We adopted a hierarchical analytical approach to dissect the relationships between leaf nutrients and niche parameters. This progression from exploratory to confirmatory modeling is a recommended practice to structure analysis and mitigate false-positive risks [37]. First, we conducted exploratory bivariate PGLMs between each leaf trait (N, P, N/P) and each niche parameter separately. This step aimed to identify any significant pairwise associations without controlling for potential covariation among the three nutrient traits, providing an initial, broad assessment of trait-niche links. Subsequently, we performed confirmatory multiple PGLMs, simultaneously including leaf N, P, and N/P as predictors for each niche parameter. This step was essential to evaluate the independent contribution of each trait while accounting for inter-correlations among them, thereby identifying the most parsimonious set of predictors and mitigating issues of multicollinearity in interpretation (e.g., distinguishing the effect of N from that of P or N/P)—a key rationale for using multivariate models [38].
Regarding statistical inference, we treated p-values with care in the context of multiple testing. Given that our confirmatory hypotheses were specific and dimension-focused (e.g., testing a priori predictions about which traits affect thermal vs. hydric dimensions), we did not apply a universal correction (e.g., Bonferroni) across all tests, as such corrections can be overly conservative and increase Type II errors when hypotheses are not fully independent or exploratory [37]. Instead, we prioritized the interpretation of effect sizes and patterns of consistency across bivariate and multivariate models, recognizing that the magnitude and precision of an effect are more informative than binary significance testing alone [39]. Significance was evaluated at α = 0.05, but we emphasize that p-values should be interpreted alongside the reported R2 values, which indicate the proportion of variance explained, and in the context of the strong phylogenetic control applied, which yields more conservative estimates. All analyses were conducted to be reproducible, and raw p-values are fully reported in the Section 3 and Supplementary Materials for transparency.
We assessed the relationships of thermal niche (thermal niche breadth, lower thermal niche limit, upper thermal niche limit) and hydric niche (hydric niche breadth, lower hydric niche limit, upper hydric niche limit) with leaf N, leaf P, and leaf N/P using bivariate PGLMs, implemented separately via the “phylolm” R package [40].
To account for potential confounding effects among the three leaf nutrient variables, we further employed multiple PGLMs incorporating leaf N, leaf P, and leaf N/P ratio simultaneously to evaluate their combined influence on both thermal and hydric niche parameters.
For comparison, we also repeated the above analyses using conventional (non-phylogenetic) bivariate and multiple linear regression models (LMs).
All statistical analyses were conducted using R version 4.5.2 [41].
3. Results
See details of descriptive statistics of leaf traits and hydrothermal niche parameters for 362 woody plant species in Table 1.
Table 1.
Descriptive statistics of leaf traits and hydrothermal niche parameters for 362 woody plant species in eastern China.
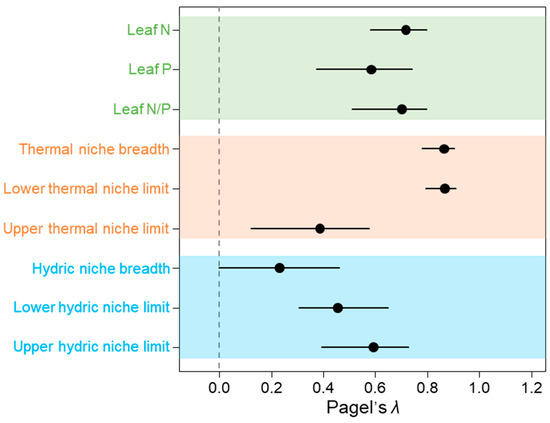
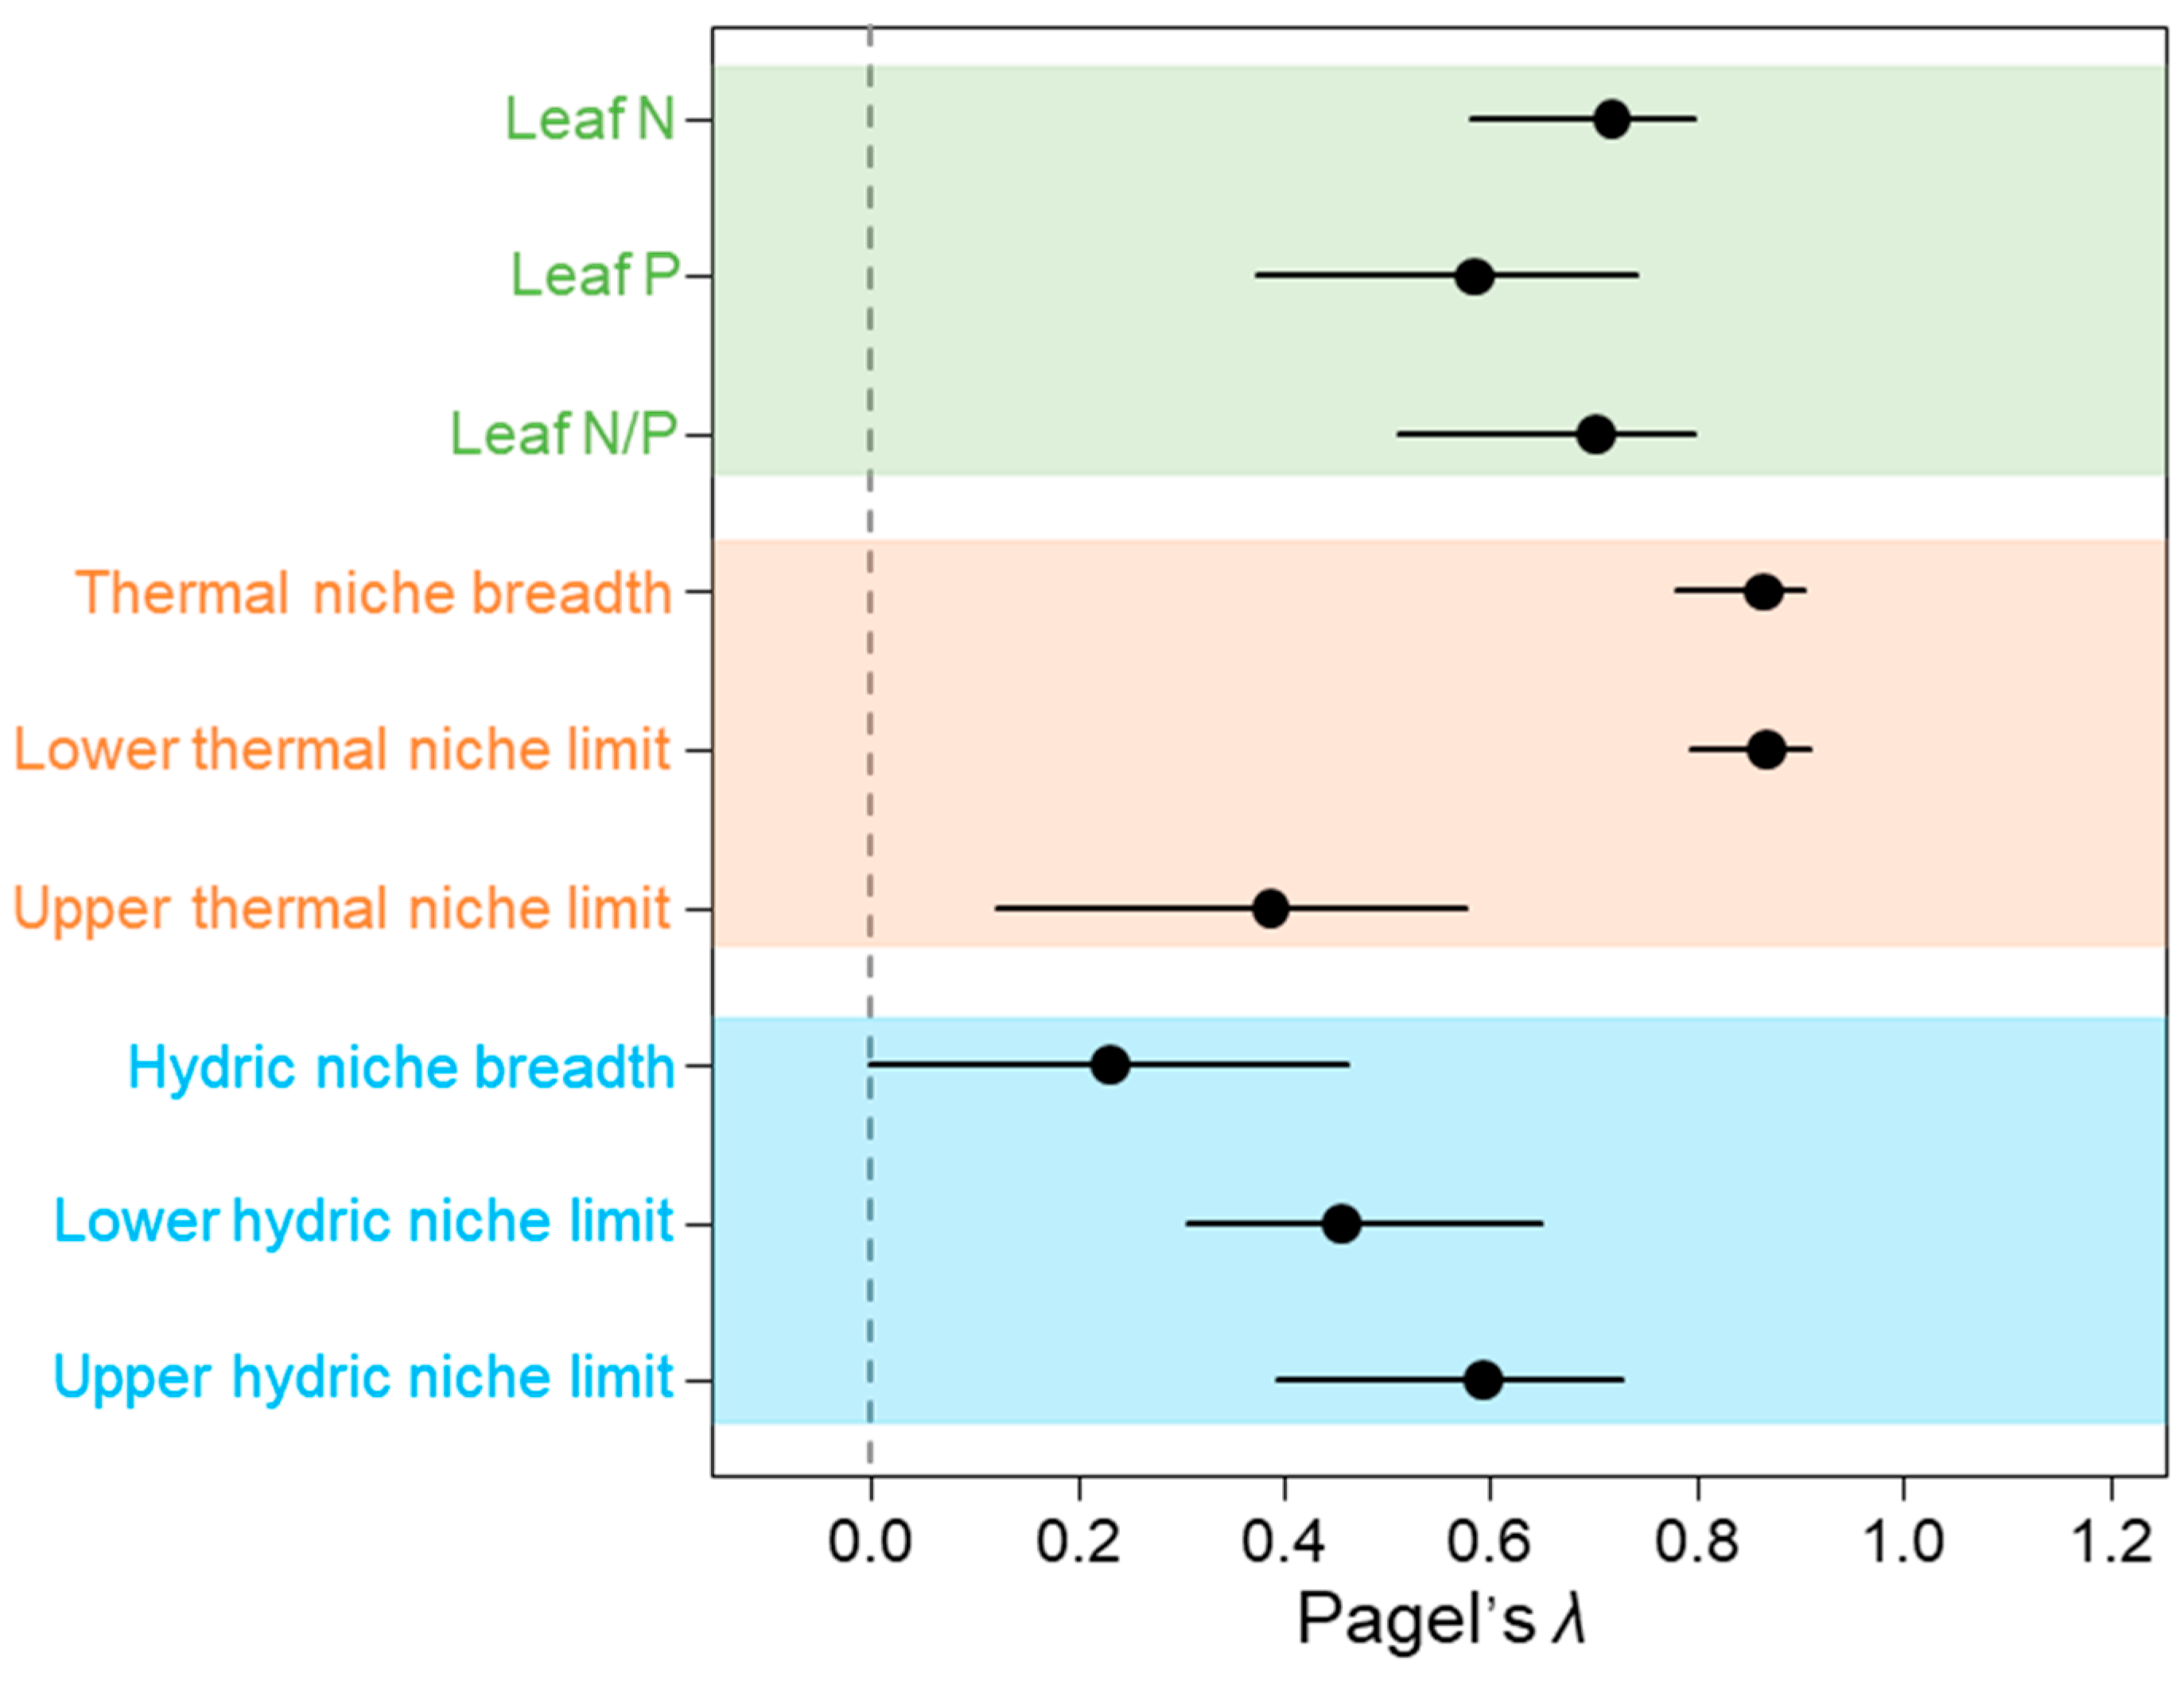
Leaf N (Pagel’s λ = 0.720; 95% CI: 0.583–0.797), leaf P (0.589; 0.374–0.743), leaf N/P (0.705; 0.512–0.796), thermal niche breadth (0.867; 0.781–0.904), lower thermal niche limit (0.869; 0.795–0.909), upper thermal niche limit (0.391; 0.125–0.577), hydric niche breadth (0.235; 7.333 × 10⁻⁵–0.577), lower hydric niche limit (0.457; 0.310–0.649), and upper hydric niche limit (0.596; 0.396–0.728) all exhibited significant phylogenetic signals, but the strengths of these signals differed considerably (Figure 1). For example, the phylogenetic signal for thermal niche breadth was significantly stronger than that for hydric niche breadth. Furthermore, the phylogenetic signal for the lower thermal niche limit was significantly stronger than that for the upper thermal niche limit, hydric niche breadth, and both the lower and upper hydric niche limits. This pattern directly answers our first research question by demonstrating a fundamental divergence in evolutionary history between thermal and hydric niches: thermal niche dimensions, especially those related to cold tolerance (lower limit) and overall thermal range (breadth), show stronger phylogenetic conservatism.
Figure 1.
Phylogenetic signals (Pagel’s λ) for leaf N, leaf P, leaf N/P ratio, thermal niche breadth, lower thermal niche limit, upper thermal niche limit, hydric niche breadth, lower hydric niche limit, and upper hydric niche limit. Points and error bars represent the estimated Pagel’s λ and its 95% confidence intervals. A Pagel’s λ is considered statistically significant if its 95% confidence interval does not include zero (equivalent to p < 0.05). Crucially, the significantly stronger phylogenetic signals observed for thermal niche parameters (especially thermal niche breadth and lower thermal limit) compared to their hydric counterparts suggest that evolutionary constraints play a more dominant role in shaping plant adaptation to temperature, particularly cold tolerance, than to moisture regimes.
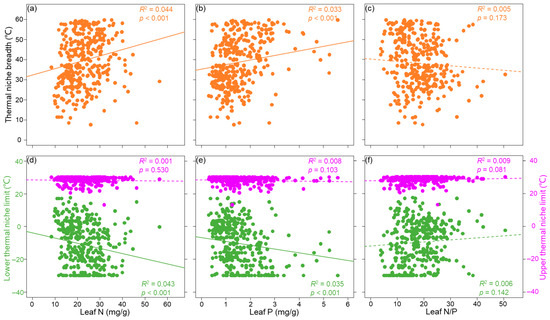
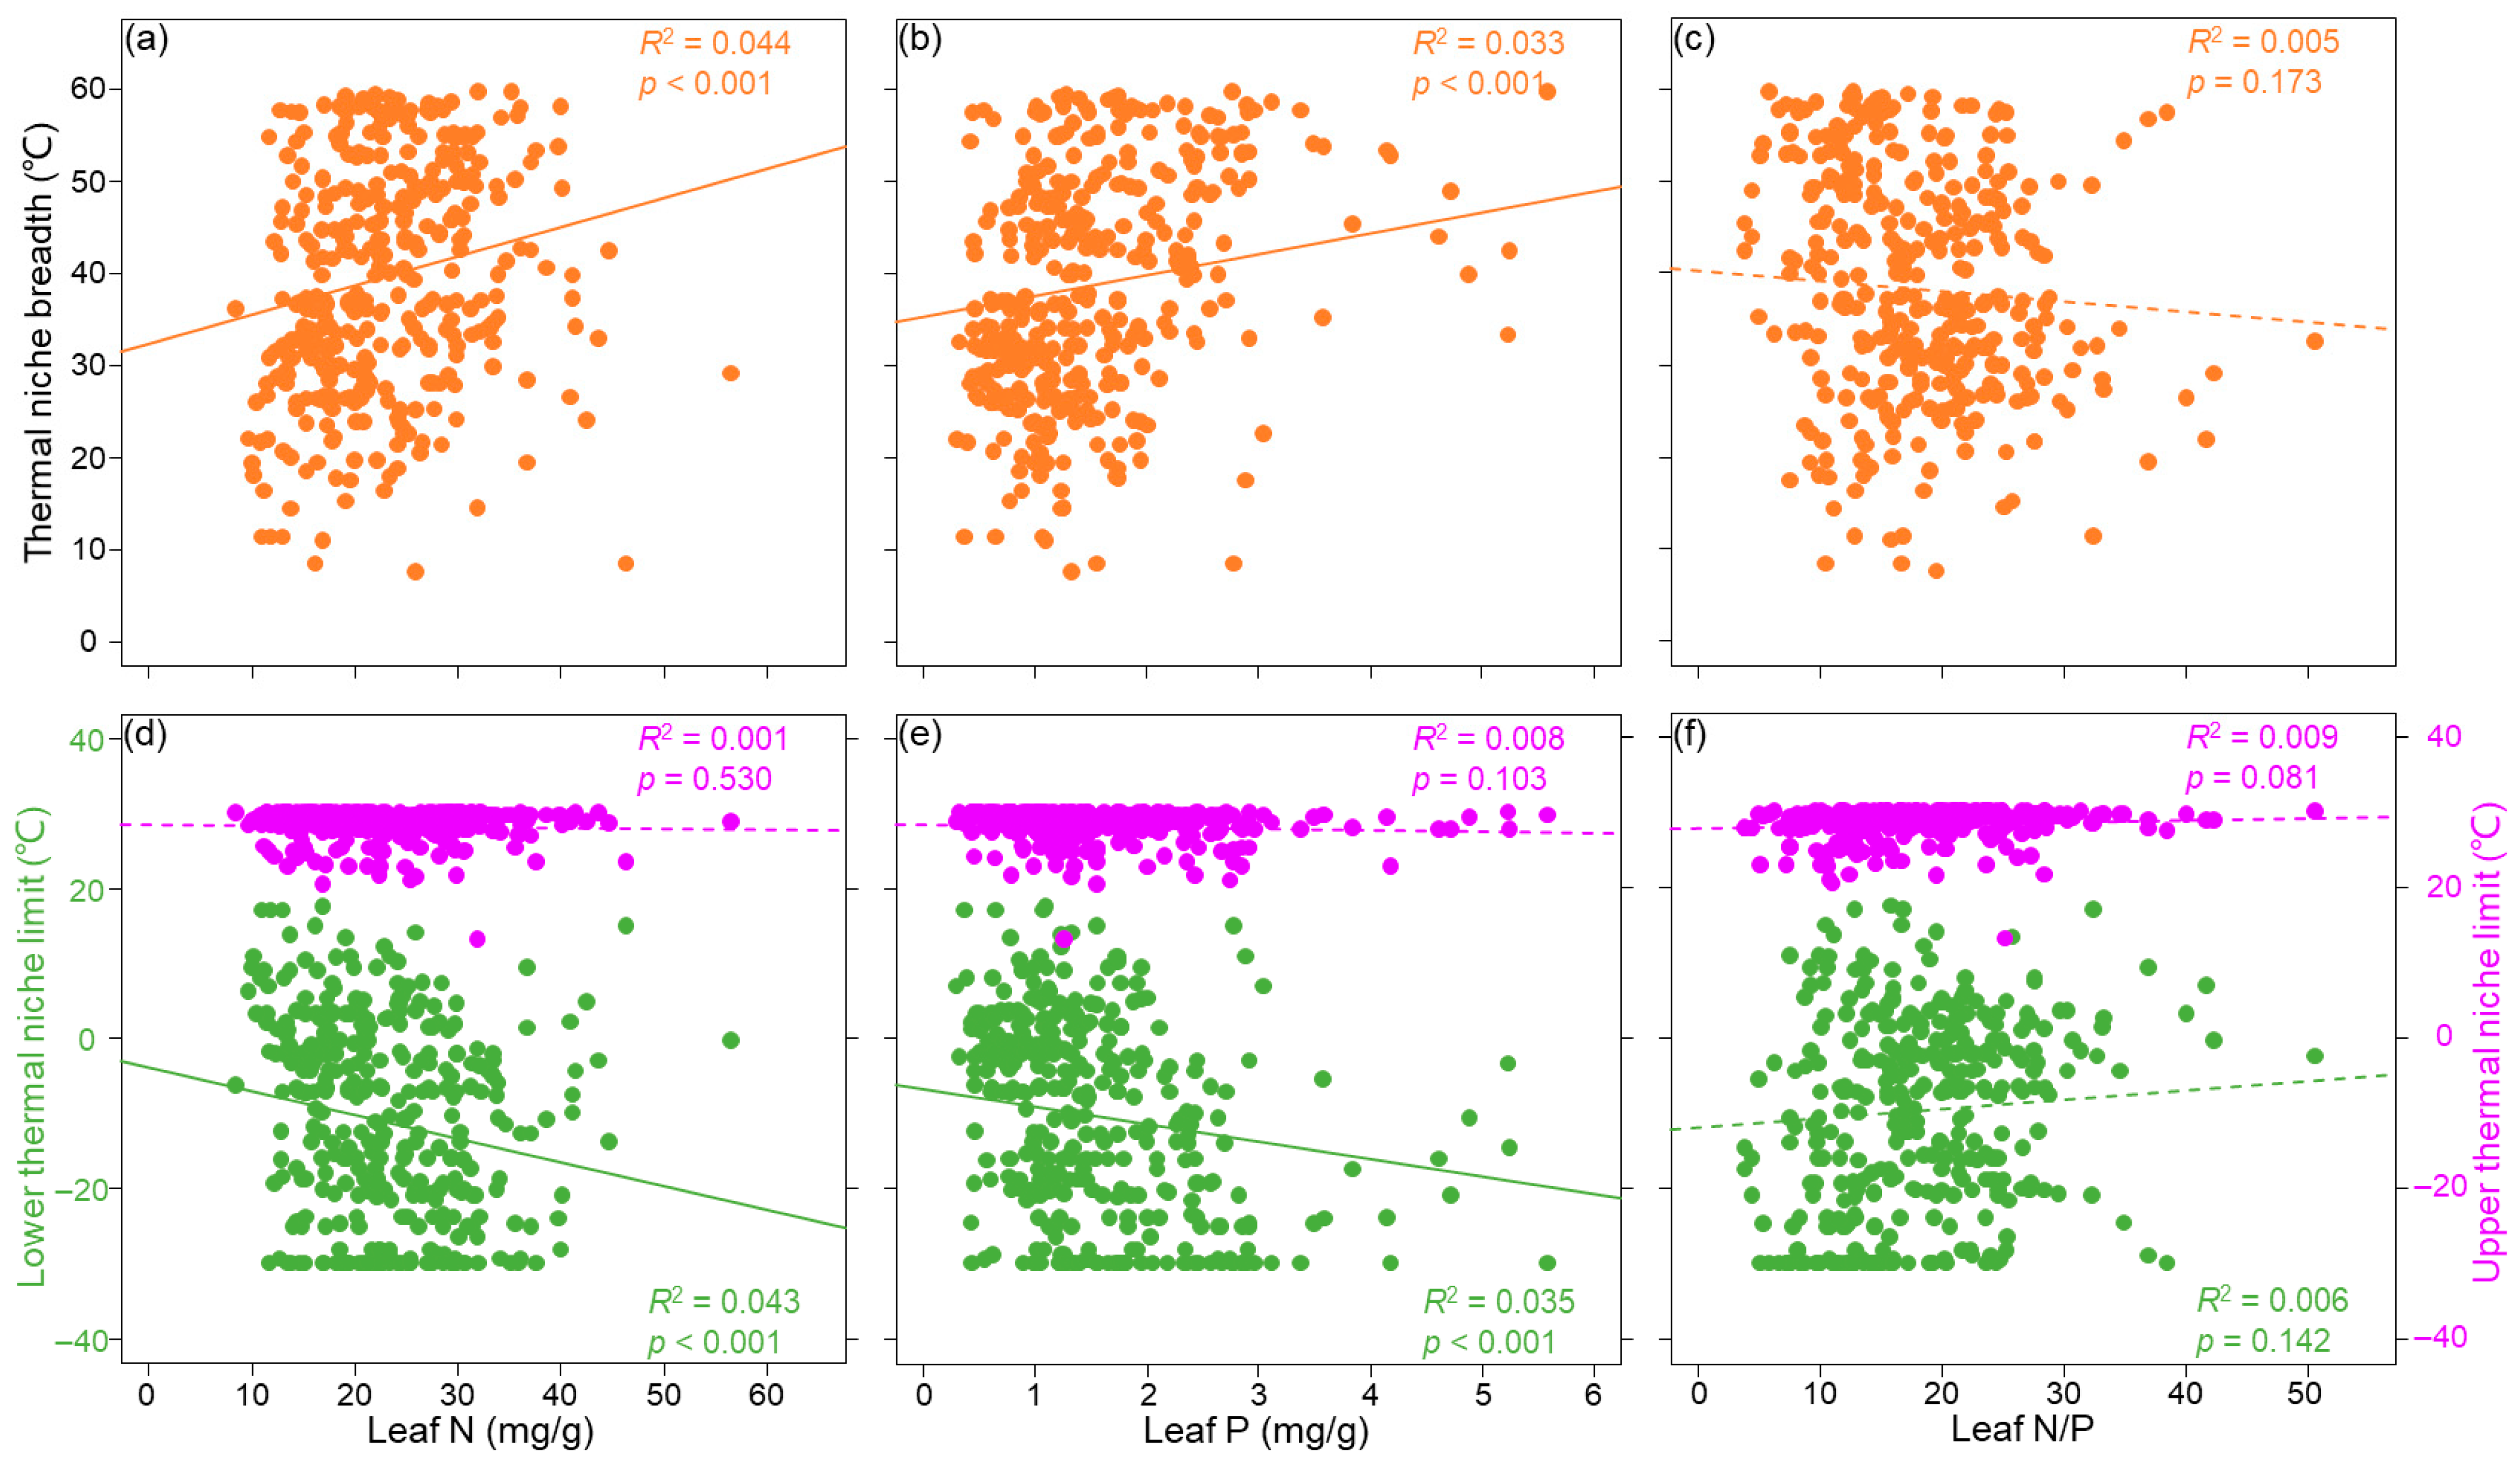
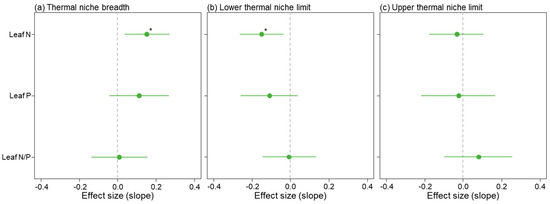
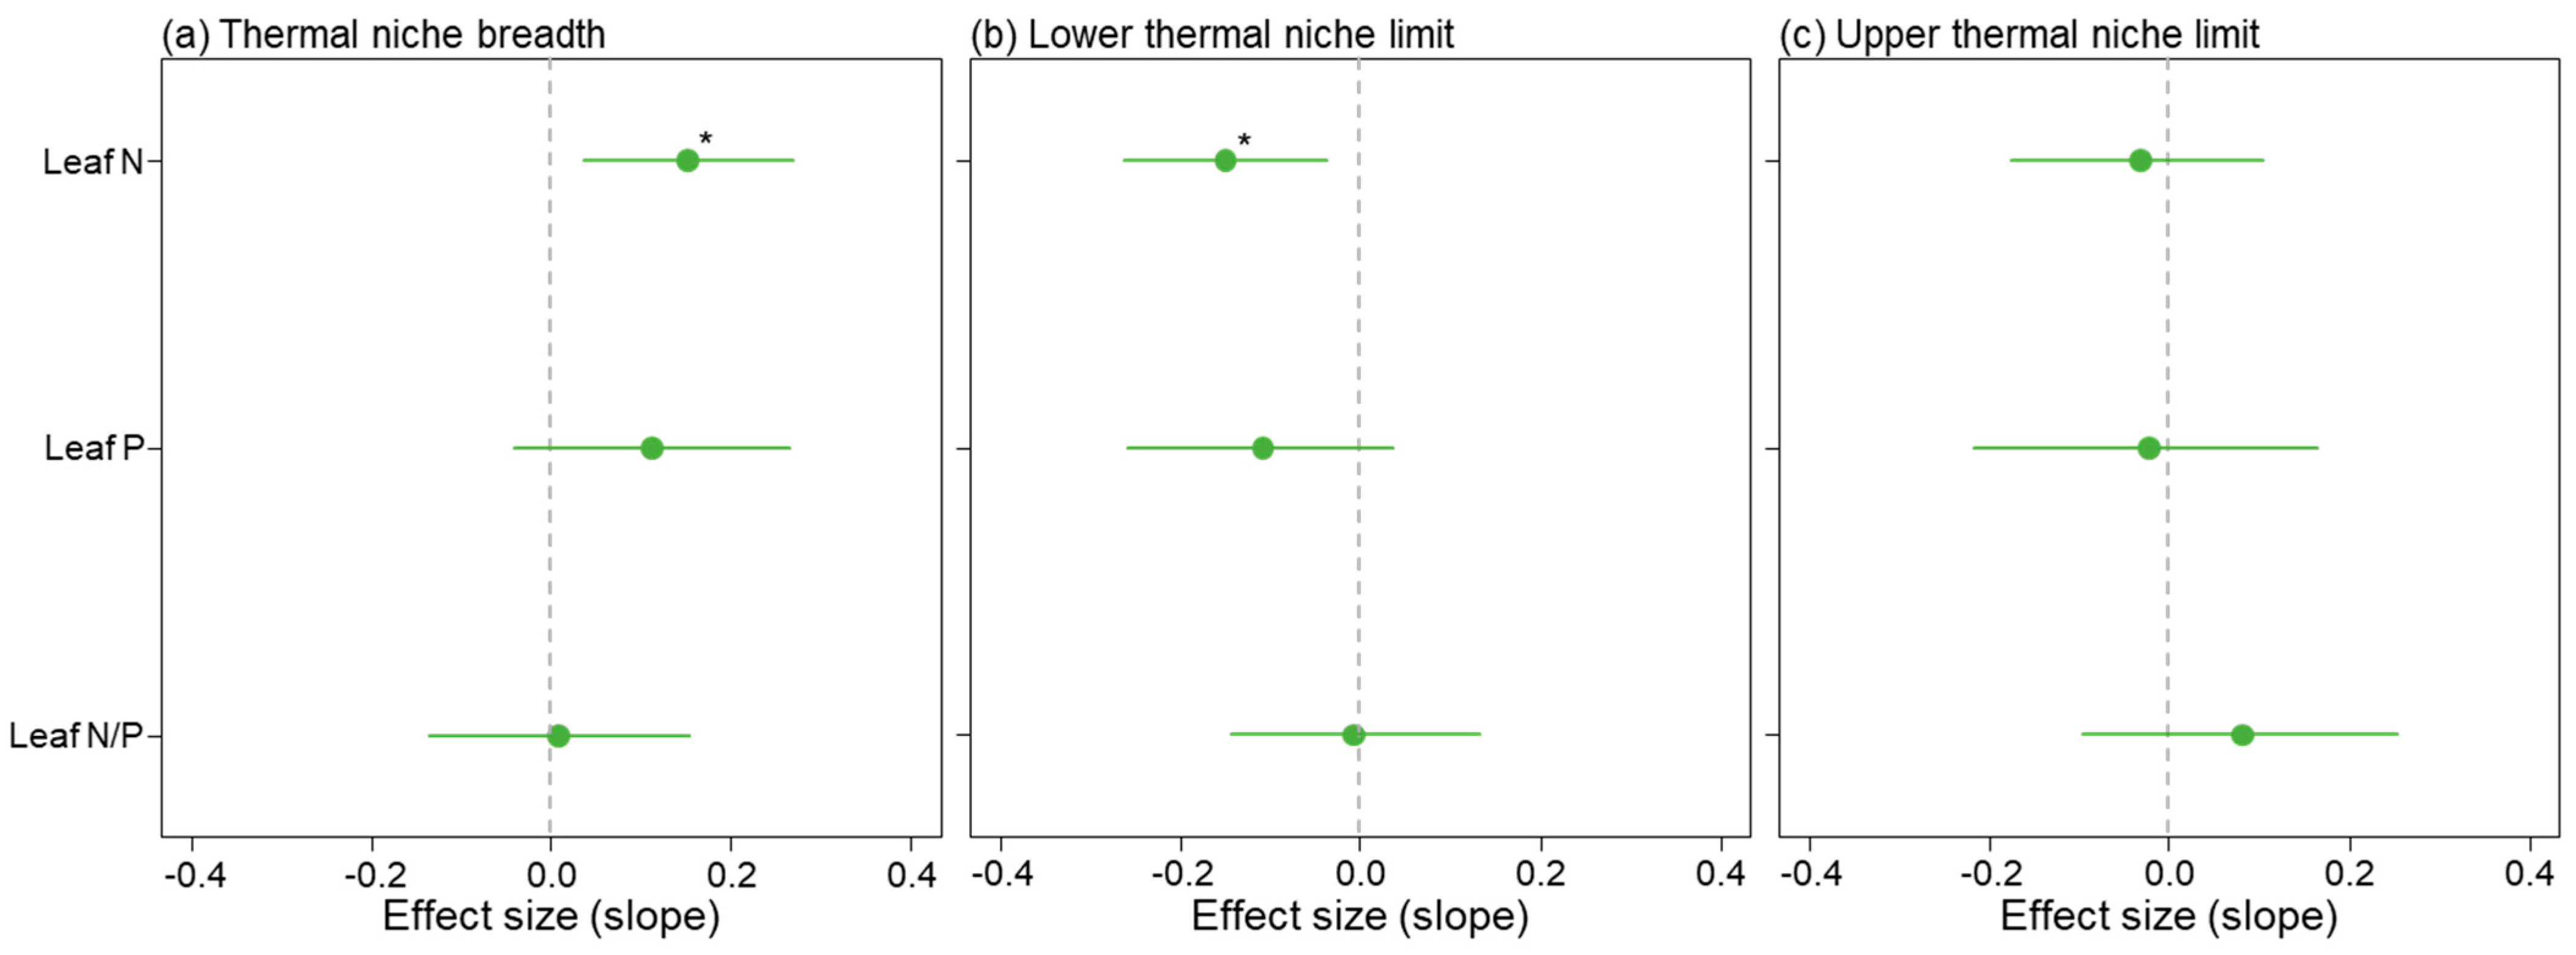
Based on PGLMs, the results indicated that leaf N (R2 = 0.044, p < 0.001) and leaf P (R2 = 0.033, p < 0.001) were positively associated with thermal niche breadth, whereas leaf N/P showed no significant association (Figure 2a–c). In the multiple PGLM that simultaneously included leaf N, P, and N/P, only leaf N had a significant effect (Figure 3a). Similarly, leaf N (R2 = 0.043, p < 0.001) and leaf P (R2 = 0.035, p < 0.001) were negatively associated with the lower thermal niche limit, while leaf N/P was not significantly related (Figure 2d–f). In the multiple PGLM, only leaf N showed a significant effect on the lower thermal niche limit (Figure 3b). This result clarifies that the observed bivariate relationships are primarily driven by leaf N, emphasizing its central role in nutrient-related adaptations to temperature after accounting for correlations among traits. In contrast, neither leaf N, P, nor leaf N/P showed any association with the upper thermal niche limit, whether examined individually or together in the PGLMs (Figure 2d–f and Figure 3c). This clear dissociation suggests that the mechanisms governing plant survival at high temperatures are largely independent of the leaf nutrient concentrations examined here.
Figure 2.
Relationships of thermal niche breadth (orange points), lower thermal niche limit (green points), and upper thermal niche limit (purple points) with leaf N (a,d), leaf P (b,e), and leaf N/P (c,f). These relationships were assessed using bivariate phylogenetic generalized linear models. Solid lines indicate a significant relationship (p < 0.05). The figure reveals that higher leaf N and P are associated with broader thermal ranges and greater cold tolerance (lower limit), but have no discernible link to heat tolerance (upper limit). This underscores a specific role for nutrient-mediated metabolism in defining the cold boundary of plant distributions.
Figure 3.
Effect sizes of three leaf traits (leaf N, leaf P, and leaf N/P ratio) on thermal niche breadth (a), lower thermal niche limit (b), and upper thermal niche limit (c). Effect sizes represent the slopes from multiple phylogenetic generalized linear models analyzing the relationships between the three leaf traits and thermal niche parameters. Prior to analysis, all variables were standardized using Z-score transformation to ensure comparability of parameter estimates. Points and error bars denote the estimated effect sizes and their 95% confidence intervals. Effect sizes are considered significant if their 95% confidence intervals do not include zero (equivalent to p < 0.05). When evaluated simultaneously, leaf N emerges as the dominant and sole significant predictor for both thermal niche breadth and the lower thermal limit, highlighting its paramount importance over leaf P or N/P in shaping the thermal dimensions of plant niches. *, p < 0.05.
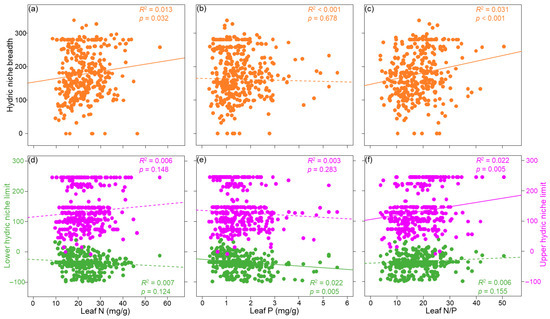
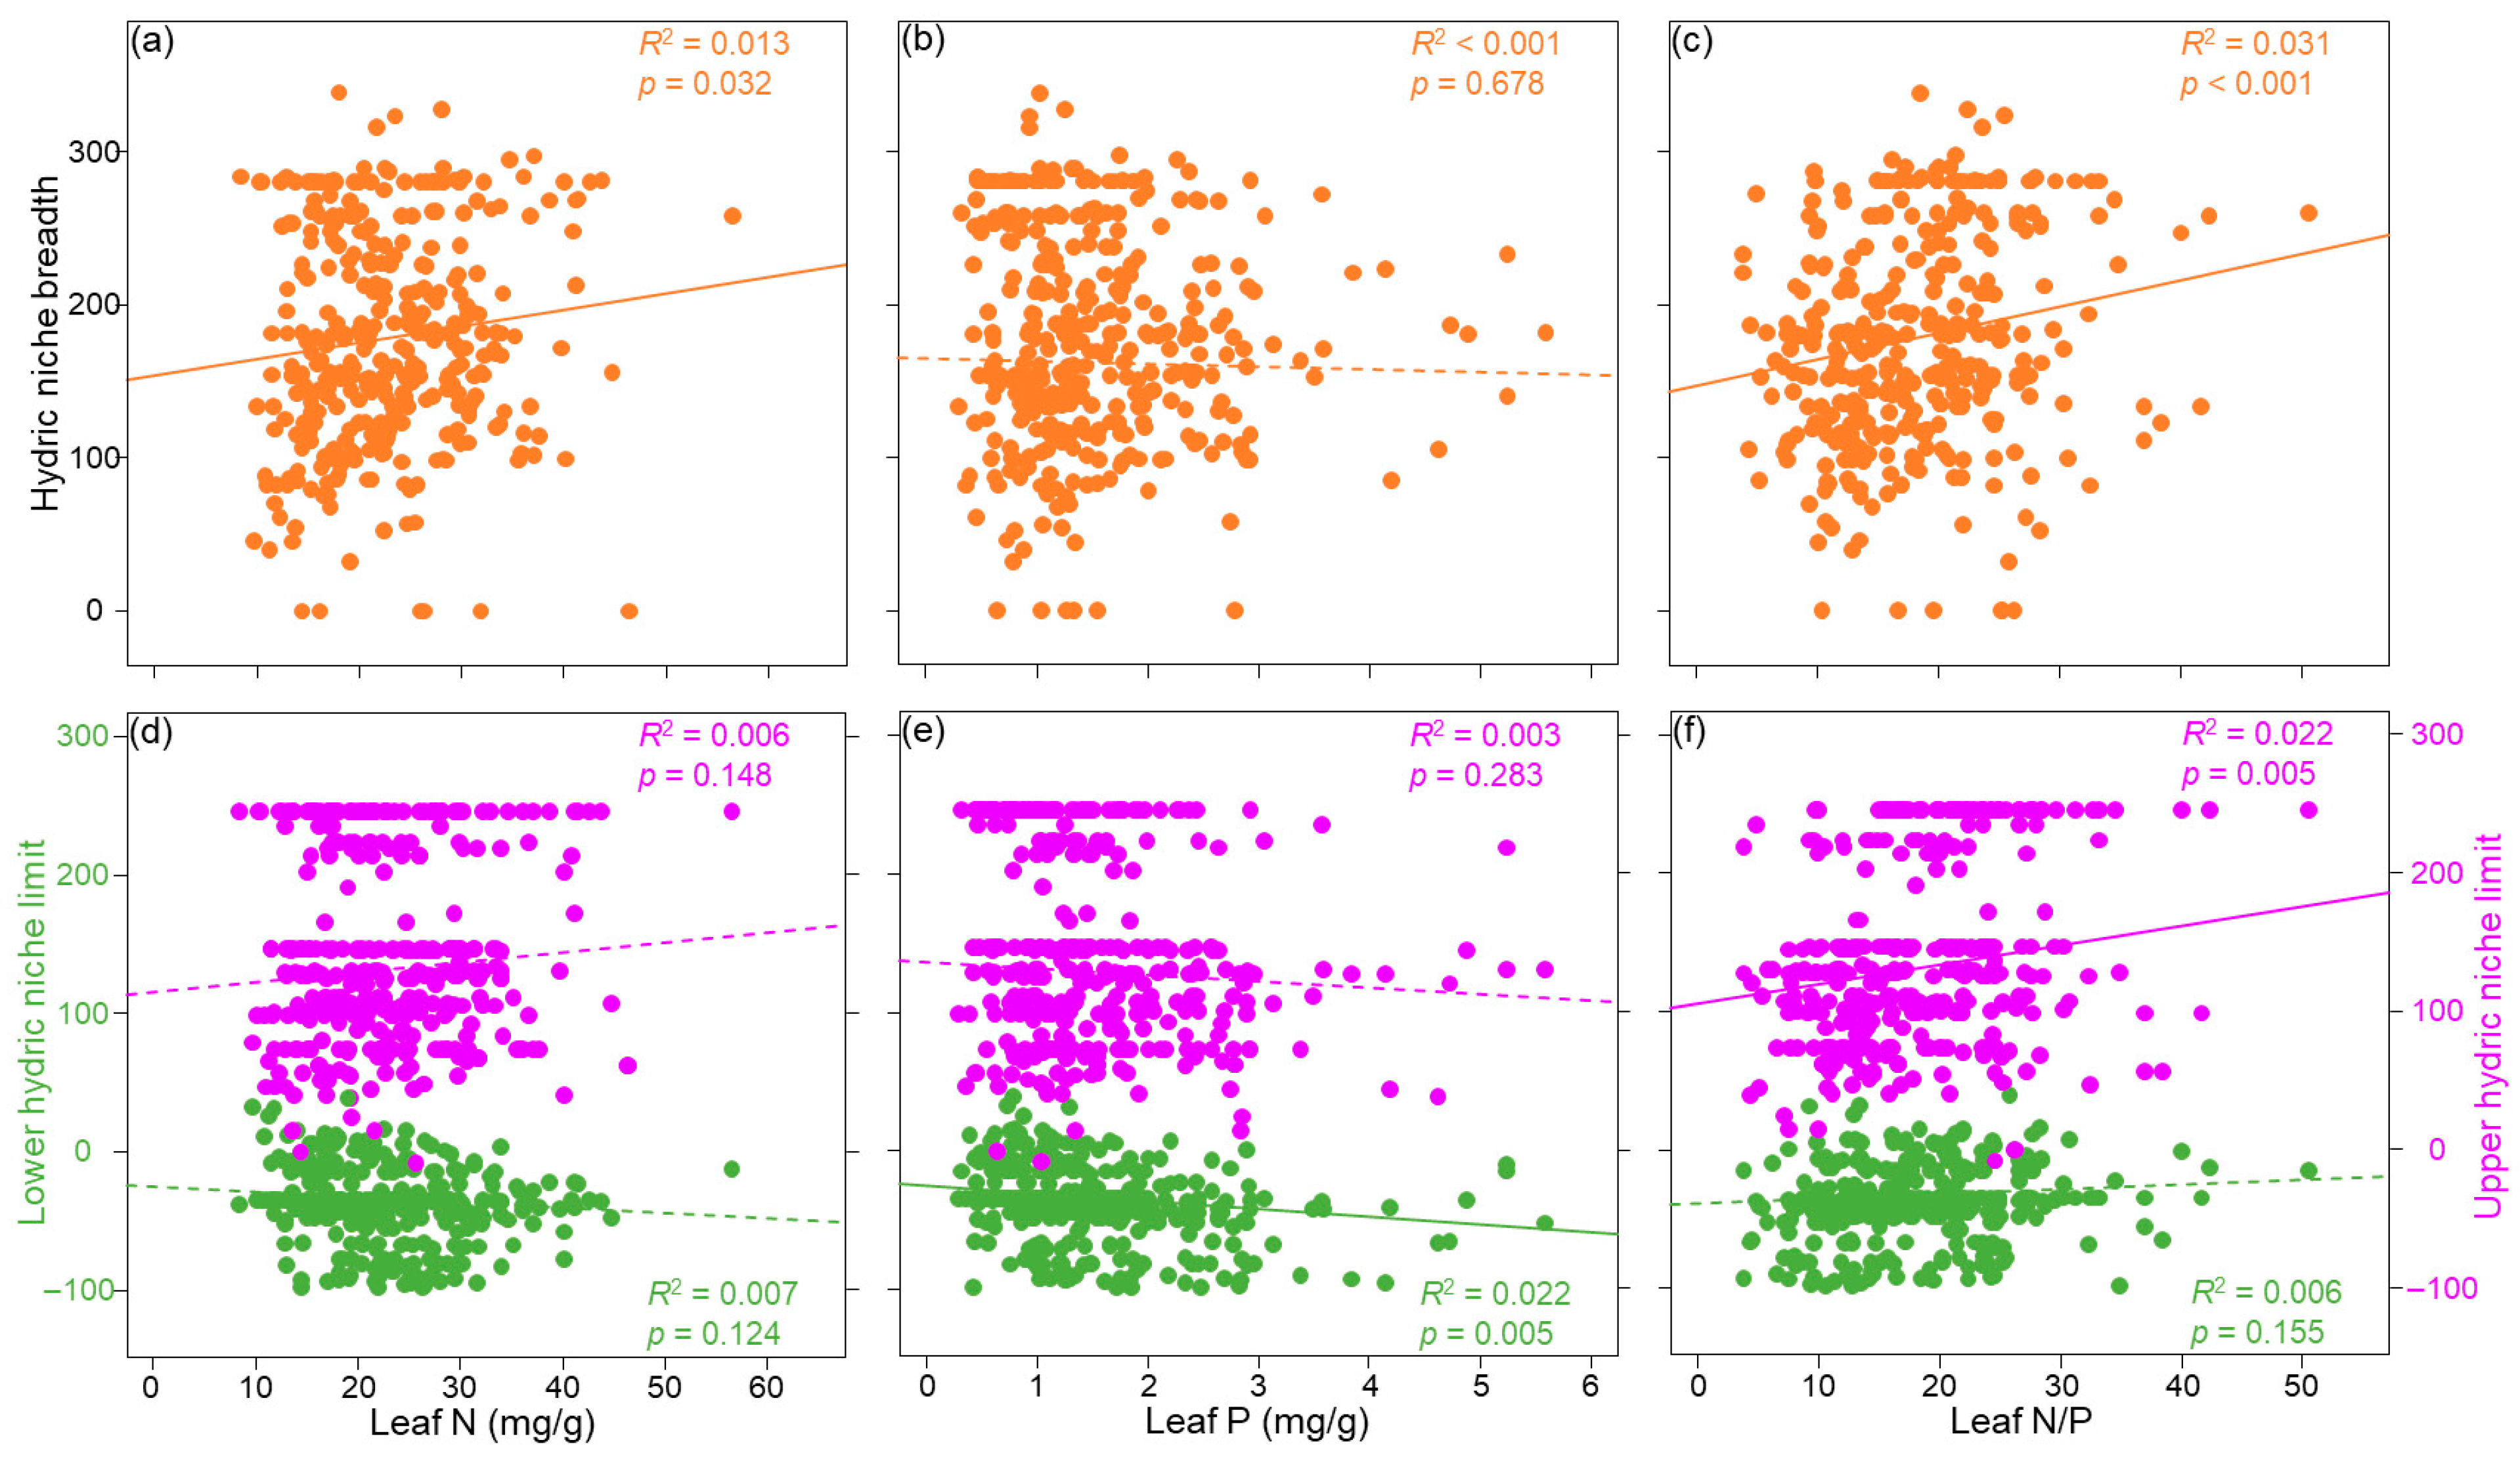
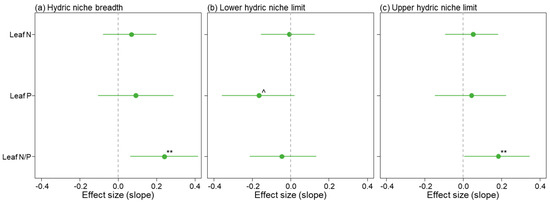
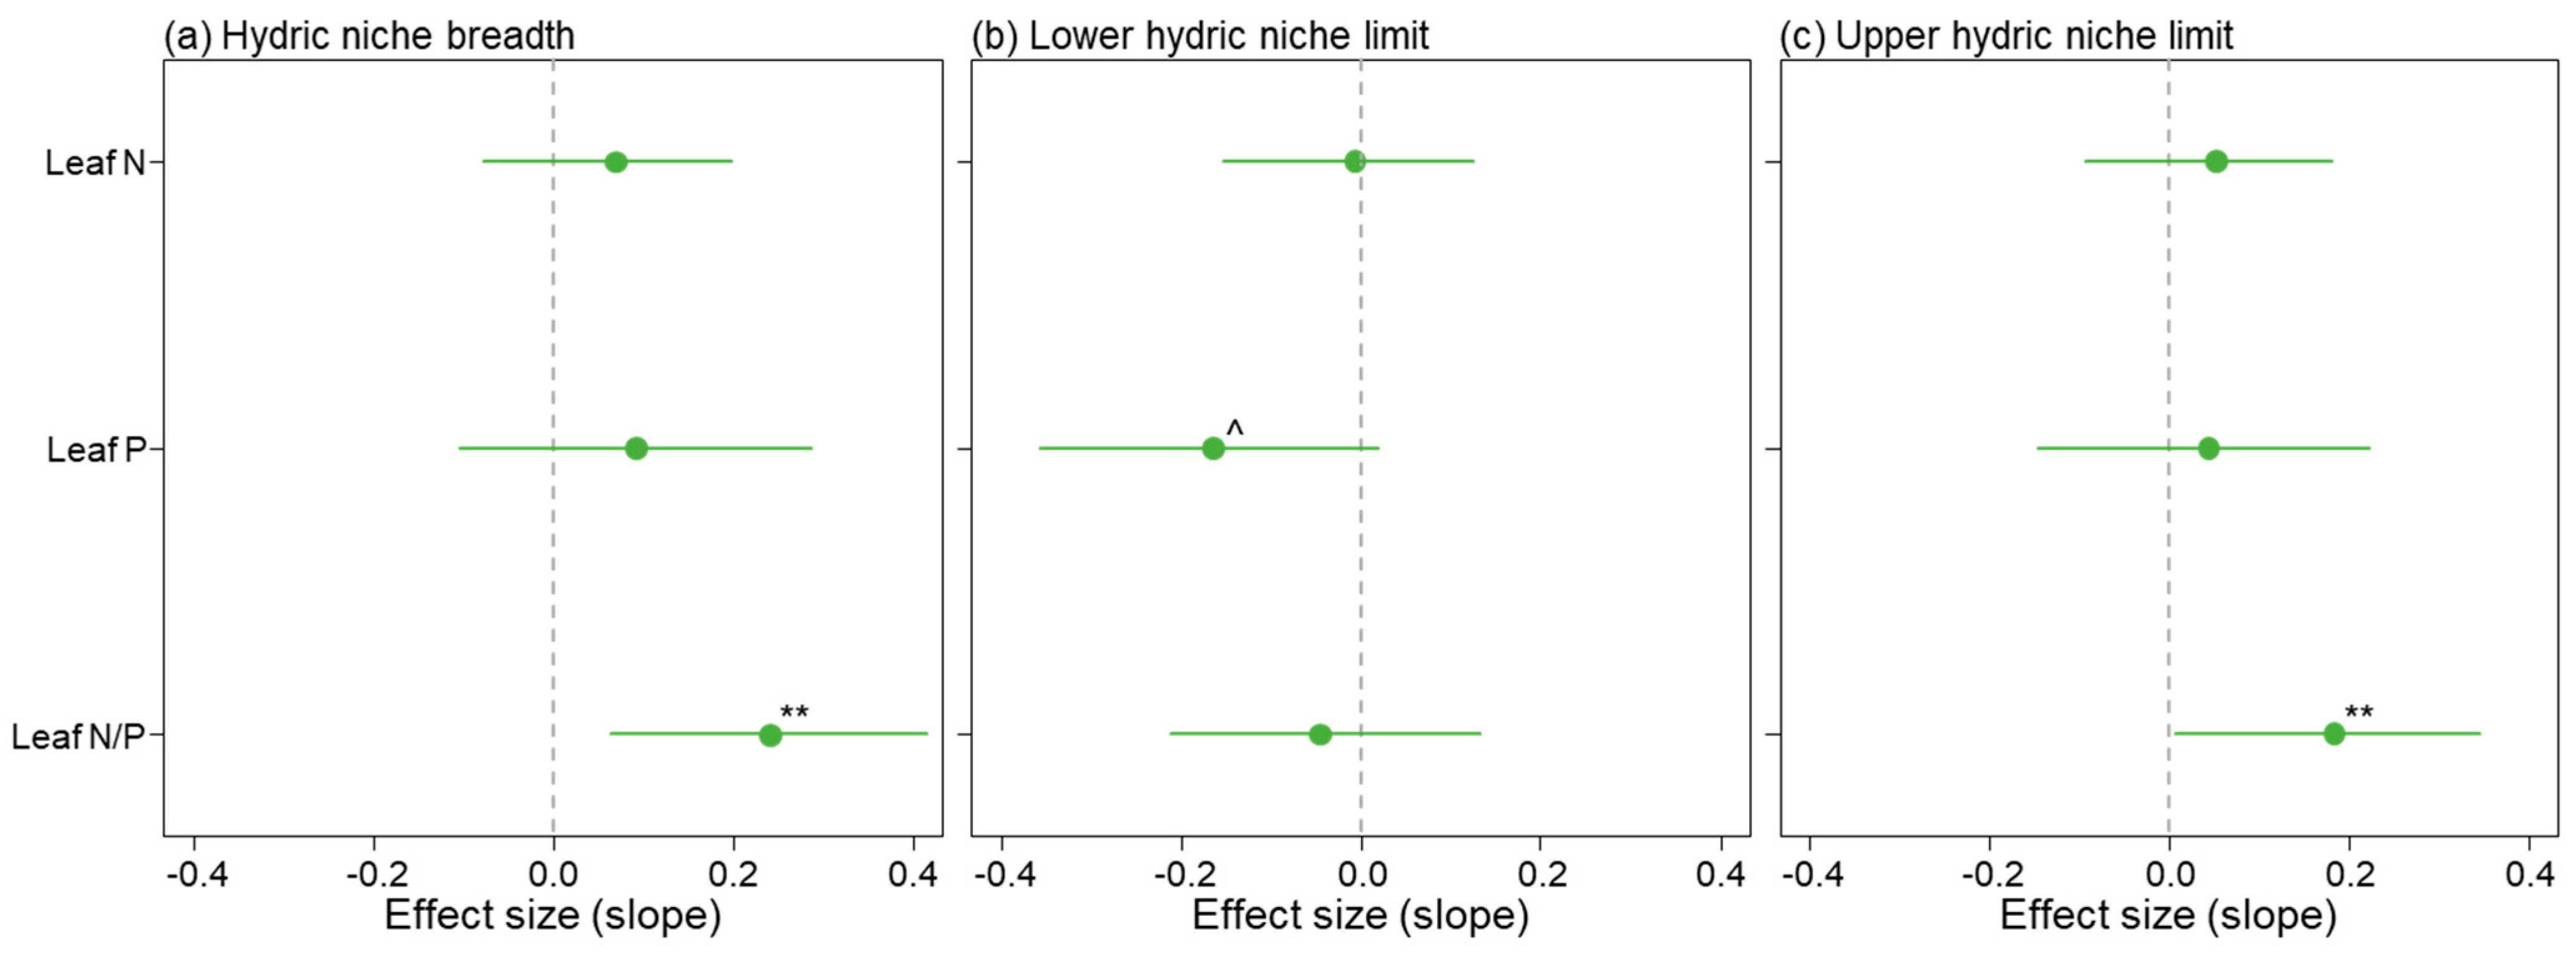
Based on PGLMs, the results indicated that leaf N (R2 = 0.013, p = 0.032) and the leaf N/P (R2 = 0.031, p < 0.001) were positively associated with hydric niche breadth, whereas leaf P showed no association (Figure 4a–c). In the multiple PGLM, only leaf N/P had a significant effect (Figure 5a). Across all models (bivariate or multiple), only leaf P showed a significant or marginally significant negative correlation with the lower hydric niche limit (Figure 4d–f and Figure 5b). Similarly, across all models, only leaf N/P showed a significant positive correlation with the upper hydric niche limit (Figure 4d–f and Figure 5c). The consistency between bivariate and multivariate analyses for the hydric niche confirms the robustness of these specific trait-niche associations. Together, these results demonstrate a clear functional differentiation: leaf N/P influences the capacity to occupy the wet-end of the realized hydric niche, whereas leaf P concentration is a stronger predictor of the species’ distribution limit under dry conditions.
Figure 4.
Relationships of hydric niche breadth (orange points), lower hydric niche limit (green points), and upper hydric niche limit (purple points) with leaf N (a,d), leaf P (b,e), and leaf N/P (c,f). These relationships were assessed using bivariate phylogenetic generalized linear models. Solid lines indicate a significant relationship (p < 0.05). The patterns reveal a complex, dimension-specific regulation of the hydric niche: leaf N/P is positively linked to niche breadth and the upper (wetter) limit, while leaf P is negatively associated with the lower (drier) limit. This illustrates that different aspects of plant water adaptation are governed by distinct nutrient traits.
Figure 5.
Effect sizes of three leaf traits (leaf N, leaf P, and leaf N/P) on hydric niche breadth (a), lower hydric niche limit (b), and upper hydric niche limit (c). Effect sizes represent the slopes from multiple phylogenetic generalized linear models analyzing the relationships between the three leaf traits and hydric niche parameters. Prior to analysis, leaf N, leaf P, leaf N/P, hydric niche breadth, lower hydric niche limit, and upper hydric niche limit were standardized using Z-score transformation to ensure comparability of parameter estimates. Points and error bars denote the estimated effect sizes and their 95% confidence intervals. Effect sizes are considered significant if their 95% confidence intervals do not include zero (equivalent to p < 0.05). The analysis confirms leaf N/P as the key driver of hydric niche breadth and the upper limit, and leaf P as the primary factor associated with the lower limit. This reinforces the conclusion that internal nutrient balance (N/P) is crucial for exploiting diverse water availability, while absolute P concentration is a key determinant of drought resistance. **, p < 0.01; ^, p < 0.1.
To quantify the actual effect size of leaf traits on niche boundaries, we calculated unstandardized regression coefficients based on bivariate phylogenetic regression models (Table 1). The results show that physiologically and ecologically plausible variations in leaf traits can lead to substantial and biologically meaningful shifts in niche boundaries. For example, a 10 mg/g increase in leaf N predicts an average expansion of thermal niche breadth by approximately 3.2 °C, with a corresponding increase in its lower tolerance limit (coldest month temperature) of about 3.2 °C. A 1 mg/g increase in leaf P predicts a broadening of thermal niche breadth by around 2.3 °C, accompanied by an increase in its lower tolerance limit of about 2.3 °C. Regarding the hydric niche, a 10-unit increase in leaf N/P ratio predicts an expansion of hydric niche breadth by approximately 17.4 units on the moisture index scale, along with an increase in its upper tolerance limit of about 14.0 units. Conversely, a 1 mg/g increase in leaf P predicts a decrease in the drought tolerance limit (the lower hydric niche boundary) by approximately 5.6 units.
For comparison, we also performed analyses using conventional LMs that do not account for phylogenetic non-independence (see Supplementary Tables S1–S4 for full results). The overall patterns revealed by LMs were largely congruent with those from PGLMs, affirming the general robustness of the observed relationships between leaf nutrients and niche dimensions. However, several critical contrasts emerged, highlighting the necessity of phylogenetic control: (1) For the thermal niche, when all three leaf traits were included simultaneously in a single LM (Table S1), leaf P was identified as the significant predictor for both thermal niche breadth and the lower thermal limit. This contrasts with the PGLM results (Figure 3a,b), where leaf N was the sole significant driver. (2) Across nearly all examined bivariate and multivariate relationships (Tables S2 and S4 vs. Figure 2 and Figure 4; Tables S1 and S3 vs. Figure 3 and Figure 5), both the statistical significance (p values) and the explanatory power (R2 values) were lower in the PGLMs than in the corresponding LMs. Despite the differences in significance and effect attribution, the qualitative, dimension-specific patterns remained consistent. For example, LMs also showed that leaf N/P was a significant predictor of hydric niche breadth and its upper limit, and leaf P was associated with the lower hydric limit (Table S4), mirroring the PGLM findings. This reinforces the core conclusion that the influences of leaf nutrients on hydrothermal niches are asymmetric and specific to different niche axes.
4. Discussion
This study, by integrating leaf chemical traits, hydrothermal niche data, and phylogenetic information for woody plants in eastern China, reveals three key findings: First, all hydrothermal niche parameters exhibited significant yet varying strengths of phylogenetic signal. Second, the influences of leaf nitrogen (N) and phosphorus (P) on thermal and hydric niches were asymmetric and dimension-specific. Third, phylogenetic history constitutes a critical contextual factor that cannot be overlooked when interpreting trait-niche relationships. These findings provide new insights into understanding the relationship between plant functional traits and niche evolution. It should be noted that the thermal and hydric niche boundaries estimated in this study are based on species distribution data, reflecting the realized niche shaped by the combined effects of existing biotic interactions, dispersal limitations, and evolutionary history—rather than their broader physiological tolerance limits (i.e., the fundamental niche) [42,43]. Therefore, our results reveal patterns of association between leaf functional traits and the actual distribution limits exhibited by species under current ecological contexts, which hold direct implications for understanding real-world distribution patterns and species’ vulnerability to climate change [44].
4.1. Phylogenetic Signal Variation Reveals Divergent Evolutionary Trajectories of Niche Dimensions
Our results reveal a complex pattern of phylogenetic structure in hydrothermal niches. All examined traits and niche parameters exhibited significant phylogenetic signals, yet the strength of these signals varied importantly across dimensions (supporting H1). Specifically, the phylogenetic signal for thermal niche breadth was significantly stronger than that for hydric niche breadth, and the signal for the lower thermal niche limit was also stronger than that for its upper limit. This pattern aligns with niche conservatism theory, suggesting that plant tolerance to temperature (particularly cold) may be constrained by more conserved physiological and biochemical mechanisms (e.g., membrane lipid composition, enzyme function). These mechanisms are relatively stable over evolutionary history, leading to greater similarity in cold tolerance among closely related species [2,3,28]. In contrast, hydric niches, particularly their breadth, showed weaker phylogenetic signals. This implies that plants may adapt to water stress through more plastic morphological (e.g., root architecture) and physiological traits (e.g., stomatal regulation), which are more prone to convergent evolution or rapid divergence under natural selection [45,46]. This divergence in phylogenetic signal strength suggests that hydric niches possess greater evolutionary lability than thermal niches, providing essential evolutionary context for understanding the more complex association patterns between hydric niches and leaf nutrient traits.
4.2. Asymmetric Roles of Leaf N and P in Shaping Thermal and Hydric Niches
The results of this study reveal a clear pattern of dimension-specificity and mechanistic asymmetry in the influence of leaf N, P, and their stoichiometric ratio (N/P) on plant hydrothermal niches (supporting H4). In the thermal niche dimension, as hypothesized by H2, PGLMs indicated that both leaf N and leaf P were positively correlated with thermal niche breadth and negatively correlated with the lower thermal niche limit. This pattern supports predictions from resource allocation trade-off hypotheses and metabolic ecology theory. Higher leaf N and P concentrations typically reflect greater enzyme concentrations and metabolic rates, which may help plants maintain basic physiological functions under low-temperature conditions, thereby expanding their thermal adaptive range, and are correlated with occupation of colder environments [4,47]. However, not entirely consistent with the expectations of H2, after controlling for collinearity among traits (in the multivariate model), leaf N rather than leaf P emerged as the dominant factor driving changes in thermal niche breadth and its lower limit. This suggests that the role of nitrogen as a structural component of key cold-tolerance proteins (e.g., photosynthetic and protective enzymes) may be more directly limiting for thermal tolerance under low-temperature stress than the role of phosphorus in energy transduction processes (e.g., ATP metabolism). Additionally, no significant association was observed between leaf nutrient traits and the upper thermal niche limit, suggesting that plant tolerance to high temperatures may depend more on non-nutrient traits such as heat shock protein expression, leaf anatomical structure, or transpirational cooling efficiency [16,48,49], rather than directly on nutrient concentration.
In contrast, the drivers of the hydric niche appear more complex. Our results provide strong support for H3. As predicted, our PGLM results clearly indicated that hydric niche breadth is primarily governed by leaf N/P, which emerged as the sole significant predictor in the multiple model. This finding suggests that the expansion of the hydric niche depends on a plant’s internal nutrient balance rather than on the absolute concentration of either N or P alone. According to ecological stoichiometry theory, leaf N/P is a key indicator for determining the type of nutrient limitation a plant experiences [17]. Higher N/P ratios (often indicative of phosphorus limitation) may prompt plants to adopt a range of adaptive strategies as supported by prior mechanistic studies [18,19,50], such as developing deeper root systems to access scarce phosphorus and deep soil water, or forming aerenchyma under flooded conditions to cope with hypoxia and low phosphorus stress. While these specific structural traits (e.g., root depth, aerenchyma) were not directly measured in our study, the strategies are well-supported in the literature and collectively provide a mechanistic explanation for how plants can occupy a broader moisture gradient, particularly expanding toward wetter environments [18,19,50]. However, leaf P concentration (rather than N/P) showed a consistent negative correlation with the lower hydric niche limit (the dry end). While this finding was not explicitly predicted in H3, its underlying mechanism is plausible: lower leaf P may limit the energy (ATP) and structural components (membrane phospholipids) required for plants to construct efficient water-absorption systems (e.g., fine roots and mycorrhizal symbioses) under drought conditions, thereby constraining their drought resistance [19]. This indicates that the drivers influencing the dry and wet ends of the hydric niche are distinct.
In summary, the findings of this study comprehensively validate H4. First, we observed clear asymmetries: the thermal niche is primarily driven by leaf N, whereas the hydric niche is mainly governed by the leaf N/P ratio and P. Second, these influences exhibit pronounced dimension-specificity: the same trait affects niche breadth, lower limits, and upper limits in distinct patterns. For example, N/P influences hydric breadth and its upper limit but not its lower limit, while P affects the hydric lower limit and thermal parameters but not hydric breadth. The fundamental differences in the driving mechanisms between thermal and hydric niches indicate that plants employ distinct trait combinations to adapt to different environmental pressures. Consequently, decomposing the niche into its constituent dimensions and analyzing them independently is crucial for a comprehensive understanding of plant adaptation strategies.
The asymmetric and dimension-specific effects of leaf N, P, and their stoichiometry on thermal and hydric niches, as revealed in this study, provide an important complement and contextual case for the classical “plant economics spectrum” theory [5,6]. This theory describes a continuum ranging from “fast-investment–return” strategies (characterized by high nitrogen, thin leaves, and rapid growth) to “slow resource-conservation” strategies [6,7]. Our findings suggest that this overarching strategy spectrum may map differently onto distinct dimensions of environmental adaptation. For example, higher leaf nitrogen concentration—often associated with a “fast” strategy—is primarily linked to a broader thermal tolerance range, supporting an adaptive pathway that relies on high metabolic investment to cope with temperature challenges, especially cold stress. In contrast, for water-related adaptation, the key driver is not the absolute concentration of nitrogen or phosphorus alone but their internal balance (the N/P ratio), which reflects divergent survival strategies under different nutrient limitations [17]. This implies that the “economics spectrum” may not manifest as a single, simple set of trait combinations across all environmental pressures. Instead, plants may employ decoupled trait combinations to separately optimize their adaptation to different environmental factors (e.g., temperature vs. moisture).
These findings underscore the importance of leaf nutrient traits in shaping plant niches. However, it must be recognized that the influence of these traits is embedded within broader adaptive strategies. For example, leaf thermotolerance may rely more heavily on leaf anatomical structures (such as palisade tissue thickness) and the expression of heat-shock proteins [48], whereas plant survival under drought conditions is closely linked to hydraulic traits like deep rooting systems and low xylem embolism risk [51]. Leaf N and P may indirectly interact with these traits—through their effects on resource allocation for constructing such structures or by modulating metabolic efficiency—thereby jointly determining the ultimate niche boundaries.
4.3. The Necessity of Controlling for Phylogenetic Relationships in Trait-Niche Studies
Our comparative analysis revealed nuanced differences between the results of ordinary linear models (LMs) and PGLMs. When explaining both thermal niche breadth and the lower thermal niche limit using models that included multiple leaf traits simultaneously, the LMs incorrectly attributed the effect to leaf P, whereas the PGLMs clearly identified leaf N as the dominant driver. More importantly, after controlling for phylogeny, the explanatory power (R2) and statistical significance of the models were generally reduced. This result provides strong evidence that ignoring phylogenetic non-independence leads to an overestimation of the direct shaping effect of functional traits on niches, as the observed phenotypic associations may partly stem from legacy effects of common ancestry [52,53]. Therefore, employing phylogenetic comparative methods is a crucial prerequisite for drawing reliable inferences in macroecology and evolutionary biology research.
4.4. Limitations and Future Directions
This study also has several limitations. First, the niche estimates in this study are derived from species distribution data, which capture the realized niche [43]. This reflects the actual ecological space occupied by species under contemporary biotic and abiotic constraints. While this approach effectively reveals large-scale trait-environment relationships and is essential for biogeographic predictions [44], the boundaries it defines may not fully represent the species’ fundamental physiological tolerance limits. For example, competitive exclusion may prevent species from occupying the entire environmental space that they are physiologically capable of tolerating [54]. Future studies incorporating controlled experiments, such as measuring leaf photosynthetic responses along temperature and moisture gradients, would substantially complement the findings presented here [12].
Second, the linear models examining the relationships between leaf N, P, N/P and niche parameters generally exhibited low coefficients of determination (R2) (see Supplementary Tables S2 and S4). This is common in macroecological studies of trait–environment relationships, because species niches are highly complex outcomes shaped by numerous biotic and abiotic factors [14,55]. The primary goal of this study was not to build a complete model with high predictive accuracy, but rather to test and isolate the independent and statistically significant contributions of two key chemical traits (leaf N and P) to specific dimensions of the niche. Although these traits explain only a portion of the total variation, the systematic patterns they reveal—namely, the marked asymmetry and dimension-specificity in how leaf nutrient traits influence thermal and hydric niches—hold significant ecological meaning. These results provide quantitative, trait-based insights for understanding the diversity of plant adaptation strategies and for developing mechanistic species distribution models. Future research that integrates a broader spectrum of functional traits (e.g., leaf morphology, root architecture, hydraulic traits) and environmental covariates is expected to yield more comprehensive models with greater explanatory power.
Third, this study focuses exclusively on leaf N, P, and their ratio. However, to achieve a more comprehensive and predictive understanding of niche-shaping mechanisms, future research should be conducted within a multidimensional trait-integration framework. The R2 values of our models indicate that a substantial portion of the variation remains explained by other factors. It is therefore crucial to incorporate morphological traits from the leaf economics spectrum (e.g., specific leaf area), hydraulic traits (e.g., xylem vulnerability curves), and below-ground traits (e.g., specific root length, mycorrhizal association types) into the analysis [14,56]. In addition, biotic interactions such as competitive exclusion may prevent species from occupying the full environmental space that they are physiologically capable of tolerating, resulting in a “realized niche” estimated from distribution data that is narrower than the “fundamental niche”—a point that must be considered when interpreting the results [54]. Finally, intraspecific variation and phenotypic plasticity represent key mechanisms through which plants respond to environmental heterogeneity, and they warrant further exploration in future modeling efforts [57].
5. Conclusions
This study systematically evaluated the influence of leaf N and P on the hydrothermal niches of 362 woody plant species in eastern China while clarifying the significant role of phylogenetic context in these relationships. Our key findings include the following:
- (1)
- Phylogenetic signal strength varied notably across niche dimensions. Thermal niche breadth exhibited a stronger phylogenetic signal (Pagel’s λ = 0.867) compared to hydric niche breadth (0.235). Similarly, the lower thermal limit (0.869) showed a stronger signal than the upper thermal limit (0.391) and both hydric niche limits (0.457 and 0.596), indicating greater evolutionary conservatism in cold tolerance.
- (2)
- Leaf N and P differentially predicted thermal and hydric niche dimensions. In phylogenetic models, leaf N (R2 = 0.044) and leaf P (R2 = 0.033) were positively associated with thermal niche breadth, and both were negatively correlated with the lower thermal limit (R2 = 0.043 and 0.035, respectively). Our quantitative models estimate that, for instance, a 10 mg/g increase in leaf N is associated with an expansion of thermal niche breadth by approximately 3.2 °C and an increase in cold tolerance (lower limit) by about 3.2 °C. In contrast, leaf N/P was the primary predictor for hydric niche breadth (R2 = 0.031), with an estimated increase of about 17.4 moisture index units for every 10-unit rise in leaf N/P, while leaf P consistently correlated with the lower hydric limit and leaf N/P with the upper hydric limit.
- (3)
- Model comparison underscored the necessity of phylogenetic control. When phylogeny was accounted for, explanatory power (R2) generally decreased, and in multiple-trait models, leaf N emerged as the dominant driver for thermal niche parameters—a pattern masked in conventional linear models.
In summary, this study confirmed that effects of leaf nutrient traits on different niche dimensions are specific and asymmetric: the thermal niche is primarily driven by leaf N, whereas the hydric niche is more strongly influenced by leaf N/P and P. These findings not only deepen our understanding of mechanisms underlying plant adaptive evolution but also emphasize the necessity of considering both functional traits and the evolutionary history of species when making ecological predictions. In the context of global climate change, this study provides a more refined theoretical basis for predicting the risks of range shifts for species with different functional strategies. Furthermore, our quantification of the specific and asymmetric roles of leaf N, P, and N/P in defining thermal and hydric niche limits provides a trait-based mechanistic constraint that can be integrated into process-based species distribution models to improve their physiological realism and predictive accuracy under novel climates.
Supplementary Materials
The following supporting information can be downloaded at https://www.mdpi.com/article/10.3390/f17010146/s1. Table S1.Effects of three leaf traits (leaf N, leaf P, and leaf N/P) on thermal niche breadth, lower thermal niche limit, and upper thermal niche limit; Table S2. Relationships of thermal niche breadth, lower thermal niche limit, and upper thermal niche limit with leaf N, leaf P, and leaf N/P; Table S3. Effects of three leaf traits (leaf N, leaf P, and leaf N/P) on hydric niche breadth, lower hydric niche limit, and upper hydric niche limit; Table S4: Relationships of hydric niche breadth, lower hydric niche limit and upper hydric niche limit with leaf N, leaf P, and leaf N/P.
Author Contributions
Conceptualization, C.Z. and Z.M.; methodology, C.Z. and Z.M.; software, C.Z.; formal analysis, C.Z.; investigation, L.Z., Y.H., X.Z. and W.R.; writing—original draft preparation, C.Z. and Z.M.; writing—review and editing, L.Z., Y.H., X.Z. and W.R.; supervision, C.Z.; project administration, Z.M.; funding acquisition, C.Z. All authors have read and agreed to the published version of the manuscript. L.Z., Y.H. and X.Z. contributed equally to this work.
Funding
This research was funded by the the CAS “Light of West China” Program.
Data Availability Statement
The original contributions presented in the study are included in the article and Supplementary Materials, further inquiries can be directed to the corresponding author.
Acknowledgments
We extend our gratitude to the 21 anonymous experts in botany and ecology for their meticulous review and revision of the species distribution information collected for each region, including the verification of Chinese names and Latin scientific names (encompassing species, genus, and family levels).
Conflicts of Interest
The authors declare no conflicts of interest.
Abbreviations
The following abbreviations are used in this manuscript:
| N | Nitrogen |
| P | Phosphorus |
| PGLM | Phylogenetic generalized linear model |
| LM | Linear regression model |
References
- Ordoñez, J.C.; van Bodegom, P.M.; Witte, J.P.M.; Wright, I.J.; Reich, P.B.; Aerts, R. A global study of relationships between leaf traits, climate and soil measures of nutrient fertility. Glob. Ecol. Biogeogr. 2009, 18, 137–149. [Google Scholar] [CrossRef] [Scilit]
- Wiens, J.J.; Ackerly, D.D.; Allen, A.P.; Anacker, B.L.; Buckley, L.B.; Cornell, H.V.; Damschen, E.I.; Davies, T.J.; Grytnes, J.-A.; Harrison, S.P.; et al. Niche conservatism as an emerging principle in ecology and conservation biology. Ecol. Lett. 2010, 13, 1310–1324. [Google Scholar] [CrossRef] [Scilit] [PubMed]
- Briceño, V.F.; Arnold, P.A.; Cook, A.M.; Courtney Jones, S.K.; Gallagher, R.V.; French, K.; Bravo, L.A.; Nicotra, A.B.; Leigh, A. Drivers of thermal tolerance breadth of plants across contrasting biomes. J. Ecol. 2025, 113, 3812–3829. [Google Scholar] [CrossRef] [Scilit]
- Reich, P.B.; Oleksyn, J. Global patterns of plant leaf N and P in relation to temperature and latitude. Proc. Natl. Acad. Sci. USA 2004, 101, 11001–11006. [Google Scholar] [CrossRef] [Scilit]
- Wright, I.J.; Reich, P.B.; Westoby, M.; Ackerly, D.D.; Baruch, Z.; Bongers, F.; Cavender-Bares, J.; Chapin, T.; Cornelissen, J.H.C.; Diemer, M.; et al. The worldwide leaf economics spectrum. Nature 2004, 428, 821–827. [Google Scholar] [CrossRef] [Scilit]
- Reich, P.B. The world-wide ‘fast-slow’ plant economics spectrum: A traits manifesto. J. Ecol. 2014, 102, 275–301. [Google Scholar] [CrossRef] [Scilit]
- Wright, I.J.; Reich, P.B.; Cornelissen, J.H.C.; Falster, D.S.; Garnier, E.; Hikosaka, K.; Lamont, B.B.; Lee, W.; Oleksyn, J.; Osada, N.; et al. Assessing the generality of global leaf trait relationships. New Phytol. 2005, 166, 485–496. [Google Scholar] [CrossRef] [Scilit]
- Blomberg, S.P.; Garland, T.; Ives, A.R. Testing for phylogenetic signal in comparative data: Behavioral traits are more labile. Evolution 2003, 57, 717–745. [Google Scholar] [CrossRef] [Scilit]
- McGill, B.J.; Enquist, B.J.; Weiher, E.; Westoby, M. Rebuilding community ecology from functional traits. Trends Ecol. Evol. 2006, 21, 178–185. [Google Scholar]
- Violle, C.; Navas, M.L.; Vile, D.; Kazakou, E.; Fortunel, C.; Hummel, I.; Garnier, E. Let the concept of trait be functional! Oikos 2007, 116, 882–892. [Google Scholar] [CrossRef]
- Laughlin, D.C. The intrinsic dimensionality of plant traits and its relevance to community assembly. J. Ecol. 2014, 102, 186–193. [Google Scholar] [CrossRef] [Scilit]
- Kearney, M.; Porter, W. Mechanistic niche modelling: Combining physiological and spatial data to predict species’ ranges. Ecol. Lett. 2009, 12, 334–350. [Google Scholar] [CrossRef] [Scilit] [PubMed]
- Thuiller, W.; Münkemüller, T.; Lavergne, S.; Mouillot, D.; Mouquet, N.; Schiffers, K.; Gravel, D. A road map for integrating eco-evolutionary processes into biodiversity models. Ecol. Lett. 2013, 16, 94–105. [Google Scholar] [CrossRef] [Scilit] [PubMed]
- Díaz, S.; Kattge, J.; Cornelissen, J.H.C.; Wright, I.J.; Lavorel, S.; Dray, S.; Reu, B.; Kleyer, M.; Wirth, C.; Prentice, I.C.; et al. The global spectrum of plant form and function. Nature 2016, 529, 167–171. [Google Scholar] [CrossRef] [Scilit]
- Körner, C. Alpine Plant Life: Functional Plant Ecology of High Mountain Ecosystems, 2nd ed.; Springer: Berlin, Germany, 2003. [Google Scholar]
- Sastry, A.; Barua, D. Leaf thermotolerance in tropical trees from a seasonally dry climate varies along the slow-fast resource acquisition spectrum. Sci. Rep. 2017, 7, 11246. [Google Scholar] [CrossRef] [Scilit]
- Güsewell, S. N: P ratios in terrestrial plants: Variation and functional significance. New Phytol. 2004, 164, 243–266. [Google Scholar] [CrossRef] [Scilit]
- Ho, M.D.; Rosas, J.C.; Brown, K.M.; Lynch, J.P. Root architectural tradeoffs for water and phosphorus acquisition. Funct. Plant Biol. 2005, 32, 737–748. [Google Scholar] [CrossRef] [Scilit]
- Lambers, H.; Oliveira, R.S. Plant Physiological Ecology, 3rd ed.; Springer Nature: Cham, Switzerland, 2019. [Google Scholar]
- Zhang, C.; Li, C.; Ma, Z.; Du, G. Identification of determinants of species germination niche breadth on the eastern Tibetan Plateau. Glob. Ecol. Conserv. 2020, 24, e01312. [Google Scholar] [CrossRef] [Scilit]
- Cavender-Bares, J.; Kozak, K.H.; Fine, P.V.A.; Kembel, S.W. The merging of community ecology and phylogenetic biology. Ecol. Lett. 2009, 12, 693–715. [Google Scholar] [CrossRef] [Scilit]
- Chen, Y.; Han, W.; Tang, L.; Tang, Z.; Fang, J. Leaf nitrogen and phosphorus concentrations of woody plants differ in responses to climate, soil and plant growth form. Ecography 2013, 36, 178–184. [Google Scholar] [CrossRef] [Scilit]
- Cornelissen, J.H.C.; Lavorel, S.; Garnier, E.; Díaz, S.; Buchmann, N.; Gurvich, D.E.; Reich, P.B.; ter Steege, H.; Morgan, H.D.; van der Heijden, M.G.A.; et al. A handbook of protocols for standardised and easy measurement of plant functional traits worldwide. Aust. J. Bot. 2003, 51, 335–380. [Google Scholar] [CrossRef] [Scilit]
- John, M.K. Colorimetric determination of phosphorus in soil and plant materials with ascorbic acid. Soil Sci. 1970, 109, 214–220. [Google Scholar] [CrossRef] [Scilit]
- Fang, J.; Wang, Z.; Tang, Z. (Eds.) Atlas of Woody Plants in China: Distribution and Climate; Springer: Berlin, Germany, 2011. [Google Scholar]
- Thornthwaite, C.W. An approach toward a rational classification of climate. Geogr. Rev. 1948, 38, 55–94. [Google Scholar] [CrossRef] [Scilit]
- Fang, J.; Yoda, K. Climate and vegetation in China III water balance and distribution of vegetation. Ecol. Res. 1990, 5, 9–23. [Google Scholar] [CrossRef] [Scilit]
- Pearman, P.B.; Guisan, A.; Broennimann, O.; Randin, C.F. Niche dynamics in space and time. Trends Ecol. Evol. 2008, 23, 149–158. [Google Scholar] [CrossRef] [Scilit]
- Sillero, N.; Barbosa, A.M. Want to model a species niche? A step-by-step guideline on correlative ecological niche modelling. Ecol. Model. 2021, 456, 109671. [Google Scholar]
- Sexton, J.P.; McIntyre, P.J.; Angert, A.L.; Rice, K.J. Evolution and ecology of species range limits. Annu. Rev. Ecol. Evol. Syst. 2009, 40, 415–436. [Google Scholar] [CrossRef] [Scilit]
- Jin, Y.; Qian, H.V. PhyloMaker2: An updated and enlarged R package that can generate very large phylogenies for vascular plants. Plant Divers. 2022, 44, 335–339. [Google Scholar]
- Davies, T.J.; Fritz, S.A.; Grenyer, R.; Orme, C.D.L.; Bielby, J.; Bininda-Emonds, O.R.P.; Cardillo, M.; Jones, K.E.; Gittleman, J.L.; Mace, G.M.; et al. Phylogenetic trees and the future of mammalian biodiversity. Proc. Natl. Acad. Sci. USA 2008, 105, 11556–11563. [Google Scholar] [CrossRef] [Scilit]
- Zanne, A.E.; Tank, D.C.; Cornwell, W.K.; Eastman, J.M.; Smith, S.A.; FitzJohn, R.G.; Beaulieu, J.M.; O’Meara, B.C.; Moles, A.T.; Reich, P.B.; et al. Three keys to the radiation of angiosperms into freezing environments. Nature 2014, 506, 89–92. [Google Scholar]
- Pagel, M. Inferring the historical patterns of biological evolution. Nature 1999, 401, 877–884. [Google Scholar] [CrossRef] [Scilit] [PubMed]
- Revell, L.J. Phytools: An R package for phylogenetic comparative biology (and other things). Methods Ecol. Evol. 2012, 3, 217–223. [Google Scholar] [CrossRef] [Scilit]
- Brazzale, A.R. Boot: Bootstrap Functions; R Package Version 1.3-32. Available online: https://cran.r-project.org/web/packages/boot (accessed on 26 November 2025).
- Forstmeier, W.; Wagenmakers, E.J.; Parker, T.H. Detecting and avoiding likely false-positive findings—A practical guide. Biol. Rev. 2017, 92, 1941–1968. [Google Scholar] [CrossRef] [Scilit] [PubMed]
- Dormann, C.F.; Elith, J.; Bacher, S.; Buchmann, C.; Carl, G.; Carré, G.; Marquéz, J.R.G.; Gruber, B.; Lafourcade, B.; Leitão, P.J.; et al. Collinearity: A review of methods to deal with it and a simulation study evaluating their performance. Ecography 2013, 36, 27–46. [Google Scholar] [CrossRef] [Scilit]
- Gelman, A.; Stern, H. The difference between “significant” and “not significant” is not itself statistically significant. Am. Stat. 2006, 60, 328–331. [Google Scholar] [CrossRef] [Scilit]
- Tung Ho, L.S.; Ané, C. A linear-time algorithm for Gaussian and non-Gaussian trait evolution models. Syst. Biol. 2014, 63, 397–408. [Google Scholar] [CrossRef] [Scilit]
- R Core Team. R: A Language and Environment for Statistical Computing; R Foundation for Statistical Computing: Vienna, Austria, 2025. [Google Scholar]
- Hutchinson, G.E. Concluding remarks. Cold Spring Harb. Symp. Quant. Biol. 1957, 22, 415–427. [Google Scholar] [CrossRef] [Scilit]
- Soberón, J.; Peterson, A.T. Interpretation of models of fundamental ecological niches and species’ distributional areas. Biodivers. Inform. 2005, 2, 1–10. [Google Scholar] [CrossRef] [Scilit]
- Guisan, A.; Thuiller, W. Predicting species distribution: Offering more than simple habitat models. Ecol. Lett. 2005, 8, 993–1009. [Google Scholar] [CrossRef] [Scilit]
- Araya, Y.N.; Silvertown, J.; Gowing, D.J.; McConway, K.J.; Peter Linder, H.; Midgley, G. A fundamental, eco-hydrological basis for niche segregation in plant communities. New Phytol. 2011, 189, 253–258. [Google Scholar] [CrossRef] [Scilit]
- Zhang, C.; Xi, N. Precipitation changes regulate plant and soil microbial biomass via plasticity in plant biomass allocation in grasslands: A meta-analysis. Front. Plant Sci. 2021, 12, 614968. [Google Scholar] [CrossRef] [Scilit] [PubMed]
- Brown, J.H.; Gillooly, J.F.; Allen, A.P.; Savage, V.M.; West, G.B. Toward a metabolic theory of ecology. Ecology 2004, 85, 1771–1789. [Google Scholar] [CrossRef] [Scilit]
- Perez, T.M.; Feeley, K.J. Photosynthetic heat tolerances and extreme leaf temperatures. Funct. Ecol. 2020, 34, 2236–2245. [Google Scholar] [CrossRef] [Scilit]
- González, M.; Cuervo-Gómez, M.; Garnica-Díaz, C.; Álvarez-Flórez, F.; Cubillos-Ariza, L.; Giral, V.; John, G.; Melgarejo, L.M.; Salgado-Negret, B. Thermal tolerance is linked to anatomical but not morphological leaf traits in woody species of Andean tropical montane forests. Funct. Ecol. 2025, 39, 1537–1549. [Google Scholar] [CrossRef] [Scilit]
- Lambers, H. Phosphorus acquisition and utilization in plants. Annu. Rev. Plant Biol. 2022, 73, 17–42. [Google Scholar] [CrossRef] [Scilit]
- Choat, B.; Brodribb, T.J.; Brodersen, C.R.; Duursma, R.A.; López, R.; Medlyn, B.E. Triggers of tree mortality under drought. Nature 2018, 558, 531–539. [Google Scholar] [CrossRef] [Scilit]
- Felsenstein, J. Phylogenies and the comparative method. Am. Nat. 1985, 125, 1–15. [Google Scholar] [CrossRef] [Scilit]
- Revell, L.J. Phylogenetic signal and linear regression on species data. Methods Ecol. Evol. 2010, 1, 319–329. [Google Scholar] [CrossRef] [Scilit]
- Araújo, M.B.; Luoto, M. The importance of biotic interactions for modelling species distributions under climate change. Glob. Ecol. Biogeogr. 2007, 16, 743–753. [Google Scholar] [CrossRef] [Scilit]
- Violle, C.; Reich, P.B.; Pacala, S.W.; Enquist, B.J.; Kattge, J. The emergence and promise of functional biogeography. Proc. Natl. Acad. Sci. USA 2014, 111, 13690–13696. [Google Scholar] [CrossRef] [Scilit]
- Weigelt, A.; Mommer, L.; Andraczek, K.; Iversen, C.M.; Bergmann, J.; Bruelheide, H.; Fan, Y.; Freschet, G.T.; Guerrero-Ramírez, N.R.; Kattge, J.; et al. An integrated framework of plant form and function: The belowground perspective. New Phytol. 2021, 232, 42–59. [Google Scholar] [CrossRef] [Scilit]
- Violle, C.; Enquist, B.J.; McGill, B.J.; Jiang, L.; Albert, C.H.; Hulshof, C.; Jung, V.; Messier, J. The return of the variance: Intraspecific variability in community ecology. Trends Ecol. Evol. 2012, 27, 244–252. [Google Scholar] [CrossRef] [Scilit]

Disclaimer/Publisher’s Note: The statements, opinions and data contained in all publications are solely those of the individual author(s) and contributor(s) and not of MDPI and/or the editor(s). MDPI and/or the editor(s) disclaim responsibility for any injury to people or property resulting from any ideas, methods, instructions or products referred to in the content. |
© 2026 by the authors. Licensee MDPI, Basel, Switzerland. This article is an open access article distributed under the terms and conditions of the Creative Commons Attribution (CC BY) license.