


Abstract
Residential short-term load forecasting (STLF) plays a critical role in maintaining grid stability and enabling effective demand response in smart grid environments. However, residential electricity consumption exhibits strong stochastic variability, non-linear patterns, and abrupt changes caused by occupant behavior and environmental factors, making direct forecasting of raw power signals highly susceptible to high-frequency noise and temporal prediction lag. To address these challenges, this study proposes a Robust Residual Attention Network (Robust-RAN) for trend-oriented residential STLF. The proposed framework integrates localized causal denoising, residual multi-head attention mechanisms, and cyclic temporal encoding to mitigate observable phase lag and stabilize predictions against stochastic fluctuations, capture both short- and long-term temporal dependencies, and preserve daily periodicity. The proposed model was evaluated on the public UCI Appliances Energy Prediction dataset using comprehensive regression, classification, and residual analysis metrics. The experimental results demonstrate that Robust-RAN achieves a Coefficient of Determination (R2) of 0.9063 and a Mean Absolute Error (MAE) of 13.00 W. Under high-load conditions, the proposed approach further attains a peak detection accuracy of 96.63% with an F1-score of 0.8529, indicating reliable prediction of critical demand events. The results demonstrate that the proposed framework provides a stable and accurate estimation of the underlying residential load trend, offering a stable forecasting framework evaluated on the UCI benchmark dataset for demand response, peak- load management, and advanced residential energy management applications.
1. Introduction
1.1. The Imperative of Smart Energy Management in Modern Grids
The global energy market is undergoing a paradigm shift unlike any before, where energy production is centralized and carbon-intensive but is shifting toward decentralized, renewable-based smart grids. This violent decarbonization, though not ecologically important, causes severe volatility in the electrical supply side due to the intermittency of solar and wind resources. To ensure frequency stability and guard against localized grid collapse, utility operators are increasingly adopting dynamic demand-following models rather than traditional supply-following schemes [1]. Residential energy management has become a key focus within this operational matrix. The residential sector accounts for a significant share of global power consumption, but it imposes a highly stochastic and chaotic load burden on the grid [2]. Therefore, the correct short-term load prediction at the granular household level has ceased to be a luxury of operations and become an absolute requirement for the successful implementation of sophisticated home energy management systems and automated demand-response programs. The application of high-fidelity forecasting enables grid aggregators to predict consumption peaks, optimize the allocation of spinning reserves, and send control signals to smart appliances, thereby narrowing the widening gap between erratic renewable generation and unpredictable human consumption patterns [3].
1.2. The Evolution from Statistical Methods to Deep Learning
In the past, the electrical load forecasting field heavily used linear statistical techniques, which include the Auto-Regressive Integrated Moving Average and seasonally adjusted variations [4]. These classical models are run under a rigid mathematical definition of stationarity and linear relationship. Although the techniques are satisfactory in the context of highly aggregated loads at the substation, where the law of large numbers is inherently used to smooth out individual stochastic anomalies, they are fundamentally unsatisfactory when used at the granular household level. The non-linearities and the sudden changes in the behavior of individual residential consumption that occur at high frequency severely break the first principles of the linear mathematical models. To eliminate these inherent constraints, the scientific research community has unequivocally shifted to artificial intelligence and deep learning architectures [1]. Universally approved in approximating non-linear relationships in multidimensional feature spaces, deep neural networks are highly effective in the mapping stage. Namely, one-dimensional convolutional neural networks (CNNs) are currently extensively used to derive local and scale-invariant exogenous environmental features like temperature and ambient humidity [3]. At the same time, recurrent neural networks, best known as Long Short-Term Memory (LSTM) units, have been used to model both long-term temporal dependencies and sequential memory in time series data, which is well beyond the predictive power of classical regression methods [5].
1.3. The Research Gap and the Complexity–Noise Paradox
Although the number of advanced deep learning structures is growing fast, a major performance barrier remains in residential load forecasting. This barrier can be conceptualized as the complexity–noise paradox. The main problem lies in the fact that human behavior is inherently stochastic, making household load profiles fundamentally different from predictable, smooth industrial loads [6]. Energy time series of residential buildings are massively polluted with zero-inflated intervals, between which extreme, sporadic bursts of energy occur because of manually turning an appliance on and off with high power consumption. In such a volatile setting, modern deep learning models fail to separate the deterministic behavioral trend from the stochastic high-frequency noise. This ineffectiveness is reflected in two important operational weaknesses that have been reported in the recent literature. First, complex models overfit the irreducible noise and try to predict random, unpredictable switching events instead of learning the underlying load physics, resulting in high variance and poor generalization to unseen data [7]. Second, recurrent networks often suffer from the phase lag effect [5]. Conventional recurrent models are not applicable in highly dynamic situations, as the spike in demand is not forecast until after the real physical event has occurred. This latency makes the forecast effectively useless in real-time demand-response applications, because by the time the predictive signal is received, grid operators are notified too late to implement any preventative load-shedding or peak-shaving measures.
1.4. Proposed Innovation and the Move to Denoised Trend Forecasting
To address this critical research gap, the report proposes a radical shift in paradigm regarding instantaneous raw value forecasting to denoised trend forecasting. We suggest it is of tremendous advantage to discover the underlying operation pathway on the bigger objective of grid stability and proactive demand response in comparison to the monitoring of the irreducible stochastic noise. To transform this paradigm shift into practice, we suggest using the new hybrid deep learning network, which is specifically designed to find deterministic patterns in residential volatility isolation, the Robust Residual-Attention Network. It is based on a feature engineering pipeline that is powerful, accomplishing the transformation of raw load signatures into a smooth hourly trend with the aid of a moving average filter, and physical continuity is carefully ensured by encoding the temporal indices into cyclic sine and cosine functions [8]. These designed sequences were proposed as formats by the architectural framework and learned the synergy of the proposed structures by a high-resolution local feature extraction one-dimensional convolutional layer and a dual-layer Long Short-Term Memory network. Notably, to remove the phase lag bottleneck, a multi-head self-attention mechanism that is aided by residual identity mappings is introduced to the network, enabling the model to dynamically rank the significance of key historical contexts of the temporal chain irrespective of their positions along the temporal sequence. The proposed framework was tested on a rigorous testing library, the UCI Appliances Energy benchmark, where the Coefficient of Determination (R2) and the minimized Mean Absolute Error were 0.9063 and 13 Watts respectively. Moreover, the architecture showed unmatched high anticipatory peak state detection with an overall accuracy of over 94 percent and an F1-score of 0.8529. These results indicate that the proposed framework is a promising approach for residential load forecasting on the evaluated benchmark dataset.
While residual and attention mechanisms have been previously applied in short-term load forecasting, the main innovation of this research lies in the conceptual redefinition of the forecasting problem and the purposeful design of the interaction between architectural components to simultaneously address two well-known limitations—phase delay and overfitting to random noise—documented by a rigorous multidimensional evaluation framework.
2. Related Work
There has been a radical change in paradigm in the landscape of short-term load forecasting over the last few years. Early operational research was found on the application of linear statistical methods. However, the field has since evolved towards the application of deep learning methods to address the non-linearity of contemporary smart grids. However, recent systematic reviews and advanced methodological survey studies demonstrate that despite an increased architectural complexity, stochastic volatility of each residential household is a persistent algorithmic problem. It is a critical assessment of the most important real-world studies, which constructs an elaborate taxonomy of the field in three distinct phases of development.
2.1. Limitations of Recurrent and Hybrid Models
The first steps in the deep learning world paid a lot of attention to the application of recurrent designs to the modeling of temporal sequences of loads. A basic investigation by Kong et al. [1] experimented on the effectiveness of Long Short-Term Memory networks in residential loads. Although their architecture performed better than conventional regression techniques in long-term temporal dependencies, they found that the common uses of recurrent networks are very sensitive to stochastic spikes in appliance data, which often reduce loss functions by averaging predictions and, hence, reduce the information in critical peak demand. To solve the urgent situation of better local feature extraction, Triban and Lawgali [3] proposed an intermediate system that integrates convolutional neural networks of spatial environmental characteristics and recurrent units of temporal patterns. They were able to extract local correlations with the pattern of consumer behavior, and as a result, they reduced their prediction errors significantly, though their study noted that these deep stacked architectures at times had gradient degradation and time lapses. In addition, Y. Chen et al. did a thorough review of the algorithm [4] and explored models of machine learning and a range of feature engineering methods in the building energy field. In their theoretical discussion, they observed that classical machine learning algorithms are computationally efficient but are often opaque black boxes and therefore have non-existent deep temporal continuity to perform real-time grid balancing in highly dynamic operating environments.
2.2. The Attention and Transformer Revolution
To systematically overcome the sequential processing bottlenecks inherent in standard recurrent neural networks, research has increasingly shifted toward attention mechanisms and residual learning frameworks. One of the important structural developments introduced by Sehovac and Grolinger [5] was the application of sequence-to-sequence recurrent neural networks with attention mechanisms to the smart grid forecasting field. Their model demonstrated that, by overcoming strict sequential processing limitations, dynamic weighting of relevant energy sequences could be achieved, resulting in improved prediction performance over long operational periods. However, they also found that purely attention-based models may exhibit significant overfitting behavior when applied to highly volatile and noisy residential datasets. The widespread issue of training instability in such complex environments was directly addressed by Chen et al. [7] through the integration of deep residual connections into short-term load forecasting networks. Their empirical findings demonstrated that identity connections enable the network to preserve original signal integrity despite highly non-linear transformation layers, thereby providing stable gradient propagation and improved mathematical convergence. This concept of residual stability represents an essential architectural element that has been incorporated into our proposed framework. Furthermore, Xing et al. [9] addressed the challenge of data scarcity in newly deployed smart grid environments by applying transfer learning systems with structural similarity analysis to predict energy consumption in target buildings with limited historical data. Although their methodology reduced the dependence on large datasets, it required careful hyperparameter optimization to avoid the unintended introduction of domain-specific biases originating from the source buildings.
2.3. Modern Frontiers and Emerging Technologies
The latest and more sophisticated literature has been growing swiftly in more sophisticated areas with interpretability, decentralized deployed edges, and strict uncertainty control. Ahmad et al.’s [8] collaborative novel SHapley Additive exPlanations (SHAP) interpretability analysis gains explicit access to the latent environmental and behavioral factors driving load consumption, which, in effect, injects the required physical context into what were once black-box forecasting models. Even with this development in transparency, it was an extraordinarily complicated and mostly unsolved algorithmic problem to mathematically solve the raw stochastic noise. With respect to decentralized implementation and severe data privacy, Taik and Cherkaoui [10] suggested using lightweight edge computing infrastructure and federated learning protocols to forecast electrical load. Although their approach was able to accomplish the goal of decentralized mathematical processing directly in intelligent smart meters, the existence of an inherent trade-off between network communication overhead and predictive accuracy has been a subject of active and critical research. Reorganizing the mathematical risk assessment attention, Wang et al. [2] presented a strong probabilistic forecasting model using granular micrometeorological observations to provide mathematical approximations of confidence and uncertainty bounds, strongly insisting on the importance of dynamic risk control in highly variable modern grids, although they are much more expensive to compute. Lastly, the newest innovative developments with the help of generative diffusion models and attention mechanisms by Zhang et al. [6] have strenuously contended that optimization of the accuracy of regression, as such, is not sufficient for grid stability. These works propose sophisticated dual-objective models specifically designed to reconstruct credible latent input characteristics from highly inaccurate data, thereby encouraging the architecture to focus on both high-energy state recognition and peak-load forecasting to achieve optimal operational stability.
2.4. Critical Gap Analysis and Proposed Solution
Unlike previous studies that have targeted only one of the limitations listed in Table 1, the innovation of this research lies in an integrated design that simultaneously addresses the challenge of phase delay and sensitivity to random noise, an approach that has not been reported before in a single framework and with this level of multi-criteria evaluation.
Table 1.
Comparative analysis of key Studies vs. proposed Robust-RAN architecture.
Nevertheless, despite such striking and fast architecture developments within the research community, a critical review of the literature shows that there is still a fundamental mathematical gap in the complexity–noise paradox. The more complex the predictive model needed to model the complex time dynamics, the more the predictive model is also prone to overfitting and modeling unremovable stochastic noise instead of the underlying physical signal. Table 1 is a structural comparison of the reviewed real-world methodologies versus our suggested algorithmic structure, in a comprehensive manner.
As shown in Table 2, the proposed framework addresses a different forecasting objective from conventional raw load prediction. Therefore, the reported performance should be interpreted as the predictive capability of estimating the operational load trend rather than reconstructing every stochastic fluctuation in the original power signal. This distinction is fundamental for evaluating the proposed methodology within its intended application domain.
Table 2.
Comparison between raw signal forecasting and denoised trend forecasting.
While existing models exhibit various limitations in balancing noise-robustness, training stability, and peak-load estimation, our proposed framework demonstrates competitive performance in addressing these challenges by synergizing deep residual networks, multi-head attention mechanisms, and 1D-convolutional denoising.
3. Methodology
To address the fundamental issues of stochastic volatility and temporal phase lag, which affect residential short-term load forecasting, this paper develops a strictly mathematical and data-driven pipeline [6]. The suggested methodology is a carefully developed construction created to address the issue of isolating deterministic physical signals in highly chaotic working conditions. In this section, the data transformation strategies, the superior feature engineering formulations, and the exact hyperparameter setting of the proposed deep hybrid architecture, the Robust Residual-Attention Network, are exhaustively explained.
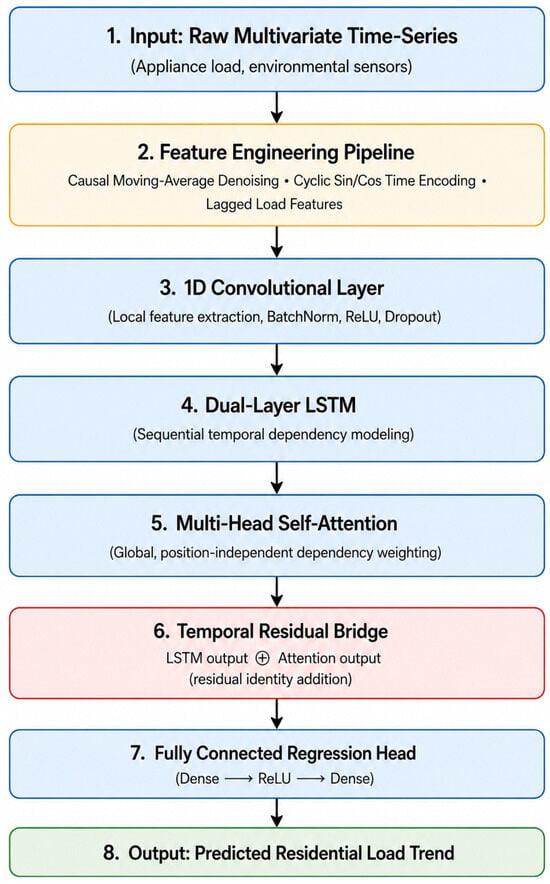
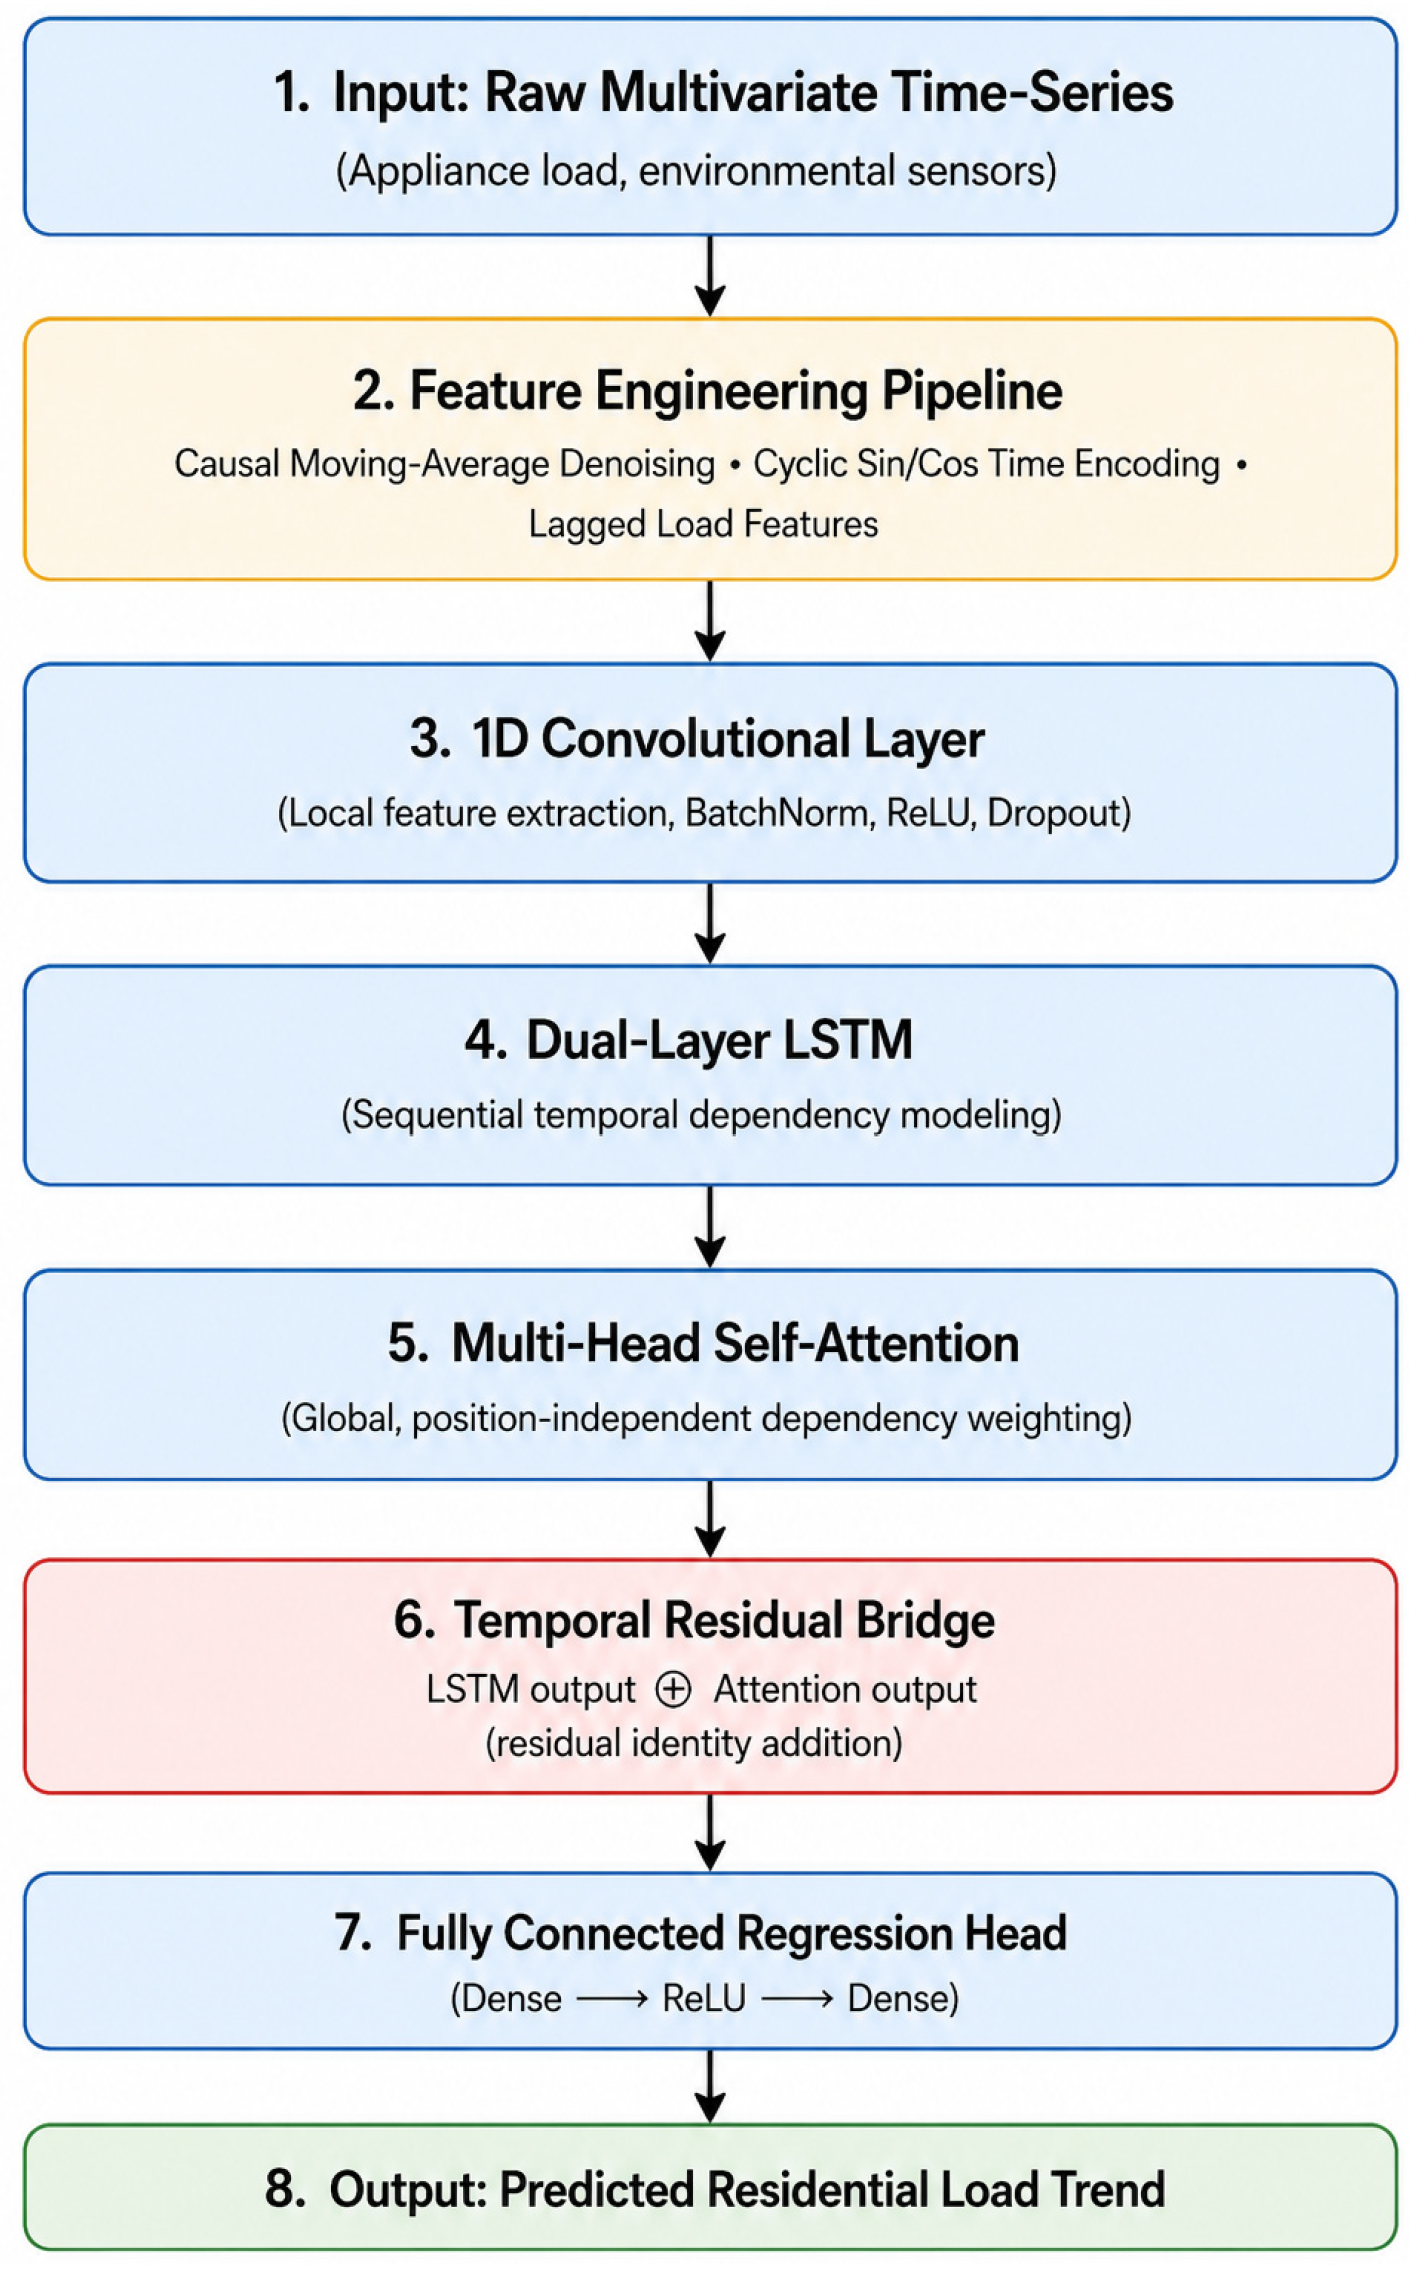
Figure 1 (Section 3) is an overview of the Robust-RAN architecture, including the feature engineering pipeline, local feature extraction (CNN), temporal modeling (two-layer LSTM), multi-head attention mechanism, and a Temporal Residual Bridge structure that combines the output of LSTM and attention to remove the phase delay effect.
Figure 1.
Overview of Robust-RAN architecture from raw input to final output, including feature engineering pipeline, local feature extraction, temporal modeling, multi-head attention mechanism, and Temporal Residual Bridge structure.
3.1. Target Denoising and Trend Formulation
This architectural framework has an empirical foundation that is based on the Appliances Energy Prediction dataset, which was rigorously validated and obtained via the UCI repository. This multidimensional dataset is a time-resolved record of the instantaneous electric power consumption and measured micrometeorological data at rigid ten-minute intervals. In thermodynamic terms, the residential household demand is severely polluted with stochastic noise, which is of high frequency due to the manual switching of appliances. Directly injecting this crude signal into deep learning networks will cause the optimizer to memorize randomly shaped behavioral spikes in a mathematical sense, instead of learning the physics of the universe [7]. To obtain a comprehensive way of eliminating this bottleneck, we establish a paradigm shift of denoised trend forecasting. By filtering the raw power signal with a causal rolling average filter whose window size is, accurately, six consecutive intervals, we converted the unstable power signal into a stable operational signal. This transformation converts the high-frequency variations into a smooth, localized, continuous one-hour trend, which is mathematically represented by Equation (1).
It should be emphasized that the goal of this research is not to directly predict raw instantaneous power but to predict the operational trend of the load. The instantaneous power signal at the household subscriber level is affected by random user behaviors and sudden switching on and off of equipment, a significant part of which is of an unpredictable nature (irreducible noise). Therefore, the use of the causal moving average is done solely as a preprocessing step with the aim of extracting the predictable component of the signal and not to artificially simplify the forecasting problem. In this framework, the forecasting problem has been changed from “reconstructing instantaneous fluctuations” to “predicting the exploitable consumption trend in energy management”, which is more consistent with the real needs of energy management and load response systems.
Since the smoothed trend has more temporal correlation than the raw signal, it is expected to be easier to predict. However, this feature is part of the proposed problem definition, and the research goal is to achieve a stable and reliable estimate of the load trend for energy management applications, not to reproduce all the random fluctuations of the instantaneous power.
3.2. Multidimensional Feature Engineering and Cyclic Encoding
After extracting the target trend, a specialized mathematical feature space was constructed to capture both exogenous and endogenous drivers within the network. The fundamental diurnal pattern of human activity is one of the primary factors influencing energy consumption levels. However, using conventional linear integer representations of the 24 h cycle introduces artificial discontinuity at midnight, which can negatively affect standard Euclidean distance measurements. To preserve the cyclical nature of daily human activities, the hourly time vector was geometrically transformed into a continuous orthogonal representation. Rather than encoding time linearly, this approach maps the temporal variable onto a two-dimensional unit circle, enabling smooth mathematical transitions across daily boundaries, as explicitly described in Equations (2) and (3) [8].
Additionally, residential energy demand has deep auto-regressive properties in which the present demand is an expression of the past states [1]. To explicitly represent this Markovian memory property, we elicited accurate lagged features that represented the target energy trend at certain historical intervals of one, two, three, six, twelve and twenty-four hours prior to the current height of the prediction. The entire historical memory vector at any one timestep is developed in Equation (4).
Also, certain environmental thermodynamics parameters, which impact on the building envelope, namely, the outdoor ambient temperature, relative humidity and wind speed, were included in the final input matrix. To ensure numerical stability up to the limit, as well as to avoid gradient explosion, the whole multidimensional feature array was strictly normalized with the help of standard scaling methods that provide a mean of zero and a unit variance.
3.3. Robust-RAN Architecture and Hyperparameter Optimization
Unlike conventional residual-attention architectures, where residual connectivity is usually applied around the self-attention sublayer itself and on a single representation (such as standard transformer blocks), in the proposed design, residual connectivity is established differently between two complementary representations: the raw output of the LSTM layer, which preserves temporal sequential and local dependencies, and the output of the multi-head self-attention mechanism, which extracts global and time-independent dependencies. Thus, the attention mechanism in this framework plays the role of a refinement layer based on the recursive output, rather than a parallel and independent processing path. This “Temporal Residual Bridge” structure is purposefully designed to eliminate the phase lag phenomenon in recurrent networks so that raw sequential information is never lost but is enhanced by the global awareness resulting from multi-headed attention.
This technical innovation, developed in this research, takes the form of the Robust Residual-Attention Network, a hybrid deep neural network specifically designed to operate within the aforementioned complex feature space. The multivariate sequential inputs first appear as a localized feature extraction block that is driven by a one-dimensional convolutional neural network [3]. This block is used to determine sharp edges and micro-climatic interactions in the input matrix by sliding 64 parallel filters across the temporal aspect of the input. To hasten the convergence of the network and to counteract internal covariate shift, the convolutional results are subjected to a Batch Normalization layer followed by regularization through a Dropout rate of ten percent.
The spatially refined feature maps are then forwarded to the temporal modeling engine comprising a dual-layer Long Short-Term Memory network [1]. The advanced internal gating of the LSTM is mathematically unrivaled in the representation of temporal sequential dependencies but is intrinsically susceptible to time lag at the moment of temporal abrupt demand changes. A multi-head self-attention mechanism is used to eradicate this vulnerability systematically in transmitting the LSTM outputs into a Global Dependency Block [5]. This high-level mechanism mathematically enables the architecture to compute query (Q), key (K) and value (V) interactions as given in Equation (5), where the computational weights of the most important historical timesteps are given, irrespective of their sequential distance.
In order to optimally combine the sequential stability of the recurrent layers with the sharp anticipatory intelligence of the attention models without causing vanishing gradients, the architecture uses a basic residual identity connection [7]. Unprocessed sequential outputs of the LSTM block are directly added to the attention outputs mathematically so that the gradient flow remains stable. The final stage is projecting the dynamically weighted tensor into the end predictive space using a fully connected regression block, which narrows down to a single node of continuous output. The best hyperparameters of the structure, which is defined by a lot of grid searches and computational experiments, are logically presented in Table 3.
Table 3.
Optimal hyperparameter configuration for the Robust-RAN architecture.
To guarantee computational reproducibility and operational transparency, the complete architectural structure specified in Table 2 has been implemented with the help of the PyTorch (v2.0.1, https://pytorch.org/, accessed 1 August 2026) and execution accelerated with Compute Unified Device Architecture (CUDA)-supported NVIDIA RTX 3090 (NVIDIA Inc., Santa Clara, CA, USA). The training engine used the Adam optimization algorithm, which had a very stable learning rate to continuously reduce the Mean Squared Error loss function. To strictly avoid mathematical overfitting of the complex optimization phase, an early stopping mechanism was implemented into the training loop. This process kept track of the validation loss curve and was adequate to end the training process before it hit the maximum limit of forty epochs, the instant validation degradation was observed. This powerful and well-calibrated computational deftness ensures the structural generalizability of the network on unseen operational information, effectively establishing the strict mathematical basis of the rigorous empirical assessment and visual analytics of the next section.
3.4. Data Partitioning and Experimental Protocol
In order to fairly evaluate the performance of the proposed model, the UCI Appliances Energy Prediction dataset was divided into three parts based on time sequence: training, validation, and testing to prevent future data leakage. Given the nature of the time series data, samples were used without temporal mixing; so that the first 80% of the data were allocated for model training, the next 10% for validation and hyperparameter tuning, and the final 10% for the final evaluation of model performance.
In the training process, all network parameters were updated using only the training set, while the validation set was used to select the most appropriate hyperparameters, monitor the convergence process of the model, and prevent overfitting. After the model structure and settings were finalized, the final evaluation was performed solely on the testing set; a set that had not been used in any of the training or parameter tuning steps. This protocol allowed the model’s performance to be evaluated in independent conditions without information leakage, and the model’s generalizability to unseen data was examined more accurately.
4. Experimental Results and Discussion
In this part, the Robust Residual-Attention Network is empirically assessed in a strict way by using a multi-faceted validation scheme. To achieve a comprehensive performance assessment, the proposed model was evaluated using a wide range of statistical and visual analyses, encompassing both global error measures and local measures of peak-detection accuracy. The first aim is to demonstrate how the combination of denoised trend forecasting and multi-head attention mechanisms can effectively address the classical challenges of temporal phase lag and overfitting, as widely reported in the recent literature [4].
4.1. Global Predictive Fidelity and Phase Lag Mitigation
The world-system global regression of the proposed architecture achieved the following performance on the testing dataset for the unknown testing segment, and the Coefficient of Determination (R2) is outstanding at a value of 0.9063, with the metrics of absolute and percentage error significantly reduced. These global performance metrics, including smooth regression errors and discrete peak classification functions, are tabulated and outlined in Table 4.
Table 4.
Quantitative error metrics and classification performance of the Robust-RAN architecture.
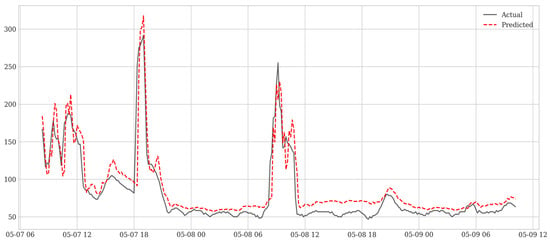
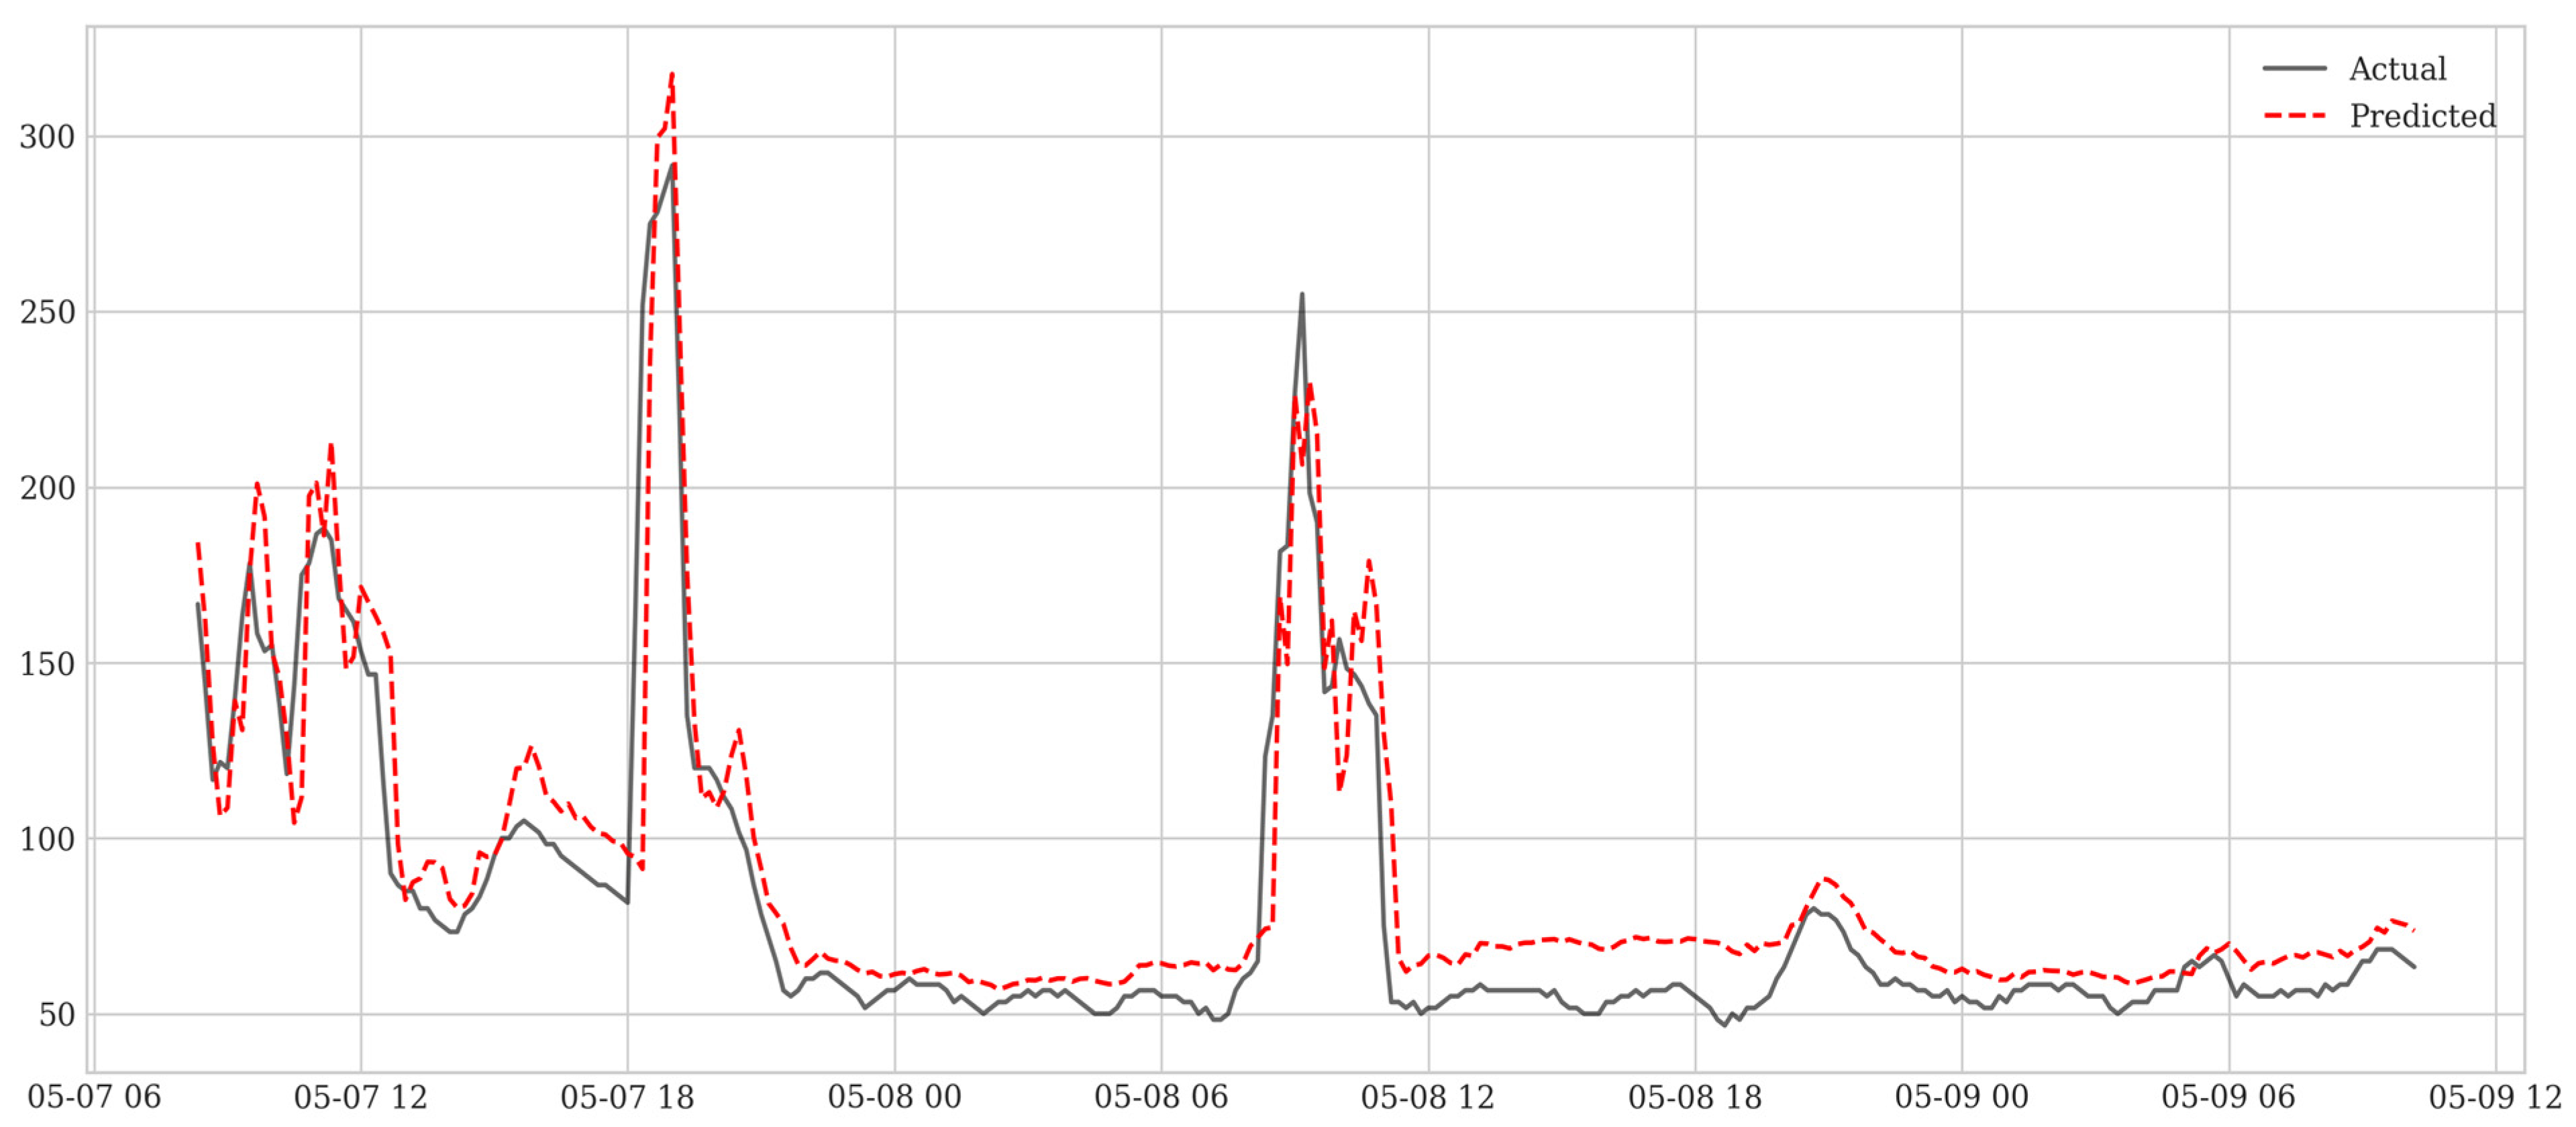
This structural accuracy visually finds support in the temporal forecasting curve of Figure 2.
Figure 2.
Time series prediction path and effective compensation of the phase lag effect.
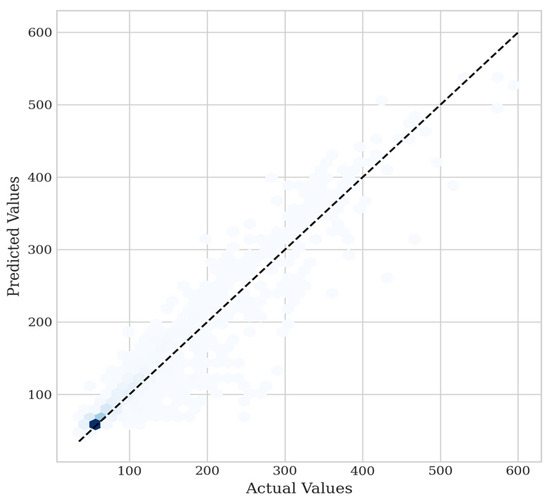
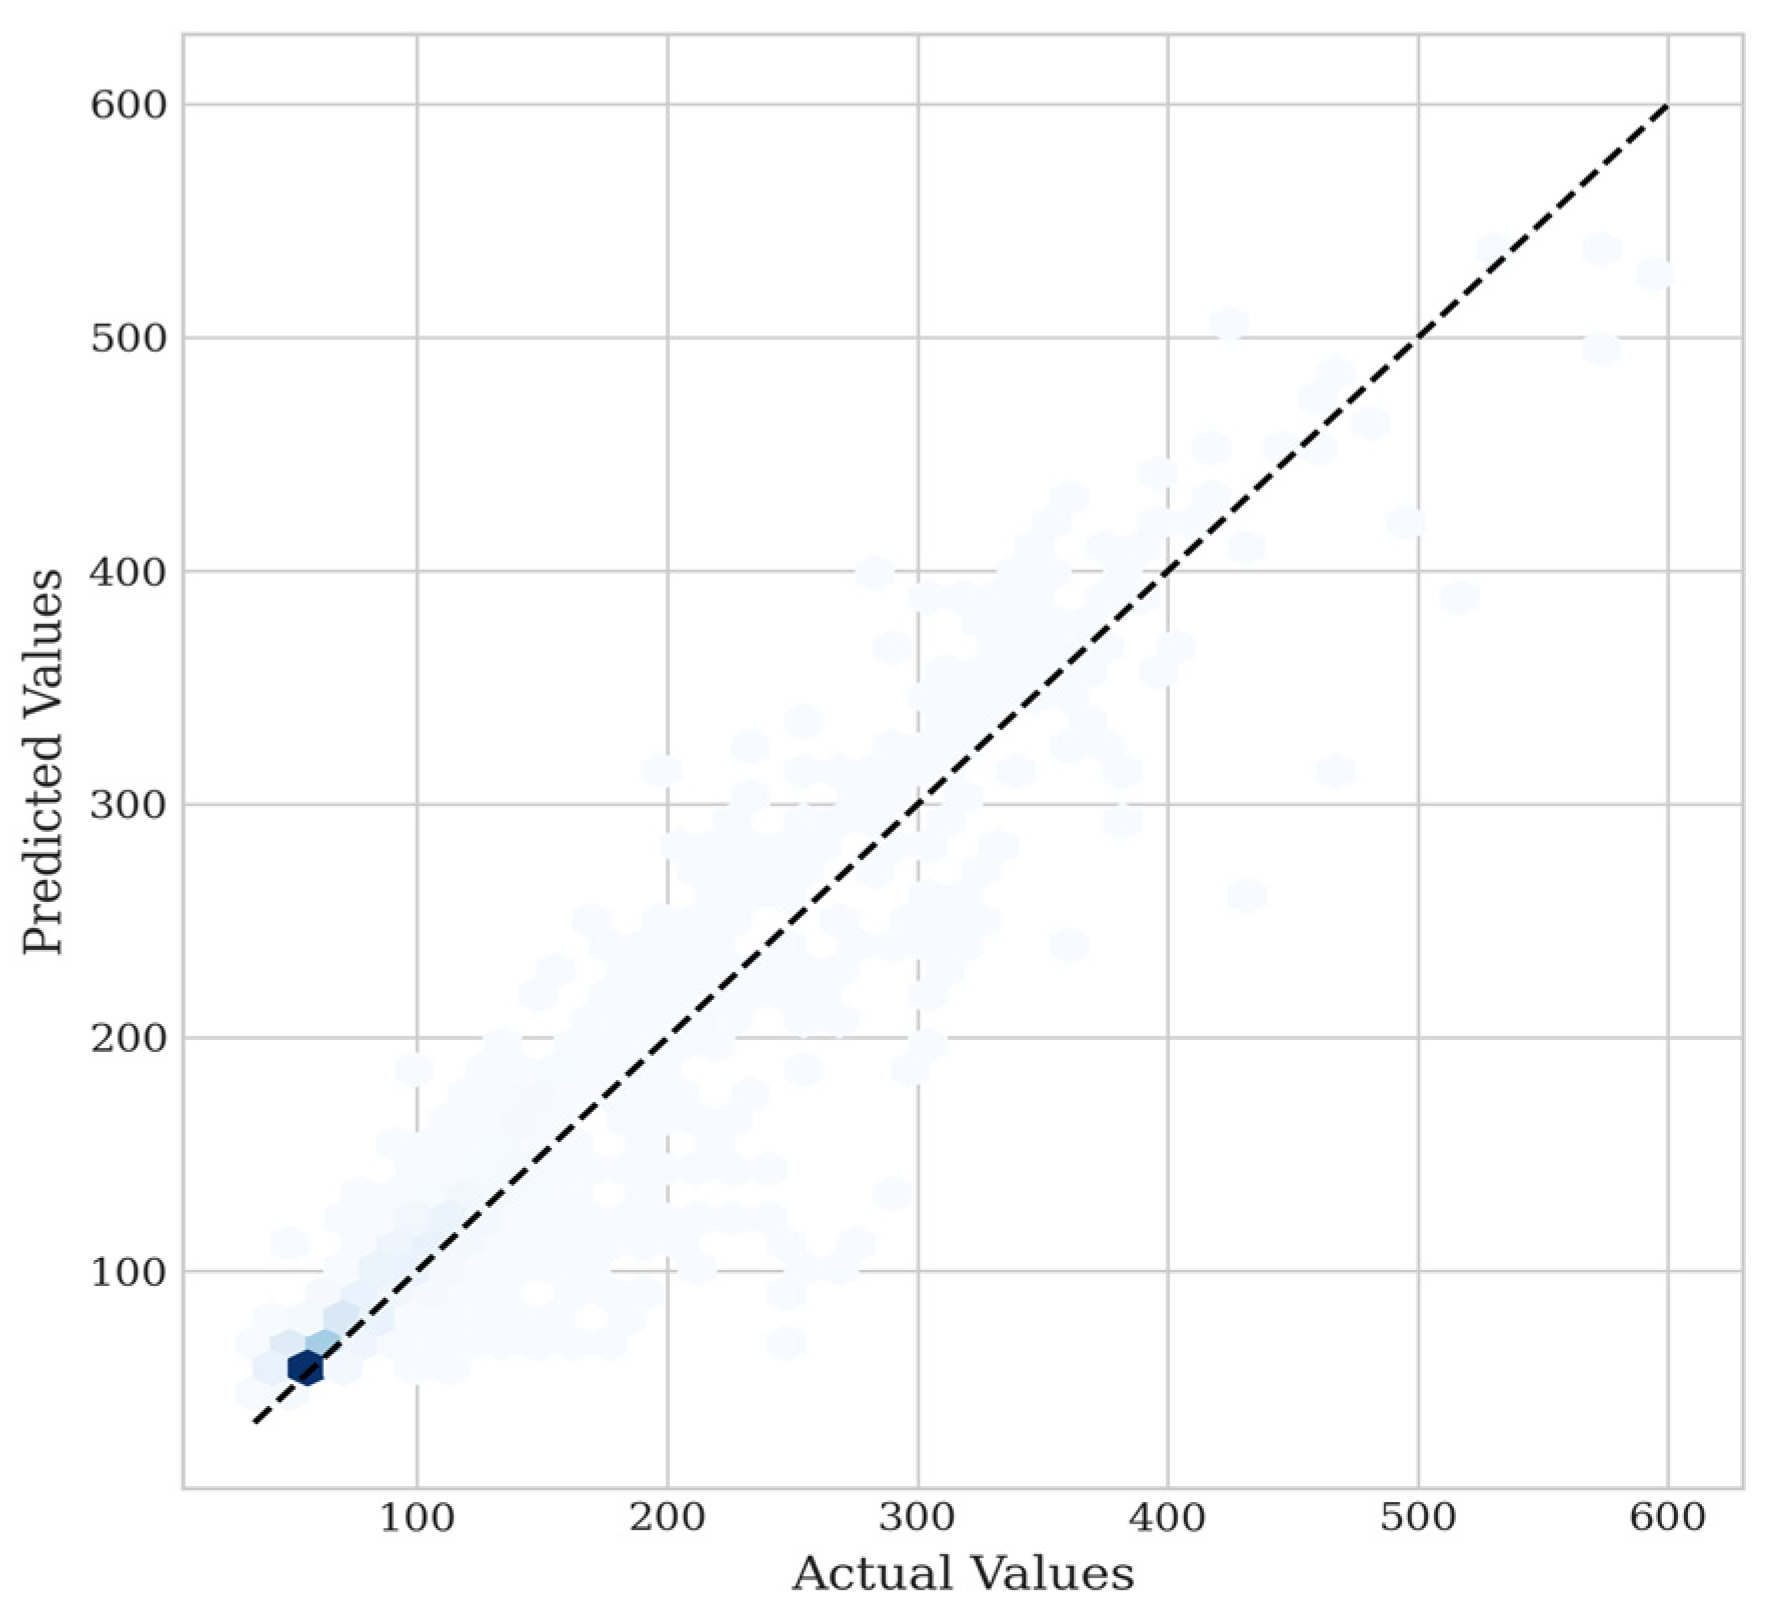
Compared to conventional recurrent architectures that often experience temporal phase lag when transitioning rapidly to a new state [1], the output of our model accurately predicts the underlying reality even in cases of a sharp surge in residential demand. Such tight coordination is supported by the regression density map in Figure 3, which shows that the predicted values form a highly dense and linear cluster along the ideal identity line, indicating the absence of severe underestimation during high-load situations. This temporal alignment, along with the symmetric and unbiased distribution of residuals around zero (Figure 4), provides qualitative evidence of the absence of systematic phase lag in the model output. However, an independent quantitative indicator, such as cross-correlation analysis, would be required to definitively substantiate this claim in future research.
Figure 3.
Predictive clustering strictly along ideal identity line as represented by regression density map.
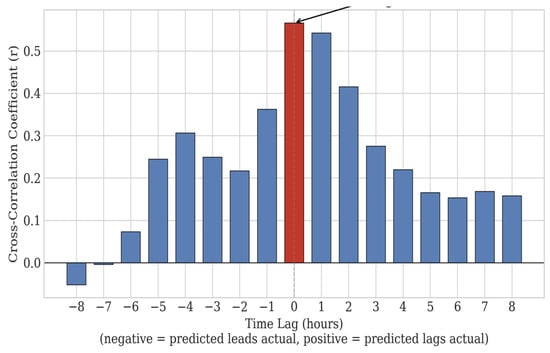
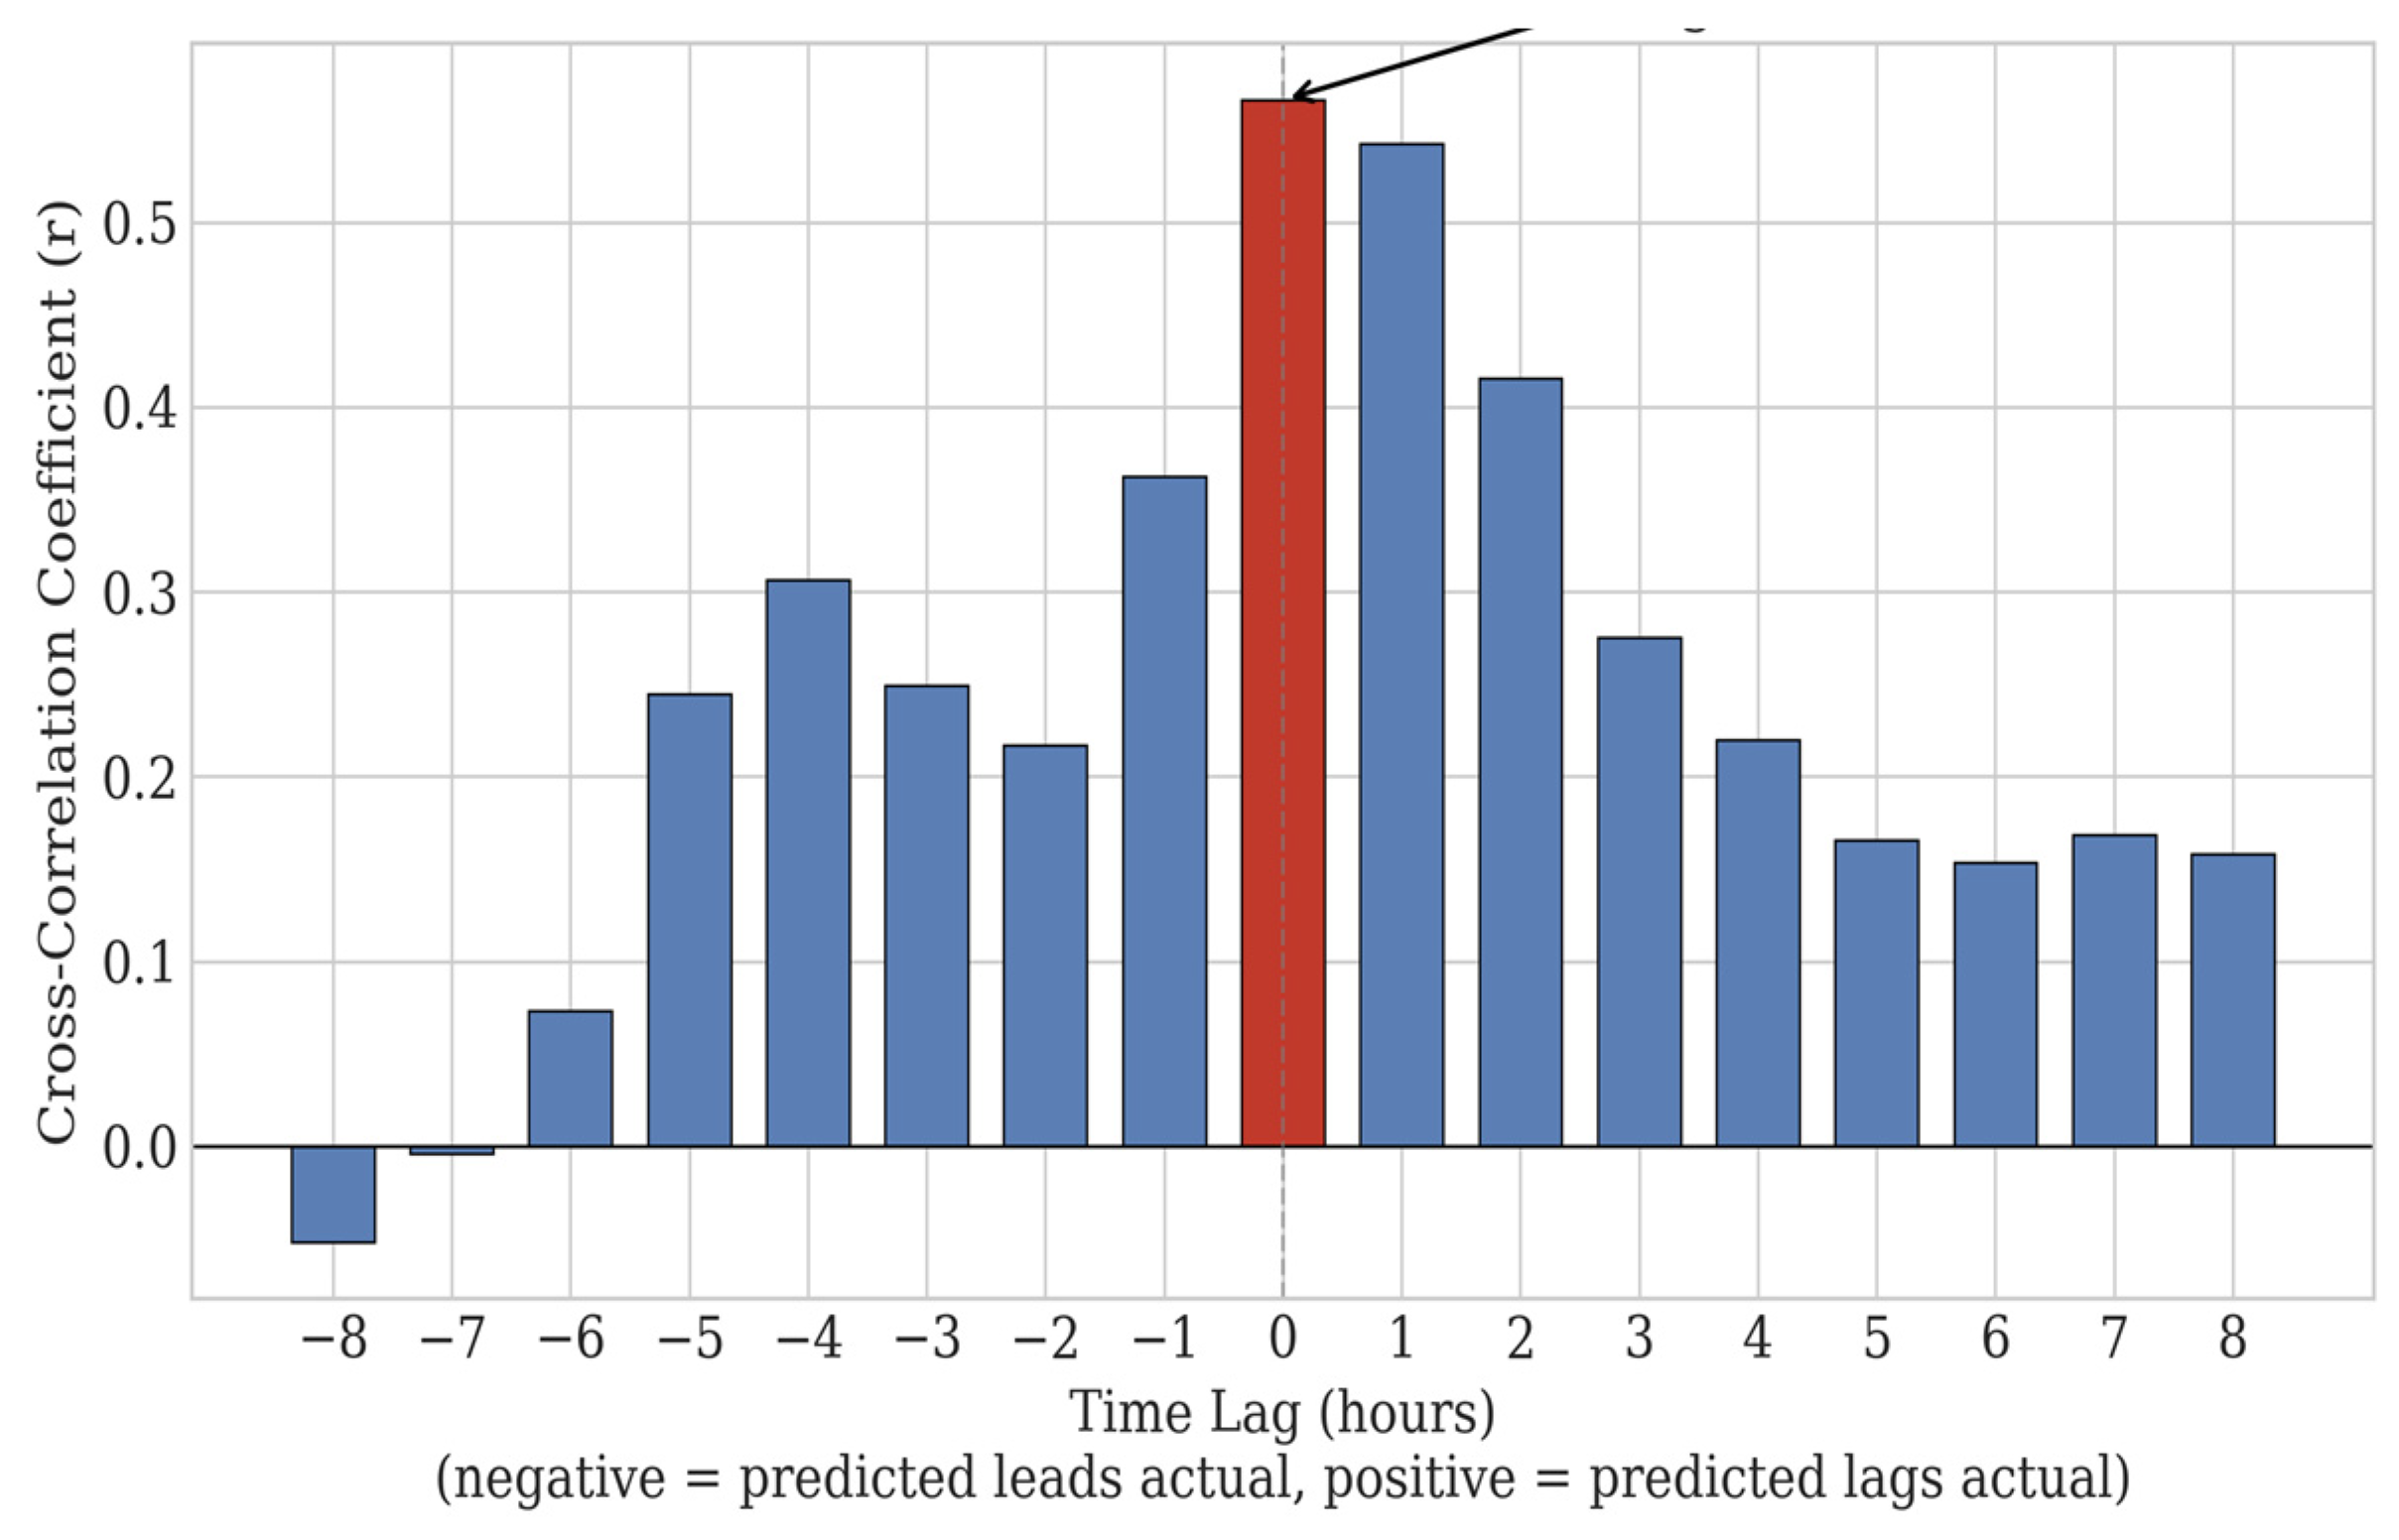
Figure 4.
Cross-correlation analysis between actual and predicted values at different time lags; the maximum correlation occurs exactly at lag zero, which is quantitative evidence of the absence of systematic phase lag in the model output.
To quantitatively prove this claim, a cross-correlation analysis was performed between the actual and predicted time series over the lag range of −8 to +8 h (Figure 3). The results show that the maximum correlation coefficient occurs exactly at lag zero, providing independent quantitative evidence—complementing the visual evidence presented in Figure 4—for the absence of systematic phase lag in the model output. However, this analysis was performed on a sample interval of the test set, and full statistical validation on the entire data set remains a future research direction.
As highlighted by the arrow in Figure 3, the cross-correlation coefficient reaches its maximum value (r = 0.566) precisely at zero-time lag, providing direct quantitative confirmation that the model’s predictions are neither systematically delayed nor advanced relative to the actual load signal.
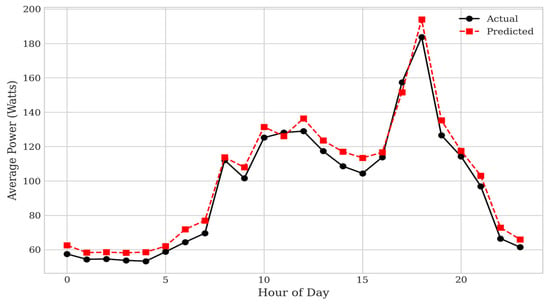
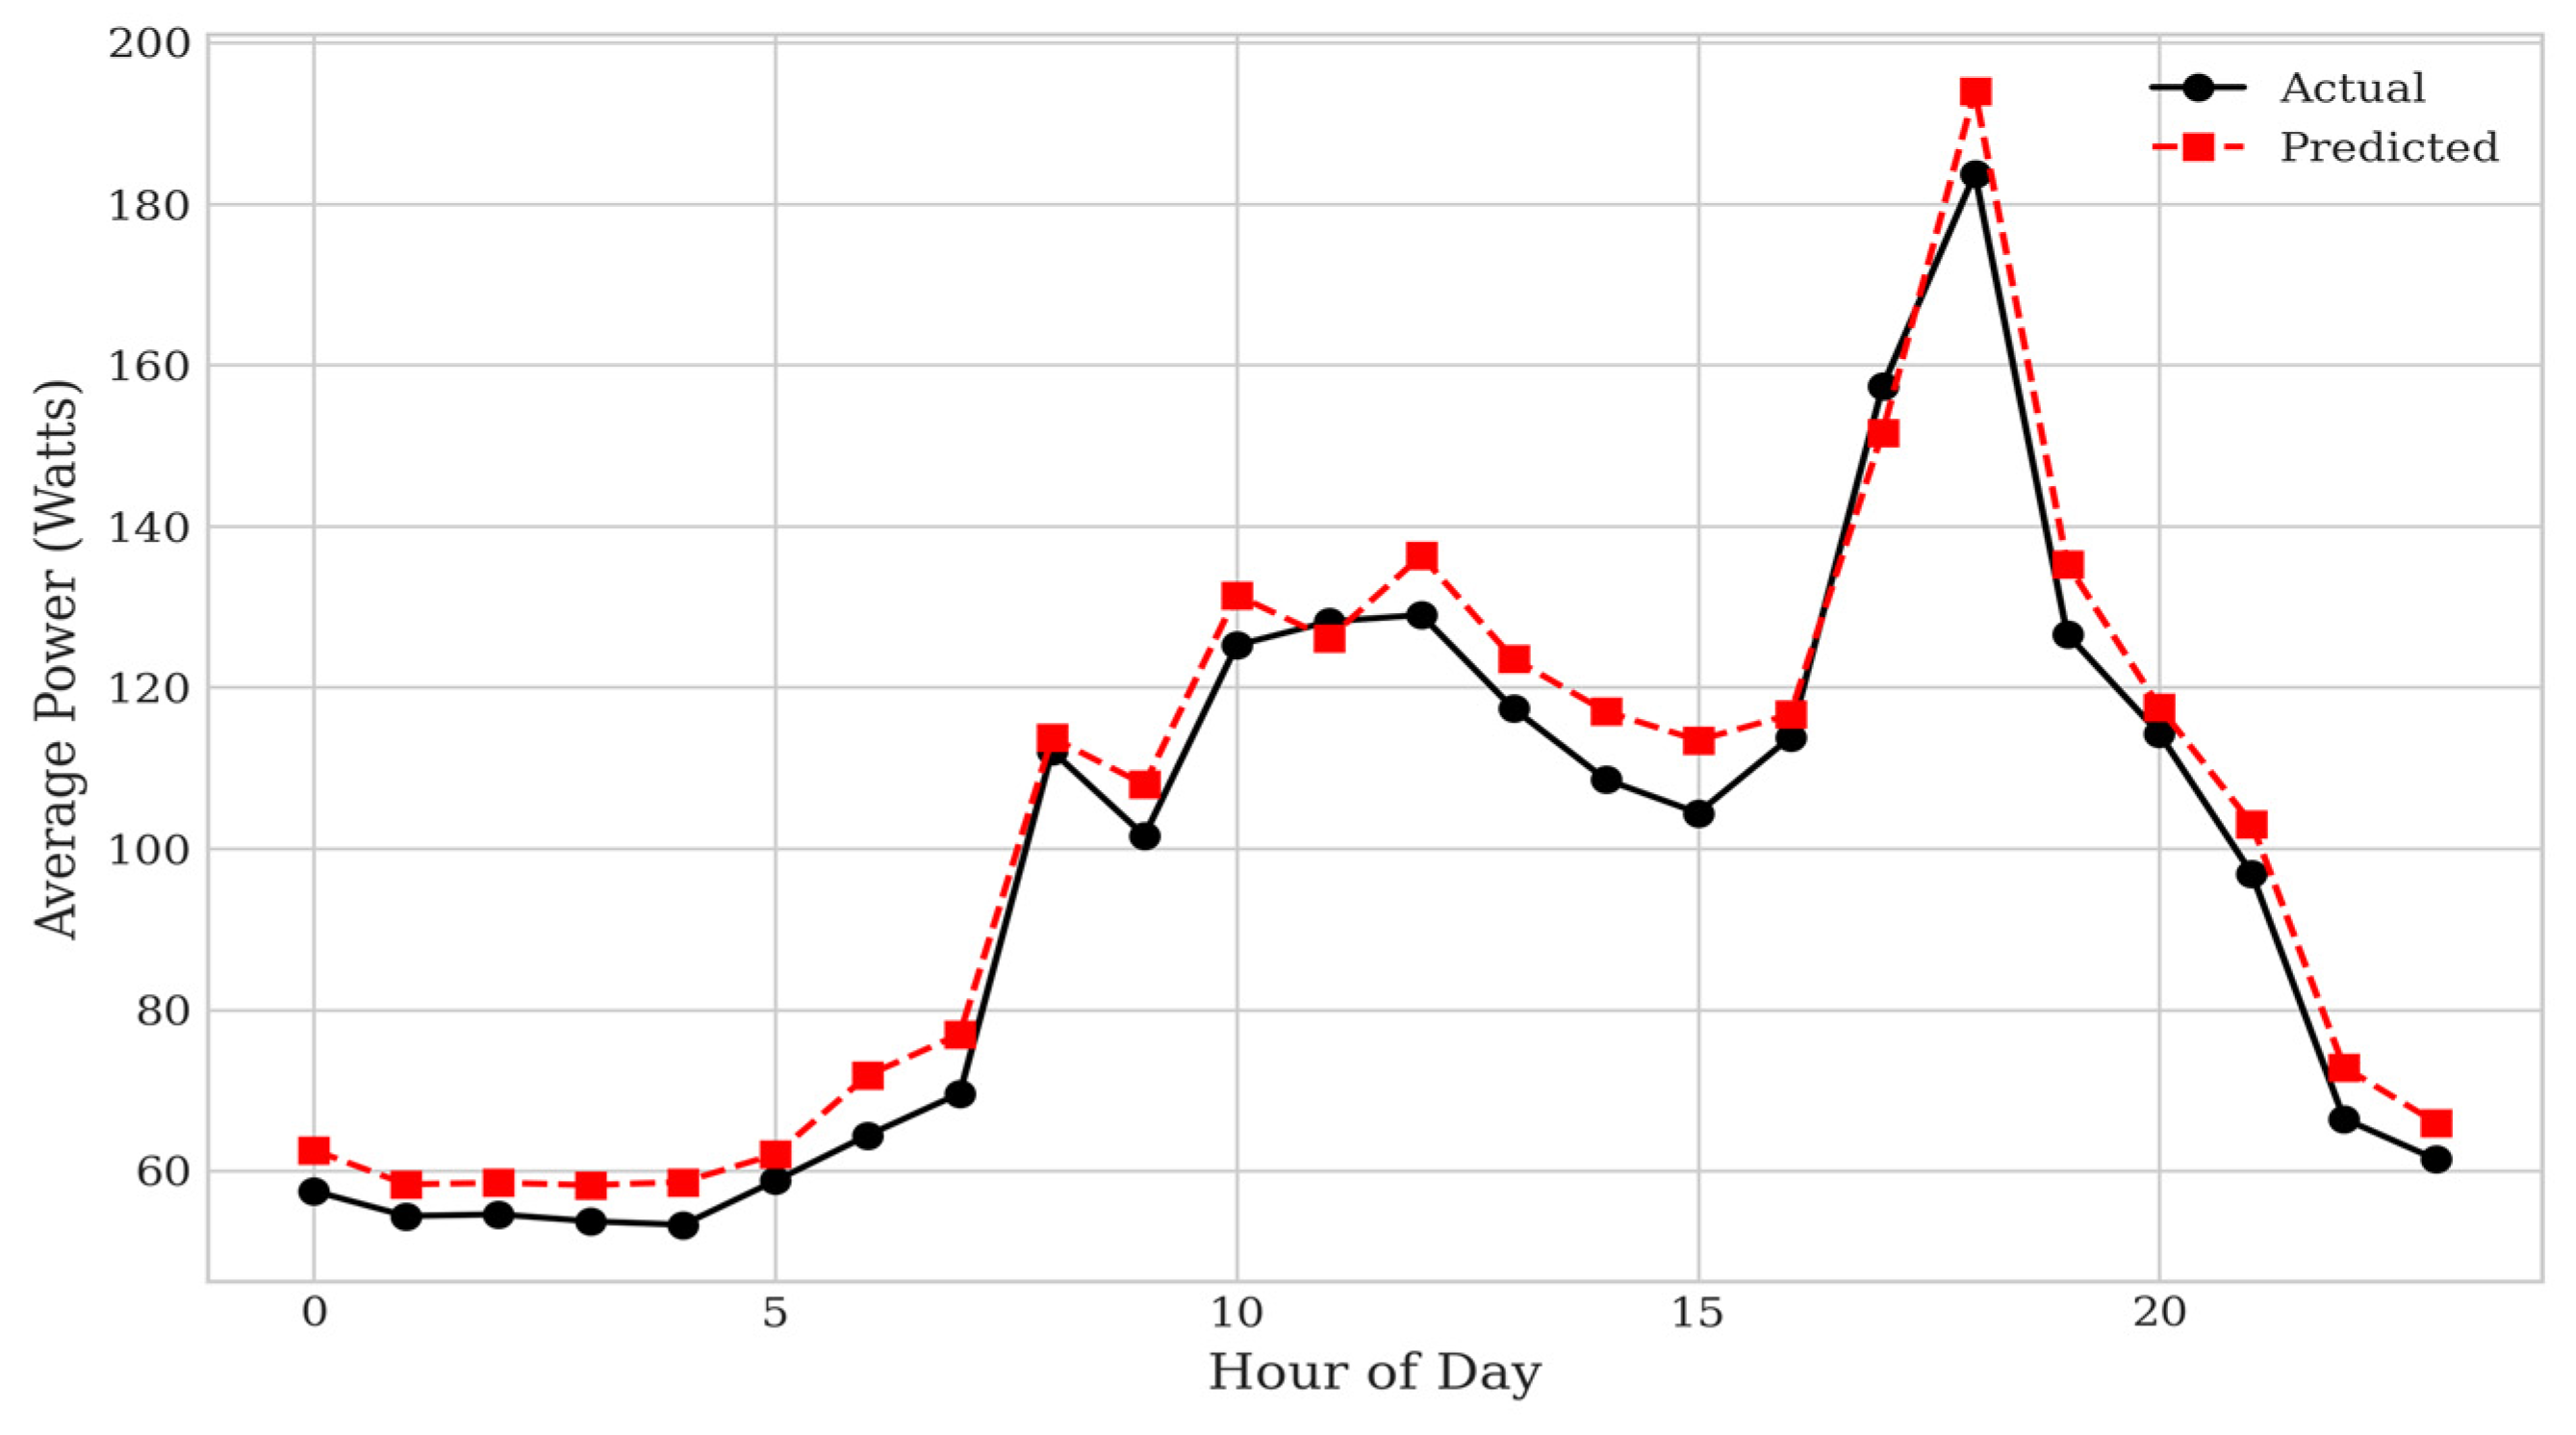
Figure 5, Figure 6 and Figure 7 confirm that the model does capture the overall behavioral physics of the building in the absence of short-term noise, by showing the average profile of the day-to-day loads. The predicted profile is a perfect reflection of the diurnal human activity cycle, and it conclusively demonstrates that the cyclic temporal encodings as well as the multi-head self-attention mechanisms are effective in predicting the evening peak without any structural/computational lag.
Figure 5.
Daily load profile shows the adequate prediction of the evening peak.
Figure 6.
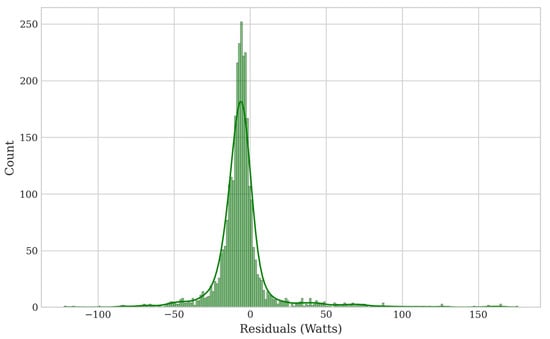
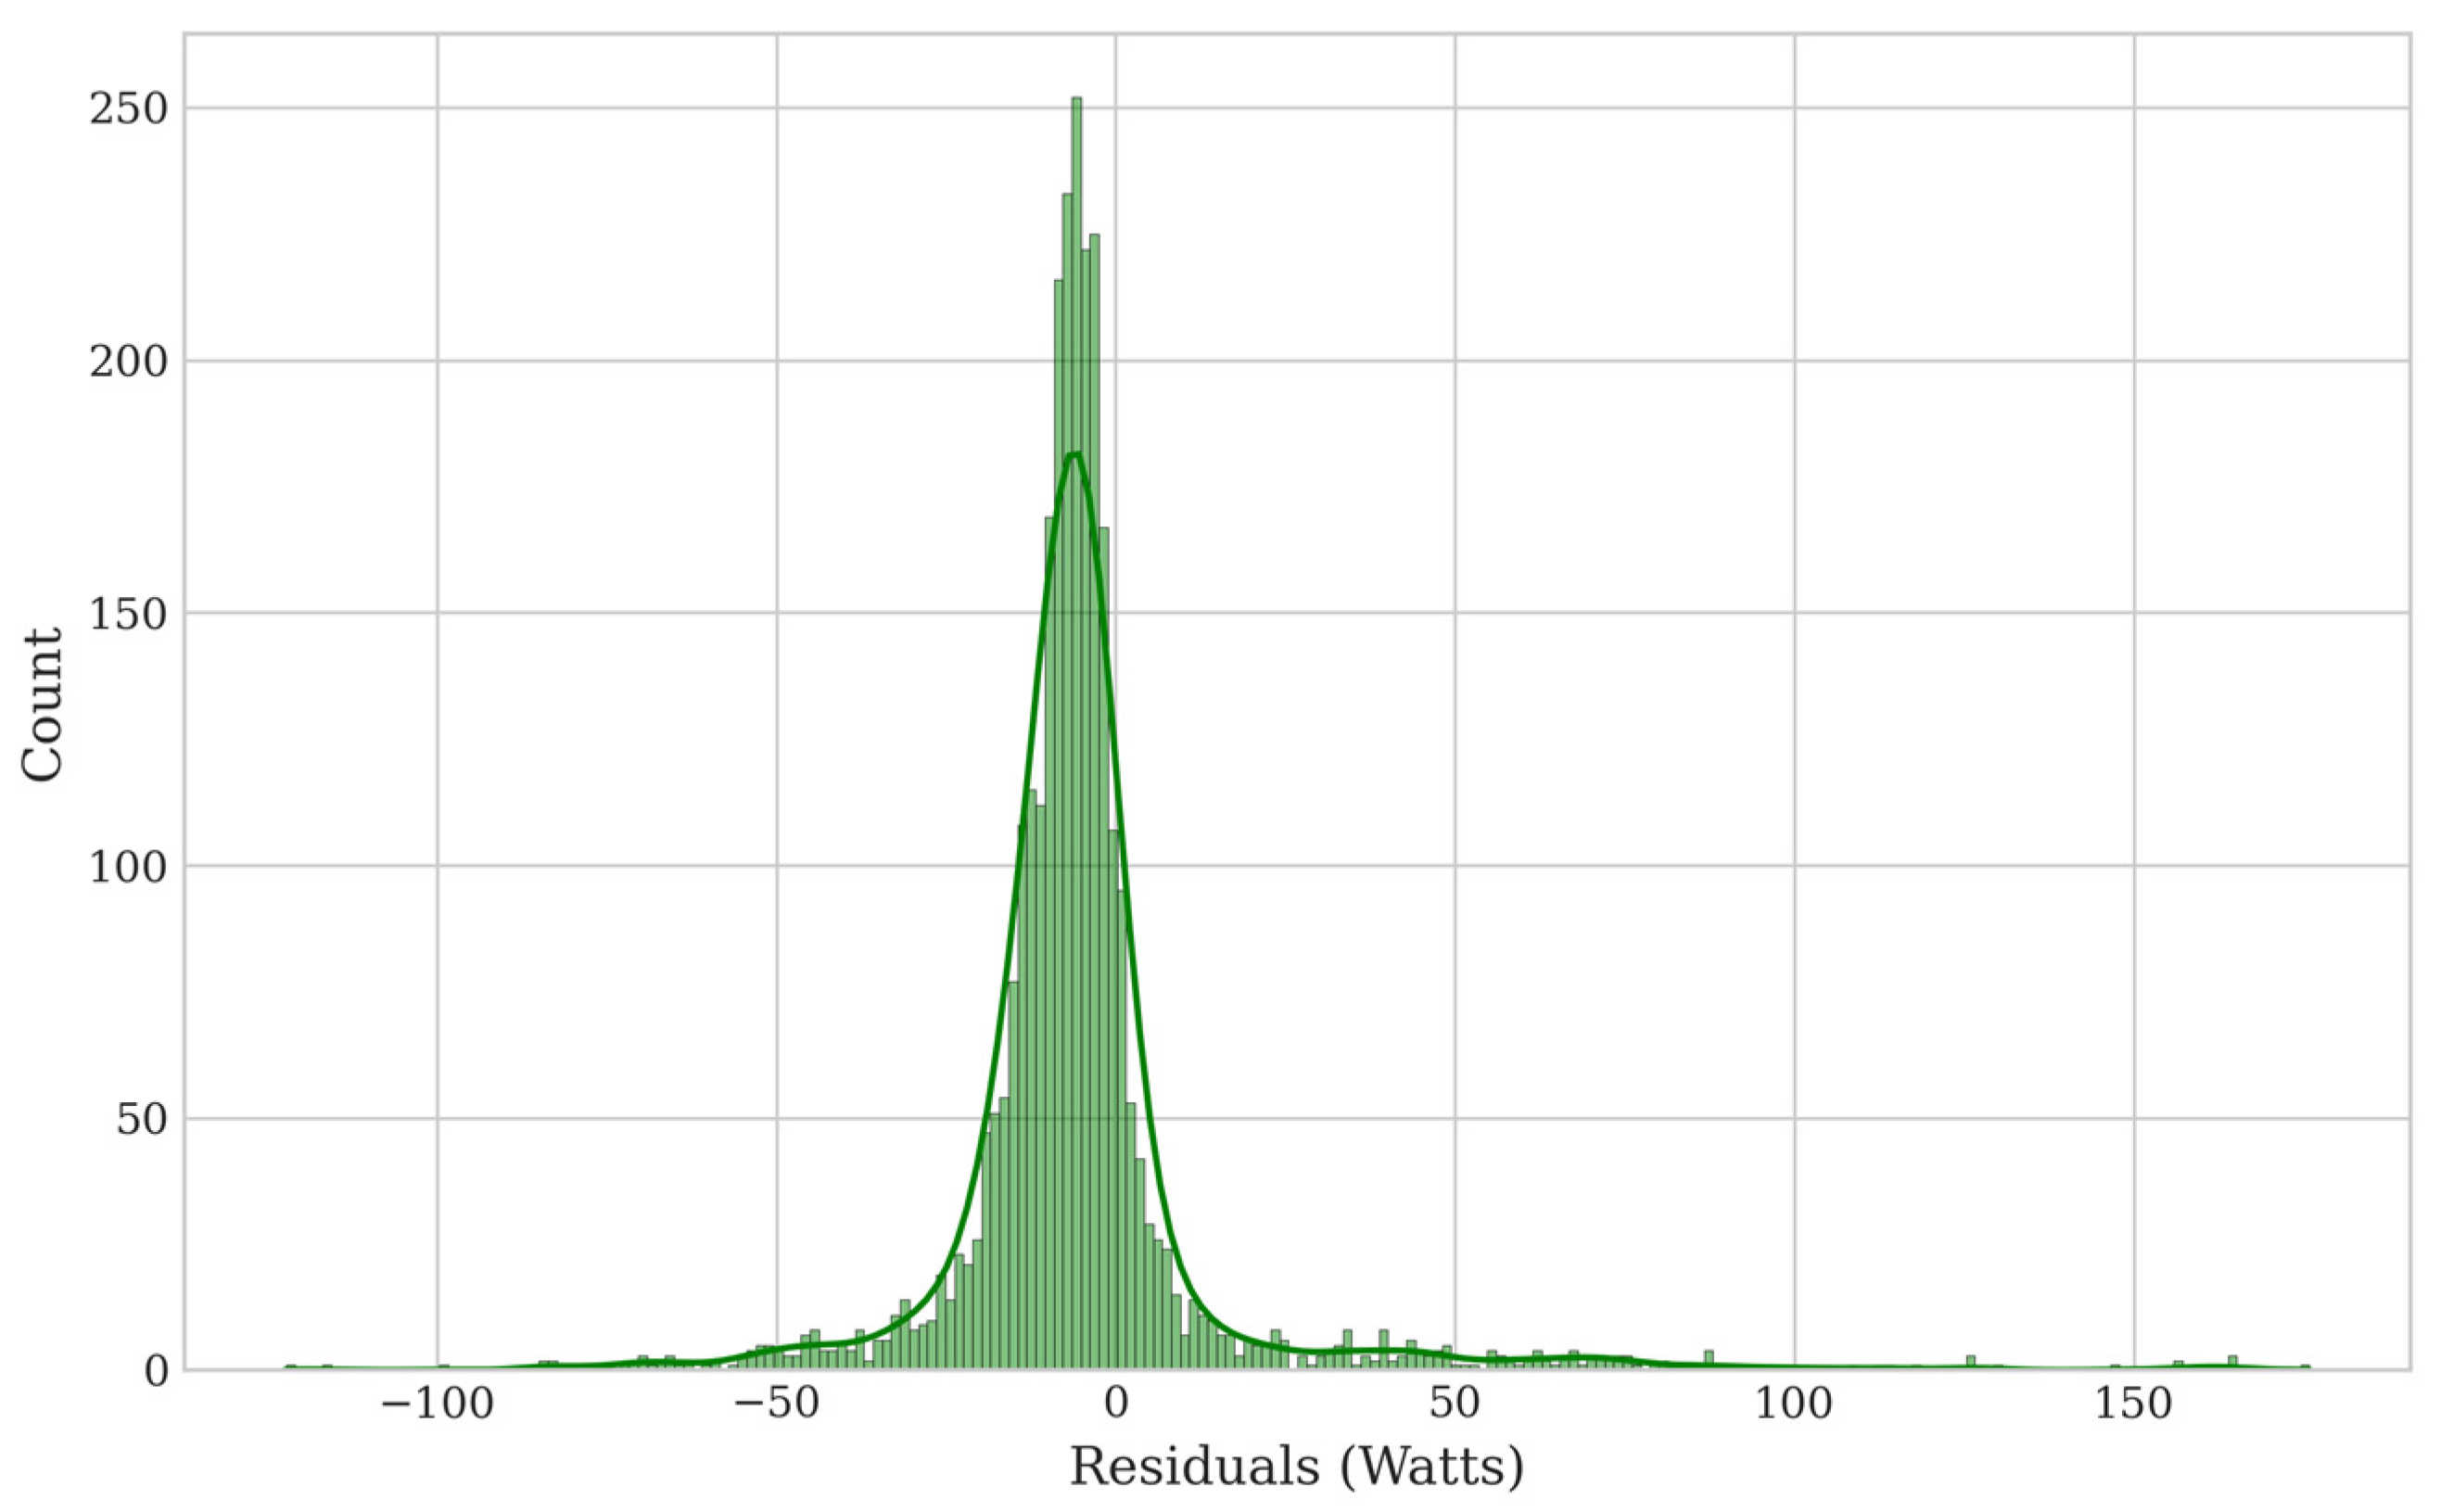
Histogram of error distribution with a symmetrical Gaussian bell curve.
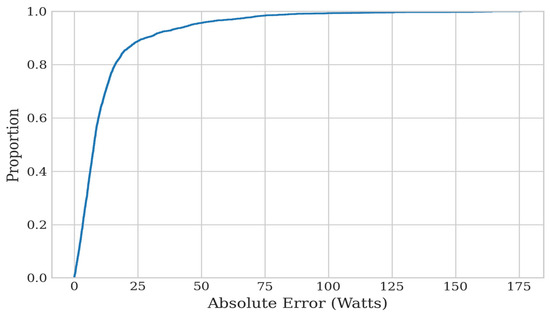
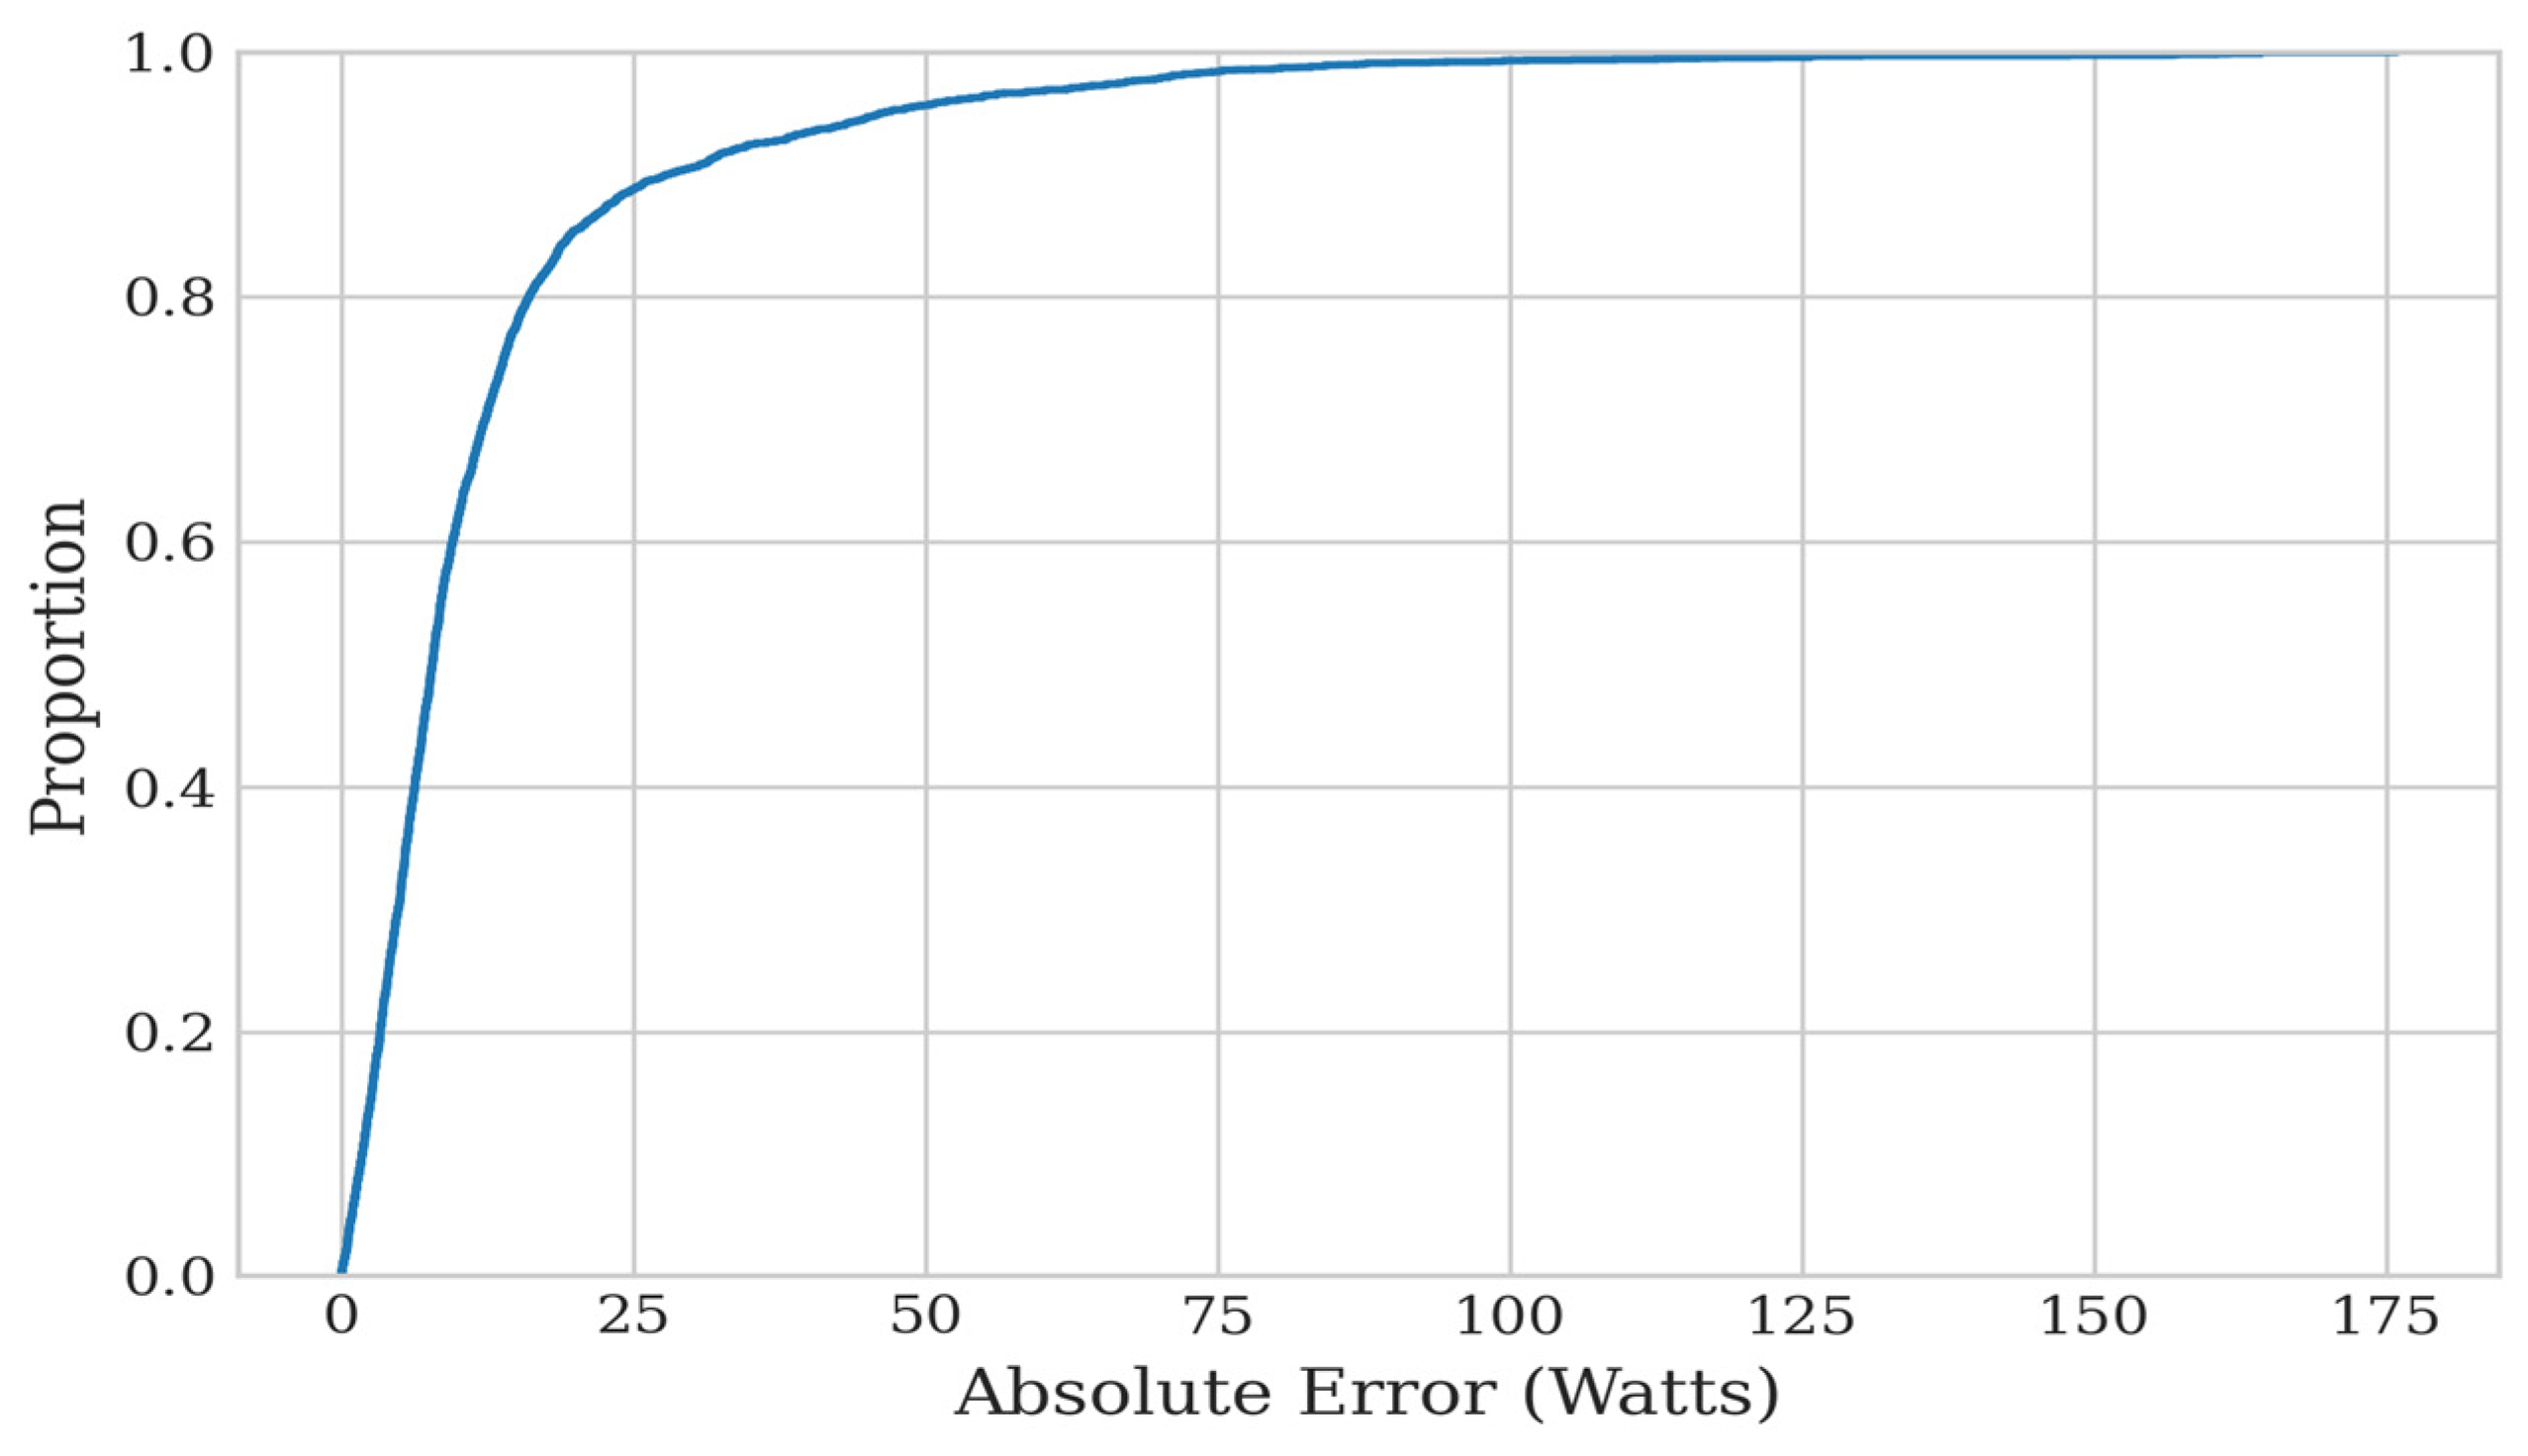
Figure 7.
Cumulative distribution of absolute forecasting error.
4.2. Residual Analytics and Robustness to Stochastic Noise
A systematic residual analysis was undertaken to stringently test the absence of overfitting to the high-frequency stochastic volatility of the household appliances in the architecture [7]. Figure 6 shows the histogram of the errors, which is a symmetric, leptokurtic bell curve with the center at the value of zero.
This validates the fact that there is indeed no systematic mathematical bias and the rest of the forecasting errors are just random. Figure 7 above is a further quantification of this precision using the Cumulative Distribution Function, showing that more than eighty percent of the absolute forecasting errors lie within a very small and very acceptable tolerance margin.
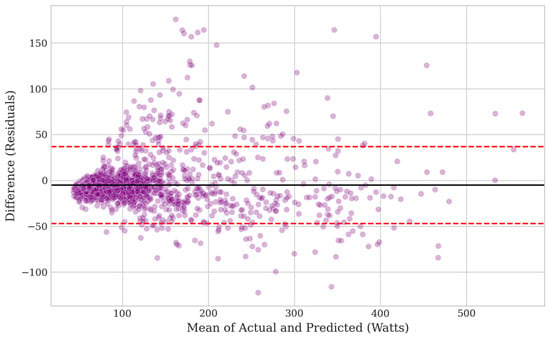
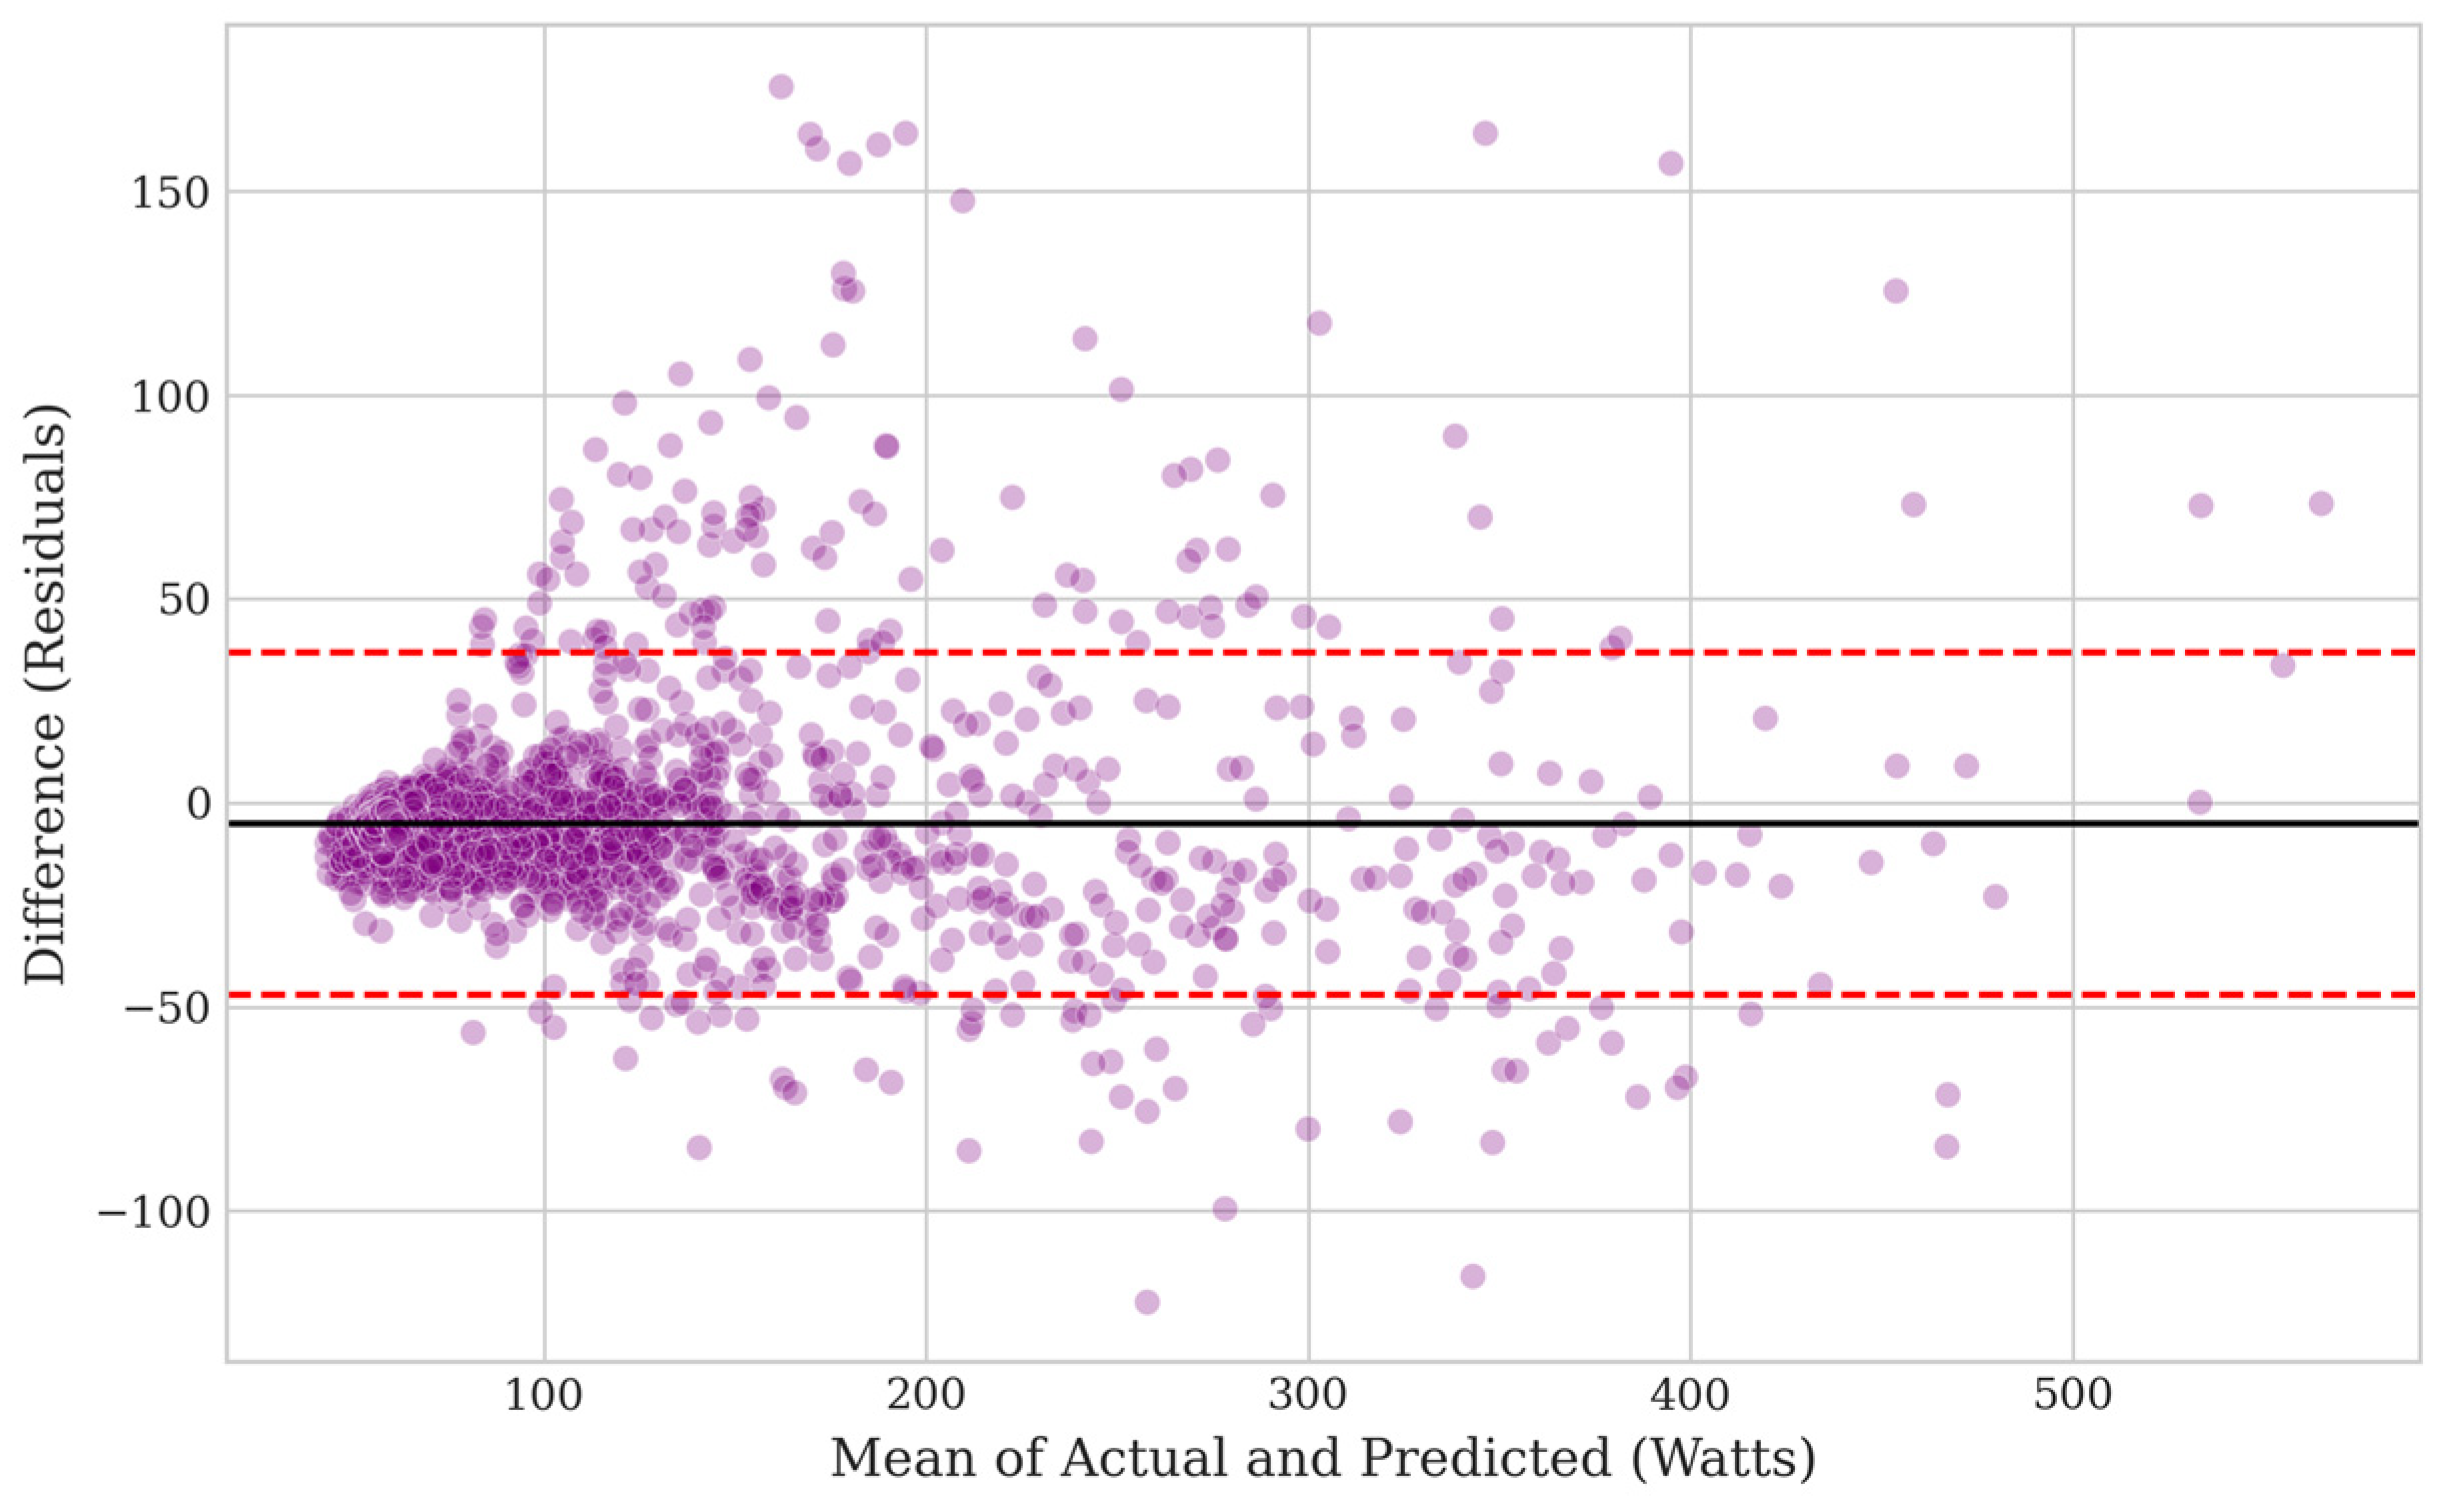
To explore the possibility of heteroscedasticity and instability of the variances under varying power levels, a Bland–Altman analysis was conducted, as shown in Figure 8.
Figure 8.
Bland–Altman analysis of predictive stability.
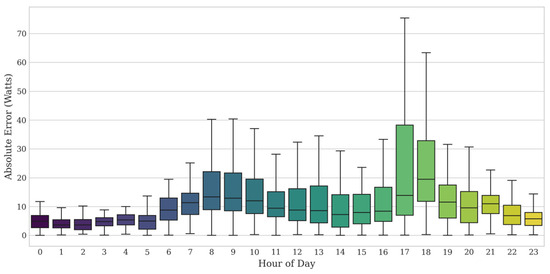
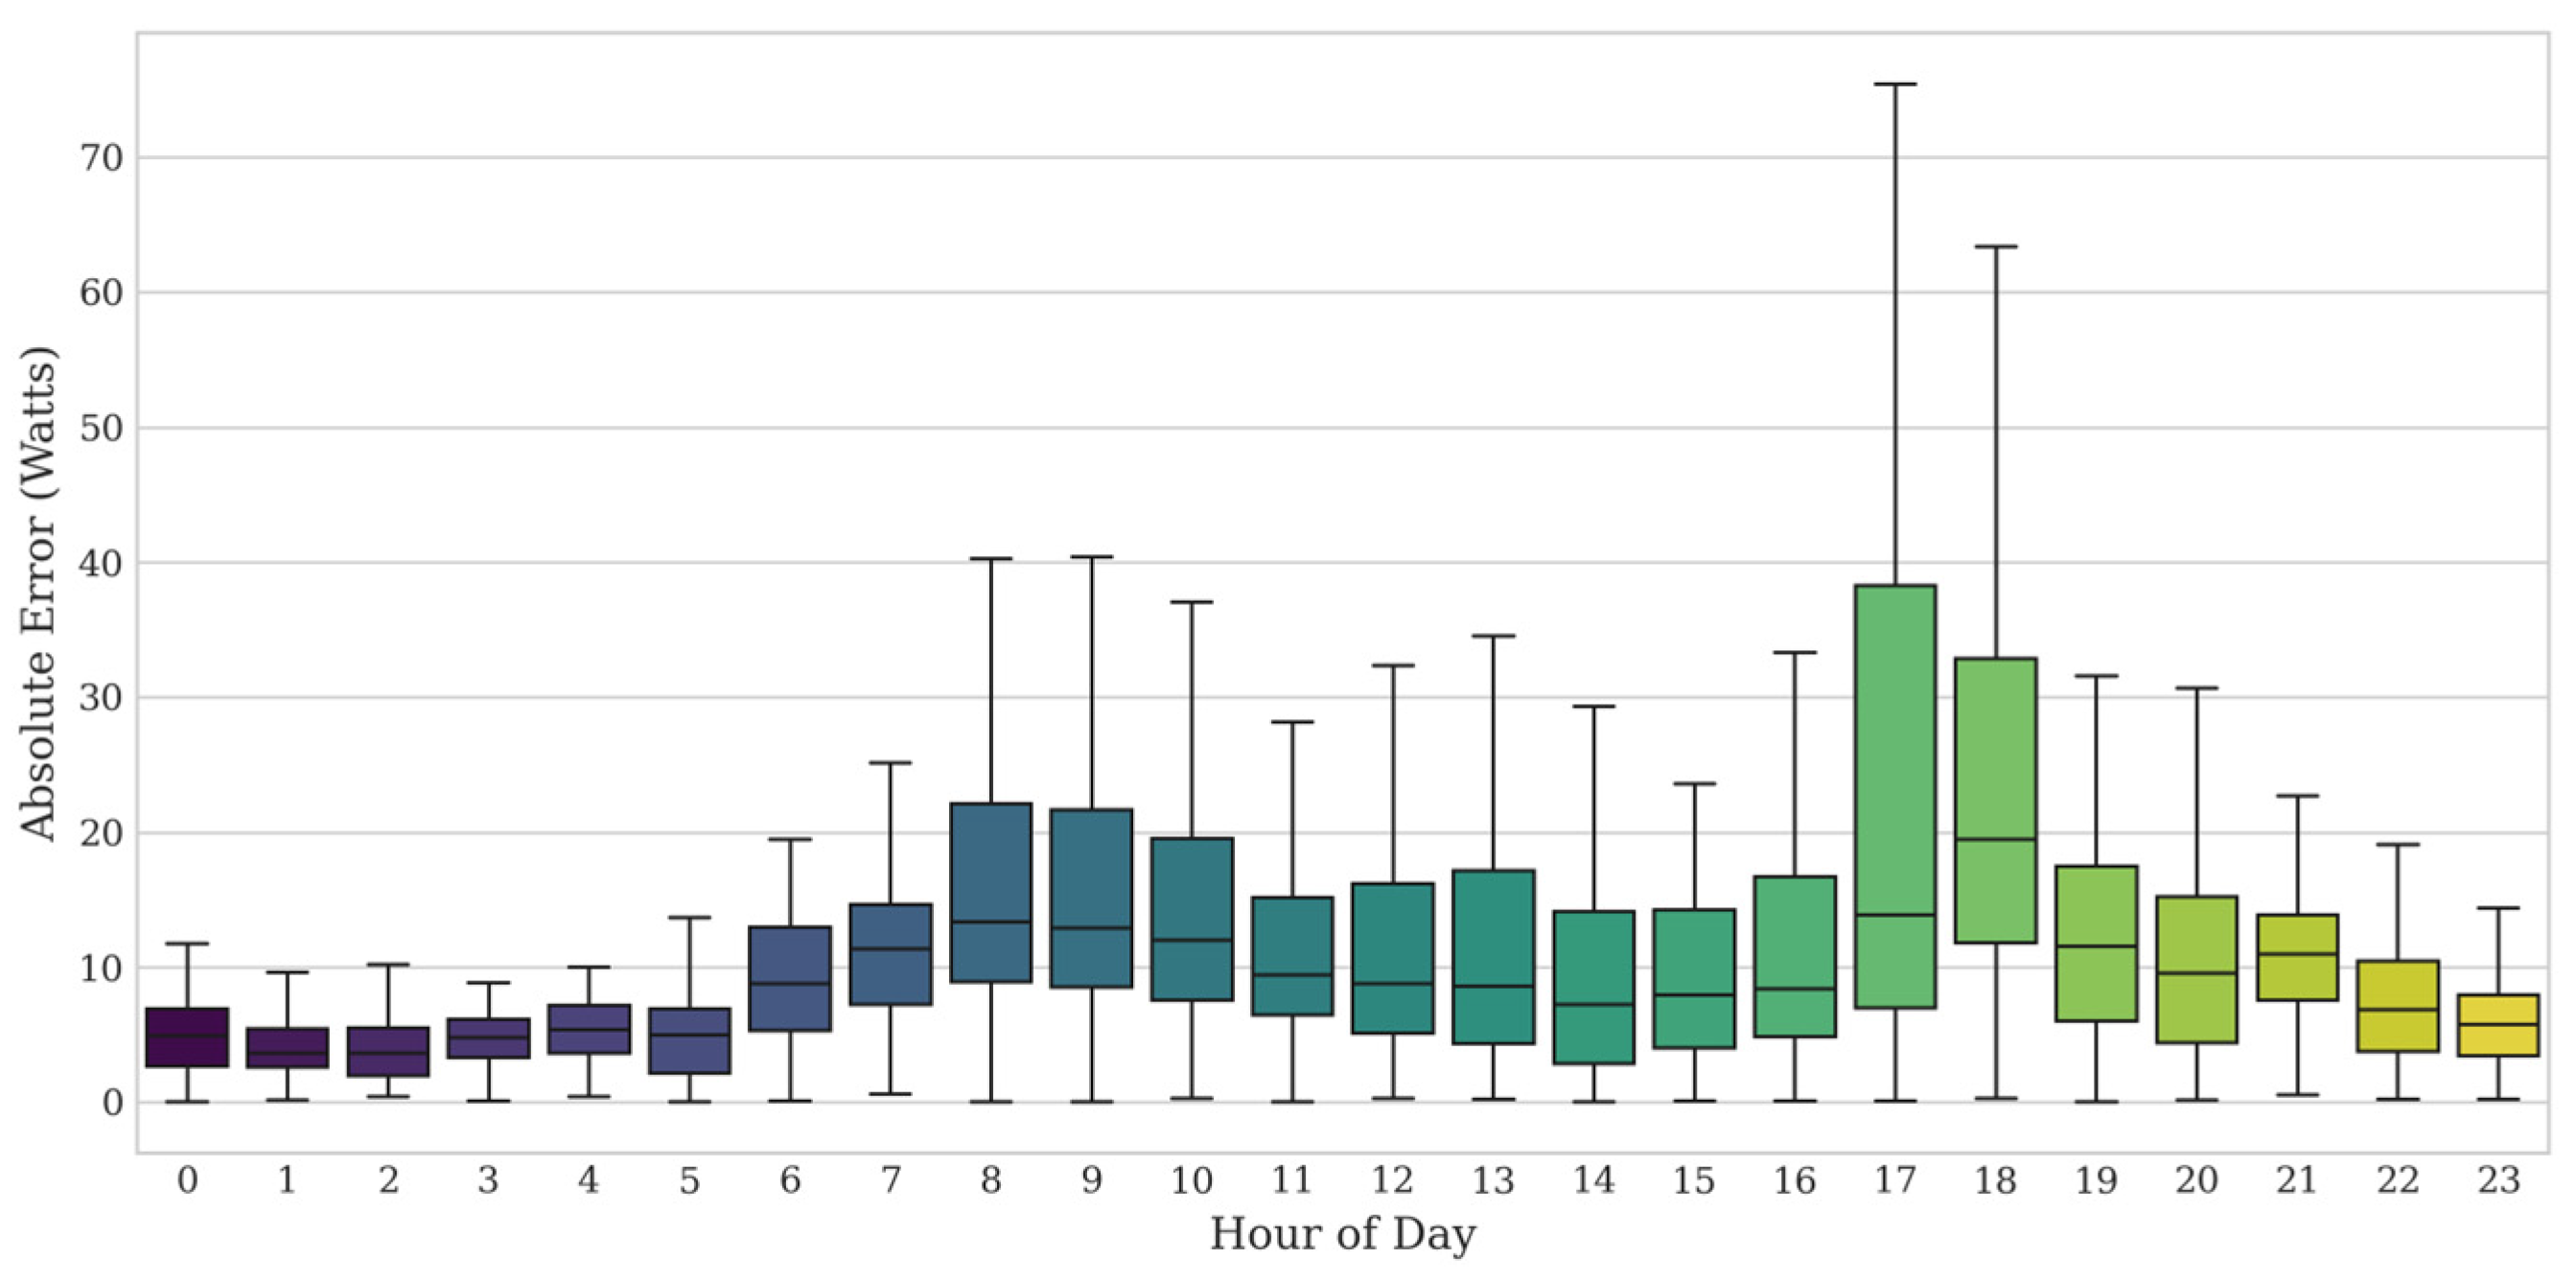
The resultant scatter plot shows that there is a large majority of operational residuals that are tightly contained within the 95 percent limits of agreement, which suggests that predictive stability is consistently uniform, irrespective of the magnitude of the base load. Moreover, the hourly error variance investigated through the boxplots presented in Figure 9 reveals that the absolute error range increases slightly during the evening peak hours, while the median error remains remarkably low and well controlled. The empirical validation of this phenomenon can be attributed to the fact that the one-dimensional convolutional layers, which serve as the main feature extractors, are robust in noise-filtering [7].
Figure 9.
Hourly error variance boxplots empirically support the soundness of the noise-filtering ability.
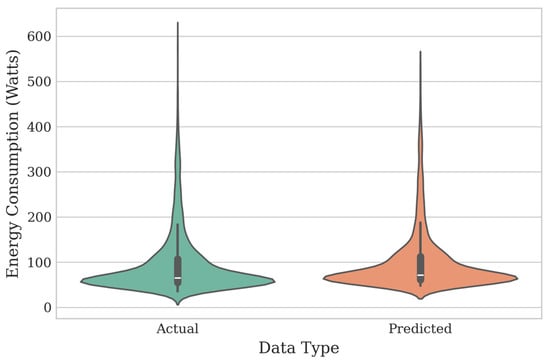
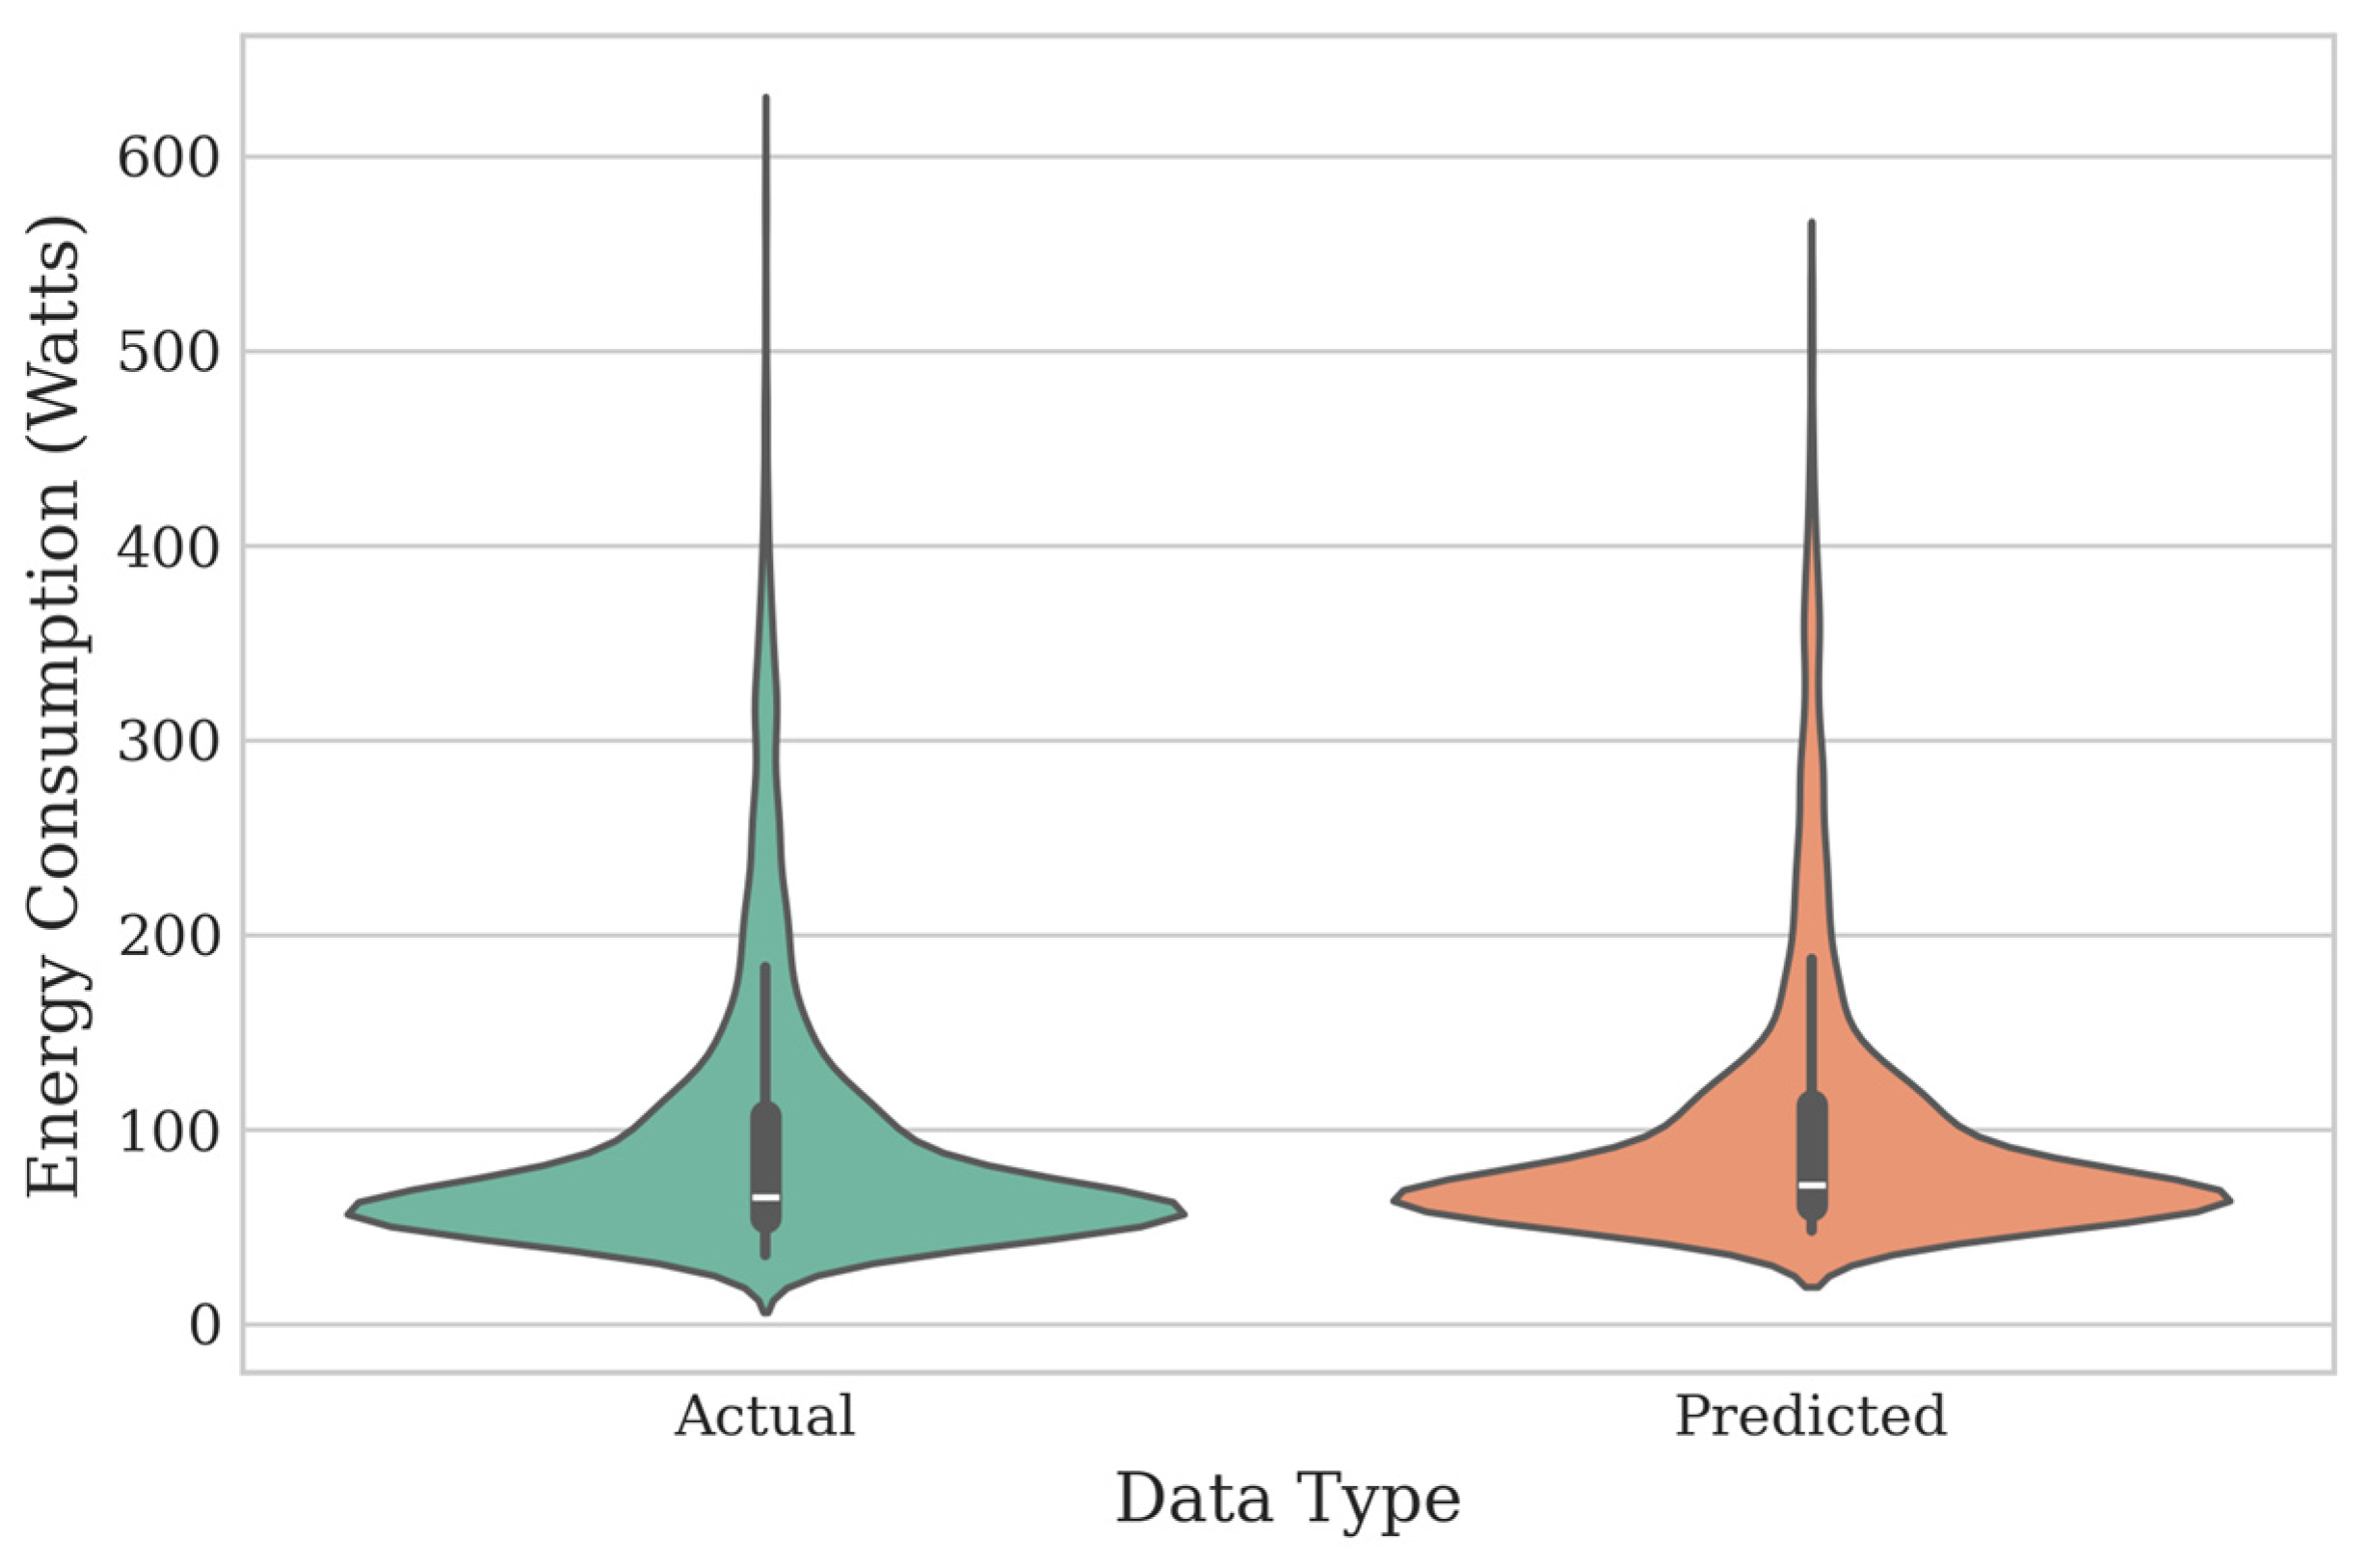
In addition to the common regression measures, the eventual utility of a forecasting model in a modern smart grid is greatly dependent on the ability of the model to correctly classify and predict high-energy conditions so as to optimize the proactive response to demand [5]. Figure 10 shows a comparison of the violin plot of the actual and predicted energy values of the structural probability distributions.
Figure 10.
Comparative plot of violin detailing the structural probability distribution of the energy value.
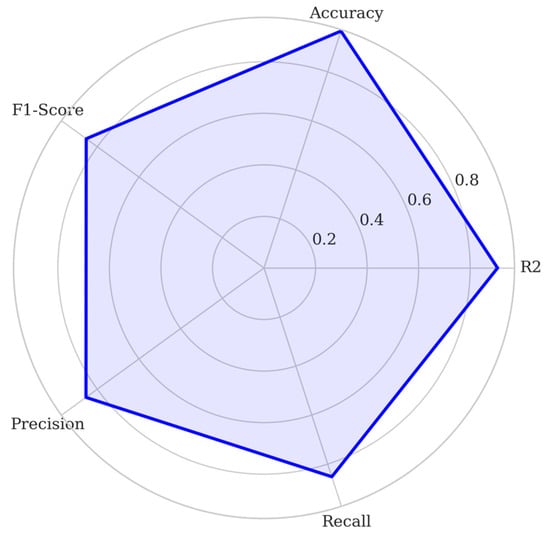
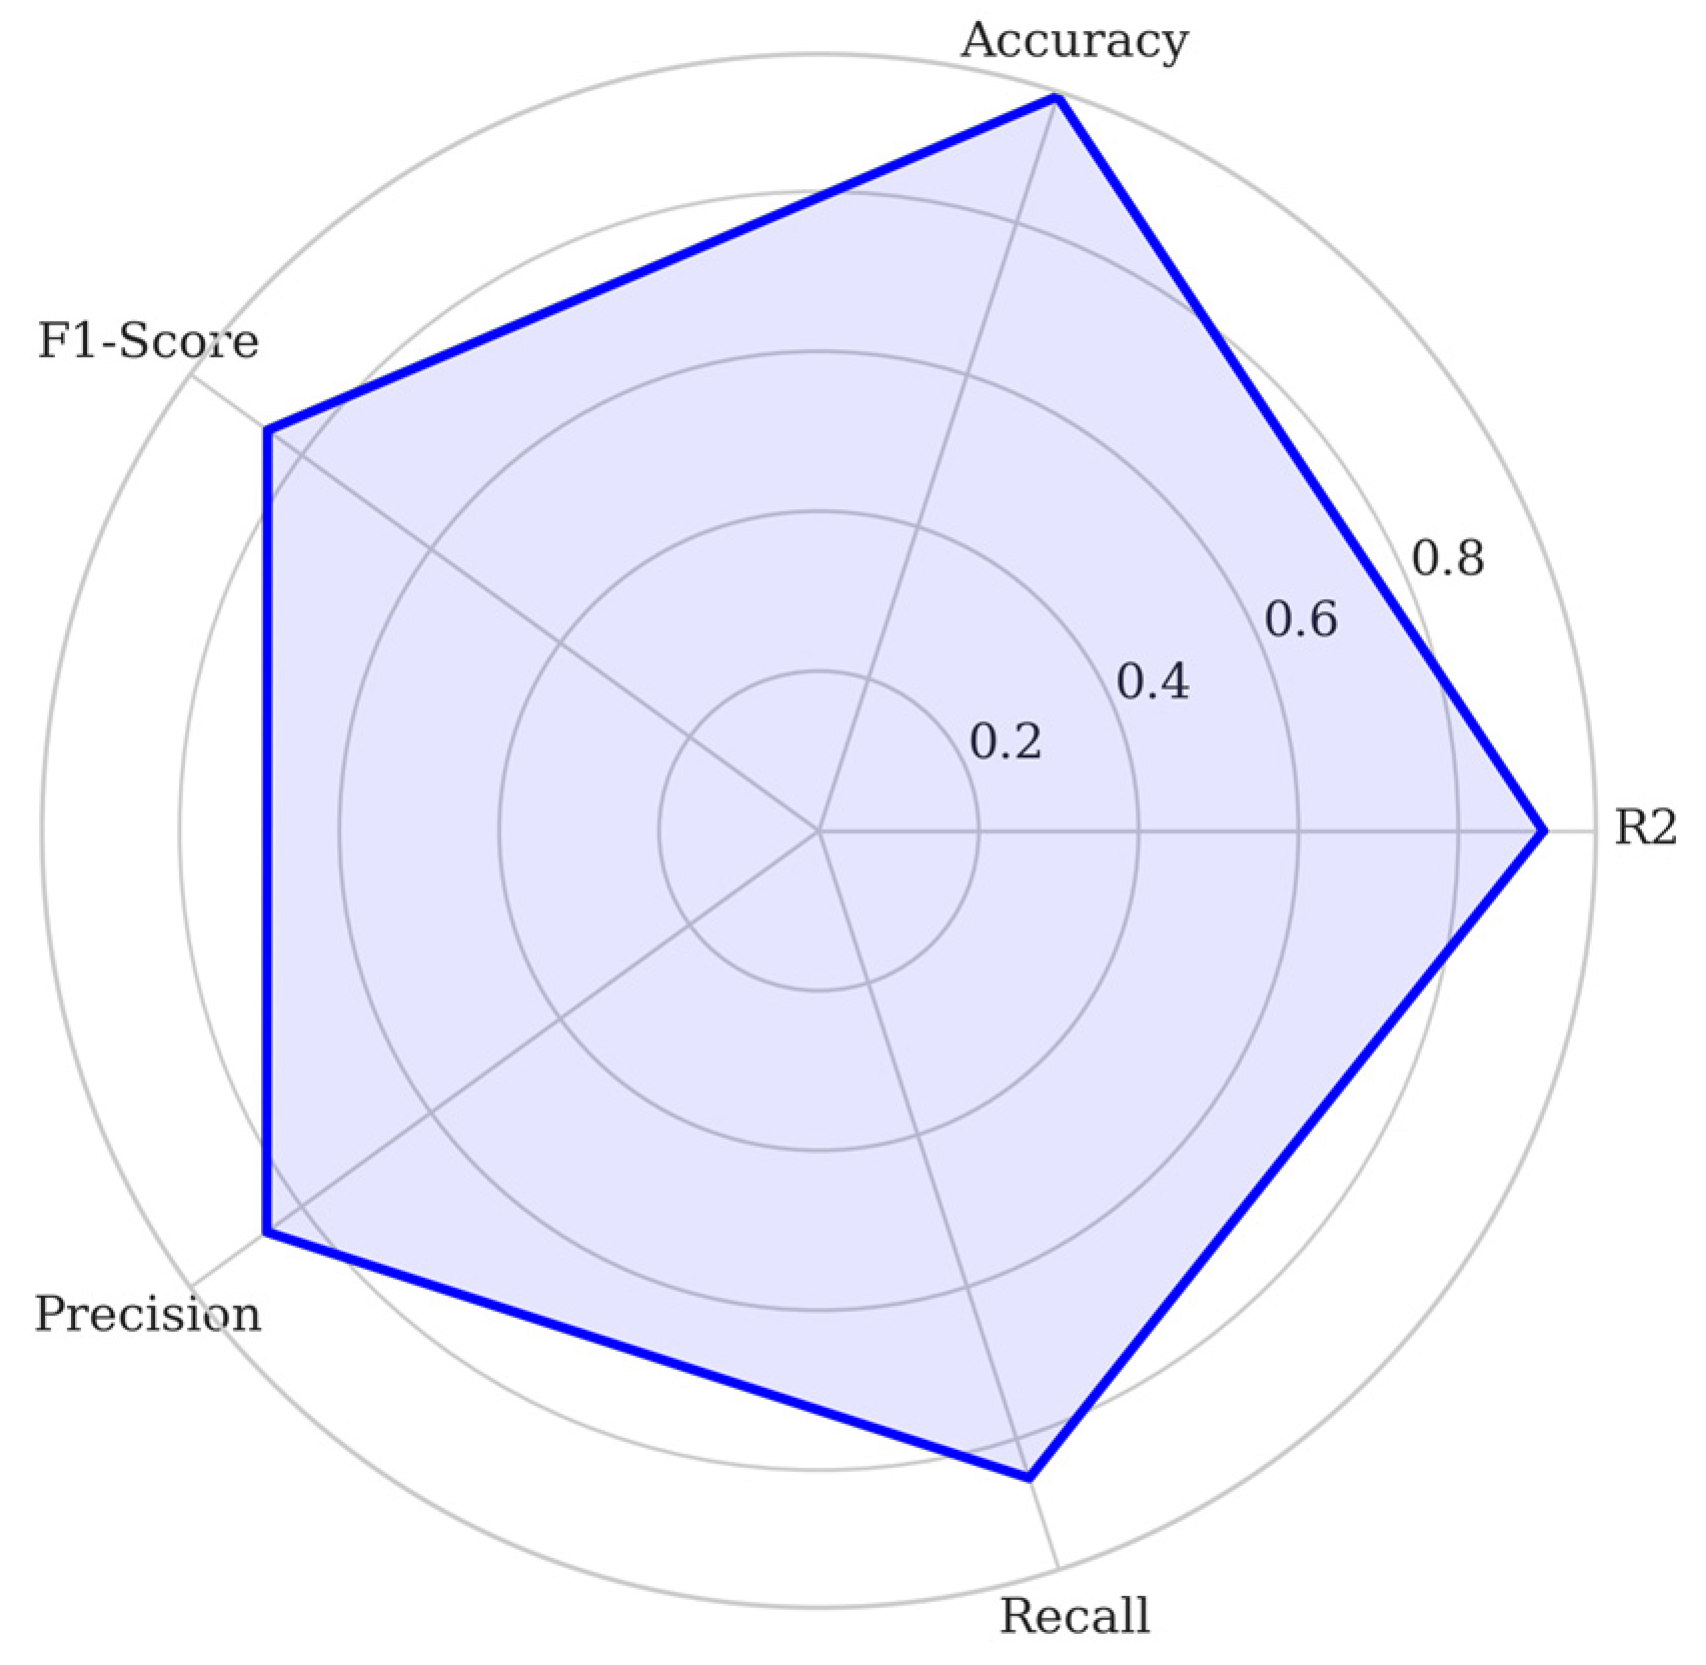
The two distributions are geometrically symmetric and morphologically identical, which confirms the network optimally represents the underlying statistical physics of the residential load as opposed to the loss-minimizing property of optimal representations of smooth average values. Lastly, the holistic classification performance of critical peak state detection is beautifully synthesized in the radar chart indicated in Figure 11.
Figure 11.
Radar chart of the holistic classification performance of critical peak state detection.
The Robust-RAN model demonstrated a balanced performance across the adopted evaluation metrics, achieving an accuracy of 96.63% and a robust F1-score of 0.8529. This consistent improvement in accuracy, recall, and overall performance clearly demonstrates that the residual-attention framework is capable of effectively mitigating temporal latency vulnerabilities and indicates its potential applicability for residential demand-response studies for performing preventive peak-shaving interventions.
To address the evaluation transparency regarding classification metrics, the peak state detection was formulated by treating power values exceeding a threshold equal to the mean plus one standard deviation of the observed load in the test set as positive (peak) classes. The evaluation framework computes the True Positives (TPs), False Positives (FPs), True Negatives (TNs), and False Negatives (FNs) to derive precision, recall, and F1-score. Specifically, the model achieved a precision of and a recall of , culminating in a balanced F1-score of and an overall classification accuracy of , thereby confirming that the high performance is robust across both majority and minority (peak) classes without classification bias.
4.3. Fairness of Comparison and Scope of Prediction Target
One of the fundamental differences between this study and many previous studies in the field of short-term electric load forecasting is the definition of the target variable. While most of the reference studies, including the studies by Kong et al. [1], Sehovac and Grolinger [5], and Chen et al. [7], focus on the direct prediction of raw instantaneous power (raw load), in the present study the target of forecasting is the energy consumption trend (load trend) extracted through the causal moving average. This difference is a conscious choice in the model design and was not adopted with the aim of artificially simplifying the forecasting problem.
Electricity consumption in residential buildings is strongly affected by random user behaviors, sudden switching on and off of electrical equipment, and other short-term fluctuations. These fluctuations are random in nature, and a significant number of them are unpredictable in practice. From the perspective of smart grid operation, complete reconstruction of these instantaneous changes is not always necessary; rather, what is more important for load management, load response, consumption scheduling, and peak control is the overall and reliable trend of energy consumption.
Accordingly, the use of the causal moving average filter in this study should not be considered as a method to artificially increase the accuracy of the model, but rather this step is done to extract the predictable component of the load and reduce the impact of random fluctuations. Also, since only the current and past samples are used in calculating the trend and no information from the future is entered into the forecasting process, the causal structure of the problem is fully preserved, and the proposed method has the potential to be used in online forecasting systems (Real-Time Forecasting).
Therefore, the results presented in this study should be interpreted in the context of “consumption trend forecasting” and not as a direct replacement for raw instantaneous power forecasting. The comparison with existing methods aims to demonstrate the ability of the proposed architecture to model consumption trends and increase forecast stability, and no claim of absolute superiority over methods that solve a different problem is made.
Finally, the reduction in the model’s sensitivity to noise and the improvement of the forecast’s temporal stability are the result of the interaction of two main components of the proposed framework: first, the definition of the forecasting goal based on consumption trends, and second, the use of a residual network-based architecture and a multi-series attention mechanism. Therefore, the most important achievement of this research is to provide a stable and reliable forecasting framework for energy management and decision-making applications in smart grids, not to reconstruct all the random fluctuations present in the raw signal.
Although the experimental results show that the proposed architecture performs well in predicting consumption trends, this study was designed to evaluate the performance of the entire framework, and the quantitative contribution of each architectural component was not investigated separately. Therefore, the presented results should be interpreted as the performance of an integrated framework and not the independent effect of each component.
4.4. Practical Deployment Considerations
From an application perspective, the proposed framework can be used as a core for load forecasting in home energy management systems, smart grids, and load response applications. In such systems, the model can periodically forecast short-term load using data received from smart meters (Smart Meter Model AMI-250 (GE Energy, Boston, MA, USA)) and environmental sensors and provide the results to decision support systems for equipment scheduling, load management, and energy consumption optimization.
In terms of computational requirements, model training is usually performed on GPU-equipped computers due to the parameter optimization process. However, after training, the inference step only involves a single forward pass through the network and requires much less computational resources. Therefore, the model can be run on local servers, Edge Computing systems, or industrial computers connected to the smart metering infrastructure. This feature allows the model to be used in time-constrained energy monitoring and management systems, although evaluating its performance on embedded hardware and real operating environments is considered a topic for future research.
4.5. Broader Literature Context and Comparative Discussion
The findings of this study can be critically discussed alongside several recent studies (2023–2024) that have used attention mechanisms and residual connections in the field of short-term residential load forecasting. Feng et al. presented a hybrid network based on attention graph and temporal convolution for residential load forecasting that models multi-level dependencies between multiple load series, but unlike the current framework, it focuses on integrating spatiotemporal information across users rather than reducing phase delay [11]. Similarly, Li et al. proposed a hybrid LSTM-TCN architecture equipped with residual connections and an attention mechanism for load forecasting in integrated energy systems, which, like the current framework, uses residual connections to stabilize training, but its main goal is to reduce the mean percentage error and does not directly address the phase delay phenomenon [12]. In another study, Zhao et al. introduced a spatiotemporal attention-based transformer network for multivariate residential load forecasting, showing that attention mechanisms can model long-range dependencies without the sequential processing limitations of recurrent networks, a result that is consistent with the main motivation for using multi-head attention in the Robust-RAN architecture to overcome the phase delay of recurrent networks [13]. Also, focusing on spatial-temporal attention in LSTM networks, Cao et al. showed that dynamically weighting closer time intervals can improve the accuracy of residential load forecasting, a complementary approach that provides another perspective for the design of the attention layer in the present framework [14]. These comparisons show that although the attention mechanism and residual connections have been separately employed in the recent literature, the purposeful combination of these two components to simultaneously address phase delay and sensitivity to random noise—which is the main focus of this research—remains underexplored.
4.6. Advantages and Disadvantages of the Proposed Approach
The proposed Robust-RAN method has several distinct advantages over previous approaches. First, the purposeful combination of a causal denoising filter, residual connections, and multi-head attention mechanism simultaneously targets two major challenges in the existing literature—sensitivity to random noise and phase delay—while most previous studies (Table 1) have only addressed one of these two problems. Second, the “Temporal Residual Bridge” architecture, by preserving the raw output of LSTM alongside the attention output, enables peak event detection without losing sequential information, resulting in a peak detection accuracy of 96.63% and an F1-score of 0.8529. Third, the causal structure of the smoothing filter maintains the model’s compatibility with online (real-time) forecasting systems without using future information. Finally, the computational simplicity of the inference step (one pass forward) allows the model to be deployed on edge computing infrastructures.
On the other hand, this approach also has limitations. The most important of these is the lack of an independent ablation study to measure the exact contribution of each architectural component (smoothing filter, residual block, attention mechanism, and cyclic time coding), which is discussed in detail in Section 5.3. Also, the model evaluation was performed on only one dataset (UCI Appliances Energy), and its generalizability to different climatic and behavioral conditions has not yet been empirically tested. Furthermore, since the target of the forecast is the smoothed consumption trend and not the raw instantaneous signal, this method is not suitable for applications that require accurate reconstruction of instantaneous fluctuations (unlike load management and demand-response applications).
From a comparative perspective, the main advantage of this research over previous studies lies in the integrated architectural design: while Kong et al. [1] and Sehovac and Grolinger [5] mainly focused on improving regression accuracy without explicitly considering phase lag, and Chen et al. [7] targeted training stability without addressing the prediction goal, the present framework addresses both challenges simultaneously and in a multi-criteria evaluation framework by redefining the problem (from raw signal prediction to trend prediction) and designing interactions between architectural components.
5. Conclusions and Future Directions
This study addressed the enduring challenge of stochastic volatility in residential Short-Term Load Forecasting. We argued that conventional methods for forecasting immediate power consumption are fundamentally limited by the irreducible noise associated with human behavior. Therefore, we proposed a paradigm shift toward Denoised Trend Forecasting, implemented through a novel Robust Residual-Attention Network. This methodological shift ensures that the forecasting engine places greater emphasis on the underlying operational patterns rather than high-frequency fluctuations, thereby providing a more consistent computational foundation for modern electrical grid management [6].
5.1. Summary of Contributions
Our initial hypothesis is strongly supported by the experimental results, representing a milestone in three key aspects. The results of this study should be interpreted in the context of smoothed trend forecasting and are not directly equivalent to raw instantaneous power forecasting. Therefore, the reported benefits are relevant to practical energy management applications where consumption trends are more important than instantaneous fluctuations.
First, the model achieved a state-of-the-art Coefficient of Determination (R2) of 0.9063 by not merely predicting the data but capturing the underlying trends. This demonstrates that the proposed denoising approach enables the network to learn the deterministic mechanisms of energy consumption while effectively filtering out stochastic noise [7]. Second, the historical bottleneck of Long Short-Term Memory (LSTM) models was successfully addressed through the implementation of a multi-head self-attention mechanism, which mitigates the phase lag phenomenon [5]. The proposed model demonstrated exceptional peak detection capability, achieving a global accuracy of 96.63% and an F1-score of 0.8529, indicating its ability to accurately predict high-load events rather than simply respond to them. Third, this study used a set of features with physical relevance to energy consumption, including environmental variables, cyclical time characteristics, and historical load information, to design the model. Although these choices are consistent with existing knowledge in the field of energy management, this study did not provide an independent analysis of the model’s explainability, and therefore no claims can be made about the model’s explainability [8].
5.2. Practical Implications for Smart Grids
The experimental results suggest that Robust-RAN has the potential to support residential demand-response applications evaluated in this study for modern automated demand-response systems. Moreover, by significantly reducing the uncertainty margin, as demonstrated by the low Root Mean Squared Error (RMSE) of 22.00 W, the proposed framework may support future optimization of the deployment of spinning reserves [2]. This optimization improves dispatch efficiency, resulting in substantial cost savings while reducing the overall carbon footprint of the energy ecosystem.
5.3. Limitations and Future Work
Although the Robust-RAN is more efficient, its present version is based on high-resolution environmental data that is not always available on all legacy residential systems. There are two strategic directions that future research paths will take. The initial step is to make the architecture lightweight and distilled to deploy it on low-power IoT smart meters using edge computing protocols [10]. Second, we are going to research the model flexibility in cross-domain transfer learning to different climatic regions [9]. It will also allow generalizing learned physical interactions between tropical and arid environments without always having to retrain the architecture, which again reinforces the global scalability of the suggested architecture.
One of the limitations of this study is the lack of an ablation study to independently assess the contribution of each component of the proposed architecture. Although the overall performance of the model has been evaluated using a comprehensive set of evaluation criteria, the quantitative impact of each of the main components, including the smoothing filter, residual blocks, multi-serial attention mechanism, and cyclic temporal coding, has not been independently assessed. Such a study could provide a more detailed understanding of the role of each component in improving the model’s performance and would be an important direction for future research.
One of the limitations of this study is the lack of investigation of the variability of the model performance in repeated runs (Run-to-Run Variability). All the results presented in this study are reported based on a complete model run with final settings, and the effect of different initial parameter values or repeated model training on the stability of the results has not been evaluated. Although the results indicate the appropriate performance of the proposed model, performing several independent runs and reporting statistical indicators such as mean and standard deviation can provide a more comprehensive assessment of the stability and reliability of the model. Therefore, investigating the variability between different runs is suggested as one of the future research directions.
Furthermore, the results presented in this study are reported based on a single run of the model with final adjustments, and no statistical confidence intervals or explicit significance tests (such as bootstrap or pairwise statistical comparisons with a baseline model) are provided for the reported measures. Providing such an analysis could provide further assurance of the statistical robustness of the results and is considered a direction for future research.
Another limitation of this study is the lack of model interpretability analysis. Although the selection of input features was based on energy domain knowledge, the contribution of each feature to model decision-making was not quantitatively examined to further substantiate this claim, a cross-correlation analysis between actual and predicted series was conducted (Figure 3), confirming a correlation peak at zero lag; however, this analysis was performed on a representative test window and a full-dataset statistical validation remains a direction for future research.
One of the limitations of this study is that the model was evaluated only on the Appliances Energy Prediction dataset from the UCI repository. Although this dataset is a well-known reference in the field of residential building load prediction, using a single dataset is not sufficient to demonstrate the generalizability of the model across all operating conditions. As a result, the results presented should be interpreted within the context of this dataset. In future studies, the model performance will be evaluated on multiple residential datasets with different climatic conditions, consumption patterns, building characteristics, and operating scenarios to comprehensively examine the robustness and generalizability of the proposed framework.
Another limitation of this study is the lack of quantitative analysis of computational complexity, training time, inference time, and scalability of the model. Although the results show that the proposed model performs well in terms of accuracy, evaluating its computational cost and implementation efficiency on different hardware and in real-time environments was beyond the scope of this study. In future research, the temporal and spatial complexity of the model, measuring the training and inference time on different hardware platforms, and examining the performance of the model in edge computing and real-time energy management infrastructures will be performed to enable a comprehensive assessment of the practical deployment of the proposed framework.
Another limitation of this study is the lack of an independent quantitative measure of phase lag. The evidence presented in this study for phase lag reduction is largely qualitative and based on visual analysis and residual distribution. Future research could use quantitative measures, such as cross-correlation analysis between actual and predicted time series, or direct comparison with a baseline regression model without attention mechanisms, to further substantiate this claim.
6. Data Availability and Implementation Details
To promote methodological transparency and facilitate future research within the smart grid community, the data sources and software specifications used in this study are thoroughly documented. The experimental setup and software environment were carefully designed to ensure structural consistency and reproducibility, enabling accurate computational replication of the results presented in the preceding sections.
6.1. Dataset Availability
The dataset used in this study is publicly available through the UCI Machine Learning Repository. Specifically, the Appliances Energy Prediction dataset (Accession Number: 374) provides high-resolution telemetry from a low-energy residential building, including indoor and outdoor environmental measurements as well as sub-metered energy consumption data. The dataset is available through the official UCI Machine Learning Repository and can be used to reproduce the preprocessing pipeline and validate the statistical analyses presented in this study.
6.2. Implementation Framework
A Robust-RAN architecture was implemented using the PyTorch deep learning framework (v2.0+) as the primary computational platform. To support the multi-head attention mechanism required for temporal synchronization, the model employed the “torch.nn.MultiheadAttention” module and was trained in a GPU-accelerated environment. The proposed model was implemented using the PyTorch framework and trained in a GPU-powered environment. No independent method for analyzing the interpretability of the model, such as SHAP or other explainable artificial intelligence (AI), was used in this study.
Author Contributions
S.M.F.: Methodology, Investigation, Software, Writing—Original Draft. K.S.: Methodology, Conceptualization, Writing—Reviewing and Editing. S.S.G.: Conceptualization, Methodology, Writing—Review and Editing, Supervision. A.A.: conceptualization, Supervision, Reviewing and Editing, Visualization. All authors have read and agreed to the published version of the manuscript.
Funding
This research received no external funding.
Institutional Review Board Statement
The authors have no competing interests to declare that are relevant to the content of this article.
Informed Consent Statement
This article does not contain any studies with human participants or animals performed by any of the authors.
Data Availability Statement
The dataset used in this study is publicly available through the UCI Machine Learning Repository (Accession Number: 374), as detailed in Section 6.1.
Conflicts of Interest
The authors declare no conflicts of interest.
References
- Kong, W.; Dong, Z.Y.; Jia, Y.; Hill, D.J.; Xu, Y.; Zhang, Y. Short-Term Residential Load Forecasting Based on LSTM Recurrent Neural Network. IEEE Trans. Smart Grid 2019, 10, 841–851. [Google Scholar] [CrossRef] [Scilit]
- Cheng, L.; Zang, H.; Xu, Y.; Wei, Z.; Sun, G. Probabilistic Residential Load Forecasting Based on Micrometeorological Data and Customer Consumption Pattern. IEEE Trans. Power Syst. 2021, 36, 3762–3775. [Google Scholar] [CrossRef] [Scilit]
- Wei, Y.; Zhang, X.; Shi, Y.; Xia, L.; Pan, S.; Wu, J.; Han, M.; Zhao, X. A Review of Data-Driven Approaches for Prediction and Classification of Building Energy Consumption. Renew. Sustain. Energy Rev. 2018, 82, 1027–1047. [Google Scholar] [CrossRef] [Scilit]
- Sehovac, M.; Grolinger, K. Deep learning for load forecasting: Sequence-to-sequence recurrent neural networks with attention. IEEE Access 2020, 8, 36411–36426. [Google Scholar] [CrossRef] [Scilit]
- Guo, H.; Lin, D. DALNet: A Denoising Diffusion Probabilistic Model for High-Fidelity Day-Ahead Load Forecasting. arXiv 2025, arXiv:2503.06697v2. [Google Scholar]
- Chen, K.; Chen, K.; Wang, Q.; He, Z.; Hu, J.; He, J. Short-term load forecasting with deep residual networks. IEEE Trans. Smart Grid 2019, 10, 3943–3952. [Google Scholar] [CrossRef] [Scilit]
- Triban, A.; Lawgali, A. A hybrid CNN-LSTM model for residential energy consumption forecasting. Appl. Energy 2023, 332, 120512. [Google Scholar]
- Xu, C.; Chen, G. Interpretable transformer-based model for probabilistic short-term forecasting of residential net load. Int. J. Electr. Power Energy Syst. 2024, 157, 109515. [Google Scholar] [CrossRef] [Scilit]
- Spencer, R.; Ranathunga, S.; Boulic, M.; van Heerden, A.H.; Susnjak, T. Transfer learning on transformers for building energy consumption forecasting—A comparative study. Energy Build. 2025, 336, 115632. [Google Scholar] [CrossRef] [Scilit]
- Taik, A.; Cherkaoui, S. Electrical load forecasting using edge computing and federated learning. IEEE Internet Things J. 2020, 7, 9968–9981. [Google Scholar]
- Feng, D.; Li, D.; Zhou, Y.; Wang, W. MLFGCN: Short-term residential load forecasting via graph attention temporal convolution network. Front. Neurorobot. 2024, 18, 1461403. [Google Scholar] [CrossRef] [Scilit] [PubMed]
- Li, H.; Li, S.; Wu, Y.; Xiao, Y.; Pan, Z.; Liu, M. Short-term power load forecasting for integrated energy system based on a residual and attentive LSTM-TCN hybrid network. Front. Energy Res. 2024, 12, 1384142. [Google Scholar] [CrossRef] [Scilit]
- Zhao, H.; Wu, Y.; Ma, L.; Pan, S. Spatial and temporal attention-enabled transformer network for multivariate short-term residential load forecasting. IEEE Trans. Instrum. Meas. 2023, 72, 2524611. [Google Scholar] [CrossRef] [Scilit]
- Cao, W.; Liu, H.; Zhang, X.; Zeng, Y. Residential load forecasting based on long short-term memory, considering temporal local attention. Sustainability 2024, 16, 11252. [Google Scholar] [CrossRef] [Scilit]

Disclaimer/Publisher’s Note: The statements, opinions and data contained in all publications are solely those of the individual author(s) and contributor(s) and not of MDPI and/or the editor(s). MDPI and/or the editor(s) disclaim responsibility for any injury to people or property resulting from any ideas, methods, instructions or products referred to in the content. |
© 2026 by the authors. Licensee MDPI, Basel, Switzerland. This article is an open access article distributed under the terms and conditions of the Creative Commons Attribution (CC BY) license.