


Abstract
The incorporation of industrial byproducts into concrete is crucial for utilizing waste materials, reducing clinker use, and increasing the durability of cement-based materials. This study investigates the high-temperature exposure performance of cement mortars containing Class C and F fly ash from a multiscale perspective. Fly ash was used as a partial cement substitute at percentages of 5%, 10%, 15%, and 20%, and the prepared mortars were subjected to temperatures of 400, 600, and 800 °C. Flexural and compressive strengths, microstructural properties, X-ray microcomputed tomography (micro-CT) data, concrete petrography, and thermogravimetric analysis (TGA) characteristics were systematically examined to evaluate changes in mechanical performance, pore structure, microstructure, and thermal stability. The results indicated that the highest compressive strength values in mixtures subjected to 800 °C were obtained at a 10% replacement rate. Compared to the 5.64 MPa compressive strength of the reference mortar, this value was found to be 12.96 MPa in mortars containing 10% Class F fly ash and 11.86 MPa in mortars containing 10% Class C fly ash. Micro-CT and microstructural observations supported the finding that fly ash substitution reduced porosity and limited cracking, while thermogravimetric results supported the relationship between thermal stability and sustained mechanical performance. This study aims to contribute to the development of high-temperature-resistant cementitious materials by recycling fly ash, an industrial waste product.
1. Introduction
Research on concrete aims to improve its mechanical properties and durability while minimizing cement usage [1]. The use of pozzolanic waste products as a partial substitute for cement is crucial for conserving natural resources and minimizing waste [2] because cement production increases global CO2 emissions, causing environmental pollution [3,4]. Fly ash is one of the waste products used as a cement substitute to reduce CO2 emissions from cement production and improve concrete properties [5,6]. This material is an industrial byproduct of coal-fired power plants captured by electrostatic precipitators in chimneys [7], containing oxides such as Fe2O3, CaO, MgO, SO3, Na2O and K2O, while the vast majority of the material consists of SiO2, CaO and Al2O3 [8,9,10,11]. Fly ash is classified into two categories, Class C and Class F, based on its chemical composition, calcium oxide content, and reactivity [12]. Class C and F fly ashes are widely used as complementary binder material in cement mortar and concrete mixtures. According to the ASTM C618 standard [13] published by ASTM International, Class F fly ash has a low calcium oxide (CaO) content and a high total silica + alumina + iron oxide (≥70%) content and exhibits mainly pozzolanic reactions. Class C fly ash can show both pozzolanic and binding properties thanks to its higher CaO content [13]. This waste material, when integrated into carbon-based materials, enhances the structural performance of concrete and supports environmental sustainability [14]. Replacing cement with fly ash has been shown to significantly reduce CO2 emissions while improving concrete workability, compressive strength, and permeability resistance [12]. Fly ash is also reported to reduce the Ca(OH)2 content in hydration products, improve pore structure, and significantly increase the material’s resistance to dissolution [15]. The literature indicates that the optimum fly ash replacement rate in terms of mechanical performance is up to 20% [16,17,18].
The damage caused by fires to structures and the resulting economic losses are of significant concern. Fire resistance is a crucial performance characteristic for cement-based materials used in structures. The degradation of cement-based materials affected by high temperatures involves a series of physico-chemical changes [19]. It has been reported that rapid degradation occurs in cement mortars, especially when the temperature exceeds 400 °C [20]. It has been stated that the main loss in compressive strength occurs between 400 °C and 800 °C, and a significant loss of strength occurs especially between 600 °C and 800 °C [21]. Previous studies have substituted cement with fly ash to enhance mortar properties and minimize the adverse effects of high temperatures. In studies conducted within this scope, increasing the FA content in mortars exposed to high temperatures effectively increased high-temperature resistance [19]. It has been stated that the addition of FA consumed some Ca(OH)2 due to pozzolanic reaction, which reduced the degradation caused by the decomposition of Ca(OH)2 at high temperatures [22]. In addition, it is stated that up to 30% FA substitution in concrete provides positive results under high-temperature conditions, but higher FA contents increase the loss of strength [23].
Although the effects of fly ash on the mechanical and durability properties of cement-based materials have been widely studied, the comparative high-temperature behaviour of Class C and Class F fly ash under the same substitution rates and thermal conditions has not yet been sufficiently investigated. In particular, information is limited on how the variability in ash chemistry and reactivity simultaneously shapes the residual mechanical performance, pore structure, microstructural degradation, and thermal stability after high-temperature exposure. Therefore, determining the types and substitution levels of fly ash that provide a suitable balance between cement reduction and high-temperature performance is crucial for the development of more resource-efficient and durable cementitious systems. In this context, the present study presents a direct comparison of Class C and Class F fly ashes added to cement mortars at 5%, 10%, 15%, and 20% concentrations and exposed to temperatures of 400, 600, and 800 °C. The novelty of this study lies in its integrated assessment of flexural and compressive strengths, SEM/EDX analyses, X-ray micro-computed tomography, petrographic analysis, and thermogravimetric analysis under a common experimental framework. By correlating mechanical performance with changes in pore structure, microstructure, and thermal stability, the study aims to determine the fly ash type and substitution level that provides optimal performance after high-temperature exposure while reducing cement demand. The findings are intended to contribute to the development of more resource-efficient and high-temperature-resistant cementitious materials through the beneficial reuse of industrial fly ash.
2. Materials and Experimental Methods
2.1. Materials
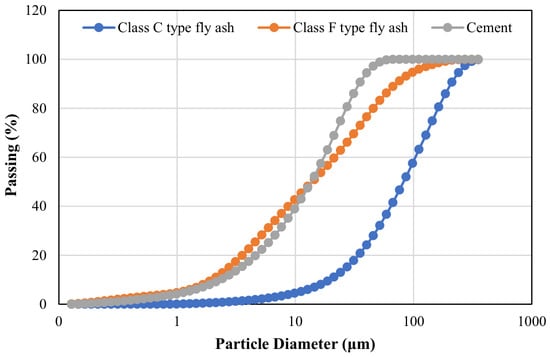
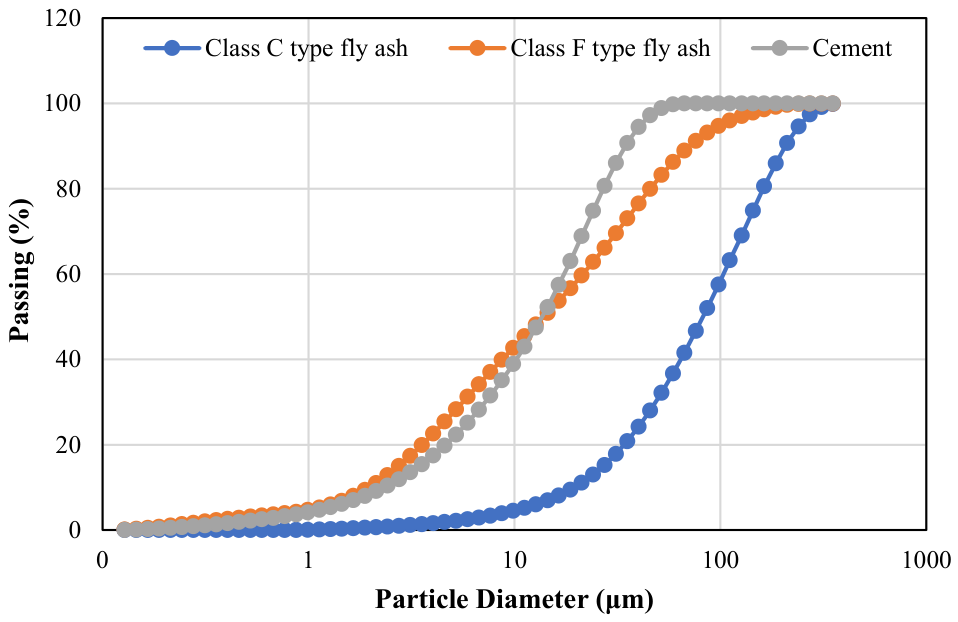
CEM I 42.5 R Portland cement with a specific gravity of 3.10 g/cm3, conforming to the TS EN 197-1 [24] standard, was used as the primary binder. The chemical composition of this cement is given in Table 1, and its particle size distribution is given in Figure 1. Class C and F fly ashes, used as additional binder materials, were obtained from coal-fired thermal power plants. The chemical compositions of these fly ashes were determined by XRF analysis and are presented in Table 1, while their particle size distributions are shown in Figure 1.
Table 1.
Chemical composition of the materials used in the mixture.
Figure 1.
Particle size distribution of materials.
The aggregate used in mortar mixtures is CEN reference sand [25] conforming to TS EN 196-1 standard, with a particle size range of 0.08–2.0 mm.
In the analysis conducted to determine particle sizes and distribution ratios, it was determined, on the one hand, that the particle size distributions of cement and Class F fly ash were close to each other, but cement particles exhibited a smaller size distribution. On the other hand, Class C fly ash was found to have a distribution consisting of larger particles compared to these two materials.
2.2. Methods
2.2.1. Mixture Proportions, Specimen Preparation, and Elevated-Temperature Exposure
In this study, 9 different mixtures were prepared, including a control mixture. The mixtures were designed with a water-to-binder-to-aggregate ratio of 0.5:1:3. Class F and Class C fly ashes were used to partially replace cement at replacement levels of 5%, 10%, 15%, and 20%, resulting in eight fly ash-containing mixtures in addition to the control mixture. Specimens were prepared from each mixture and exposed to elevated temperatures of 400, 600, and 800 °C. Table 2 shows the mixing proportions of the mixtures. In the mixture designations, the numbers 5, 10, 15, and 20 indicate the percentage of cement replaced by fly ash; F and C denote Class F and Class C fly ash respectively and FA refers to fly ash.
Table 2.
Mixture proportions.
The prepared mortars were placed into steel prismatic moulds with dimensions of 40 × 40 × 160 mm and covered with plastic sheets. After 24 h, the specimens were demoulded and kept in water curing. At the end of 28 days, the specimens were placed into the furnace individually for each temperature value to observe the effect of elevated temperatures. The heating rate was set at 6 °C/min, and the furnace was held at the target temperatures of 400 °C, 600 °C, and 800 °C for 2 h. Subsequently, the furnace was turned off, and its door was opened to allow the temperatures to drop to ambient temperature.
2.2.2. Flow Table Test
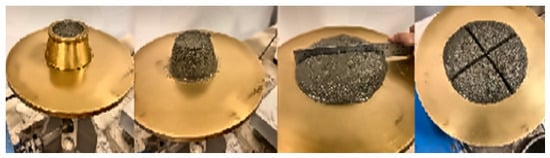
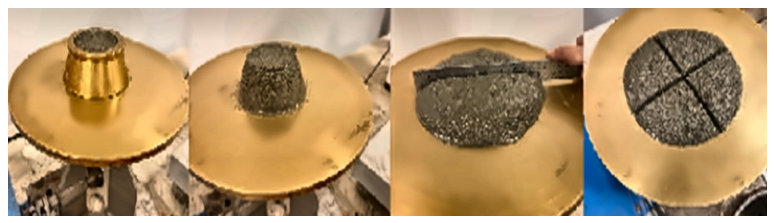
The workability of the prepared mortar mixtures was evaluated using the flow table test in accordance with ASTM C1437 [26]. The test procedure was conducted as illustrated in Figure 2.
Figure 2.
Flow table test procedure.
2.2.3. Flexural and Compressive Strength Tests
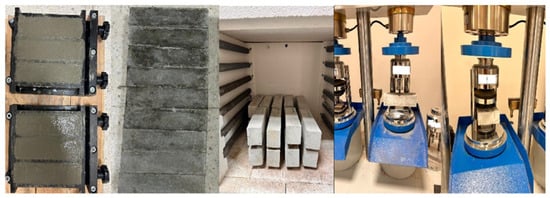
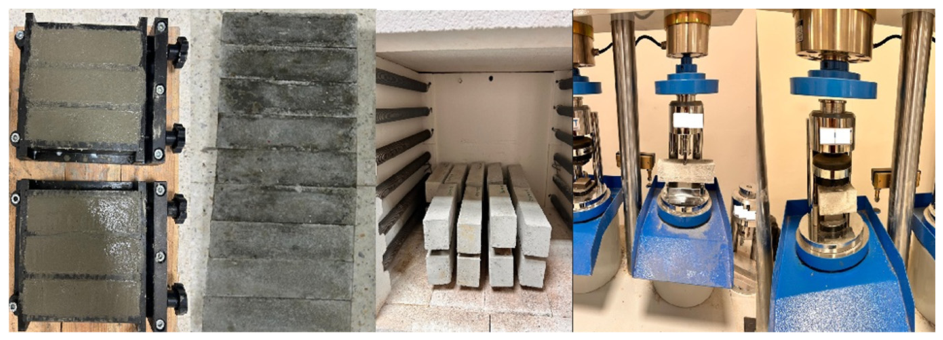
As shown in Figure 3, the flexural strength of the prismatic mortar specimens was determined at the age of 28 days in accordance with TS EN 196-1. The flexural test was conducted using a constant loading rate of 50 ± 10 N/s. Following the flexural test, the resulting halves of the prismatic specimens were subjected to compressive strength testing in accordance with the same standard, using a constant loading rate of 2400 ± 200 N/s. Three replicate specimens were tested for each flexural strength condition, and six compressive strength measurements were obtained.
Figure 3.
Flexural and compressive strength tests procedure.
2.2.4. SEM, Micro-CT, and Petrographic Analyses
Several methods are commonly used to study the microstructure of concrete [27]. In this study, microstructural analyses were performed using a high-resolution scanning electron microscope (SEM) with a resolution of 1.2 nm located at Middle East Technical University, Ankara, Türkiye. X-ray micro-CT analyses were performed using a high-resolution computed microtomography scanner at Ankara University, Ankara, Türkiye. For these analyses, cubic specimens measuring 40 × 40 × 40 mm were prepared. At the age of 28 days, specimens exposed to ambient temperature and elevated temperatures of 400 and 800 °C were examined. Petrographic analyses of the mortar specimens were conducted using polarized light microscopy. Following 28 days of curing and subsequent temperature exposure, both reference specimens and specimens exposed to elevated temperatures were examined comparatively to evaluate changes in microstructure, pore structure, microcracking, and hydration products.
2.2.5. Thermogravimetric Analysis
For the thermogravimetric analyses, specimens were placed in lidded alumina crucibles and heated from 30 to 1050 °C under a nitrogen atmosphere at a constant heating rate of 10 °C/min. TGA was conducted to evaluate the mass changes in the specimens as a function of temperature. Both specimens maintained at ambient temperature and those previously exposed to 800 °C were analyzed to compare their thermal decomposition behaviour and mass loss characteristics.
3. Results and Discussion
3.1. Flow Table Test Results
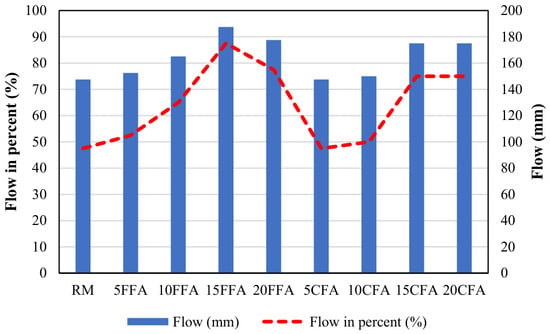
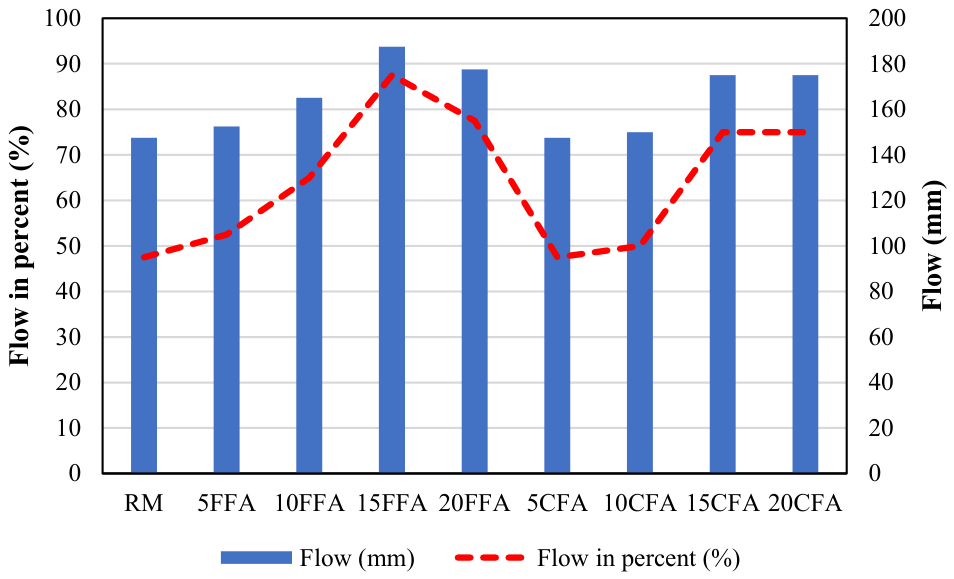
The flowability values (spreading diameter) of the fresh specimens are shown in Figure 4. The measured spreading diameters ranged from 147.5 mm to 187.5 mm. It was generally observed that the substitution of Class C and F FAs increased the flowability of the mortar mixtures compared with the reference mixture. The mortar containing 15% Class F fly ash (15FFA) exhibited the highest flowability among all mixtures. In contrast, the mortar containing 5% Class C fly ash (5CFA) showed the lowest flowability, which was comparable to that of the reference mortar (RM). It was determined that fly ash substitution had a positive effect on the workability of the mortars, especially after the 5% substitution rate, and that Class F FA substitution increased the workability slightly more than Class C.
Figure 4.
Flow table test results.
The lower flowability for Class C FA can be attributed to its high CaO content; a large part of this content is found in the glassy fraction [28]. The increased flowability observed with fly ash substitution may be attributed to the spherical morphology and smooth texture of fly ash particles enhancing particle slippage and minimizing internal friction within the mortar matrix [29].
3.2. Compressive Strength Test Results
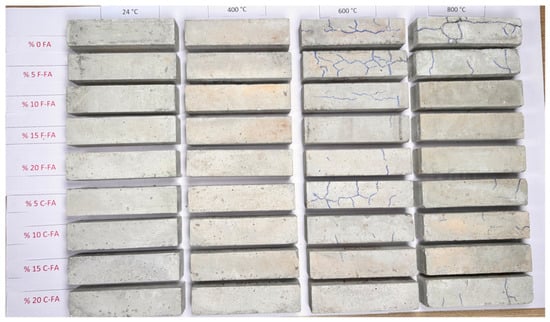
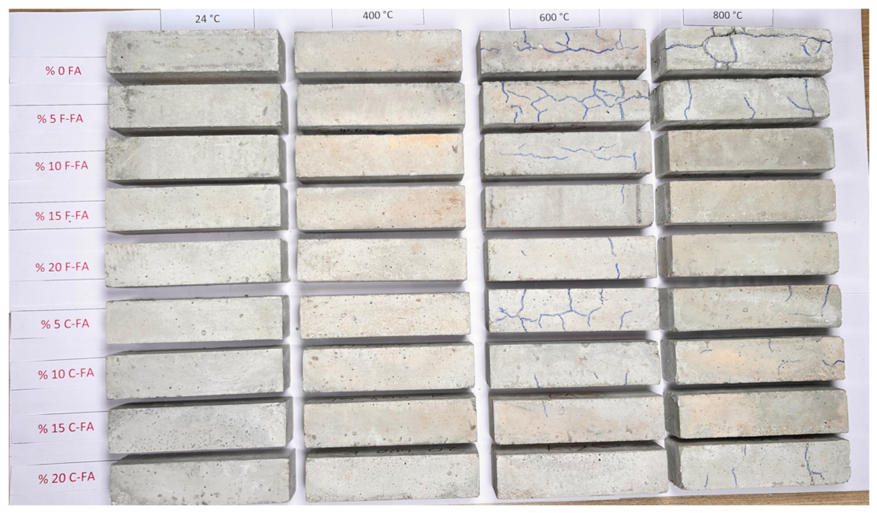
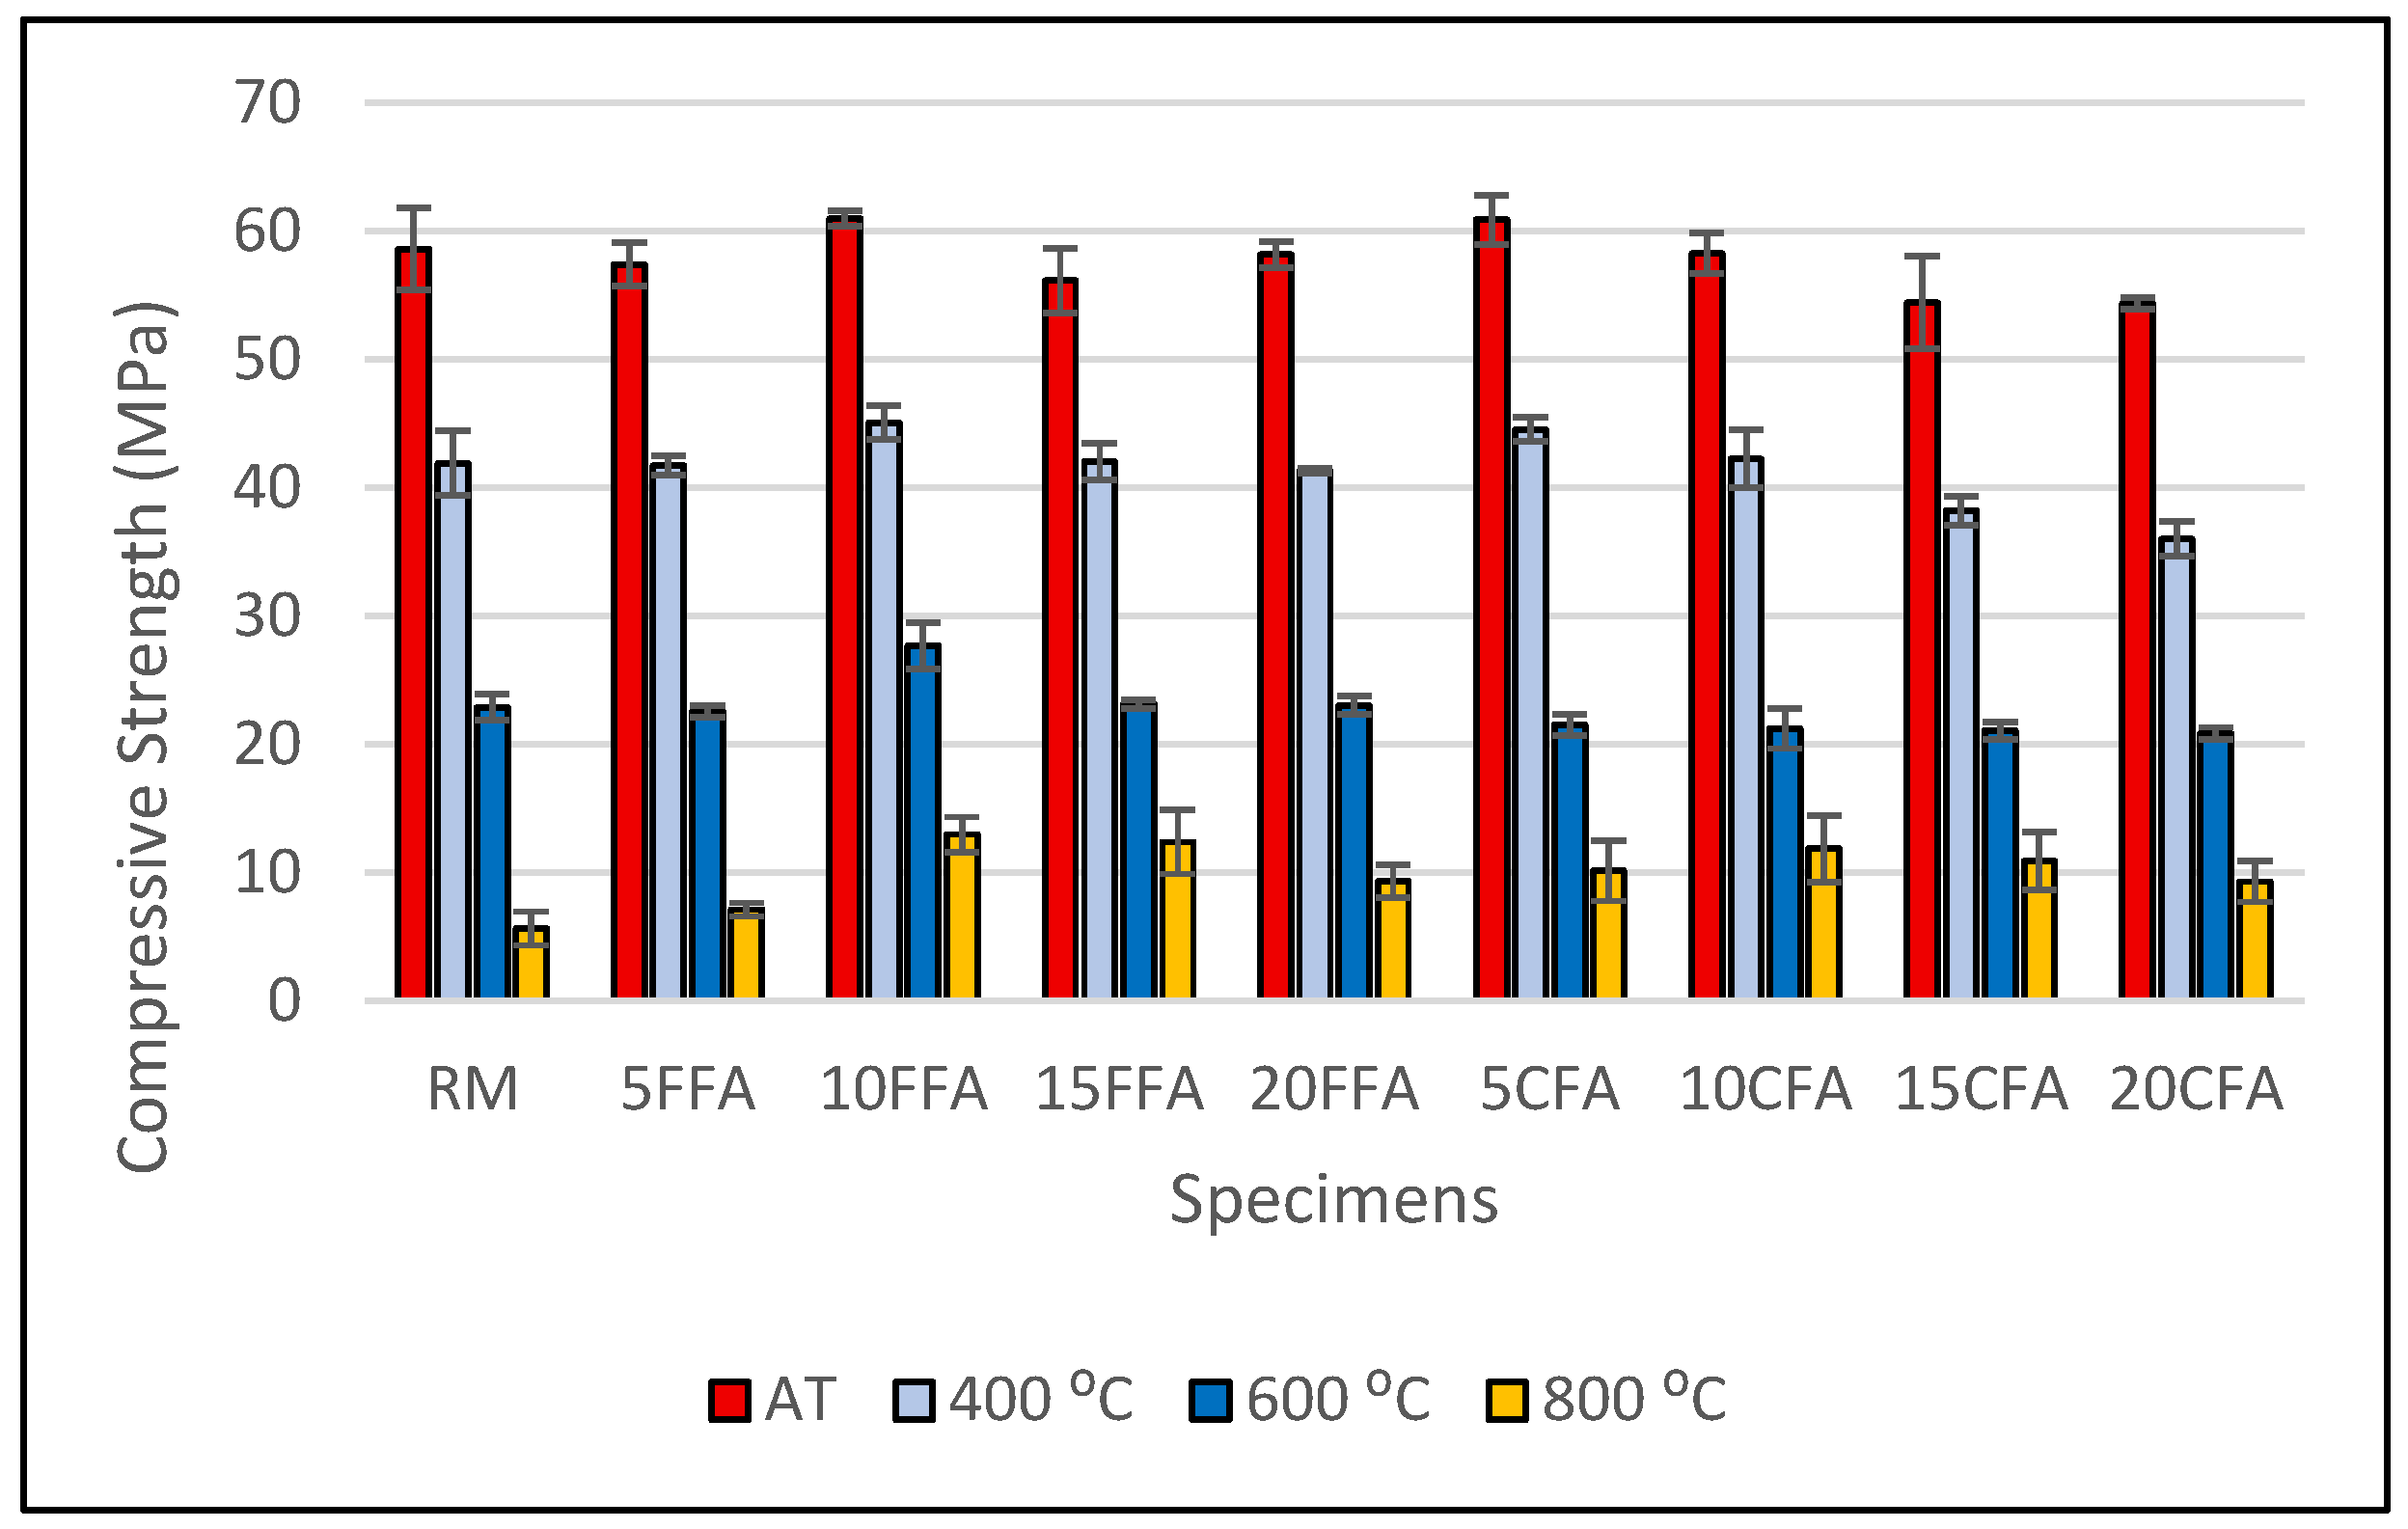
The compressive strength of the mortar specimens was evaluated at the age of 28 days under four different temperature conditions: ambient temperature, 400 °C, 600 °C, and 800 °C. At 28 days, the mortars incorporating both Class C and Class F fly ash generally exhibited higher compressive strength than the control mortar, with the differences becoming particularly pronounced after exposure to elevated temperatures. In the samples not exposed to high temperatures, in parallel with previous studies [30], it was observed that a 10% substitution rate in Class F fly ash substitution provided higher strength values compared to the reference mortar, and a 5% substitution rate in Class C fly ash substitution gave higher strength values compared to the reference mortar. This situation can be explained by the fact that the fly ash used contains mineral components that provide a filling effect [17] and nucleation effect, and also that the addition of FA increases the amount of C-S-H as a result of the pozzolanic reaction. As seen in Figure 5, after different high-temperature treatments, particularly when the temperature reached 600 °C and 800 °C, it was determined that significant cracks were visible in the reference samples.
Figure 5.
Images of specimens exposed to ambient temperature and high temperature.
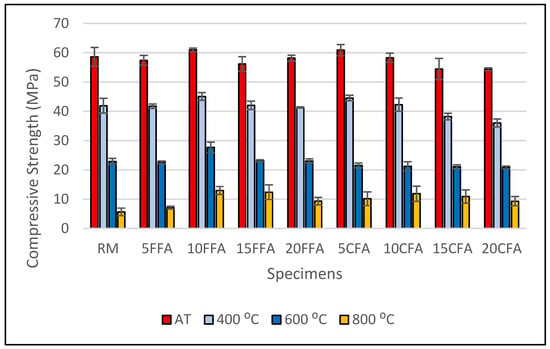
Studies have shown that increasing the FA content improves the crack resistance of cement-based systems at high temperatures [19]. In samples exposed to 600 °C, the lowest compressive strength was 20.84 MPa in cement mortars with 20% Class C FA substitution, while the highest strength was 27.68 MPa in cement mortars with 10% Class F FA substitution. In samples exposed to 800 °C, the lowest compressive strength was 5.64 MPa in reference mortar, while the highest strength was 12.96 MPa in cement mortars with 10% Class F FA substitution. Many studies [19,20] have stated that the deterioration in cement mortars is more severe above 400 °C. In this study, a significant decrease in strength is observed, especially above 400 °C. One of the most important reasons for this is the increase in microporous structure, as seen in micro-CT analyses. In previous studies [21,31], it was stated that significant strength losses occurred between 400 °C and 800 °C.
As shown in Figure 6, the use of 10% Class F and Class C FA, in particular, mitigated the reductions in strength. It is theorized that the FA addition decreased the Ca(OH)2 content as a result of the pozzolanic reaction, which limited the degradation caused by Ca(OH)2 decomposition at elevated temperatures. Consequently, the 10% Class F FA replacement provided higher strength under both ambient and elevated temperatures compared to the other mixtures.
Figure 6.
Compressive strength values at 28 days.
The degradation of the C-S-H gel structure at temperatures reaching 800 °C, along with water loss, Ca(OH)2 dehydroxylation, and microcrack development, is considered one of the primary causes of the decrease in compressive strength. Furthermore, in samples with substitution rates above 10%, a decrease in compressive strength compared to samples with a 10% substitution rate is observed due to a reduction in the amount of active binder, a weakening of matrix continuity, and an increase in microcracks caused by high temperatures.
3.3. Flexural Strength Test Results
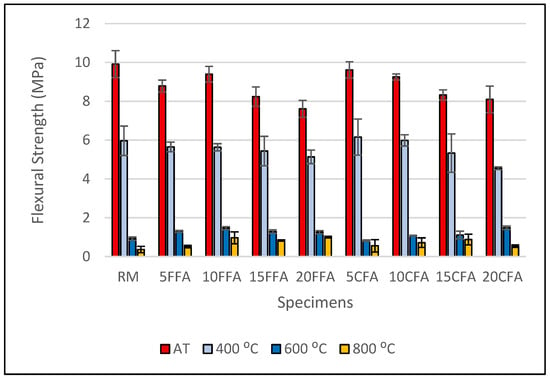
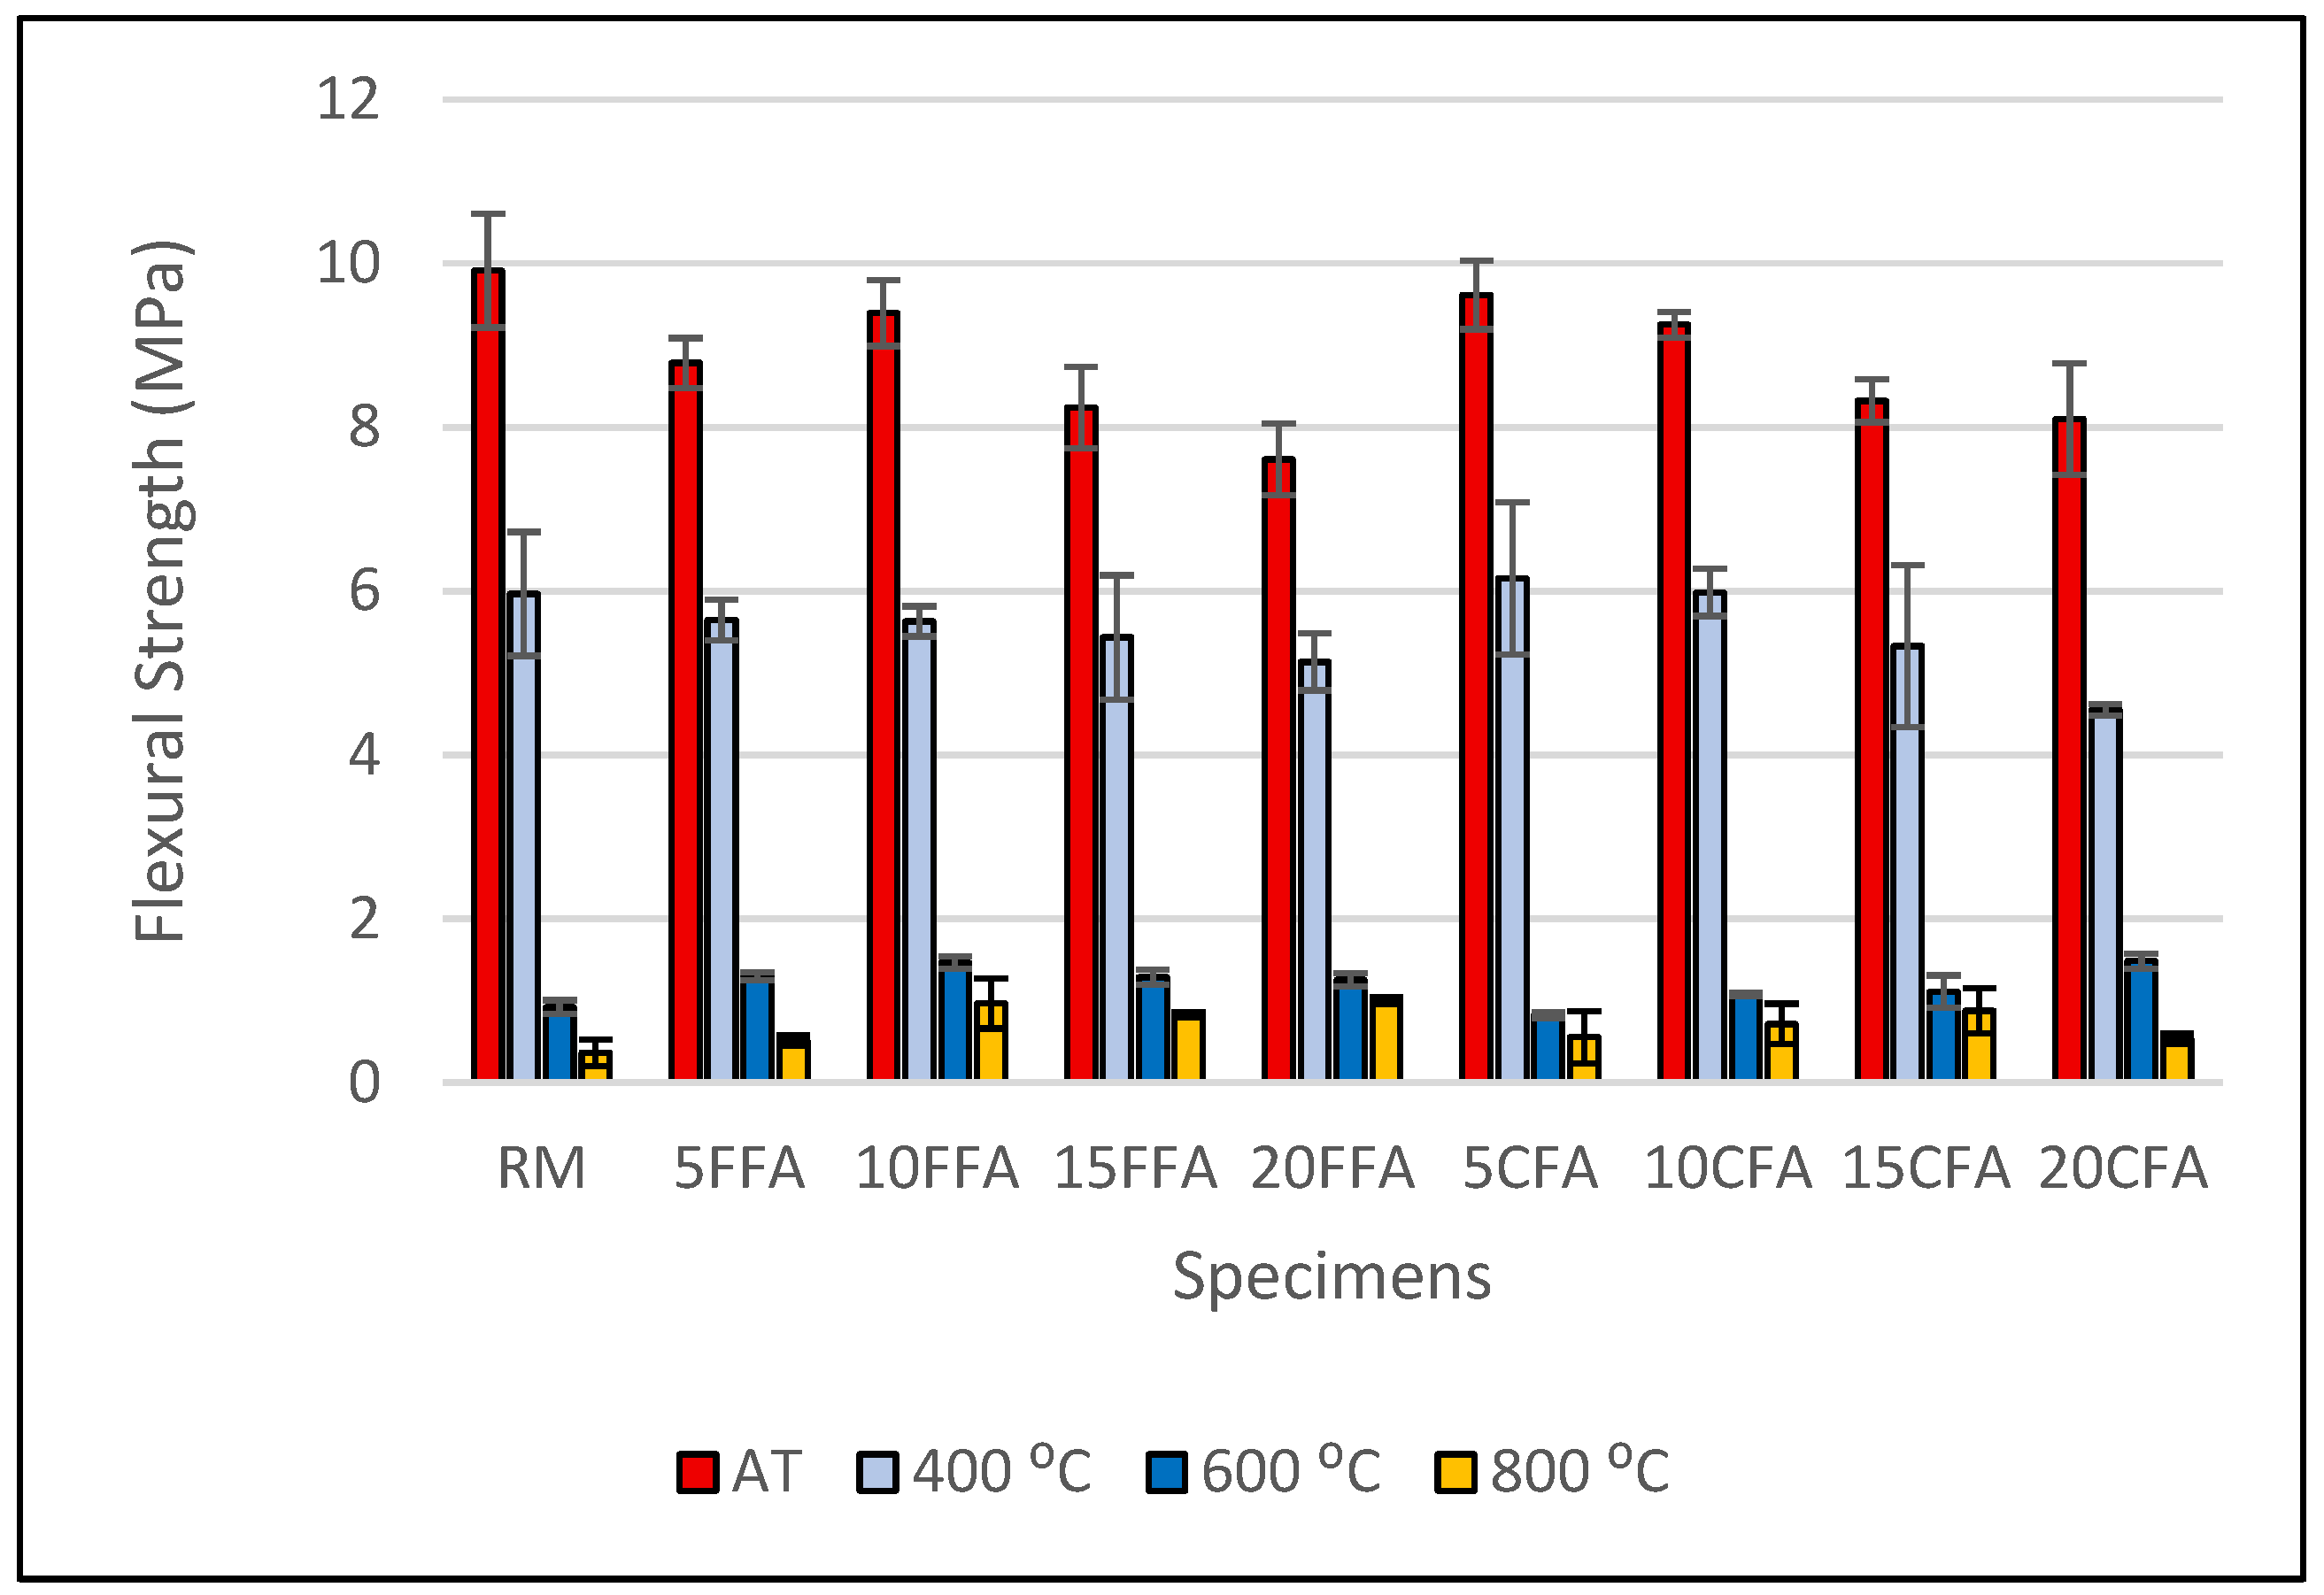
The flexural strength values of the mortar specimens tested under four different temperature conditions (ambient temperature, 400 °C, 600 °C, and 800 °C) are presented in Figure 7. When the temperature was increased to 400 °C, the average strength loss of the samples was 35%, while when the temperature was increased to 600 °C and 800 °C, the strength losses increased to an average of 85% and 95%, respectively. As observed in many studies [19], it is clearly seen that the loss in strength increases rapidly when the temperature exceeds 400 °C.
Figure 7.
Flexural strength values at 28 days.
Under high-temperature conditions (400 °C), the flexural strength of the reference samples was measured as 5.96 MPa. The highest flexural strength was obtained as 6.15 MPa in mortar containing 5% Class C fly ash, while this value was 5.64 MPa in mortars with 5% Class F fly ash substitution. After exposure to a high temperature of 600 °C, the flexural strength of the reference samples was measured as 0.92 MPa. Among the fly ash-blended mortars, the highest strength of 1.48 MPa was achieved with a 20% Class C replacement. Meanwhile, for the Class F fly ash-substituted mortars, the maximum value reached 1.46 MPa at a 10% replacement level. At a high temperature of 800 °C, the highest flexural strength was shown by samples with 20% Class F FA substitution, reaching 1 MPa, while the flexural strength of the reference samples was determined to be 0.36 MPa. In conclusion, it was found that after high-temperature exposure, both Class C and F fly ash substitution limited the decrease in flexural strength compared to reference samples at all temperature values, and this effect was particularly pronounced at 800 °C.
3.4. Microstructural Analyses
3.4.1. SEM Analyses
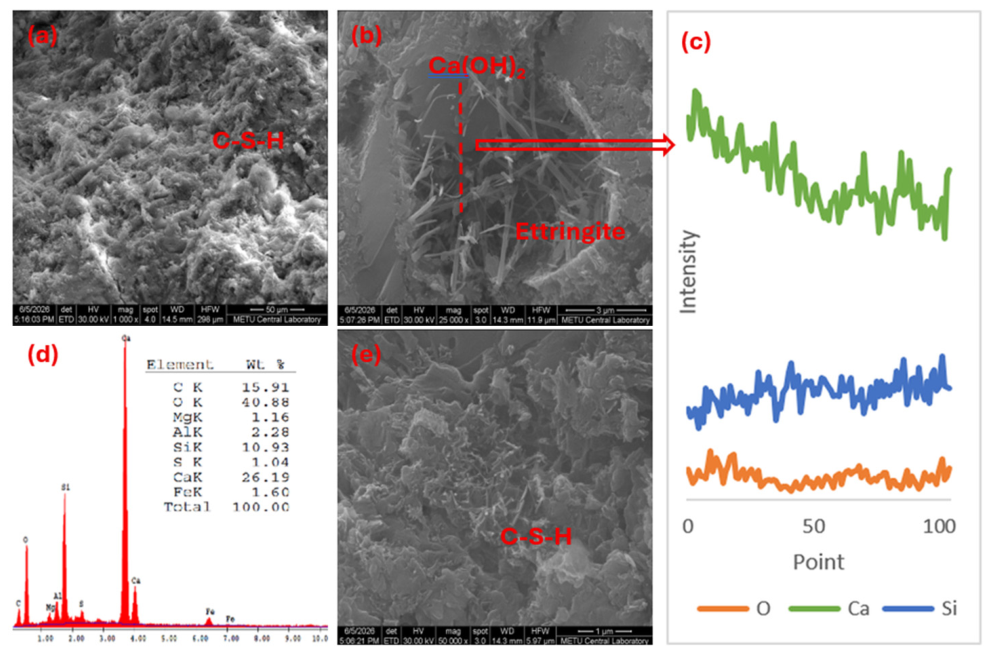
Figure 8, Figure 9, Figure 10 and Figure 11 present the microstructural characteristics of the reference specimen and those containing 10% Class C and Class F fly ash as cement replacements. To evaluate the effect of high-temperature exposure on the microstructure, specimens exposed to 800 °C were examined and compared with their corresponding unexposed specimens. Within this scope, general EDX, line-scan analysis, and microstructural analysis evaluations of cement mortars were carried out.
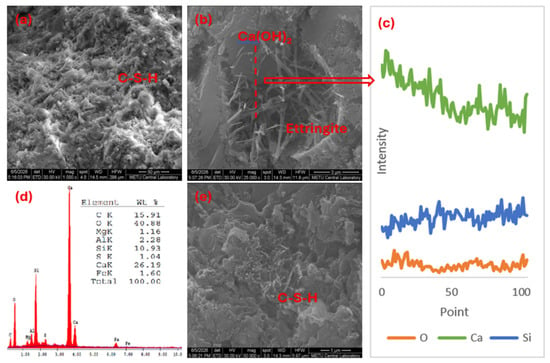
Figure 8.
Microstructure analysis of RM-AT specimen: (a) 1000× magnification, (b) 25,000× magnification (dashed line: line scan analysis), (c) line-scan analysis, (d) general EDX analysis, (e) 50,000× magnification.
Figure 9.
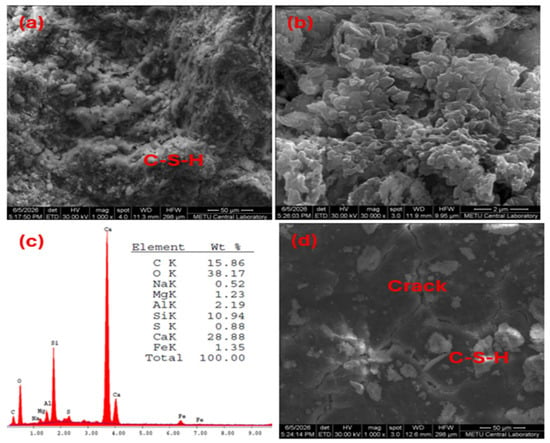
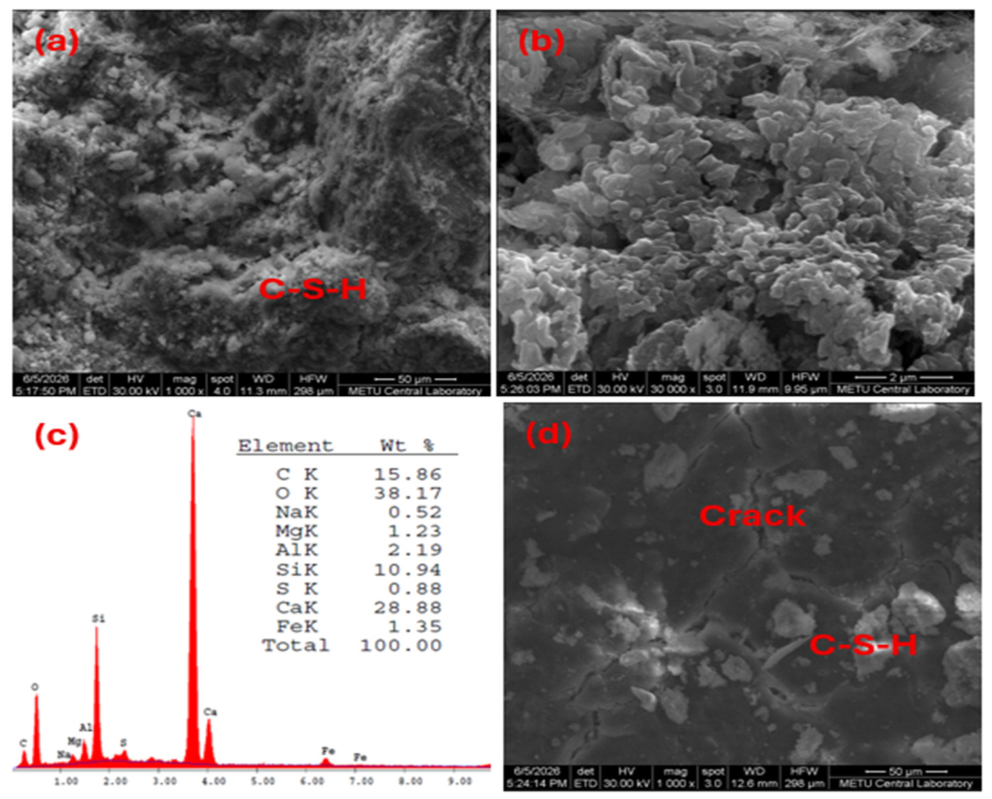
Microstructure analysis of RM-800 specimen: (a) 1000× magnification, (b) 30,000× magnification, (c) general EDX analysis, (d) 1000× magnification.
Figure 10.
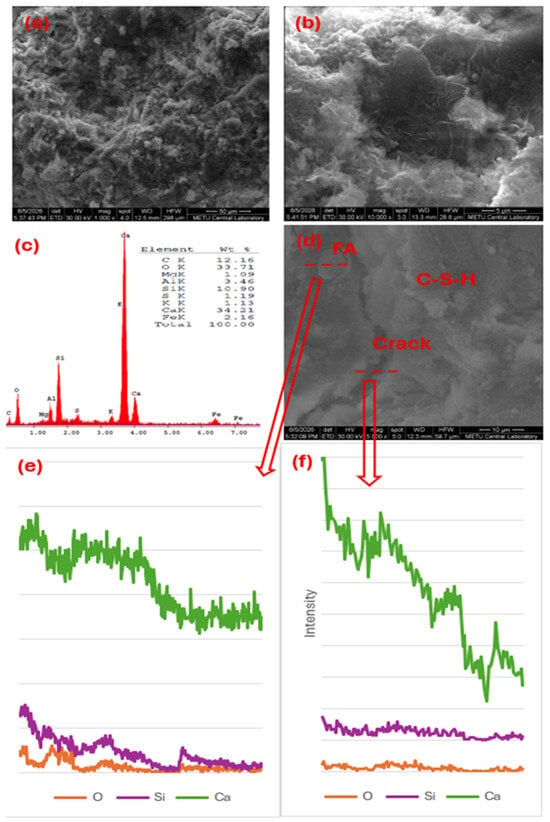
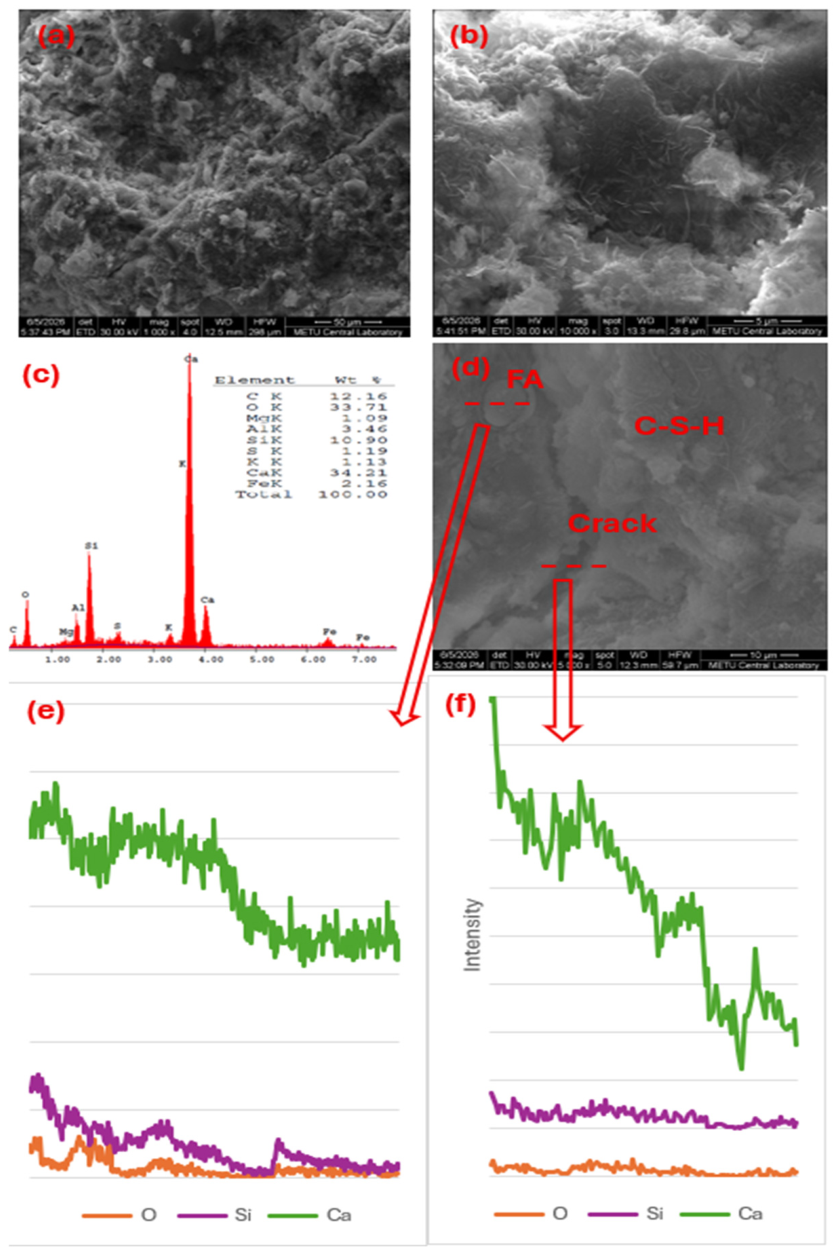
Microstructure analysis of 10 FFA-800 specimen: (a) 1000× magnification, (b) 10,000× magnification, (c) general EDX analysis, (d) 5000× magnification (dashed line: line scan analysis), (e) line-scan analysis, (f) line-scan analysis.
Figure 11.
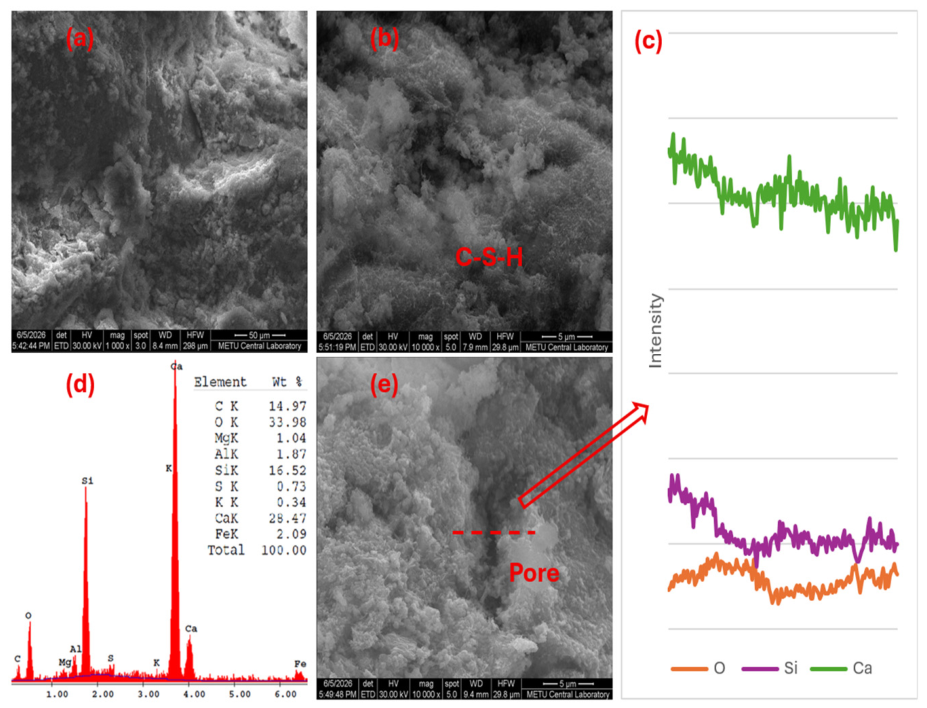
Microstructure analysis of 10 CFA-800 specimen: (a) 1000× magnification, (b) 10,000× magnification, (c) line-scan analysis, (d) general EDX analysis, (e) 10,000× magnification (dashed line: line scan analysis).
When the SEM images of the sample not exposed to high temperature in Figure 8a,b,e were examined, the microstructural characteristics expected from a typical cement matrix (C-S-H gels, (CaOH)2 crystals, and a small amount of ettringite) were detected. By contrast, when the EDX analyses in Figure 8d were analyzed, it was understood that the oxygen (O), calcium (Ca), and silicon (Si) elements constitute the main structure. In the line-scan analysis conducted to examine the changes in important regions, it was observed that the Ca element was high on the Ca(OH)2 crystal and decreased as it progressed along the line, as seen in Figure 8b,c; conversely, a slight increase in the Si element was observed. Based on these analyses, it was understood that a more poreless structure was formed in the samples not exposed to high temperatures, and especially that crack formation was much more limited compared to other samples.
SEM examinations of the reference sample exposed to a high temperature of 800 °C are shown in Figure 9. The images show that there are porous structures in the cement matrix, and cracks are evident even at 1000× magnification (Figure 9d). According to the EDX analysis results, when comparing the RM-AT and RM-800 samples, it was determined that the oxygen (O) content in Figure 9c was lower than that in Figure 8d due to the effect of the high temperature. It is theorized that the decrease in the oxygen (O) content may be attributed to the decomposition of Ca(OH)2 and the formation of a denser porous structure resulting from Ca(OH)2 degradation at elevated temperatures. Furthermore, it is thought that shrinkage and concurrent crack formation occur due to water loss in Ca(OH)2 and C-S-H structures decomposed by high temperatures.
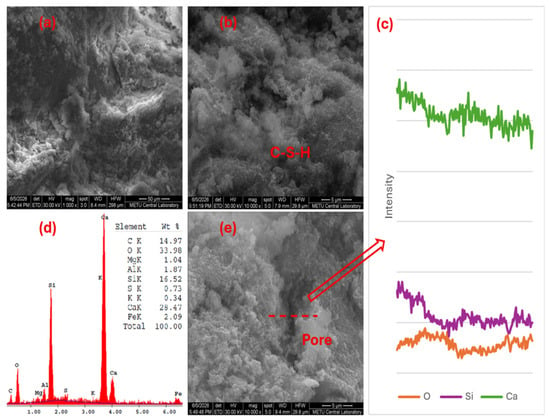
In samples containing 10% Class F fly ash substitute exposed to 800 °C (Figure 10a,b,d), C-S-H formations and cracks were detected more clearly compared to the reference sample at the same temperature (Figure 9d). Furthermore, it was observed that the fly ash-substituted samples exhibited a denser microstructure compared to the reference sample. The high Ca content detected in the EDX analyses indicates the decomposition of C-S-H and Ca(OH)2 and the subsequent formation of Ca precipitates. As shown in Figure 10d, unreacted fly ash particles were observed in certain areas. The line-scan analysis in Figure 10d,e reveals that the initially abundant Ca and Si elements decreased in the unreacted fly ash region, with this depletion extending along the crack. Similarly, the line-scan data from the crack region in Figure 10d,f exhibits a significant decrease in Ca and Si elements, confirming the decomposition of the C-S-H structure in these areas. In Figure 10d, the fly ash particle is seen to have a rough structure, presumably containing reaction products, instead of a smooth surface. The high Ca and Si concentrations observed in the line analysis in Figure 10d,e indicate that these reaction products on fly ash (FA) consist of a C-S-H gel. On the other hand, while the amount of Si in the crack region is almost zero, a slight decrease in the amount of Ca has been detected.
The remarkable point in the line-analysis performed exclusively on the crack region in Figure 10d,f is that there is a steady decrease rather than a sudden drop in both Ca and Si amounts at a specific point. The gradual decrease in Ca and Si along the crack region may indicate compositional alteration and partial degradation of the C-S-H phase associated with high-temperature exposure.
The SEM images in Figure 11a,b,e show C-S-H formations and fracture structures at specific points. The general EDX analysis in Figure 11d shows that Si and Ca elements are present in higher proportions and the C-S-H structures are better preserved compared to the reference sample. In the line-scan analysis obtained from the void region in Figure 11c,e, a significant decrease in Ca and Si density was detected. This deterioration in the C-S-H structure is considered to have led to a fractured structure at the relevant points.
In conclusion, when FA is used in concrete, it enhances the microstructure by converting Ca(OH)2 crystals into a fibrous C-S-H structure through pozzolanic reactions [28]. As shown in Figure 8, Figure 9, Figure 10 and Figure 11, FA substitution in cement mortars creates a denser and more compact structure—especially at elevated temperatures—by partially reducing cracks and defects. The greater strength enhancement obtained with the addition of FA is explained by the pozzolanic reaction detected via SEM examination [32]. Furthermore, the compressive strength values of cement mortars under high-temperature exposure are consistent with the microstructure analyses. It was observed that the hydration products became more compact with FA substitution, thereby improving mechanical properties and reducing porosity.
3.4.2. Micro-CT Analyses
The pore distribution and structure of cementitious composites greatly affect the mechanical properties of the material, such as hardness and strength [33]. The purpose of micro-CT analyses is to determine and characterize the porous matrix, to examine the behaviour of the mortar over time, and to perform damage analysis [34]. For these reasons, computerized micro-tomography (micro-CT) analyses were performed to investigate the pore structure, distribution, and the effects of high temperature on the internal structure of Class C and F fly ash-substituted cement mortars without damaging the mechanical properties of the specimens.
Figure 12.
2D images of micro-CT analyses.
Figure 13.
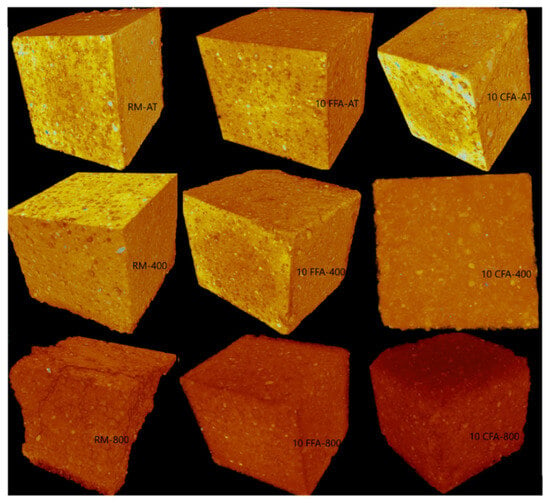
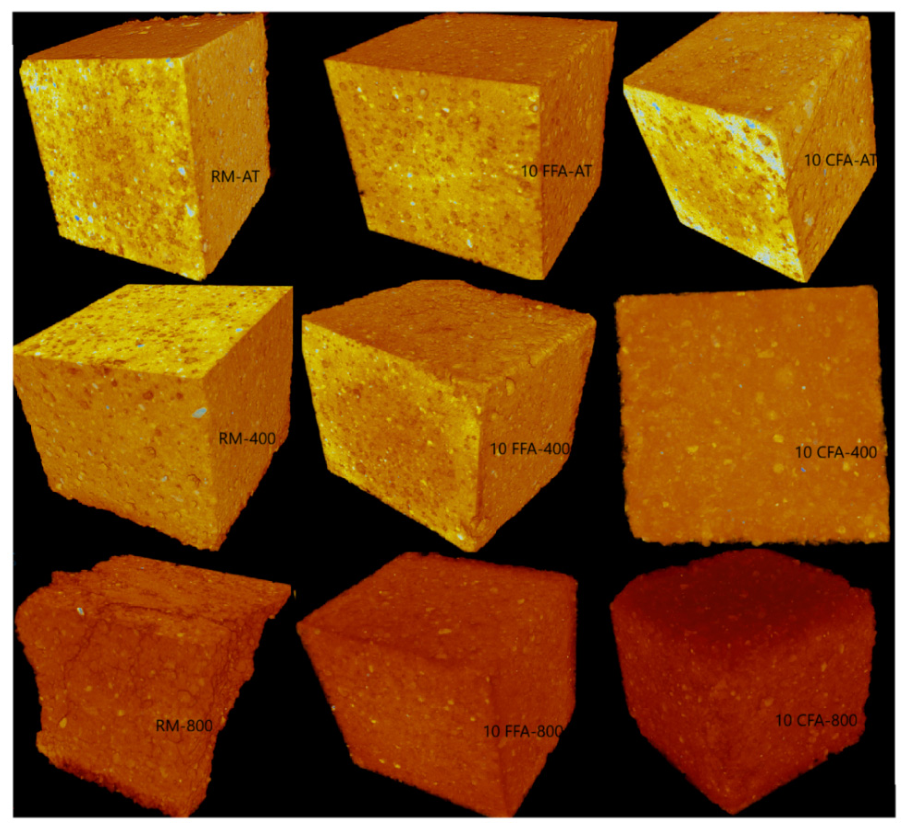
3D images of micro-CT analyses.
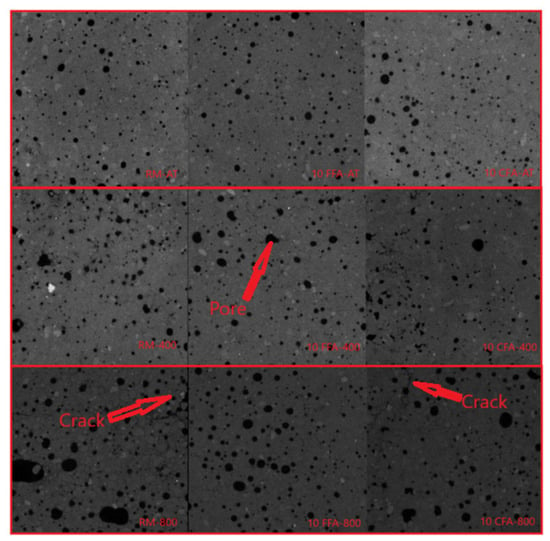
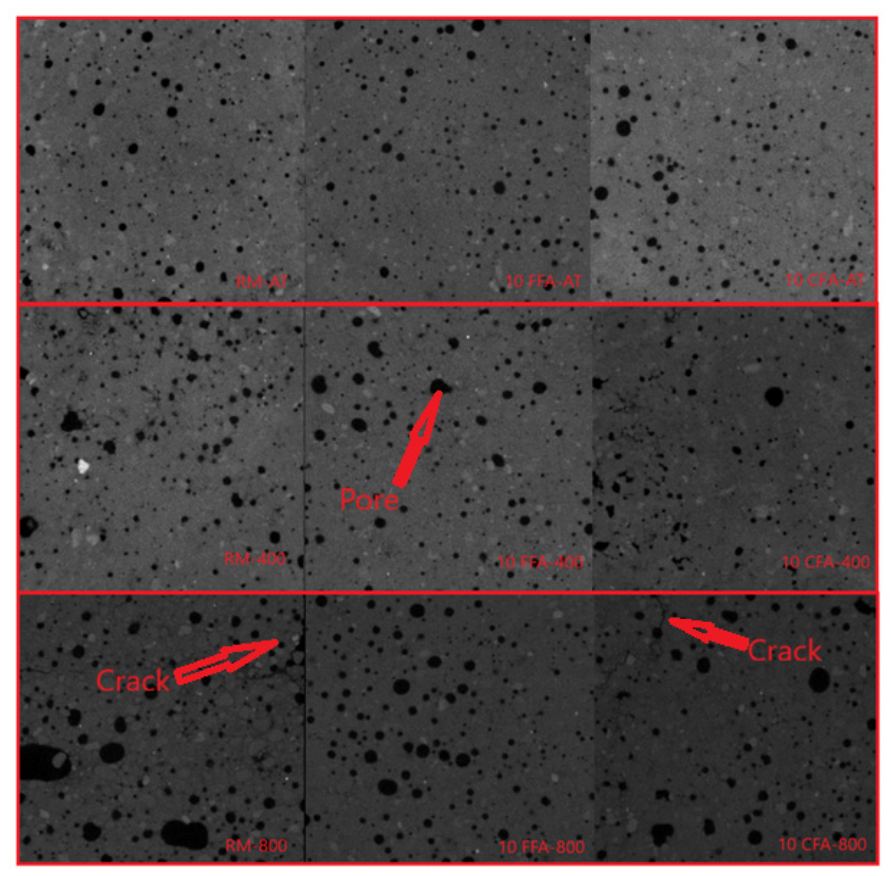
Micro-CT analyses were used to determine void distributions, cracks formed, open and closed void quantities, and total void quantities. As shown in Figure 12, the geometry of the voids varies depending on the different high-temperature effects and the type of substitute material.
While the number of voids was relatively low in the specimens not exposed to high temperatures, a noticeable increase in void content was observed in the specimens exposed to 400 and 800 °C. In addition, it is thought that cracks formed in the samples exposed to 800 °C, and that a cracked structure was formed with the deterioration of C-S-H structures at these points. Studies in the literature have also stated that a significant loss of strength occurs between 600 °C and 800 °C [21]. Figure 12 and Figure 13 show that the 10 FFA-800 and 10 CFA-800 specimens exhibited substantially fewer cracks than the RM-800 specimen. This finding suggests that FA substitution contributed to the densification of the mortar matrix [35] and enhanced the crack resistance of cement mortars under high-temperature exposure [19].
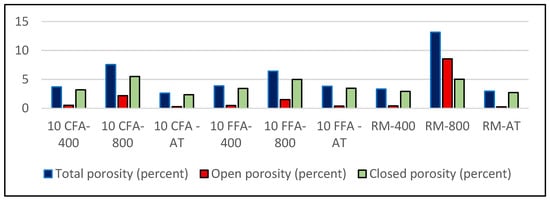
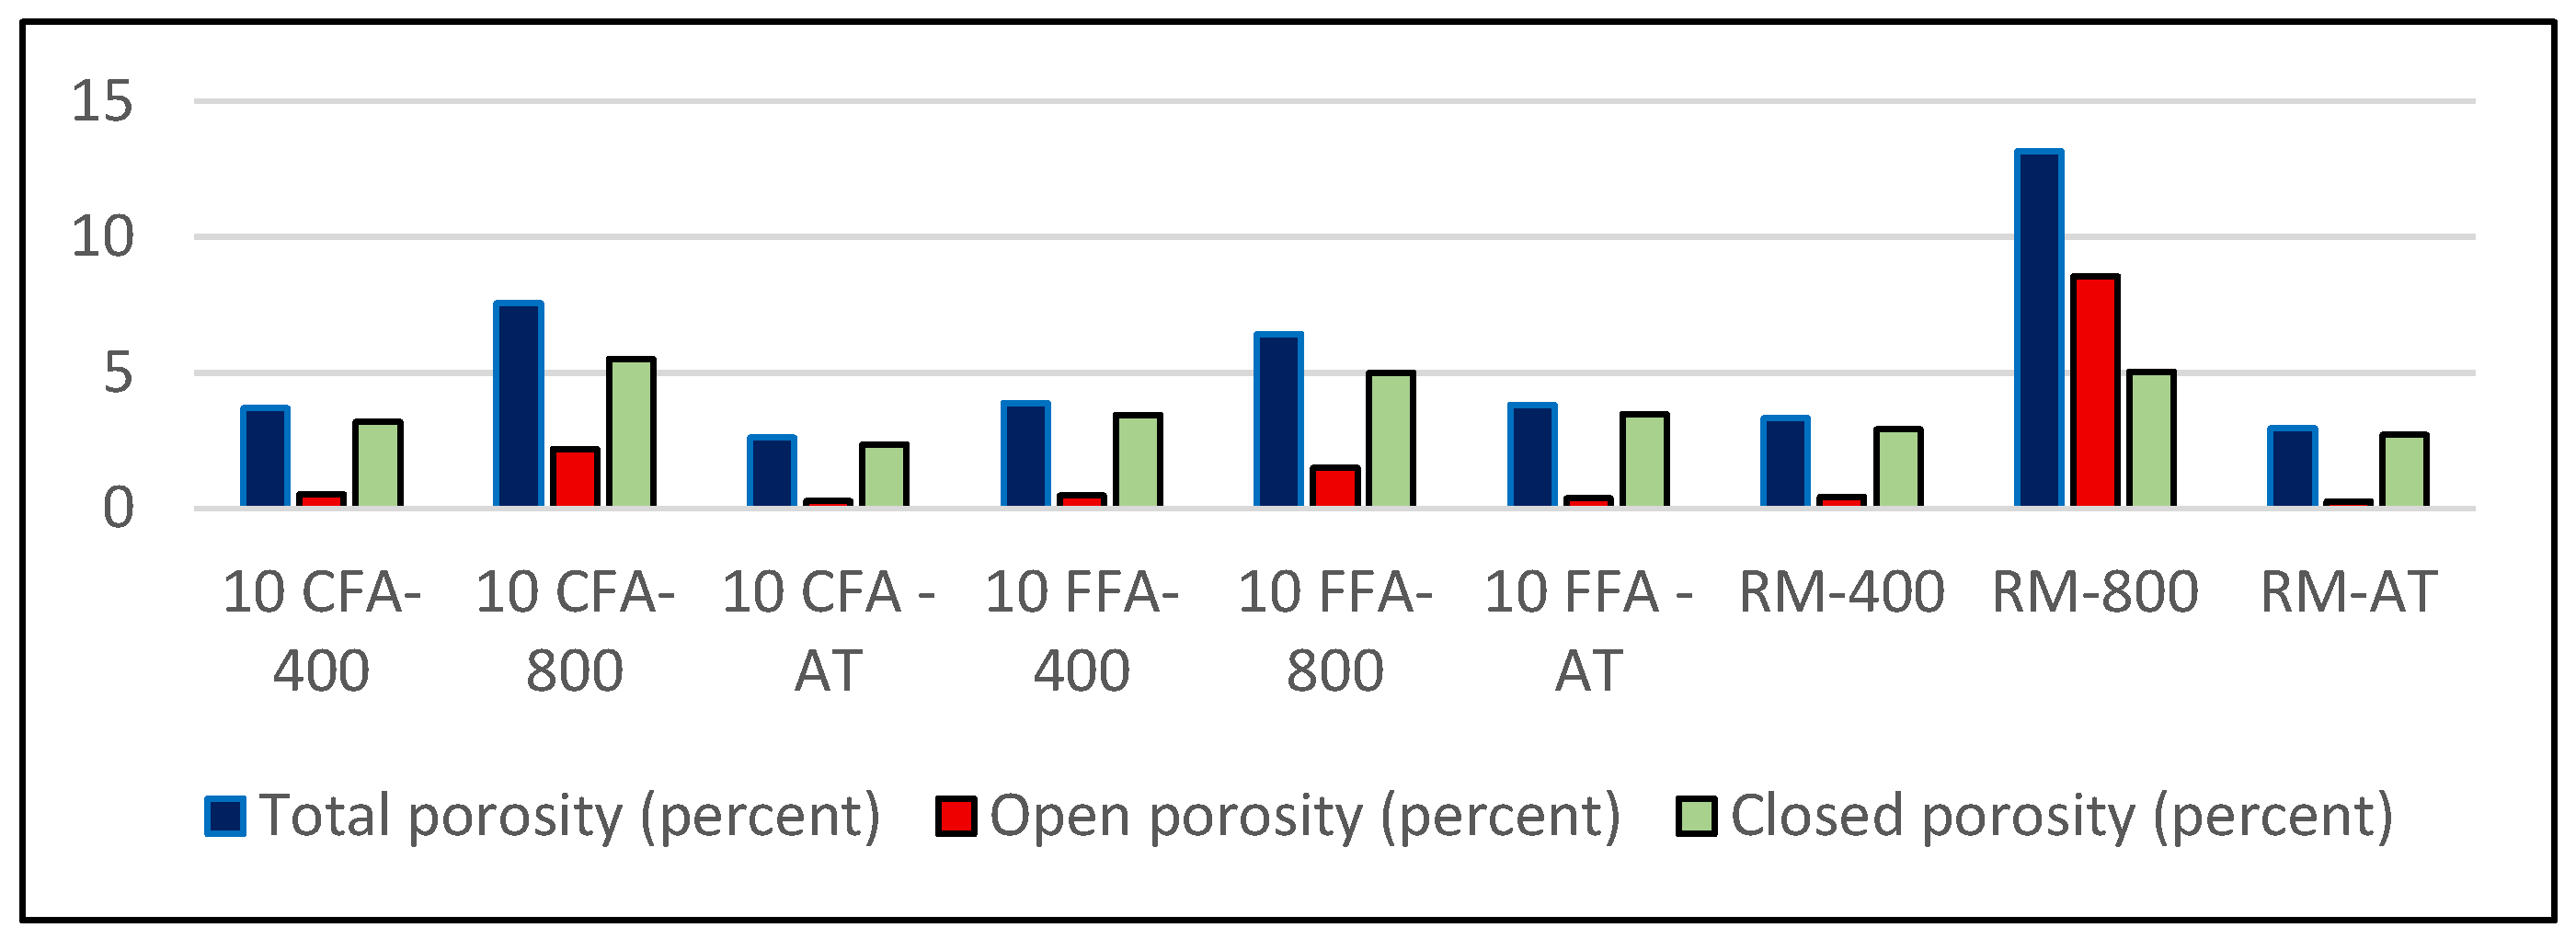
Micro-CT analyses determined the open, closed and total void amounts of the samples. In line with these results, as shown in Figure 14, a significant increase in the number of pores was observed after exposure to high temperatures, especially in samples exposed to 800 ᴼC, as stated in previous studies [36]. However, no significant change in the number of voids was observed in samples exposed to 400 ᴼC compared to samples kept at ambient temperature. Studies in the literature clearly state that the deterioration occurs especially after 400 ᴼC [20].
Figure 14.
Void ratios determined by micro-CT analyses.
As shown in Figure 14, the highest number of voids is observed in the RM-800 sample (13.15%), while the lowest number of voids is found in the 10 CFA-AT sample (2.62%). The effect of high temperatures is clearly seen in the RM-800 sample. In the 10 CFA-AT samples, it is thought that the use of Class C fly ash increases the filling ratio of the mortar matrix, leading to a lower void content. When the open and closed void ratios were examined, it was observed that while the number of closed voids was similar in the samples exposed to 800 °C, the number of open voids increased significantly compared to the samples tested at 400 °C and ambient temperature. It was seen that the high temperature (800 °C) increased the number of open voids even more. It was determined that FA substitution significantly reduced the number of open voids under the influence of high temperature.
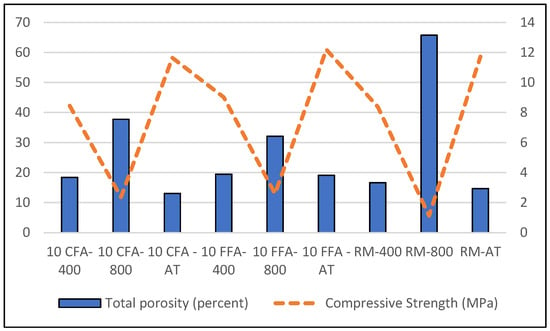
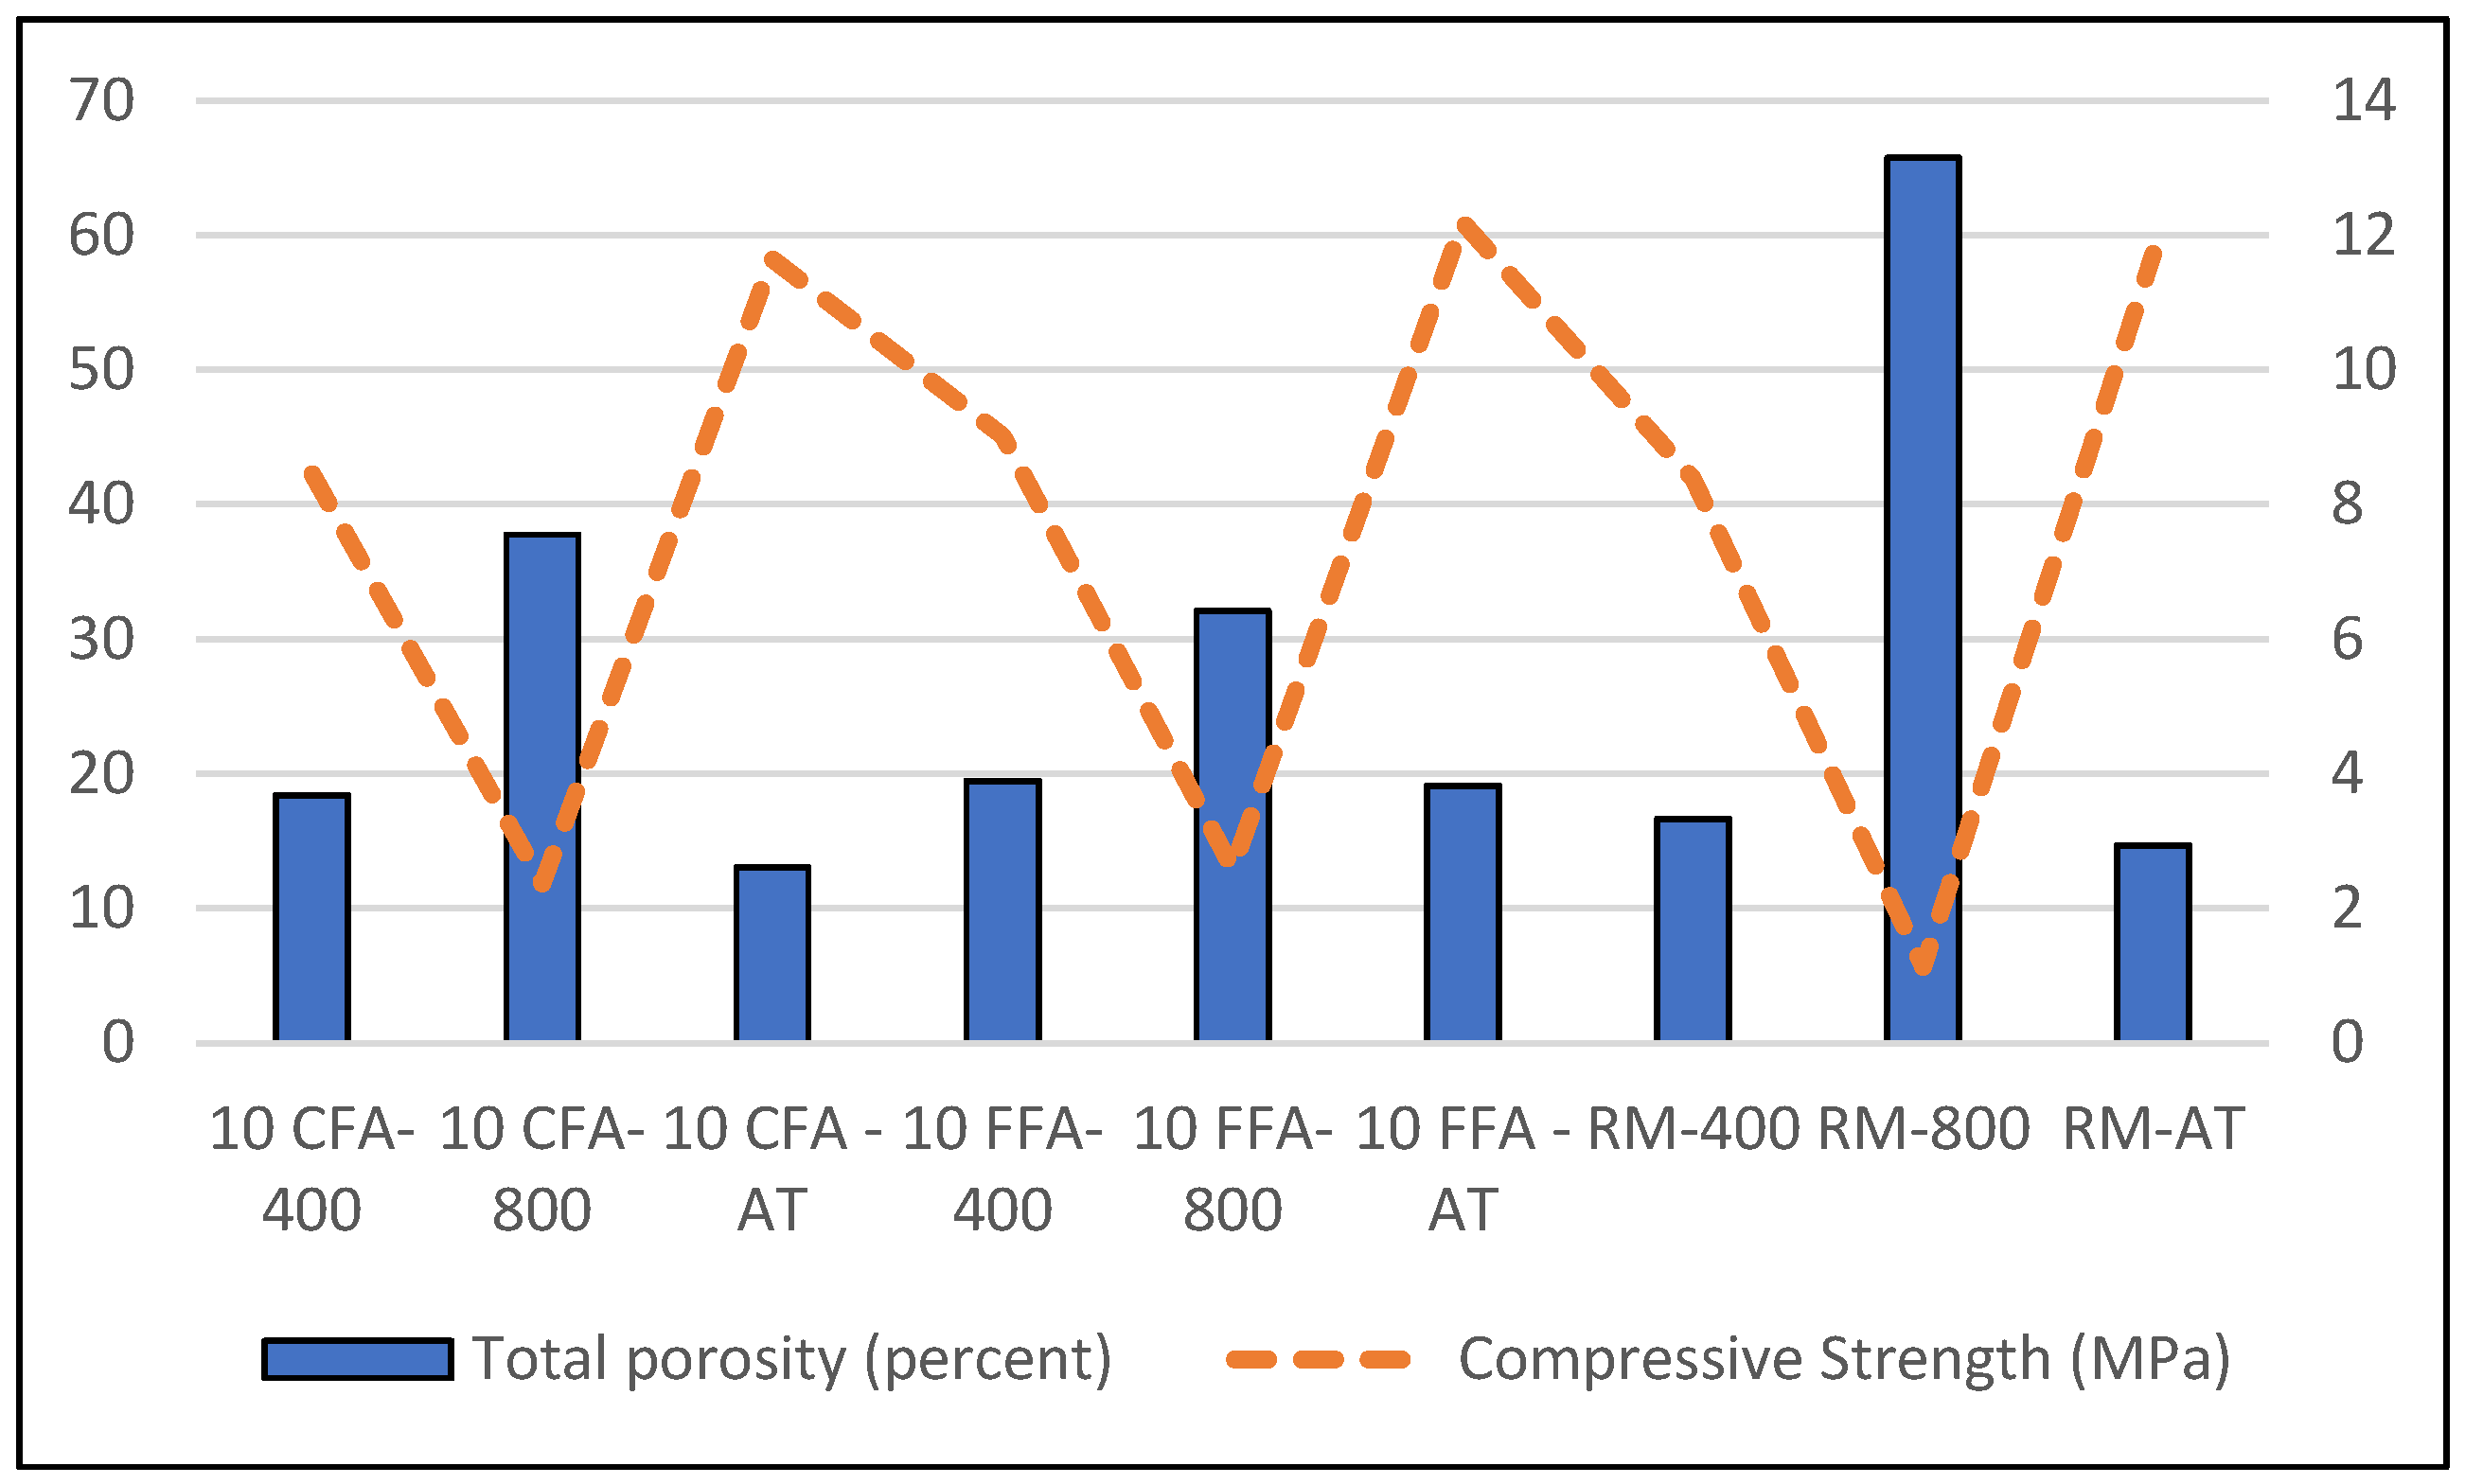
Figure 15 attempts to establish a relationship between compressive strength change and void number. According to the results, strength losses occurred as the void number increased. In the RM-800 sample with the highest void share (13.15%), the compressive strength was 5.64 MPa, while in the 10 CFA-AT sample with the lowest void share (2.62%), the compressive strength was 58.25 MPa. It is seen that the compressive strength values of cement mortars under high-temperature effects are consistent with the void structure analyses. It is thought that with FA substitution, hydration products increase and additionally increase the filling ratio of the material, which improves mechanical properties and reduces porosity [35]. Experimental findings show that FA can have a microstructure improving effect. The filling effect it creates, the reduction in capillary voids, the improvement of the aggregate–paste transition zone and the reaction of amorphous silica-containing ash components with Ca(OH)2 to form a secondary C-S-H gel are considered to be the main mechanisms supporting strength improvement and resistance.
Figure 15.
Relationship between total porosity and compressive strength.
3.4.3. Petrographic Analysis of Cement Mortars
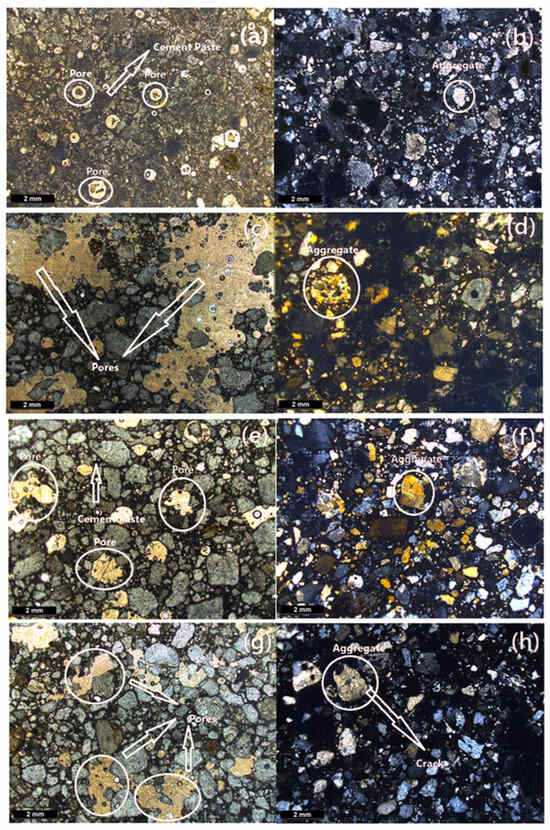
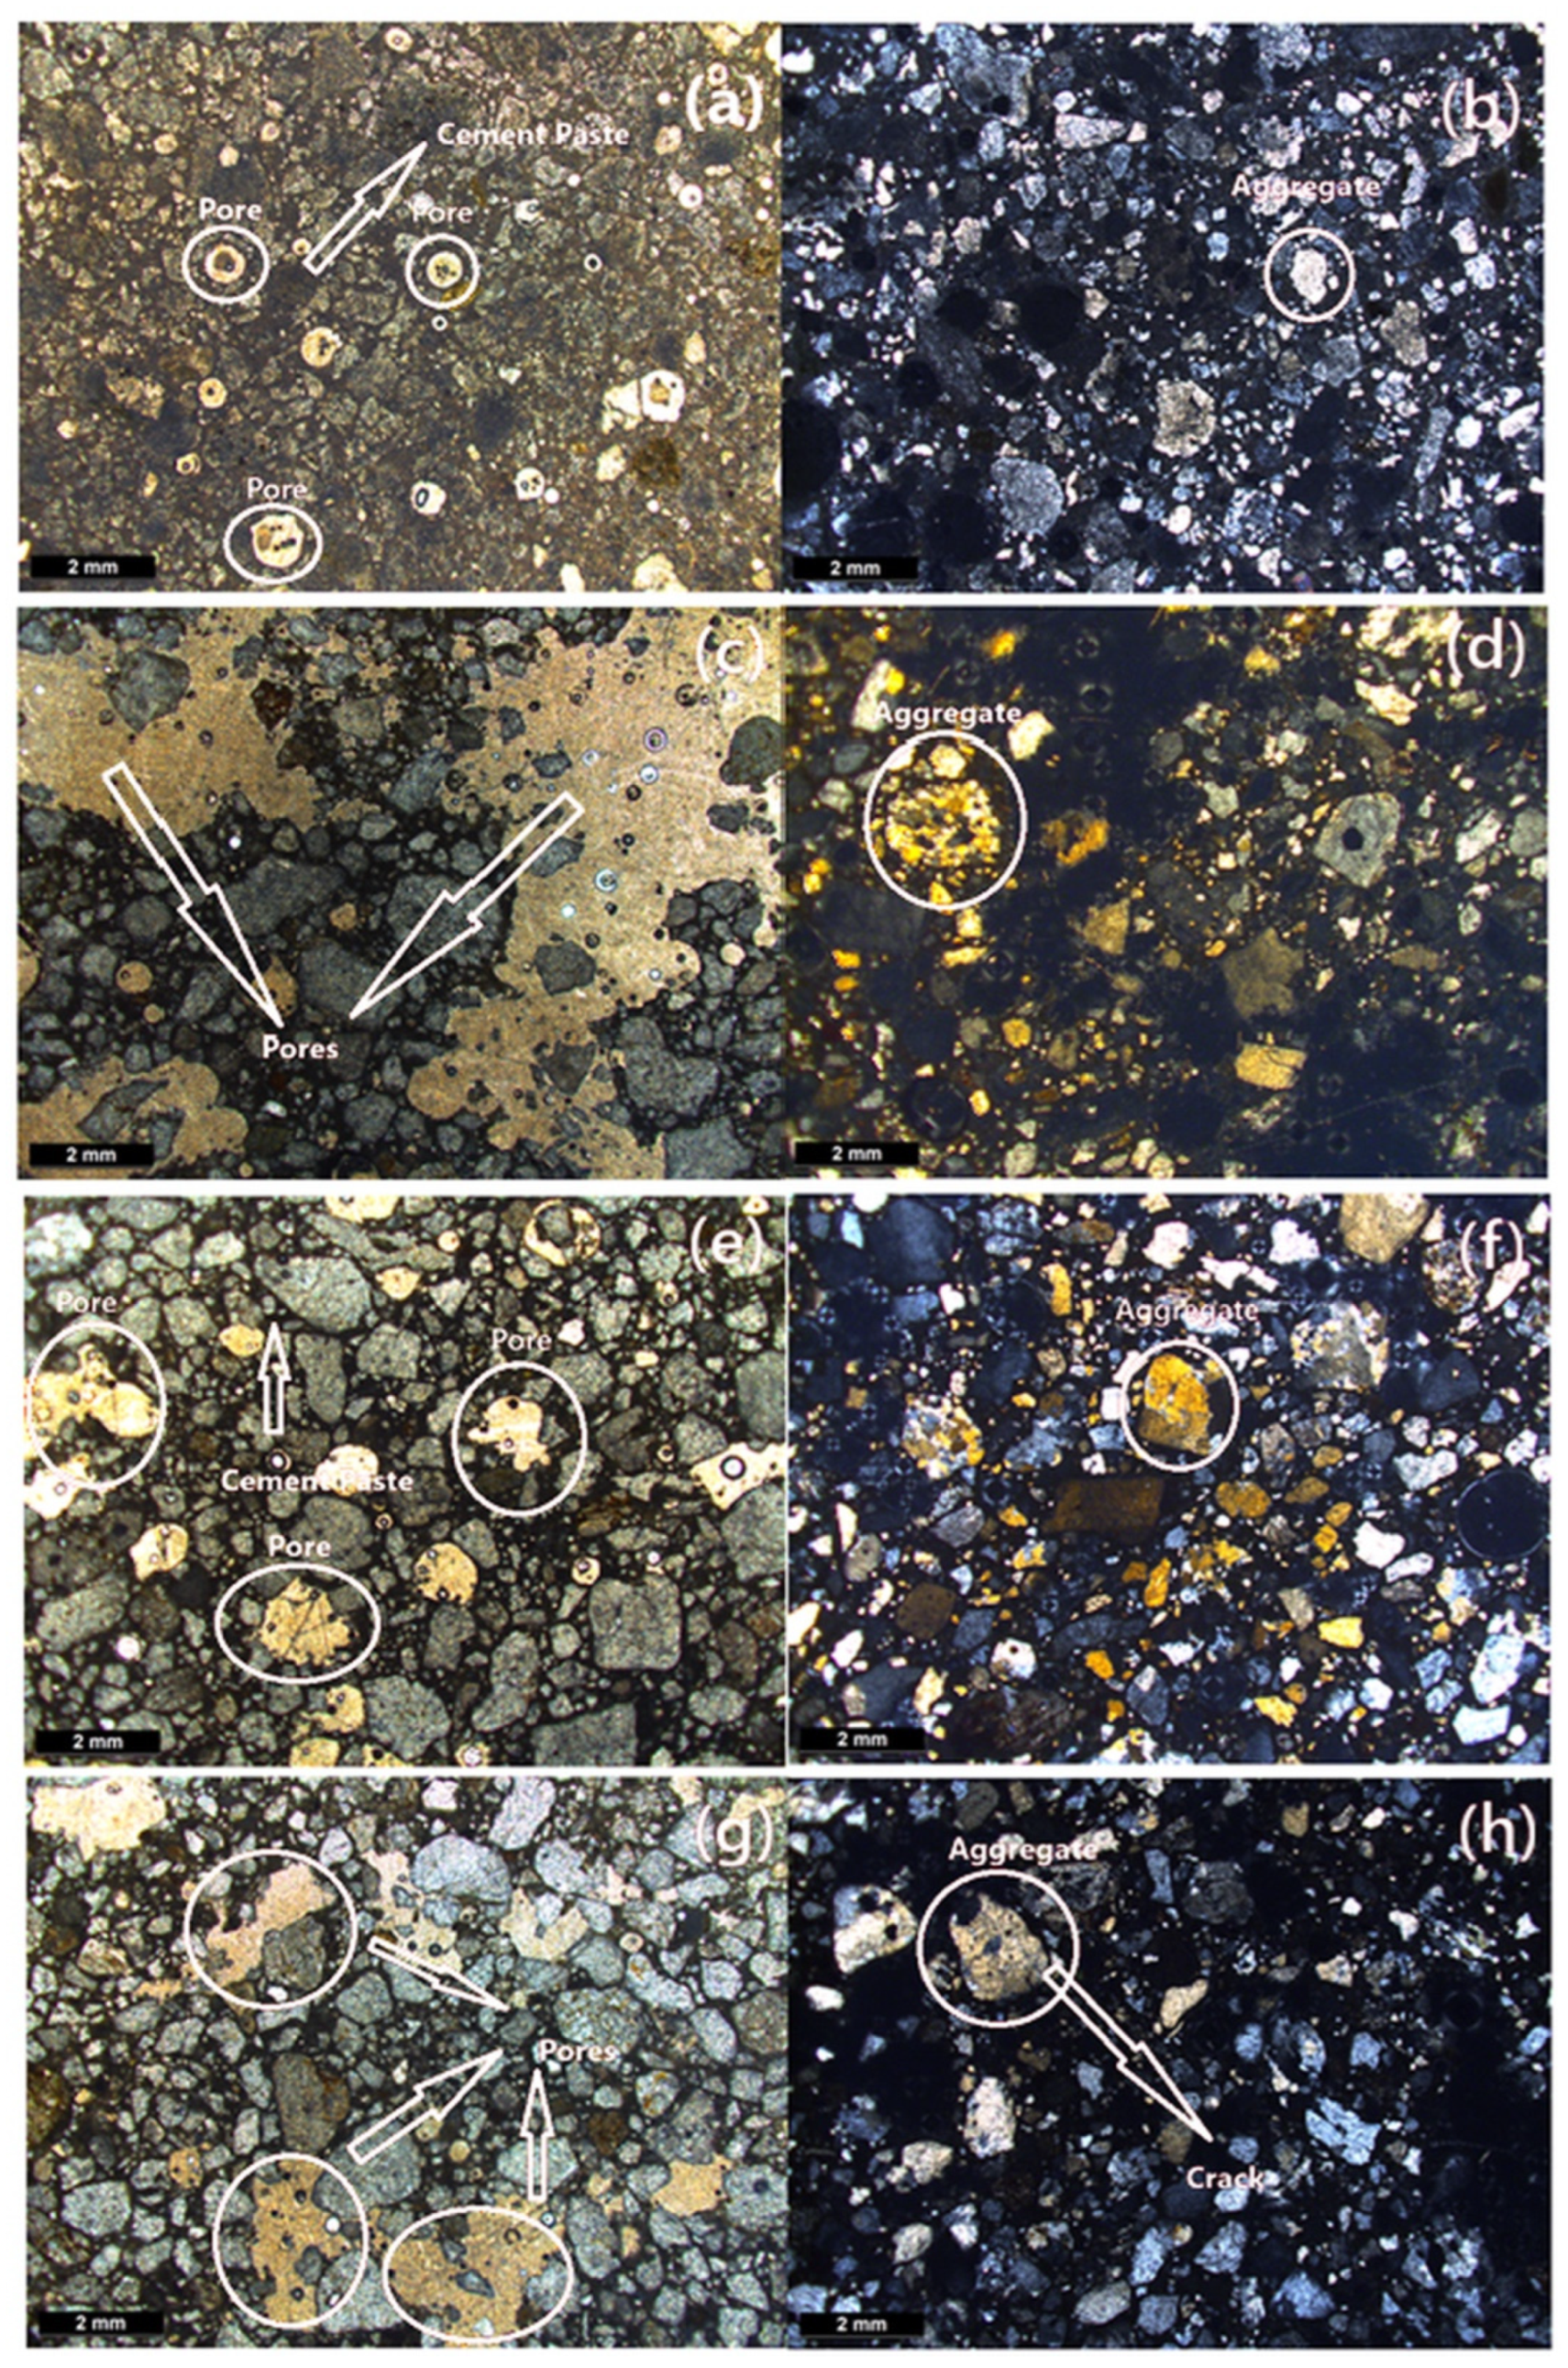
In this study, the petrography of mortars was carried out to examine crack development, void structure at the interfaces, and deterioration in the aggregate structure. In this context, petrographic analyses of cement mortars with 10% Class C and Class F fly ash substitution were performed, along with reference sample shown in Figure 16. To observe the effect of high temperatures on the mortars, petrographic analyses of samples unexposed to any temperature and samples exposed to a high temperature of 800 °C were examined.
Figure 16.
Petrographic analyses: (a,b) RM-AT, (c,d) RM-800, (e,f) 10 FFA-800, (g,h) 10 CFA-800.
Petrographic analyses of the reference samples (RM-AT) (a,b) revealed that the naturally occurring voids had a circular morphology, were homogeneously distributed throughout the sample and had diameters of less than 1 mm. Furthermore, since the samples were not exposed to high temperatures, no abnormalities were observed in the aggregate phase. In reference mortar exposed to 800 °C, Figure 16c,d show that voids and deteriorations can be observed almost everywhere in the sample, the geometry of all circular voids is distorted, and they become interconnected irregular voids. Furthermore, micro-CT analyses show an increase in the number of open voids, supporting the situation observed in the images. This situation causes localized cracks and fractures in the cement mortar, leading to significant strength losses. Additionally, Figure 16d shows that serious deterioration has occurred in the aggregate structure, and it has completely lost its properties. In Class C and Class F FA-substituted cement mortars exposed to 800 °C, it was observed that the round, small, and regular voids became irregular, and their number increased compared to the reference sample (RM-AT). Furthermore, the formation of irregular secondary voids and fractures and cracks in the aggregates were determined. Comparing the RM-800 and 10 CFA-800 samples, it was found that FA substitution significantly reduced the number of voids and cracks. In the 10 FFA-800 samples, irregular and geometrically altered voids were reduced compared to the reference sample (RM-800), while both the void quantity and the number of cracks were much lower compared to the RM-800 sample. Additionally, as seen in Figure 16f,h, slight deteriorations in the aggregate structure were also observed.
In conclusion, petrographic studies are among the methods used to identify many concrete problems, including problems that may occur after a fire [37]. In this study, it was determined that high temperatures disrupted the structure of the cement matrix and aggregate, and similar situations have been reported in the literature [38]. However, it is also known that pores formed in concrete, independent of high temperature, naturally occur during the concrete pouring or curing process [39]. In line with this information, it was clearly seen that the number and structure of voids increased significantly with increasing temperature, but the substitution of Class C and F FA limited the number of voids and the deterioration in the mortar structure.
3.4.4. Thermogravimetric Analysis Results
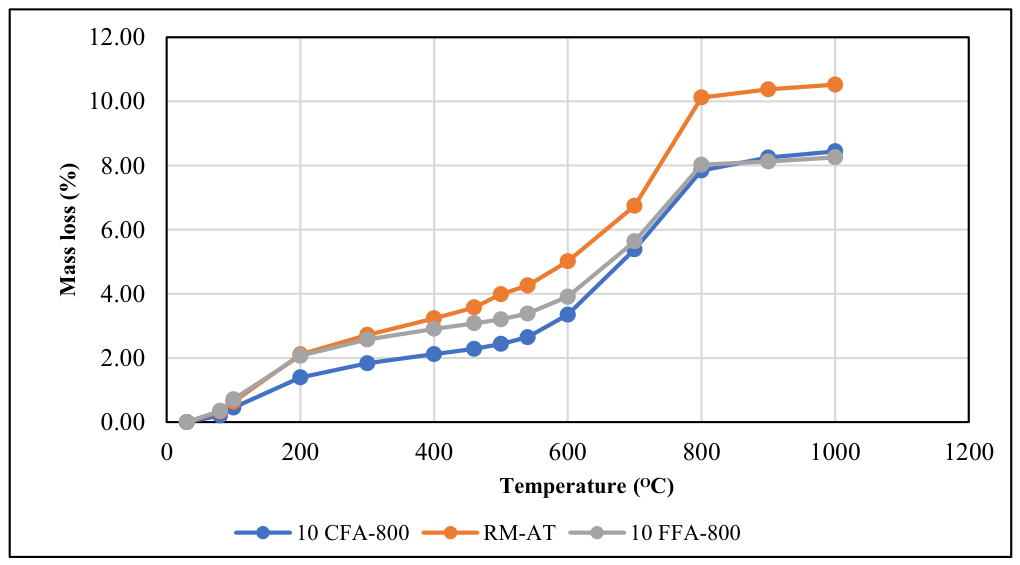
One of the primary reasons for TGA measurements in the cement and concrete field is to measure free water and bound water (degree of hydration), and the second is to determine the amounts of Ca(OH)2 and CaCO3 [40]. In the study by Pittrich et al., it was reported that a temperature change in the range of 20–200 ᴼC causes the evaporation of free and physically bound water, and the dehydration and decomposition of C-S-H gel in the range of 80–800 ᴼC causes the dehydration of Portlandite mineral in the range of 460–540 ᴼC and the decomposition of calcium carbonate (limestone) in the range of 600–900 ᴼC [41].
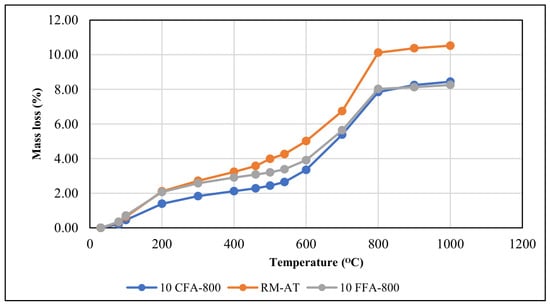
Mass losses in C-S-H resulting from the evaporation of free water, the decomposition of CH, and the decarbonization of calcium carbonates can be quantitatively determined by thermogravimetric analysis [42]. In this context, tests were carried out for Class C and Class F fly ash-substituted cement mortars previously exposed to 800 °C together with the reference sample (RM-AT) and the weight losses are presented in Figure 17 and Table 3.
Figure 17.
Mass losses determined by TGA.
Table 3.
Total mass loss determined by TGA.
According to thermogravimetric analysis (TGA) results, the RM-AT sample, which was not exposed to high temperatures, showed a higher mass loss compared to the 10 FFA-800 and 10 CFA-800 samples exposed to 800 °C. Mass loss in the 460–540 °C range was found to be 0.68% in the RM-AT sample, 0.37% in the 10FFA-800 sample, and 0.30% in the 10CFA-800 sample. This indicates that some of the Ca(OH)2 decomposed beforehand in the samples exposed to high temperatures, and the difference observed between Class C and Class F fly ash substitutes is due to the reaction of Class F fly ash with Ca(OH)2. Mass loss in the 600–900 °C range was measured as 5.36% in the RM-AT sample, 4.22% in the 10FFA-800 sample, and 4.90% in the 10CFA-800 sample. As stated in the literature [41], CaCO3 decomposes at high temperatures. Since there was no prior high-temperature effect in the RM-AT sample, the TGA analysis results show that the amount of decomposed CaCO3 in this sample is high. In contrast, the lower mass losses observed in the fly ash-containing samples are thought to reflect the combined effects of the addition of fly ash and previous thermal exposure.
4. Conclusions
In this study, the high-temperature performance of cement mortars containing 5%, 10%, 15%, and 20% Class C and F fly ash was comparatively evaluated.
Among the mixtures exposed to 800 °C, it was determined that Class F fly ash-added mortars exhibited the highest performance at this temperature, reaching a compressive strength of 12.96 MPa, and showing a strength significantly higher than the reference mortar (5.64 MPa). Looking at the other temperature values, the lowest compressive strength at 600 °C was 20.84 MPa for cement mortars with 20% Class C fly ash substitution, whereas the highest was 27.68 MPa for those with 10% Class F fly ash. At 400 °C, the lowest and highest compressive strengths were determined as 36.01 MPa and 45.07 MPa for the 20% Class C and 10% Class F fly ash-substituted mortars, respectively. Micro-CT, microstructural analyses, and petrographic observations showed that the addition of fly ash contributed to a denser and more stable microstructure under high temperatures. Thermogravimetric analyses supported the observation that mass losses in mortars containing fly ash were consistent with their mechanical performance.
A comparison of reference samples, specifically Class C and Class F fly ash-substituted cement mortars, revealed that Class F fly ash-substituted cement mortars exhibited higher strength values under high temperatures. Class C fly ash-substituted cement mortars showed better strength than reference samples at 5% and 10% substitution rates under high-temperature conditions. However, cement mortars containing 10% Class F fly ash substitution showed better strength compared to all Class C- and Class F-substituted mortars. When comparing the porosity levels, the total void ratios of the samples exposed to 800 °C were 13.15% for the reference samples, 7.55% for mortars with 10% Class C fly ash substitution, and 6.42% for mortars with 10% Class F fly ash substitution, respectively. Furthermore, microstructure analyses, micro-CT analyses, concrete petrography analyses, and thermogravimetric analyses demonstrated that cement mortars containing 10% Class F fly ash substitution were more usable under high-temperature conditions.
This study investigated the behaviour of mortar mixtures prepared with Class C and F fly ash under controlled high-temperature exposure after a 28-day curing period. The main limitations of this study are that high-temperature tests were not performed on large-sized structural elements and the effect of reinforcement in the concrete was disregarded. Considering these limitations, future research focusing on larger structural elements will make significant contributions to the literature.
Funding
This research received no external funding.
Data Availability Statement
The original contributions presented in this study are included in the article. Further inquiries can be directed to the corresponding author.
Conflicts of Interest
The author declares no conflict of interest.
References
- Guzelkucuk, S.; Demir, I.; Sevim, Ö.; Kalkan, I. Mechanical properties and microstructure of cement multicomponent systems containing pozzolan materials under sulfate attack. Cem. Wapno Beton 2020, 25, 137–153. [Google Scholar] [CrossRef] [Scilit]
- Oyejobi, D.O.; Adewuyi, A.P.; Yusuf, S.O.; Oyebanji, Y.O.; Suleiman, I.; Hassan, I.A. Performance of blended cement mortar modified with fly ash and copper slag. Mater. Today Proc. 2023, 86, 104–110. [Google Scholar] [CrossRef] [Scilit]
- Jaramillo, H.Y.; Vasco-Echeverri, O.; López-Barrios, R.; García-León, R.A. Optimization of Bio-Brick Composition Using Agricultural Waste: Mechanical Properties and Sustainable Applications. Sustainability 2025, 17, 1914. [Google Scholar] [CrossRef] [Scilit]
- Zhao, X.; Xie, J.; Dai, Q.; Mensah, C. Performance and Carbon Reduction of Binary and Ternary Concrete Systems with Slag Cement and Fly Ash. J. Build. Eng. 2026, 130, 117087. [Google Scholar] [CrossRef] [Scilit]
- Ritu; Seeni, B.S.; Sharma, S.; Siddique, R. Effect of High-Volume Fly Ash on the Engineering Properties of Pervious Concrete—A Techno-Sustainability Assessment. Constr. Build. Mater. 2026, 527, 146484. [Google Scholar] [CrossRef] [Scilit]
- Sun, Y.; Wang, K.Q.; Lee, H.S. Prediction of compressive strength development for blended cement mortar considering fly ash fineness and replacement ratio. Constr. Build. Mater. 2021, 271, 121532. [Google Scholar] [CrossRef] [Scilit]
- Gong, J.; Chen, C.; Liu, J.; Li, Z.; Shi, X. Synergistic upcycling of municipal solid waste incineration fly ash and Class F fly ash to prepare a sustainable ternary cementitious composite. J. Build. Eng. 2025, 105, 112474. [Google Scholar] [CrossRef] [Scilit]
- Sevim, Ö.; Demir, İ. Optimization of fly ash particle size distribution for cementitious systems with high compactness. Constr. Build. Mater. 2019, 195, 104–114. [Google Scholar] [CrossRef] [Scilit]
- Kim, T.; Davis, J.M.; Ley, M.T.; Kang, S.; Amrollahi, P. Fly ash particle characterization for predicting concrete compressive strength. Constr. Build. Mater. 2018, 165, 560–571. [Google Scholar] [CrossRef] [Scilit]
- Ahmaruzzaman, M. A review on the utilization of fly ash. Prog. Energy Combust. Sci. 2010, 36, 327–363. [Google Scholar] [CrossRef] [Scilit]
- Hemalatha, T.; Ramaswamy, A. A review on fly ash characteristics—Towards promoting high-volume utilization in developing sustainable concrete. J. Clean. Prod. 2017, 147, 546–559. [Google Scholar] [CrossRef] [Scilit]
- Akbulut, Z.F.; Yavuz, D.; Tawfik, T.A.; Smarzewski, P.; Guler, S. Enhancing concrete performance through sustainable utilization of Class C and Class F fly ash: A comprehensive review. Sustainability 2024, 16, 4905. [Google Scholar] [CrossRef] [Scilit]
- ASTM C618-15; Standard Specification for Coal Fly Ash and Raw or Calcined Natural Pozzolan for Use in Concrete. ASTM International: West Conshohocken, PA, USA, 2015.
- Chang, J.-H.; Selvaraj, S.; Manikandan, S.; Nagarani, S.; Islam, S.; Shkir, M.; Senthilkumar, A.K.; John, A.J.; Ethiraj, S.; Sangaraju, S.; et al. Fly ash carbon composites: A breakthrough in CO2 capture and energy efficiency. Alex. Eng. J. 2026, 135, 450–473. [Google Scholar] [CrossRef] [Scilit]
- He, J.; Li, Z.; Xu, D.; Tang, W.; Rong, H.; Dai, J.; Yang, X. Study on the effect and mechanism of fly ash on the leachability resistance of cement mortar. Case Stud. Constr. Mater. 2026, 24, e05830. [Google Scholar] [CrossRef] [Scilit]
- Gao, M.; Jing, H.; Dai, J.; Ye, W. Effect of Magnesium Slag and Fly Ash on Strength and Hydration Mechanism of Binary and Ternary Blended Cement Mortar. Case Stud. Constr. Mater. 2025, 22, e04531. [Google Scholar] [CrossRef] [Scilit]
- Juanir, R.G.; Gudia, S.E.L.; Go, A.W.; Giduquio, M.B.; Gunarto, C.; Jamora, J.B. Class-C Fly Ash from Coal as a Partial Substitute in Cement-Based Paste and Mortar Design Mix—A Case in the Philippines. Sustain. Mater. Technol. 2024, 39, e00813. [Google Scholar] [CrossRef] [Scilit]
- Peng, C.; Li, Q.; Fan, Y.; Qi, W. Evolution of Elastic Modulus in Fly Ash Cement Mortar Under Acid Rain Exposure. Dev. Built Environ. 2026, 26, 100924. [Google Scholar] [CrossRef] [Scilit]
- Li, Y.; Xu, W.; Zhu, J.; Yang, L. Effect of fly ash content on the performance of hardened cement-based materials suffered from high temperatures. Case Stud. Constr. Mater. 2024, 20, e03217. [Google Scholar] [CrossRef] [Scilit]
- Gao, D.; Yang, L.; Li, Y. In situ monitoring the deterioration processes of hardened cement pastes and mortars exposed to continuous heating. Constr. Build. Mater. 2018, 192, 515–525. [Google Scholar] [CrossRef] [Scilit]
- Chan, Y.N.; Peng, G.F.; Anson, M. Residual strength and pore structure of high-strength concrete and normal strength concrete after exposure to high temperatures. Cem. Concr. Compos. 1999, 21, 23–27. [Google Scholar] [CrossRef] [Scilit]
- Morsy, M.S.; Al-Salloum, Y.A.; Abbas, H.; Alsayed, S.H. Behavior of blended cement mortars containing nano-metakaolin at elevated temperatures. Constr. Build. Mater. 2012, 35, 900–905. [Google Scholar] [CrossRef] [Scilit]
- Ramzi, S.; Hajiloo, H. The effects of supplementary cementitious materials (SCMs) on the residual mechanical properties of concrete after exposure to high temperatures. Buildings 2023, 13, 103. [Google Scholar] [CrossRef] [Scilit]
- TS EN 197-1; Cement—Part 1: Composition, Specifications and Conformity Criteria for Common Cements. Turkish Standards Institution: Ankara, Türkiye, 2012.
- TS EN 196-1; Methods of Testing Cement—Part 1: Determination of Strength. Turkish Standards Institution: Ankara, Türkiye, 2016.
- ASTM. ASTM C1437-15; Standard Test Method for Flow of Hydraulic Cement Mortar. ASTM International: West Conshohocken, PA, USA, 2015.
- Chung, S.-Y.; Kim, J.S.; Stephan, D.; Han, T.S. Overview of the use of micro-computed tomography (micro-CT) to investigate the relation between the material characteristics and properties of cement-based materials. Constr. Build. Mater. 2019, 229, 116843. [Google Scholar] [CrossRef] [Scilit]
- Nassar, R.; Room, S. Comparison of the performance of Class C and Class F fly ash concrete mixtures produced with crushed stone sand. Mater. Today Proc. 2023; in press. [CrossRef] [Scilit]
- Fang, K.; Lin, Z.; Wang, Q.; Hao, J.; Zhuang, S.; Zhou, Y. Magnesium slag–fly ash–cement binders for flowable solidified soil: Hydration behavior, rheological control and strength performance. J. Build. Eng. 2025, 112, 113987. [Google Scholar] [CrossRef] [Scilit]
- Saha, A.K. Effect of Class F fly ash on the durability properties of concrete. Sustain. Environ. Res. 2018, 28, 25–31. [Google Scholar] [CrossRef] [Scilit]
- Jia, Z.; Chen, C.; Shi, J.; Zhang, Y.; Sun, Z.; Zhang, P. The microstructural change of C-S-H at elevated temperature in Portland cement/GGBFS blended system. Cem. Concr. Res. 2019, 123, 105773. [Google Scholar] [CrossRef] [Scilit]
- Ho, L.S.; Van-Pham, D.T.; Huynh, T.P. Strength development and microstructural characterization of eco-cement paste with high-volume fly ash. Results Eng. 2025, 26, 105013. [Google Scholar] [CrossRef] [Scilit]
- Han, T.S.; Zhang, X.; Kim, J.S.; Chung, S.Y.; Lim, J.H.; Linder, C. Area of lineal-path function for describing the pore microstructures of cement paste and their relations to the mechanical properties simulated from μ-CT microstructures. Cem. Concr. Compos. 2018, 89, 1–17. [Google Scholar] [CrossRef] [Scilit]
- Travincas, R.; Pereira, M.F.; Torres, I.; Maurício, A.; Silveira, D.; Flores-Colen, I. X-ray microtomography applied to mortars: Review of microstructural visualization and parameterization. Micron 2023, 164, 103375. [Google Scholar] [CrossRef] [Scilit] [PubMed]
- Liu, Y.; Chen, Z.; Ni, H.; Liu, K.; He, J. High-temperature properties of fly ash and silica fume composite magnesium potassium phosphate cement. Constr. Build. Mater. 2024, 441, 137487. [Google Scholar] [CrossRef] [Scilit]
- Durmuş, G.; Arslan, M. Physical properties of cement mortars exposed to high temperature in various cooling conditions. J. Fac. Eng. Arch. Gazi Univ. 2010, 25, 541–548. [Google Scholar]
- Güngör, G.K.; Akkaya, Y. Petrography methods for the quality and inspection of concrete. In Proceedings of the Concrete 2023 Congress, Istanbul, Türkiye, 8–10 November 2023. [Google Scholar]
- Akçaözoğlu, K. Microstructural examination of concrete exposed to elevated temperature by using plane polarized transmitted light method. Constr. Build. Mater. 2013, 48, 772–779. [Google Scholar] [CrossRef] [Scilit]
- Yang, J.; Moon, J. Experimental study on tracing the initial water-to-cement ratio of hardened concrete using petrography analysis. Constr. Build. Mater. 2023, 403, 133199. [Google Scholar] [CrossRef] [Scilit]
- Oh, D.; Kitagaki, R. Preventing unintended carbonation in hardened cement paste powder during thermogravimetric analysis. J. Anal. Appl. Pyrolysis 2025, 193, 107405. [Google Scholar] [CrossRef] [Scilit]
- Pittrich, T.; Jansen, D.; Weise, F.; Stelzner, L.; Dehn, F. Thermal decomposition in blended cement systems and its effect on fire-induced concrete spalling: Insights from XRD and TGA. Case Stud. Constr. Mater. 2026, 24, e05784. [Google Scholar] [CrossRef] [Scilit]
- Alemu, M.Y.; Yehualaw, M.D.; Nebiyu, W.M.; Nebebe, M.D.; Taffese, W.Z. Marble and glass waste powder in cement mortar. Appl. Sci. 2025, 15, 3930. [Google Scholar] [CrossRef] [Scilit]

Disclaimer/Publisher’s Note: The statements, opinions and data contained in all publications are solely those of the individual author(s) and contributor(s) and not of MDPI and/or the editor(s). MDPI and/or the editor(s) disclaim responsibility for any injury to people or property resulting from any ideas, methods, instructions or products referred to in the content. |
© 2026 by the author. Licensee MDPI, Basel, Switzerland. This article is an open access article distributed under the terms and conditions of the Creative Commons Attribution (CC BY) license.