


Abstract
Assessing historic timber requires separating service history from material variability, surface condition and sampling limitations. This study characterizes Scots pine recovered during renovation of the historic half-timbered residential building at farm no. 5 in Swołowo, Poland, dated to 1869, and compares it with contemporary pine and previously published oak results from the same building. Twenty-four historic-pine tests and four contemporary-reference tests were analysed by mass loss calorimetry at 35 and 50 kW/m2. The study extends earlier work by examining, within one historic-pine dataset, how area-normalized peak and total heat release relate to heat release normalized by initial specimen mass, while placing the results in a shared building-provenance context with published oak data. Mean ignition times of historic series ranged from 31.4 to 65.6 s at 35 kW/m2 and from 12.0 to 19.0 s at 50 kW/m2, versus 48.0 and 12.5 s for the references. Mean peak heat-release rates (pHRRs) were 8.4–32.1% higher in historic pine, whereas heat release per initial specimen mass (Q0) was 7.5–22.5% lower; these opposite directions show that peak intensity and mass-normalized heat contribution are not interchangeable. Area-normalized total heat release (THR) varied in direction. Published historic oak showed consistently lower THR, while its pHRR response depended on surface condition. The material was obtained from a historic building, rather than from a controlled ageing experiment; all historic pine tests came from one structural member, and the reference groups were small and heterogeneous. Two mass-signal discrepancies and incomplete specimen-level anatomical and density data further limit inference. Accordingly, the results do not establish an ageing effect or a fire-reaction classification. Fire-performance assessment of historic timber should consider ignition time, peak heat release and mass-normalized heat release separately, without attributing observed differences to age alone.
1. Introduction
1.1. Pine Wood as a Historic Building Material
Wooden elements in historic buildings combine practical function with material evidence of construction history. Their cross-sections, tool marks, timber selection and joints document past building techniques. Assessment of the surviving material should therefore precede decisions on replacement or protection. Krzysik emphasized the need to consider historic wood in relation to its environment, distinguishing building elements, movable objects and archaeological finds. This distinction remains useful because chronological age alone does not describe preservation conditions [1].
The anatomy of softwood is particularly relevant to pine. Its tissue consists predominantly of tracheids, which provide both conduction and mechanical support, together with wood rays and resin canals. Within each annual ring, thin-walled earlywood differs from thick-walled latewood. These differences influence local density, porosity and anisotropy. Wdowiak describes the anatomy of Scots pine and other structural timbers, while Karlman et al. demonstrate variability in density and latewood content in pine and larch. A single density value should therefore not be assumed for all pine specimens, nor should narrow growth rings be equated with uniform material condition [2,3].
Pine differs from oak in more than its tracheid-based structure, rather than a vessel–fibre system. Differences also concern hemicelluloses, lignin structure and extractives. Galactoglucomannans form an important hemicellulose fraction in softwoods, whose lignin is predominantly guaiacyl-type; xylans and guaiacyl–syringyl lignin are more prominent in many hardwoods. The thermal response of a lignocellulosic composite depends on interactions among these fractions, and their distribution and transport conditions, rather than the behaviour of one isolated component. Comparisons between oak and pine consequently require species-specific interpretation [4,5].
Extractives further differentiate regions within a stem. Krutul and Buzak found that extractive content in the pine examined decreased from the pith towards the periphery, with variation according to stem position. They did not identify a simple relationship allowing extractive content to be predicted from ring width or latewood proportion alone. Assessment of historic pine should therefore distinguish sapwood from heartwood, and account for possible resin enrichment. Similar specimen masses do not guarantee similar chemical composition or equivalent proportions of readily volatilized compounds [6].
1.2. Service History, Material Condition and Ageing
Natural ageing comprises slow changes over time, whereas degradation denotes changes caused by specific agents such as microorganisms, moisture, radiation or temperature. These processes overlap in real buildings. Reviews by Kránitz et al. and Cavalli et al. document the diversity of findings on old wood and the difficulties of comparison with contemporary references. Unknown initial properties, loading history and selection of surviving fragments may affect the results as strongly as age. Changes in stiffness and strength cannot, therefore, be predicted solely from a building’s construction date [7,8].
Hemicelluloses and accessible polysaccharide regions are particularly susceptible to change within the cell wall. Hydrolysis, oxidation and biological decay can modify chain length, functional groups and internal surface accessibility. Lignin also changes, and an increased percentage of lignin may result from preferential carbohydrate loss, rather than the formation of additional lignin. Ghavidel et al. observed different changes in chemical structure and crystallinity indices in naturally aged spruce and fir, depending on the specimen and exposure history. Although these are other softwood species, their results illustrate the limitations of a unidirectional ageing model [9].
Studies on Scots pine provide a more direct context. Broda et al. demonstrated that biological and chemical degradation produce different changes in cell-wall composition and microstructure. Subsequent work also found that changes in sorption and viscoelastic behaviour depend on the degradation pathway. These studies used deliberately prepared model materials, rather than timber with the same history as the historic pine examined here. Their relevance is that similar outward signs of deterioration can have different causes and need not correspond to a single direction of change in equilibrium moisture content [10,11].
Evidence from archaeological and waterlogged wood demonstrates that degradation is strongly environment-dependent and that density, porosity, chemistry and biological damage can vary spatially [12,13,14,15,16,17,18,19,20]. Those studies are retained only as methodological context: their numerical results and conservation-treatment effects are not transferred to the present dry building timber. Tree age at felling, time in service, and degradation history are, likewise, treated as distinct variables [21].
1.3. Flammability and Interpretation of Calorimetric Tests
Wood exposed to heat undergoes heating and drying, thermal decomposition, volatile release, ignition and char formation. Parameters describing these stages need not change in the same direction. Calorimetric studies by Spearpoint and Quintiere, Tran and White, and Harada demonstrate dependence on species, moisture, thickness, exposure orientation and heat flux. Bartlett et al. organize these relationships in a broader review of wood burning. Time to ignition, peak heat-release rate and total heat release describe different response dimensions, and should not be combined into an unsupported single percentage of flammability [22,23,24,25].
The pyrolysis experiments of Yang et al. confirm differences among lignocellulosic constituents. However, they concern component decomposition under specified conditions, rather than direct ignition of a solid specimen approximately 40 mm thick. Char development under changing or constant thermal exposure is a separate issue, examined in the charring-rate model of Yang et al. Heat flux and the evolving residue affect the measured response even when the initial composition is unchanged [26,27].
Monder et al. included pine as a reference material, but used a fire-tube method. Their findings support considering density and chemistry together, although the numerical values are not interchangeable with MLC results. The guidance of Schartel and Hull on calorimetric interpretation helps distinguish heat-release intensity, fuel quantity and residue properties. The integration interval and normalization method must also be defined explicitly [28,29].
Jurecki, Wieruszewski and Grześkowiak previously examined historic oak by mass loss calorimetry at 35 and 50 kW/m2 [30]. The subsequent Materials article by Jurecki et al. combines oak MLC results with scanning electron microscopy and energy-dispersive X-ray spectroscopy (SEM–EDS), and documents the source as a half-timbered residential building dated to 1869 at farm no. 5 in Swołowo, Poland [31]. The historic pine examined here originates from that same building, providing a shared historical context for comparison. This common origin does not establish identical exposure histories for individual members or permit oak surface classifications to be transferred to pine series. Chorlton and Gales compared historic timber with contemporary products, including glued timber, illustrating that reference selection can introduce technological differences, alongside age [32].
Direct studies of naturally aged pine are also available. Deng et al. combined microscopy, thermal analysis and cone calorimetry to compare fresh and naturally aged pine. Dúbravská et al. linked charring of historic pine with chemical analysis and FTIR. Pánek et al. examined a different exposure regime: two years of natural weathering of selected softwoods did not alter ignition and relative burning rate in their flame test. Together, these studies emphasize ageing conditions and measurement method, rather than a universal trend [33,34,35].
Mechanistic interpretation requires complementary methods. Pandey and Pitman used FTIR to study chemical changes following fungal decay; Lionetto et al. examined crystallinity during pine weathering; and Poletto et al. investigated relationships between cellulose structure and thermal properties in lignocellulosic materials. Park et al. demonstrated that crystallinity indices depend on the determination method. Heat-release rate (HRR) and total heat release (THR) should, consequently, not be treated as surrogate measurements of lignin content or cellulose crystallinity [36,37,38,39].
Previous thermal and chemical treatments are additional possible sources of variation. Reviews by Esteves and Pereira and by Zelinka et al. describe controlled wood modification and the wide range of properties affected. They do not establish that the present pine was modified; they support checking conservation records before attributing differences to natural ageing [40,41].
1.4. Research Gap and Objectives
Existing studies do not resolve how heterogeneous historic Scots pine recovered from a building performs in mass loss calorimetry when area-normalized and mass-normalized heat-release indicators are considered together. In particular, it remains unclear whether differences relative to contemporary pine have a consistent direction for ignition time, pHRR, area-normalized THR, and heat release per unit of initial specimen mass. The present study addresses this measurement and interpretation gap using historic pine recovered during renovation of a half-timbered building. The material was not collected as a controlled, building-wide probability sample, and the tests do not isolate chronological ageing from member history, anatomy or surface condition. Published oak results from the same building provide historical context, but species and surface-condition differences prevent a controlled pine–oak comparison.
The objective was to characterize the reaction to fire of historic Scots pine and compare it with contemporary pine at the same nominal heat flux, and then describe the results alongside published oak data from the same building. The analysis addressed three questions: (1) whether ignition time changed consistently across the historic-pine series; (2) whether pHRR and THR showed similar directions of change; and (3) whether normalization by initial specimen mass altered the interpretation of heat release. The oak comparison was used to identify descriptive similarities and differences, not to estimate a causal species effect. No hypothesis that age alone increases or decreases flammability was adopted.
2. Materials and Methods
2.1. Material Origin and Identification of the Dataset
The historic material was identified as Scots pine (Pinus sylvestris L.) and was recovered during renovation of the half-timbered residential building at farm no. 5 in Swołowo, Pomeranian Voivodeship, Poland, in the region known as “Kraina w Kratkę”. The source was a historic structural timber element from the building; the material provenance and limits of the sampling procedure are described below.
The building was dated to 1869, on the basis of a date carved by the builders into an upper-storey timber-frame member and found beneath the plaster. This is construction-date evidence, not dendrochronological dating of the sampled wood. The supplied material history attributes the timber to eighteenth-century growth and estimates that the source tree was more than 100 years old when the timber was installed. If installation coincided with construction in 1869, this estimate places the beginning of tree growth before approximately 1769, but does not date each sampled growth ring. Tree age before felling, the formation date of an individual growth ring, and the duration of service in the building are, therefore, distinguished.
The timber was selected at random from the historic pine material made available during renovation; this selection does not constitute a probability sample of all structural members in the building. All 24 historic specimens tested in this study were cut from one structural member of the external timber frame. The sampled member formed part of the outer building envelope, and had been exposed to variable outdoor weather conditions. The material originated from the same building and revitalisation context as the historic oak described by Jurecki et al. [31]. Contemporary Scots pine was used as the reference material.
The pine dataset comprised 24 historic-material tests and four contemporary-reference tests. Each test was represented by an instrument report and its corresponding numerical export. Report–export matching used the “Data filename” field, rather than the external filename alone. Each matched pair represented one test, not two replicates. The original analysis checked all 28 pairs.
Historic pine was retained in six series: AI, AII, BI, BII, CI, and CII. The first four contained five tests each, while CI and CII contained two each. AI—building exterior zone, AII—beam mid-zone, and CI—building interior zone were tested at 35 kW/m2; BI—building exterior zone, BII—beam mid-zone, and CII—building interior zone were tested at 50 kW/m2. Modern pine references were designated R35 (35R1 and 35R2) and R50 (50R3 and 50R4). CI2z and CII2z identifiers were retained, without interpretation of the “z” suffix. These are laboratory series and specimen identifiers within a single-element dataset, not identifiers for separate buildings or independent source members. These labels were not assigned to degradation classes, but only to the origin of the examined surface. The anatomical orientation was mixed, and the wood in the outer and inner layers of the building contained a negligible proportion of sapwood, while the middle part consisted exclusively of heartwood. AI–BI and AII–BII were not treated as matched pairs of samples. Table 1 summarizes the series.
Table 1.
Pine series and specimen characteristics. Initial mass and thickness are mean ± sample standard deviation. The approximate bulk-density indicator ρ* is calculated from series means and the reported specimen plan dimensions of 99 mm × 98 mm; it is not a mean of individual density measurements.
2.2. Specimen Preparation and Test Conditions
Tests were performed in the flammability laboratory of the Faculty of Wood Technology using a mass loss calorimeter manufactured by Fire Testing Technology (FTT; serial no. 1401020, 2013, A Judges Scientific PLC Company, West Sussex, UK) and FTT MLCCalc software (2008, A Judges Scientific PLC Company, UK). The procedure was reported as ISO 13927:2015 [42], which uses a conical radiant heater and a thermopile detector, rather than oxygen-consumption calorimetry. The cited edition records the procedure reported for these tests; it is not a claim that this is the latest edition of the standard.
Specimen length and width were 99 mm × 98 mm, respectively. Recorded thicknesses were 38.47–39.72 mm for historic pine and 39.65–40.05 mm for reference pine. The full specimen plan area was therefore 97.02 cm2, whereas the area exposed through the edge frame was 88.4 cm2. The heater-to-surface distance was 25 mm and the recording interval was 5 s for all tests. Specimens were not bonded to a substrate, and ignition was piloted by a spark igniter. Grain orientation relative to the exposed face, side and bottom wrapping, and the insulating backing remain incompletely documented. Full specimen dimensions, rather than the smaller exposed area, were used for the density estimates.
Equilibrium moisture contents of 7–8% were adopted for the conditioned test material. After conditioning, the moisture content of every historic and contemporary pine specimen was measured using a HIT-3 moisture meter (TANEL Elektronika i Informatyka Spółka Jawna, Gliwice, Poland); all measured values were within 7–8%. The range thus describes measurements made on individual specimens, rather than an assumed moisture content based only on the conditioning environment. Conditioning temperature, relative humidity and duration are not specified. Mass-based quantities are reported for the conditioned, as-tested state; no oven-dry conversion was applied.
The common HRR calibration record gives a slope of 0.366286 mV/kW and a zero intercept of 0 kW. Historic-pine tests were conducted in January and April 2026; the contemporary-reference tests were conducted on 16 April 2026.
2.3. Parameters and Calculations
Numerical test records formed the basis of the original calculations; instrument reports supplied metadata and allowed checks against rounded values. Extracted parameters included time to ignition (TTI), time to flame extinction (TTF), the end of the calculation interval (EOT), peak heat-release rate (pHRR), mean HRR from ignition to EOT, and mean HRR over the first 180 and 300 s after ignition. THR denotes heat released per exposed area from the start of exposure to EOT. Flaming duration was calculated as TTF − TTI.
Mass loss (ML) was consistently related to initial mass m0, rather than mass at ignition: ML = 100 × (m0 − mEOT)/m0. Mean mass loss rate (MLR) and mean effective heat of combustion (EHC) were taken from the export for the ignition-to-EOT interval. EHC in MLC depends on combustion behaviour and the mass signal; it is not a bomb-calorimeter determination of gross calorific value.
To distinguish area-normalized heat release from the initial mass loading, Q0 was calculated as THR × A/m0, where A = 0.00884 m2 and m0 is expressed in kilograms. Q0 has units of MJ/kg of initial specimen mass in the as-tested condition. Q0 was retained on the measured as-tested mass basis at 7–8% moisture content, without conversion to an oven-dry basis. The supplementary indicator QΔm was defined as THR × A/(m0 − mEOT). This ratio uses quantities integrated over the complete test, and need not equal the mean EHC exported by the software.
Bulk density at the measured moisture content can be calculated for an individual specimen as ρu = m0/(l × b × h), using that specimen’s initial mass and full measured volume in consistent SI units. For Table 1, only series means of initial mass and thickness are available in the manuscript; the reported ρ* is therefore a ratio-of-means indicator calculated as mean(m0)/[0.099 × 0.098 × mean(h)]. It is not the arithmetic mean of individual specimen densities, and does not permit calculation of their standard deviation or coefficient of variation. No individual density variability is reported because the paired specimen-level mass and thickness dataset needed for that calculation is not available in the material supplied for this analysis. These approximate indicators describe the conditioned material at 7–8% moisture content; they are neither oven-dry density nor basic density, and were not used to rescale calorimetric results.
MARHE was determined as the maximum of the exported average rate of heat emission (ARHE) series between 0 and EOT. Here, the term refers specifically to the MLCCalc output with time measured from the start of exposure, without claiming equivalence to other classification protocols. Records after EOT were excluded from parameter analysis and plots. No smoothing, independent correction of negative values, or adjustment of mass-signal offsets was applied in the original analysis.
2.4. Descriptive Statistics and Quality Control
The original analysis calculated the arithmetic mean, sample standard deviation using n − 1, median, minimum and maximum for each series. Absolute differences were defined as the historic-series mean minus the contemporary-reference mean at the same heat flux; relative differences were 100 × (historic mean − reference mean)/reference mean. Percentage-point differences in ML were distinguished from relative percentage changes. Mean Q0 was calculated from individual specimen ratios, not by dividing mean THR by mean mass.
No significance tests were applied. Each contemporary-reference group contained only two tests, and all 24 historic specimens were subsamples from one structural member. The historic material, therefore, represents one independent source member, not 24 independent member-level replicates. The results describe within-member specimen variability, and cannot establish a population-level ageing effect. Generalization would require multiple independently sampled historic members and a larger, appropriately matched contemporary reference set, with within-member subsampling represented in the analysis. Observations recorded every 5 s are not independent material replicates. Because series meaning remains unresolved and heat flux is partly associated with test date, a pure heat-flux effect was not estimated in a factorial model.
The quality-control assessment covered identifiers, time step, mass balance and agreement between pHRR and the time-series maximum. The report–export matching procedure confirmed file correspondence but cannot independently validate the physical accuracy of the weighing signal. AII3 and CII2z were flagged because the mass recorded at ignition differed from the initial mass by +7.88% and −5.08%, respectively. The original balance records, tare records and instrument diagnostics were not available for independent verification at the time of revision. Accordingly, neither record has been numerically corrected or silently excluded. All specimens remain in the primary analysis, and the diagnostic exclusion of AII3 is presented only as a sensitivity check.
2.5. Comparison with Published Oak Results
Oak data were transcribed from Table 3 of Jurecki et al. [31], retaining their reported means and standard deviations. QN denotes contemporary oak (Quercus robur L.), QHND historic oak with a non-degraded surface, and QHD historic oak with a degraded surface. Available variants were QN 35, QHND 35, QN 50, QHND 50 and QHD 50. No degraded-oak group at 35 kW/m2 was available. These labels were not assigned to pine series.
The oak study used nominal specimens of 38 × 100 × 100 mm ± 1 mm, with the last dimension along the grain, an exposed area of 88.4 cm2, a 25 mm heater distance and heat fluxes of 35 and 50 kW/m2. It reported moisture content of 7–8%, contemporary-oak density of approximately 737.03 kg/m3 and historic-oak densities of approximately 580.59–720.07 kg/m3 [31]. Common heat flux, exposed area and heater distance support comparison of the reported calorimetric endpoints. Pine density estimates use the pine dimensions and masses reported here; oak dimensions, densities and surface classifications were not substituted for pine measurements.
3. Results
3.1. Initial Mass, Estimated Density and Reference Heterogeneity
Initial masses of historic-pine specimens ranged from 200.839 to 251.515 g. The contemporary reference at 35 kW/m2 comprised specimens weighing 149.602 and 237.664 g; at 50 kW/m2, the masses were 176.343 and 172.875 g. Every historic series had a higher mean initial mass than the respective reference, despite similar thicknesses. At the measured moisture content of 7–8% and using the full plan dimensions of 99 mm × 98 mm, approximate series-level bulk densities were 569, 531 and 589 kg/m3 for AI, AII and CI, compared with 502 kg/m3 for R35; the corresponding values for BI, BII and CII were 584, 541 and 554 kg/m3, compared with 452 kg/m3 for R50 (Table 1). Historic-series estimates were thus approximately 5.8–17.3% higher at 35 kW/m2 and 19.8–29.4% higher at 50 kW/m2. These are descriptive ratios calculated from mean mass and mean thickness, not specimen-level density statistics or evidence that ageing increased density.
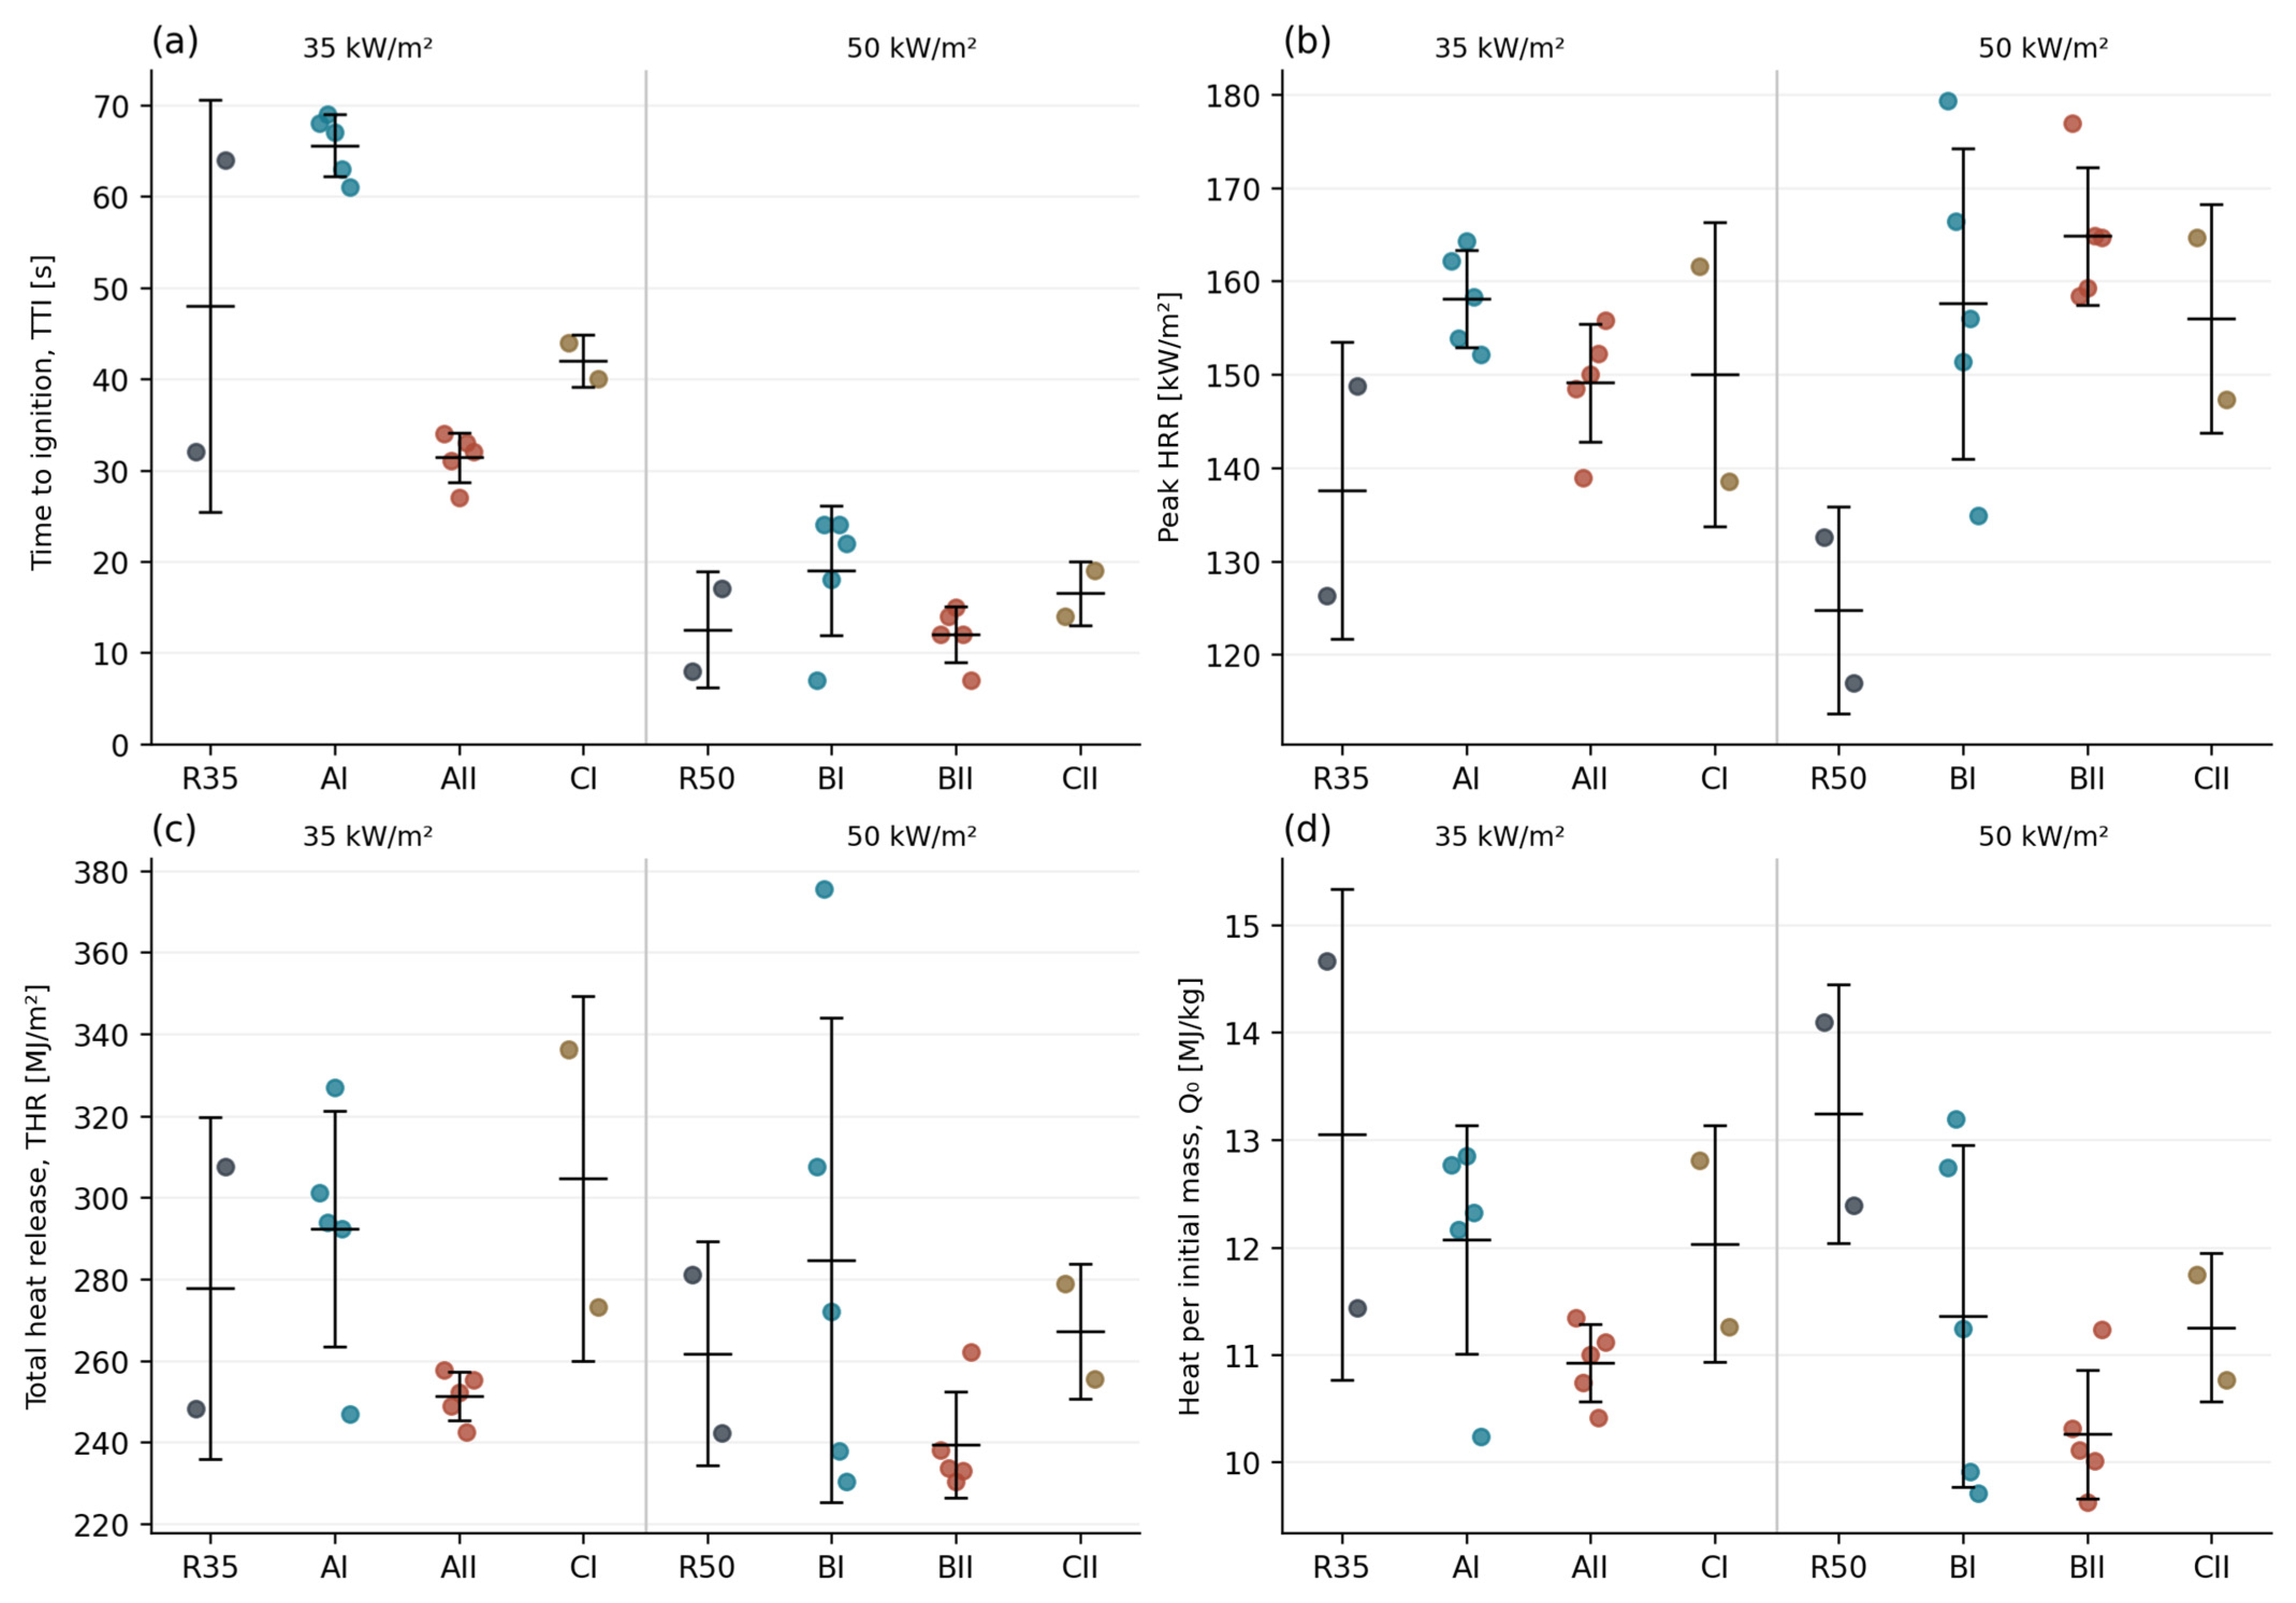
The R35 reference showed TTI values of 32 and 64 s and THR values of 248.20 and 307.51 MJ/m2. Its mean ignition time of 48 s lies between two widely separated observations. At 50 kW/m2, ignition times also differed, at 8 and 17 s. Differences relative to reference means should therefore be read alongside individual results (Table 2 and Figure 1).
Table 2.
Individual contemporary-pine reference results. Q0 denotes heat release per initial specimen mass in the as-tested condition.
Figure 1.
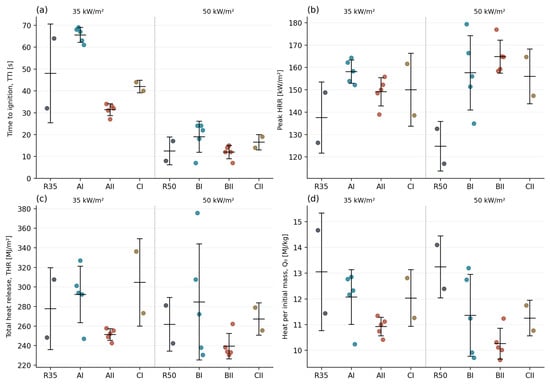
Individual pine results for (a) TTI, (b) pHRR, (c) THR and (d) Q0. Points represent specimens; black bars and whiskers show mean ± SD. The left and right halves of each panel correspond to 35 and 50 kW/m2, respectively. SD describes between-specimen dispersion.
3.2. Ignition and Heat-Release Rate
At 35 kW/m2, mean TTI in AI exceeded the reference by 17.6 s, or 36.7%. AII ignited 16.6 s earlier, a decrease of 34.6%, and CI ignited 6.0 s earlier, a decrease of 12.5%. The AI range of 61–69 s did not overlap the AII range of 27–34 s. At 50 kW/m2, mean TTI was 19.0 s in BI, 12.0 s in BII and 16.5 s in CII, corresponding to +52.0%, −4.0% and +32.0%, relative to R50. Historic series did not exhibit a uniform direction of change in ignition time (Table 3 and Figure 1).
Table 3.
Ignition and heat-release parameters for pine, expressed as mean ± sample standard deviation. Mean HRR covers ignition to EOT.
In contrast to TTI, mean pHRR exceeded the corresponding contemporary reference in every historic series. Differences ranged from 8.4% to 15.0% at 35 kW/m2 and from 25.0% to 32.1% at 50 kW/m2. BII had the highest series mean, of 164.82 ± 7.40 kW/m2. However, the highest individual value, 179.32 kW/m2, occurred in BI1. The maximum individual result and the maximum series mean thus refer to different comparisons.
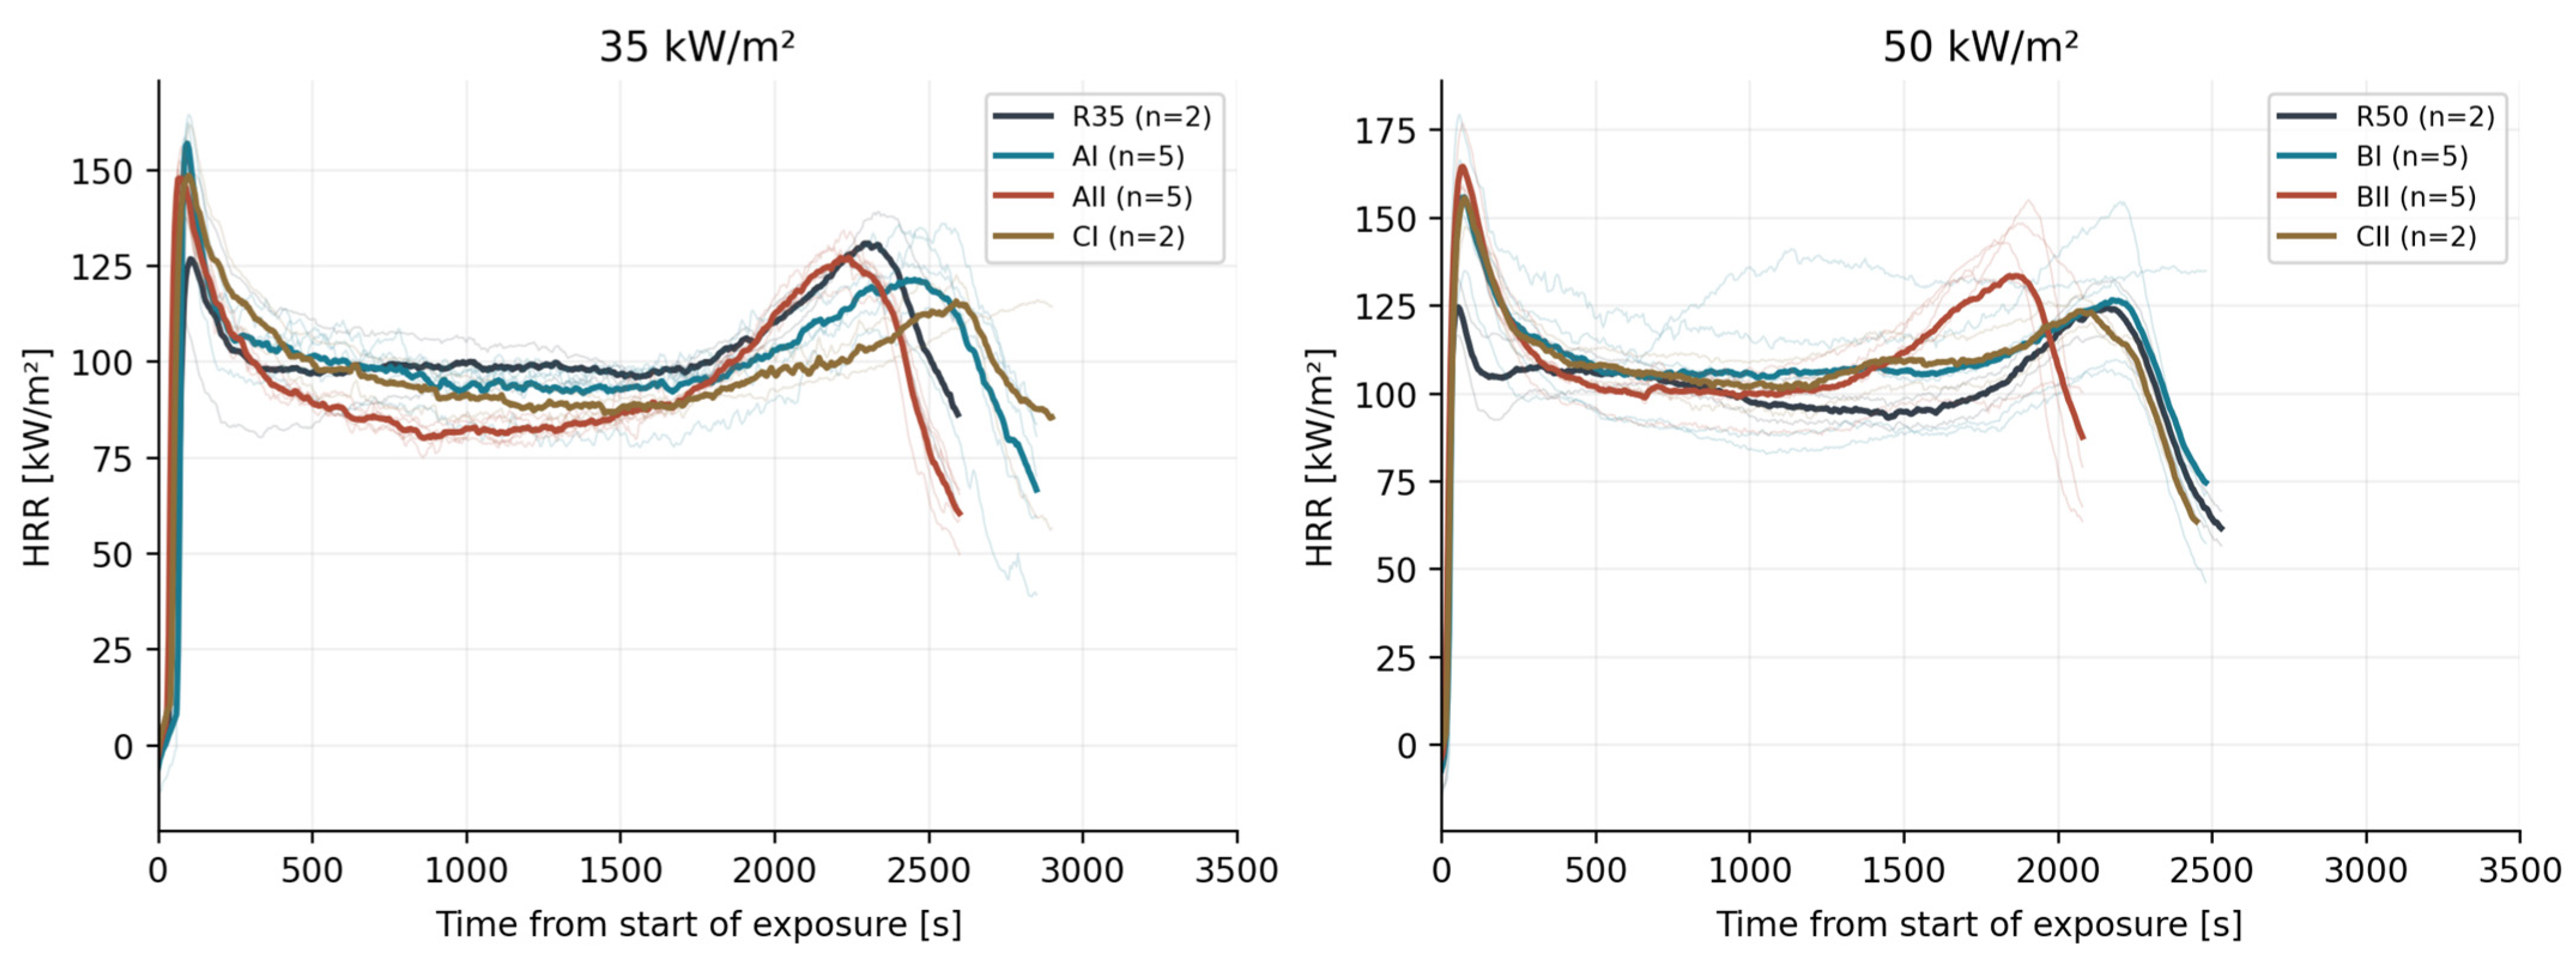
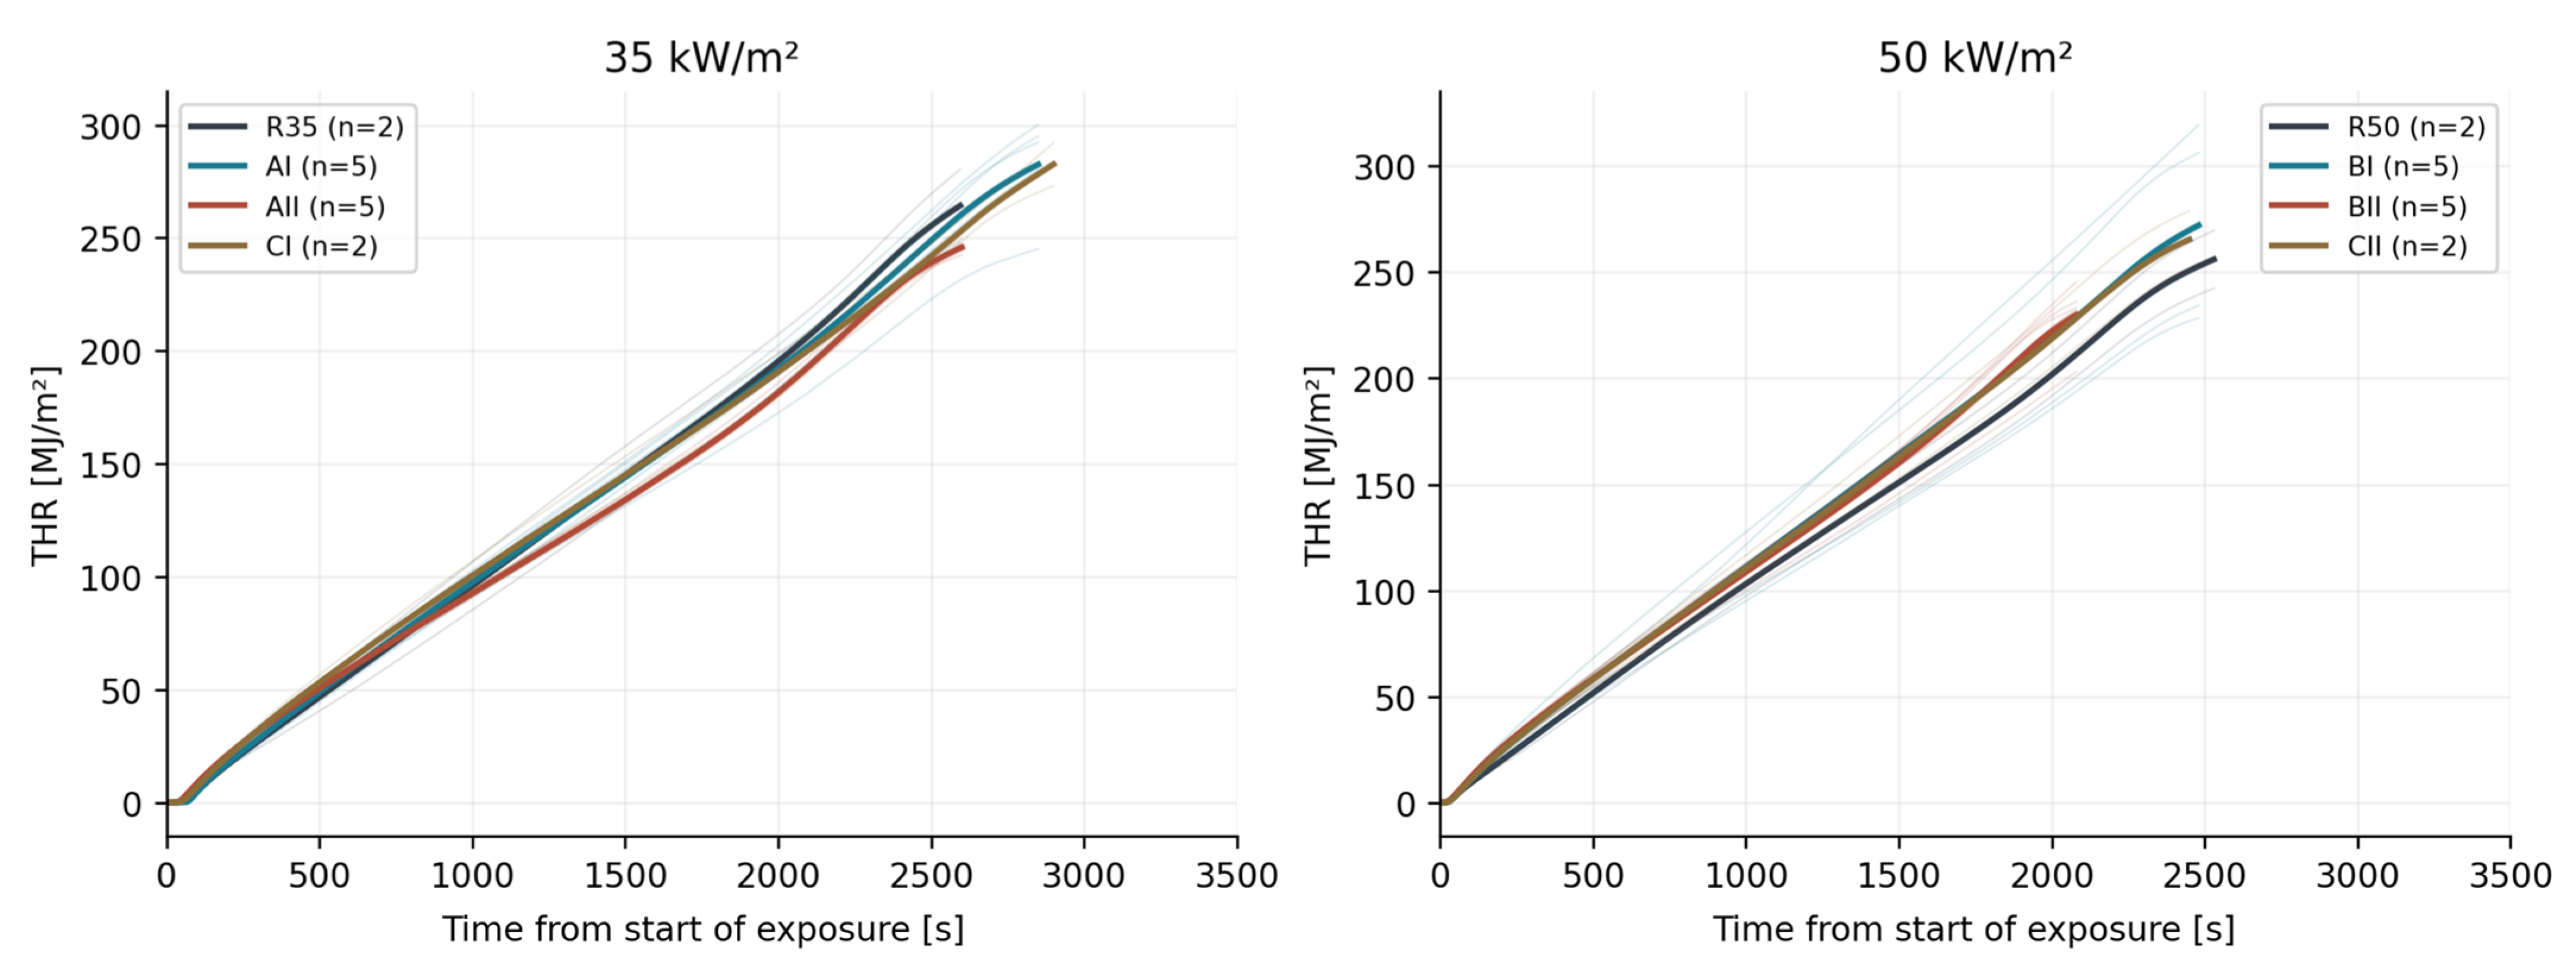
At 35 kW/m2, mean HRR between ignition and EOT was lower in historic series than in R35, despite their higher pHRR. At 50 kW/m2, historic-series mean HRR exceeded R50. Mean MARHE at 50 kW/m2 ranged from 121.48 to 128.68 kW/m2 for historic pine, compared with 104.76 kW/m2 for the reference. At 35 kW/m2, MARHE differences were smaller, ranging from −0.8% to +5.2% (Figure 2).
Figure 2.
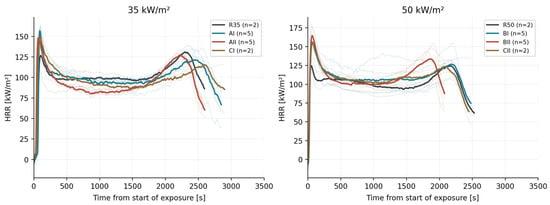
Pine HRR histories at 35 and 50 kW/m2. Thin lines show individual tests and thick lines show series means. Each series is truncated at its earliest EOT, to maintain a constant number of observations in the mean. Time is measured from the start of exposure.
In every historic-pine test, pHRR occurred 60–105 s after exposure began. Two reference peaks occurred early (35R2 at 120 s and 50R3 at 55 s), whereas two occurred late (35R1 at 2235 s and 50R4 at 2160 s). Figure 2 shows this difference in heat-release timing. The original analysis also reported higher mean HRR over the first 180 s after ignition in all historic series, compared to their respective reference groups.
3.3. Total Heat Release and Mass Normalization
At 35 kW/m2, THR exceeded R35 by 5.2% in AI and 9.6% in CI, but was 9.5% lower in AII. At 50 kW/m2, differences relative to R50 were +8.8% for BI, −8.5% for BII and +2.1% for CII. BI had the widest THR range, of 230.43–375.48 MJ/m2. Its highest value occurred in the heaviest specimen, BI2 (251.515 g). This test was not excluded, solely because of its THR value. Figure 3 shows cumulative heat release, and Table 4 summarizes differences relative to the contemporary references.
Table 4.
Differences between historic-pine series means and the contemporary reference at the same heat flux. Each cell gives the absolute difference followed by the relative difference. Absolute ML differences are in percentage points. Values retain rounding from the original specimen-based analysis.
When heat release was normalized by initial mass, every historic-series mean was below the corresponding reference. At 35 kW/m2, Q0 was 12.07 MJ/kg in AI, 10.92 MJ/kg in AII and 12.04 MJ/kg in CI, compared with 13.05 MJ/kg in R35. At 50 kW/m2, the respective values were 11.36 MJ/kg in BI, 10.26 MJ/kg in BII and 11.25 MJ/kg in CII, compared with 13.24 MJ/kg in R50. Changing normalization, therefore, reversed the direction of comparison for AI, CI, BI and CII.
3.4. Mass Loss and Derived Energy Indicators
Mean ML was lower in every historic series than in its respective reference. At 35 kW/m2, historic-series means ranged from 74.30% to 78.80%, compared with 80.09% in R35. At 50 kW/m2, the range was 76.32–80.34%, compared with 81.97% in R50. The largest difference occurred in AII, at −5.79 percentage points, relative to R35. Residue at EOT was not chemically characterized, and was therefore not assumed to consist entirely of char (Table 5).
Table 5.
Pine mass loss and energy indicators, expressed as mean ± sample standard deviation. ML is relative to initial mass; Q0 = THR × A/m0. Mean EHC is the MLCCalc output. The final column gives flaming duration, TTF − TTI.
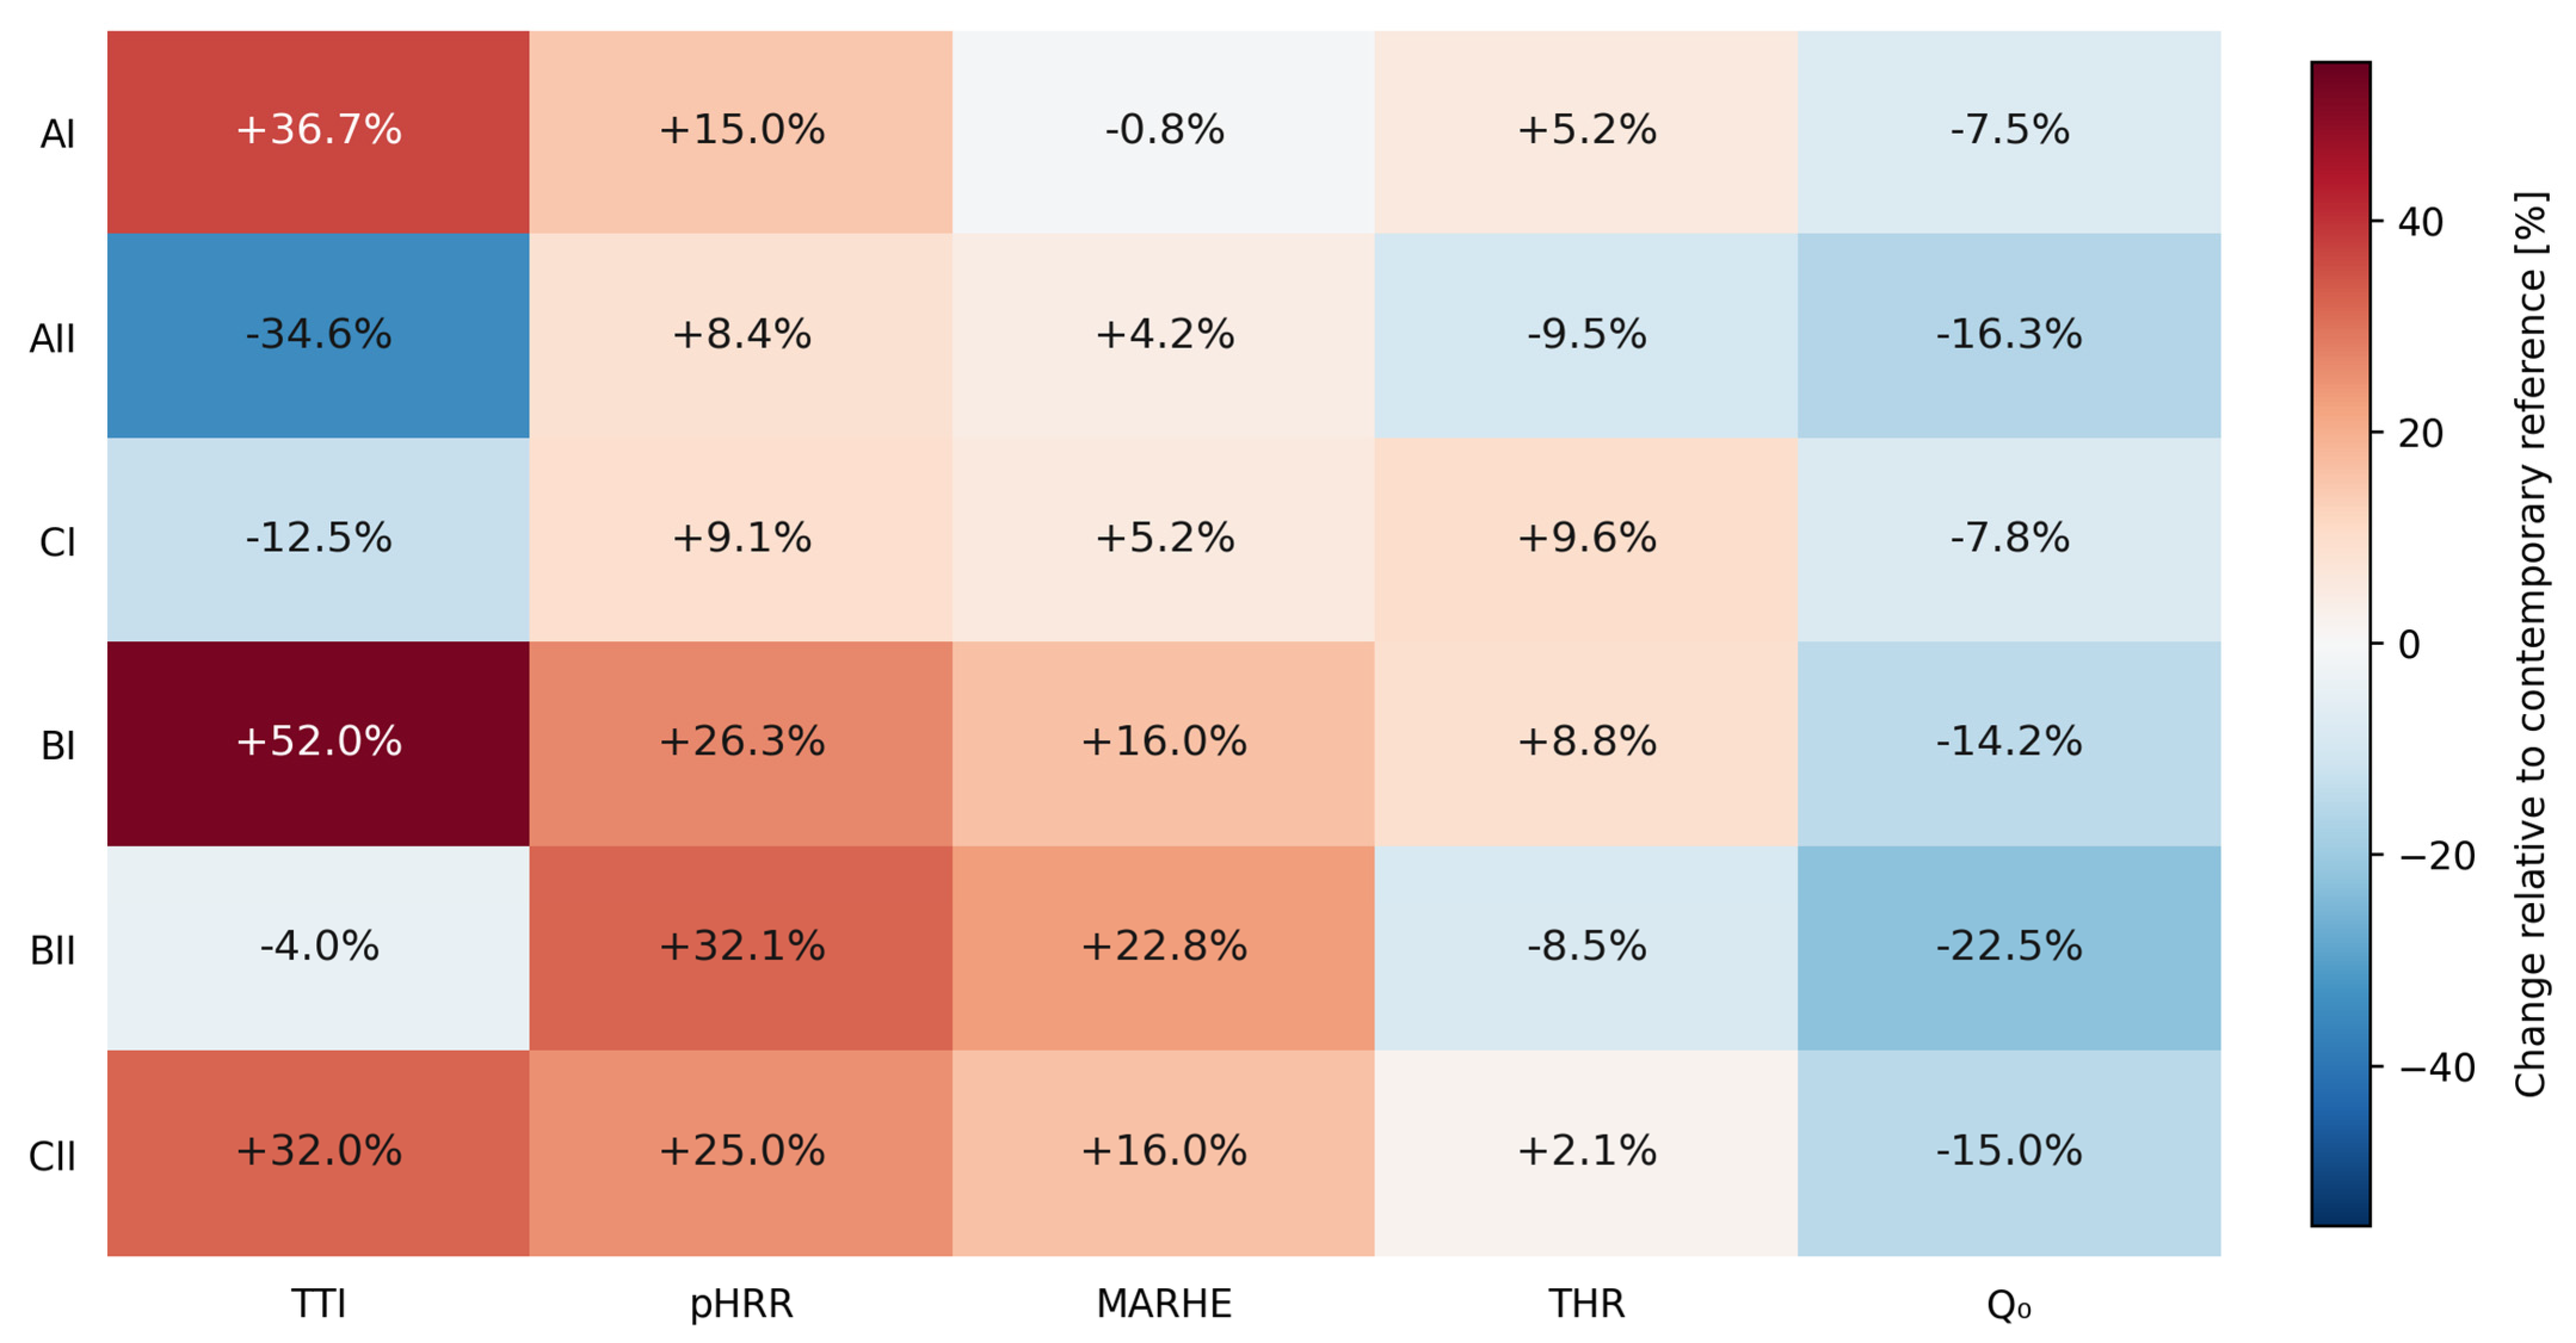
Software-derived mean EHC ranged from 13.37 to 15.71 MJ/kg in historic series, compared with 16.05 and 15.96 MJ/kg in the reference groups. Individual instantaneous EHC maxima across the complete dataset ranged from 62.56 to 79.99 MJ/kg. These maxima were not used to characterize calorific value. Mean flaming durations, TTF − TTI, ranged from 2190.6 s in BII to 3118.5 s in CI (Table 5). Flaming duration and the calculation endpoint are distinct quantities; test duration and residual mass affect interpretation of integrated energy. Figure 4 summarizes the directions of change in selected parameters.
Figure 4.
Relative differences between historic-pine series means and the contemporary reference at the same heat flux. Positive and negative values indicate higher and lower parameter values, respectively. Colours do not indicate safety: longer TTI and higher pHRR have different physical meanings.
3.5. Mass Signal Discrepancies and Sensitivity Analysis
For AII3, the mass recorded at ignition exceeded the recorded initial mass by 7.88%; for CII2z, it was 5.08% lower. These differences are treated as unresolved mass-signal/record discrepancies, not as verified physical mass gain or loss before ignition. The available exports do not establish whether the cause was a balance/tare issue, a data-recording problem, specimen movement, or another measurement-chain effect. Without the original weighing sheets and instrument diagnostics, the initial and ignition masses cannot be reconciled reliably; no estimated correction has therefore been applied.
In the diagnostic variant excluding AII3, mean AII THR changed from 251.37 to 251.14 MJ/m2, while ML changed from 74.30% to 75.56%; the directions of the pHRR and THR differences relative to R35 remained unchanged (Table 6). Excluding CII2z leaves only one observation, and cannot establish the reliability of the CII series. The discrepancy is most directly relevant to mass-trace-derived quantities such as ML, MLR and software-derived EHC. Q0 is calculated using initial mass m0, not mass at ignition, and has therefore not been recalculated using the discrepant ignition mass. Nevertheless, the original initial weighing record should be checked before the mass-based indicators are treated as definitive. The sensitivity analysis documents the influence of individual records, without establishing grounds for exclusion.
Table 6.
Sensitivity analysis for the two records with the largest mass discrepancies before ignition. The primary analysis includes all specimens; exclusions below are diagnostic only.
3.6. Comparison with Oak from the Same Historic Building
Table 7 places the pine series alongside the published oak variants at the same nominal heat flux. At 35 kW/m2, historic-oak QHND had a mean TTI of 50.33 s, compared with 56.67 s for contemporary QN. Historic-pine means spanned both sides of the historic-oak value: AI ignited after 65.60 s, whereas AII and CI ignited after 31.40 and 42.00 s. At 50 kW/m2, BI, BII and CII had mean TTI values of 19.00, 12.00 and 16.50 s, respectively. These overlap the vicinity of QHND 50 at 18.00 s, but are all longer than QHD 50 at 5.33 s. Contemporary pine also ignited earlier than contemporary oak in these datasets, particularly at 50 kW/m2 (12.50 versus 25.33 s).
Table 7.
Descriptive comparison of pine with published oak results at 35 and 50 kW/m2. Values are mean ± SD. Pine data are from the present dataset; oak values are transcribed from Table 3 of Jurecki et al. [31]. Rows identify series, and are not matched specimens.
Historic-pine mean pHRR values were 149.11–158.16 kW/m2 at 35 kW/m2, compared with 120 kW/m2 for QHND 35. At 50 kW/m2, historic-pine means of 155.99–164.82 kW/m2 exceeded both QHND 50 (120 kW/m2) and QHD 50 (140 kW/m2). Relative to QHND at the same flux, these pine means were approximately 24.3–31.8% higher at 35 kW/m2 and 30.0–37.4% higher at 50 kW/m2. Relative to degraded QHD 50, the pine means were 11.4–17.7% higher. These are arithmetic contrasts between observed means, not estimated species effects.
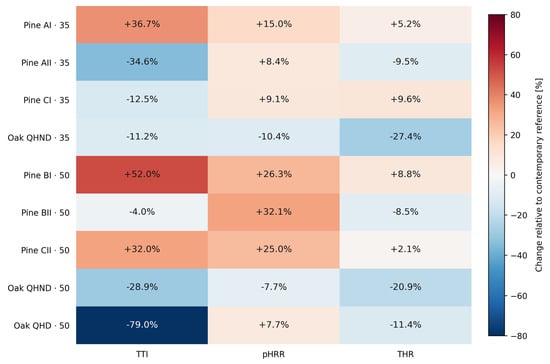
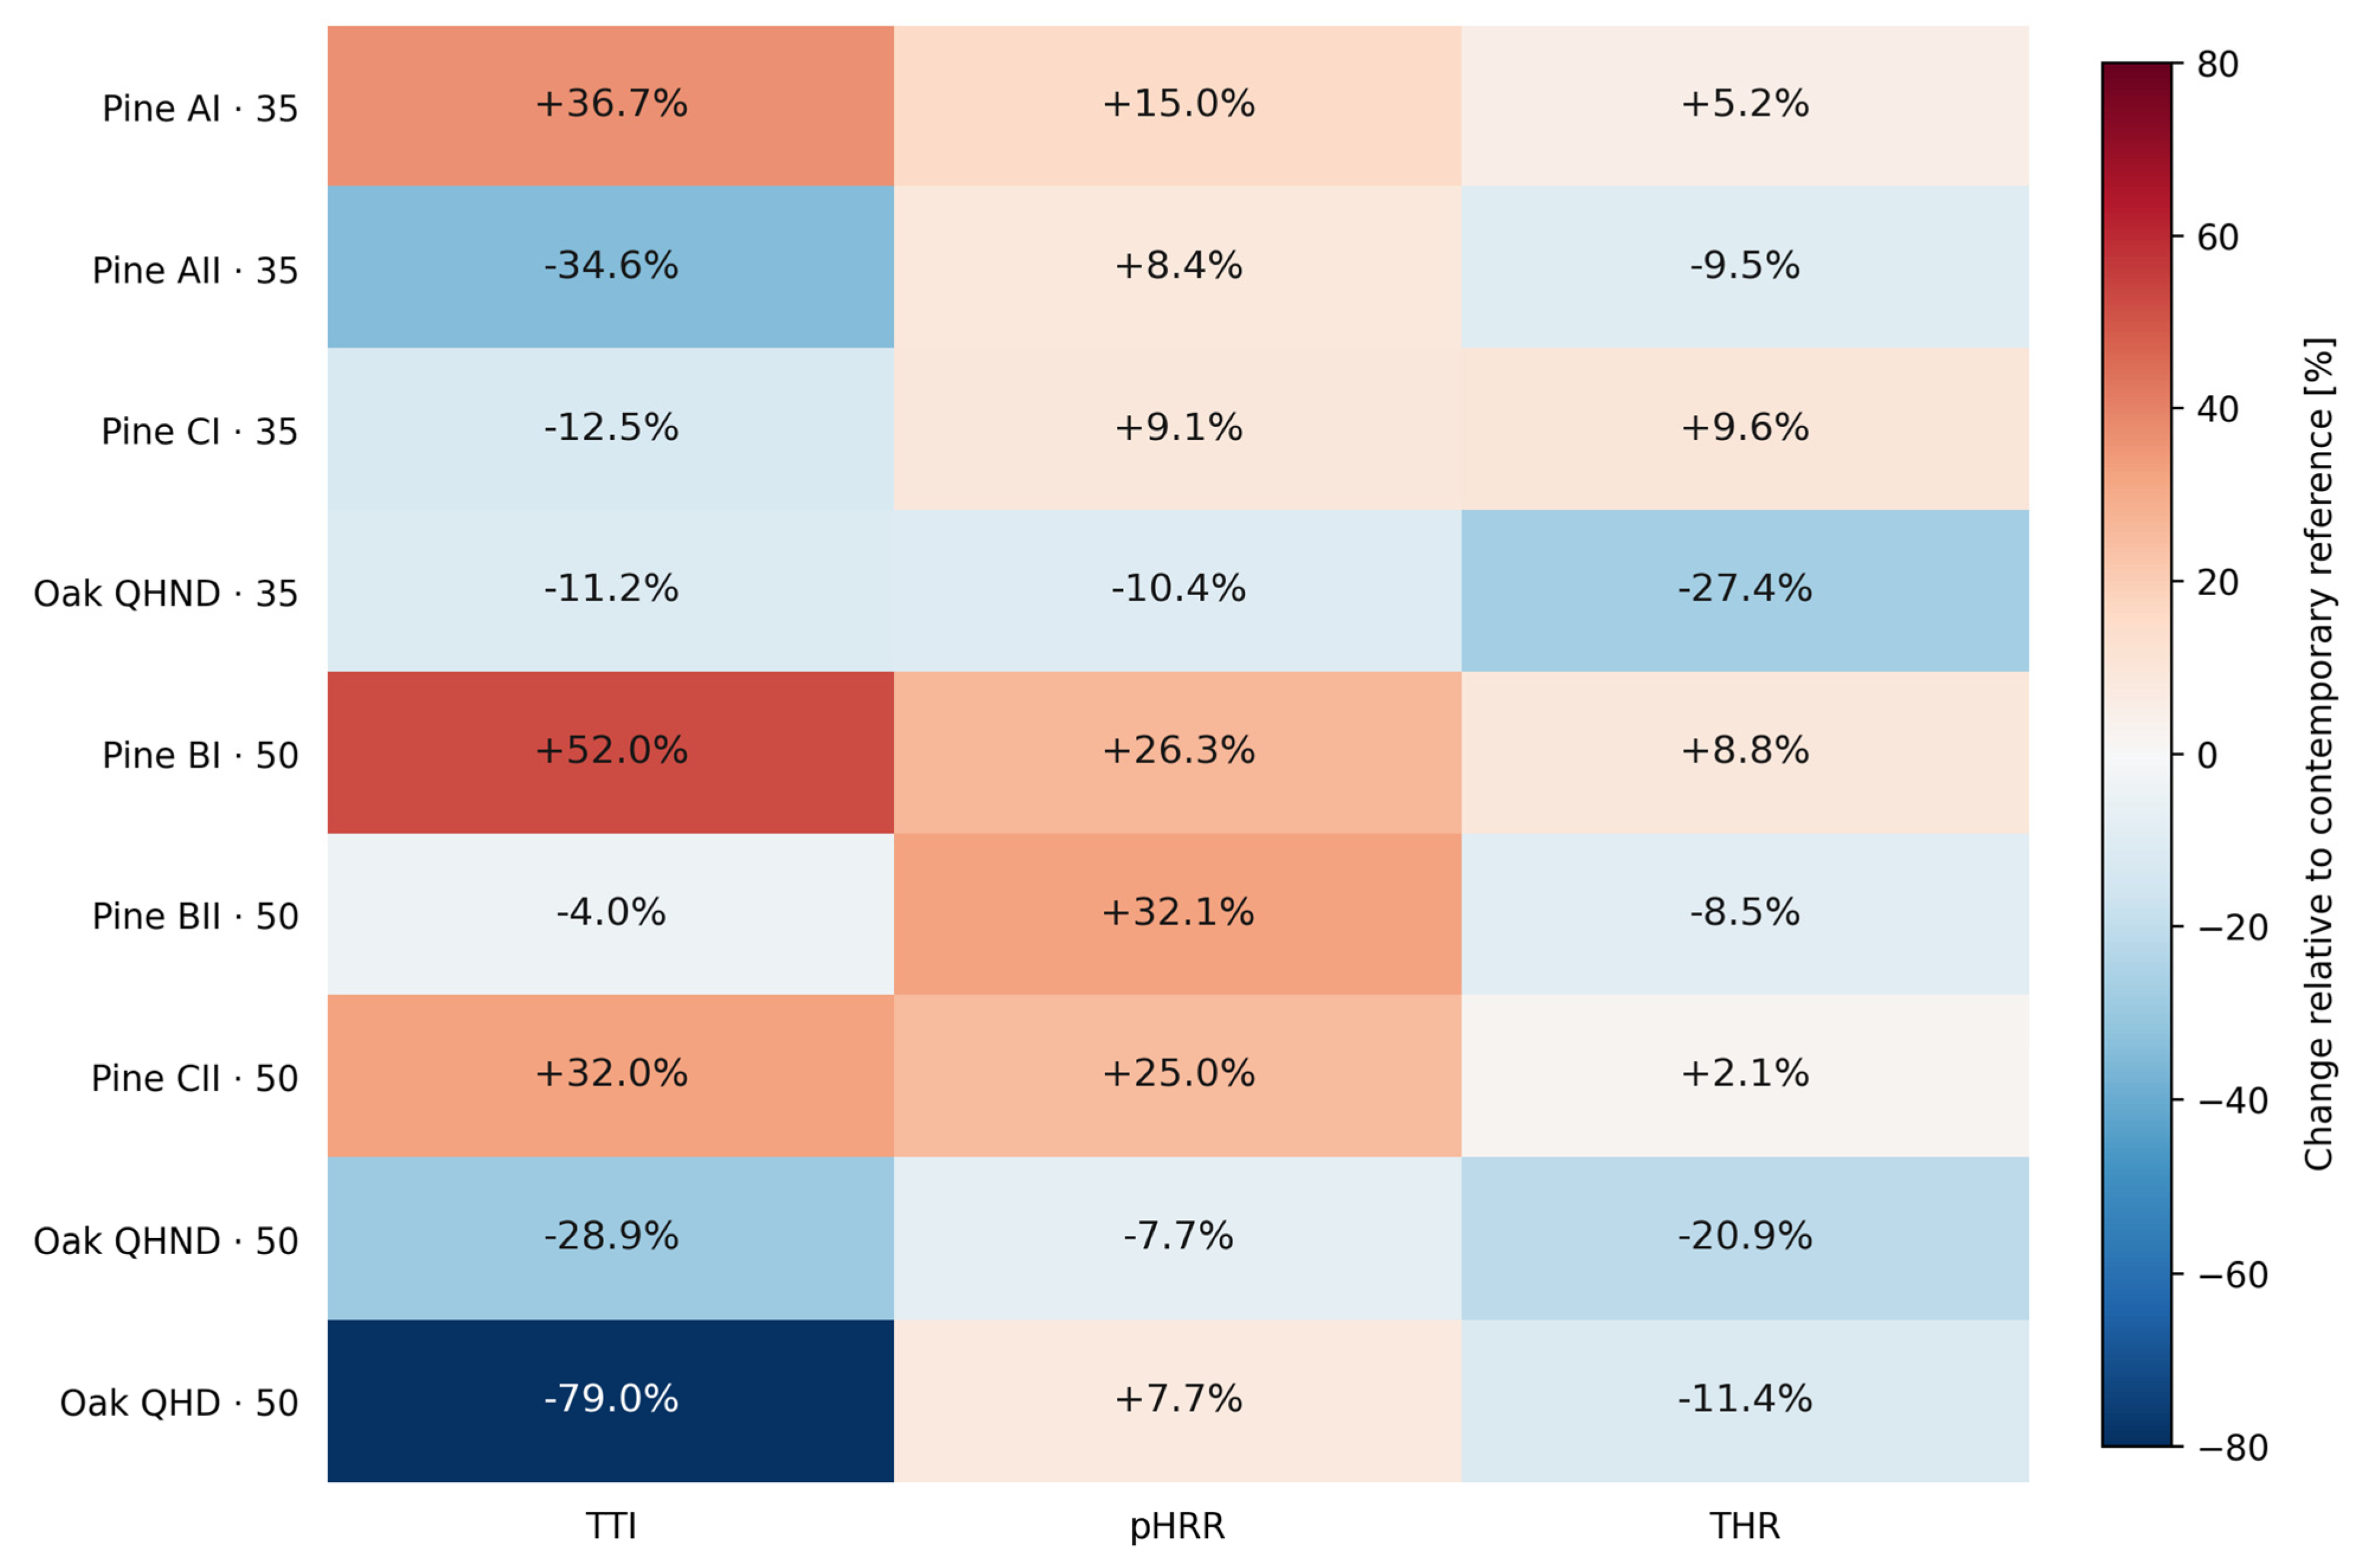
Historic-pine mean THR ranged from 251.37 to 304.63 MJ/m2 at 35 kW/m2, exceeding QHND 35 at 225 MJ/m2 by 11.7–35.4%. At 50 kW/m2, pine means of 239.43–284.69 MJ/m2 exceeded QHND 50 at 208 MJ/m2 by 15.1–36.9% and QHD 50 at 233 MJ/m2 by 2.8–22.2%. However, normalization to each species’ own contemporary reference reveals a different pattern (Figure 5). Historic oak had lower THR in all reported comparisons: −27.4% for QHND 35, −20.9% for QHND 50 and −11.4% for QHD 50. Historic-pine THR varied from −9.5% to +9.6%, relative to contemporary pine.
Figure 5.
Relative changes in TTI, pHRR and THR for historic material compared with the contemporary reference of the same species at the same heat flux. Pine changes retain the original analysis; oak changes are calculated from published means [31]. Labels identify flux in kW/m2. Values are descriptive; no significance or equivalence is implied. Surface classifications apply only to oak.
The published oak ML means were approximately 73–74%, whereas historic-pine means ranged from 74.30% to 80.34%. Pine was 1.30–5.80 percentage points above QHND 35 and 2.32–6.34 points above QHND 50; differences relative to QHD 50 were 3.32–7.34 points. Contemporary pine also had greater reported ML than contemporary oak. These endpoints do not establish differences in char yield because the final residue and endpoint conventions were not harmonized between datasets. The oak article provides no paired specimen-level information from which a comparable mean Q0 can be reconstructed.
4. Discussion
4.1. Ignition Response and Material Variability
The clearest ignition contrast at 35 kW/m2 was the separation between AI and AII, whose mean TTI differed by 34.2 s under the same nominal heat flux. AI also had greater mean initial mass, but slightly lower thickness. Thickness alone, therefore, does not explain the difference. The approximate density indicator was also higher in AI than AII (569 versus 531 kg/m3). Possible contributors include local surface anatomy, latewood and sapwood–heartwood proportions, extractives and preparation history; measured specimen moisture was restricted to 7–8%. The unresolved meaning of I/II prevents selection of one mechanism.
These results should be considered alongside ignition studies in which species and exposure orientation are evaluated together with heat flux and specimen properties. Spearpoint and Quintiere treated ignition as dependent on heating conditions and material properties, while Harada also examined thickness and exposed cross-section. Species identification does not replace determination of whether the exposed surface is radial, tangential or transverse [22,24]. In the present pine dataset, length, width and thickness are specified, but the anatomical orientation of the exposed face remains unresolved.
The different behaviour of fresh and naturally aged pine reported by Deng et al. supports studying historic timber separately, but it does not predict TTI for every series in the present dataset. AII ignited earlier than the reference on average, whereas AI ignited later. This is not necessarily inconsistent with the literature, because material history, surface condition and reference selection differ. Ignition temperature in thermal analysis and ignition time under imposed heat flux are also different quantities [33].
The limited changes after weathering reported by Pánek et al., likewise, do not exclude differences in the present material. Two years of exposure of contemporary wood is not equivalent to prolonged service, and a flame test does not reproduce MLC conditions. The methodological implication is that descriptions such as “old” or “aged” require an accompanying account of environment, duration and exposure. The documented common source member and external weather exposure provide a historical and environmental context for the pine, but do not rank its individual series by expected ignitability [35].
The consistent increase in pHRR contrasts with the variable THR response. BII is the clearest example: relative to R50, its mean pHRR was 32.1% higher, but THR was 8.5% lower. The HRR histories show that all historic-pine peaks occurred early, 60–105 s after exposure, whereas two reference maxima occurred near the end of the tests. BII also had the shortest mean flaming duration (2190.6 s). Together, these measured observations support a temporal explanation: a sharper early release can coexist with a smaller integrated heat release when the later flaming contribution is shorter or less intense. This is a curve-based interpretation, not proof of a specific chemical, anatomical or char-formation mechanism (Table 5).
Separating pHRR from total energy follows the principles discussed by Schartel and Hull. A peak represents the greatest instantaneous intensity, whereas THR integrates heat release over a defined interval. Two specimens may therefore have similar total energy but very different peaks, or the reverse. Higher mean HRR during the first 180 s after ignition in every historic series provides additional evidence of temporal differences. This description is more informative than a single assessment of better or worse flammability [29].
Early maxima in all historic-pine tests and late maxima in two reference tests indicate different distributions of heat release over time. A late HRR increase may be associated with the advancing decomposition front, changes in the char layer, or thermal conditions at the specimen underside. None of these mechanisms was directly observed. Surface observations, temperature measurements and backing documentation would be needed to distinguish them. A late peak should not be described as a second ignition without a flame record.
4.2. Mass Normalization, Material Variability and Pine-Oak Comparison
THR in MJ/m2 describes the specimen’s heat contribution per exposed area. At similar exposed area, a greater quantity of material can increase THR without increasing heat release per unit mass. This occurred in four historic-pine series, whose THR exceeded the reference while Q0 was lower. The highest THR, recorded for BI2, coincided with the greatest initial mass. Area-based and mass-based results therefore need to be presented together.
Lower Q0 in all historic series is a central descriptive result, but Q0 is not the gross calorific value of dry wood. It is calculated as THR × A/m0, and therefore depends on conditioned initial mass, the exposed area, the test endpoint, and the fraction remaining at EOT. Initial mass included 7–8% moisture, while the EOT residue could contain char, unreacted wood and inorganic material. The supplementary ratio based on consumed mass is, likewise, endpoint-sensitive. Consequently, Q0 is used here to compare heat released per unit initial-specimen mass under the stated protocol, not as an intrinsic fuel property.
The approximate bulk-density indicators show that the historic series carried more initial mass per full specimen volume than their corresponding references. This strengthens the need to distinguish heat release per exposed area from heat release per initial mass, but it does not justify rescaling HRR or THR by an assumed proportional density effect. Series-level ratios do not resolve local density variability, anatomical composition or the causes of the historic–contemporary difference. Tran and White describe relationships among burning rate, flux, density and mass loss [23]. The normalization used here remains limited to measured initial mass and recorded energy; it is not a correction that isolates ageing.
R35 is a particularly important limitation. Its two specimens differed in mass by 88.062 g; in TTI by a factor of two, and in individual Q0 values (14.67 and 11.44 MJ/kg). A mean alone conceals this heterogeneity. Higher Q0 in the lighter specimen indicates that a simple proportional mass model does not describe every difference. A larger, better-characterized contemporary reference is needed to determine whether the observed trend is representative.
Tracheid arrangement and the marked contrast between earlywood and latewood can produce locally uneven heating and pyrolysis-product release. Cracks may increase heat access to the interior, but their importance depends on depth, orientation and closure by the forming residue. Visible roughness alone does not determine fuel quantity or the protective character of char. No documented microscopic surface analysis was available for the present pine; these mechanisms, therefore, remain hypotheses based on its anatomy [2].
Karlman et al. showed substantial variation in pine density associated with growth-ring structure. Some differences between the present series may consequently have existed before harvesting, rather than developing during service. A historic beam cut from mature heartwood and a contemporary reference containing more sapwood or a different latewood proportion do not constitute a controlled ageing experiment [3].
Extractives may undergo opposing processes: volatilization and leaching can reduce their abundance, whereas migration and local accumulation can enrich a surface. Krutul and Buzak support considering their natural initial distribution. Lower Q0 accompanied by higher pHRR does not establish that less resin remains in historic wood. Testing that explanation would require solvent extraction, preferably separately for surface and interior regions, linked to the same MLC specimen or an adjacent fragment [6].
The pine–oak comparison extends the earlier historic-oak work [30] using the published Materials dataset [31]. The common MLC framework makes corresponding parameters interpretable, but identical nominal flux does not remove differences in anatomy, extractives, reference selection or surface preservation. The numerical contrasts in Section 3.6 must therefore remain explicitly interspecific and descriptive.
Common provenance at farm no. 5 in Swołowo is a stronger basis for historical comparison than an unspecified “old wood” category. Both species are associated with the half-timbered residential building dated to 1869 and with material recovery during revitalisation [31]. For the present pine, all historic specimens came from a single externally exposed structural member, shared a broadly similar environmental history, and had no previous conservation treatments according to the material history. These pine-specific facts do not establish identical histories for the separately studied oak. The carved construction date also remains distinct from the estimated pre-felling tree age and from dendrochronological dating of individual wood samples.
Ignition results show why surface condition must be retained in the comparison. Historic oak ignited earlier than its contemporary reference in every reported variant, with reductions of 11.2% for QHND 35, 28.9% for QHND 50 and 79.0% for QHD 50. Pine showed mixed changes, from 34.6% for earlier ignition to 52.0% for later ignition. At 50 kW/m2, the 12.0–19.0 s range of historic-pine means was much longer than the 5.33 s reported for degraded oak, even though contemporary pine ignited earlier than contemporary oak. Thus, a general softwood–hardwood ranking does not explain these groups. The extreme oak response is associated with a documented degraded-surface category, which cannot be assigned to any pine series from its code alone.
Peak heat release distinguishes the datasets particularly clearly. All historic-pine series had higher mean pHRR than their contemporary references. Non-degraded historic oak, instead, had pHRR reductions of 10.4% at 35 kW/m2 and 7.7% at 50 kW/m2; degraded oak at 50 kW/m2 showed an increase of 7.7%. The direction observed for degraded oak is therefore shared with pine, but the pine increases of 25.0–32.1% at 50 kW/m2 are larger. This similarity does not establish comparable surface damage. It indicates that a model derived from non-degraded oak cannot be transferred directly to the pine response.
Total heat release gives a different comparison. Historic oak consistently released less heat per exposed area than contemporary oak, whereas pine showed both increases and decreases. Once pine was normalized by initial mass, all historic series were lower than their references. These findings support separating heat-release intensity from total energy, but they should not be described as quantitative agreement between species because oak THR and pine Q0 use different denominators. Oak specimen-level masses would be needed to determine whether an equivalent mass-normalized trend occurs there. Published oak densities cannot substitute for those paired measurements, especially when the mean of individual ratios is required.
The oak SEM observations document roughness, fibrillation, delamination, fractured cell-wall edges and secondary porosity, while SEM–EDS identifies local inorganic heterogeneity in altered regions [31]. These observations supply plausible mechanisms for testing, in pine. They are not measurements of the pine specimens, and neither particular minerals, nor a catalytic contribution to pine combustion, can be inferred from them. Pine tracheids, resin canals and extractive distribution may interact with surface degradation differently from the vessel–fibre structure of oak. Matching microscopy and chemical measurements to the pine MLC sampling positions would allow those possibilities to be evaluated.
Taken together, the datasets show that early ignition, high peak heat release, and large cumulative heat release are not interchangeable consequences of prolonged service. For the Swołowo materials, pine had higher mean peaks than the published oak variants at matched flux, yet the strongest ignition sensitivity occurred in degraded oak. These observations support assessing both species and preservation state in historic timber diagnostics. They do not establish a universal species ranking, a pure effect of age, or a common fire classification.
4.3. Limits of Mechanistic Interpretation
Preferential hemicellulose loss could alter the quantity and timing of decomposition products and the balance between polysaccharides and lignin. Model-component experiments show different thermal behaviour, but coupled heat and mass transfer occurs in solid wood. Lower mean EHC cannot, therefore, quantify hemicellulose loss, and pHRR cannot be equated with hemicellulose content. Several combinations of structure and chemistry can produce the same direction of calorimetric change [26].
Nor is there a single expected direction of change in crystallinity indices. Lionetto et al. associated increased relative crystallinity in weathered pine with loss of amorphous constituents, whereas Broda et al. found reduced crystallinity and polysaccharide loss following biological degradation. These outcomes concern different deterioration processes. An increased relative proportion of ordered material need not indicate improved condition, and a lower index does not, by itself, explain MLC behaviour [10,37].
Poletto et al. examined relationships between crystallinity, extractives and thermal stability in natural fibres, supporting XRD, FTIR and thermogravimetry as complementary methods. Park et al. also showed that the determination method affects crystallinity-index values. Further comparison of historic and contemporary pine should use consistent preparation, background treatment and index calculation. The present dataset contains no diffractograms, so crystallinity cannot be inferred from calorimetry [38,39].
4.3.1. Lignin and Combustion Residue
Lower percentage ML means a greater fraction of initial mass remained at EOT. Different char formation is one possible explanation; incomplete reaction of the interior or a larger inorganic fraction are others. Without residue analysis, this fraction cannot be equated with char yield or used to calculate lignin content. Dúbravská et al. identified chemical changes in historic pine zones produced under thermal loading. These describe the effects of heating, and are not proof that the same composition existed before testing [34].
Zborowska et al. documented changes in archaeological-oak lignin, including functional-group composition, showing that lignin is not an invariant reference component. Pandey and Pitman demonstrated the usefulness of FTIR after fungal decay, while Ghavidel et al. combined FTIR with XPS and XRD in aged softwoods. Surface oxidation, changes in band ratios, and changes in ordered structure represent different levels of information, and do not necessarily describe the same process throughout a specimen [9,13,36].
No spectra or elemental analyses were available for the present pine. Oxidation, depolymerization and lignin condensation, therefore, remain possible mechanisms, rather than demonstrated findings. A further experiment should combine MLC with pre-test material characterization and residue analysis, maintaining links to series, moisture and sampling position.
4.3.2. Moisture and Method Comparability
Moisture content was measured separately for every pine specimen after conditioning, and all readings were within 7–8%. This measured range limits moisture-related variation at testing, although it does not imply identical readings or provide a specimen-specific oven-dry normalization. Water consumes energy during heating and evaporation, and contributes to initial mass; Q0 and the approximate density indicators therefore refer to the conditioned, as-tested state. Broda et al. showed that different degradation processes can alter pine sorption in different directions [11]. The same moisture range reported for oak improves comparability, without proving exact moisture matching between individual pine and oak specimens.
The documented pine service history involved exterior weather exposure and no conservation treatments. Dirt, soot, salts, metal-corrosion products and conservation-agent residues were not confirmed on the sampled material, and none is invoked as an established explanation for the calorimetric response. Wood-modification and archaeological-conservation studies illustrate why such factors should be checked, but cannot establish their presence in this pine [19,40,41]. Quantitative surface characterization and targeted chemical analyses would be required to exclude trace contamination or assign a mechanism to surface alteration.
Comparisons must distinguish thermopile-based MLC from oxygen-consumption calorimetry. The methods produce similarly named parameters using different HRR measurement chains, and identical nominal flux does not guarantee equivalent instrumentation. Within the pine dataset, a common report format, exposed area, and calibration record support internal consistency. Across pine and oak, matching exposure area and heater distance improve comparability, but differences in surface definition, endpoint criteria and specimen characterization remain. Neither comparison is a controlled experiment isolating ageing.
4.4. Measurement Uncertainty and Limited Replication
Instantaneous EHC maxima are particularly sensitive to a small or disturbed MLR denominator. Differentiation of the mass signal amplifies short-term fluctuations, and the original exports also contained negative MLR values. High instantaneous EHC, therefore, does not reliably indicate exceptional calorific value. Interpretation emphasizes software means and indicators with explicit definitions. The discrepancy between mass at ignition and initial mass further supports checking the weighing system before interpreting detailed energy-to-mass relationships.
The sensitivity of mean AII ML to AII3 was appreciably greater than that of THR. A mass-signal error can affect mass-dependent indicators, without a proportional change in HRR. This does not establish that the entire ML difference is an artefact. Without independent final weighing and instrument diagnostics, a correction is not justified. Retaining all data while displaying the diagnostic variant is more reproducible than manually shifting curves.
Two contemporary-reference tests per flux do not characterize the population distribution reliably. Moreover, all historic specimens were obtained from one member, so neither parametric nor non-parametric testing can turn them into independent replicates of historic structural timber. Correlations between arbitrarily paired specimens in different groups would also be unjustified. The oak replication inconsistency adds a separate obstacle to cross-study inference. Additional independent source members, documented sampling, and a larger reference set are needed; more comparisons of the existing time series would not supply that information.
4.5. Practical Implications and Further Research
The results support simultaneous assessment of ignition, early heat-release intensity and cumulative energy. In historic pine, higher pHRR coexisted with lower Q0 and, in some series, longer TTI. Each parameter describes a different aspect of the test. The pine–oak comparison, likewise, shows that the shortest ignition time and highest heat-release peak occurred in different material categories. These small-scale data do not assign a reaction-to-fire class, determine load-bearing capacity during fire, or establish R, E or I fire-resistance performance.
Methods developed for archaeological wood offer useful diagnostic tools, but their selection should reflect the confirmed origin of this material as building timber, rather than a waterlogged find [14,15,20]. For the Swołowo comparison, priority should be given to sampling additional independent members, resolving the series codes, quantifying sapwood–heartwood proportions and surface condition, and retaining linked specimen-level mass, dimensions, and moisture records for individual density calculations in both species.
Sampling should enable comparisons within the same or suitably matched members, with randomized test order and controlled moisture. Microscopy and chemical analyses should use adjacent fragments with a known relationship to each MLC specimen. Such a design could test whether extractives, surface condition or polysaccharide changes explain pHRR differences, instead of assigning a mechanism from age alone. The present dataset and published oak values provide a quantitative basis for that work, within clearly defined evidential limits.
5. Conclusions
Historic Scots pine from one externally exposed structural member showed a consistent increase in mean pHRR relative to contemporary pine (8.4–32.1%), but a consistent decrease in heat release per initial specimen mass, of Q0 (7.5–22.5%). In contrast, ignition time changed in both directions and area-normalized THR ranged from −9.5% to +9.6%. Higher peak intensity, therefore did not imply a greater cumulative or mass-specific heat contribution.
The BII series illustrates this distinction: pHRR was 32.1% higher than R50, whereas THR was 8.5% lower. Early HRR peaks and the shorter mean flaming duration support a difference in the temporal distribution of heat release, but the experiment does not identify the underlying chemical or anatomical mechanism.
The study does not establish an ageing effect, a species effect or a reaction-to-fire classification. Inference is limited by sampling from a single historic member, only two contemporary reference tests per heat flux, unresolved laboratory series codes, unavailable specimen-level density statistics, and mass-signal discrepancies in AII3 and CII2z. The comparison with published oak from the same building is descriptive, rather than causal.
Future work should test multiple independent historic members and larger contemporary reference groups using matched anatomical orientation, sapwood/heartwood status, density, moisture, quantified surface condition, and linked chemical or microscopic characterization. For conservation and fire-safety assessment, TTI, pHRR, area-normalized THR, and mass-normalized heat release should be reported separately.
Author Contributions
Conceptualization, A.J. and W.G.; methodology, A.J., M.W. and W.G.; formal analysis, M.W. and W.G.; investigation, A.J.; resources, A.J. and W.G.; data curation, B.K.; writing—original draft preparation, A.J. and W.G.; writing—review and editing, M.W., W.G. and B.K.; visualization, M.W. and B.K.; supervision, W.G. and M.W. project administration, M.W.; funding acquisition, M.W. All authors have read and agreed to the published version of the manuscript.
Funding
This research was funded by the Polish Minister of Science and Higher Education as part of the Strategy of the Poznan University of Life Sciences for 2024–2026 in the field of improving scientific research and development work in priority research areas.
Institutional Review Board Statement
Not applicable.
Informed Consent Statement
Not applicable.
Data Availability Statement
The original contributions presented in this study are included in the article. Further inquiries can be directed to the corresponding author.
Acknowledgments
OpenAI ChatGPT was used to assist with English translation and editorial organization. No experimental observations were generated.
Conflicts of Interest
The authors declare no conflicts of interest.
Abbreviations
| ARHE | average rate of heat emission |
| EHC/EHOC | effective heat of combustion (pine/oak terminology) |
| EOT | end of the calculation interval |
| FTIR | Fourier-transform infrared spectroscopy |
| HRR/pHRR | heat release rate/peak heat release rate |
| MARHE | maximum average rate of heat emission |
| ML/MLR | mass loss/mass loss rate |
| MLC | mass loss calorimetry or mass loss calorimeter |
| QN/QHND/QHD | contemporary/non-degraded historic/degraded historic oak |
| Q0 | heat release per initial specimen mass |
| SEM–EDS | scanning electron microscopy with energy-dispersive X-ray spectroscopy |
| THR | total heat release per exposed area |
| TTI/TTF | time to ignition/time to flame extinction |
| XPS/XRD | X-ray photoelectron spectroscopy/X-ray diffraction |
References
- Krzysik, F. Drewno jako materiał w zabytkach. Ochr. Zabyt. 1968, 21, 11–16. [Google Scholar]
- Wdowiak, A. Struktura drewna konstrukcyjnego. Czas. Inż. Lądowej Sr. Archit. 2017, 64, 365–380. [Google Scholar] [CrossRef] [Scilit]
- Karlman, L.; Mörling, T.; Martinsson, O. Wood Density, Annual Ring Width and Latewood Content in Larch and Scots Pine. Eurasian J. For. Res. 2005, 8, 91–96. [Google Scholar]
- Sjöström, E. Wood Chemistry: Fundamentals and Applications; Academic Press: New York, NY, USA, 1981. [Google Scholar]
- Fengel, D.; Wegener, G. Wood: Chemistry, Ultrastructure, Reactions; Walter de Gruyter: Berlin, Germany, 1989. [Google Scholar]
- Krutul, D.; Buzak, J. Rozmieszczenie substancji ekstrakcyjnych w drewnie pnia drzewa dębowego i sosnowego. Sylwan 1986, 130, 65–77. [Google Scholar]
- Kránitz, K.; Sonderegger, W.; Bues, C.T.; Niemz, P. Effects of aging on wood: A literature review. Wood Sci. Technol. 2016, 50, 7–22. [Google Scholar] [CrossRef] [Scilit]
- Cavalli, A.; Cibecchini, D.; Togni, M.; Sousa, H.S. A review on the mechanical properties of aged wood and salvaged timber. Constr. Build. Mater. 2016, 114, 681–687. [Google Scholar] [CrossRef] [Scilit]
- Ghavidel, A.; Scheglov, A.; Karius, V.; Mai, C.; Tarmian, A.; Vioel, W.; Vasilache, V.; Sandu, I. In-depth studies on the modifying effects of natural ageing on the chemical structure of European spruce (Picea abies) and silver fir (Abies alba) woods. J. Wood Sci. 2020, 66, 77. [Google Scholar] [CrossRef] [Scilit]
- Broda, M.; Popescu, C.M.; Curling, S.F.; Timpu, D.I.; Ormondroyd, G.A. Effects of Biological and Chemical Degradation on the Properties of Scots Pine Wood—Part I: Chemical Composition and Microstructure of the Cell Wall. Materials 2022, 15, 2348. [Google Scholar] [CrossRef] [Scilit] [PubMed]
- Broda, M.; Spear, M.J.; Curling, S.F.; Dimitriou, A. Effects of Biological and Chemical Degradation on the Properties of Scots Pine—Part II: Wood-Moisture Relations and Viscoelastic Behaviour. Forests 2022, 13, 1390. [Google Scholar] [CrossRef] [Scilit]
- Babiński, L. (Ed.) Wybrane właściwości fizyczne drewna wykopaliskowego z Biskupina. In Stan i Perspektywy Zachowania Drewna Biskupińskiego; Biskupińskie Prace Archeologiczne 7; Muzeum Archeologiczne w Biskupinie: Biskupin, Poland, 2009; pp. 149–174. [Google Scholar]
- Zborowska, M.; Spek-Dźwigała, A.; Waliszewska, B.; Prądzyński, W. Ocena stopnia degradacji drewnianych obiektów archeologicznych z najcenniejszych znalezisk wielkopolskich. Acta Sci. Pol. Silvarum Colendarum Ratio Ind. Lignaria 2004, 3, 139–151. [Google Scholar]
- Jensen, P.; Gregory, D.J. Selected physical parameters to characterize the state of preservation of waterlogged archaeological wood: A practical guide for their determination. J. Archaeol. Sci. 2006, 33, 551–559. [Google Scholar] [CrossRef] [Scilit]
- Babiński, L. Badanie stopnia degradacji i stabilizacji wymiarowej mokrego drewna wykopaliskowego. Acta Sci. Pol. Silvarum Colendarum Ratio Ind. Lignaria 2005, 4, 151–169. [Google Scholar]
- Prądzyński, W.; Waliszewska, B.; Spek, A. Podstawowy skład chemiczny i zmiany w układzie celulozowym sosnowego drewna wykopaliskowego. In Drewno Archeologiczne—Badania i Konserwacja; Babiński, L., Ed.; Materiały Sympozjum Biskupin–Wenecja 1999; SNAP: Biskupin, Poland, 1999; pp. 277–286. [Google Scholar]
- Björdal, C.G.; Nilsson, T.; Daniel, G. Microbial decay of waterlogged archaeological wood found in Sweden Applicable to archaeology and conservation. Int. Biodeterior. Biodegrad. 1999, 43, 63–73. [Google Scholar] [CrossRef] [Scilit]
- Blanchette, R.A. A review of microbial deterioration found in archaeological wood from different environments. Int. Biodeterior. Biodegrad. 2000, 46, 189–204. [Google Scholar] [CrossRef] [Scilit]
- Broda, M.; Hill, C.A.S. Conservation of Waterlogged Wood—Past, Present and Future Perspectives. Forests 2021, 12, 1193. [Google Scholar] [CrossRef] [Scilit]
- Grattan, D.W.; Mathias, C. Analysis of waterlogged wood: The value of chemical analysis and other simple methods in evaluating condition. Somerset Lev. Pap. 1986, 12, 6–12. [Google Scholar]
- Szczepkowski, A.; Nicewicz, D.; Koczoń, P. The relationship between tree health and chemical composition of beech (Fagus sylvatica L.) and oak (Quercus robur L.) wood of Polish provenances. Acta Sci. Pol. Silvarum Colendarum Ratio Ind. Lignaria 2007, 6, 77–88. [Google Scholar]
- Spearpoint, M.J.; Quintiere, J.G. Predicting the piloted ignition of wood in the cone calorimeter using an integral model—Effect of species, grain orientation and heat flux. Fire Saf. J. 2001, 36, 391–415. [Google Scholar] [CrossRef] [Scilit]
- Tran, H.C.; White, R.H. Burning rate of solid wood measured in a heat release rate calorimeter. Fire Mater. 1992, 16, 197–206. [Google Scholar] [CrossRef] [Scilit]
- Harada, T. Time to ignition, heat release rate and fire endurance time of wood in cone calorimeter test. Fire Mater. 2001, 25, 161–167. [Google Scholar] [CrossRef] [Scilit]
- Bartlett, A.I.; Hadden, R.M.; Bisby, L.A. A Review of Factors Affecting the Burning Behaviour of Wood for Application to Tall Timber Construction. Fire Technol. 2019, 55, 1–49. [Google Scholar] [CrossRef] [Scilit]
- Yang, H.; Yan, R.; Chen, H.; Lee, D.H.; Zheng, C. Characteristics of hemicellulose, cellulose and lignin pyrolysis. Fuel 2007, 86, 1781–1788. [Google Scholar] [CrossRef] [Scilit]
- Yang, L.; Zhou, Y.; Wang, Y.; Guo, Z. Predicting charring rate of woods exposed to time-increasing and constant heat fluxes. J. Anal. Appl. Pyrolysis 2008, 81, 1–6. [Google Scholar] [CrossRef] [Scilit]
- Monder, S.; Kozakiewicz, P.; Iwanek, E. Naturalna palność wybranych gatunków drewna z Afryki. Sylwan 2010, 154, 721–728. [Google Scholar]
- Schartel, B.; Hull, T.R. Development of fire-retarded materials—Interpretation of cone calorimeter data. Fire Mater. 2007, 31, 327–354. [Google Scholar] [CrossRef] [Scilit]
- Jurecki, A.; Wieruszewski, M.; Grześkowiak, W. Comparative Analysis of the Flammability Characteristics of Historic Oak Wood from 1869 and Contemporary Wood. In International Scientific Conference on Woods & Fire Safety; Makovicka Osvaldova, L., Hasburgh, L.E., Das, O., Eds.; Springer: Cham, Switzerland, 2024; pp. 370–377. [Google Scholar] [CrossRef] [Scilit]
- Jurecki, A.; Grześkowiak, W.; Klimek, B.; Wieruszewski, M. Comparative Flammability and SEM–EDS Characterization of Contemporary, Aged and Charred Oak Wood from Historic Timber Structures. Materials 2026, 19, 3365. [Google Scholar] [CrossRef] [Scilit] [PubMed]
- Chorlton, B.; Gales, J. Fire performance of cultural heritage and contemporary timbers. Eng. Struct. 2019, 201, 109739. [Google Scholar] [CrossRef] [Scilit]
- Deng, J.; Liu, T.S.; Yao, M.; Yi, X.; Bai, G.X.; Huang, Q.R.; Li, Z. Comparative study of the combustion and kinetic characteristics of fresh and naturally aged pine wood. Fuel 2023, 343, 127962. [Google Scholar] [CrossRef] [Scilit]
- Dúbravská, K.; Kučerová, V.; Štefková, J.; Mišíková, O.G. Charring of and Chemical Changes in Historical Wood under Thermal Loading. Forests 2024, 15, 1189. [Google Scholar] [CrossRef] [Scilit]
- Pánek, M.; Kubovský, I.; Oberhofnerová, E.; Štěrbová, I.; Niemz, P.; Osvald, A.; Kačík, F. Influence of natural weathering on the ignition and relative burning rate of selected softwoods. Constr. Build. Mater. 2021, 304, 124615. [Google Scholar] [CrossRef] [Scilit]
- Pandey, K.K.; Pitman, A.J. FTIR studies of the changes in wood chemistry following decay by brown-rot and white-rot fungi. Int. Biodeterior. Biodegrad. 2003, 52, 151–160. [Google Scholar] [CrossRef] [Scilit]
- Lionetto, F.; Del Sole, R.; Cannoletta, D.; Vasapollo, G.; Maffezzoli, A. Monitoring Wood Degradation during Weathering by Cellulose Crystallinity. Materials 2012, 5, 1910–1922. [Google Scholar] [CrossRef] [Scilit]
- Poletto, M.; Ornaghi, H.; Zattera, A. Native Cellulose: Structure, Characterization and Thermal Properties. Materials 2014, 7, 6105–6119. [Google Scholar] [CrossRef] [Scilit] [PubMed]
- Park, S.; Baker, J.O.; Himmel, M.E.; Parilla, P.A.; Johnson, D.K. Cellulose crystallinity index: Measurement techniques and their impact on interpreting cellulase performance. Biotechnol. Biofuels 2010, 3, 10. [Google Scholar] [CrossRef] [Scilit] [PubMed]
- Esteves, B.M.; Pereira, H.M. Wood modification by heat treatment: A review. BioResources 2009, 4, 370–404. [Google Scholar] [CrossRef] [Scilit]
- Zelinka, S.L.; Altgen, M.; Emmerich, L.; Guigo, N.; Keplinger, T.; Kymäläinen, M.; Thybring, E.E.; Thygesen, L.G. Review of Wood Modification and Wood Functionalization Technologies. Forests 2022, 13, 1004. [Google Scholar] [CrossRef] [Scilit]
- ISO 13927:2015; Plastics—Simple Heat Release Test Using a Conical Radiant Heater and a Thermopile Detector. International Organization for Standardization: Geneva, Switzerland, 2015.

Disclaimer/Publisher’s Note: The statements, opinions and data contained in all publications are solely those of the individual author(s) and contributor(s) and not of MDPI and/or the editor(s). MDPI and/or the editor(s) disclaim responsibility for any injury to people or property resulting from any ideas, methods, instructions or products referred to in the content. |
© 2026 by the authors. Licensee MDPI, Basel, Switzerland. This article is an open access article distributed under the terms and conditions of the Creative Commons Attribution (CC BY) license.