


Highlights
- Six near-surface substitutions were examined in TiFe(111) slab models.
- Molecular, dissociative, and reported single-H adsorption are distinguished.
- Molecular binding strength and H–H elongation need not follow the same trend.
- Mn/Fe yields a dissociated configuration; Co/Fe and Ni/Fe retain molecular H2.
- Constrained NEB profiles are reported with their achieved convergence status.
Abstract
TiFe-based alloys offer reversible hydrogen storage, but adsorption strength alone does not determine surface activation. Spin-polarized density functional theory was used to examine Sc, V, Cr, Mn, Co, and Ni substitution in the third atomic plane of Ti- and Fe-terminated TiFe(111) slabs. Adsorption and hydrogen-free electronic-structure calculations used PBE without a dispersion correction; separately prepared dissociation profiles used ordinary PBE nudged elastic band (NEB) calculations. The substituted Ti-face configurations retain molecular hydrogen at to eV. On the Fe face, Mn yields two separate H atoms at eV per incident H2, Cr and Sc elongate the molecule (0.863 and 0.831 Å), and Co, Ni, and V change it by less than 0.03 Å; several Fe-face energies include a change in the slab’s magnetic state. Only the Ti/Cr band met the force criterion, under additional lateral hydrogen constraints; the other eleven bands remained unconverged. Their sampled heights therefore do not establish a quantitative dissociation-barrier ranking. Metal-projected spectra and Bader charges provide electronic context without establishing a hydrogen-orbital mechanism. The results distinguish configuration-specific binding, molecular distortion, and exploratory pathway information; they do not identify a universal optimum additive for practical hydrogen uptake or release.
1. Introduction
Hydrogen is increasingly recognized as a promising energy carrier for low-carbon energy systems because of its high gravimetric energy density and broad applications in transportation, fuel cells, and industry [1,2,3,4,5,6]. It can be produced from diverse sources, including fossil fuels, nuclear power, and renewable energy, supporting the development of a broad hydrogen value chain encompassing production, storage, transportation, and supply [7,8,9,10,11,12]. Among these interconnected components, hydrogen storage remains a major technological challenge because H2 has a very low density under ambient conditions, making efficient and practical storage difficult [13,14].
Current hydrogen-storage technologies can broadly be classified into compressed-gas, cryogenic-liquid, and solid-state approaches [13,14,15,16,17]. Compressed and liquid hydrogen are established storage routes, but they require either high pressures or cryogenic temperatures and present challenges related to energy consumption, volumetric efficiency, infrastructure, and safety [15,16,18,19,20,21]. Solid-state storage offers an alternative in which hydrogen is retained within a host material through chemical or physical interactions, including absorption in metal hydrides and adsorption in porous or carbon-based materials [17,22,23,24,25,26,27]. These materials can provide high volumetric storage densities and favorable safety characteristics, although their practical performance depends on storage capacity, sorption kinetics, reversibility, and cycling stability.
Among solid-state hydrogen storage materials, metal hydrides are particularly attractive because they can accommodate hydrogen within compact metallic lattices, providing high volumetric storage density without the extreme pressures required for compressed hydrogen or the cryogenic temperatures required for liquid hydrogen [28,29,30]. Their hydrogen absorption and desorption involve a complex interplay of thermodynamic and kinetic factors, including hydride stability, temperature, pressure, and hydrogen transport within the material [29,31]. Accordingly, practical performance depends on achieving a balance among storage capacity, operating conditions, reaction kinetics, reversibility, and cycling stability [32,33,34]. Understanding and controlling these factors is therefore essential for developing efficient and reversible hydrogen-storage systems. In practice, however, surface impurities can hinder hydrogen adsorption and complicate the initial activation of metal hydrides, while sluggish sorption kinetics and unfavorable thermodynamics can further limit their performance [32]. These considerations have motivated extensive research into intermetallic compounds capable of reversibly absorbing hydrogen under comparatively moderate conditions.
Within the broad family of intermetallic hydrogen-storage materials, TiFe has been recognized as an attractive alloy because it combines reversible hydrogen absorption with relatively high volumetric storage density and the use of comparatively inexpensive and abundant constituent elements [35,36]. TiFe is an AB-type intermetallic compound with a B2 (CsCl-type) structure and can reversibly form hydride phases upon hydrogen absorption [37,38,39]. It has a theoretical hydrogen-storage capacity of approximately 1.86 wt% and, following appropriate activation, can absorb and desorb hydrogen under conditions close to ambient temperature [35,36]. These characteristics have sustained decades of research into TiFe-based materials and have motivated their investigation for applications including stationary hydrogen storage, thermal hydrogen compression, and nickel–metal hydride battery systems [40,41]. The combination of reversible hydrogen storage, relatively high volumetric capacity, moderate operating conditions, and low constituent-element cost therefore continues to make TiFe an attractive platform for the development of practical solid-state hydrogen-storage technologies.
A major limitation of TiFe is its difficult initial hydrogenation. TiFe generally requires elevated temperatures of approximately 673–773 K and hydrogen pressures of several megapascals before efficient hydrogen uptake can be achieved [42,43]. Schlapbach and Riesterer attributed this difficulty to the initially passivating surface oxide and investigated its evolution during activation under high-pressure hydrogen conditions [43,44]. They showed that the surface oxide undergoes chemical transformation through surface segregation and reduction, resulting in a surface containing TiO2 and Fe. Their H2/D2 exchange experiments further demonstrated that molecular hydrogen dissociates readily on Fe and FeTi, whereas TiO2 does not promote H2 dissociation effectively [43,44]. These findings indicate that activation involves substantial changes in the surface composition and chemical state rather than simply the physical removal of an oxide layer. Importantly, Schlapbach and Riesterer also suggested that the difficulty of initial hydrogen absorption in high-purity TiFe may involve bulk processes, including hydrogen diffusion and fracture-related effects [43,44]. Nevertheless, these findings underscore the importance of understanding the intrinsic chemical and electronic properties of the metallic surface and their role in the interaction with molecular hydrogen.
Once hydrogen reaches the metallic surface, its adsorption and dissociation are governed by the local atomic configuration and electronic structure of the exposed sites. In an early full-potential linearized augmented plane-wave (FLAPW) study, Lee et al. investigated hydrogen adsorption on B2 TiFe(001) and TiFe(110) surfaces and found that hydrogen forms stronger chemical bonds with Fe than with Ti [45]. They also reported a pronounced ferromagnetic moment of 2.27 for the Fe-terminated TiFe(001) surface, which rapidly diminishes toward the interior of the slab. These results demonstrate that the local surface composition and electronic structure strongly influence hydrogen–TiFe interactions, with Fe-containing sites exhibiting stronger chemical interactions with hydrogen than Ti sites.
These findings suggest that TiFe activation involves two closely connected factors: surface passivation and the intrinsic chemical and electronic properties of the exposed alloy. Thus, improving bulk hydrogen-storage properties alone may not facilitate activation if H2 adsorption and dissociation remain unfavorable. Effective modification should therefore tailor the surface environment to promote H2 activation while preserving the favorable storage characteristics of TiFe.
Partial substitution of Ti or Fe by a third element has emerged as a widely investigated and practically relevant strategy for improving the activation and hydrogen-sorption behavior of TiFe-based alloys [46,47,48,49,50,51,52]. Among the various alloying elements, Mn is one of the most extensively studied dopants [53,54,55,56,57]. Partial replacement of Fe by Mn has been shown to expand the CsCl-type unit cell, lower the hydrogen plateau pressure, and shorten the incubation period for hydrogen absorption across a range of Ti–Fe–Mn compositions [58]. More broadly, Dematteis et al. demonstrated that similar beneficial effects on activation can be achieved with a wide range of substituent elements, highlighting substitutional alloying as a general strategy for tailoring TiFe-based materials [48]. Further studies have reported that Zr addition can eliminate the incubation period through the formation of Zr-rich secondary phases [59], while Mn- and Cr-containing alloys exhibit improved activation associated with secondary phases, particularly near grain boundaries [60]. Appropriate substitution can also improve hydrogen-storage performance; for example, TiFe0.66Mn0.05Co0.05 was reported to achieve 1.98 wt% H2 at 0 °C [61]. Zr additions, intermetallic additives, and rare-earth substitutions have likewise been investigated for modifying the activation and sorption characteristics of TiFe [62,63,64].
Recent work by Garelli et al. demonstrated that Cr- and Al-containing alloys activated more rapidly than the Co- and Cu-containing compositions examined in that study [65]. The authors related the differences to phase constitution and transport-related behavior. Such experimental comparisons motivate distinguishing the effect of a substituent on a particular surface step from its effect on overall alloy activation.
First-principles studies have examined hydrogen energetics in bulk TiFe and the effects of substitution on diffusion and binding environments [46,66,67]. Izanlou and Aydinol examined clean TiFe(001), (110), and (111), including dissociation on both (111) terminations [68]. Kumar et al. subsequently investigated systematic 3d substitution on both TiFe(111) terminations, reporting site-selected dissociated hydrogen configurations, including subsurface occupation on the Fe face [49]. Li et al. examined dissociative adsorption, segregation, and substitution energetics for 3d and 4d additives on TiFe(110), identifying Co replacing Fe and Sc replacing Ti as promising when these criteria were considered jointly [69]. These studies establish a substantial adsorption-screening background against which the present configuration and pathway results must be compared.
The connection between these elementary surface processes and practical hydrogen uptake depends on additional mechanisms. Santhosh et al. reported an H2 dissociation barrier of 0.172 eV but hydrogen-penetration barriers above 1.4 eV for an oxidized TiFe(110)-based surface, not for a clean TiFe(111) slab [70]. Kim et al. combined experimental oxide characterization and activation measurements with calculated hydride-nucleation energetics; V and Cr improved activation more effectively than Co and Ni in their comparison [71]. These results caution against equating a favorable clean-surface adsorption energy with an improvement in the complete absorption process.
The present work complements these studies with a joint analysis of the molecular and dissociated configurations and selected dissociation profiles for six near-surface substitutions in TiFe(111) slab models. The adopted model contains a dopant below the outermost atomic plane; the calculation therefore probes hydrogen interaction with a substituted near-surface environment, not necessarily direct adsorption on an exposed dopant atom. Its focus is the relationship between binding, H–H distortion, and energy variation along a specified path, not a first systematic dopant survey. Reported single-H binding and the molecular and dissociated two-H states are treated separately. Their structural and electronic context is examined without assuming that one descriptor orders all aspects of reactivity. The comparison with earlier site-selected dissociative minima explicitly identifies different final states and sampling protocols; neither of those comparisons nor the additional profiles establish a global adsorption minimum or a universal alloy-activation ranking.
The remainder of this article is organized as follows. Section 2 defines the models, calculation methods, and energy references. Section 3 presents adsorption, selected dissociation profiles, and electronic-structure results with the corresponding literature comparisons. Section 4 discusses their implications and limitations for hydrogen uptake, and Section 5 summarizes the conclusions.
2. Computational Methodology
2.1. Model Systems and Surface Construction
All surface calculations were performed on TiFe(111) slab models constructed from the DFT-optimized bulk B2-TiFe structure. The optimized lattice parameter obtained at the PBE level was Å, in excellent agreement with the experimental value of 2.976 Å [58] and previous first-principles studies of TiFe [66].
The choice of (111) is motivated by its use in previous adsorption and dissociation studies [49,68], rather than by an assumption that it is universally the lowest-energy facet. Kumar et al. reported (111) as the lowest-energy orientation among their three low-index models [49]. Li et al., however, obtained a (110) preference in their layer-dependent comparison of (001), (110), and (111) slabs [69]. Łodziana likewise obtained (110) as the lowest-energy facet while including (111) in the calculated equilibrium shape [72]. The latter study reports effective energies for stoichiometric slabs and does not include reconstructions or off-stoichiometric surfaces. These different model treatments do not establish the equilibrium abundance of the individual substituted terminations considered here. The present calculations address their intrinsic hydrogen interactions as prescribed surface configurations; a chemical-potential-dependent surface phase diagram is outside their scope.
Two separate asymmetric slab models were constructed in the MedeA environment [73], each with unlike upper and lower terminations. The pristine supercell contains 108 metal atoms (54 Ti and 54 Fe) in 12 alternating atomic planes with nine sites per plane. Numbering planes from the adsorption face downwards, the Ti-face sequence is Ti/Fe/Ti/Fe/Ti/Fe/Ti/Fe/Ti/Fe/Ti/Fe; the Fe-face sequence is Fe/Ti/Fe/Ti/Fe/Ti/Fe/Ti/Fe/Ti/Fe/Ti. Thus, a Ti adsorption face has an Fe-terminated lower face and vice versa. For adsorption-structure optimization, the upper four atomic planes were allowed to relax, while the lower eight were fixed. Adsorbates were relaxed on the upper face; the distinct NEB endpoint and image masks are specified in Section 2.3.2. The resulting structures are relaxed within this specified mobile region, not with respect to every substrate coordinate.
The substituted compositions are for the Ti-face family and for the Fe-face family, where = Sc, V, Cr, Mn, Co, or Ni. The specified substitution lies in the second plane of the corresponding host species counted from the adsorption face, i.e., plane 3 of the alternating stack, rather than in the outermost plane. One host atom in that plane is replaced, leaving eight host atoms and one dopant; the exposed top plane retains nine host atoms. Figure 1 shows the numbered-plane model. This is a near-surface substitution model, not a surface-segregation calculation or a representation of direct replacement of an exposed adsorption atom.
Figure 1.
Numbered-plane composition of the two asymmetric TiFe(111) slab families, with = Sc, V, Cr, Mn, Co, or Ni in atomic plane 3. The exposed plane retains nine host atoms. The movable/fixed regions shown apply to adsorption and NEB endpoint preparation: the top four planes and H relax, while the lower eight planes remain fixed. All metal coordinates are fixed during optimization of the intermediate NEB images; H is movable in three directions except for Ti/Cr, where lateral H coordinates are fixed. This is a layer schematic, not an atom-coordinate rendering.
Hydrogen adsorption was investigated by placing H2 above selected sites and relaxing the allowed coordinates. The configurations are outcomes of this sampling, not a determination of the global adsorption minimum. The simulation-cell length along the surface normal is Å, including both the slab and its periodic separation. For the Co-containing examples, the metal-slab spans are approximately 9.30 Å (Ti-face) and 9.06 Å (Fe-face), giving separations between the outermost metal planes of periodic replicas of approximately 25.70 and 25.94 Å, respectively. These separations exclude the extent of the adsorbed hydrogen. The slab spans are example-specific and are not assigned to every composition. Figures S1–S5 show the original cutoff, k-point, magnetic-initialization, and cell-separation sensitivity data. No systematic slab-thickness or relaxation-depth series was performed. The cell length and the corresponding metal-plane separations are distinguished explicitly in Supplementary Materials Tables S1 and S5; 35 Å is not the empty vacuum-gap thickness.
2.2. Computational Details
The bulk, adsorption, gas-phase reference, static DOS/charge, and NEB calculations used VASP 6.1.2 (22Jul20) [74,75]. Electronic interactions were described with the projector augmented-wave (PAW) formalism [76] and the Perdew–Burke–Ernzerhof (PBE) generalized gradient approximation [77]. No empirical dispersion correction (e.g., Grimme DFT-D3 with Becke–Johnson damping [78,79]) was applied in the adsorption, static electronic, or NEB calculations. The adsorption and NEB calculations are nevertheless separate computational treatments, not a single quantitatively combined energy landscape. The Ti and Fe datasets were PAW_PBE Ti_sv (26Sep2005) and Fe (06Sep2000). The NEB records also identify H (15Jun2001) and, for the Mn calculation, Mn_pv (02Aug2007).
Geometry optimization used a plane-wave cutoff of 520 eV, an electronic convergence threshold of eV, and a Monkhorst–Pack mesh. The conjugate-gradient optimizer was used (), with , , and eV/Å. Six adsorption relaxations ended before reaching this force criterion; they are identified in Table 1 and Supplementary Materials Table S6. Spin polarization was enabled (). Occupations used first-order Methfessel–Paxton smearing (, eV). The reported dipole settings are , , and , with z the surface-normal direction. The NEB convergence status is reported separately below; its target force tolerance is not taken as evidence that every band reached that tolerance.
Table 1.
Reported single-H adsorption energies (eV per H) and two-H-system adsorption energies (eV per incident H2). The latter equals for molecular outcomes and for the dissociated Mn/Fe outcome. The final-state labels distinguish molecular from dissociative adsorption rather than assigning an energy-threshold bonding classification. a The final slab moment differs from that of the clean reference, so the entry includes a change in slab state. In the pristine, Co, and Ni structures, H2 is little elongated and lies 2.4–4.3 Å from the nearest metal atom, so the entry is attributed mainly to that change (Section 3.2). b Includes restructuring of the surface and a change in slab moment. c The relaxation ended before reaching the force criterion (Supplementary Materials Table S6).
The absence of a dispersion correction is expected mainly to underestimate the binding of weakly interacting molecular configurations; no dispersion-corrected comparison was performed. The adsorption energies and NEB profiles are reported separately and are not combined to assign an activation energy from a Table 1 adsorption configuration. Their different constraints and energy conventions do not by themselves establish the cause of differences between studies [80].
Because the magnetic state of transition-metal-doped TiFe surfaces can significantly influence their electronic structure and adsorption behavior, spin-polarized calculations were performed for all pristine and doped Ti-terminated and Fe-terminated surfaces. Initial magnetic moments were assigned based on preliminary magnetic convergence tests (see Figure S4 in the Supplementary Materials) and the expected magnetic character of the constituent elements. The initial moments were set to 0.5 for Ti and 1.5 for Fe in the Ti-face models (0.2 and 0.75 , respectively, in the Fe-face models), 1.5 for V, 3.5 for Mn, 2.5 for Cr, 1.2 for Co, 0.65 for Sc and Ni, and 0.0 for H atoms. The final magnetic configurations and local magnetic moments were subsequently determined self-consistently during electronic relaxation.
The final slab moments of each H2-containing calculation were compared with those of its clean reference. For the pristine, Co, Cr, Mn, and Ni Fe-face models, the total moment changed (from 21.9 to 18.9, 21.6 to 18.4, 17.8 to 20.5, 18.0 to 19.4, and 20.3 to 17.6 , respectively), so the corresponding energy differences include a change in slab state in addition to the hydrogen interaction. The Sc/Fe and V/Fe moments and all Ti-face moments are essentially unchanged (≤0.1 ). Static references for the final slab geometries with hydrogen removed were not computed in this revision; the affected energies are therefore qualified in Section 3.2 rather than corrected.
The NEB calculations used VASP’s built-in ordinary NEB implementation, without a VTST extension or a climbing image [81]. Four intermediate images connected two separately relaxed endpoints. The NEB inputs were eV, a automatic mesh reported to match the optimization sampling, , , eV, eV, and eV/Å. Damped ionic dynamics used , , and . The NEB dipole settings were , , and . No zero-point, vibrational, or finite-temperature corrections were included.
DOS and charge calculations were static single-point calculations without ionic motion (, ), using 520 eV, an electronic threshold of eV, and a Monkhorst–Pack mesh. The spin, smearing, and dipole treatment followed the settings above. The reported DOS grid and projection inputs were and . VASPKIT Standard Edition 1.3.5 (3 July 2022), options 111 and 113, was used for the total and element-projected DOS, respectively [82]. The TDOS is summed over the full slab; the spin-resolved elemental PDOS is summed over all atoms of that element and is not normalized per atom. The spectra were calculated only for hydrogen-free pristine and substituted slabs. DOS calculations were not performed for H2-adsorbed or other hydrogen-containing configurations; no H 1s projections are available. These spectra characterize the host electronic structure and are not evidence of H2 orbital occupation or a donation/back-donation mechanism.
Bader charge partitioning used the grid-based method of Henkelman and co-workers [83]. Charges are reported in units of e, with positive values denoting electron loss and negative values denoting electron gain. The molecular charge for H2 on a pristine slab is the sum over both H atoms. The dopant charges and the molecular charges refer to different reported datasets; dopant charges are not treated as adsorption-induced charge differences. The real-space maps are charge-density sections, not charge-density-difference or electron-localization-function maps.
Adsorption energies were formed from VASP total-energy values without entropy contributions, with each adsorbed structure referenced to a clean slab of the same metal composition and compatible constraints and settings. For the isolated H2 reference, computed in the same cell, the energy extrapolated to ( eV) was used; the entropy-excluded value ( eV) would make every two-H-system adsorption energy 0.008 eV less negative. Table 1 energies and Table 2 H–H separations describe the same adsorption structures. For NEB, every endpoint and image energy instead uses the last-ionic-step value in OSZICAR, extrapolated to , from the PBE/VASP 6.1.2 jobs. No NEB endpoint enters Table 1. Adsorption and NEB energies are not combined, and neither exact cancellation of smearing corrections nor equivalence of the two energy conventions is assumed. Table S1 distinguishes the calculation groups.
Table 2.
H–H internuclear separations before and after adsorption relaxation (Å). is listed only for molecular outcomes. The Mn/Fe separation is between distinct adsorbed H atoms, so no molecular bond-length change is assigned. Changes are calculated from the displayed distances.
2.3. Energy Definitions
2.3.1. Molecular, Dissociative, and Single-H Adsorption
For an intact adsorbed molecule, the adsorption energy is
where S denotes the matched clean slab with the same metal composition, cell, and constraint scheme, and the asterisk denotes an adsorbed species. For the independent one-H adsorption calculations,
This is an energy per H atom referenced to half a gas-phase H2 molecule; it is not an atomic-H desorption barrier. A configuration containing two separate adsorbed H atoms has the dissociative adsorption energy
Equations (1) and (3) are per incident H2 and use the same type of separated reference, but describe different final states. Table 1 denotes either outcome by and identifies the corresponding state explicitly. The single-H quantity in Equation (2) is not generally half the two-H adsorption energy, because the configurations, site occupation, and H–H interactions can differ. Negative values signify an exothermic energy difference under the stated convention; they do not by themselves identify the bonding mechanism or a kinetic barrier.
2.3.2. Selected Dissociation Profiles
Initial molecular and final two-H configurations were constructed following the reaction-setup approach of Izanlou and Aydinol [68] and relaxed independently. The upper four substrate planes and H were movable during endpoint preparation, while the lower eight planes were fixed. During optimization of the intermediate band images, all metal coordinates were fixed at their prepared positions and only H moved. H was free in x, y, and z for eleven paths; in Ti/Cr its lateral coordinates were fixed, leaving motion along z. This distinction between endpoint relaxation and band-image constraints is essential to interpreting the profiles. The dopant remains in atomic plane 3, not at an exposed surface site.
The endpoint relaxations comprise 5–100 ionic steps in the recorded histories. Endpoint OUTCAR files were retained only for Ti/Cr, so the remaining molecular endpoints are identified as separately relaxed configurations, not independently certified local minima. Their states are distinct from the Table 1 adsorption calculations. No systematic site or orientation search and no matched pristine-surface NEB series were performed.
Writing for the NEB energy of image i, including the endpoints in the sampled band, we define
The reverse height along the same sampled profile is . It is not an atomic-H desorption barrier, and it inherits the constraints and convergence limitations of that profile.
Only Ti/Cr reached the requested 0.02 eV/Å NEB force criterion; this convergence applies to its additional lateral H constraints. The other eleven bands stopped at the wall-time limit. Reported residual NEB forces are 0.15–0.34 eV/Å on the Fe face and 0.40–2.01 eV/Å for the nonconverged Ti-face bands. The sampled heights are therefore not a uniformly converged set of transition-state barriers. Final-step energy changes and residual forces are documented as convergence diagnostics, not converted into a validated error bar.
3. Results and Discussion
3.1. Adsorption and Surface-Termination Effects on Pristine TiFe(111)
3.1.1. Hydrogen Adsorption on Pristine TiFe(111)
Table 1 compares the reported adsorption energies for pristine and substituted configurations. Molecular and dissociated outcomes are distinguished explicitly instead of imposing a universal eV boundary between physisorption and chemisorption. Such an energy threshold would mix the sign of adsorption, the identity of the final state, and the character of bonding.
For the pristine models, the molecular adsorption energies are eV on the Ti face and eV on the Fe face. The corresponding H–H separations are 0.7760 and 0.7535 Å, compared with the common starting separation of 0.7506 Å (Table 2). On the Ti face, H2 lies 2.21 Å from the nearest Ti atom. On the Fe face, it lies 3.41 Å from the nearest Fe atom while the slab moment differs from that of the clean reference (18.9 versus 21.9 ), so the Fe-face value is attributed mainly to a change in slab state (Table 1, note a). Figure S10 presents top and side views of the relaxed pristine Fe-face molecular configuration, with the molecular axis described as approximately perpendicular to the surface. This is a qualitative orientation description; a coordinate-derived angle is not reported. The orientation and adsorption energy do not establish a donation/back-donation mechanism.
The final-state terminology in Table 1 and Table 2 is not a replacement binary bonding criterion. Supplementary Materials Table S6 therefore gives, for each relaxed configuration, the nearest metal–hydrogen distance, the distance to the substituent, and the height of each H atom above the outermost metal plane, all derived from the relaxed coordinates; Supplementary Materials Figures S13 and S14 show top and side views. The sums of the covalent radii of H and the metals considered here are about 1.6–2.0 Å [84]. The corresponding van der Waals sums are 3.6–3.8 Å [85]. Mn/Fe and Cr/Fe place H at a bonding distance from a surface Fe atom (Fe–H 1.68–1.73 Å, within the low- and high-spin Fe–H sums of 1.63 and 1.83 Å), and Sc/Fe places H 2.11 Å from Sc, slightly above the Sc–H sum of 2.01 Å. In the other configurations, H2 lies 2.2–4.3 Å from the nearest metal atom, longer than the covalent sums and, except for Co/Fe (4.28 Å), shorter than the van der Waals sums. The molecular outcomes of a limited relaxation search also do not exclude dissociation along another trajectory.
Earlier clean-surface calculations by Izanlou and Aydinol found no dissociation barrier on their Fe-terminated TiFe(111) pathway and a 1.164 eV barrier on their Ti-terminated pathway [68]. These are external literature results for their specific states and protocol, not same-protocol controls for the present substituted profiles. The fact that the reported pristine adsorption configurations here remain molecular is therefore not used to explain the experimentally required activation temperature or pressure.
3.1.2. Electronic Properties of Pristine TiFe(111)
Figure 2 provides the TDOS, metal-projected DOS, and charge-density sections of the pristine slab models. Both spectra have finite weight at the Fermi level and retain metallic character. The occupied spectral weight is predominantly Fe-d-derived, while the plotted Ti-d weight is more pronounced above . Differences in spectral shape between the modeled faces are apparent, but slab-summed spin asymmetry is not by itself an atom-resolved surface magnetic moment.
Figure 2.
TDOS and metal-projected DOS for hydrogen-free pristine Ti-face (top) and Fe-face (bottom) models, shown alongside the retained pristine-model charge-density sections. TDOS is summed over the slab and elemental PDOS over atoms of each element; neither is normalized per atom. The TDOS panels use opposite signs to display the two spin channels; this sign is a plotting convention, not negative density of states. The PDOS panels show Fe-d and Ti-d contributions in the displayed color scheme, with . The density panels show the electron-density distribution, not an adsorption-induced density difference; their color scale runs from blue (low) to red (high) electron density. No H 1s projection is included; the figure does not establish H2 orbital occupations.
The metal-projected spectra display different near-Fermi-level shapes for the two faces, including a split Fe spin-down feature in the Fe-face plot. This is a spectral observation, not proof that the corresponding states are spatially localized at a particular reactive atom or that they populate an H2 antibonding orbital. Since the DOS calculations contain no hydrogen, the adsorption interpretation below rests on the reported energies and configurations, with the DOS providing complementary host-state context.
The Bader charge summed over the two adsorbed H atoms in the pristine systems is on the Ti face and on the Fe face (Table 3). Under the stated convention, negative values indicate electronic charge gain. Because the pristine Fe-face energy is attributed mainly to a change in slab state (Table 1, note a), this pair does not test whether the net charge follows the binding strength. Nor do the present data establish that a particular metal-DOS feature controls adsorption.
Table 3.
Selected Bader charge-transfer values (e) for the pristine adsorption and substituted slab datasets. Positive values denote charge loss and negative values charge gain under the original convention, not formal oxidation states. The hydrogen row concerns the pristine H2 adsorption systems; the other rows identify the substituted atom in the reported doped-slab calculation. These dopant charges are not reported as adsorption-induced differences or as charges on hydrogen.
3.2. Adsorption on Substituted TiFe(111)
For the Ti-face molecular configurations, the adsorption energies range from to eV. In all six substituted cases, H2 lies 2.1–3.4 Å above the outer Ti plane (Supplementary Materials Table S6). The substituted values lie within 0.13 eV of the pristine value ( eV); without an uncertainty assessment, differences of this size are not resolved into a meaningful improvement or deterioration. The H–H separations remain close to the starting molecular separation in all of these relaxed configurations.
On the Fe face, the pristine, Co, Cr, and Ni entries of Table 1 include a change in slab state, because the total slab moment differs from that of the clean reference (Section 2.2). In the Co and Ni structures, H2 is little elongated (0.7508 and 0.7754 Å) and lies 4.28 and 2.39 Å from the nearest metal atom, so these energies are attributed mainly to that change rather than to H2 binding; in Ni/Fe, one surface Fe atom is also displaced 0.82 Å outward (Supplementary Materials Table S6). In Cr/Fe, the molecule is bound side-on to a surface Fe atom (Fe–H 1.68 Å) and has the longest molecular H–H separation, 0.8634 Å. These four entries are therefore excluded from comparisons of binding strength, and the observations do not establish the order of dissociation rates.
The Mn/Fe result belongs to a different final-state class. Relaxation from the selected molecular starting configuration gives two separated H atoms with an internuclear separation of 3.1727 Å and an adsorption energy of eV per incident H2. Both H atoms are bound to the same surface Fe atom (Fe–H 1.70 and 1.73 Å), which is displaced 0.76 Å outward, and the slab moment changes (18.0 to 19.4 ), so this energy includes substrate restructuring. This is dissociative adsorption according to Equation (3), not the strength of an intact molecular state. Relaxation to that outcome demonstrates the trajectory taken from that initial configuration; it does not establish that every approach geometry lacks a molecular minimum or a finite barrier. The value is consequently excluded from a ranking of molecular binding strengths.
The Sc/Fe configuration has eV and an H–H separation of 0.8309 Å; the molecule lies 2.11 Å from the Sc atom, which relaxes outward to approximately the height of plane 2. It is endothermic relative to the specified clean slab plus gas-phase molecule. That sign does not establish a repulsive force center, because a relative energy is not an energy gradient, nor does it determine whether an alternative metastable geometry exists. For V/Fe, the molecular energy is eV and the separation is 0.7538 Å. The result identifies weak binding in this particular configuration, not universal suppression of V-containing surface reactivity.
Reported single-H binding provides different information. For example, Ni/Fe has eV, whereas Mn/Fe has eV. The one-H quantity is defined separately from the two-H dissociative state. Co/Fe ( eV) is also not more exothermic than pristine Fe-face single-H binding ( eV). The single-H calculations were not re-examined for changes in slab state in this revision. None of these values establishes a hydride-nucleation barrier or the rate at which surface H enters the bulk.
Comparison with Kumar et al. requires identifying the final hydrogen state, despite the common TiFe(111) orientation [49]. Their Results state that initially horizontal H2 dissociates during relaxation; their Tables 2, 3, and 7 give the most favorable configurations found in their site search. Their supplementary Tables A and B identify two final H sites. In particular, the eV V/Fe state contains subsurface threefold Ti–Ti–Ti occupation and an off-top V-associated H atom. The present eV V/Fe entry instead describes a retained molecule. Table 4 therefore distinguishes the compared states rather than treating the values as conflicting determinations of the same molecular adsorption energy.
Table 4.
Selected TiFe(111) adsorption energies (eV), retained as reported in Kumar et al., their Tables 2, 3, and 7 and supplementary Tables A–B [49], and in Table 1. The Kumar column contains site-selected dissociated outcomes; the present column contains molecular outcomes except Mn/Fe. These are not matched-configuration benchmarks. No factor-of-two rescaling has been applied. a,b See the notes to Table 1.
A further model distinction is the substitution depth. Kumar replaces an exposed host atom, whereas the present model specification places the dopant in the second plane of that species (plane 3 of the alternating stack). The same replaced chemical species therefore does not imply the same local adsorption environment. This distinction is included in Supplementary Materials Table S4; it is not used as a quantitative explanation of the energy differences without matched calculations.
The apparent opposite substitution shifts previously inferred for Co/Ti and V/Fe compare different final-state classes: site-selected dissociative adsorption in Kumar et al. with selected molecular outcomes here. They do not establish opposite changes in the energy of an equivalent adsorption state. For Mn/Fe, both outcomes are dissociated, but equality of their local sites, substrate relaxation, and coverage have not been established; the remaining numerical difference is not resolved merely by labeling both states dissociated. The available literature thus identifies a concrete state-selection mismatch, not an independent validation of the present relaxations or profiles.
Kumar et al.’s displayed Equation (1) subtracts a clean-slab energy and one gas-phase H2 reference, without an explicit factor of one-half. The explanatory text beneath that equation contains inconsistent H2/2 notation; the published numbers are therefore retained without imposing a normalization conversion. Their model is described as a four-layer-deep slab with 14 Å vacuum, the bottom two layers fixed, and the remaining atoms relaxed to 0.05 eV/Å, using spin-polarized GPAW/vdW-DF. The present prescribed-cell and relaxation treatment differs, as does the electronic-structure method. These differences and the broader site search are documented in the Supplementary Materials; their separate contributions to the energy differences have not been isolated.
Li et al. use a gas-phase H2 reference in their Equations (2) and (5) for adsorption on TiFe(110) [69]. Their pristine Bridge-Fp2 configuration has eV (their Table 1) and dissociates after relaxation (their Figure 2). The selected Co-at-Fe and Sc-at-Ti states have and eV, respectively, as stated in their Conclusions. Their electronic analysis identifies the associated sites as Bridge-Fp2 for Co-at-Fe and Bridge-TMp1 for Sc-at-Ti. Relative to their reported pristine value, the differences are approximately and eV; these are adsorption-energy changes, not barrier reductions. Their favorable Sc-at-Ti dissociative configuration is distinct from the endothermic molecular Sc-at-Fe (111) configuration here in facet, substituted host site, and final hydrogen state.
Li et al. also sample multiple sites, initial heights, and orientations. Their Table 1 gives, for example, and eV after relaxation from Top-Fv starting heights of 1.0 and 1.5 Å, illustrating the importance of the starting configuration without establishing any particular present endpoint. Their Figure 4 gives site-dependent Mn results rather than a universal Mn efficiency, and their segregation analysis finds positive segregation energy for Mn replacing Fe (their Figure 3). Co-at-Ti yields a more negative plotted adsorption minimum than Co-at-Fe, but the final Co/Sc recommendation considers segregation and substitution as well as adsorption. Accordingly, the comparison must specify the selected criterion; it cannot be reduced to a single ranking by dopant name. The Kumar and Li studies do not report an analogous NEB dissociation-profile series, so the present selected profiles provide complementary pathway information only at the level supported by their own endpoint and convergence records.
3.3. Exploratory Electronic-Energy Profiles for H2 Dissociation
Figure 3 shows the PBE NEB profiles relative to their own separately prepared initial states. Table S2 collects the profile heights together with the reported reaction energies, H–H separations, and convergence diagnostics. These profiles neither use the same initial states as the adsorption calculations nor form a uniformly converged kinetic dataset. Eleven of the twelve bands did not meet the force criterion; Ti/Cr met it only with fixed lateral H coordinates. Accordingly, the curves are presented as documented exploratory profiles, not as a quantitative ranking of dissociation barriers or rates. Figures S11 and S12 give the image energies at the recorded optimization steps, documenting the state of each band when it stopped. With four images, no climbing image, and several initial states that are not minima along their bands, the image maxima are not bounds on the dissociation barriers.
Figure 3.
Selected ordinary-NEB PBE profiles for Fe-face (solid) and Ti-face (dotted) models with third-plane substitution. Each initial configuration defines its own zero. is the largest sampled relative energy, not an experimentally measured activation energy or a converged saddle-point barrier. Metal atoms were fixed in the band images; H was free in three directions except for Ti/Cr, where lateral H motion was constrained. Only Ti/Cr reached the 0.02 eV/Å criterion; the other eleven profiles are unconverged. The 3.925 eV Ti/Sc curve is retained as a record of a nonconverged trajectory and excluded from mechanistic interpretation. Numerical diagnostics and endpoint distinctions are given in the text and Table S2.
The recorded Fe-face heights are 0.045, 0.148, and 0.166 eV for Co, Cr, and Mn, respectively, with zero sampled rise for Ni, Sc, and V. The Ti-face values are retained in Table S2 and the figure; the 1.312 eV Ti/Cr height describes the laterally constrained path. The Ti/Sc band stopped after 10 steps with a residual force of 0.82 eV/Å, so its 3.925 eV height is not used to argue that Sc inhibits dissociation. The face-to-face differences, including Mn’s 0.166 versus 0.145 eV, are not interpreted as converged kinetic trends.
The complete endpoint summary in Table S2 gives molecular initial separations of 0.85–0.90 Å on the Fe face and 0.75–0.80 Å on the Ti face. The final two-H separations are 3.11–5.05 and 3.54–4.16 Å, respectively. All twelve reported endpoint differences are negative: to eV on the Fe face and to eV on the Ti face. Thus, the selected PBE final configurations have lower reported energies than their own separately prepared molecular initial configurations. This is not a comparison with gas-phase H2, nor proof of global adsorption minima or kinetically accessible paths. The reverse sampled heights in Table S2 describe the same recorded profiles viewed from their final states and inherit their nonconvergence and constraint limitations.
The Mn/Fe NEB initial state remained molecular after 29 relaxation steps, with H–H separation 0.88 Å. Its final state has H…H separation 5.05 Å, not the 3.1727 Å pair in the adsorption table. The NEB endpoint difference is eV and the highest sampled image, image 2, gives eV. After 13 band steps, the residual force was 0.29 eV/Å and the largest final-step image-energy change was 0.026 eV. This resolves the identity of the two reported configurations but does not turn the unconverged profile into a validated barrier from either adsorption state.
For Ni/Fe, the separately prepared NEB molecular state has H–H separation 0.90 Å after 63 endpoint-relaxation steps and is not the eV adsorption-table state. Image 1 is 0.017 eV below that NEB initial state and has a 1.43 Å H–H separation. The band stopped after 14 steps with a residual force of 0.34 eV/Å and a largest final-step image-energy change of 0.057 eV. Sc/Fe starts at 0.87 Å after 52 endpoint-relaxation steps; image 1 is 0.069 eV lower and has 1.53 Å separation. Its band residual force was 0.15 eV/Å after 22 steps. V/Fe starts at 0.85 Å after 40 endpoint-relaxation steps; the separations at images 1 and 2 are 0.87 and 1.93 Å, respectively. The energy rises by 0.007 eV between those two images while remaining below the initial-state reference. Its residual force was 0.28 eV/Å after 16 band steps. These observations specify the sampled trajectories; the zero-rise entries do not establish barrierless escape from stable molecular minima.
Izanlou and Aydinol reported no dissociation barrier for their clean Fe-face (111) path and 1.164 eV for their Ti-face path [68]. Those values provide external context, not matched controls for the present calculations. The present profiles are not subtracted from the literature values or combined with Table 1 energies to infer a dopant-induced barrier reduction. Their remaining uses are to document distinct selected routes and to identify the endpoint, constraint, and convergence requirements for a subsequent kinetic study.
3.4. Electronic Properties of Substituted TiFe(111)
The electronic analysis is organized around what the available descriptors resolve. Adsorption energies compare complete configurations, H–H separations describe intramolecular distortion or dissociation, Bader charges partition electron density, and metal-projected DOS describes spectral contributions in the slab models. These quantities need not have identical orderings. Their value here is in comparing specific observations rather than fitting a universal electronic descriptor to a small set of non-equivalent states.
3.4.1. Ti-Face Models
Figure 4 shows the Fe-d and Ti-d projections for the substituted Ti-face models. Their broad host-state distributions remain similar across the series, with occupied Fe-derived weight and Ti-derived weight above the Fermi level. Figure S8 supplies the corresponding dopant-resolved spectra. A small dopant contribution relative to a host-species sum should not be interpreted as evidence that the dopant has no local electronic effect.
Figure 4.
Fe-d and Ti-d projected DOS for the substituted Ti-face models. The mirrored spin channels and species colors follow the displayed legend, and is indicated by the dashed line. These metal projections provide slab electronic context; they contain no explicit H 1s projection and are not used to assign H2 bonding/antibonding populations.
The Ti-face dopant charges in Table 3 are negative for Co and Ni and positive for Cr, Mn, Sc, and V under the stated convention. All six reported Ti-face adsorption outcomes nevertheless remain molecular, with relatively small H–H changes. For example, the positive Sc dopant charge accompanies the most exothermic molecular energy among the substituted Ti-face cases, but it does not establish a transition from molecular binding to dissociation. These dopant charges are not measurements of charge transferred to the molecule during adsorption.
Figure 5 illustrates the spatial distribution of electron density in the displayed sections. It does not show hydrogen contact distances or heights, which are given in Supplementary Materials Table S6 and Figures S13 and S14. Local variations in such a section are therefore not converted into a mechanistic ranking or used to certify the stability of an adsorption state.
Figure 5.
Charge-density sections of the Ti-face models: (a) V; (b) Co; (c) Cr; (d) Mn; (e) Ni; (f) Sc. The color scale runs from blue (low) to red (high) electron density. These are sections through the density fields, not three-dimensional relaxed adsorption structures, adsorption-induced density differences, or electron-localization functions.
3.4.2. Fe-Face Models
The Fe-face projections in Figure 6 retain the principal host-band structure while displaying substitution-dependent changes in the near-Fermi-level Fe spin-down features. The split feature is more readily identifiable for Co than for Sc and V in the plotted spectra, whereas Cr, Mn, and Ni show intermediate changes in shape. This describes the metal spectra shown; it does not establish a localized H–metal hybrid or a causal relationship with a particular dissociation barrier. Figure S9 provides the dopant-resolved spectra. The corresponding charge-density sections are shown in Figure 7.
Figure 6.
Fe-d and Ti-d projected DOS for the substituted Fe-face models, with the displayed spin-channel/color conventions and . Differences in the metal-projected spectral shapes are not direct evidence of H 1s hybridization or a unique donation/back-donation process; hydrogen-resolved projections are not included.
Figure 7.
Charge-density sections of the Fe-face models: (a) V; (b) Co; (c) Cr; (d) Mn; (e) Ni; (f) Sc. These density maps provide real-space electronic context; the color scale runs from blue (low) to red (high) electron density. They do not show a charge-density difference induced by H2 adsorption and do not replace top/side views of the actual relaxed hydrogen configurations.
Co and Ni carry negative assigned dopant charges on the Fe face, while Cr, Mn, Sc, and V carry positive values. These charges do not order the H–H elongation: Cr and V both carry positive charges, but Cr elongates H2 more than Ni does and V less, and Sc is both molecularly elongated and endothermic relative to the separated reference. The Mn result belongs to the dissociated class and cannot be treated as another point on the same molecular-adsorption correlation. These comparisons show why an analysis of the descriptors must first control for the identity of the final state.
Taken together, the available charge and spectral information complements the adsorption-state comparison without resolving a unique orbital mechanism. Because several Fe-face energies include changes in slab state, the present charge and spectral data are not used to order binding strengths. Coordinate-resolved contact geometries are given in Supplementary Materials Table S6; hydrogen-projected spectra would be needed for any assignment of H–metal orbital interactions. A hydrogen-resolved orbital assignment is therefore not established by the evidence reported here.
4. Implications and Limitations for Hydrogen Uptake
Hydrogen adsorption, H–H cleavage, surface residence, surface-to-subsurface migration, and hydride formation are distinct steps. A strongly stabilized surface state may contribute to persistent site occupation, but its adsorption energy does not determine the energy of the saddle point for escape into a subsurface site. Thus, favorable dissociative adsorption can coexist with a subsequent transport limitation; neither continued site availability nor poisoning is established by a single adsorption event.
For a consistent reversible path with the same transition state, the identity
follows by subtracting the two endpoint energies from that transition-state energy. For the sampled NEB records here, the analogous quantity is , which does not certify a transition state or remove nonconvergence. For it describes reverse recombination to the molecularly adsorbed state, not automatically desorption into the gas phase. The one-H quantities reported in Table 1 cannot be combined with a different two-H NEB final state to obtain this barrier. No atomic-H desorption barrier or complete site-regeneration cycle is reported here.
The literature provides examples of the distinction between surface affinity and subsequent transport. Bakulin et al. found a preferred bulk-interstitial diffusion path with a barrier of 0.62 eV in B2-TiFe and reported that Co and Ni increase the barrier along that preferred path [46]. These are bulk diffusion results, not escape barriers from the present adsorption sites. Santhosh et al. likewise distinguished H2 cleavage from hydrogen penetration through an oxidized near-surface region [70]. Experimental activation and oxide characterization by Kim et al., together with their computed nucleation energetics, demonstrate why the response of a processed alloy need not follow a clean-surface molecular-binding order [71].
For Mn, this distinction is particularly important. Pati et al. examined activation and oxide-resistance changes in Mn-containing alloys [54]; those observations do not isolate the clean-surface configuration considered here. Rachidi et al. studied multiphase, nominal TiFe0.80Mn0.10 and TiFe0.85V0.05 alloys [56]. Their Section 3.4 and Figure 5 report a dominant Mn-hydride DSC desorption peak at 120–150 °C, depending on heating rate, under 50 bar H2, together with a lower-temperature feature at 60–90 °C. This is a protocol-dependent peak range, not a universal onset or an irreversible-release threshold. Their pressure–composition measurements also include desorption at 20 °C under decreasing pressure (their Figure 2).
Rachidi et al.’s representative Mn Kissinger value is 1.35 eV, compared with 1.72 and 1.60 eV for the two analyzed V features. These are apparent macroscopic desorption parameters, distinct from their bulk-hydride migration barriers and from the present eV surface adsorption energy, which also includes surface restructuring. Their migration results are also phase-specific: the largest reported barriers on the two examined paths are 0.71 and 0.75 eV for Mn in the and phases, respectively, versus 0.86 and 0.19 eV for V. Neither the DSC peak temperature nor the barrier ordering yields a universal Mn/V transport ranking. The present Mn surface state can motivate a connected uptake/release study, but its energy alone establishes neither irreversible trapping nor an ideal storage additive. The experimental conditions and phase distinctions used in this comparison are detailed in Supplementary Materials Section S3.3.
A prescribed substitutional surface model also does not uniquely represent a synthesized alloy. Processing can change segregation, secondary phases, oxide coverage, and the connectivity of hydrogen-transport paths [60,62,63,65,86]. In a distinct data-driven setting, Yu et al. obtained limited accuracy for hydrogen-capacity prediction and identified missing phase and synthesis descriptors as important limitations [87]. This is not evidence that all composition-based predictions fail; it emphasizes the need to specify the material state. The present clean-surface calculations do not predict reversible capacity, cycle life, or the overall uptake/desorption rate.
The principal limits of the comparison are the prescribed near-surface substitutions, sampled adsorption states, and absence of equilibrium facet/termination and relaxation-depth studies. The absence of a dispersion correction mainly affects the weakly interacting molecular configurations. The kinetic limitation is specific: adsorption energies were calculated with a relaxed substrate, whereas the ordinary-NEB trajectories use metal atoms fixed within each image; eleven trajectories are unconverged and the remaining Ti/Cr trajectory has an additional lateral H constraint. The two calculations therefore do not establish a common minimum-energy landscape or a quantitative ranking of elementary rates. Resolving those questions requires consistent treatments and completed pathway optimization, followed where appropriate by vibrational and transport analysis.
5. Conclusions and Outlook
Spin-polarized PBE calculations compare molecular, dissociative, and reported single-H adsorption for six third-plane substitutions in asymmetric TiFe(111) slabs. Four outer substrate planes were relaxed for these adsorption calculations. The comparison distinguishes the resulting configurations from the site-selected dissociative states reported in earlier work and from the separately prepared initial and final states of the present PBE NEB calculations.
All investigated Ti-face adsorption relaxations retain molecular hydrogen. On the Fe face, Mn reaches a dissociated configuration at eV per incident H2, an energy that includes surface restructuring and a change in slab state; Cr and Sc elongate the molecule (0.8634 and 0.8309 Å); and Co, Ni, and V change it by less than 0.03 Å. For the pristine, Co, Cr, and Ni Fe-face models, the tabulated energies include a change in slab state. Sc/Fe is endothermic relative to the stated reference rather than favorable physisorption. The reported observations distinguish binding from molecular distortion; they do not provide a universal ranking of overall hydrogen-storage additives.
The NEB summary identifies Mn/Fe and Ni/Fe molecular starting configurations that differ from their adsorption-table counterparts. The Mn/Fe endpoint difference is eV, while its 0.166 eV sampled rise remains unconverged. Only the Ti/Cr band reached the specified force criterion, under fixed lateral H coordinates; the other eleven bands did not. Accordingly, neither the zero-rise Fe-face trajectories nor the face-dependent profile heights are used to claim validated barrierless dissociation, a kinetic dopant ranking, or improvement over pristine TiFe(111).
The metal-projected spectra and Bader data provide electronic context, but neither a net-charge magnitude nor a metal-DOS feature is established as a sufficient descriptor of hydrogen activation. In particular, no H-resolved orbital mechanism is inferred from the metal-only spectra. The resulting contribution is a configuration-specific comparison of energetic, structural, and selected pathway information within the stated model constraints.
A focused next study should first complete the selected paths with matched electronic treatments and well-defined, consistent substrate and hydrogen constraints, and then connect dissociation with surface-to-subsurface transfer. This would test whether surface stabilization is followed by incorporation or persistent occupation. Coverage effects, oxide environments, and vibrational corrections can subsequently be considered for the relevant paths; stronger adsorption alone is not equated with improved hydrogen delivery.
Supplementary Materials
The following supporting information can be downloaded at https://www.mdpi.com/article/10.3390/ma19224792/s1. The Supporting Information gives the calculation-specific settings (Table S1), expanded NEB state and convergence summary (Table S2), literature comparisons (Tables S3 and S4 and Section S3), and Co-example slab geometry (Table S5). Table S2 separates reported profile heights, endpoint reaction energies, internuclear distances, and numerical convergence; it is not a table of uniformly converged barriers. Figures S1–S5 give the original total-energy, magnetic-initialization, and separation-sensitivity data. Figures S6–S9 show hydrogen-free spectra, and Figure S10 gives top and side views of the relaxed pristine Fe-face H2 configuration. Figures S11 and S12 give the NEB image-energy histories, and Table S6 and Figures S13 and S14 the hydrogen geometry and the top and side views of the relaxed pristine and substituted configurations.
Author Contributions
T.S. : Writing—review and editing; Writing—original draft; Validation; Methodology; Investigation; Formal analysis; Data curation; Resources. A.M.: Writing—review and editing; Formal analysis; Visualization; Data curation. Y.A.: Writing—review and editing; Writing—original draft; Validation; Methodology; Data curation; Conceptualization. B.M.: Writing—review and editing; Formal analysis. D.O.: Writing—review and editing; Formal analysis. S.Z.: Writing—review and editing; Formal analysis; Funding acquisition. Y.W.: Writing—review and editing; Software; Resources; Formal analysis; Conceptualization; Funding acquisition. All authors have read and agreed to the published version of the manuscript.
Funding
This research was conducted at Nazarbayev University under the Contract for the Procurement of Works No. 1135693/2025/1 dated 09 September 2025 with LLP “KMG Engineering”. The project “Development of titanium-based alloys for hydrogen storage and transportation” is funded by the Center for Scientific and Technological Initiatives “Samgau”.
Data Availability Statement
The numerical results presented in this study are included in the article and its Supporting Information. The retained computational records are incomplete: endpoint OUTCAR files are retained only for the Ti/Cr NEB calculation, as documented in Section 2.3.2 and Supplementary Materials Section S2.3. Further inquiries regarding retained calculation records may be directed to the corresponding authors. The relaxed coordinates of the adsorption structures summarized in Supplementary Materials Table S6 are available from the corresponding authors upon reasonable request.
Acknowledgments
The authors acknowledge the computational resources provided by Nazarbayev University and thank KazMunayGas and KMG Engineering for their support. During manuscript revision in October 2026, the authors used ChatGPT (GPT-Sol; OpenAI) to assist with consistency checking and LaTeX preparation. In the final revision, Claude (Claude Opus 5.5 and Claude Fable 5.1; Anthropic) was used to check the calculation output files, compute the geometric data in Supplementary Materials Table S6, render Supplementary Materials Figures S13 and S14, and assist with LaTeX preparation. Details of the use of these tools are given in the Acknowledgments section of the Supplementary Materials, and the use of Claude for Figures S13 and S14 is also noted in the captions of these figures. The authors have reviewed and edited the output and take full responsibility for the content of this publication.
Conflicts of Interest
Authors Diana Otegen and Saule Zholdayakova are employed by KMG Engineering Atyrau. The authors declare that this study received funding as stated in the Funding section. The funders were not involved in the study design, collection, analysis, interpretation of data, the writing of this article or the decision to submit it for publication. The remaining authors declare no conflicts of interest.
References
- Schlapbach, L.; Züttel, A. Hydrogen-storage materials for mobile applications. Nature 2001, 414, 353–358. [Google Scholar] [CrossRef] [Scilit] [PubMed]
- Hirscher, M.; Yartys, V.A.; Baricco, M.; von Colbe, J.B.; Blanchard, D.; Bowman, R.C., Jr.; Broom, D.P.; Buckley, C.E.; Chang, F.; Chen, P.; et al. Materials for hydrogen-based energy storage–past, recent progress and future outlook. J. Alloys Compd. 2020, 827, 153548. [Google Scholar] [CrossRef] [Scilit]
- Yu, X.; LeBlanc, S.; Sandhu, N.; Wang, L.; Wang, M.; Zheng, M. Decarbonization potential of future sustainable propulsion—A review of road transportation. Energy Sci. Eng. 2024, 12, 438–455. [Google Scholar] [CrossRef] [Scilit]
- Xu, Y.; Zhou, Y.; Li, C.; Dong, S.; Liu, H.; Yang, W.; Li, Y.; Jiang, H.; Ding, Z.; Li, H.; et al. Unraveling the potential of solid-state hydrogen storage materials: Insights from first principle calculations. Fuel 2024, 373, 132340. [Google Scholar] [CrossRef] [Scilit]
- Zhou, P.; Zhou, Q.; Xiao, X.; Fan, X.; Zou, Y.; Sun, L.; Jiang, J.; Song, D.; Chen, L. Machine learning in solid-state hydrogen storage materials: Challenges and perspectives. Adv. Mater. 2025, 37, 2413430. [Google Scholar] [CrossRef] [Scilit] [PubMed]
- Qayyum, M.N.; Majid, A.; Raza, M.T. Solid-state hydrogen storage in metal hydrides: Mechanistic insights into kinetics, activation, and destabilization strategies. RSC Adv. 2026, 16, 37300–37327. [Google Scholar] [CrossRef] [Scilit] [PubMed]
- Thomas, J.M.; Edwards, P.P.; Dobson, P.J.; Owen, G.P. Decarbonising energy: The developing international activity in hydrogen technologies and fuel cells. J. Energy Chem. 2020, 51, 405–415. [Google Scholar] [CrossRef] [Scilit] [PubMed]
- Mac Dowell, N.; Sunny, N.; Brandon, N.; Herzog, H.; Ku, A.Y.; Maas, W.; Ramirez, A.; Reiner, D.M.; Sant, G.N.; Shah, N. The hydrogen economy: A pragmatic path forward. Joule 2021, 5, 2524–2529. [Google Scholar] [CrossRef] [Scilit]
- Chen, S.; Yang, M.; Shen, S.; Ouyang, L. Advanced simulations from DFT to machine learning for solid-state hydrogen storage: Fundamentals, progresses, challenges and perspectives. Prog. Mater. Sci. 2026, 101653. [Google Scholar] [CrossRef] [Scilit]
- Zhang, H.; Maijenburg, A.W.; Li, X.; Schweizer, S.L.; Wehrspohn, R.B. Bifunctional heterostructured transition metal phosphides for efficient electrochemical water splitting. Adv. Funct. Mater. 2020, 30, 2003261. [Google Scholar] [CrossRef] [Scilit]
- Sarker, A.K.; Azad, A.K.; Rasul, M.G.; Doppalapudi, A.T. Prospect of green hydrogen generation from hybrid renewable energy sources: A review. Energies 2023, 16, 1556. [Google Scholar] [CrossRef] [Scilit]
- Muthukumar, P.; Kumar, A.; Afzal, M.; Bhogilla, S.; Sharma, P.; Parida, A.; Jana, S.; Kumar, E.A.; Pai, R.K.; Jain, I. Review on large-scale hydrogen storage systems for better sustainability. Int. J. Hydrogen Energy 2023, 48, 33223–33259. [Google Scholar] [CrossRef] [Scilit]
- Aziz, M. Liquid hydrogen: A review on liquefaction, storage, transportation, and safety. Energies 2021, 14, 5917. [Google Scholar] [CrossRef] [Scilit]
- Mekonnin, A.S.; Wacławiak, K.; Humayun, M.; Zhang, S.; Ullah, H. Hydrogen storage technology, and its challenges: A review. Catalysts 2025, 15, 260. [Google Scholar] [CrossRef] [Scilit]
- Zhao, Y.; Gong, M.; Zhou, Y.; Dong, X.; Shen, J. Thermodynamics analysis of hydrogen storage based on compressed gaseous hydrogen, liquid hydrogen and cryo-compressed hydrogen. Int. J. Hydrogen Energy 2019, 44, 16833–16840. [Google Scholar] [CrossRef] [Scilit]
- Modisha, P.M.; Ouma, C.N.; Garidzirai, R.; Wasserscheid, P.; Bessarabov, D. The prospect of hydrogen storage using liquid organic hydrogen carriers. Energy Fuels 2019, 33, 2778–2796. [Google Scholar] [CrossRef] [Scilit]
- Chen, K.; Lau, M.Y.; Luo, X.; Huang, J.; Ouyang, L.; Yang, X.S. Research progress in solid-state hydrogen storage alloys: A review. J. Mater. Sci. Technol. 2026, 246, 256–289. [Google Scholar] [CrossRef] [Scilit]
- Sandrock, G. A panoramic overview of hydrogen storage alloys from a gas reaction point of view. J. Alloys Compd. 1999, 293, 877–888. [Google Scholar] [CrossRef] [Scilit]
- Mayer, T.; Gierse, M.; Morales, M.A.G.; Schmidt, K.M.; Bauer, A.; Wind, J. Techno-economic evaluation of hydrogen refueling stations with liquid or gaseous stored hydrogen. Int. J. Hydrogen Energy 2019, 44, 25809–25833. [Google Scholar] [CrossRef] [Scilit]
- Liu, J.; Zheng, S.; Zhang, Z.; Zheng, J.; Zhao, Y. Numerical study on the fast filling of on-bus gaseous hydrogen storage cylinder. Int. J. Hydrogen Energy 2020, 45, 9241–9251. [Google Scholar] [CrossRef] [Scilit]
- Fang, L.; Dong, X.; Wang, H.; Gong, M. Economic analysis of compressed gaseous hydrogen, liquid hydrogen, and cryo-compressed hydrogen storage methods for large-scale storage and transportation. Int. J. Hydrogen Energy 2025, 162, 150725. [Google Scholar] [CrossRef] [Scilit]
- Lim, K.L.; Kazemian, H.; Yaakob, Z.; Daud, W.W. Solid-state materials and methods for hydrogen storage: A critical review. Chem. Eng. Technol. Ind. Chem.-Plant Equip.-Process Eng.-Biotechnol. 2010, 33, 213–226. [Google Scholar] [CrossRef] [Scilit]
- Ait Ousaleh, H.; Mehmood, S.; Baba, Y.F.; Bürger, I.; Linder, M.; Faik, A. An analytical review of recent advancements on solid-state hydrogen storage. Int. J. Hydrogen Energy 2024, 52, 1182–1193. [Google Scholar] [CrossRef] [Scilit]
- Tu, J.; Zhou, P.; Chen, S.; Shen, S.; Liu, X.; Xiao, X.; Li, Z.; Ouyang, L. Solid-state hydrogen storage alloys for production-storage and transportation-application coupling at ambient temperature: A review. Mater. Sci. Eng. R Rep. 2026, 167, 101089. [Google Scholar] [CrossRef] [Scilit]
- Myrzakhmetov, B.; Shomenov, T.; Sultanov, F.; Mentbayeva, A.; Zhang, W.; Wang, Y. Density functional theory insights into decorated, doped, and defective graphene as a model system for understanding hydrogen storage in carbon materials. Carbon Lett. 2026, 36, 579–616. [Google Scholar] [CrossRef] [Scilit]
- Myrzakhmetov, B.; Shomenov, T.; Sultanov, F.; Wang, Y.; Mentbayeva, A. Hydrogen adsorption on pristine and modified graphene: DFT insights into defects, doping, and decoration. Int. J. Hydrogen Energy 2025, 126, 413–428. [Google Scholar] [CrossRef] [Scilit]
- Shomenov, T.; Kenzhebek, M.; Myrzakhmetov, B.; Sultanov, F.; Mentbayeva, A.; Wang, Y. Boron-doped, lithium-decorated graphene layer for hydrogen storage technologies. Int. J. Hydrogen Energy 2026, 223, 154314. [Google Scholar] [CrossRef] [Scilit]
- Schneemann, A.; White, J.L.; Kang, S.; Jeong, S.; Wan, L.F.; Cho, E.S.; Heo, T.W.; Prendergast, D.; Urban, J.J.; Wood, B.C.; et al. Nanostructured metal hydrides for hydrogen storage. Chem. Rev. 2018, 118, 10775–10839. [Google Scholar] [CrossRef] [Scilit] [PubMed]
- Faurie, D.; Manganyi, M.; Koech, L.; Premlall, K.; Kolesnikov, A.; Lototskyy, M. An analysis of the hydrogen energy knowledge base with a focus on metal hydride-based solid-state hydrogen storage application. J. Alloys Compd. 2026, 186908. [Google Scholar]
- Huang, Z.; Han, Z.; Zhai, T.; Gao, P.; Sun, H.; Li, J.; Wang, B.; Yuan, Z.; Zhang, L.; Guo, Y.; et al. Research progress on theoretical calculation and modification strategy of TiFe-based hydrogen storage materials. J. Alloys Compd. 2025, 1028, 180669. [Google Scholar] [CrossRef] [Scilit]
- Gambini, M.; Stilo, T.; Vellini, M. Hydrogen storage systems for fuel cells: Comparison between high and low-temperature metal hydrides. Int. J. Hydrogen Energy 2019, 44, 15118–15134. [Google Scholar] [CrossRef] [Scilit]
- Rusman, N.A.A.; Dahari, M. A review on the current progress of metal hydrides material for solid-state hydrogen storage applications. Int. J. Hydrogen Energy 2016, 41, 12108–12126. [Google Scholar] [CrossRef] [Scilit]
- Kalibek, M.; Ospanova, A.; Suleimenova, B.; Soltan, R.; Orazbek, T.; Makhmet, A.; Rafikova, K.S.; Nuraje, N. Solid-state hydrogen storage materials. Discov. Nano 2024, 19, 195. [Google Scholar] [CrossRef] [Scilit] [PubMed]
- Ali, M.; Bibi, Z.; Mubashir, M.; Younis, M.; Afzal, U.; El-marghany, A. A computational investigation of lithium-based metal hydrides for advanced solid-state hydrogen storage. ChemistrySelect 2024, 9, e202304582. [Google Scholar] [CrossRef] [Scilit]
- Reilly, J.; Wiswall, R. Formation and properties of iron titanium hydride. Inorg. Chem. 1974, 13, 218–222. [Google Scholar] [CrossRef] [Scilit]
- Zhang, Y.H.; Li, C.; Yuan, Z.M.; Qi, Y.; Guo, S.H.; Zhao, D.L. Research progress of TiFe-based hydrogen storage alloys. J. Iron Steel Res. Int. 2022, 29, 537–551. [Google Scholar] [CrossRef] [Scilit]
- Van der Kraan, A.; Buschow, K. The 57Fe Mössbauer isomer shift in intermetallic compounds of iron. Phys. B C 1986, 138, 55–62. [Google Scholar] [CrossRef] [Scilit]
- Fischer, P.; Hälg, W.; Schlapbach, L.; Stucki, F.; Andresen, A. Deuterium storage in FeTi. Measurement of desorption isotherms and structural studies by means of neutron diffraction. Mater. Res. Bull. 1978, 13, 931–946. [Google Scholar] [CrossRef] [Scilit]
- Liu, H.; Zhang, J.; Sun, P.; Zhou, C.; Liu, Y.; Fang, Z.Z. An overview of TiFe alloys for hydrogen storage: Structure, processes, properties, and applications. J. Energy Storage 2023, 68, 107772. [Google Scholar] [CrossRef] [Scilit]
- Endo, N.; Suzuki, S.; Goshome, K.; Maeda, T. Operation of a bench-scale TiFe-based alloy tank under mild conditions for low-cost stationary hydrogen storage. Int. J. Hydrogen Energy 2017, 42, 5246–5251. [Google Scholar] [CrossRef] [Scilit]
- Jankowska, E.; Makowiecka, M.; Jurczyk, M. Nickel–metal hydride battery using nanocrystalline TiFe-type hydrogen storage alloys. J. Alloys Compd. 2005, 404, 691–693. [Google Scholar] [CrossRef] [Scilit]
- Sujan, G.; Pan, Z.; Li, H.; Liang, D.; Alam, N. An overview on TiFe intermetallic for solid-state hydrogen storage: Microstructure, hydrogenation and fabrication processes. Crit. Rev. Solid State Mater. Sci. 2020, 45, 410–427. [Google Scholar] [CrossRef] [Scilit]
- Schlapbach, L.; Riesterer, T. The activation of FeTi for hydrogen absorption. Appl. Phys. A 1983, 32, 169–182. [Google Scholar] [CrossRef] [Scilit]
- Schlapbach, L. Surface properties and activation. In Hydrogen in Intermetallic Compounds II: Surface and Dynamic Properties, Applications; Springer: Berlin/Heidelberg, Germany, 2005; pp. 15–95. [Google Scholar]
- Lee, G.; Kim, J.; Koo, Y.; Kulkova, S. The adsorption of hydrogen on B2 TiFe surfaces. Int. J. Hydrogen Energy 2002, 27, 403–412. [Google Scholar] [CrossRef] [Scilit]
- Bakulin, A.; Kulkov, S.; Kulkova, S.; Hocker, S.; Schmauder, S. Influence of substitutional impurities on hydrogen diffusion in B2-TiFe alloy. Int. J. Hydrogen Energy 2014, 39, 12213–12220. [Google Scholar] [CrossRef] [Scilit]
- Lys, A.; Fadonougbo, J.O.; Faisal, M.; Suh, J.Y.; Lee, Y.S.; Shim, J.H.; Park, J.; Cho, Y.W. Enhancing the hydrogen storage properties of AxBy intermetallic compounds by partial substitution: A short review. Hydrogen 2020, 1, 38–63. [Google Scholar] [CrossRef] [Scilit]
- Dematteis, E.M.; Berti, N.; Cuevas, F.; Latroche, M.; Baricco, M. Substitutional effects in TiFe for hydrogen storage: A comprehensive review. Mater. Adv. 2021, 2, 2524–2560. [Google Scholar] [CrossRef] [Scilit]
- Kumar, V.; Kumar, P.; Takahashi, K.; Sharma, P. Hydrogen adsorption studies of TiFe surfaces via 3-d transition metal substitution. Int. J. Hydrogen Energy 2022, 47, 16156–16164. [Google Scholar] [CrossRef] [Scilit]
- Nayebossadri, S.; Greenwood, C.J.; Book, D. Evaluating some design criteria for TiFe-based ternary hydrogen storage alloys. J. Alloys Compd. 2023, 947, 169456. [Google Scholar] [CrossRef] [Scilit]
- Cho, Y.; Witman, M.D.; Park, H.K.; Ko, W.S.; Wood, B.C.; Stavila, V.; Cho, E.S. Data-driven multi-element substitution of TiFe alloys for tunable thermodynamics and enhanced activation behaviour for hydrogen storage. J. Mater. Chem. A 2025, 13, 35209–35219. [Google Scholar] [CrossRef] [Scilit]
- Huang, Z.; Song, B.; Yang, C.; Han, Z.; Li, J.; Kang, X.; Sun, H.; Zhai, T.; Yuan, Z.; Hao, Q.; et al. Effects of Nd substitution and its content on hydrogen storage performance of TiFe-based alloys. Intermetallics 2026, 191, 109202. [Google Scholar] [CrossRef] [Scilit]
- Yang, T.; Wang, P.; Xia, C.; Liu, N.; Liang, C.; Yin, F.; Li, Q. Effect of chromium, manganese and yttrium on microstructure and hydrogen storage properties of TiFe-based alloy. Int. J. Hydrogen Energy 2020, 45, 12071–12081. [Google Scholar] [CrossRef] [Scilit]
- Pati, S.; Trimbake, S.; Vashistha, M.; Sharma, P. Tailoring the activation behaviour and oxide resistant properties of TiFe alloys by doping with Mn. Int. J. Hydrogen Energy 2021, 46, 34830–34838. [Google Scholar] [CrossRef] [Scilit]
- Zheng, G.; Ding, X.; Ma, X.; Wen, M.; Cao, W.; Zhang, P.; Wang, Q.; Chen, R. Thermodynamic insights on H migration and stability of hydrides in over-stoichiometric Ti doped Ti-Fe-Mn hydrogen storage alloy: A theoretical calculation and experimental study. J. Alloys Compd. 2025, 1050, 185775. [Google Scholar]
- Rachidi, S.; Kassaoui, M.E.; Garelli, F.; Dematteis, E.M.; Palumbo, M.; Tahiri, N.; Mounkachi, O.; Baricco, M.; Ez-Zahraouy, H. Tuning TiFe doped with Mn and V for enhanced hydrogen storage: Experiments and DFT insights. Int. J. Hydrogen Energy 2026, 244, 155672. [Google Scholar] [CrossRef] [Scilit]
- Wei, X.; Chen, W.; He, X.; Wang, L.; Jiao, D.; Fu, Y.Q. Strategies for enhancing hydrogen storage performance of TiFe through alloying Mn and La. Int. J. Hydrogen Energy 2026, 208, 153293. [Google Scholar] [CrossRef] [Scilit]
- Dematteis, E.M.; Dreistadt, D.M.; Capurso, G.; Jepsen, J.; Cuevas, F.; Latroche, M. Fundamental hydrogen storage properties of TiFe-alloy with partial substitution of Fe by Ti and Mn. J. Alloys Compd. 2021, 874, 159925. [Google Scholar] [CrossRef] [Scilit]
- Li, C.; Gao, X.; Liu, B.; Wei, X.; Zhang, W.; Lan, Y.; Wang, H.; Yuan, Z. Effects of Zr doping on activation capability and hydrogen storage performances of TiFe-based alloy. Int. J. Hydrogen Energy 2023, 48, 2256–2270. [Google Scholar] [CrossRef] [Scilit]
- Lee, S.M.; Perng, T.P. Effect of the second phase on the initiation of hydrogenation of TiFe1- xMx (M= Cr, Mn) alloys. Int. J. Hydrogen Energy 1994, 19, 259–263. [Google Scholar] [CrossRef] [Scilit]
- Qu, H.; Du, J.; Pu, C.; Niu, Y.; Huang, T.; Li, Z.; Lou, Y.; Wu, Z. Effects of Co introduction on hydrogen storage properties of Ti–Fe–Mn alloys. Int. J. Hydrogen Energy 2015, 40, 2729–2735. [Google Scholar] [CrossRef] [Scilit]
- Gosselin, C.; Huot, J. Hydrogenation properties of TiFe doped with zirconium. Materials 2015, 8, 7864–7872. [Google Scholar] [CrossRef] [Scilit] [PubMed]
- Jain, P.; Gosselin, C.; Huot, J. Effect of Zr, Ni and Zr7Ni10 alloy on hydrogen storage characteristics of TiFe alloy. Int. J. Hydrogen Energy 2015, 40, 16921–16927. [Google Scholar] [CrossRef] [Scilit]
- Shang, H.; Zhang, Y.; Li, Y.; Gao, J.; Zhang, W.; Wei, X.; Yuan, Z.; Ju, L. Effect of Pr content on activation capability and hydrogen storage performances of TiFe alloy. J. Alloys Compd. 2022, 890, 161785. [Google Scholar] [CrossRef] [Scilit]
- Garelli, F.; Dematteis, E.M.; Stavila, V.; Di Florio, G.; Carbone, C.; Agostini, A.; Palumbo, M.; Baricco, M.; Rizzi, P. Kinetics tuning of TiFe alloys by elemental substitution: Enabling activation under moderate conditions. Int. J. Hydrogen Energy 2025, 162, 150720. [Google Scholar] [CrossRef] [Scilit]
- Kinaci, A.; Aydinol, M. Ab initio investigation of FeTi–H system. Int. J. Hydrogen Energy 2007, 32, 2466–2474. [Google Scholar] [CrossRef] [Scilit]
- Kumar, V.; Kumar, P.; Pati, S.; Sharma, P.; Takahashi, K. Tuning the hydrogen storage properties of TiFe clusters via Zr substitution. Energy Storage 2020, 2, e157. [Google Scholar] [CrossRef] [Scilit]
- Izanlou, A.; Aydinol, M. An ab initio study of dissociative adsorption of H2 on FeTi surfaces. Int. J. Hydrogen Energy 2010, 35, 1681–1692. [Google Scholar] [CrossRef] [Scilit]
- Li, M.; Zhang, X.; Xu, D.; Yang, C.; Zhang, X. First-principles investigation of transition metal doping effects on H2 dissociative adsorption in TiFe-based alloys. Nanoscale 2026, 18, 8352–8360. [Google Scholar] [CrossRef] [Scilit] [PubMed]
- Santhosh, A.; Kang, S.; Keilbart, N.; Wood, B.C.; Klassen, T.; Jerabek, P.; Dornheim, M. Influence of near-surface oxide layers on TiFe hydrogenation: Mechanistic insights and implications for hydrogen storage applications. J. Mater. Chem. A 2023, 11, 18776–18789. [Google Scholar] [CrossRef] [Scilit]
- Kim, H.; Kang, S.; Lee, J.Y.; Heo, T.W.; Wood, B.C.; Shim, J.H.; Cho, Y.W.; Kim, D.H.; Suh, J.Y.; Lee, Y.S. A new perspective on the initial hydrogenation of TiFe0.9M0.1 (M = V, Cr, Fe, Co, Ni) alloys gained from surface oxide analyses and nucleation energetics. Appl. Surf. Sci. 2023, 610, 155443. [Google Scholar] [CrossRef] [Scilit]
- odziana, Z. Surface Properties of LaNi5 and TiFe—Future Opportunities of Theoretical Research in Hydrides. Front. Energy Res. 2021, 9, 719375. [Google Scholar] [CrossRef] [Scilit]
- Materials Design, Inc. MedeA 3.10 (Materials Exploration and Design Analysis); Materials Design, Inc.: San Diego, CA, USA, 2024. [Google Scholar]
- Kresse, G.; Furthmüller, J. Efficiency of ab-initio total energy calculations for metals and semiconductors using a plane-wave basis set. Comput. Mater. Sci. 1996, 6, 15–50. [Google Scholar] [CrossRef] [Scilit]
- Kresse, G.; Furthmüller, J. Efficient iterative schemes for ab initio total-energy calculations using a plane-wave basis set. Phys. Rev. B 1996, 54, 11169. [Google Scholar] [CrossRef] [Scilit] [PubMed]
- Blöchl, P.E. Projector augmented-wave method. Phys. Rev. B 1994, 50, 17953. [Google Scholar] [CrossRef] [Scilit] [PubMed]
- Perdew, J.P.; Burke, K.; Ernzerhof, M. Generalized gradient approximation made simple. Phys. Rev. Lett. 1996, 77, 3865. [Google Scholar] [CrossRef] [Scilit] [PubMed]
- Grimme, S.; Antony, J.; Ehrlich, S.; Krieg, H. A consistent and accurate ab initio parametrization of density functional dispersion correction (DFT-D) for the 94 elements H-Pu. J. Chem. Phys. 2010, 132, 154104. [Google Scholar] [CrossRef] [Scilit] [PubMed]
- Grimme, S.; Ehrlich, S.; Goerigk, L. Effect of the damping function in dispersion corrected density functional theory. J. Comput. Chem. 2011, 32, 1456–1465. [Google Scholar] [CrossRef] [Scilit] [PubMed]
- Araujo, R.B.; Rodrigues, G.L.; Dos Santos, E.C.; Pettersson, L.G. Adsorption energies on transition metal surfaces: Towards an accurate and balanced description. Nat. Commun. 2022, 13, 6853. [Google Scholar] [CrossRef] [Scilit] [PubMed]
- Henkelman, G.; Jónsson, H. Improved tangent estimate in the nudged elastic band method for finding minimum energy paths and saddle points. J. Chem. Phys. 2000, 113, 9978–9985. [Google Scholar] [CrossRef] [Scilit]
- Wang, V.; Xu, N.; Liu, J.C.; Tang, G.; Geng, W.T. VASPKIT: A user-friendly interface facilitating high-throughput computing and analysis using VASP code. Comput. Phys. Commun. 2021, 267, 108033. [Google Scholar] [CrossRef] [Scilit]
- Henkelman, G.; Arnaldsson, A.; Jónsson, H. A fast and robust algorithm for Bader decomposition of charge density. Comput. Mater. Sci. 2006, 36, 354–360. [Google Scholar] [CrossRef] [Scilit]
- Cordero, B.; Gómez, V.; Platero-Prats, A.E.; Revés, M.; Echeverría, J.; Cremades, E.; Barragán, F.; Alvarez, S. Covalent radii revisited. Dalton Trans. 2008, 21, 2832–2838. [Google Scholar] [CrossRef] [Scilit] [PubMed]
- Alvarez, S. A cartography of the van der Waals territories. Dalton Trans. 2013, 42, 8617–8636. [Google Scholar] [CrossRef] [Scilit] [PubMed]
- Edalati, K.; Matsuda, J.; Arita, M.; Daio, T.; Akiba, E.; Horita, Z. Mechanism of activation of TiFe intermetallics for hydrogen storage by severe plastic deformation using high-pressure torsion. Appl. Phys. Lett. 2013, 103, 143902. [Google Scholar] [CrossRef] [Scilit]
- Yu, L.; Jiang, S.; Hu, C.; Wang, Y.; Xu, L.; He, H.; Wang, Y.; Du, X. Machine Learning for Hydrogen Storage Properties of TiFe Alloys Based on Literature-Curated Data Set: Prediction and Limitation. ACS Sustain. Chem. Eng. 2025, 13, 20810–20824. [Google Scholar] [CrossRef] [Scilit]
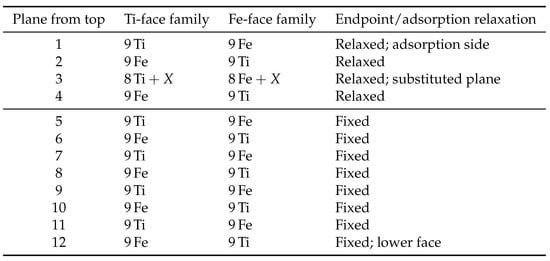
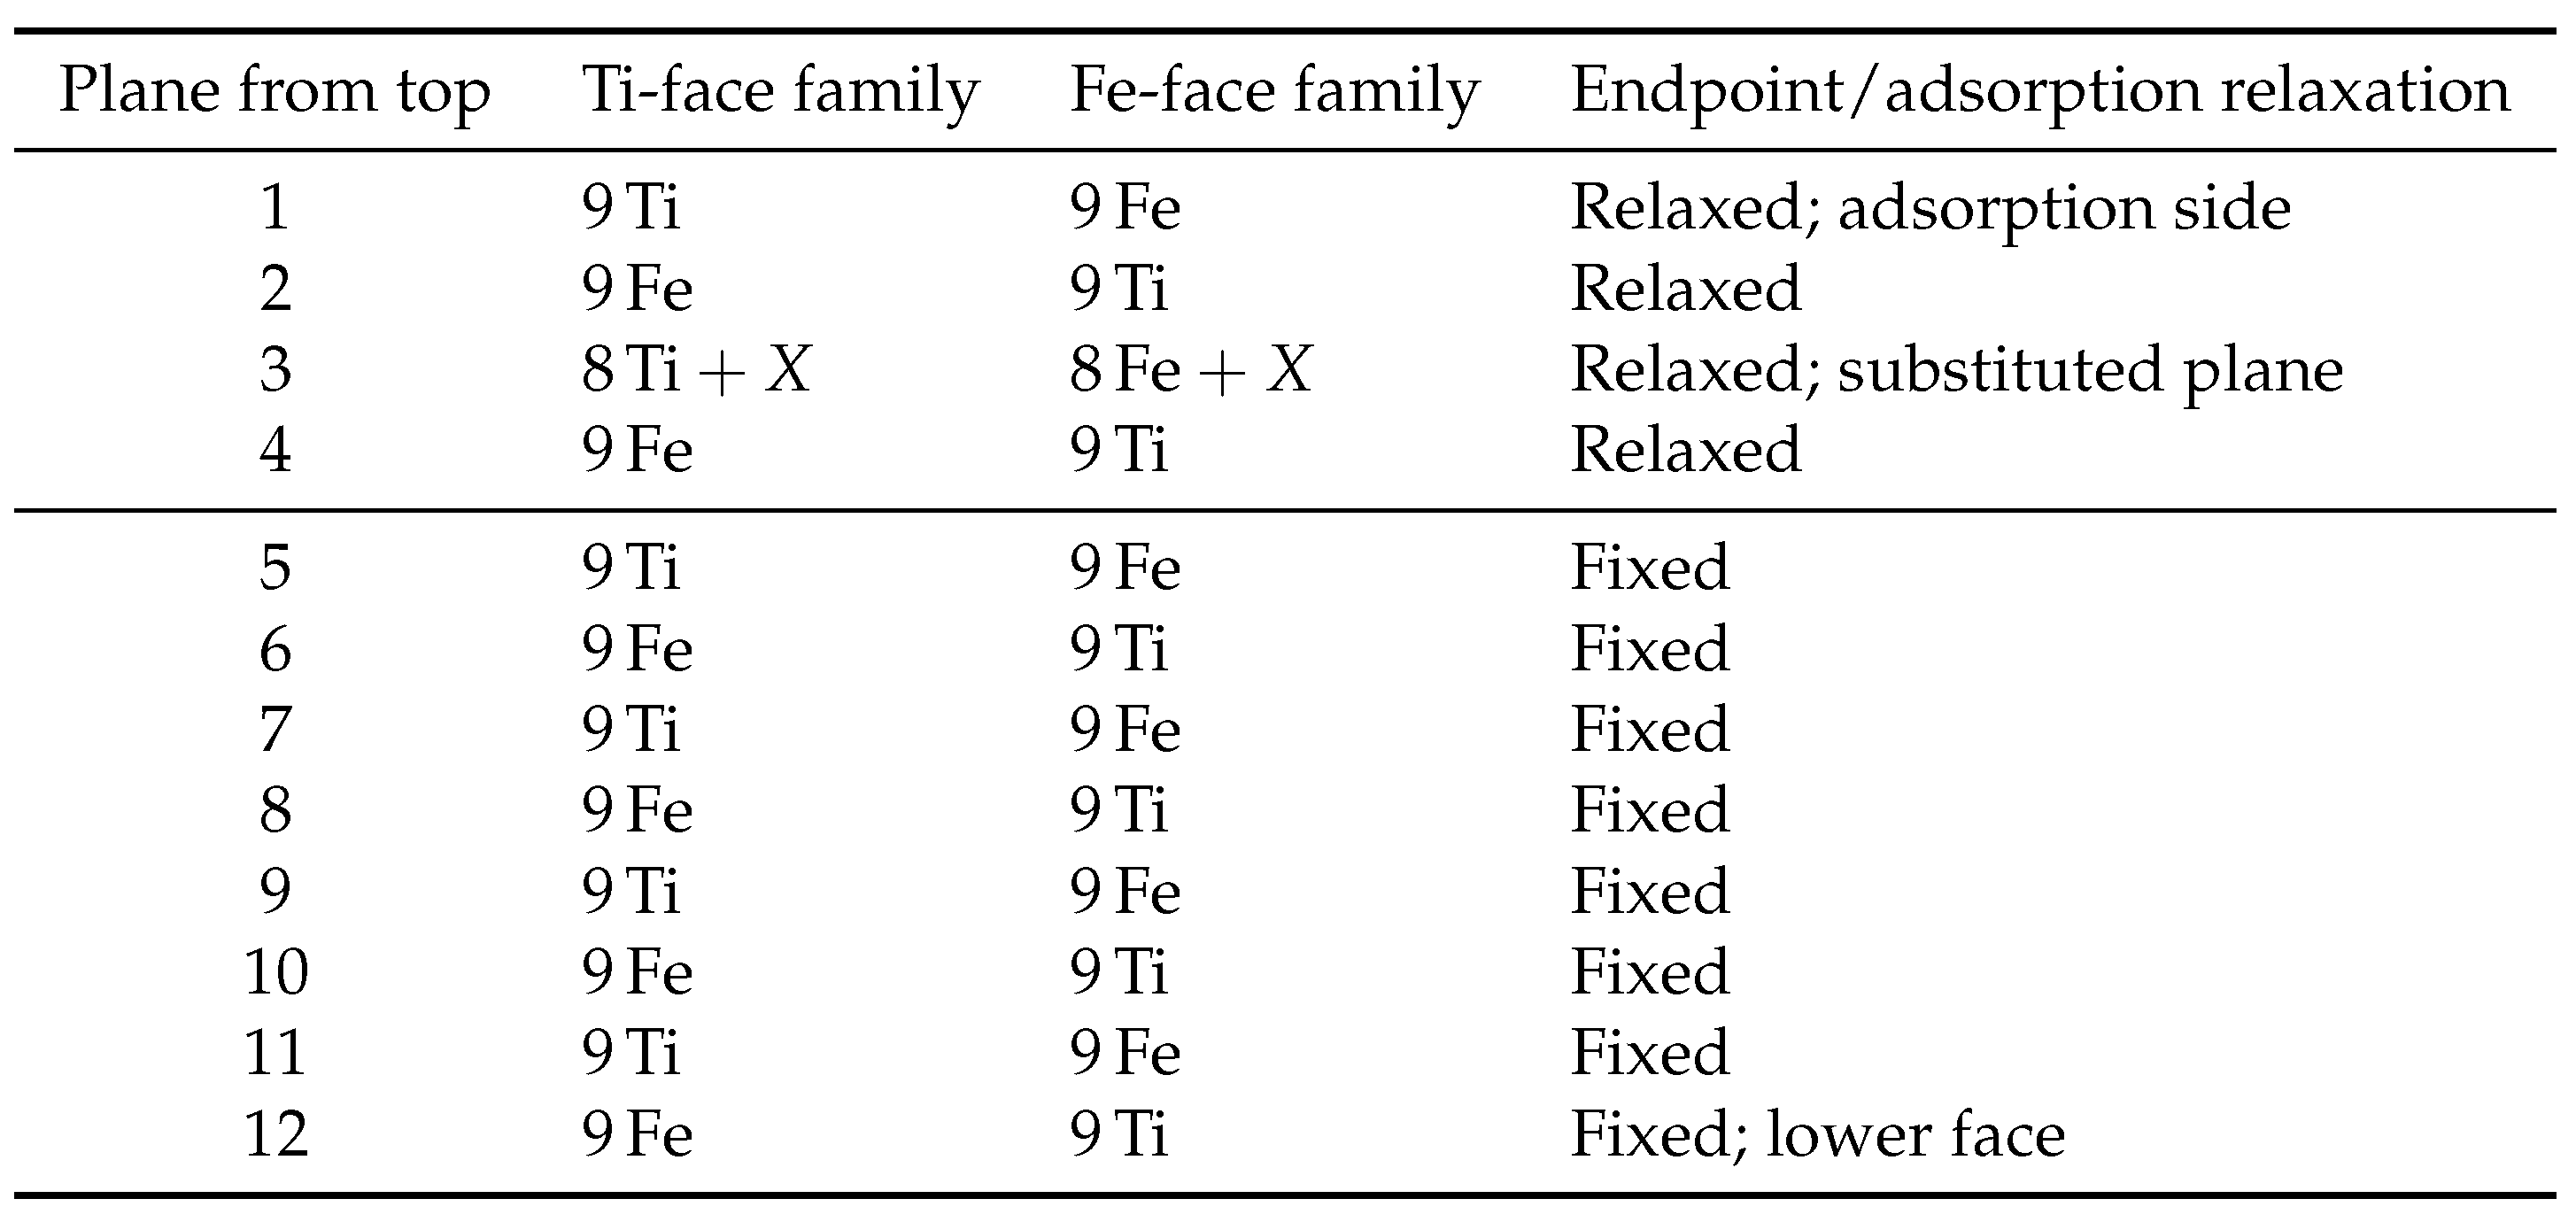
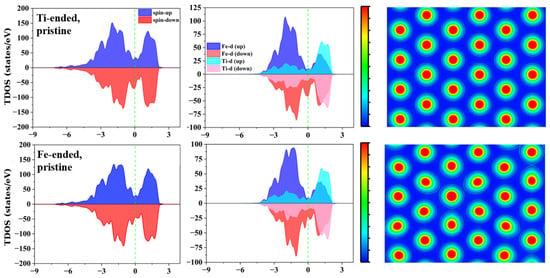
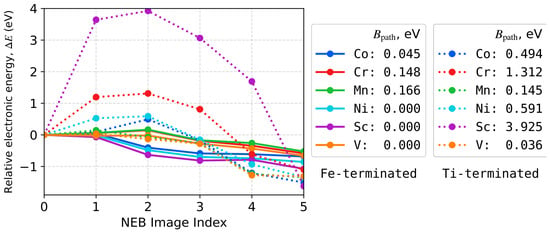
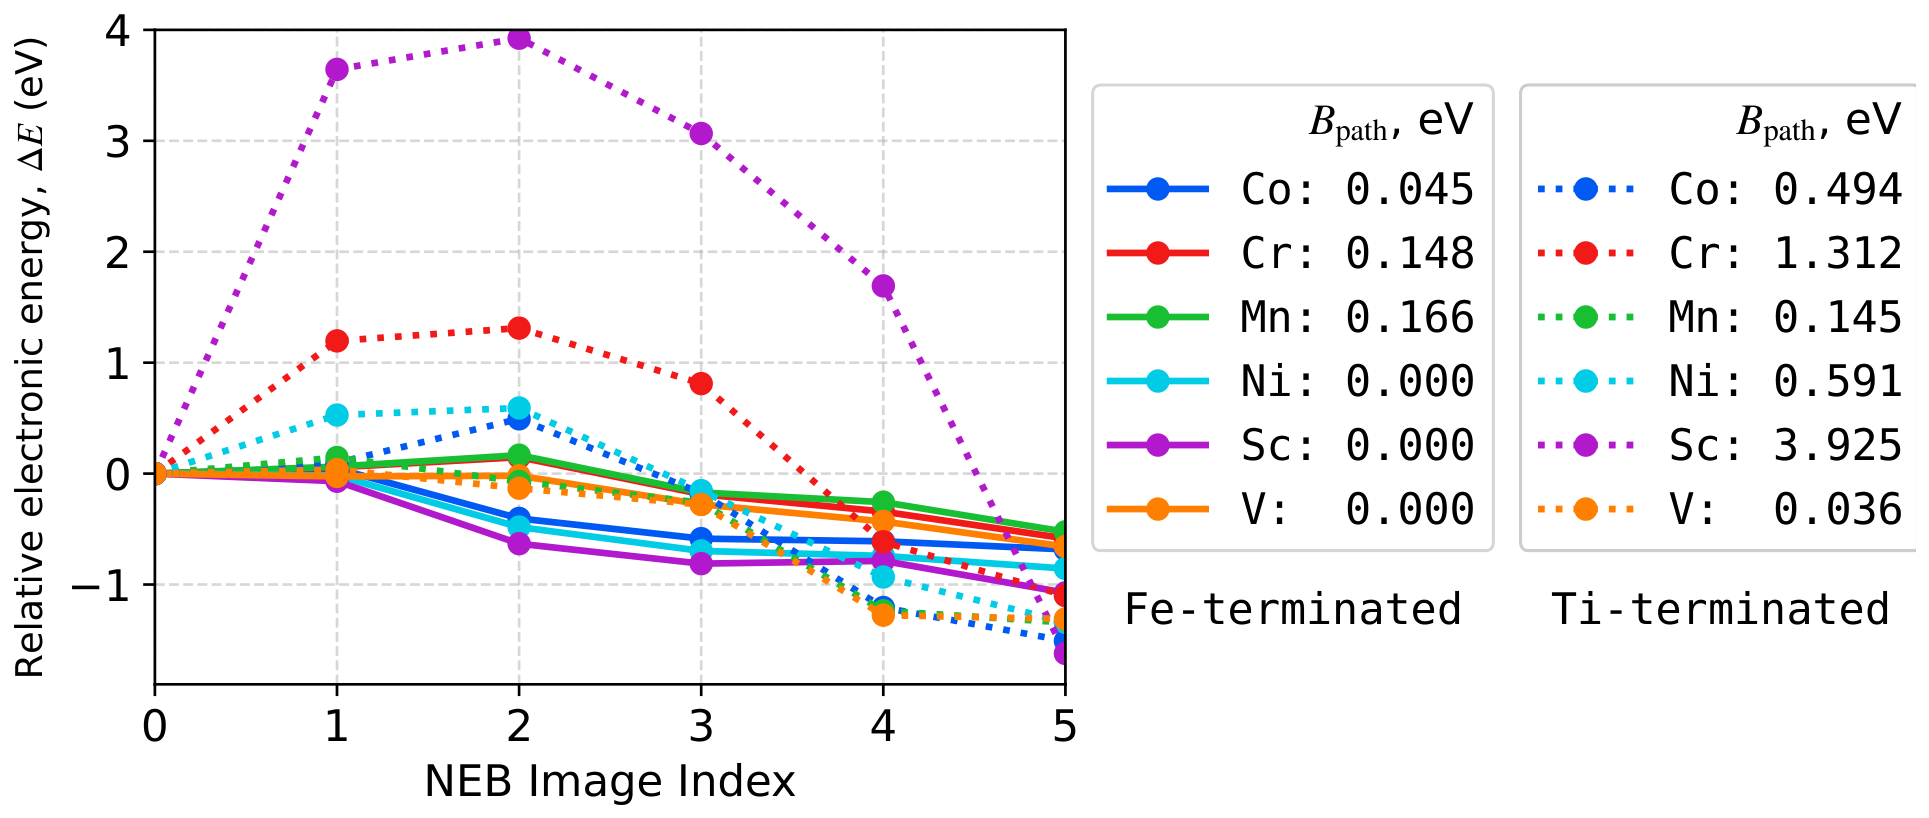
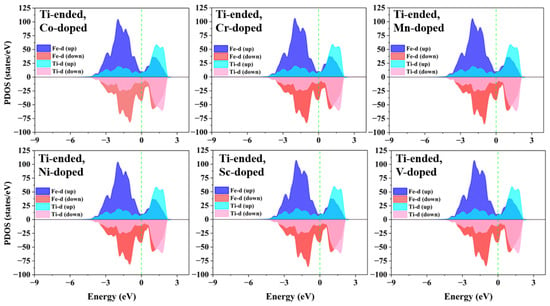
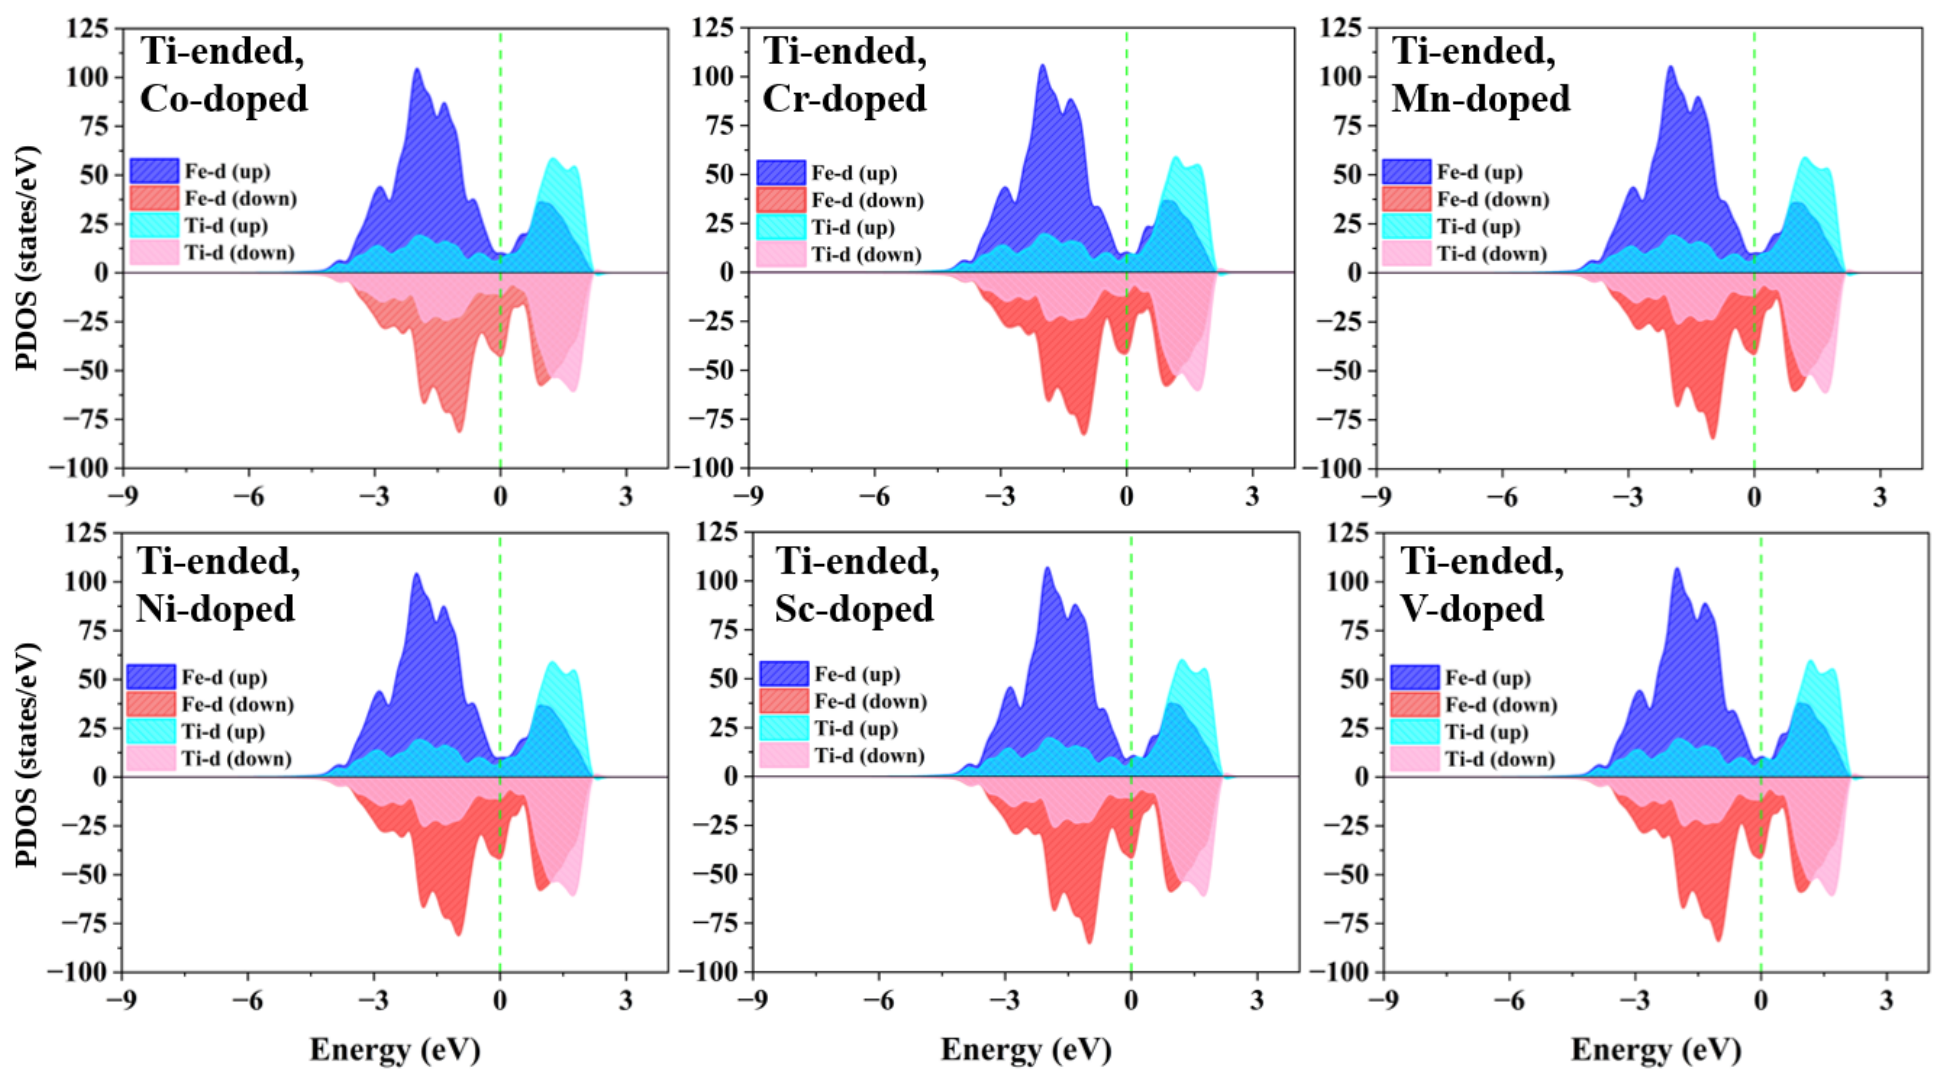
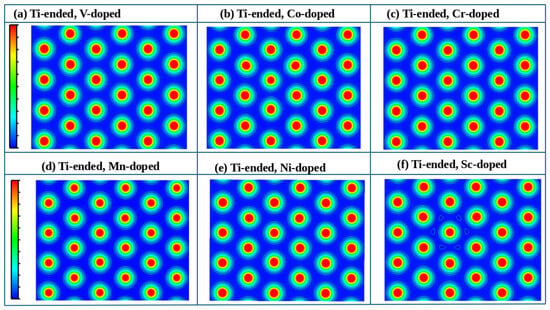
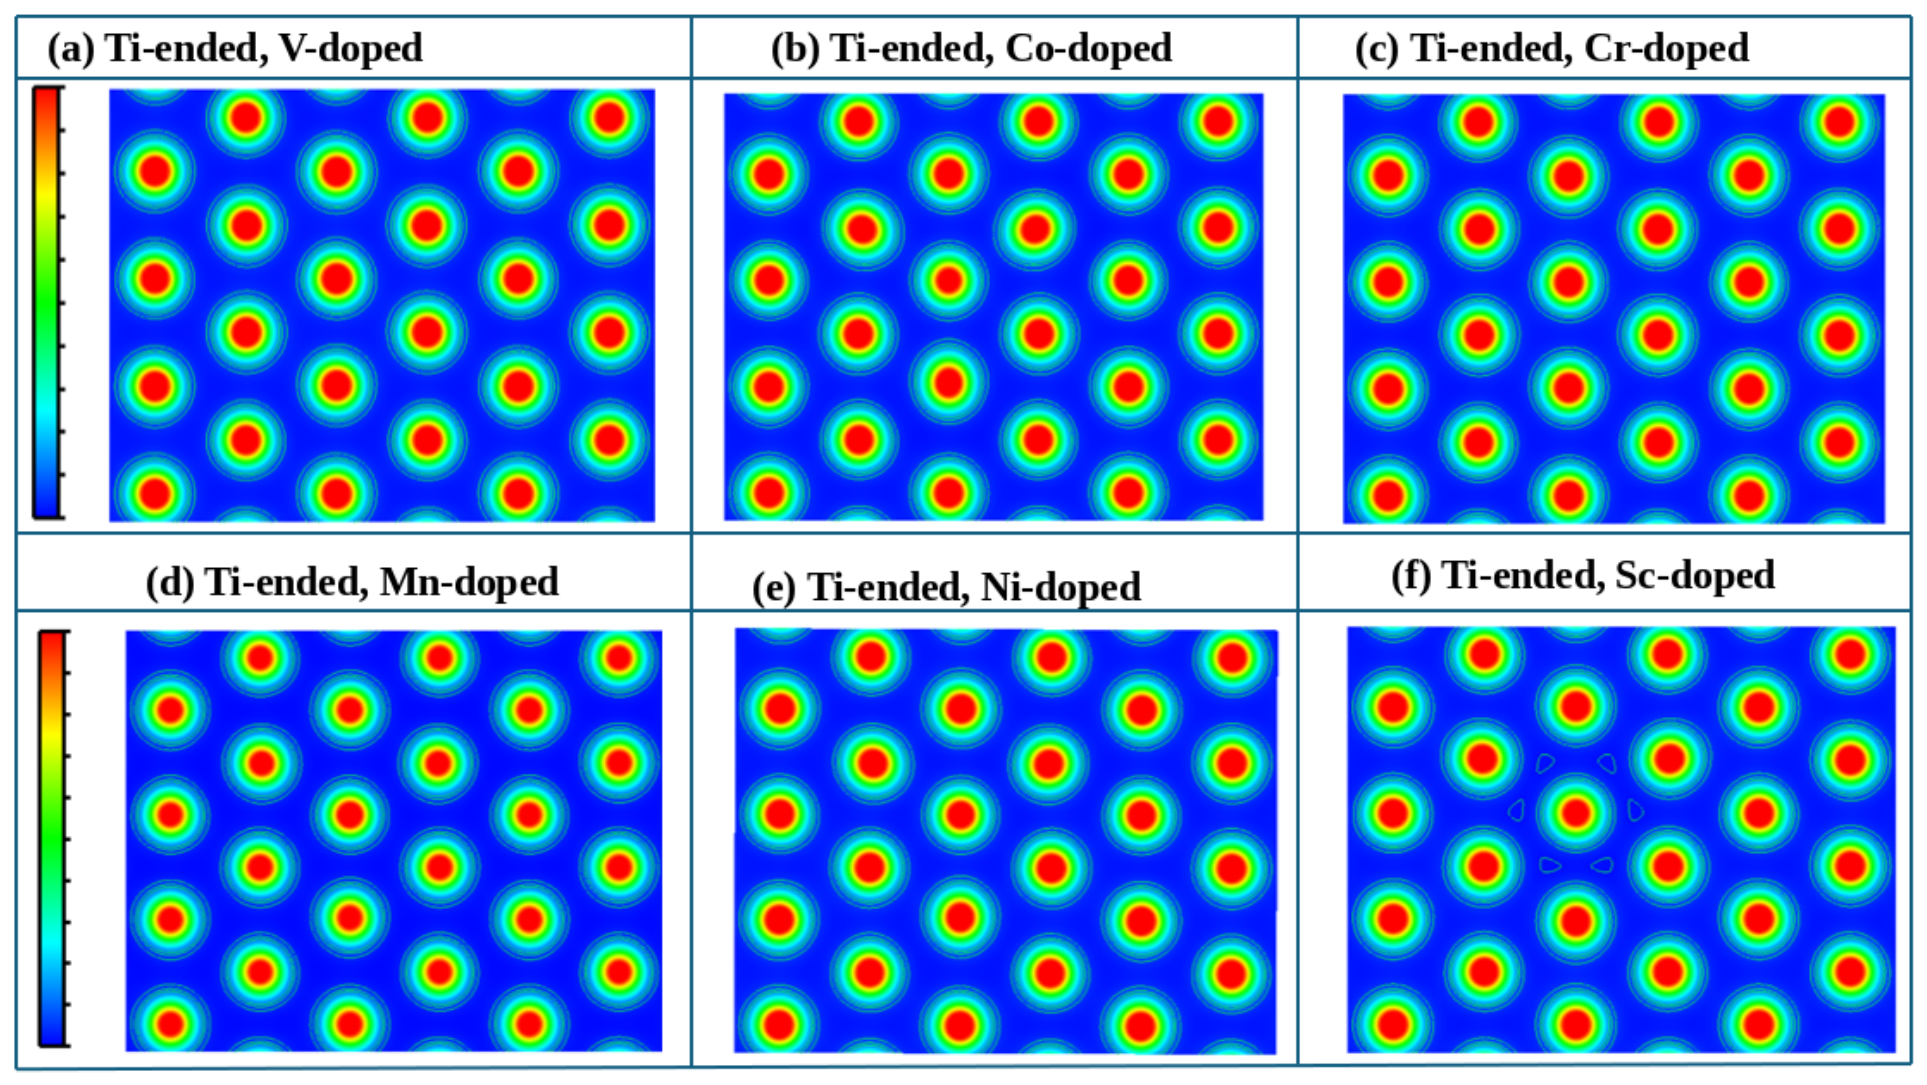
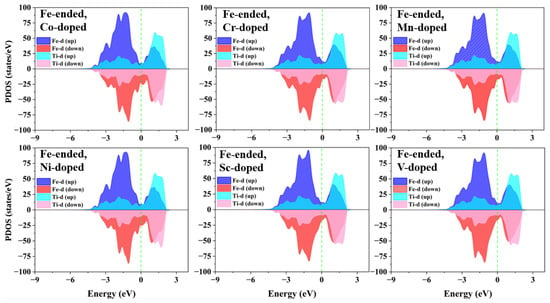
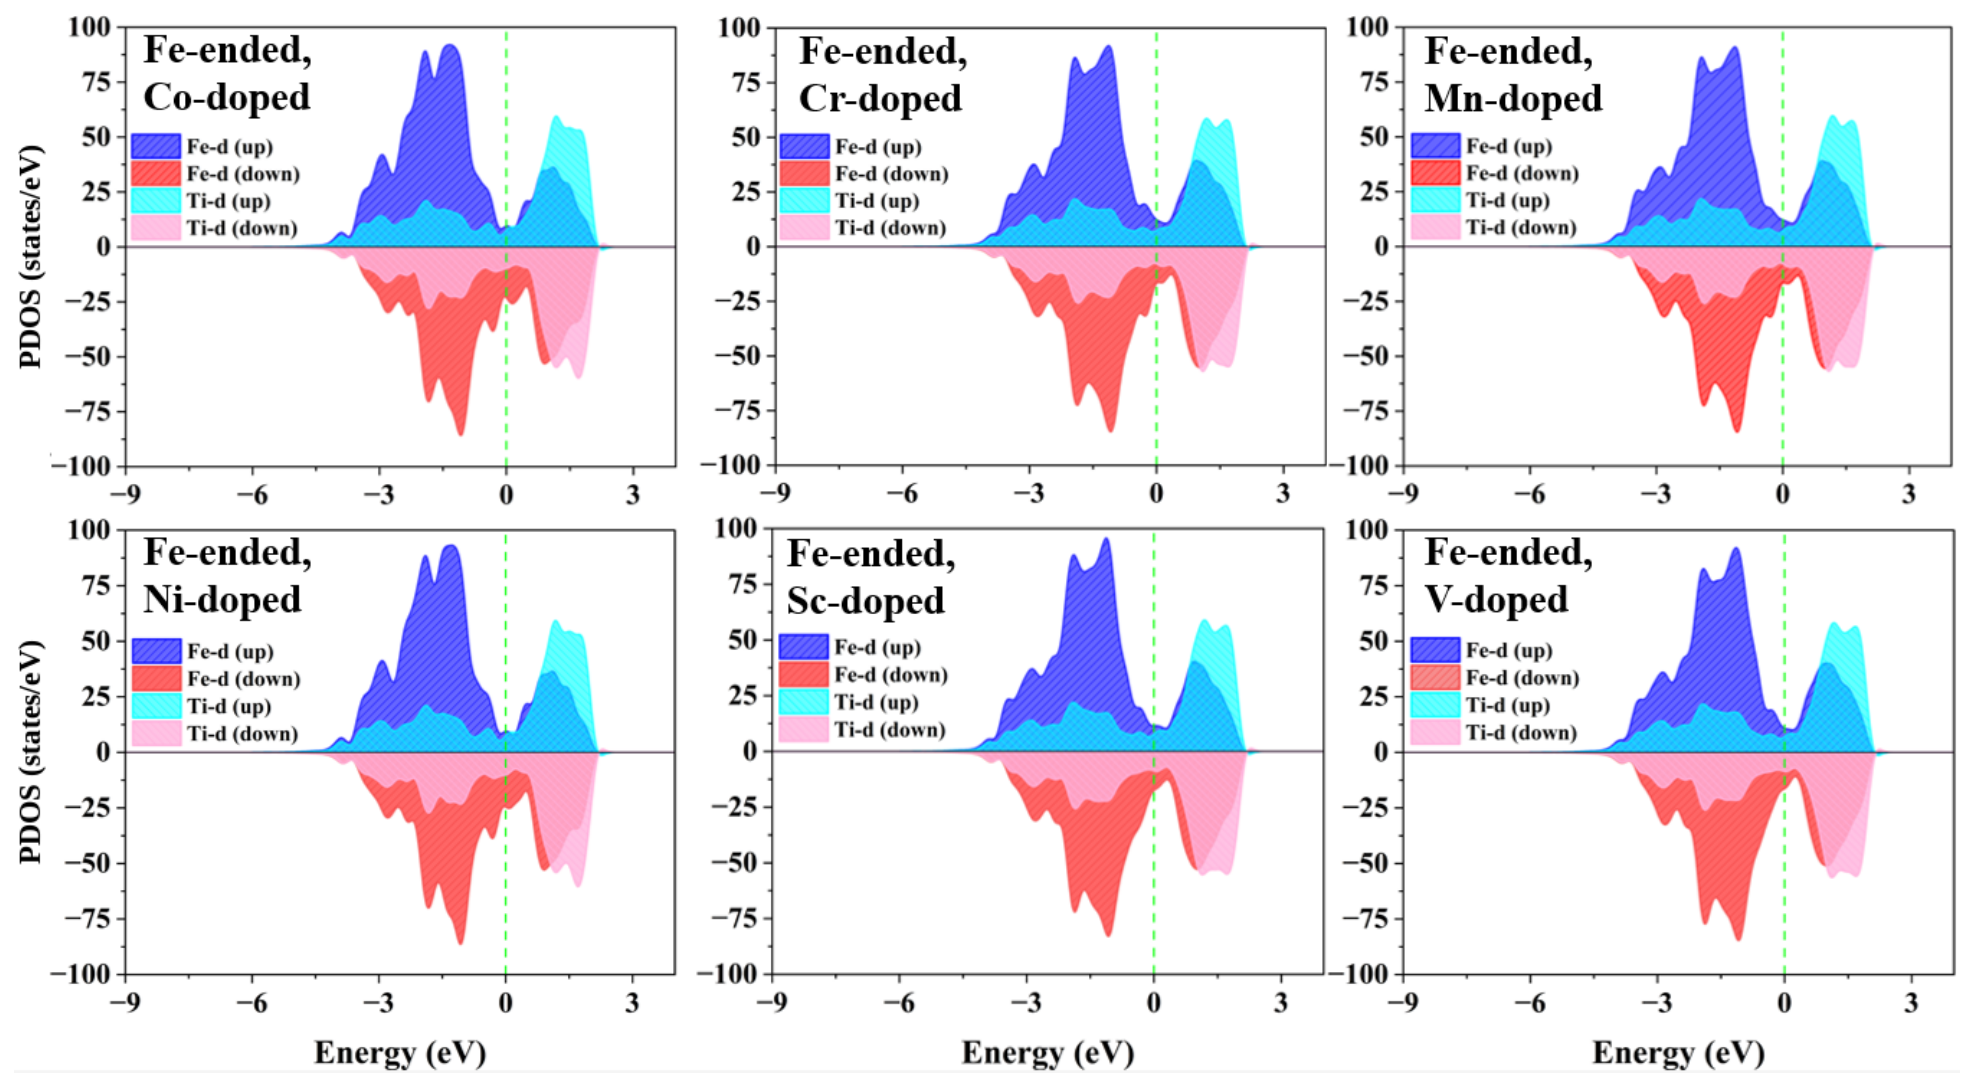
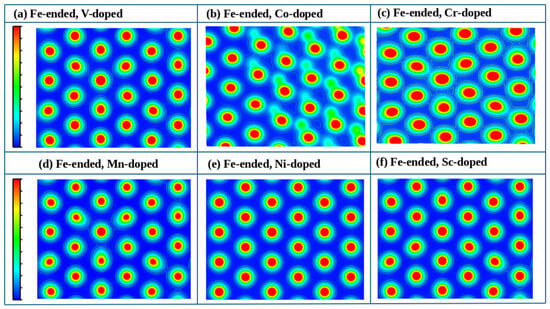
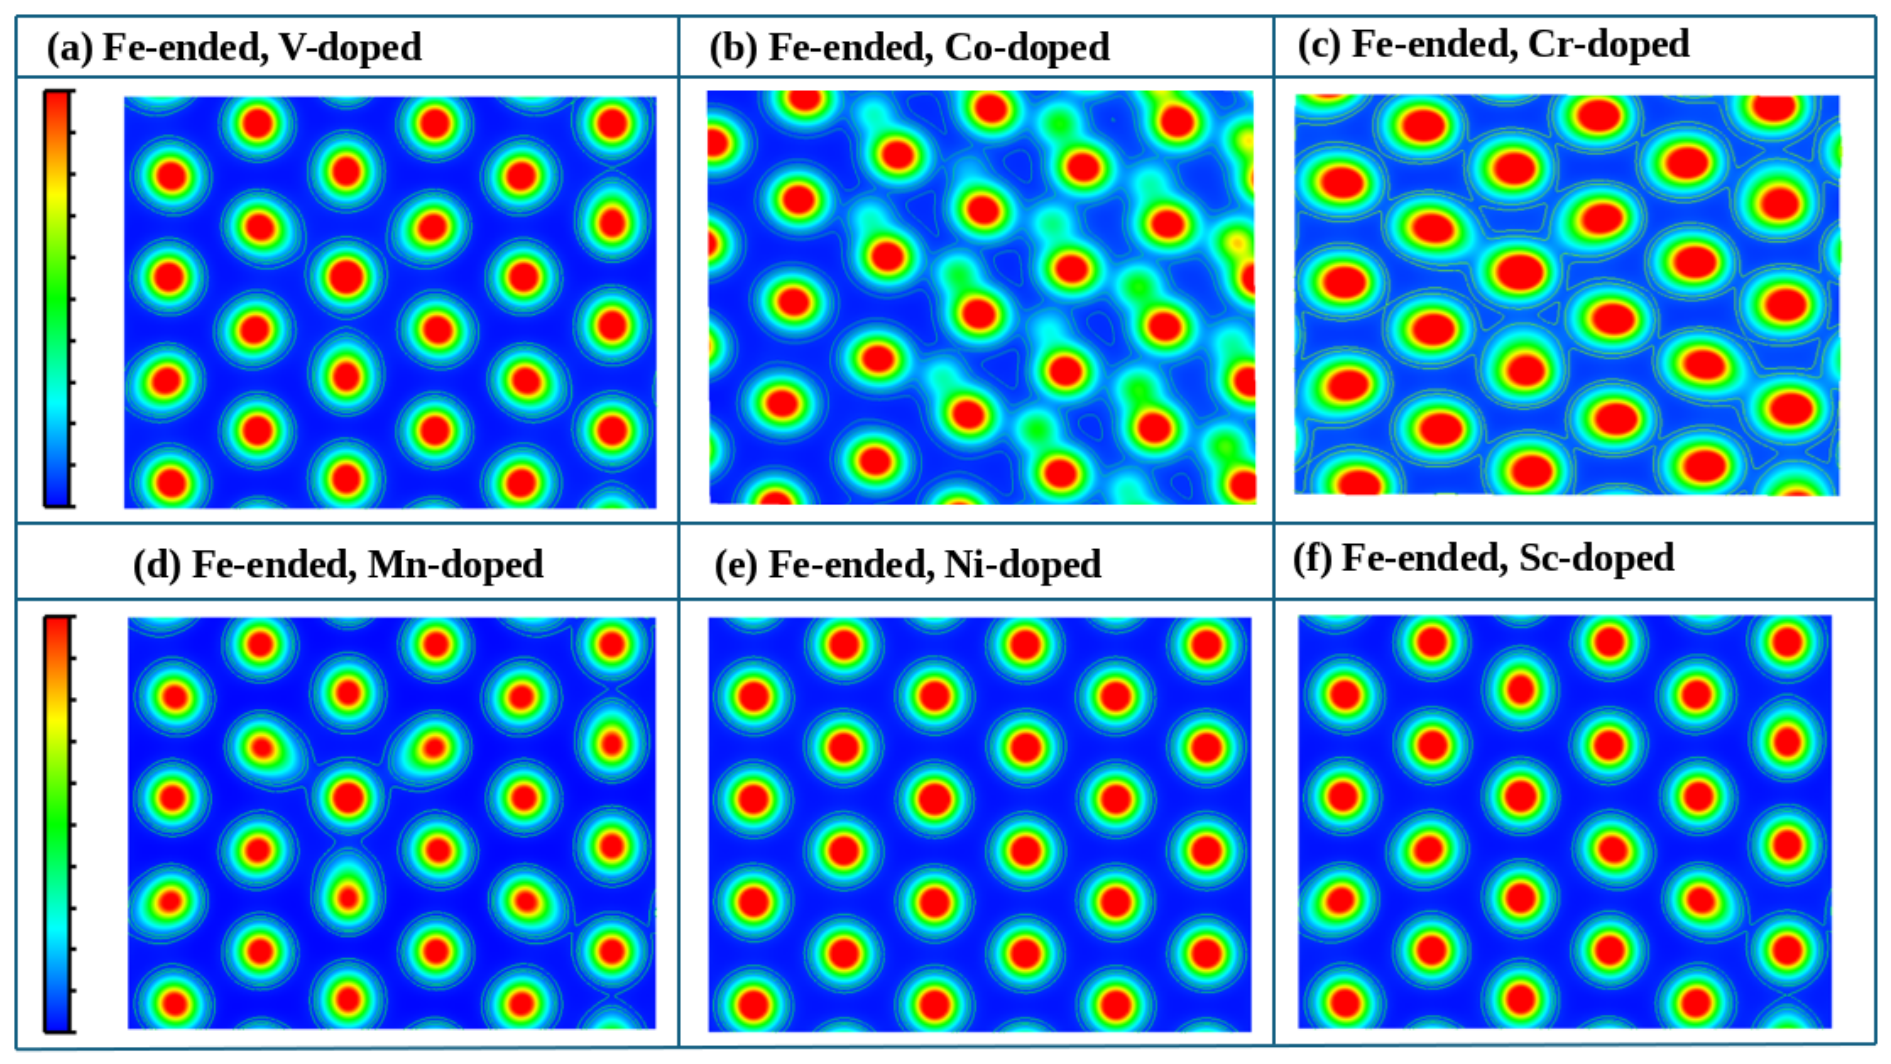

Disclaimer/Publisher’s Note: The statements, opinions and data contained in all publications are solely those of the individual author(s) and contributor(s) and not of MDPI and/or the editor(s). MDPI and/or the editor(s) disclaim responsibility for any injury to people or property resulting from any ideas, methods, instructions or products referred to in the content. |
© 2026 by the authors. Licensee MDPI, Basel, Switzerland. This article is an open access article distributed under the terms and conditions of the Creative Commons Attribution (CC BY) license.