


Abstract
Dams, their spillways, and water conveyance structures are constantly exposed to high-velocity water flow, making them susceptible to cavitation and erosion that can compromise structural durability and operational safety. This study conducted ultrasonic and hydraulic cavitation tests on repair and joint-filling materials, evaluating their cavitation resistance based on indicators such as loss in mass, cavitation rate, cavitation resistance strength, macroscopic and microscopic morphological evolution, pitting rate, and damaged area. The results showed that, under ultrasonic cavitation testing, epoxy-based materials primarily exhibited pitting and localized spalling, polyurea materials primarily exhibited crack damage, and silicone materials developed localized cavitation pits. Among the materials that showed no significant mass loss in the ultrasonic cavitation test, epoxy mortar A had a cumulative cavitation area that was significantly larger than that of the other materials, at 43.2 mm2, while epoxy mastic A and epoxy mastic B had similar cumulative cavitation areas of approximately 5.7 mm2. In the hydraulic cavitation tests, all three repair materials exhibited a certain degree of cavitation resistance, but differences were observed in mass loss and failure modes. Damage to the repair materials frequently occurred at surface defects, edges, and weak interfaces of the test specimens, primarily manifesting as material fracture and spalling. Among them, epoxy mastic B exhibited the best cavitation resistance, with a mass loss reduced by 68.9% and 29.4% compared to epoxy mastic A and polyurea A, respectively. No significant surface damage was observed in the joint-filling materials; polyurethane A exhibited excellent cavitation resistance, with a 45% reduction in mass loss compared to silicone A. In summary, the repair and joint-filling materials examined in this study can all provide a certain degree of cavitation resistance while accommodating structural joint deformation and may serve as a reference for the repair of flow surfaces in hydraulic structures.
1. Introduction
Dams, spillways, and water conveyance structures are vital components of water conservancy and hydropower projects, playing an irreplaceable role in flood control, power generation, navigation, and water supply. These hydraulic structures are continuously exposed to high flow rates and high velocities during operation. If localized surface irregularities or construction defects occur, cavitation damage may result; if left unchecked, it can jeopardize the structural durability and operational safety of the dam. As dam heights continue to increase and flood discharge velocities continue to rise—with peak velocities exceeding 50 m/s—the resulting cavitation and erosion have become major factors contributing to the failure of hydraulic structures [1,2].
Cavitation refers to the phenomenon in which, under constant temperature conditions, internal bubbles grow due to a local decrease in pressure and subsequently collapse upon entering a high-pressure zone. Ultrasound creates an acoustic field in a liquid characterized by alternating positive and negative pressures. When the sound pressure exceeds the liquid’s cavitation threshold, the equilibrium of intermolecular forces is disrupted, inducing the formation of a large number of cavitation nuclei. Cavitation bubbles and pre-existing microbubbles in the liquid absorb energy and continuously expand during the negative-pressure phase; they are then compressed during the positive-pressure phase and rapidly collapse, with the accumulated acoustic energy being converted into other forms of energy at the moment of collapse. Ibanez et al. [3] incorporated cavitation-sensing signals into their ultrasonic experiments and introduced acoustic emission monitoring technology, which not only successfully recorded changes in the test specimen’s mass but also detected the acoustic response of bubble collapse. Priyadarshi et al. [4] studied the effects of water temperature and amplitude on the cavitation behavior of aluminum alloys by comparing mass loss and surface roughness after cavitation within the range of 10–50 °C. They found that the cavitation intensity of aluminum alloys is determined jointly by temperature and amplitude.
Currently, there is no consensus in the academic community regarding the theoretical mechanisms of cavitation damage [5]. Cavitation damage mechanisms primarily include mechanical effects, chemical corrosion, electrochemical corrosion, thermal effects, and interactions among these factors. Among these, mechanical effects are the primary factor [6]. Mechanical effects primarily involve shock-wave and microjet mechanisms [7]. Osman et al. [8] conducted research on pure aluminum, focusing on the relationship between cavitation collapse loads and surface damage to the material. They concluded that the formation of cavitation damage does not depend entirely on the direct impact of microjets but is closely related to the high-intensity shock waves generated during cavitation collapse. Their results indicate that, under the operating conditions discussed, shock waves can apply high-amplitude transient pressures to the material surface within a short time, serving as the dominant factor in inducing surface plastic deformation and the formation of cavitation pits; therefore, they propose that the shock wave mechanism plays a dominant role in the cavitation damage process of pure aluminum. Zhai et al. [9] used a high-speed dynamic data acquisition system and an electrically pulsed cavitation bubble apparatus to study the evolutionary characteristics of cavitation bubbles near different elastic boundaries from the perspectives of both microjets and shock waves. The study found that under asymmetric boundary conditions, cavitation bubbles collapse more rapidly due to force imbalance, forming microjets directed toward the wall surface; when a shock wave propagates to an elastic boundary, the boundary’s flexibility alters its propagation and reflection characteristics, while the direct impact of microjets on the local wall surface becomes more pronounced. Lu et al. [10] analyzed the effect of material damage on the cavitation behavior of hydraulic concrete under different damage conditions through cavitation tests, macro- and micro-scale morphological observations, and numerical simulations. The study indicated that initial damage weakens the integrity of the concrete matrix and promotes the initiation and propagation of microcracks, making the cement paste more susceptible to localized erosion under cavitation.
In ultrasonic cavitation tests, researchers have a clear understanding of damage evaluation metrics. Franc et al. [11] focused their research on pitting behavior during the initial stage of cavitation and found that numerous pitting pits had already formed before any significant mass loss occurred; the size and density of these pits can serve as primary indicators of material damage. Jayaprakash et al. [12] investigated the relationship between pitting scale and cavitation jets under ultrasonic vibration conditions. By correlating pit size and density with material spalling, they revealed why numerous pitting pits appear on the material surface even in the absence of significant mass loss. Cosma et al. [13], while studying cavitation damage in cast stainless steel before and after laser remelting, introduced metrics such as the mean distance of erosion (MDE) and the mean distance of erosion rate (MDER) to convert mass loss into equivalent erosion distances, and proposed that distance-based metrics are particularly suitable for surface-modified materials. Huang et al. [14], in ultrasonic cavitation tests on concrete combined with three-dimensional topography measurements, conducted a comprehensive analysis of damaged surface area and volume loss, and found that the surface damage and spacing damage phases of the material were not synchronized.
In addition to test methods and evaluation criteria, researchers are also interested in the damage mechanisms of materials following ultrasonic cavitation. Mitelea et al. [15] found that the surface of ductile iron initially exhibited localized pitting and plastic deformation, followed by the gradual expansion and interconnection of damaged areas. The material then entered a relatively stable erosion phase, with the mass-loss curve showing slow growth in the early stage and a marked acceleration in the middle stage. Gao and Zhang [16] found that 2Cr13 stainless steel undergoes deformation, hardening, and grain refinement under repeated impacts, followed by the gradual formation of cracks along the crystal planes; once the accelerated phase begins, both crack propagation and surface spalling cause mass loss to increase rapidly. Ding et al. [17] subjected laser-melted 316L stainless steel to ultrasonic cavitation. Through experimental analysis, they examined the effects of microstructural density and forming defects on the mass loss and surface topography damage in the specimens. They found that specimens with higher density and fewer defects exhibited slower mass loss and delayed overall surface spalling.
In recent years, research on repair materials for protecting against cavitation damage has primarily focused on epoxy-based and polyurea repair materials, as well as flexible polyurethane and silicone sealants. Correa et al. [18] used an indirect ultrasonic cavitation method to study the wear mechanism of epoxy-based composite coatings under cavitation and found that although these coatings exhibited good behavior during the incubation period, pre-existing pores, interfaces, and cracks could serve as initiation sites for damage. Huang et al. [19] conducted ultrasonic cavitation tests on three types of polymer repair materials: an epoxy layer, an epoxy layer containing an intermediate epoxy mortar layer, and a polyurea layer with an intermediate epoxy mortar layer. They found that the intermediate epoxy mortar layer could significantly slow the formation of cavitation pits; the polyurea composite structure suffered the least surface erosion due to its greater elastoplastic deformation capacity, while the epoxy layer was prone to localized spalling. Chi et al. [20] found significant differences in cavitation resistance among epoxy systems; glass flake-reinforced epoxy coatings outperformed standard epoxy coatings in terms of morphological stability and post-cavitation profile, while polyurethane and silicone rubber exhibited distinct energy-dissipation patterns. Pavlović et al. [21] investigated the cavitation resistance of protective coatings based on cordierite filler and epoxy resin, conducting a comparative analysis of composite layer morphological damage and mass loss. They found that epoxy-based materials can enhance surface stability and impact resistance through the use of functional fillers. Zhao et al. [22] investigated the cavitation resistance of composite coatings made of polyurethane and silicone elastomers and found that cavitation damage primarily occurred in the polymer matrix rather than in the fillers themselves; for polyurethane systems, an increase in elongation, elastic modulus, and hardness led to a corresponding improvement in the composite layer’s cavitation resistance. Su et al. [23] compared the mechanical properties, water absorption, and cavitation resistance of five polyether-based polyurethane coatings with different crosslinking densities. The results showed that as density increased, tensile strength first rose and then decreased, while elongation at break and water absorption continued to decline. Among these, the PU0.4 sample with medium density exhibited the best overall performance and the lowest cavitation-induced mass loss. Marlin and Chahine [24] studied the cavitation and temperature rise in polyurea coatings under cavitation conditions. Their experiments established a link between damage and material temperature rise, indicating that polyurea failure is not solely due to cavitation impacts; localized heat accumulation also accelerates surface degradation and delamination. Li et al. [25] compared the erosion resistance of fluorinated polyurethane coatings with different fluorine contents to that of ordinary polyurethane coatings and found that the cavitation patterns of fluorinated coatings were similar to those of non-fluorinated specimens, but the fluorinated coatings exhibited better hydrophobicity, stability, and cavitation resistance. Hussain et al. [26] investigated the potential application of epoxy composites containing 0.5–3.0% nanoclay as high-performance protective coatings for structural use, focusing on their effectiveness in enhancing corrosion resistance, mechanical strength, and wear resistance. They found that nanoclay-epoxy coatings improved the material’s strength, hydrophobicity, and corrosion resistance. Riaz et al.’s [27] modeling approach, based on mechanical principles, revealed adhesion behavior that extends beyond the range of conventional peel strength and proposed a mechanistically grounded multimodal evaluation method for assessing the adhesion properties of epoxy coatings reinforced with carbon nanotubes, graphene nanosheets, and nanoscale silica.
Both ultrasonic cavitation and hydraulic cavitation involve localized shock effects caused by the collapse of cavitation bubbles; however, there are certain differences in their cavitation mechanisms, loading methods, and damage environments, meaning that while the two are related, they also differ. Hofmann et al. [28] studied the damage to the same type of martensitic stainless steel under two different cavitation conditions. In this experiment, the pitting caused by ultrasonic cavitation was smaller and occurred more frequently, while the pitting caused by hydraulic cavitation was larger and occurred less frequently. Choi et al. [29] conducted ultrasonic vibration cavitation and cavitation jet tests on various materials at different intensities. They normalized and compared the cavitation damage progression curves under different conditions using characteristic time and characteristic cavitation depth and found that the relative cavitation resistance ranking of some materials changes with variations in cavitation intensity. Yamaguchi et al. [30] conducted vibration cavitation and cavitation jet cavitation tests on aluminum alloys, brass, and various steels. The rankings of volumetric loss in the materials obtained by the two methods were generally similar, but the surface topographies differed: damage caused by the vibration method was more uniform, while damage caused by the jet method was annular and resulted in a rougher surface; the differences in the rankings among the various steels were not clear.
Although previous studies have attempted to predict a material’s cavitation resistance using indicators such as hardness, tensile strength, elastic modulus, and fatigue properties—and have established relevant relationships under specific material systems and test conditions—cavitation is a complex process involving repeated impacts, localized plastic deformation, fatigue crack propagation, and material spalling. The microstructure of different materials, the state of the coating interface, and the characteristics of the cavitation load can all alter the dominant damage mechanism; therefore, establishing a unified quantitative predictive relationship across different material systems and cavitation conditions remains challenging. Keya et al. [31] studied aluminum alloys, copper alloys, and stainless steel, combining microhardness, indentation, quasi-static, and high-strain-rate mechanical tests to analyze their relationship with the maximum cavitation rate. Their study clearly indicated that cavitation behavior cannot be sufficiently correlated with any single mechanical property. In their review, Krella et al. [32] summarized the effects of hardness, ductility, fatigue strength, fracture toughness, microstructure, and coating characteristics on cavitation resistance. They found that there are multiple correlations between hardness and cavitation resistance, rather than a single simple relationship applicable to all materials and conditions; differences in material categories and cavitation intensity are key factors.
In summary, existing research on ultrasonic cavitation has primarily focused on metallic materials, with relatively little attention given to repair and joint-filling materials for hydraulic structures. Research on ultrasonic cavitation in repair and joint-sealing materials has largely centered on the modification and design of epoxy-, polyurethane-, and polyurea-based materials, with a focus on enhancing cavitation resistance through methods such as filler incorporation and component adjustment. However, the damage evolution process and failure mechanisms of these materials under different operating conditions remain poorly understood.
At the same time, in hydraulic cavitation testing, most existing studies have used traditional Venturi testing systems to investigate cavitation in concrete, adjusting concrete mix proportions and material parameters to improve the cavitation resistance of concrete specimens. However, there has been limited research on the mechanisms of hydraulic cavitation at structural discontinuities, such as construction joints, as well as on secondary cavitation damage following repair of cavitation-induced damage in concrete. Therefore, this paper conducted ultrasonic and hydraulic cavitation tests on repair and joint-filling materials to investigate the progression of cavitation damage and evaluated their cavitation resistance using a variety of metrics.
2. Method
2.1. Test Equipment and Systems
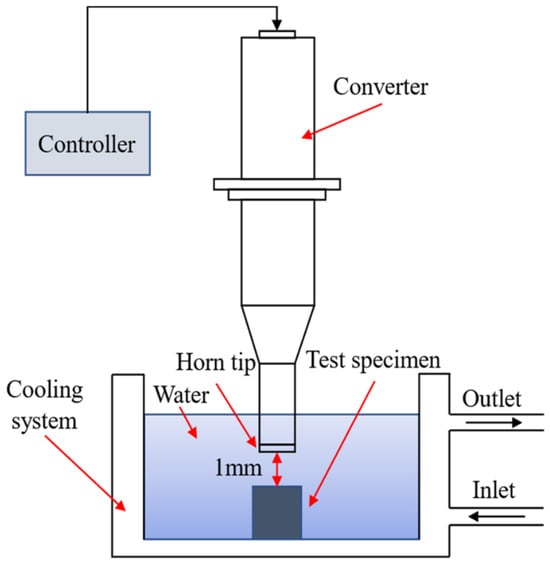
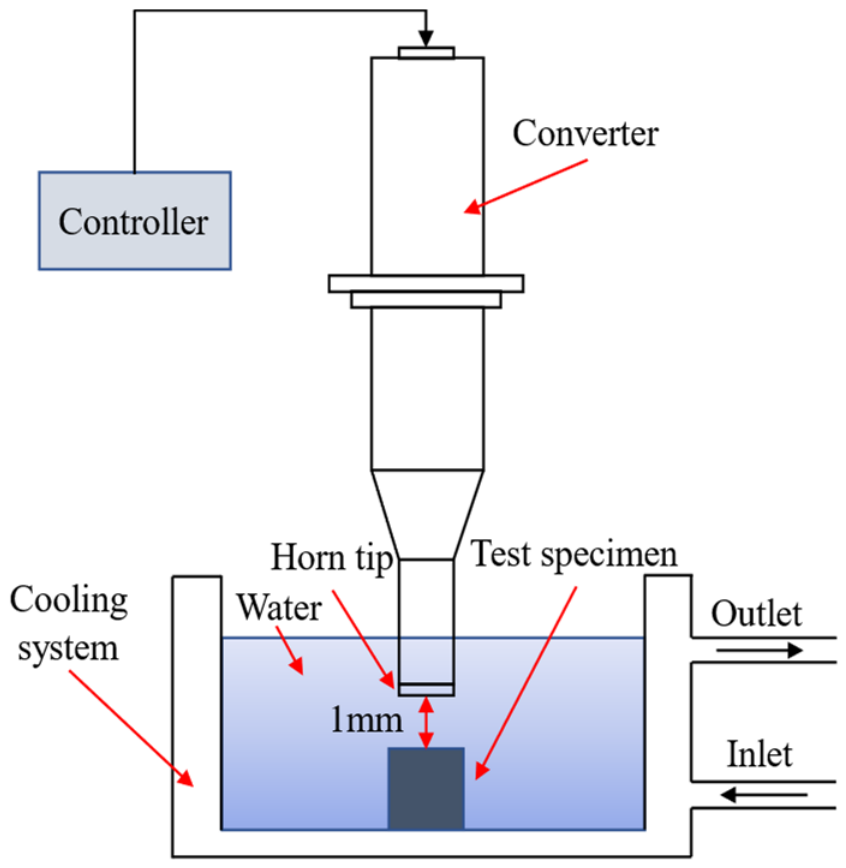
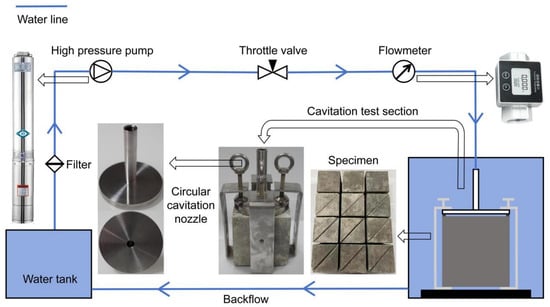
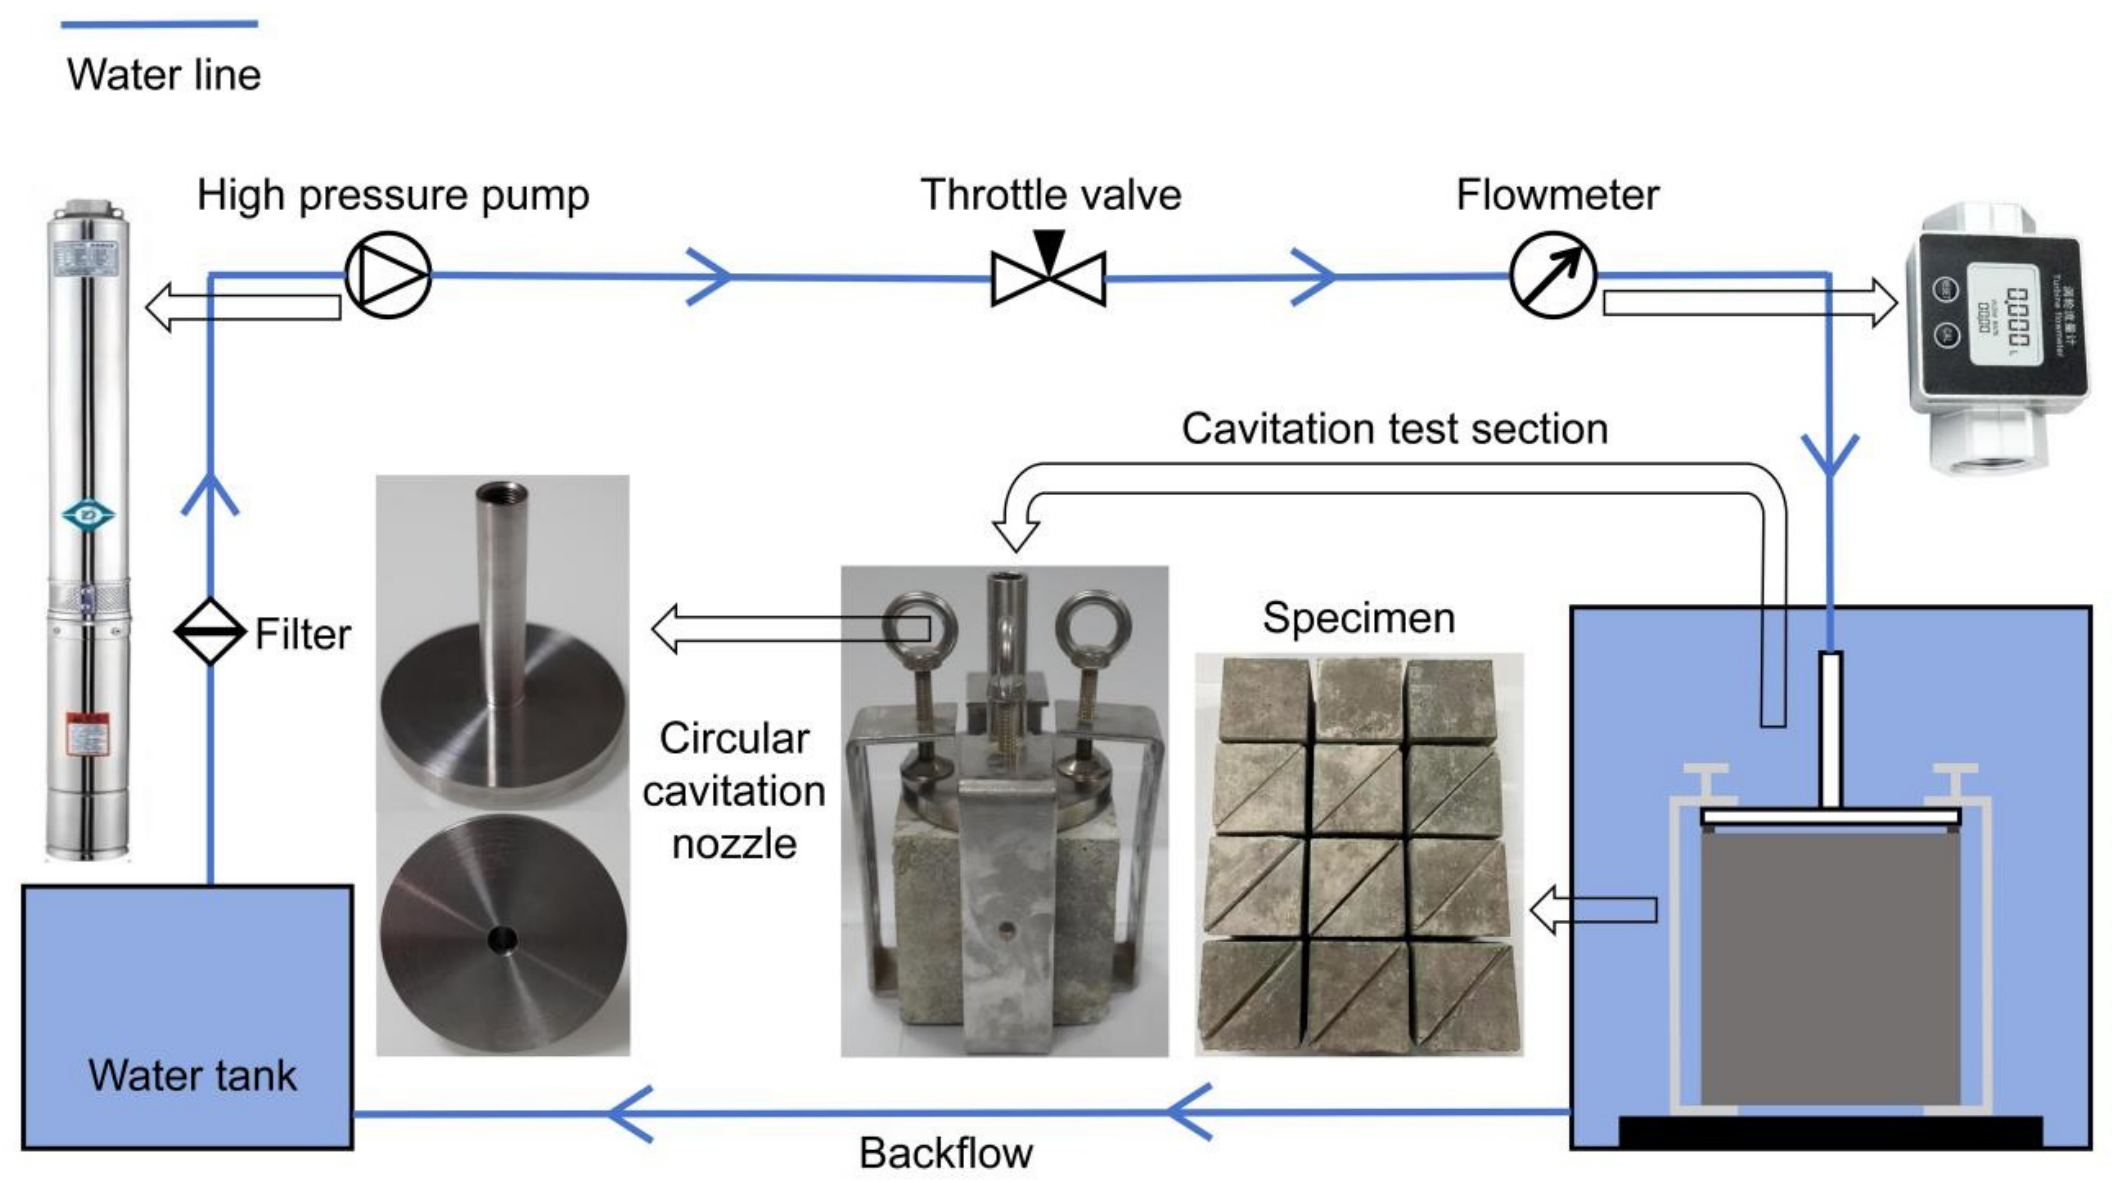
In this study, after preliminary screening of repair and joint-filling materials using ultrasonic cavitation, hydraulic cavitation tests were performed. The cavitation resistance of the selected materials was evaluated using these two different testing methods. The ultrasonic cavitation vibration apparatus used for ultrasonic cavitation testing primarily consists of an ultrasonic generator, a piezoelectric ceramic transducer, a cavitation probe, an amplitude-modulating rod, a water-circulation cooling system, and a high-precision displacement lifting platform. The test setup and schematic diagram are shown in Figure 1. Test parameters were set in accordance with the ASTM G32-16 standard [33]: a vibration frequency of 20 kHz, an amplitude of 25 μm, indirect cavitation mode, a distance of 1 mm between the test specimen and the probe, and a circulating water temperature maintained at 25 °C. The hydraulic cavitation test apparatus and cavitation test system are shown in Figure 2. The first component is the high-pressure submersible pump, which can stably deliver water flow at the required rate, with a maximum flow rate of 16 m3/h; the flow velocity at the throat of the circular cavitation nozzle can be adjusted via a control valve. A vortex flowmeter is located upstream of the cavitation test section to monitor the flow rate passing through the apparatus in real time. The specific dimensions of the cavitation apparatus are shown in Figure 2. The inner diameter of the upper pipe is 10 mm, and the outer diameter of the lower disk is 100 mm. The apparatus is secured in four directions using four clamps, which in turn secure it to the test specimen. A spacer is placed between the cavitation apparatus and the concrete surface to control the throat size; in this test, a 1 mm thick spacer was used, resulting in a throat height of 1 mm. By controlling the throttle valve, the flow velocity at the throat is maintained at 45 m/s for each operating condition under test conditions.
Figure 1.
Schematic diagram of an ultrasonic cavitation device [34].
Figure 2.
Schematic of the cavitation experimental apparatus.
2.2. Test Conditions and Evaluation Criteria
The material properties of the various materials used in the test are shown in Table 1. Since different materials exhibit varying resistance to cavitation, the time required to reach the final steady state of cavitation also varies. In the ultrasonic cavitation experiments described in this paper, the fully developed cavitation stage of each material was selected as the research objective; therefore, the times at which cavitation reached its final steady state differed.
Table 1.
Material properties for various materials.
Weighing was performed using an electronic balance with an accuracy of 0.01 g. For materials showing no detectable mass loss, image recognition was used to determine the distribution of pitting diameters and the total area of cavitation pits. Cavitation resistance was evaluated using the pitting rate and damaged area metrics.
The pitting rate is defined as the cumulative number of pitting pits exceeding a specific diameter per unit area per unit time; it characterizes the temporal variation in the distribution of pitting pits of different sizes. It is calculated using the following formula:
In this equation, N represents the number of pits; t represents the cavitation time; and S represents the cavitation area.
For materials in which mass loss has been detected, the cumulative mass loss and mass loss rate are used as evaluation metrics. Mass loss can be calculated using the following equation:
In the equation, Mt represents the cumulative mass loss at time t, m0 represents the initial mass, and mt represents the mass at time t. The expression for the mass loss rate is as follows:
In this equation, Vr represents the cumulative mass loss rate at time t, where t is the cavitation duration.
Since it is necessary to compare the cavitation resistance of different types of materials, the cumulative mass loss is combined with the material density to calculate the cumulative volume loss and the volume loss rate. The cumulative volume loss of a material is calculated using the following formula:
In this equation, Vt represents the cumulative volume loss at time t, and ρ represents the density of the material. The cumulative volume loss rate is calculated using the following formula:
In this equation, W represents the cumulative volumetric loss rate at time t, where t is the cavitation duration. Since different types of repair and joint-filling materials exhibit varying resistance to cavitation, it is necessary to first investigate the cavitation resistance of each material individually before studying the mechanisms of cavitation damage under complex, multivariate conditions. Seven materials were selected as test specimens for ultrasonic cavitation testing to evaluate their cavitation resistance, including five repair materials—epoxy mortar A (Jiangsu Sobute New Materials Co., Ltd., Nanjing, China), epoxy mortar B (Hangzhou Meibu Materials Technology Co., Ltd., Hangzhou, China), epoxy mastic A (Sika (China) Ltd., Suzhou, China), epoxy mastic B (Hangzhou Guodian Dam Safety Engineering Co., Ltd., Hangzhou, China), and polyurea A (Guangdong Huapo Technology Co., Ltd., Foshan, China)—and two flexible joint-sealing materials—silicone A (Shandong Dongyue Silicone Material Co., Ltd., Zibo, China) and polyurethane A (Wanhua Chemical Group Co., Ltd., Yantai, China). The test specimens had a diameter of 50 mm and a height of 15 mm.
Hydraulic cavitation tests were conducted separately on repair materials and joint-filling materials. The repair materials tested were epoxy mastic A, epoxy mastic B, and polyurea A, while the joint-filling materials were silicone A and polyurethane A. Three specimens were used for each material. Since the experimental results showed little variation, the analysis in the following sections is based on the average of all replicate results.
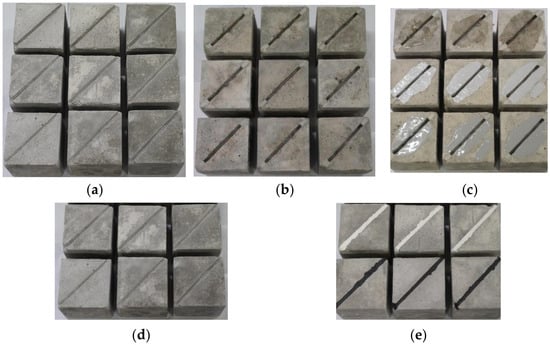
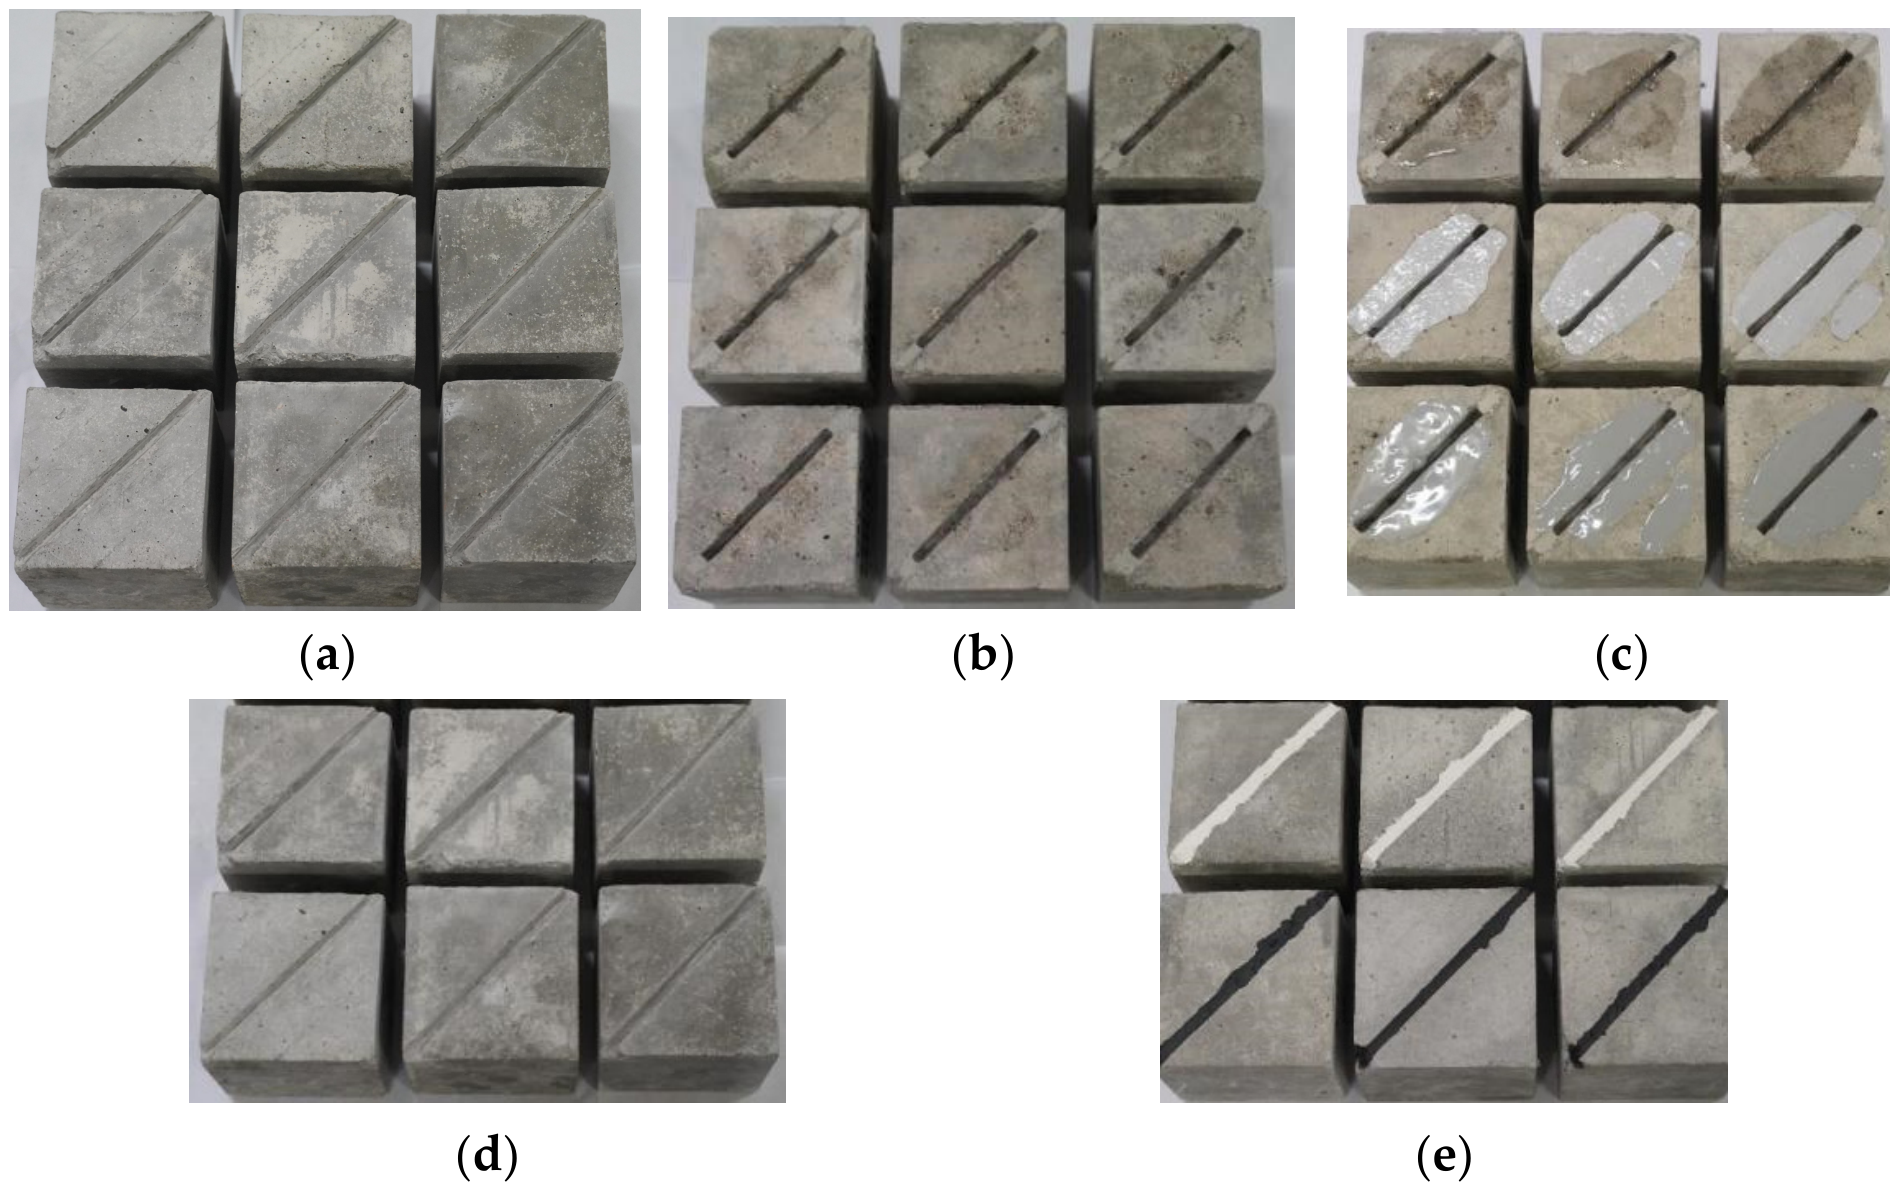
The specimens featured structural joints 6 mm wide and 10 mm deep. For the cavitation tests on repair materials, the specimens were first subjected to a 9 h cavitation test, then repaired with surface repair materials, and finally retested for cavitation. The initial condition of the test Specimen and the specimens before and after surface repair are shown in Figure 3a, Figure 3b, and Figure 3c, respectively. For the cavitation tests on joint-filling materials, the corresponding joint-filling material was applied directly into the structural joint, followed by a 9 h cavitation test. The specimens before and after joint filling are shown in Figure 3d and Figure 3e, respectively. After the initial cavitation test, the cavitation pits and pitting on the specimen’s surface and within the structural joints were coated with a repair material, ensuring a smooth surface.
Figure 3.
Schematic diagram of test specimen repair and joint filling. (a) Initial condition of the test Specimen. (b) Schematic diagram before surface repair. (c) Schematic diagram after surface repair. (d) Schematic diagram of structural joints before joint-filling. (e) Schematic diagram of structural joints after joint-filling.
Hydraulic cavitation tests were conducted on the three repair materials and three joint-filling materials described above to evaluate their cavitation resistance, with three specimens used for each material. The specific test conditions are shown in Table 2.
Table 2.
Cavitation test conditions for repair materials and joint-filling materials.
As in the ultrasonic cavitation test, an electronic balance with an accuracy of 0.01 g was used to measure the cumulative mass loss of the test specimens, and the cavitation rate and cavitation resistance were calculated separately.
The cavitation rate was calculated using Equation (6):
In the equation: VC—cavitation rate; Wti—cumulative cavitation volume at cavitation time ti; Wtj—cumulative cavitation volume at cavitation time tj; ti, tj—cavitation test times.
The calculation of cavitation resistance is performed using Equation (7):
In the equation: R—cavitation resistance, i.e., the time required for a unit mass to be eroded per unit area; t—cumulative test time; A—eroded area of the test specimen; Q—cumulative mass loss of the test specimen after cavitation for a time interval t.
3. Results and Discussion
3.1. Analysis of Ultrasonic Cavitation Results
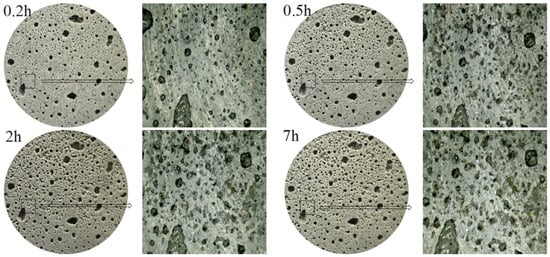
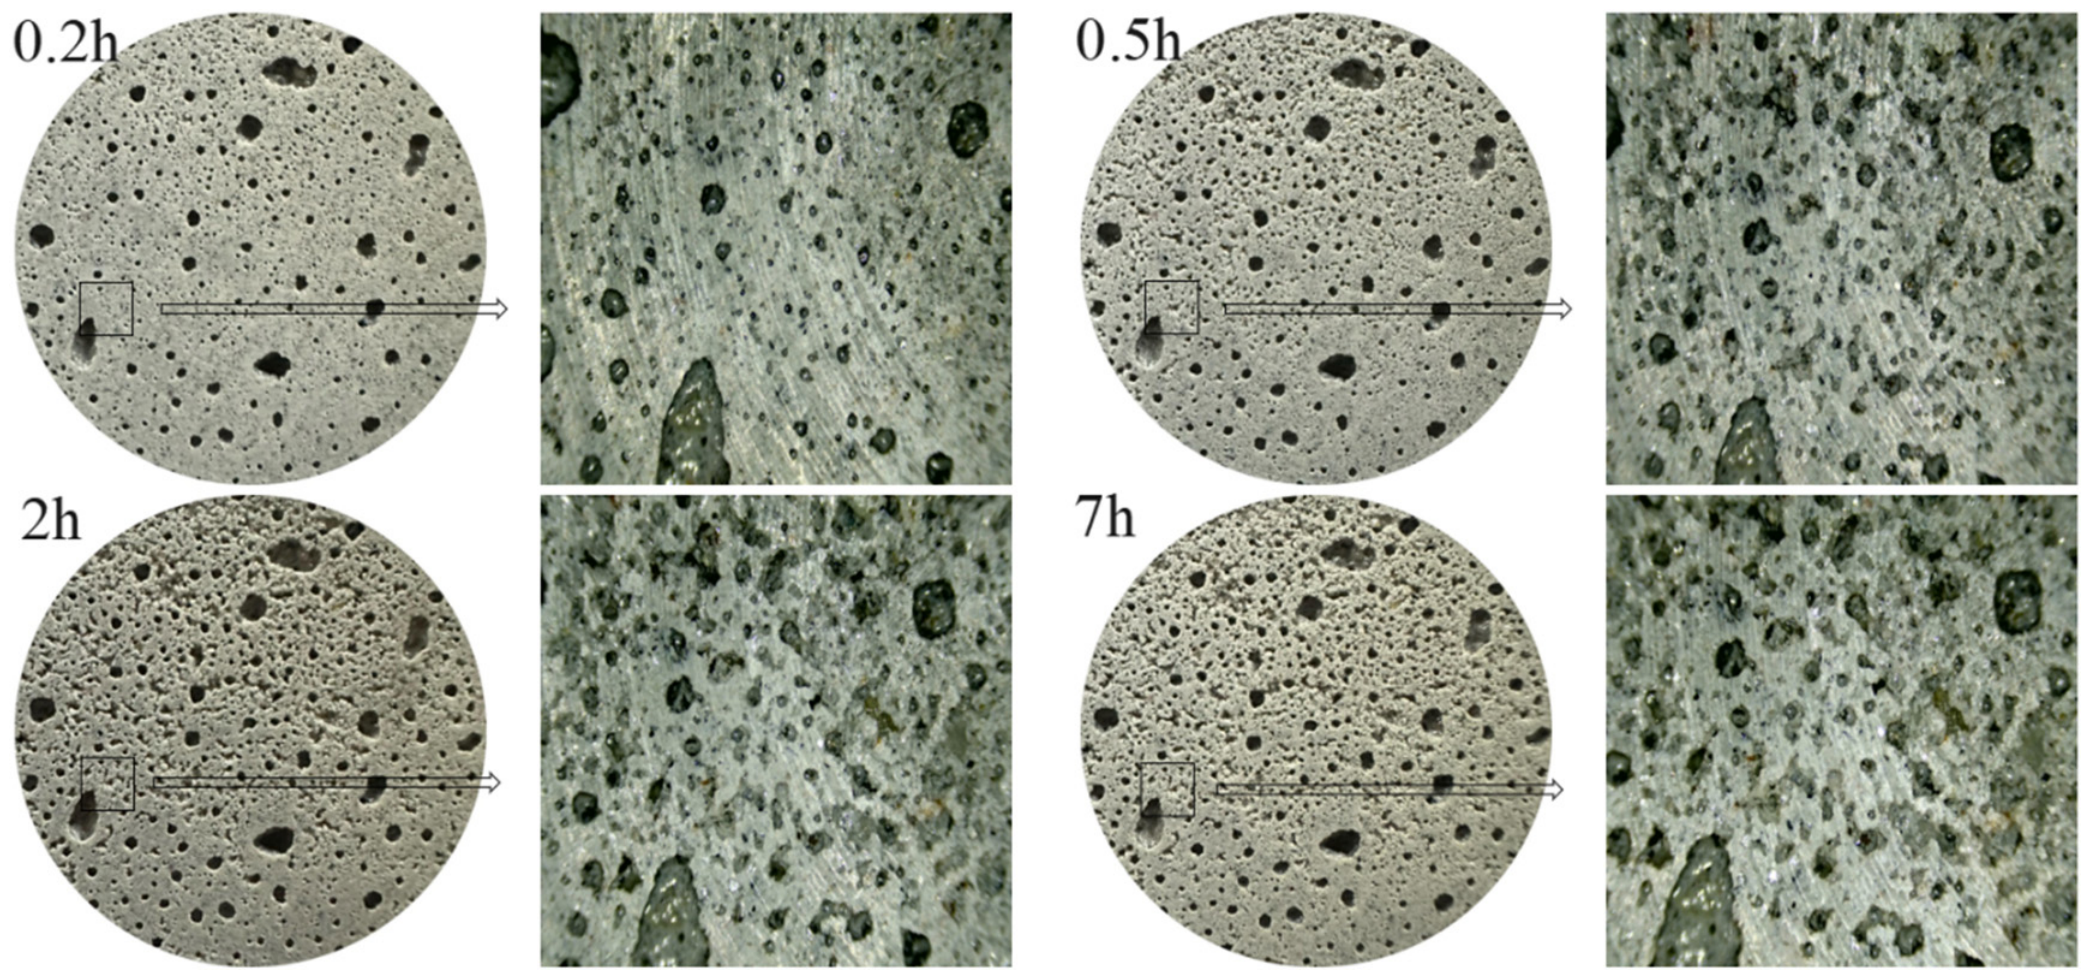
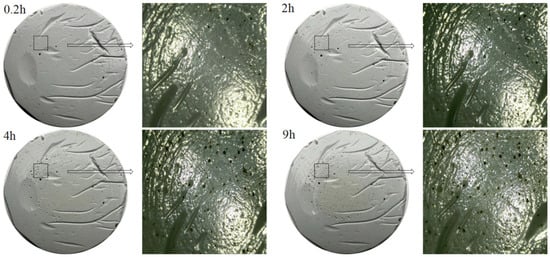
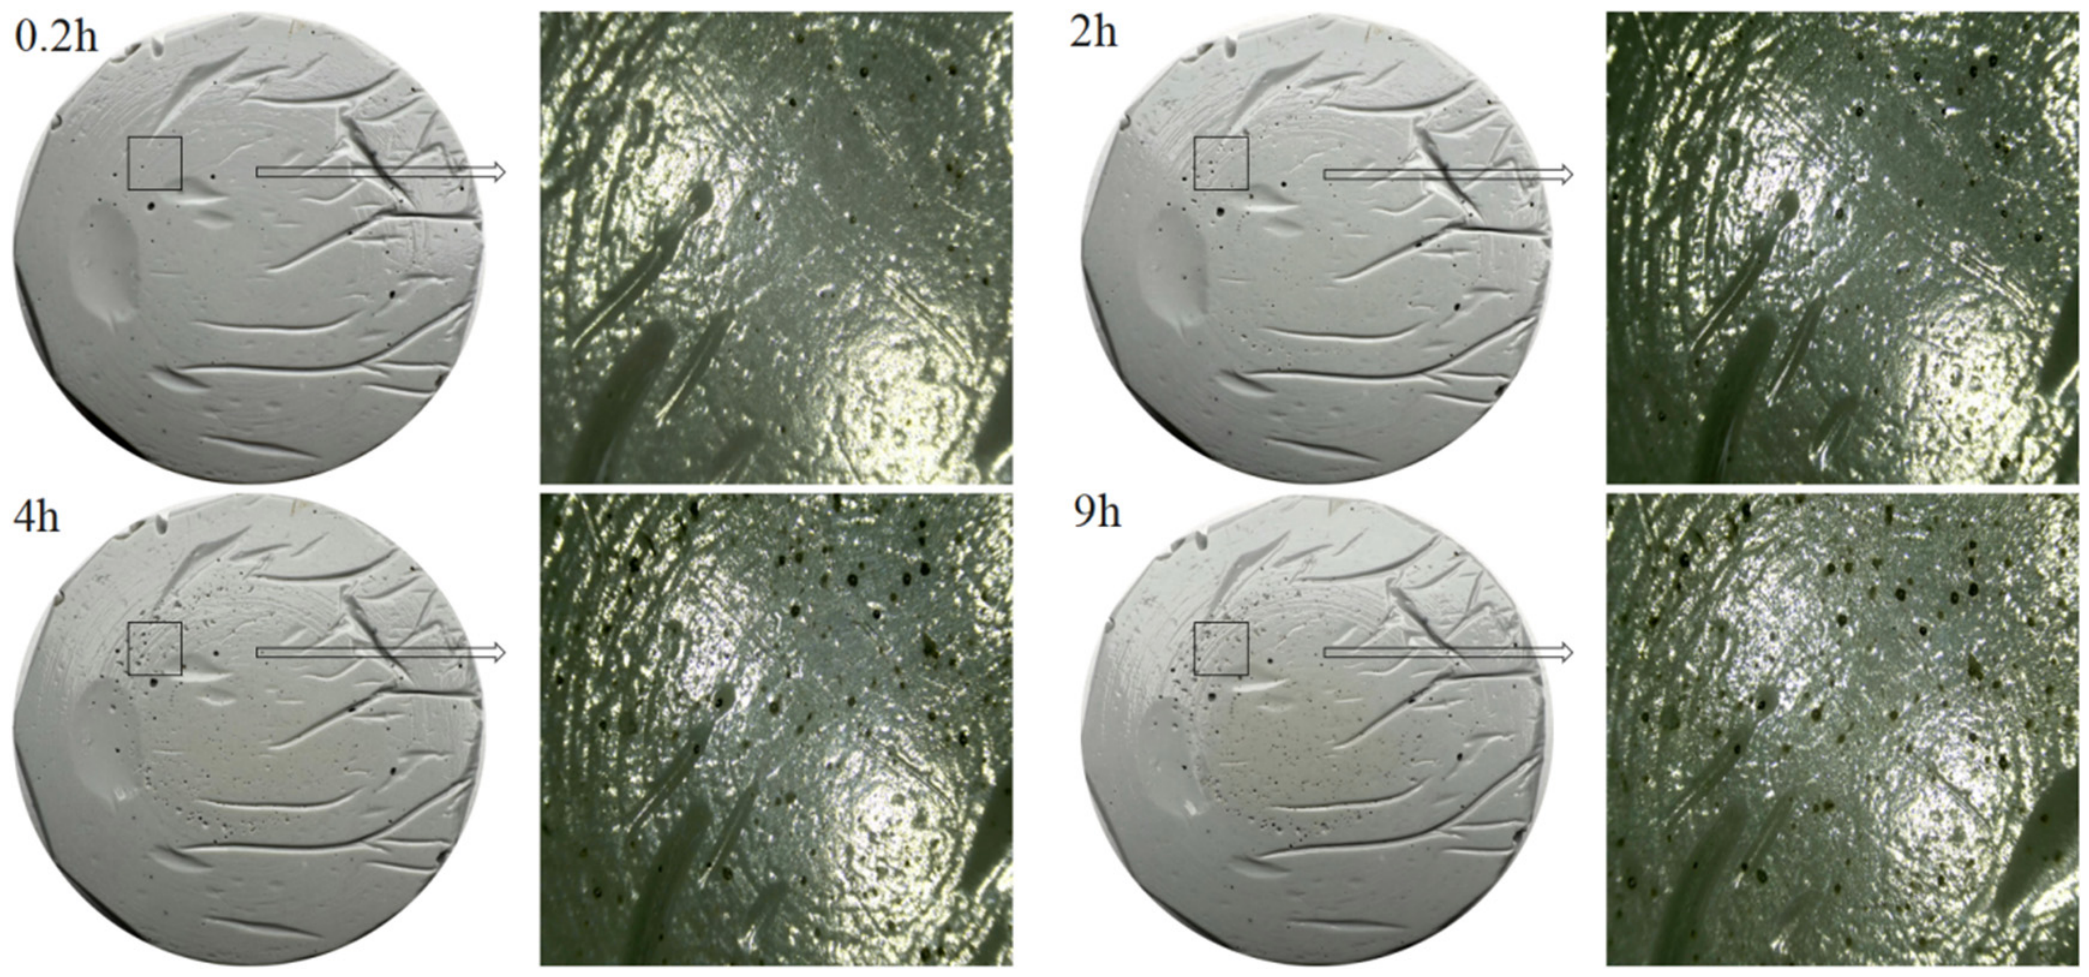
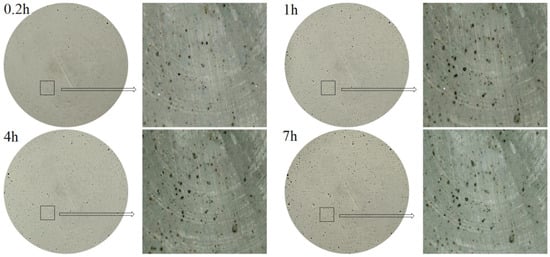
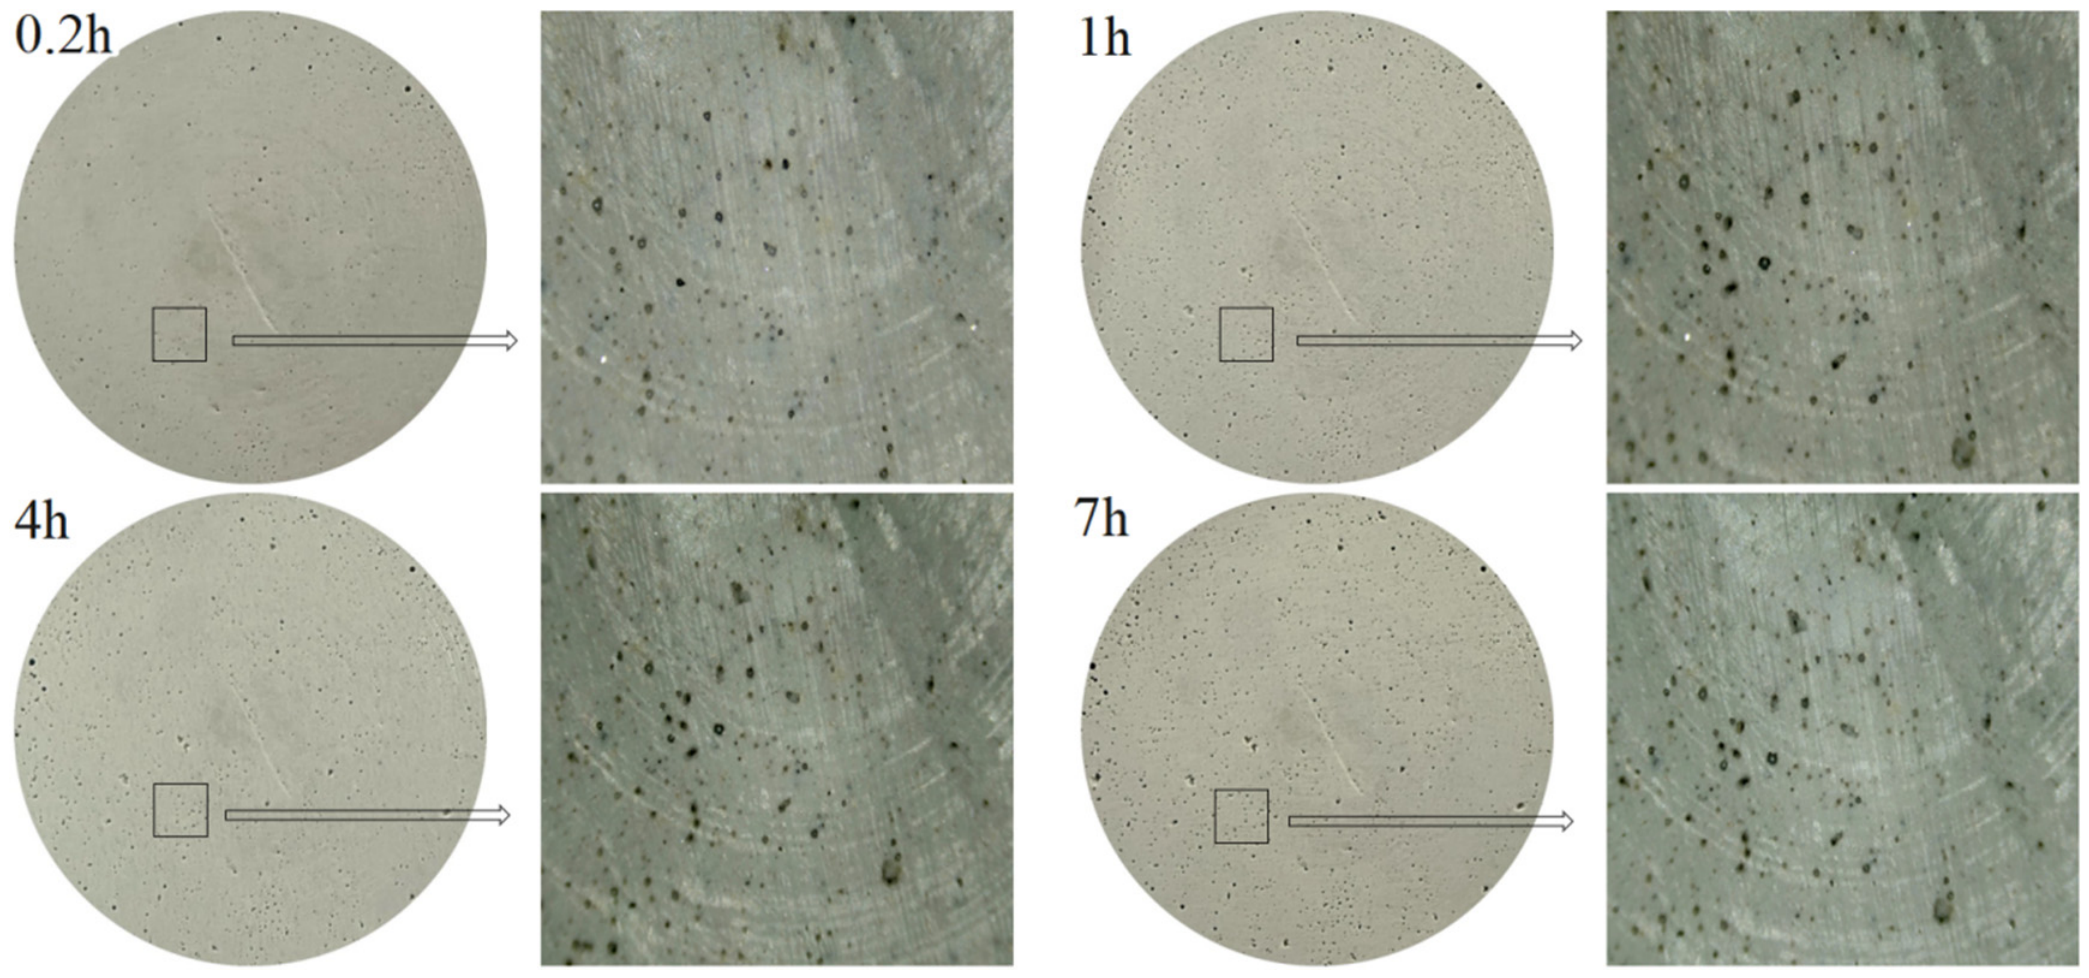
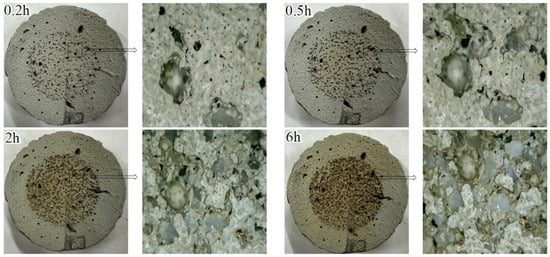
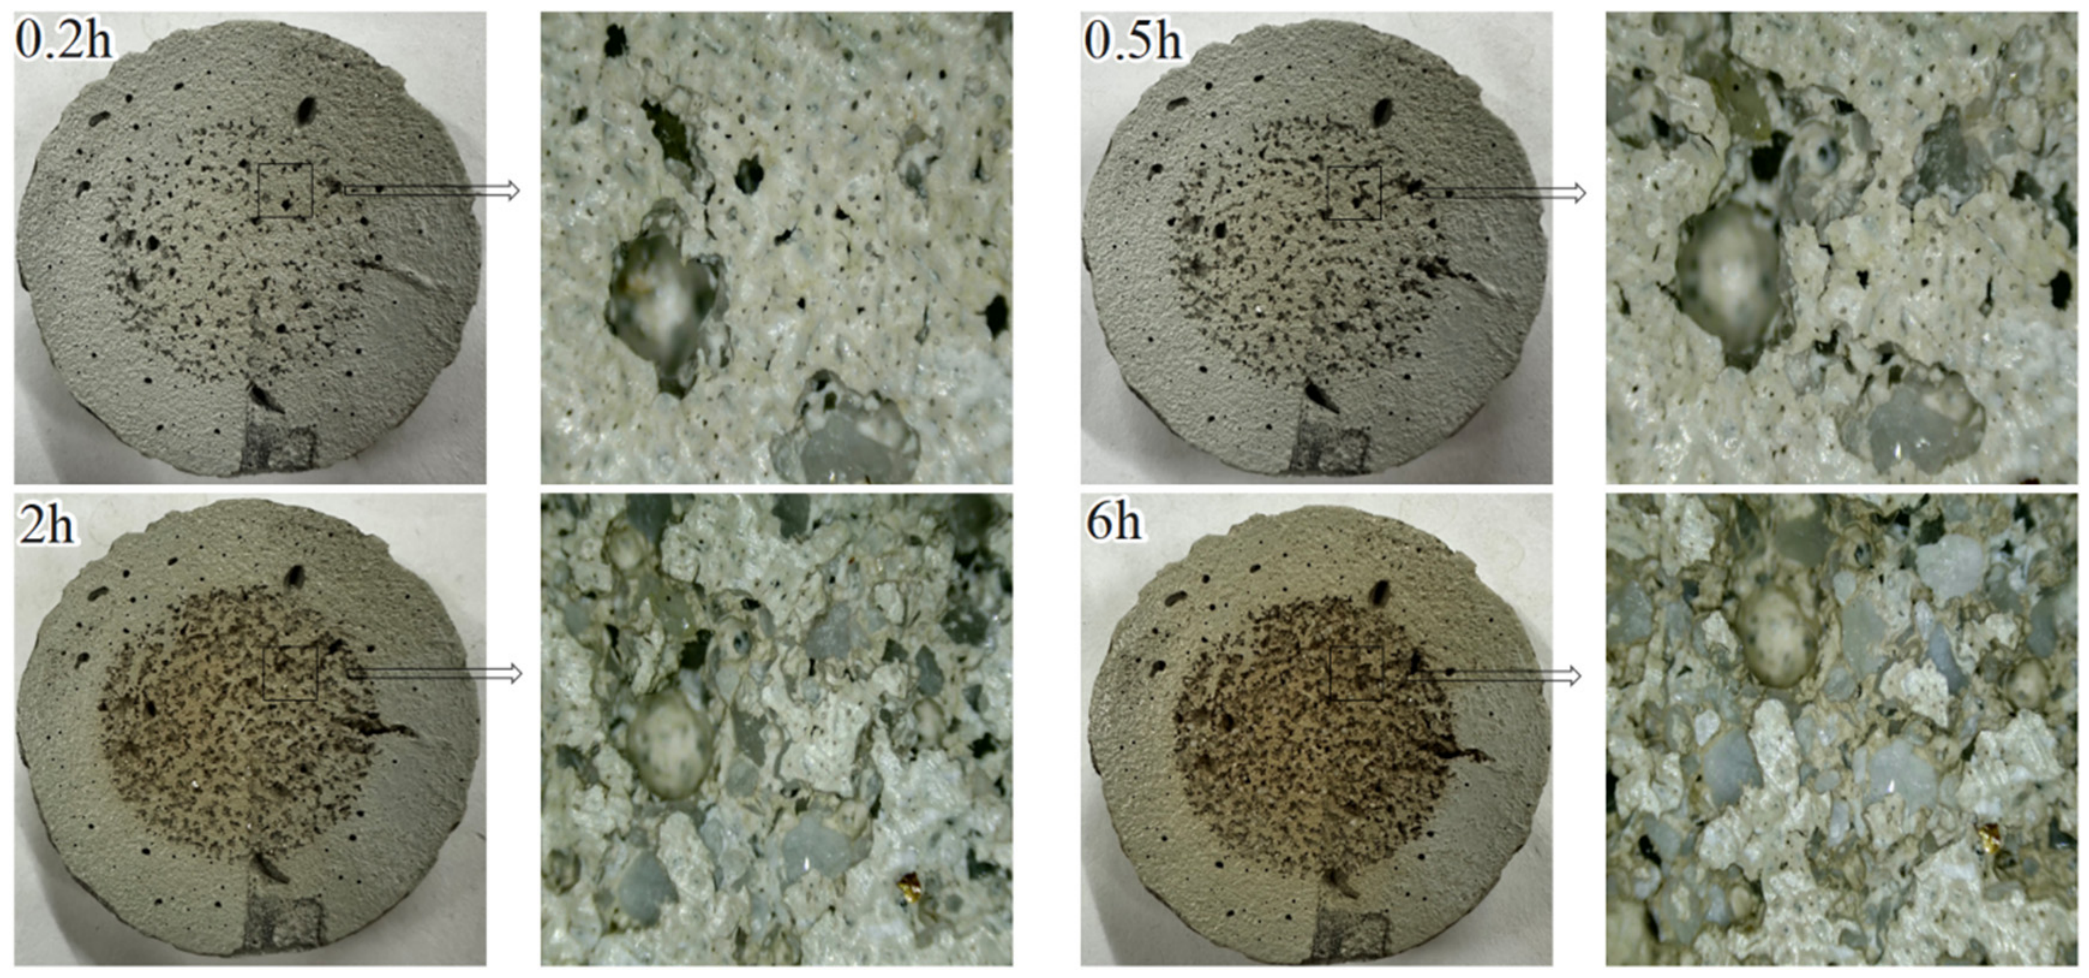
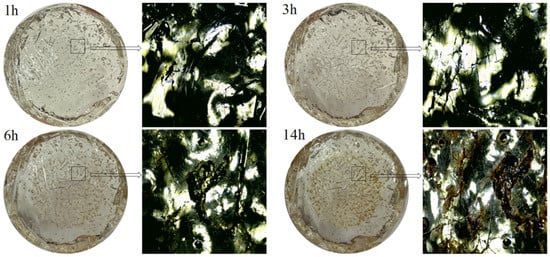
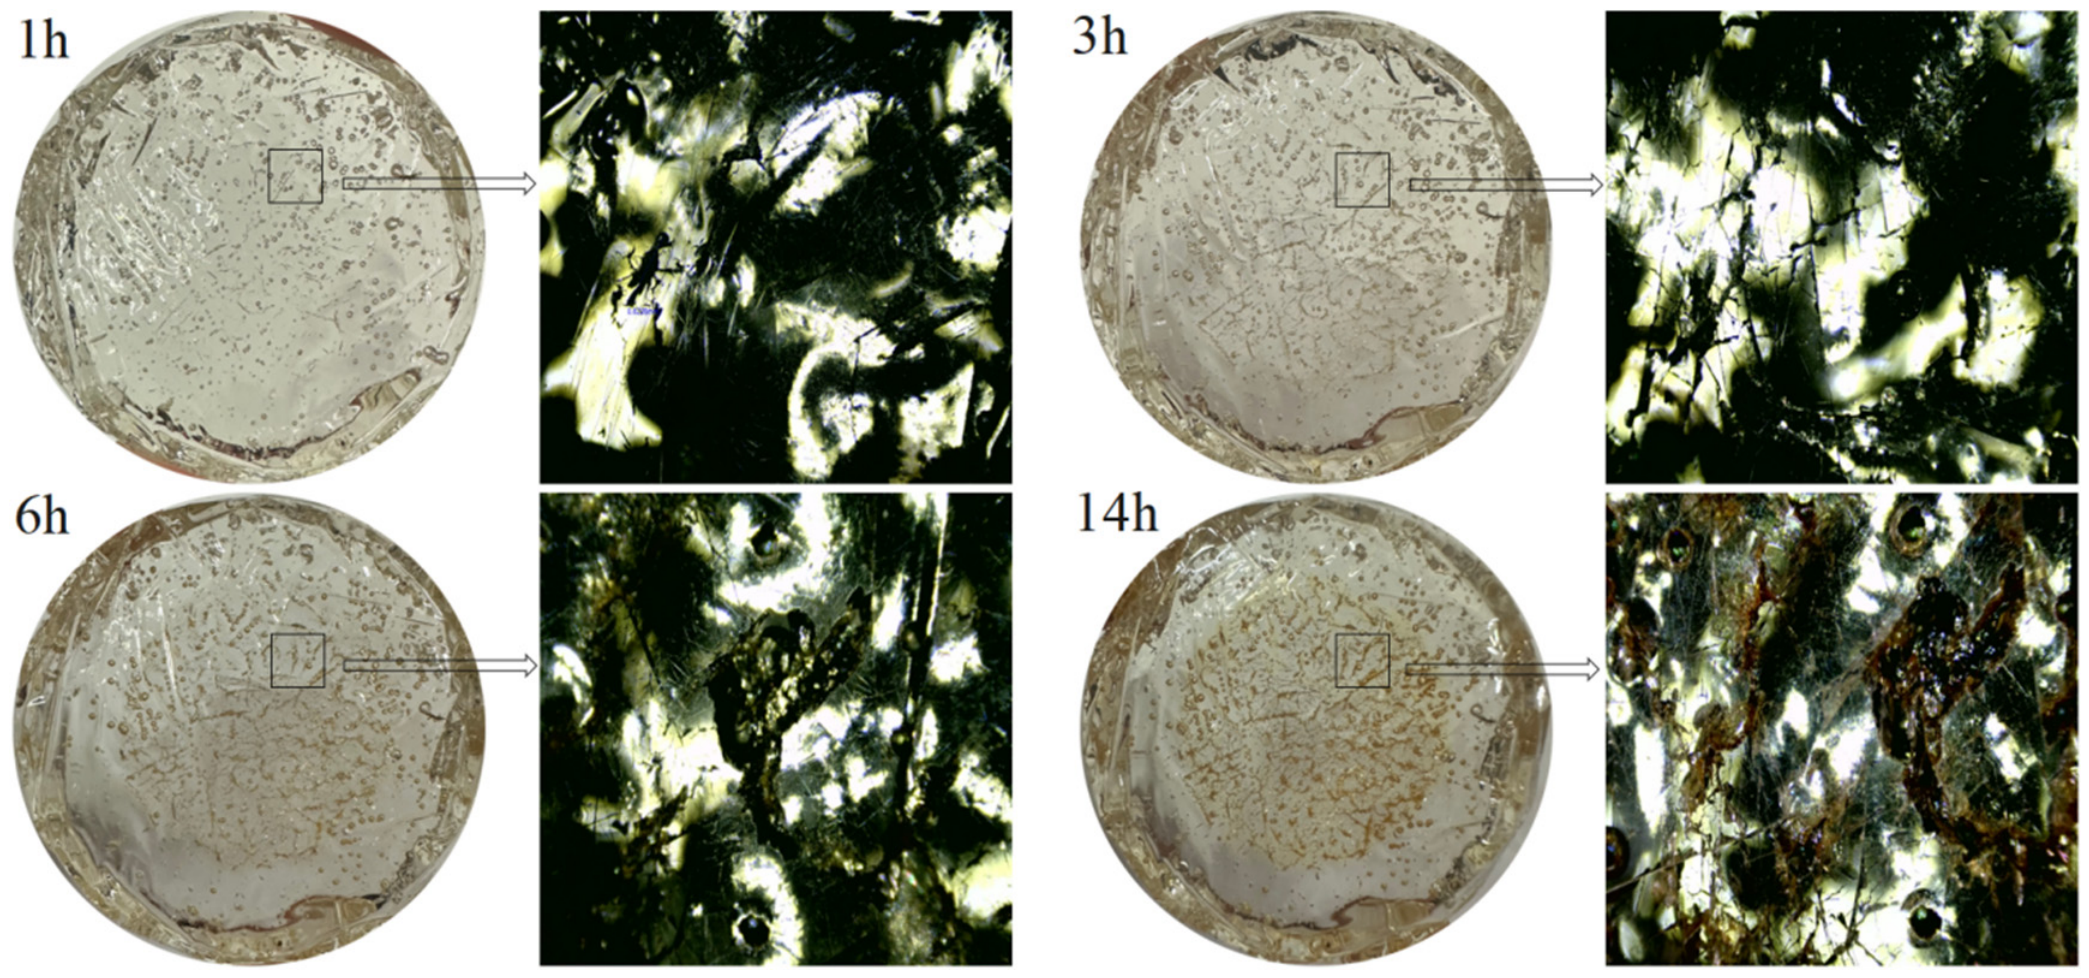
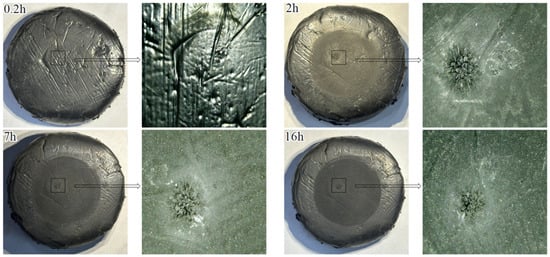
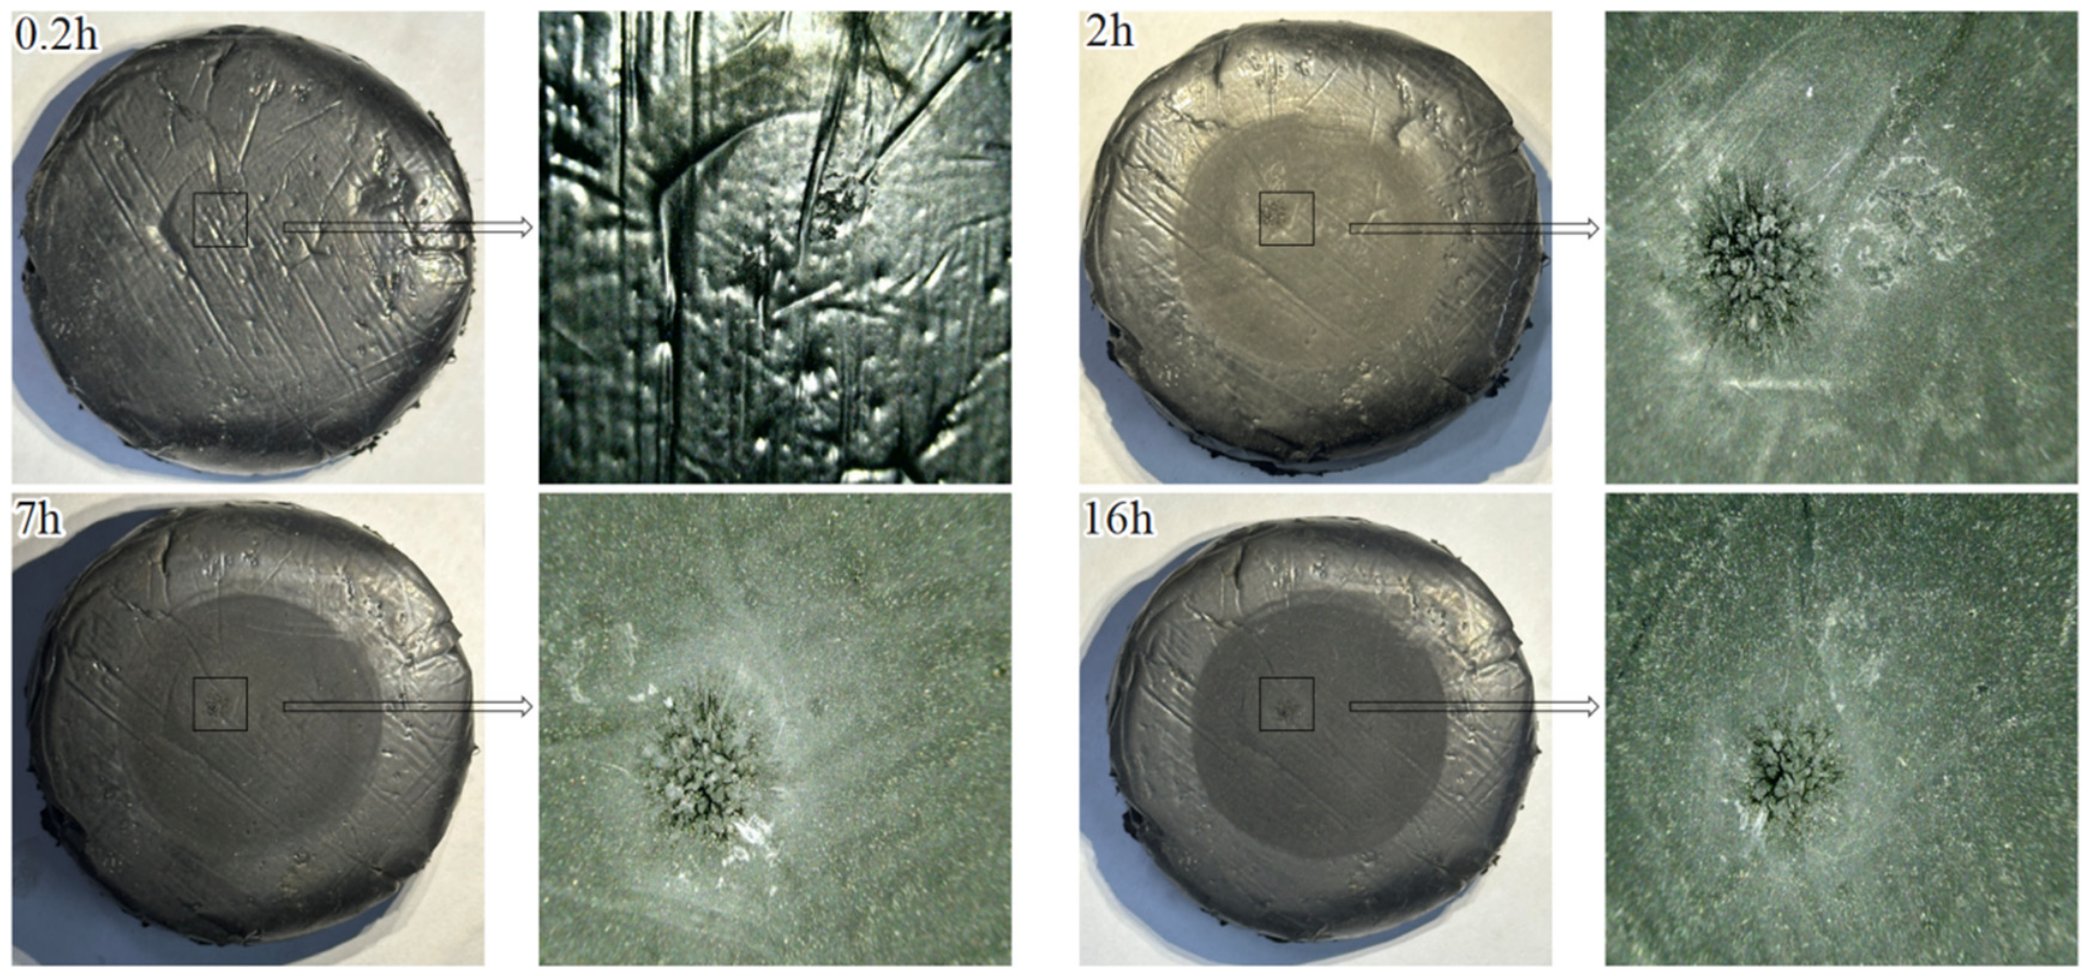
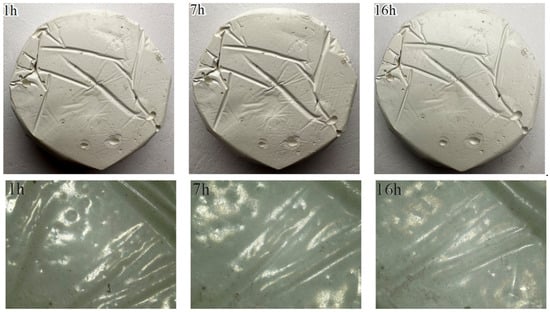
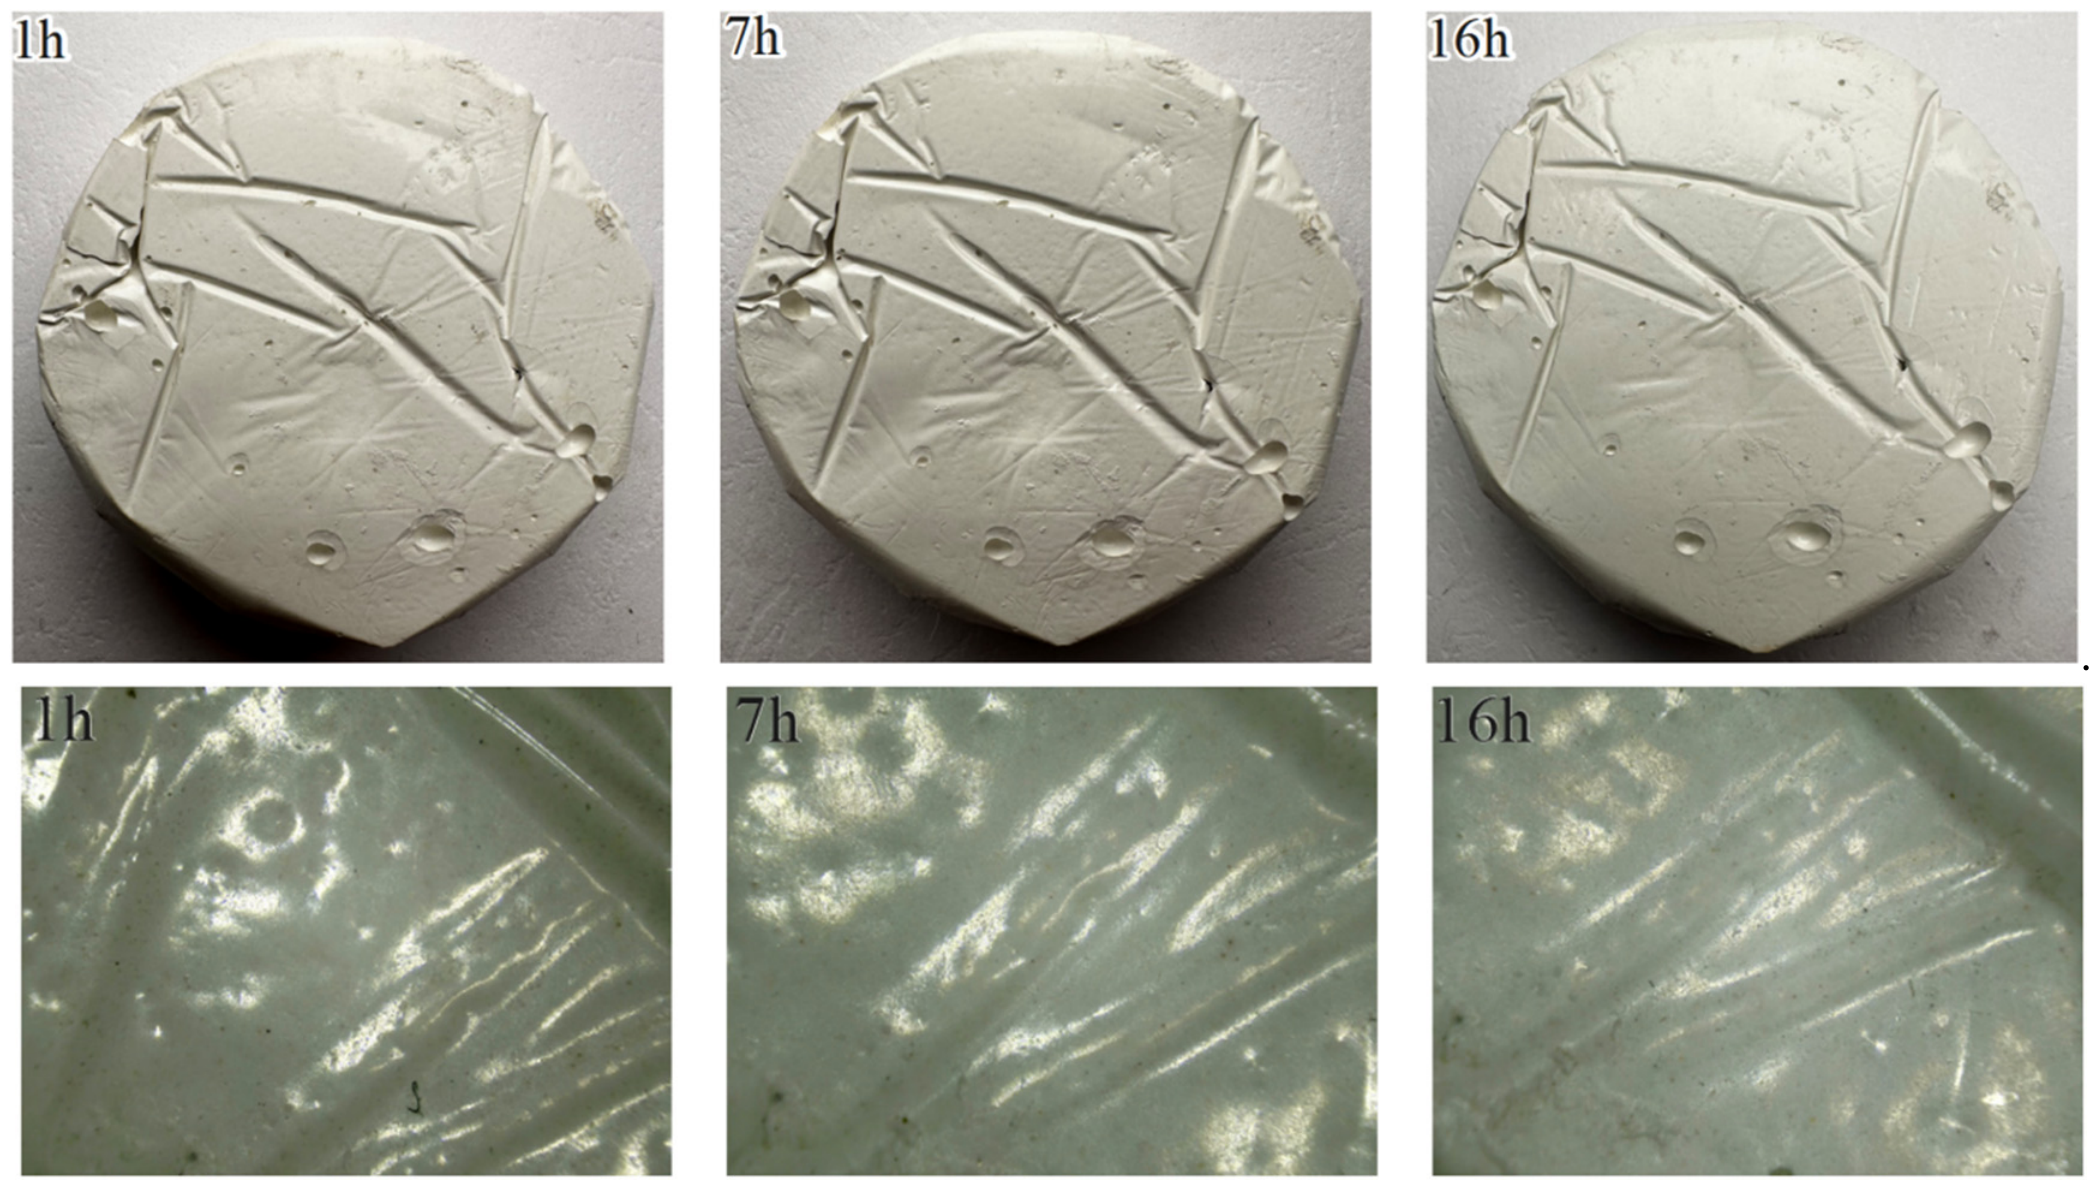
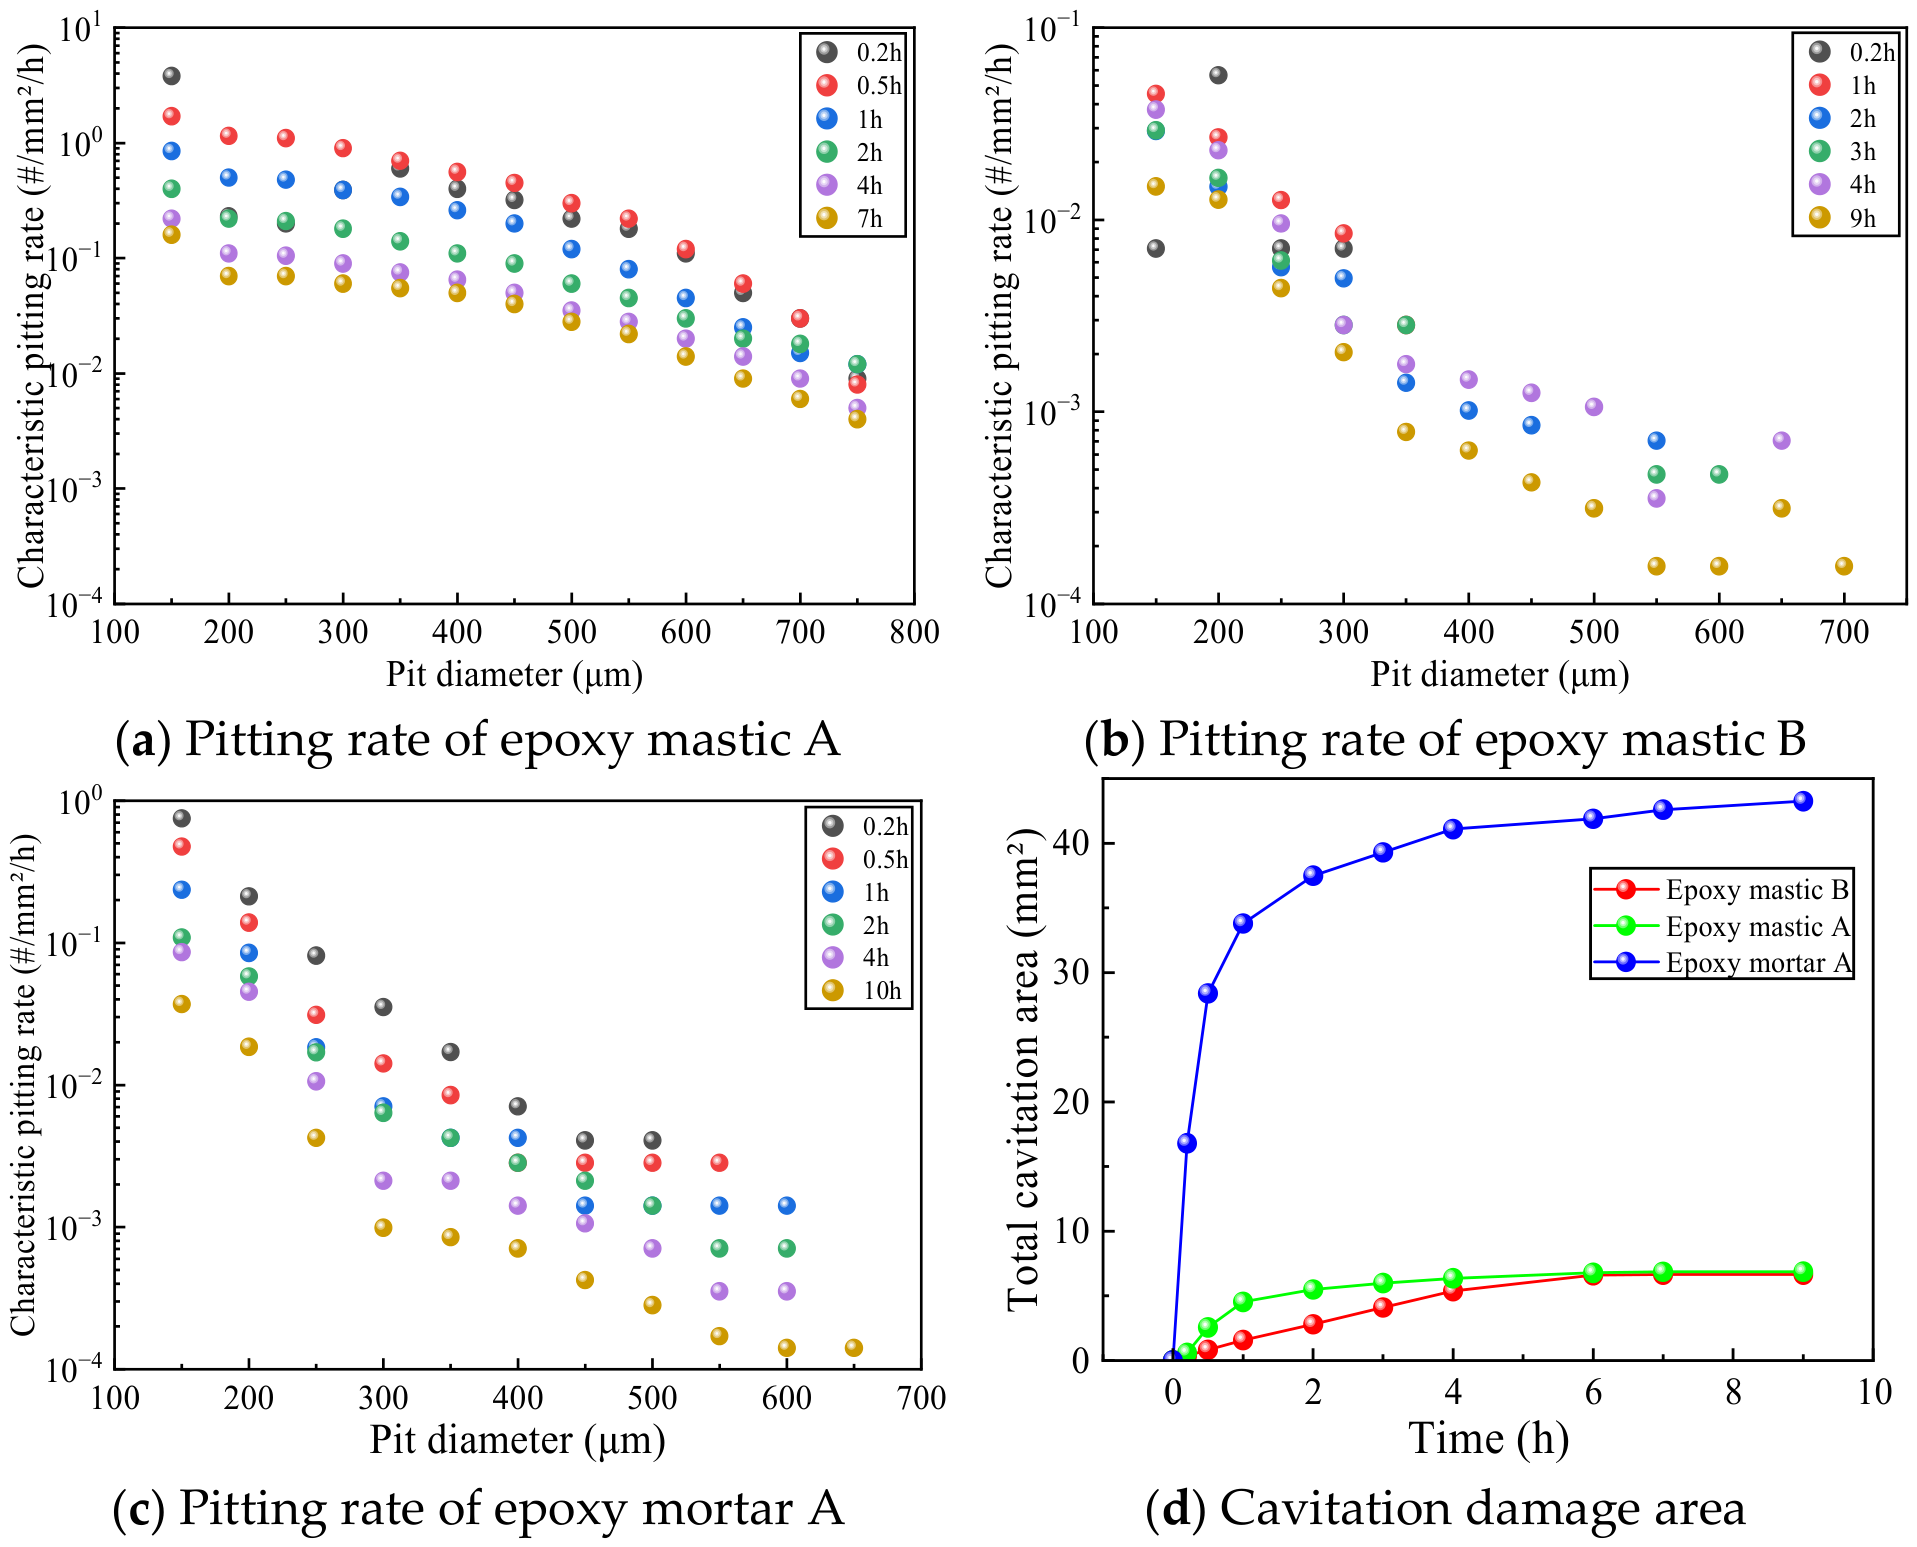
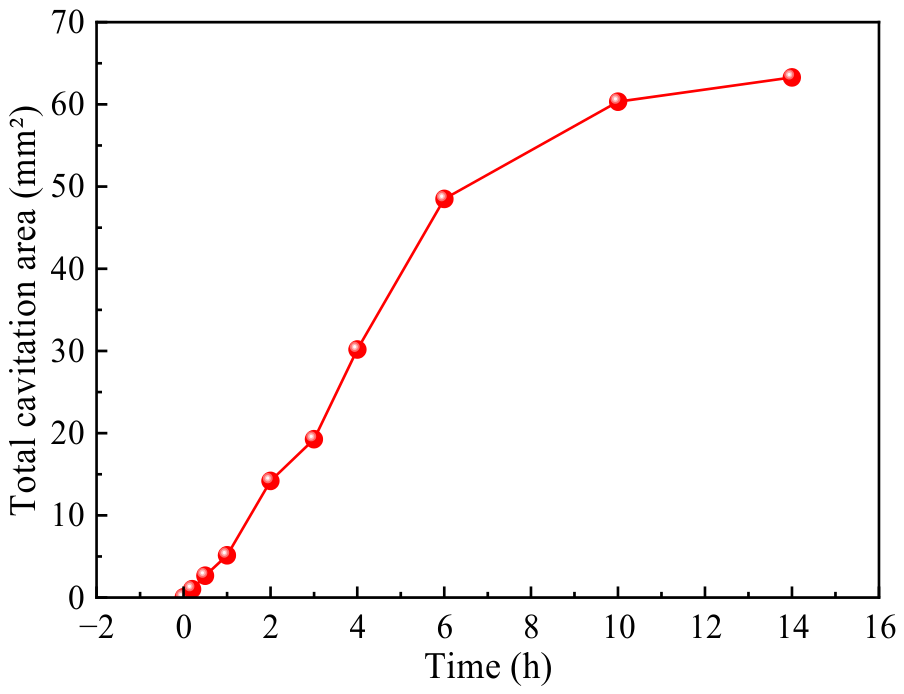
The evolution of macroscopic and microscopic cavitation morphologies for different repair materials is shown in Figure 4, Figure 5, Figure 6, Figure 7 and Figure 8. No mass loss was observed in any of the joint-filling materials; their macroscopic and microscopic cavitation morphology evolution is shown in Figure 9 and Figure 10. Epoxy mortar A exhibited a continuous accumulation of pitting cavities that gradually became more densely concentrated, displaying typical cavitation damage characteristics. In terms of the final failure mode, epoxy mastic B exhibited a continuous accumulation of small-scale pitting cavities; overall damage progression was relatively slow, and the cavitation pits were mostly scattered. The deepening of cavitation damage in epoxy mortar A was primarily manifested by an increase in the number of pitting pits and an expansion of their local dimensions; no continuous through-pits or significant spalling occurred. Epoxy mortar B exhibited a progression from dispersed pitting to centrally concentrated damage; cavitation damage developed relatively rapidly, resulting in noticeable surface mortar delamination and localized aggregate exposure within a short period. A 14 h ultrasonic cavitation test on polyurea A revealed damage patterns markedly different from those of the epoxy materials. The damage primarily manifested as the initiation, propagation, and coalescence of short cracks, ultimately forming a relatively dense crack network on the surface. No typical pitting features were observed, and the damage progression was relatively slow. The isolated localized pits observed during the test were initial internal defects in the polyurea A specimen, caused by the formation of numerous air bubbles during the pouring process. After 16 h of cavitation, damage to silicone A was primarily concentrated in isolated, localized areas; no widespread, dispersed morphology of multiple pitting was observed, and the area of cavitation pits at the end of the test was only 2.9 mm2. No significant morphological changes were observed on the surface of polyurethane A; the extent of damage was less than that of silicone A, and no obvious cavitation pits were observed.
Figure 4.
Evolution of macro- and micro-scale cavitation morphology in epoxy mortar A.
Figure 5.
Evolution of macro- and micro-scale cavitation morphology in epoxy mastic B.
Figure 6.
Evolution of macro- and micro-scale cavitation morphology in epoxy mastic A.
Figure 7.
Evolution of macro- and micro-scale cavitation morphology in epoxy mortar B.
Figure 8.
Evolution of macro- and micro-scale cavitation morphology in polyurea A.
Figure 9.
Evolution of macroscopic and microscopic cavitation morphologies of silicone A.
Figure 10.
Evolution of macro- and micro-scale cavitation morphology in polyurethane A.
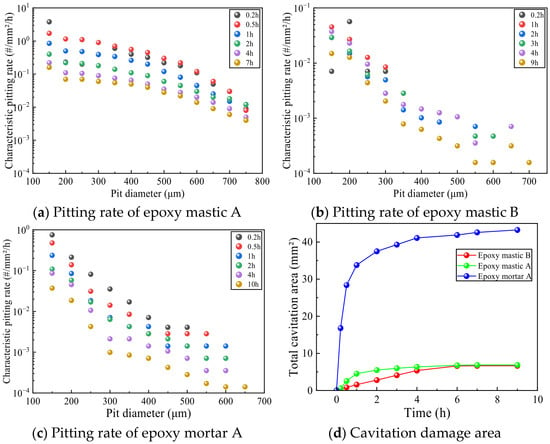
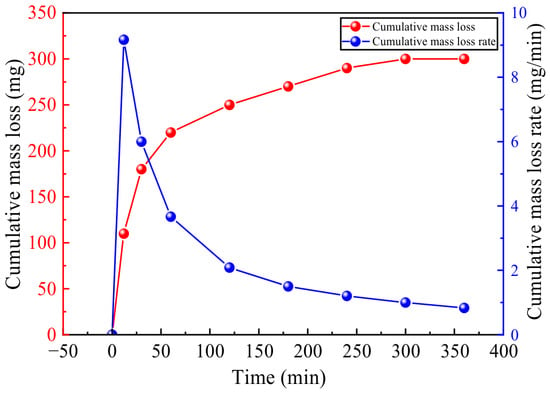
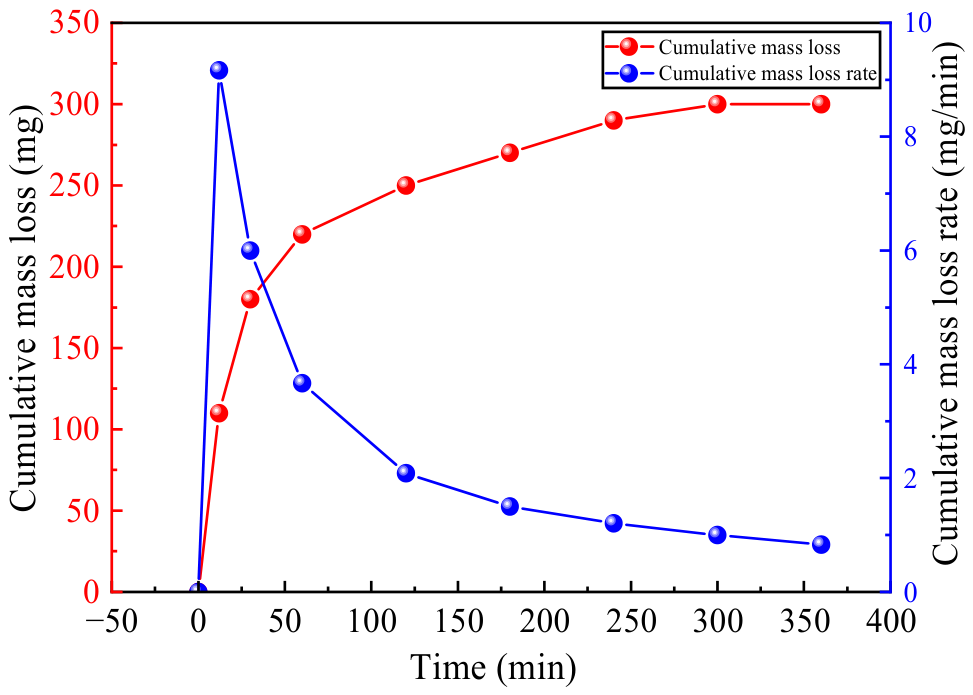
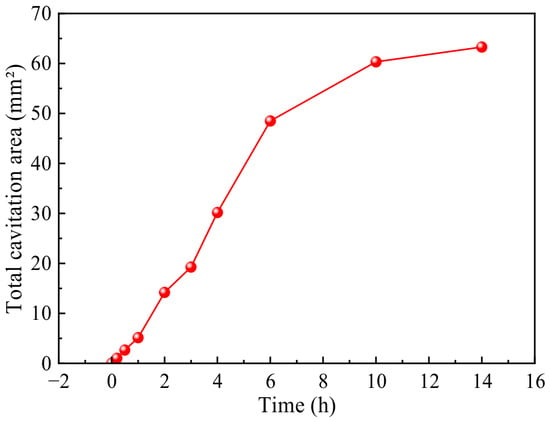
No mass loss was detected for epoxy mortar A, epoxy mastic B, or epoxy mastic A; therefore, cumulative area loss and pitting rate were used to evaluate the cavitation resistance of these materials, as shown in Figure 11. Epoxy mortar B exhibited mass loss; therefore, cumulative mass loss and mass loss rate were used for evaluation, as shown in Figure 12. Since no obvious pitting was observed on the surface of polyurea A, pitting rate was not used for evaluation; instead, only the cumulative damaged area was calculated, as shown in Figure 13.
Figure 11.
Distribution of pitting rates and changes in cavitation damage area for different repair materials.
Figure 12.
Cumulative mass loss and loss rate of epoxy mortar B.
Figure 13.
Cavitation area of polyurea A.
The above results indicate that, among the repair materials, polyurea A exhibits a damage pattern different from that of the epoxy-based materials. Based on the area of cavitation damage, its cavitation resistance is the lowest. The cavitation resistance of the remaining four epoxy repair materials is ranked as follows: epoxy mastic B > epoxy mastic A > epoxy mortar A > epoxy mortar B. Among the joint-filling materials, silicone A developed localized areas of concentrated damage consisting of several small cavitation pits, whereas no obvious cavitation pits were observed on the surface of polyurethane A; therefore, polyurethane A exhibits superior cavitation resistance.
3.2. Analysis of Hydraulic Cavitation Results
Based on the results of ultrasonic cavitation tests, it was found that epoxy mortar exhibits lower cavitation resistance than other materials; therefore, epoxy mortar will not be used as a repair material in the hydraulic cavitation tests described below.
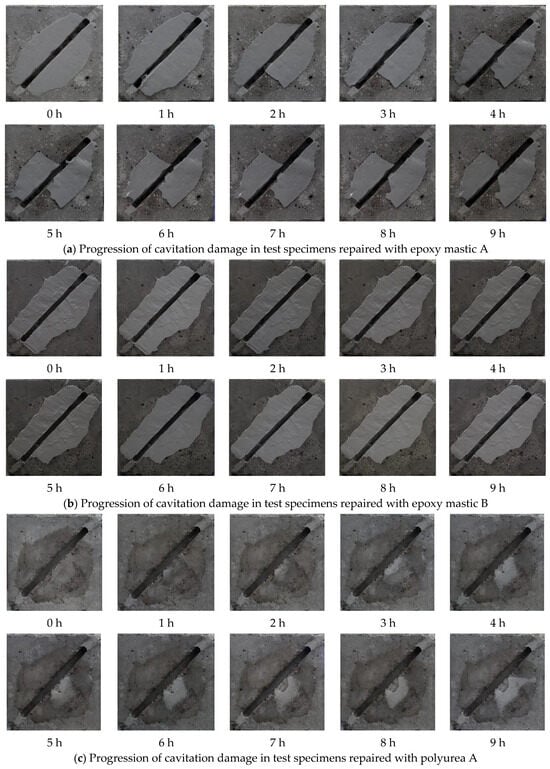
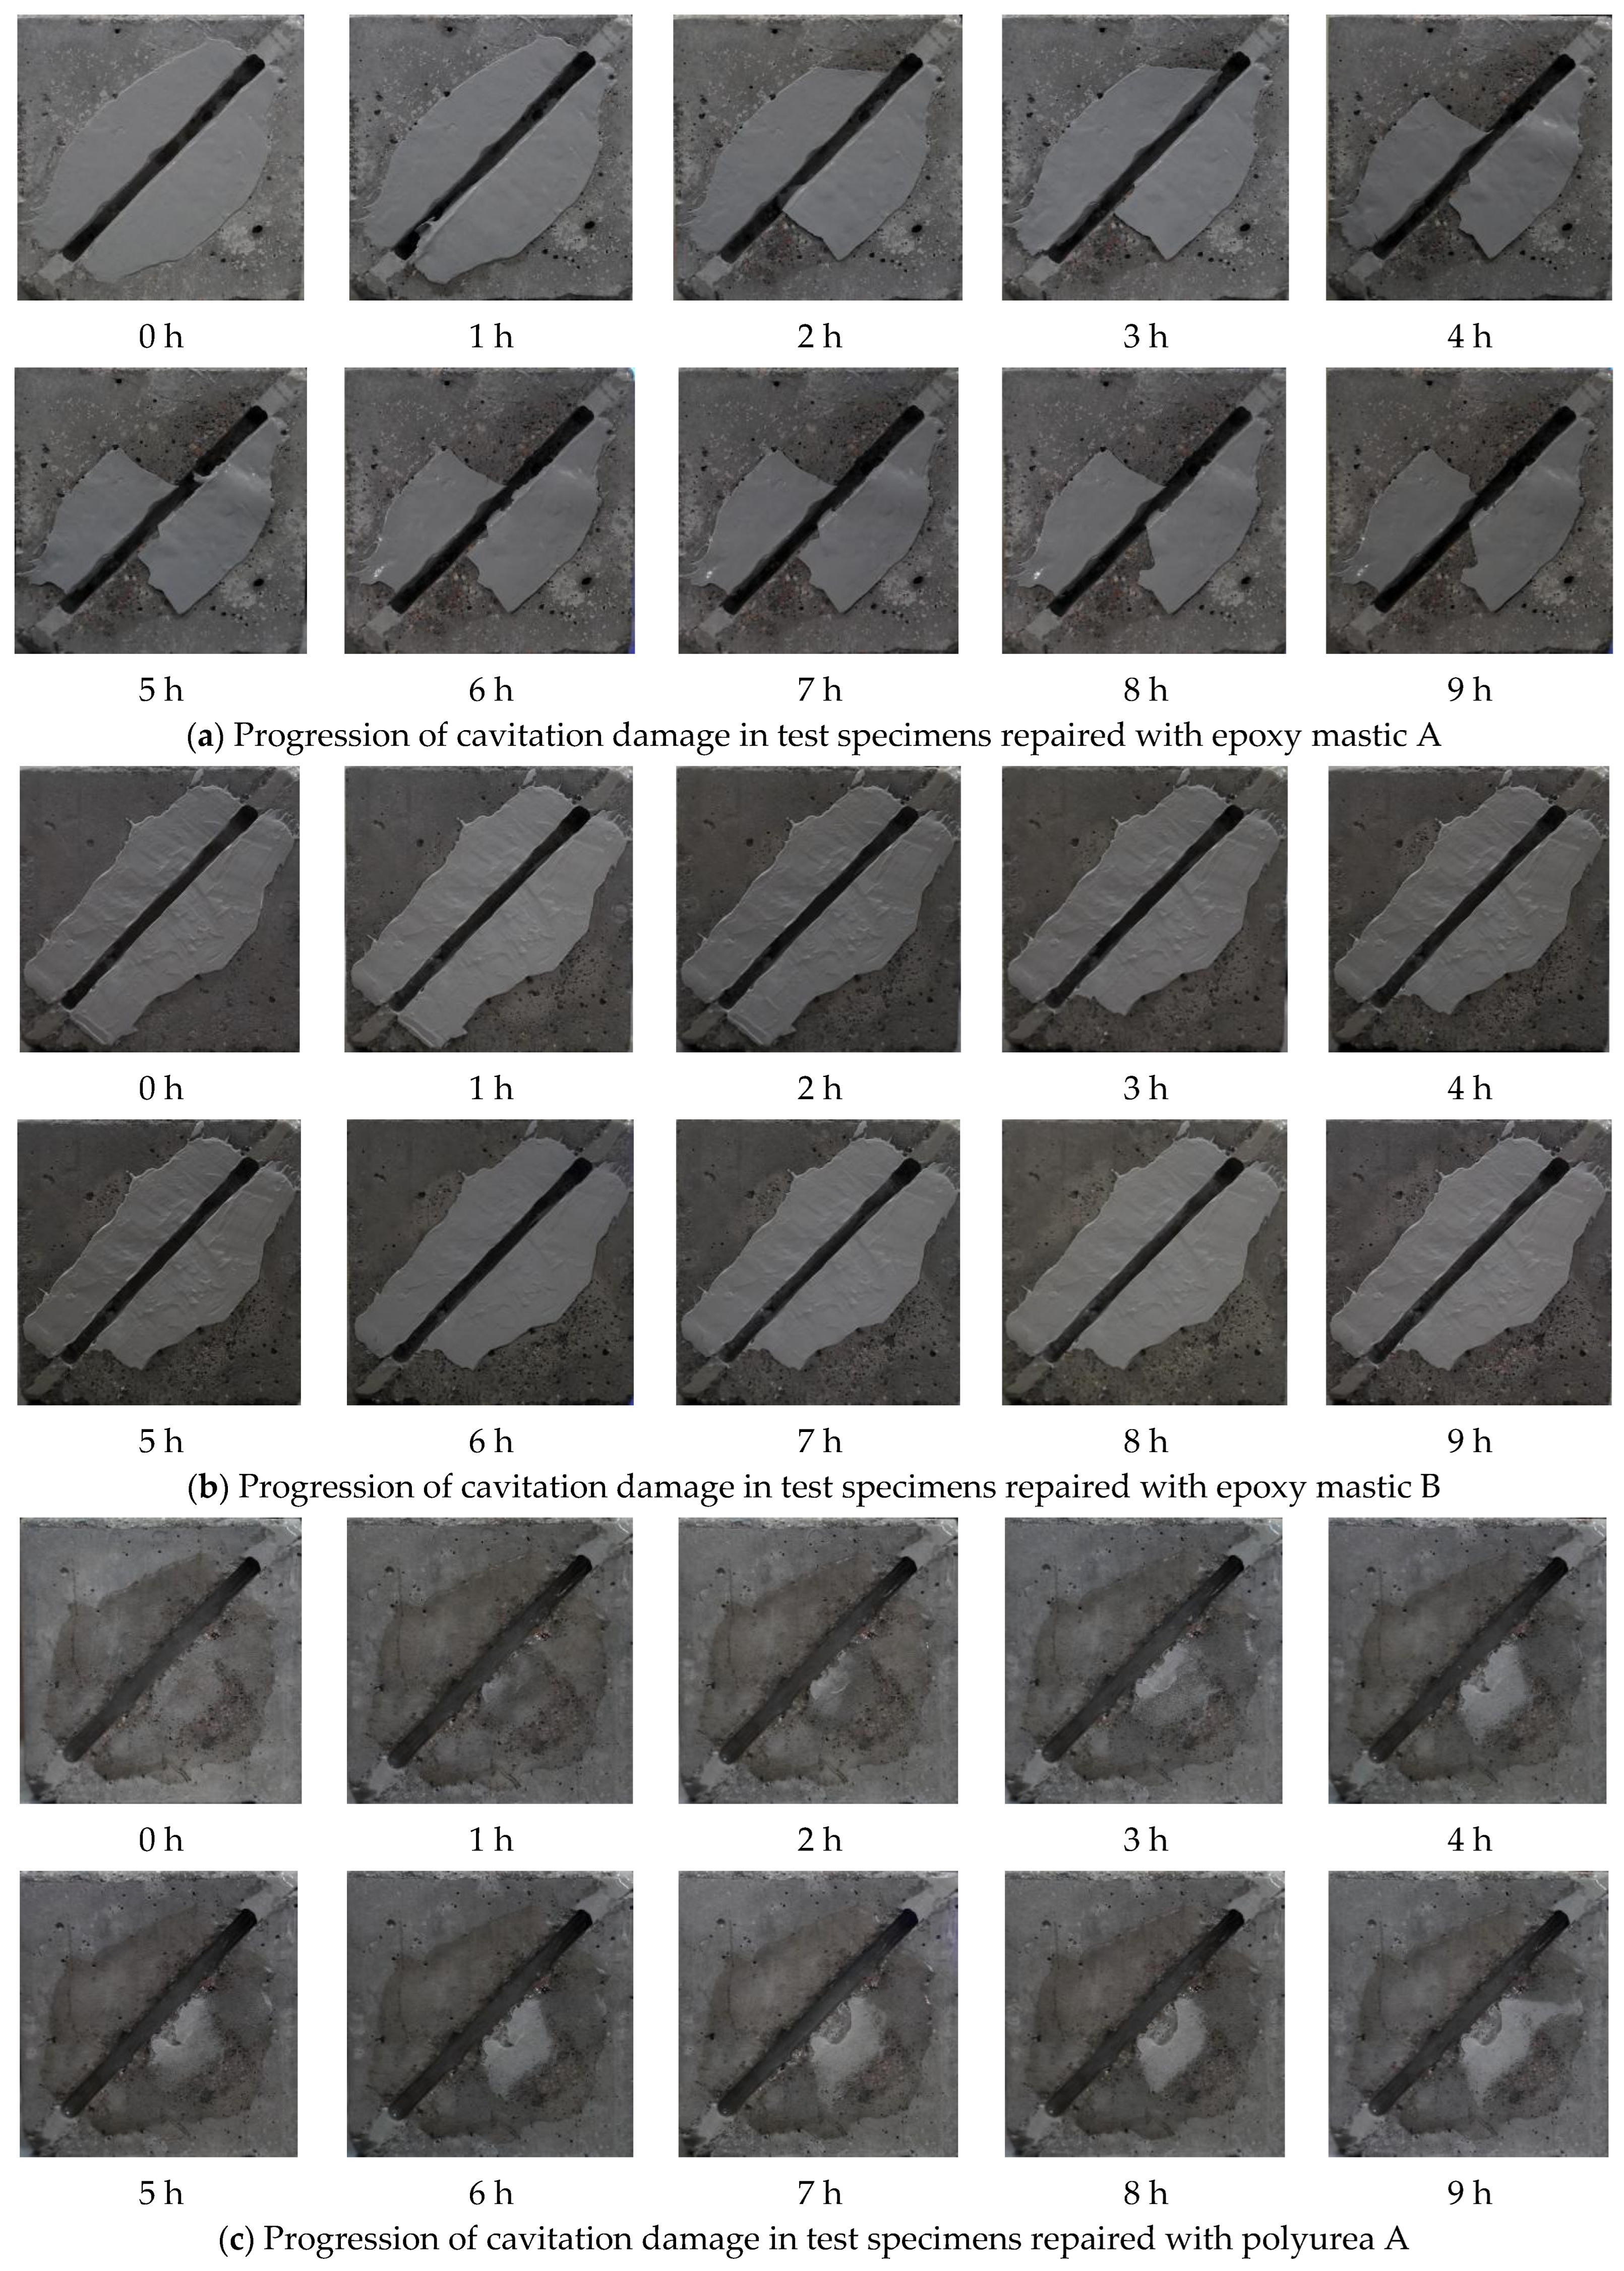
Figure 14 shows the macroscopic damage development on the surfaces of the test specimens made from the three repair materials after 9 h of hydraulic cavitation testing.
Figure 14.
Development of cavitation damage on the surface of a repaired test specimen.
Analysis of macroscopic damage development on specimen surfaces shows that the surfaces of specimens repaired with epoxy mastic A did not exhibit pitted cavitation damage; failure modes were primarily cracking and overall detachment of the repair material. Under cavitation loads, the epoxy mastic A coating generally demonstrated strong cavitation resistance, with failure primarily manifesting as interfacial bond failure between the repair material and the base concrete. Prior to the start of the test, the coating surface was generally intact. One hour into the cavitation test, a small amount of the repair coating had peeled off inside and along the edges of the construction joint; the surface repair material first failed at the joint edges and within the joint itself. After 2 h of testing, large areas of the coating on both sides of the structural joint had delaminated; after 4 h, the repair coating delaminated further, and the exposed areas near the structural joint increased. During the remainder of the test, localized damage and delamination continued to occur on the specimen surface, but the affected areas remained small. This indicates that damage progression was rapid during the initial stage of cavitation; once the bond interface between the repair material and the concrete was fully compromised and block-like delamination occurred, the cavitation rate tended to slow down. Epoxy mastic B demonstrated good overall cavitation resistance; its failure process lagged significantly behind that of epoxy mastic A, and the damage primarily took the form of localized cracking, edge damage, and minor spalling. Overall, the epoxy mastic B coating exhibited strong cavitation resistance. Prior to cavitation, the integrity of the repair coating on the specimen surface was good, and the surface was relatively smooth. Two hours into the test, significant cavitation damage began to appear on the concrete at the outer edge of the coating on the specimen surface, while the repair coating showed no obvious cavitation damage. Three hours into the test, epoxy mastic B exhibited minor spalling; the macroscopic morphology of the specimen surface changed little, and the surface of the repair material remained largely intact, with only minor material loss due to spalling. The rate of damage progression tended to level off during the middle and late stages. The failure of polyurea A under cavitation loads was primarily due to failure at the bond interface. Prior to the test, the entire specimen surface was relatively smooth, with no initial damage. One hour into the test, polyurea A near the structural joint began to crack, and cavities began to form. The repair material failed at the edges of the structural joint; as the test continued, the cracks propagated further. By the four-hour mark, the bond between the repair material and the concrete substrate had failed over a large area, and the cavities had connected to form larger voids. Under cavitation, polyurea A primarily exhibited complete detachment of the repair material; no obvious cavitation damage was observed on the entire coating surface, and the coating fractured and detached under hydraulic impact. Analysis of macroscopic damage evolution revealed that after a 9 h cavitation test, none of the three repair materials exhibited obvious cavitation damage characteristics on their surfaces, indicating that all three materials possess good cavitation resistance; the failure mode was primarily related to the bonding condition. The failure of epoxy mastic A was primarily characterized by cracking and spalling of the material, with the largest spalling area among the three repair materials; epoxy mastic B exhibited the smallest area of detachment and the best adhesion to the concrete substrate, with failure manifesting as cracking and detachment along the edges near structural joints; the failure process of polyurea A differed from that of the other two materials, primarily characterized by blistering of the repair coating, crack propagation, cavity formation, and overall detachment. Due to the formation of cavities between the polyurea coating and the concrete substrate, there is a high likelihood of large-scale detachment under cavitation loads.
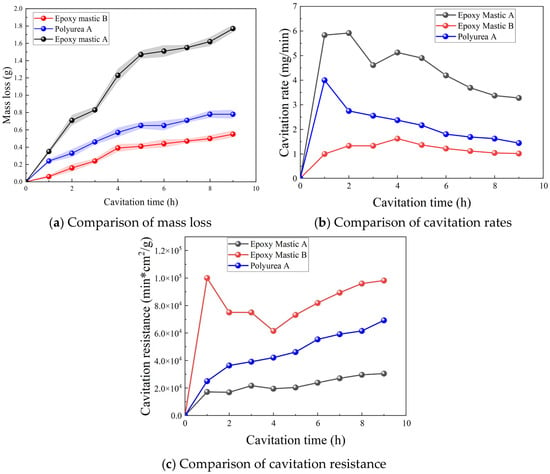
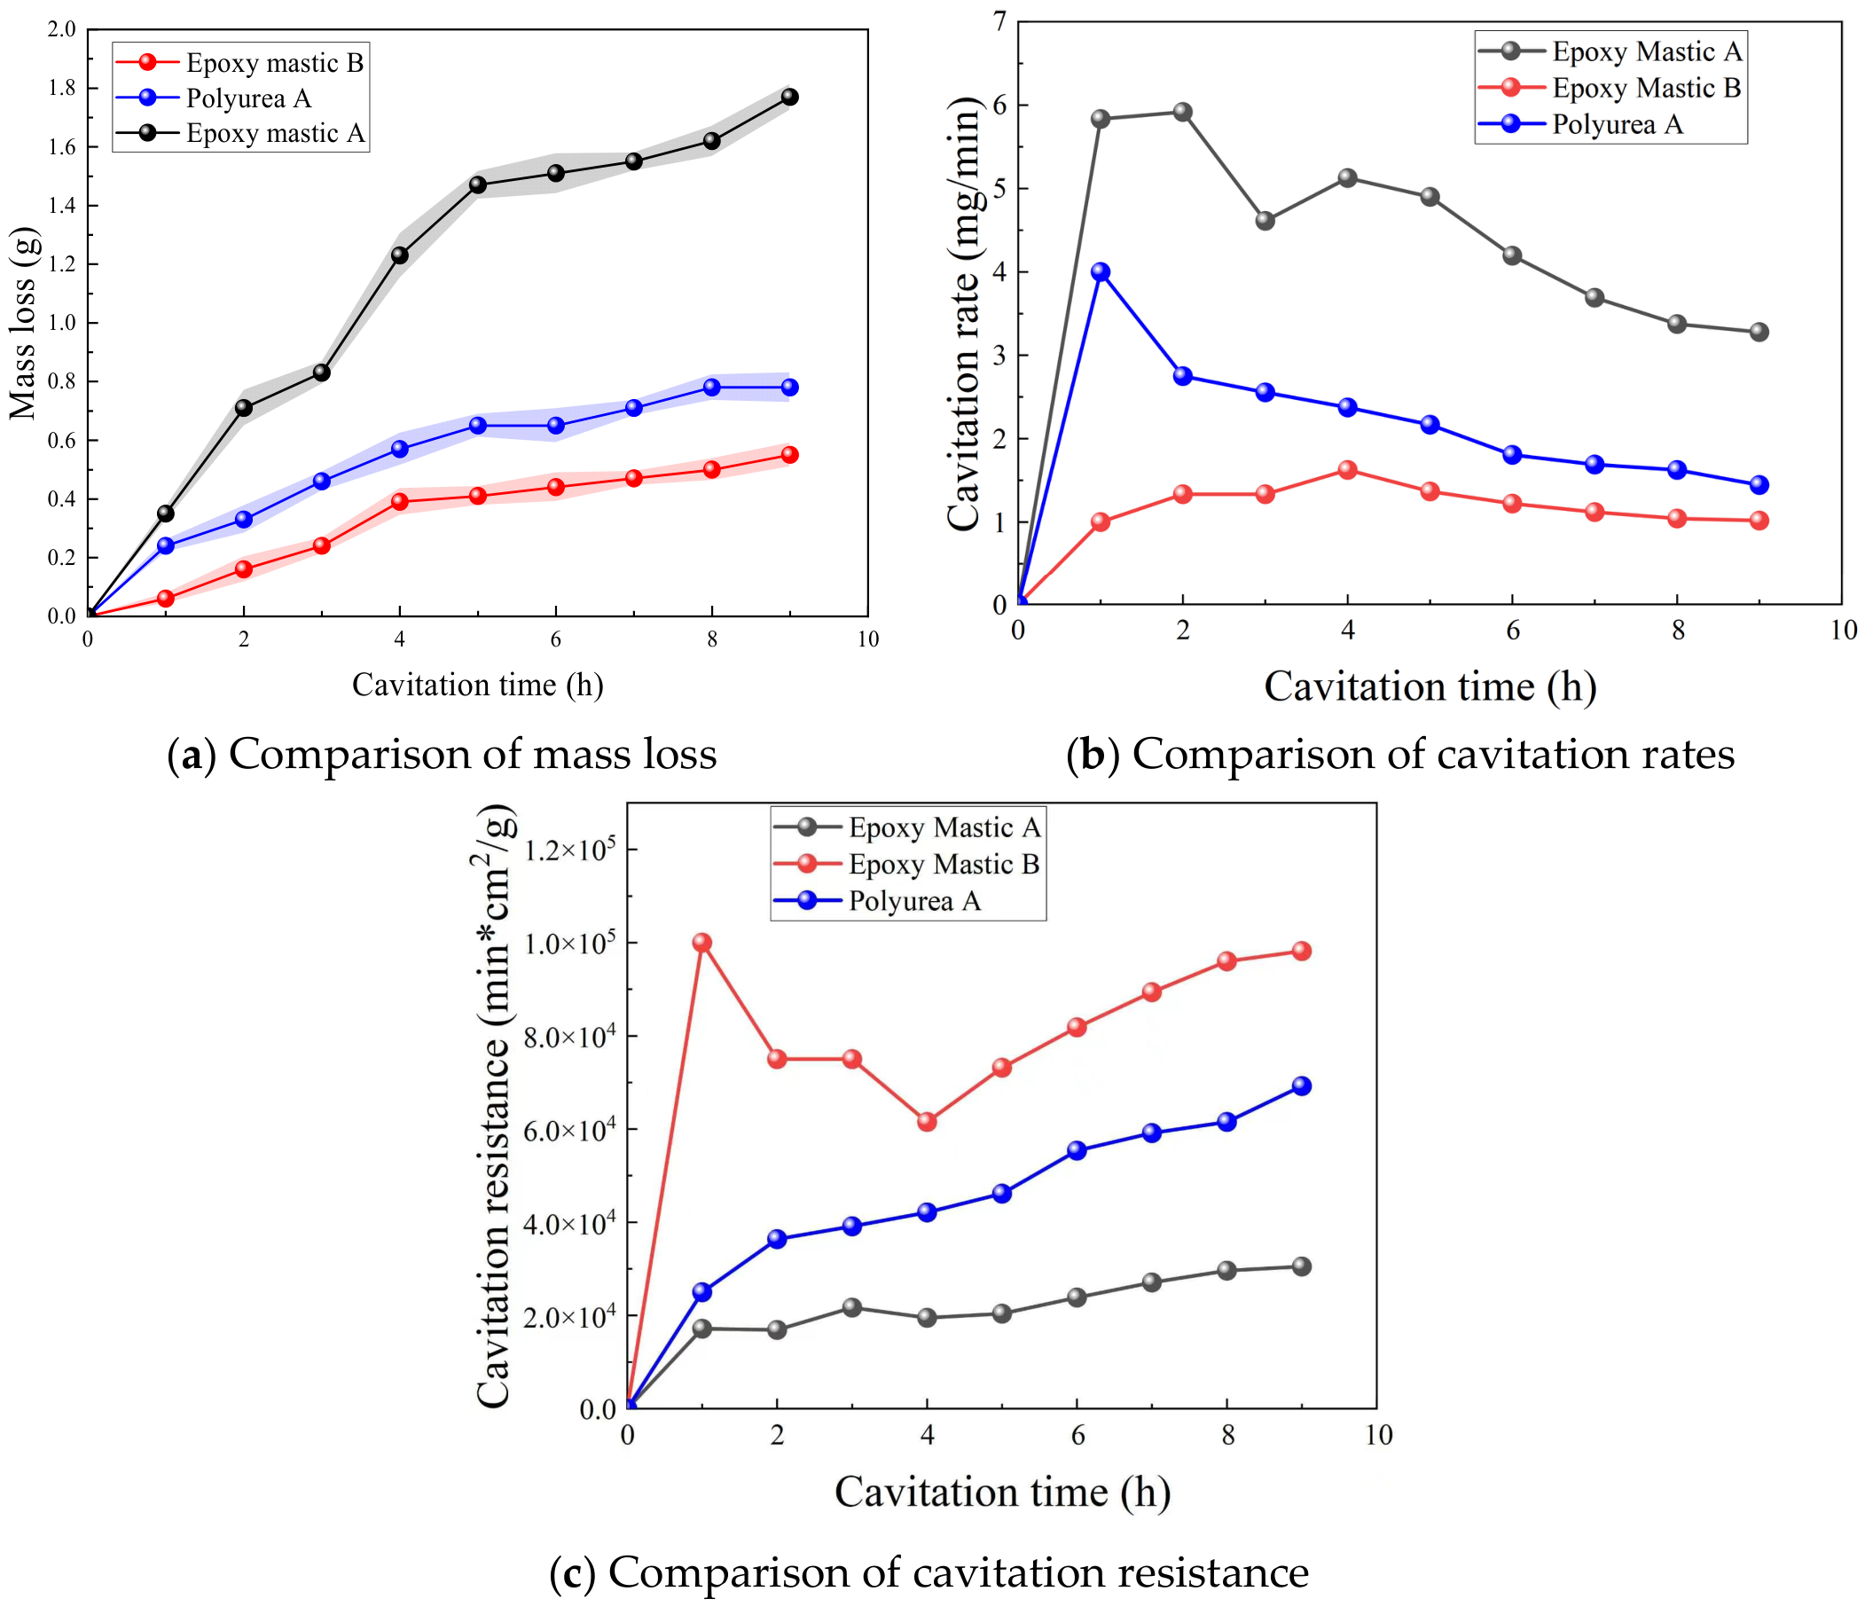
The cumulative mass loss curves from the tests are shown in Figure 15a. When combined with the macroscopic damage images, it can be seen that epoxy mastic A experienced a rapid and significant increase in mass loss due to large-scale flaking; epoxy mastic B exhibited a relatively gentle mass loss curve and lower cumulative mass loss because it showed only partial cracking and flaking; polyurea A’s cumulative mass loss fell between the two.
Figure 15.
Comparison of cavitation parameters for repair materials.
The cavitation rate development curve is shown in Figure 15b. Further analysis in conjunction with the macroscopic damage images reveals that, due to large-scale flaking, epoxy mastic A exhibited a high initial cavitation rate, with a high rate at 1 h that peaked at 2 h. Specifically, a significant amount of coating detached from the inner side of the structural joint at 1 h, followed by the detachment of a large area of coating at 2 h. After some slight fluctuations, the rate declined and stabilized, indicating that the cavitation rate of epoxy mastic A had gradually stabilized at this point, and its protective performance had also stabilized; for polyurea A, due to blistering, the cavitation rate peaked as early as 1 h and subsequently stabilized; epoxy mastic B exhibited better cavitation resistance; during the test, the coating experienced only partial cracking and spalling of the material, resulting in a lower cavitation rate that stabilized over time.
The cavitation resistance curves are shown in Figure 15c. Based on the macroscopic failure images, epoxy mastic B exhibited the highest cavitation resistance. Initial damage was minimal, with cavitation occurring primarily on the concrete surface until 3 h. After partial coating detachment at the 3 h mark, cavitation resistance decreased slightly but subsequently rose, indicating that the coating had stabilized and was gradually demonstrating its cavitation resistance; polyurea A exhibited low cavitation resistance in the early stages due to the bulging and detachment of cavities. As the test progressed, the cavities expanded, causing the cavitation resistance to rise continuously as the material gradually demonstrated its cavitation-resistant properties; epoxy mastic A, due to extensive detachment during the cavitation test, exhibited lower cavitation resistance than the other two materials, but its surface did not display typical cavitation damage characteristics.
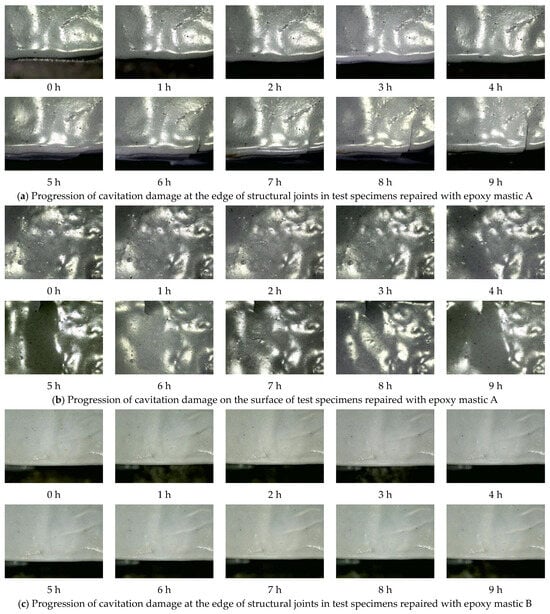
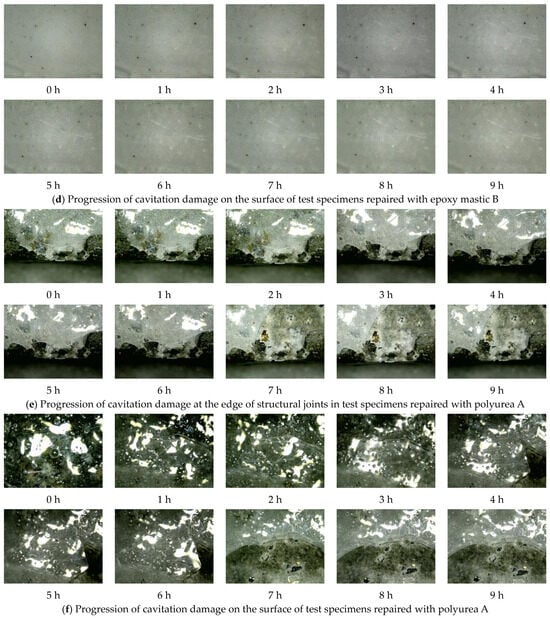
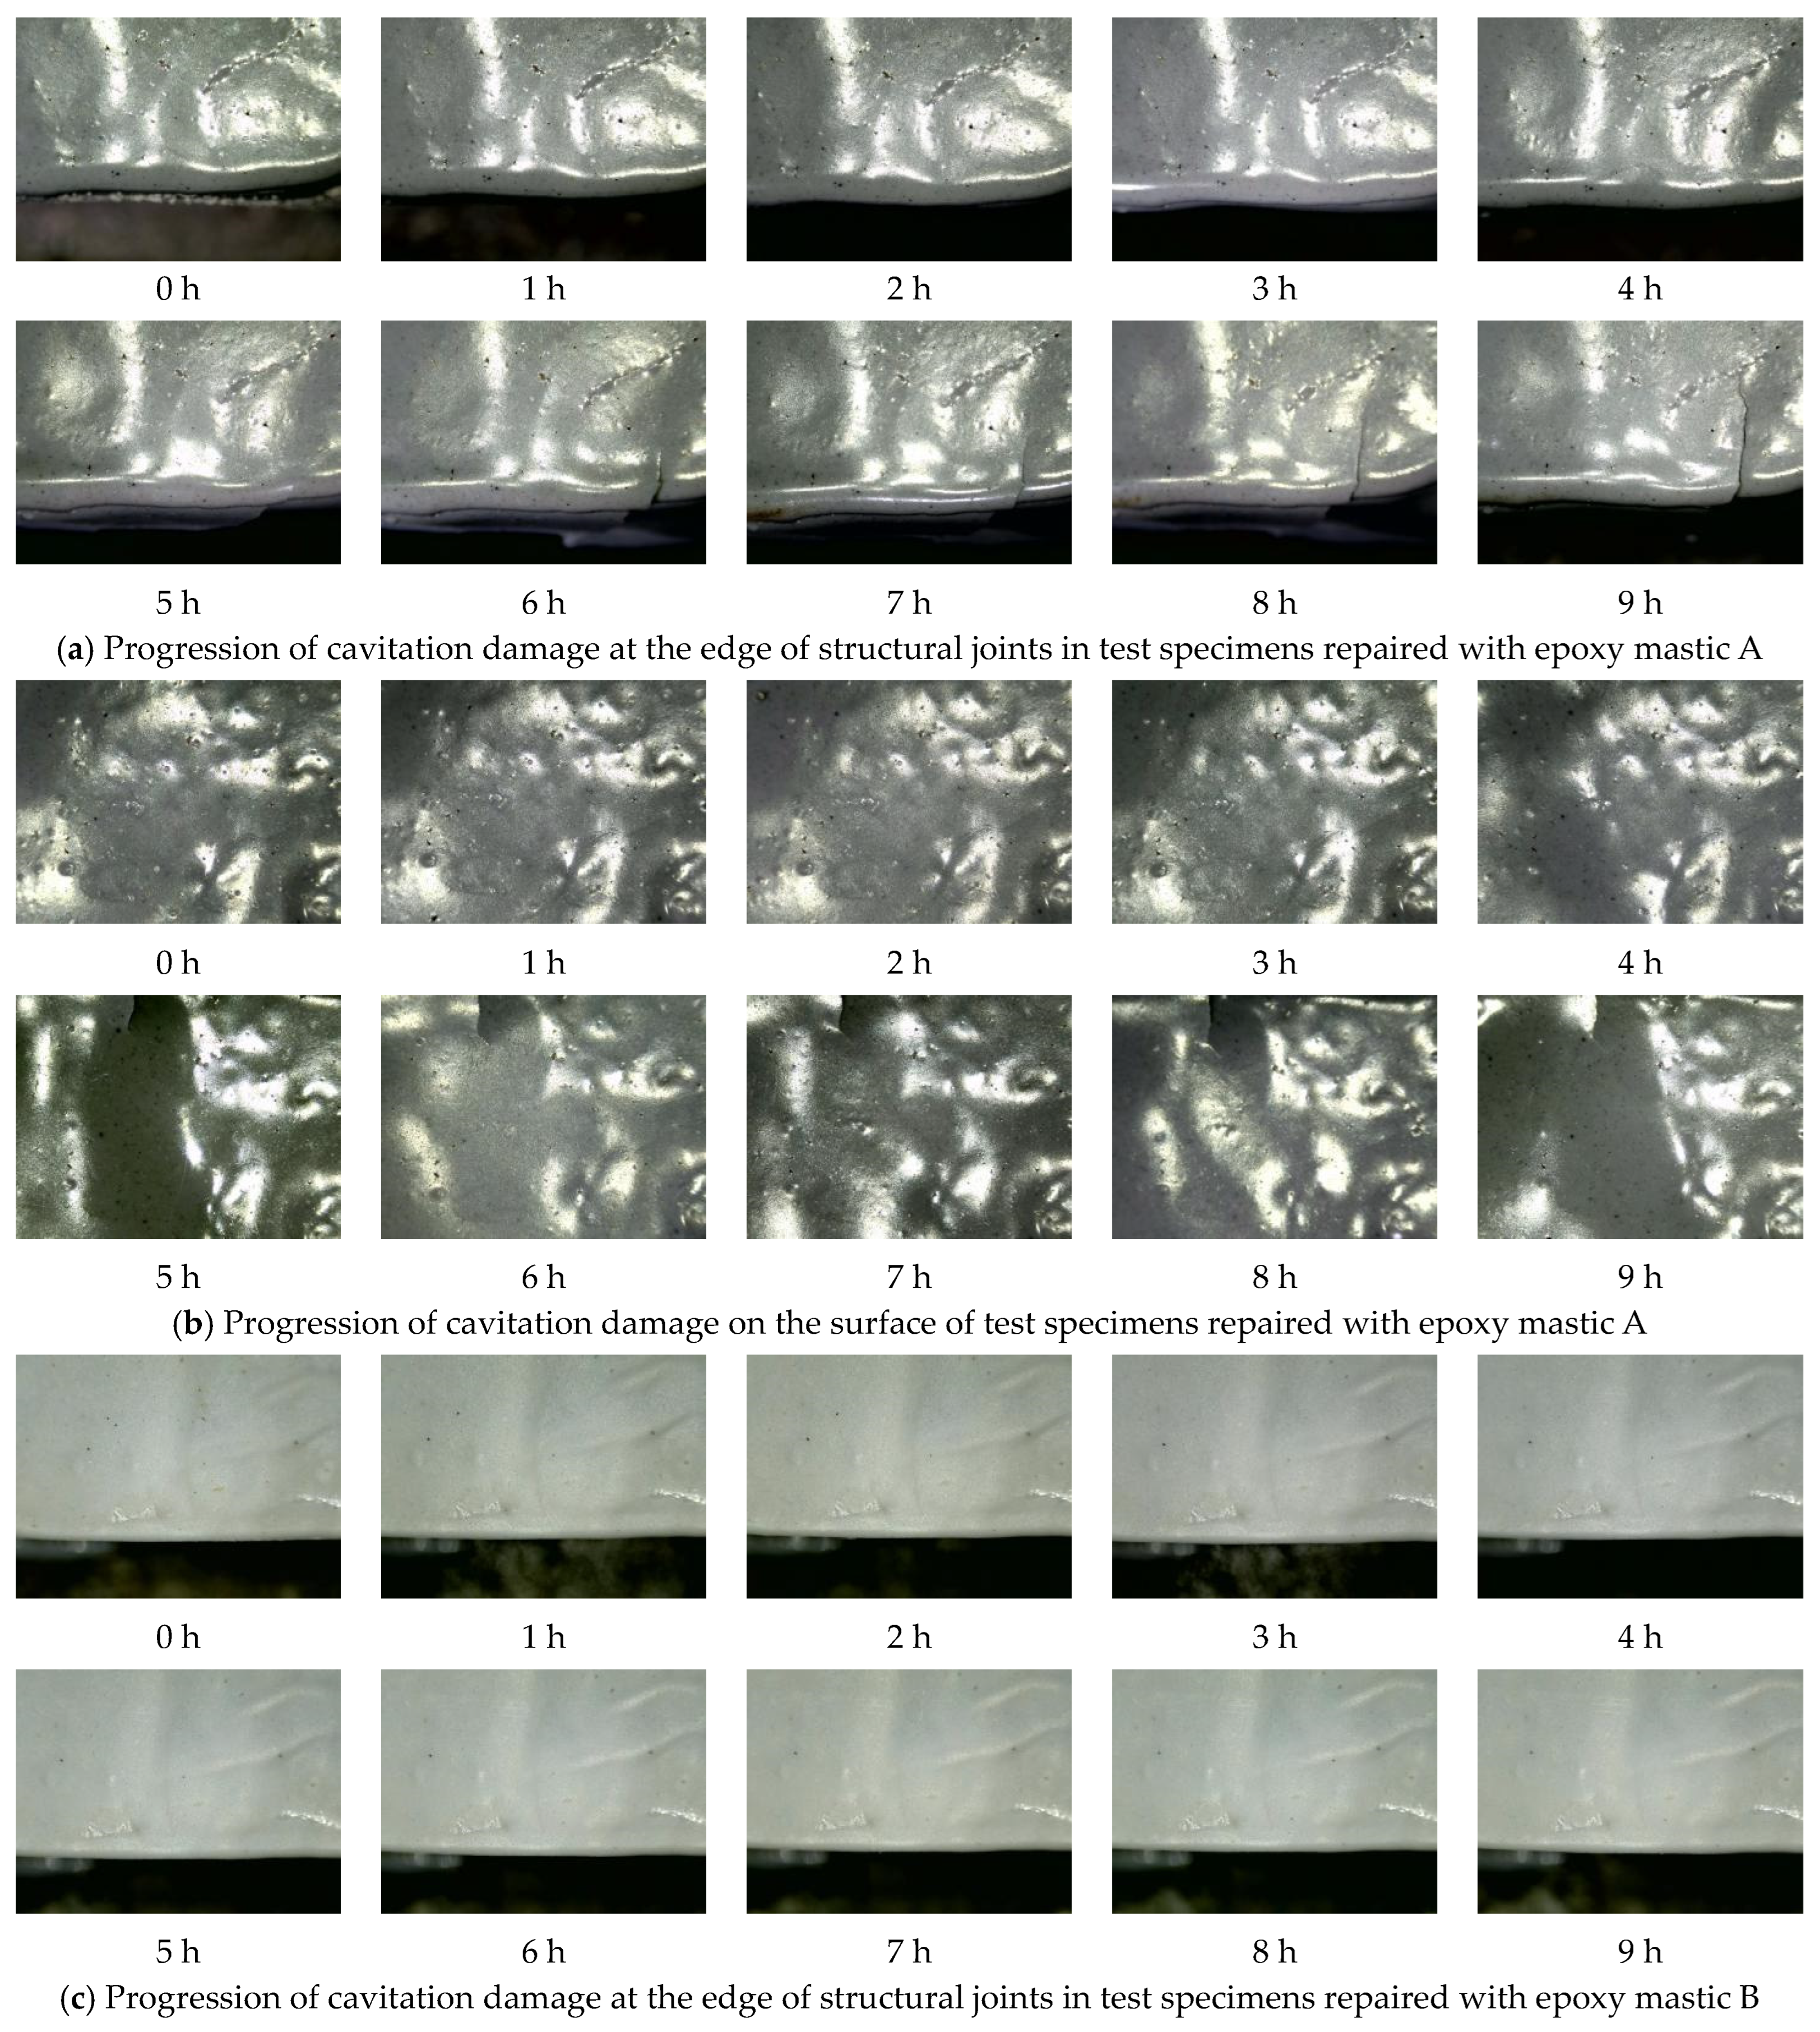
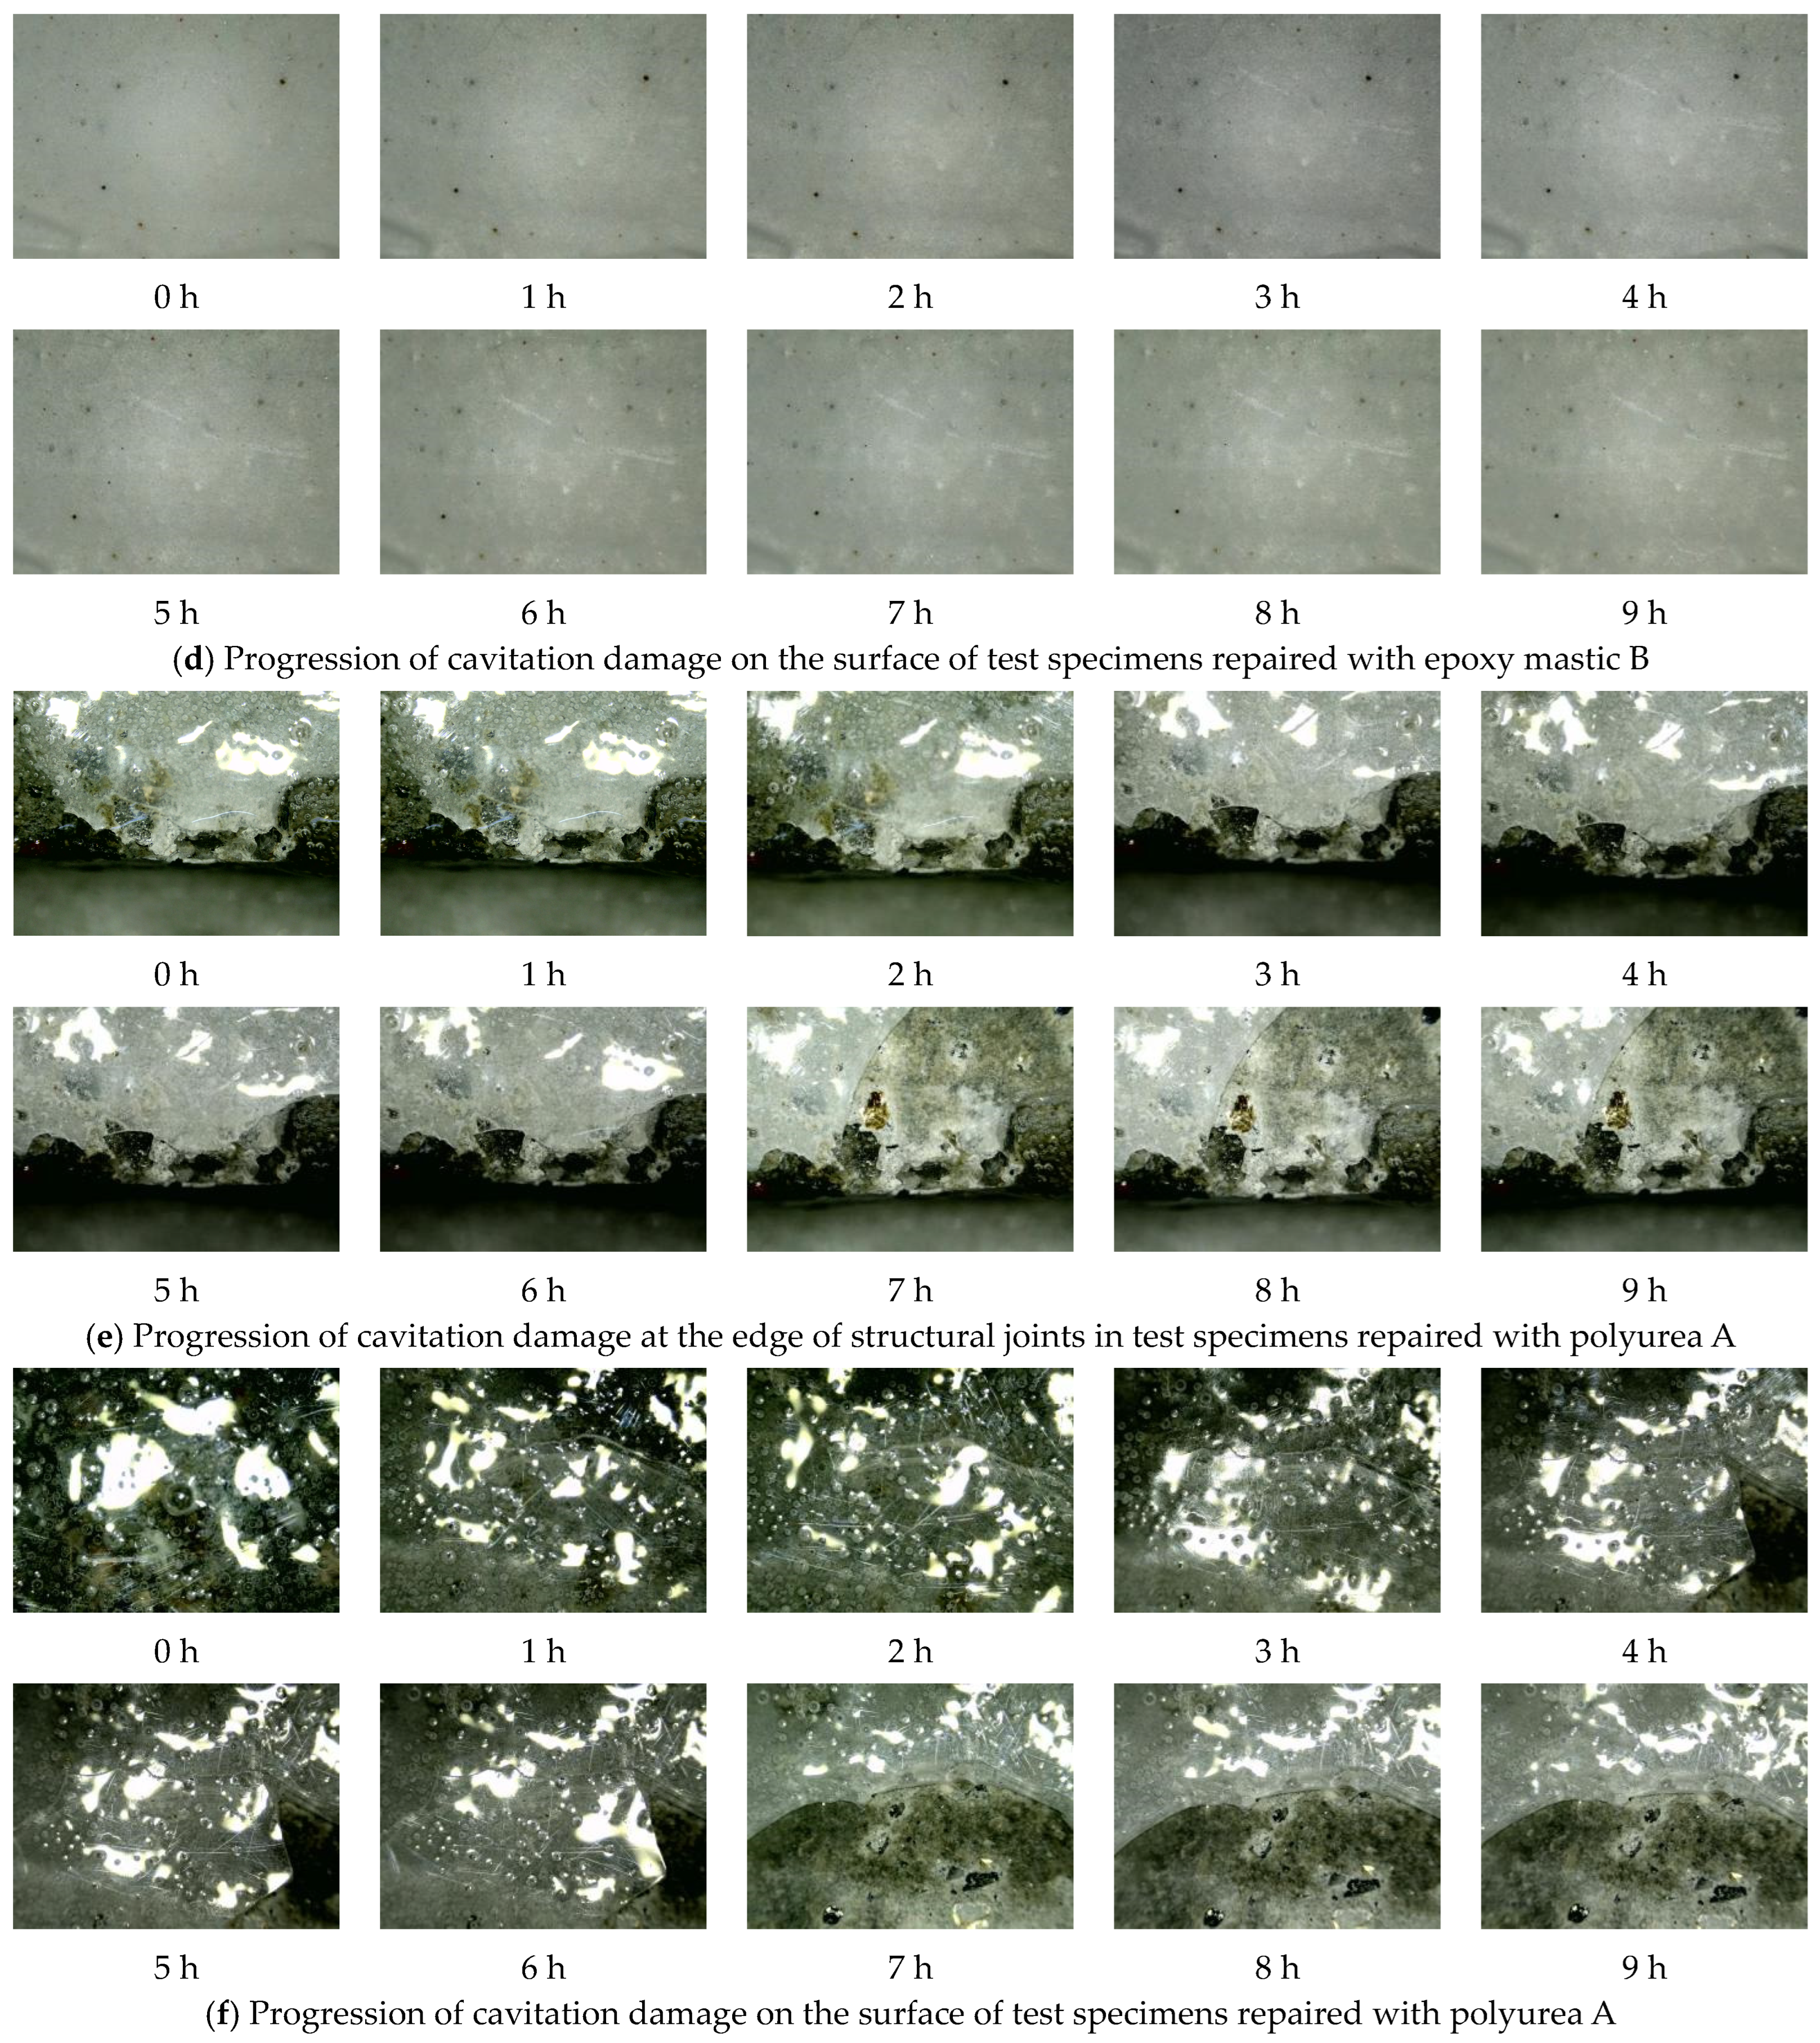
Figure 16 shows the microstructural damage development on the surfaces of the test specimens for the three repair materials after 9 h of hydraulic cavitation testing.
Figure 16.
Microscopic analysis of damage development in repair test specimens.
As shown in Figure 16, the epoxy mastic A repair layer did not exhibit significant pitting under cavitation; damage primarily manifested as localized fractures, crack propagation, and delamination caused by interfacial bond failure. At the beginning of the test, both the surface and the edges of the structural joints remained intact. After 5 h, cracks appeared at the edges of the structural joints and continued to propagate, but no significant cavitation damage was observed on the surface. Under cavitation, the epoxy mastic B repair layer showed no significant damage—whether at the joint edges or on the specimen surface—during the 9 h cavitation test. No obvious crack propagation, localized spalling, or typical cavitation pitting damage was observed, indicating that epoxy mastic B maintains surface integrity under cavitation. This also reflects its high cavitation resistance and strong adhesion to the underlying concrete substrate. Similarly, the surface of the epoxy mastic B repair specimen showed no obvious cavitation damage features; the surface remained relatively intact, with no noticeable fractures or spalling. Based on the macroscopic damage images and mass loss curves described above, it can be concluded that epoxy mastic B provides effective repair against cavitation damage, with a relatively slow progression of damage. This confirms the appropriateness of selecting this material as the repair material for this test. The polyurea A repair specimen showed no obvious initial damage at the start of the test, with a relatively smooth and intact surface. At 1 h, partial material spalling occurred; as the test progressed, polyurea A continued to fracture and spall. By 7 h, a large area of the coating had peeled off, with relatively regular fracture edges, exhibiting distinct characteristics of brittle failure. Furthermore, the areas adjacent to the cracks were more prone to becoming priority failure zones under cavitation loads. The failure of the polyurea A coating was primarily characterized by early cracking, crack propagation, and rapid detachment in the later stages. The bond performance between the polyurea A coating and the concrete substrate significantly influenced its cavitation resistance, indicating that its overall durability is notably dependent on the quality of the bond interface.
A comparative analysis of microstructural damage revealed that epoxy mastic B was relatively stable, with no significant damage observed in either the crack-edge coating or the surface coating; therefore, it provided the best repair performance. Epoxy mastic A exhibited fracturing and crack propagation at both the crack edges and the surface. Combined with macroscopic damage development, the failure of epoxy mastic A progressed through coating fracture followed by subsequent spalling; polyurea A primarily exhibited blistering, fracturing, and delamination in large patches. From a microscopic damage perspective, the cavitation resistance of the repair materials is closely related to their bond strength with concrete.
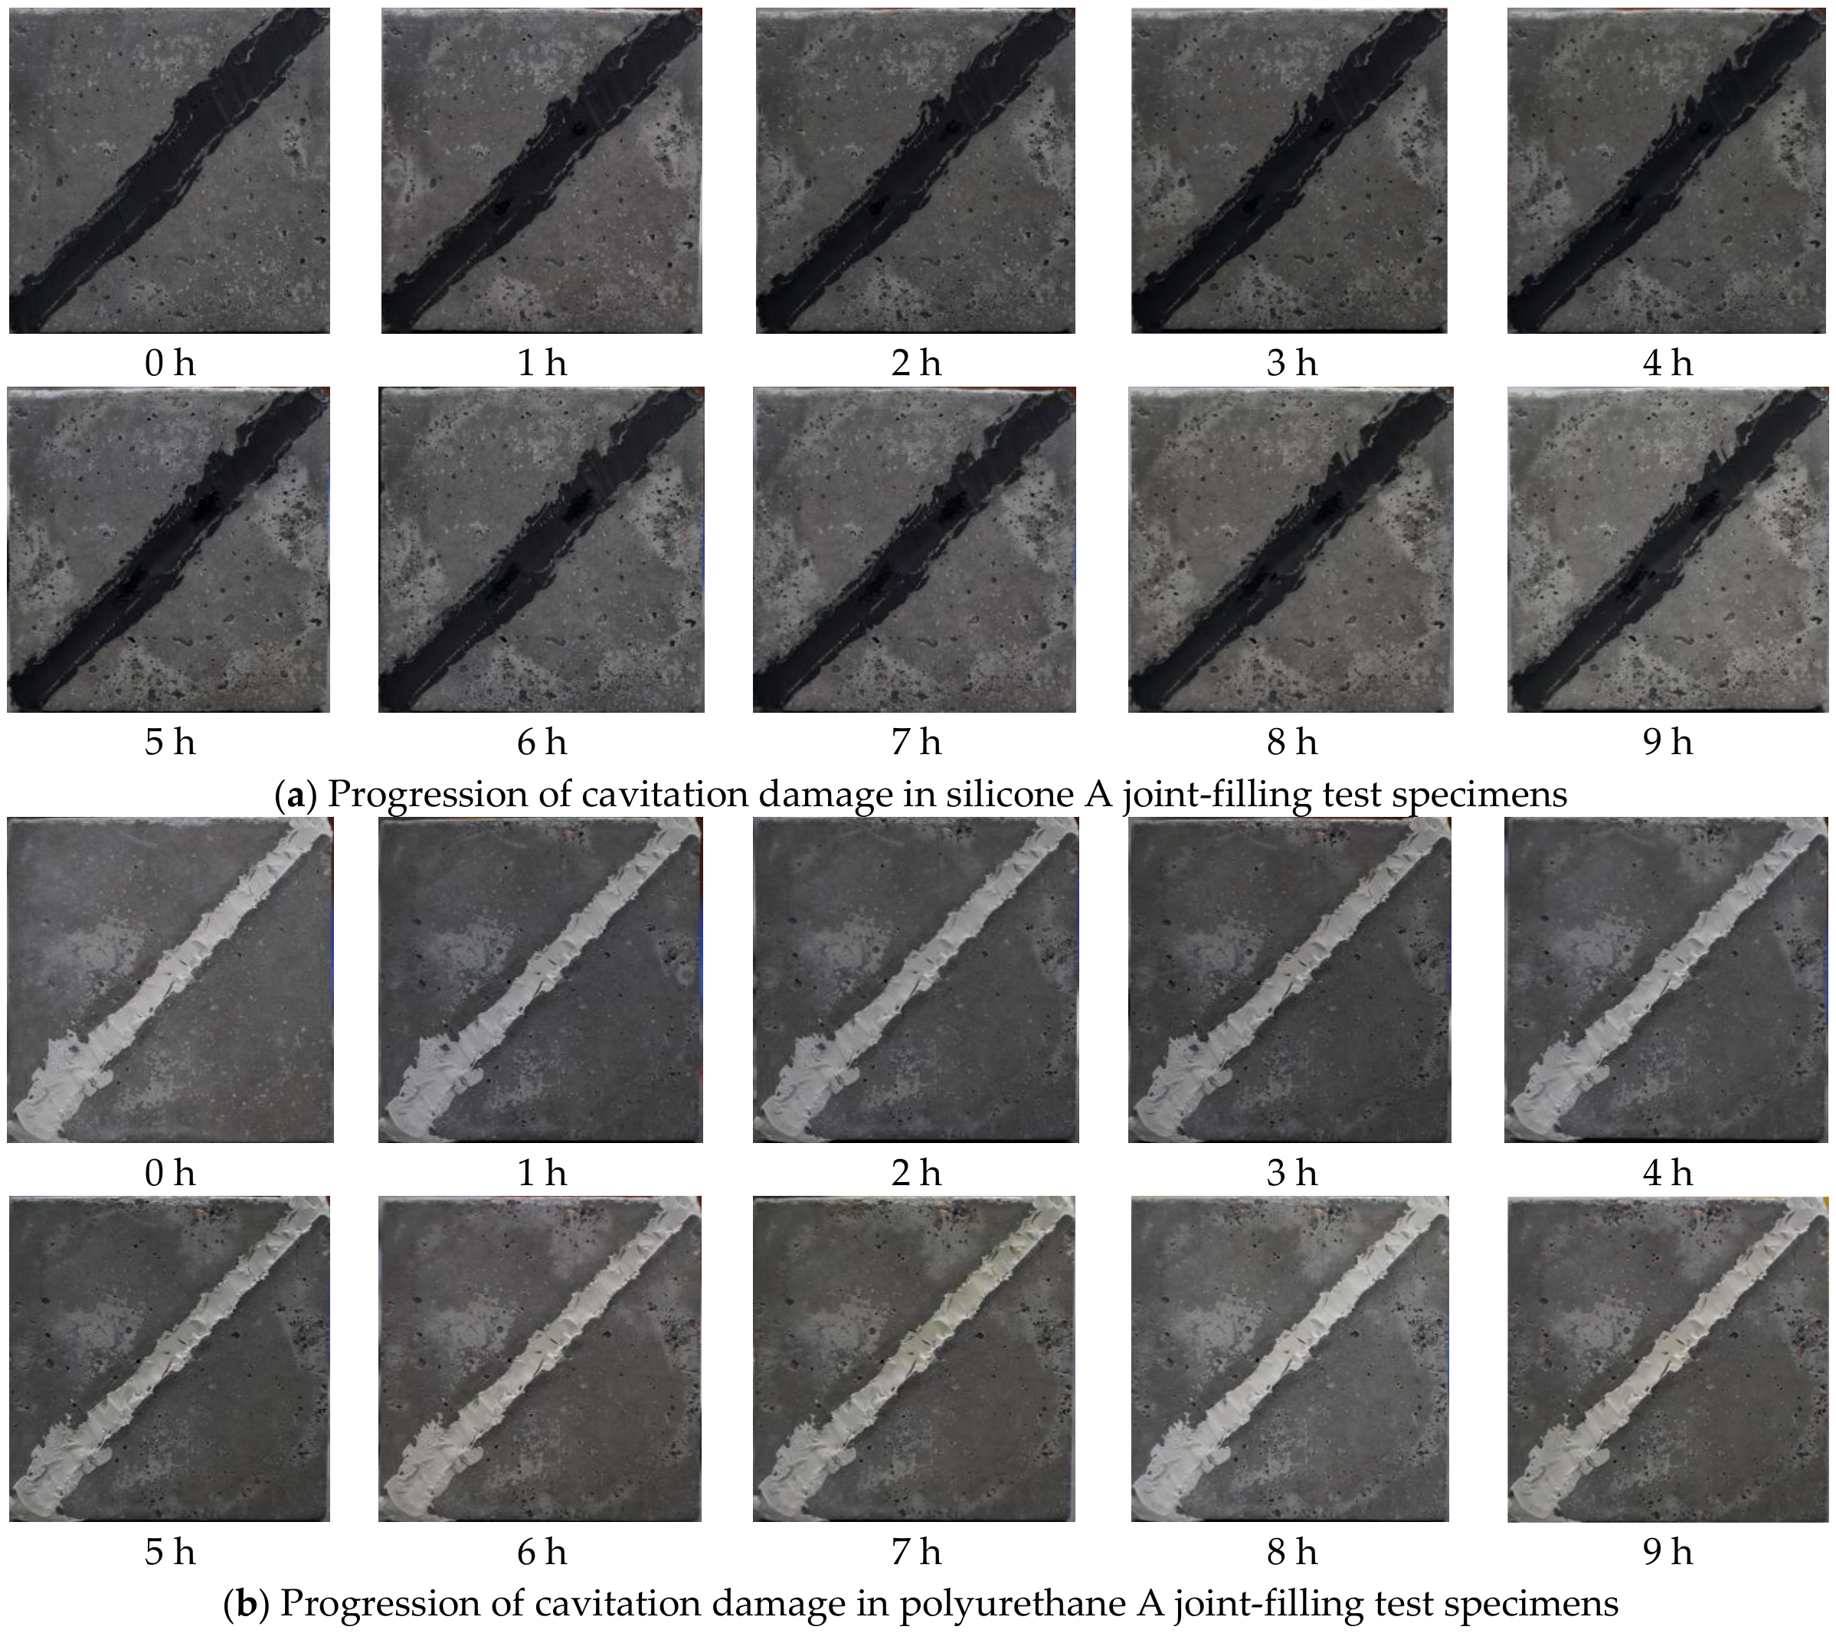
Figure 17 shows the macroscopic damage development on the specimen surfaces of the three joint-filling materials after 9 h of hydraulic cavitation testing.
Figure 17.
Development of cavitation damage in joint-filling test specimens.
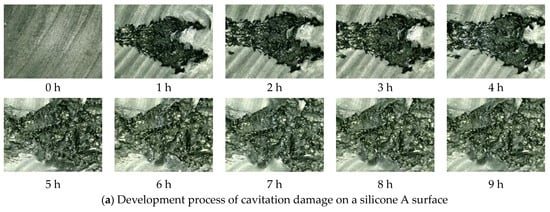
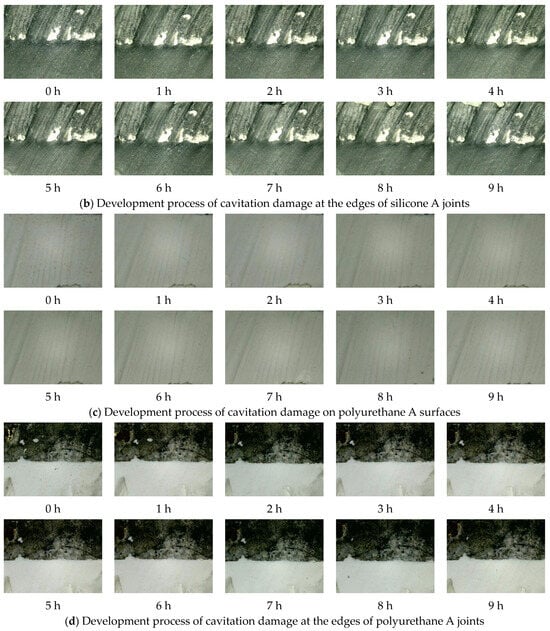
Figure 17a shows the evolution of cavitation damage in a structural joint-filling with silicone A. Prior to testing, the surface of Silicone A showed no initial damage. After 1 h, two pits appeared symmetrically, and at the same time, distinct annular cavitation damage became visible on the specimen’s surface. As the test progressed, the annular cavitation area became increasingly pronounced, but no significant failure was observed in the structural joint. Figure 17b shows the evolution of cavitation damage in a structural joint filled with polyurethane A. Prior to testing, the surface of polyurethane A showed no initial damage. After 1 h, a ring-shaped cavitation area appeared on the concrete surface of the specimen, and as the test continued, this cavitation area became more pronounced. After 9 h of testing, the surface of polyurethane A showed no obvious signs of damage; there was no pitting, cracking, or overall spalling, indicating that it maintained good integrity under cavitation. Macroscopic changes in the specimen with polyurethane A joint filling were primarily manifested as annular cavitation damage in the concrete surrounding the joint-filling material; damage to the joint-filling material itself was not significant, and no obvious signs of cavitation damage were observed in the structural joint. After 9 h of cavitation testing, no obvious cavitation damage was observed on the surface of the joint filler, and no significant cavitation damage was observed in the structural joint area.
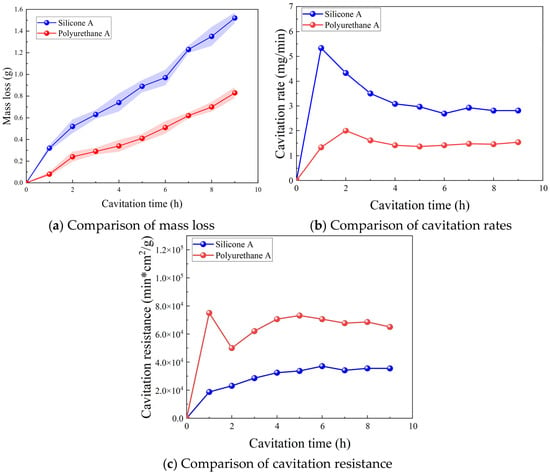
After a 9 h cavitation test, the cumulative mass losses of silicone A and polyurethane A were 1.52 g and 0.83 g, respectively. The test results indicate that, under the same cavitation conditions, there is a significant difference in mass loss between these two joint-filling materials. Polyurethane A exhibited a smaller cumulative mass loss, indicating minimal erosion during the test and good overall stability; silicone A, on the other hand, exhibited a significantly larger cumulative mass loss. Based on the cumulative mass loss metric, both joint sealants demonstrated good cavitation resistance.
As shown in Figure 18a, this figure plots the cumulative mass loss curves. The mass loss curve for Polyurethane A is relatively stable, with small mass losses at each time point; the mass loss for Silicone A is greater than that of Polyurethane A. Based on the mass loss curves, both sealing materials exhibit good cavitation resistance.
Figure 18.
Comparison of cavitation parameters for joint-filling materials.
As shown in the cavitation rate curve in Figure 18b, Silicone A reached its peak cavitation rate at 1 h, at 5.5 mg/min; subsequently, the cavitation rate gradually decreased, and the curve leveled off. Polyurethane A reached its peak cavitation rate at 2 h, though the peak was relatively low at 2 mg/min, and the cavitation rate curve soon leveled off.
Figure 18c shows the cavitation resistance curves. During the 9 h test, the cavitation resistance of silicone A fluctuated around 35,000 min∙cm2/g, and the overall curves were relatively stable. This indicates that the cavitation resistance of these sealant materials varied relatively little under cavitation, and the progression of material damage was relatively uniform, with no obvious abrupt changes observed. In contrast, the cavitation resistance of polyurethane A peaked at 1 h, reaching nearly 80,000 min∙cm2/g—significantly higher than silicone A—indicating strong cavitation resistance in the early stages of the test. Subsequently, as the test duration increased, its cavitation resistance declined to some extent before gradually leveling off and eventually entering a relatively stable phase.
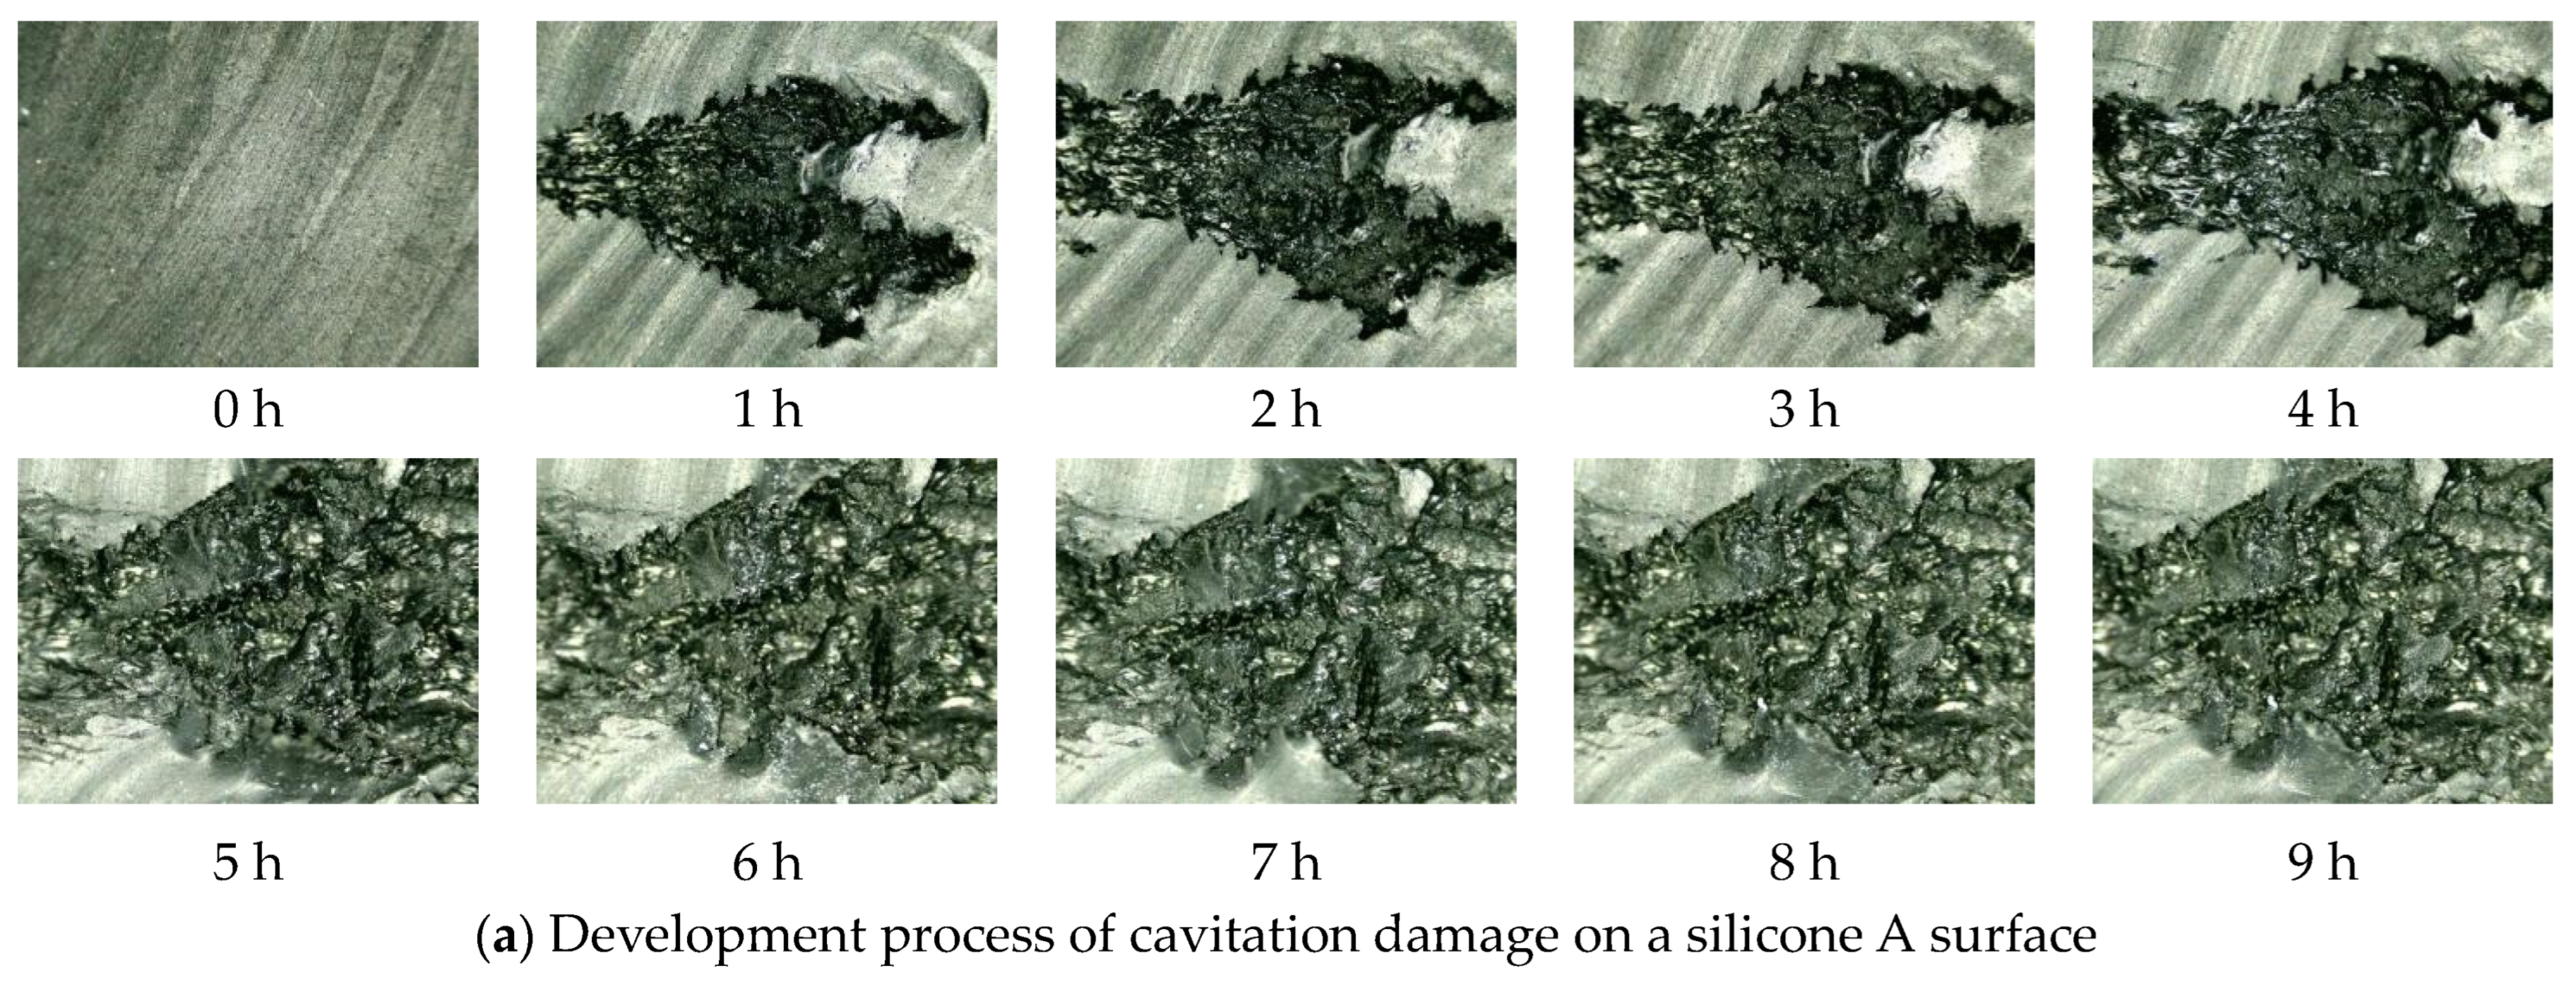
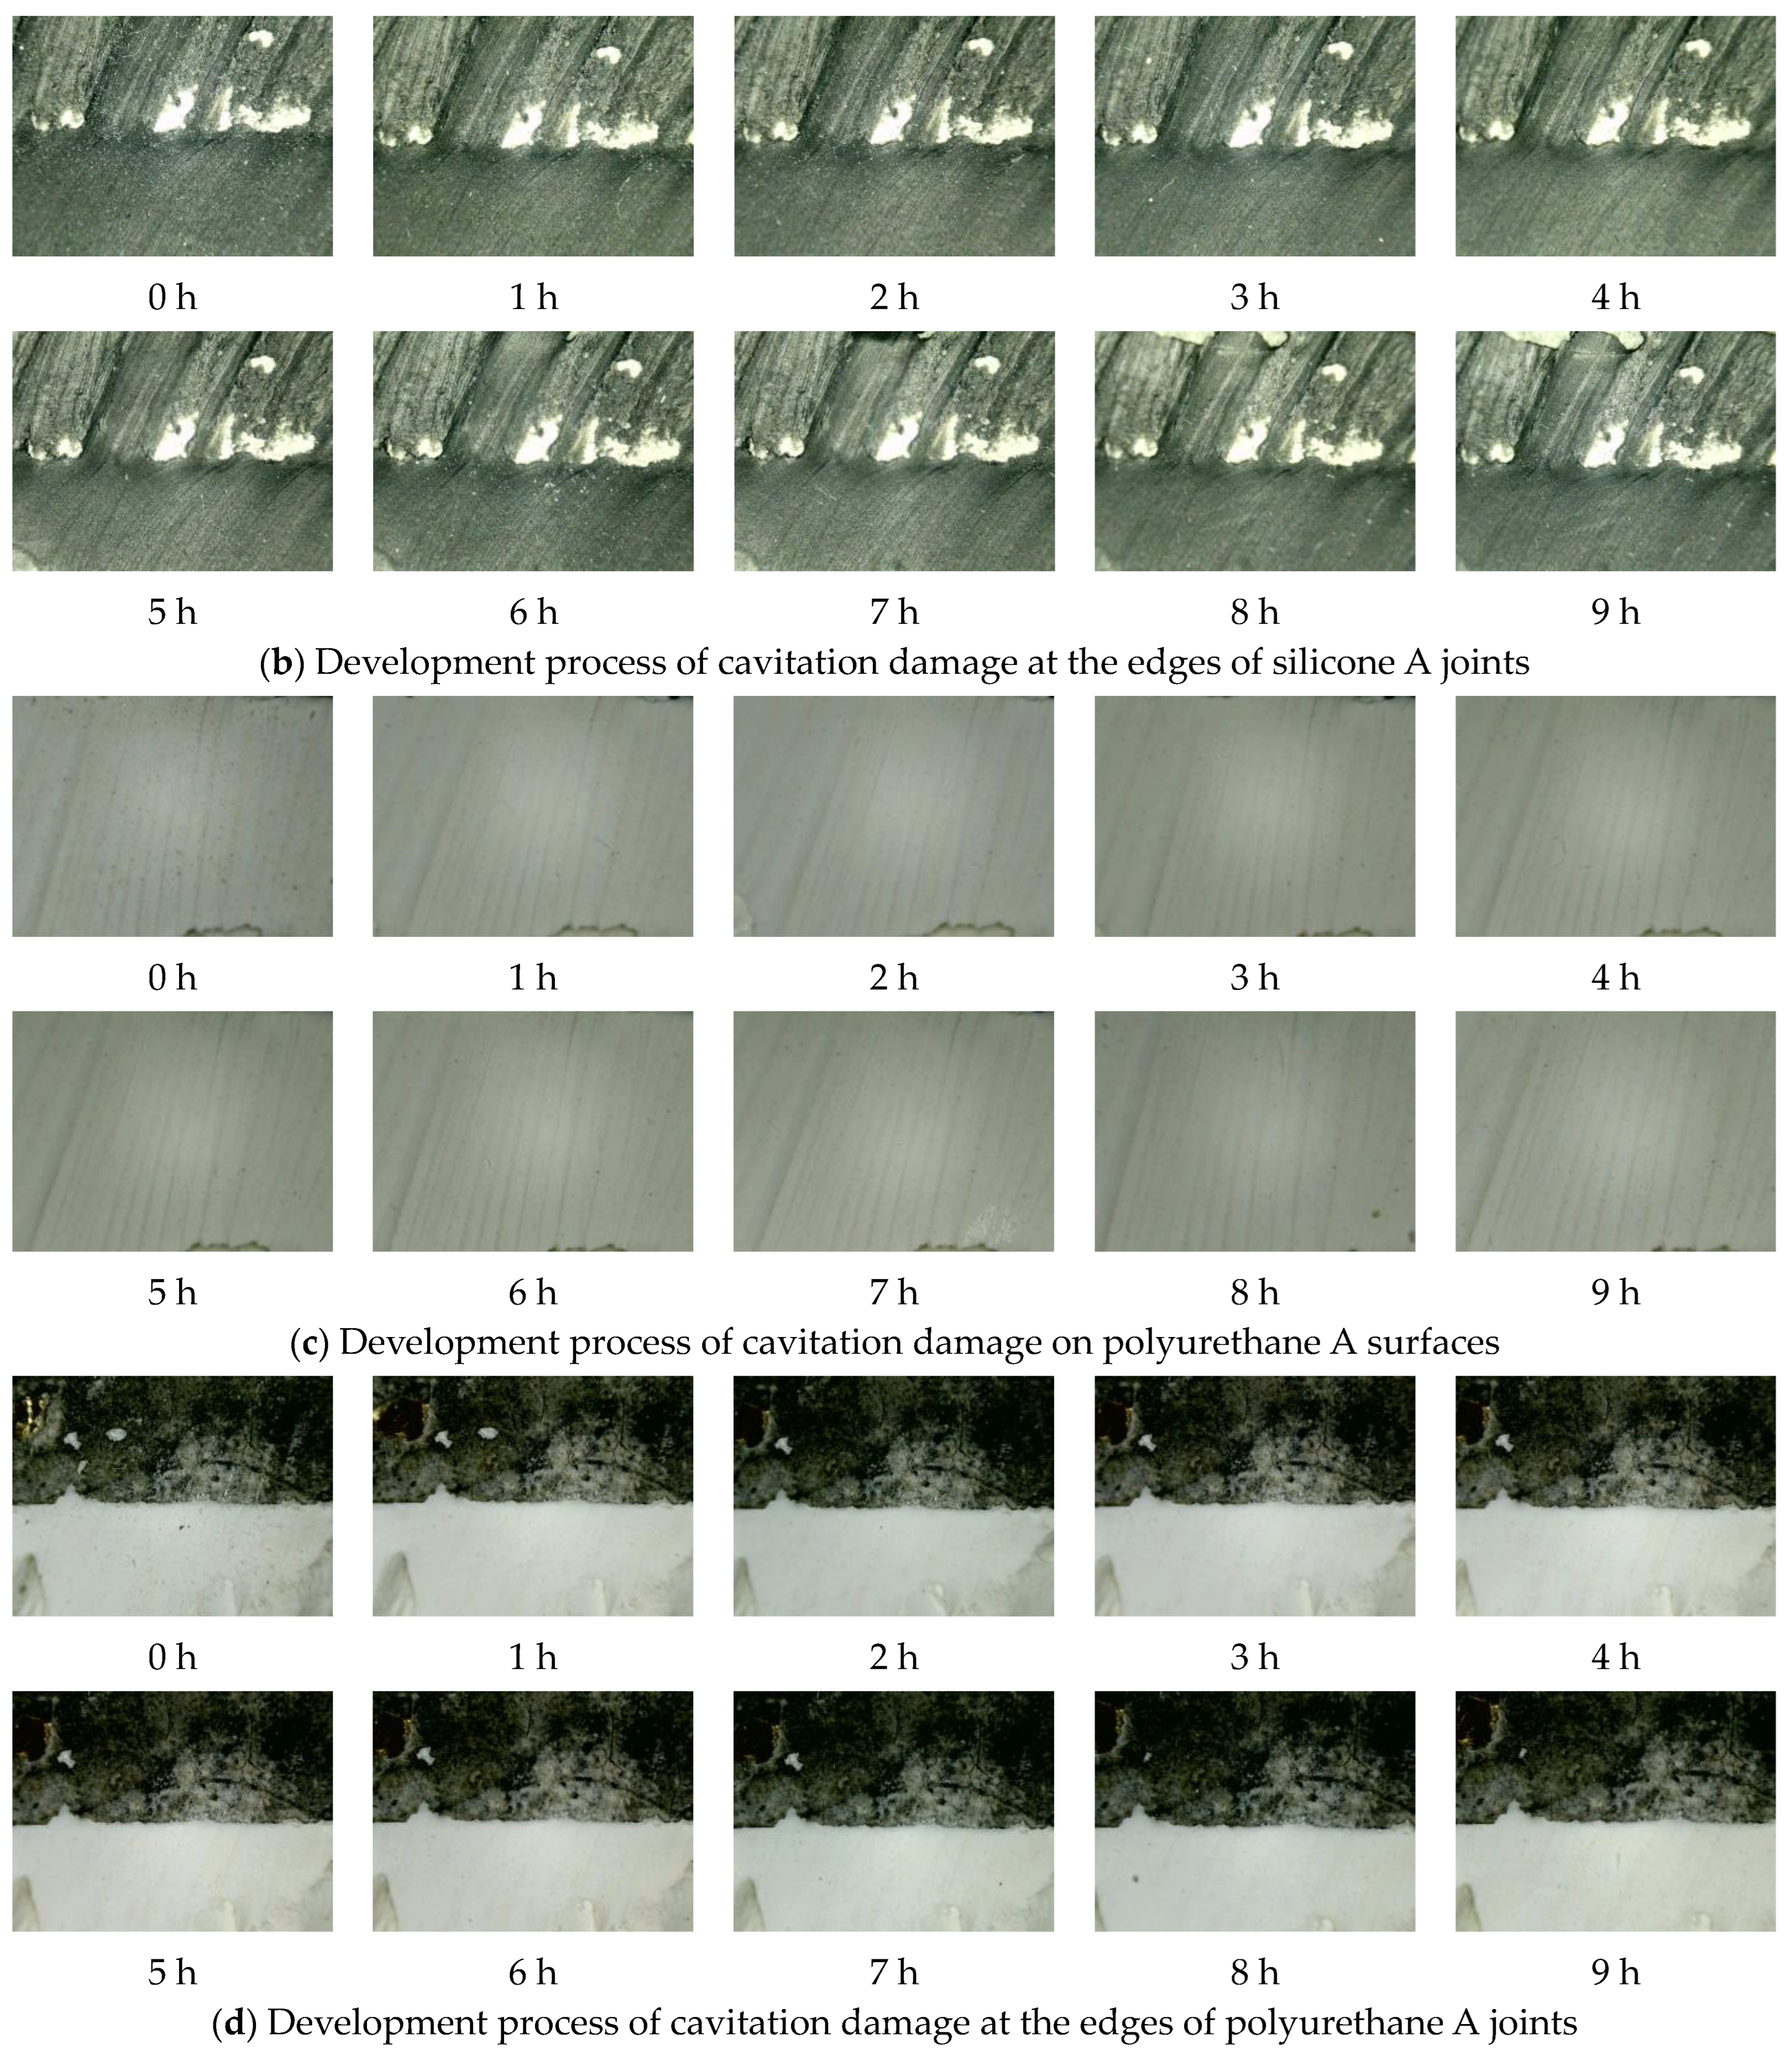
Figure 19 shows the evolution of cavitation damage on the specimen surface as observed under a 750× optical microscope.
Figure 19.
Microscopic analysis of damage development in joint-filling test specimens.
As shown in Figure 19a, neither the test specimens nor the joint sealant exhibited any initial damage prior to the start of the test. After 1 h of testing, cavitation damage appeared in Silicone A located within the structural joint. As the test progressed, the cavitation pits continued to expand, reaching their maximum size at 5 h, after which no significant changes were observed. As shown in Figure 19b, after 9 h of testing, the surface of Silicone A at the joint edges showed no obvious signs of cavitation damage. Figure 19c,d illustrate the progression of cavitation damage in the Polyurethane A joint sealant test specimens. After a 9 h cavitation test, no significant changes were observed on the surface of Polyurethane A or at the joint edges. Based on the development of cavitation characteristics on the concrete surface of the test specimens, apart from the pits appearing on the surface of Silicone A, no obvious damage features were observed on the surface of Polyurethane A or at the interface between the material and the concrete.
3.3. Adhesion Properties Pull-Out Test
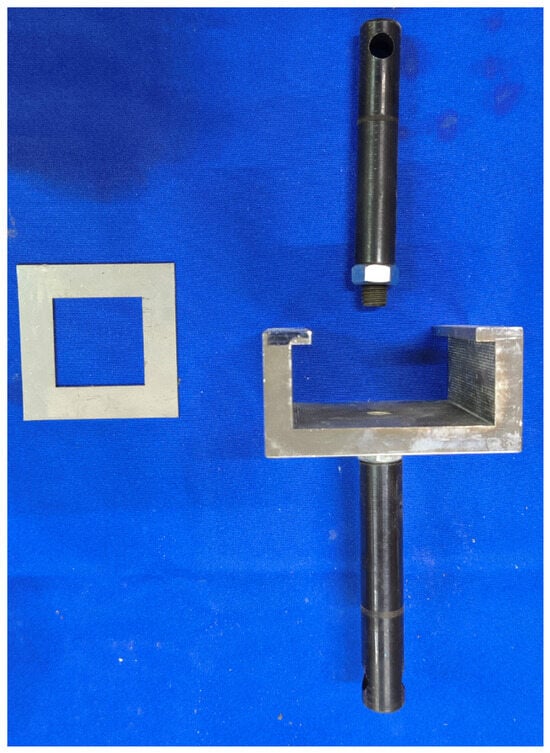
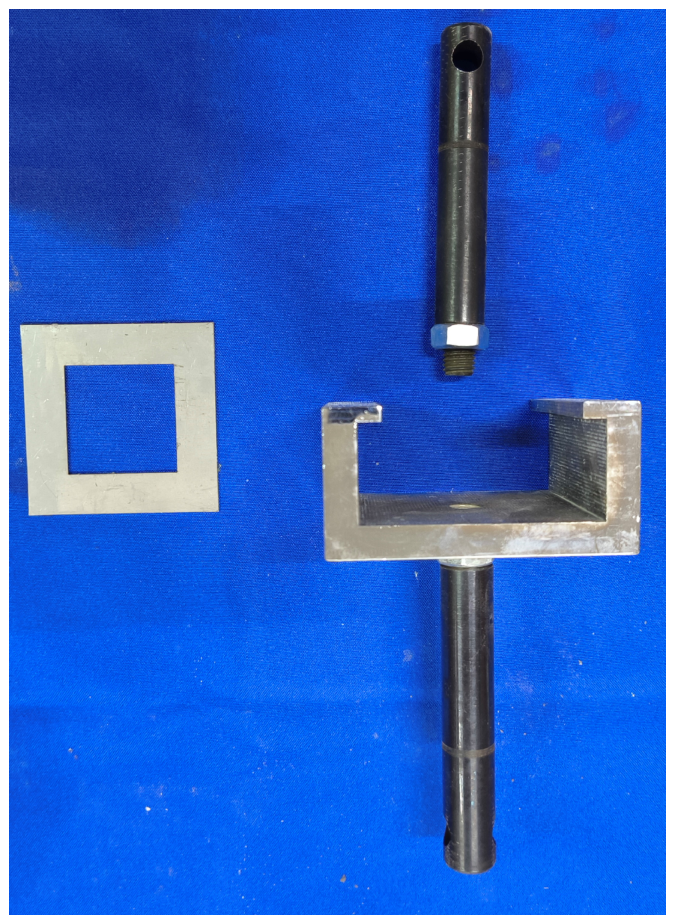
The dimensions of the base concrete used in the bond pull-out test were 70 mm × 70 mm × 20 mm, and those of the cavitation-resistant material were 40 mm × 40 mm × 10 mm. The test materials consisted of the three surface repair materials mentioned above, and the strength of the base concrete was consistent with that of the hydraulic cavitation test specimens. The test fixture used is shown in Figure 20 and consists of an upper connecting rod, a clamp, and shims.
Figure 20.
Test fixtures.
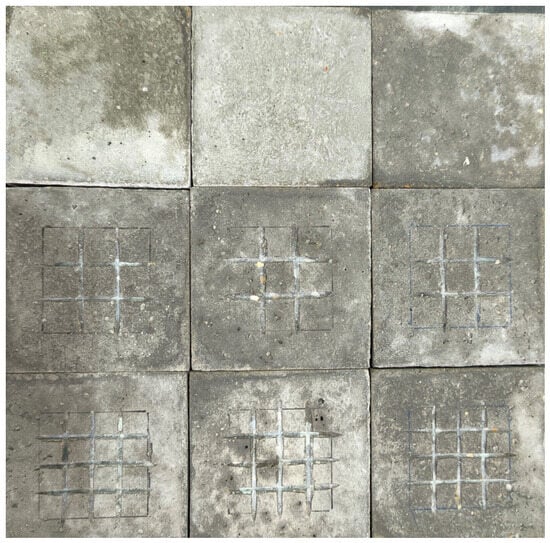
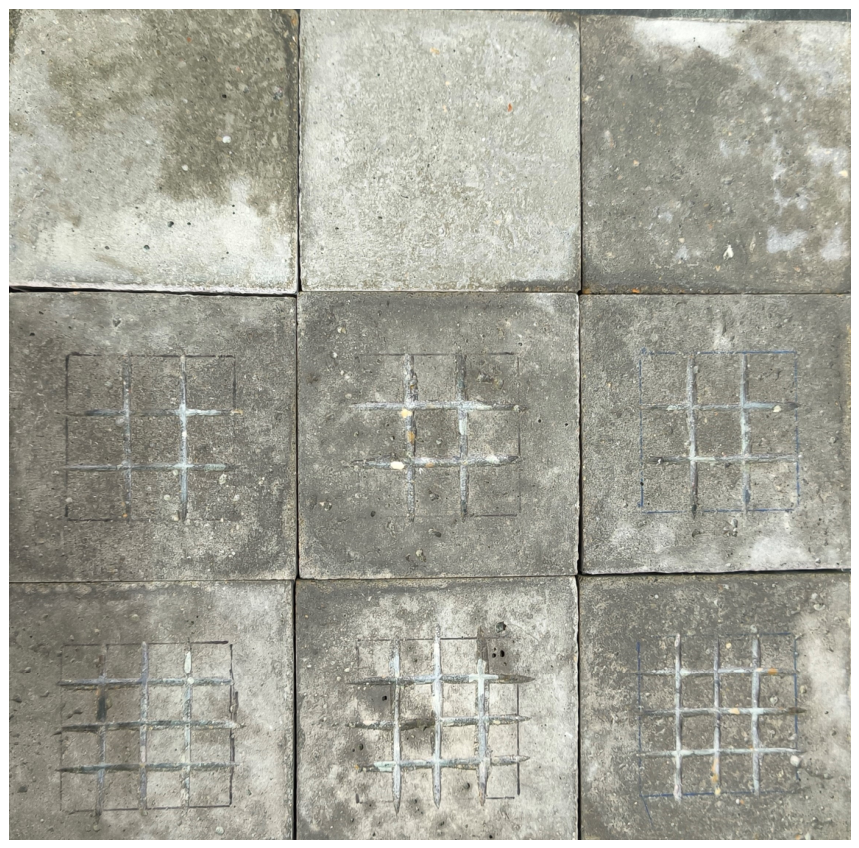
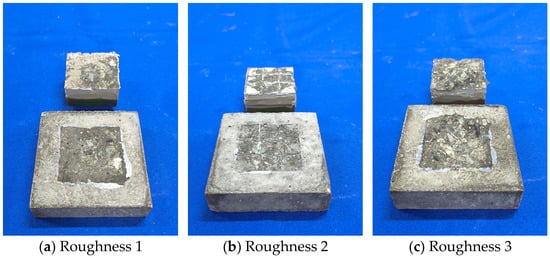
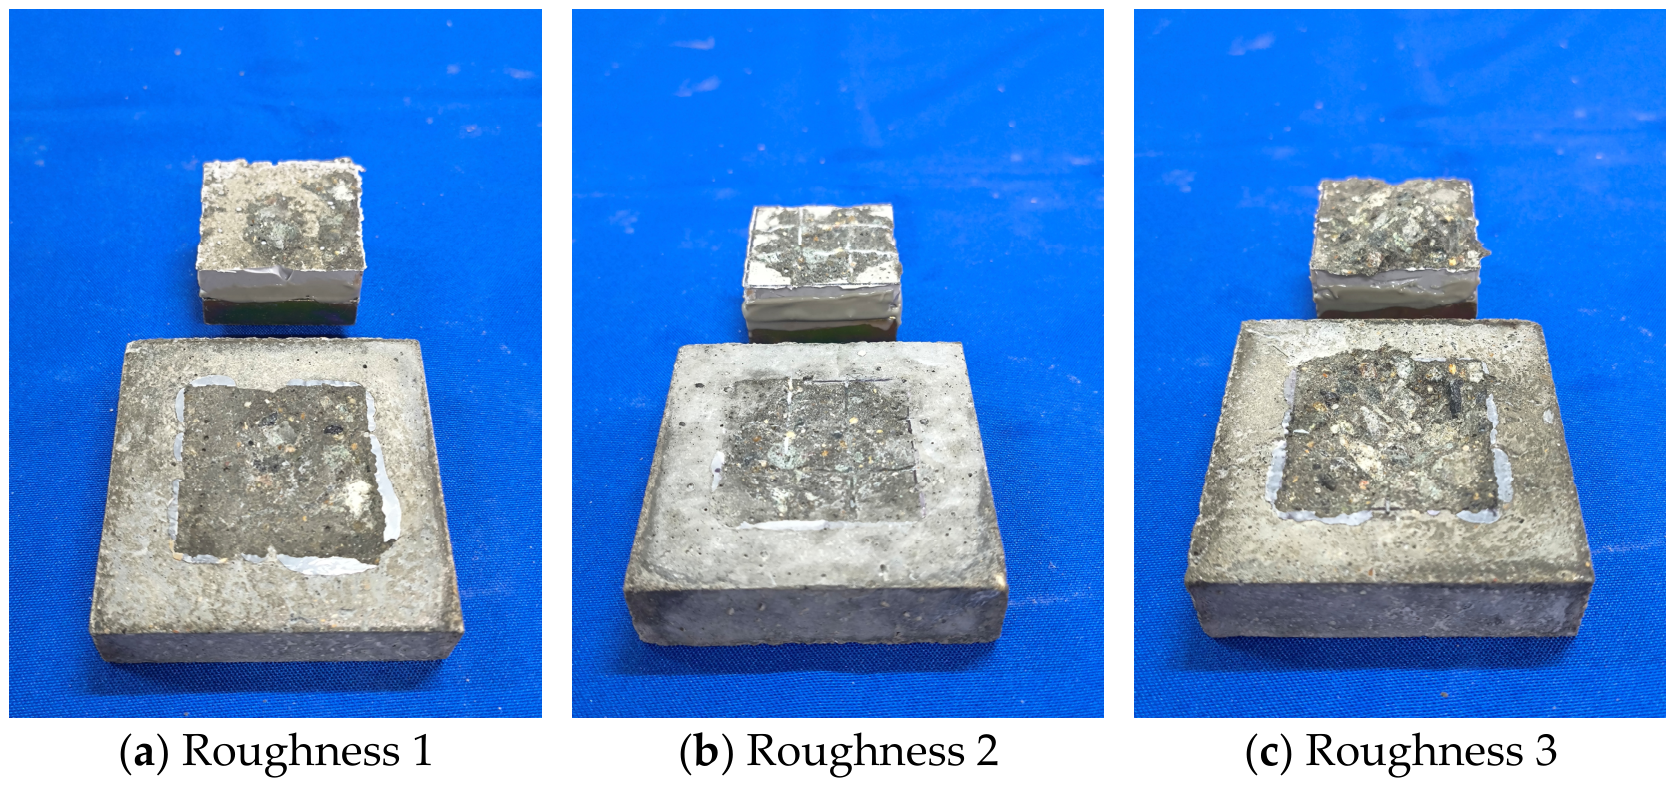
The surface of the base concrete must be ground to ensure that all test specimens are in the same initial condition. Roughness was created through cutting and roughening to produce three types of base concrete surfaces: untreated (Roughness 1), 9-grid (Roughness 2), and 16-grid (Roughness 3), as shown in Figure 21. To minimize the impact on the test results, the cutting depth on the specimen surfaces must be controlled. A digital depth gauge was used to measure the depth at nine points on each specimen, with a depth of 1.5 mm. Figure 22 shows the bond between the material and the metal pull-out bolt block after demolding; the metal pull-out block was bonded to the specimen using high-strength structural adhesive.
Figure 21.
Creating roughness.
Figure 22.
Bonding of repair material during pouring and to metal anchor blocks.
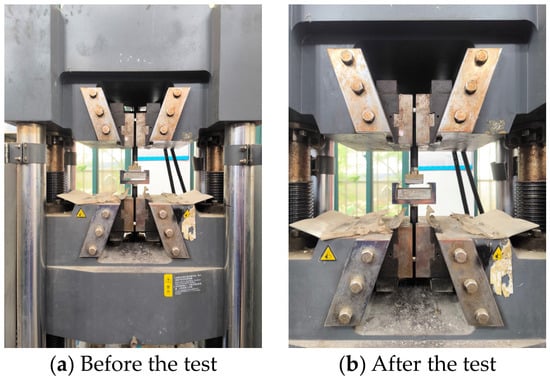
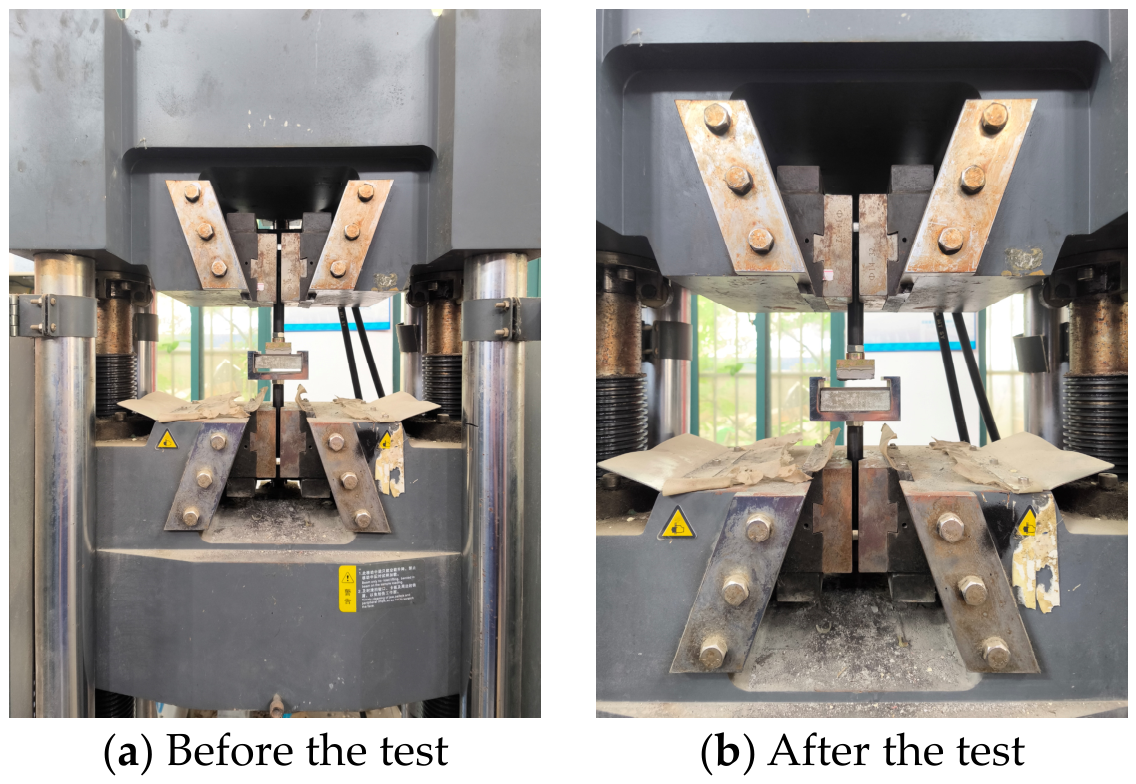
Figure 23 shows photographs of the test specimens before and after the adhesive pull-out test. An electronic universal testing machine was used as the testing apparatus. The test conditions are shown in Table 3.
Figure 23.
Comparison of pull-off tests on a universal testing machine before and after the test.
Table 3.
Adhesion pull-out test conditions.
The adhesive strength results for epoxy mastic A, epoxy mastic B, and polyurea A are shown in Table 4. As can be seen, the adhesive strength ranks as follows: epoxy mastic B > epoxy mastic A > polyurea A. The results of pull-off tests on specimens with different surface roughness levels are shown in Table 5. It can be seen that adhesive strength increases with increasing surface roughness and that surface roughness has a significant effect on adhesive strength.
Table 4.
Adhesive strength of different restorative materials.
Table 5.
The effect of surface roughness on adhesive strength.
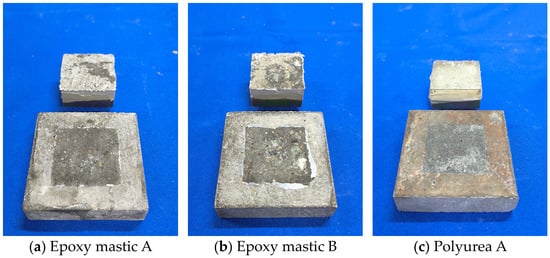
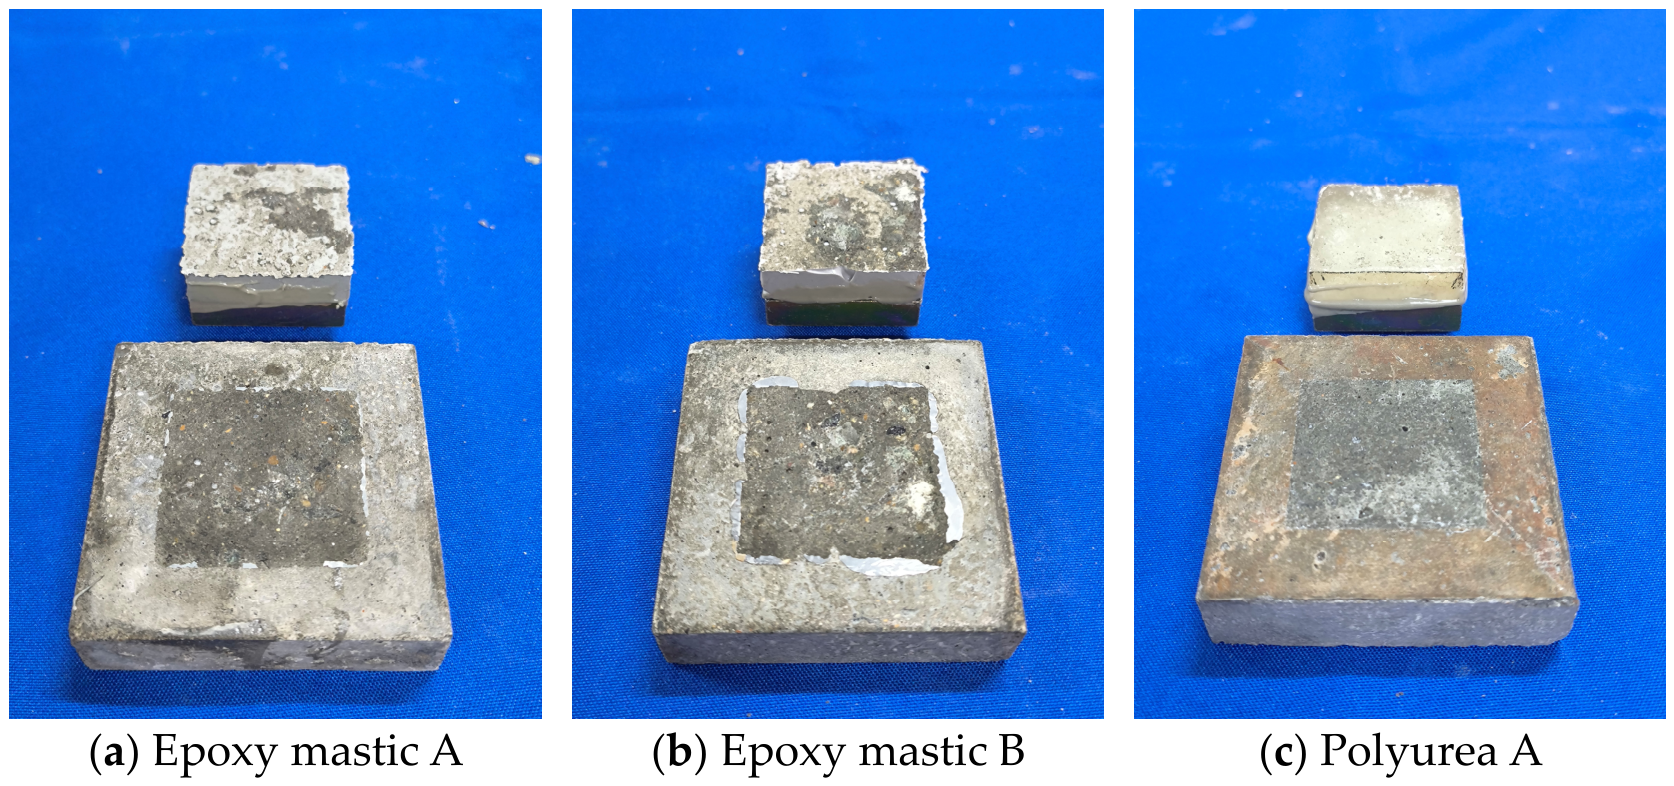
Figure 24 shows the morphology of interface damage for different repair materials; the concrete substrate surfaces corresponding to the three materials exhibit varying degrees of damage. Based on the volume of concrete adhering to the surface of the repair materials, it can be seen that epoxy mastic B exhibits the best bond with the concrete, followed by epoxy mastic A. Polyurea A has almost no concrete adhering to its surface and exhibits the poorest bond performance, which is consistent with the adhesive strength ranking results discussed above.
Figure 24.
Morphology of interface damage in different restorative materials.
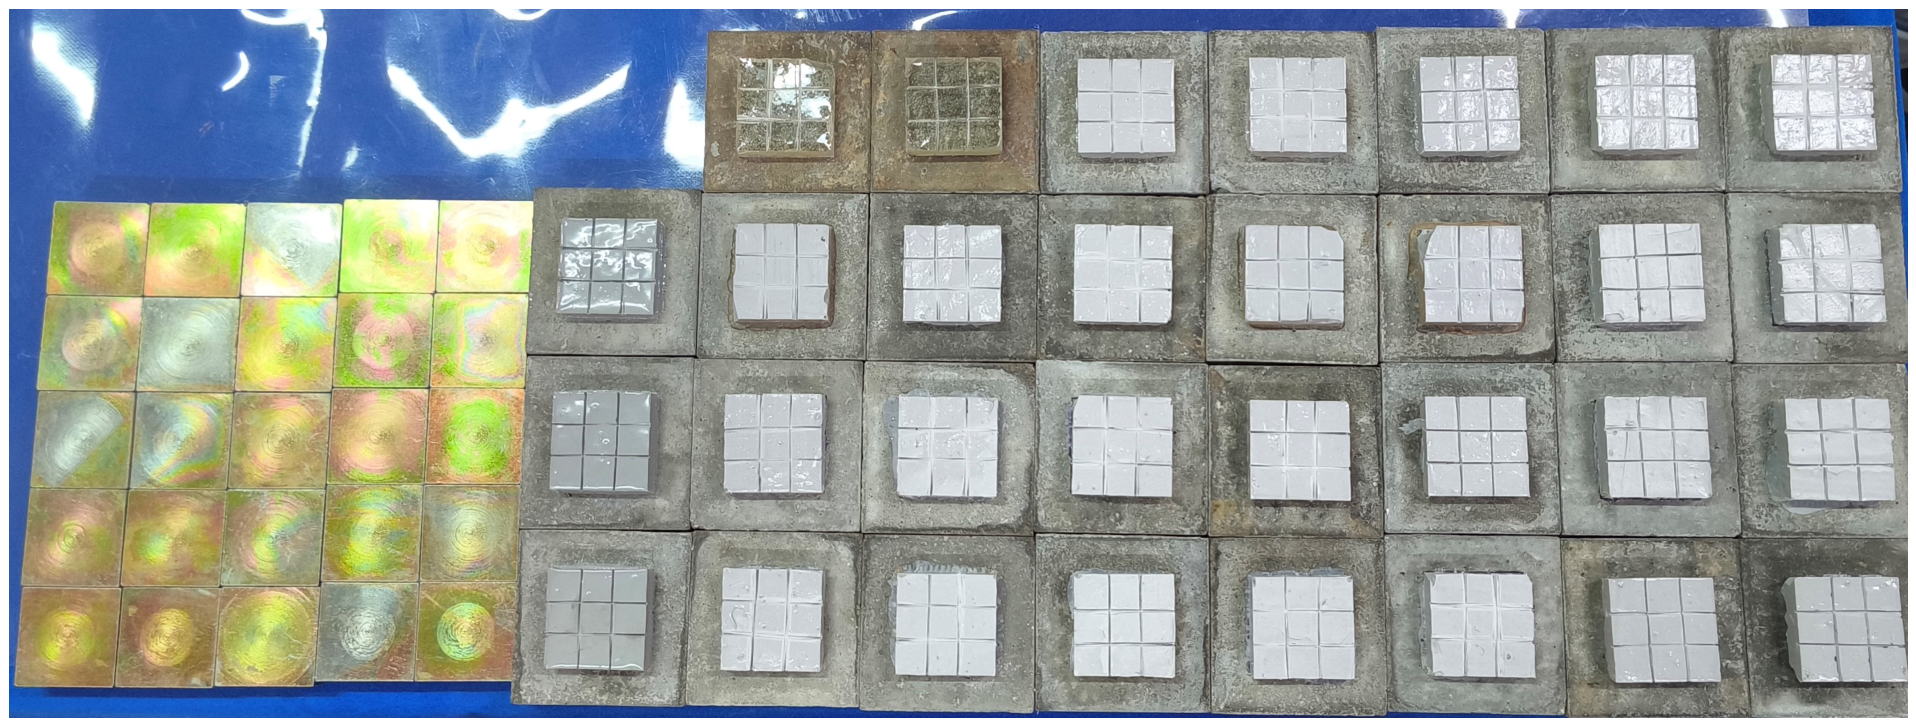
Figure 25 shows the damage morphology at the interface for different roughness levels. It was found that the amount of concrete adhering to the material surface increased with increasing roughness. In the roughness 3 test specimens, a larger volume of concrete adhered to the surface, and the aggregate in the base concrete was clearly exposed; the volume of concrete adhering in the roughness 2 test specimens was greater than that in the roughness 1 test specimens. Combined with the adhesive strength analysis discussed above, it can be concluded that setting a higher roughness level is somewhat beneficial for improving adhesive performance.
Figure 25.
Damage morphology at interfaces with different roughness.
4. Conclusions
This study conducted ultrasonic and hydraulic cavitation tests on dam repair and joint-sealing materials. By combining macroscopic and microscopic morphological analyses, the study investigated the patterns of cavitation damage morphology in these materials. Cavitation resistance was evaluated using indicators such as cumulative mass loss, mass loss rate, pitting rate, and cumulative cavitation area. The main conclusions are as follows:
1. The ultrasonic cavitation test results indicate that the repair materials primarily exhibit the initiation and propagation of pitting, as well as localized surface spalling. The damage mechanism of polyurea A differs from that of the other materials, primarily manifesting as continuous crack propagation and interconnection. The repair materials provide a certain degree of protection to the concrete substrate, and adhesion between the material and the concrete substrate significantly influences cavitation resistance.
2. The hydraulic cavitation test results indicate that all three repair materials—epoxy mastic A, epoxy mastic B, and polyurea A—possess a certain degree of cavitation resistance. Failure of the repair materials primarily manifested as fracture and spalling, and their cavitation resistance was closely related to the state of interfacial adhesion. None of the three repair materials exhibited obvious cavitation-induced damage features on their surfaces. The failure of epoxy mastic A was primarily characterized by cracking and spalling, with the largest spalling area among the three repair materials; epoxy mastic B exhibited the smallest spalling area and the best adhesion to the concrete substrate, with failure manifesting as cracking and spalling near the edges of construction joints; the failure process of polyurea A differed from that of the other two materials, primarily involving blistering of the repair coating, crack propagation, cavity formation, and complete detachment.
3. From the results of microscopic damage analysis, cavitation damage typically develops from surface defects, edge areas, and weak interfaces within the materials. Among them, epoxy mastic B was the most stable; it showed no obvious cavitation damage in either the joint-edge coating or the surface coating, yielding the best repair results. Epoxy mastic A exhibited fracturing and crack propagation in both the joint-edge and surface areas. Polyurea A primarily exhibited blistering, fracture, and large-area delamination. From a microscopic damage perspective, the cavitation resistance of the repair material is closely related to its adhesion to the concrete substrate. Therefore, when repairing structural joints, it is essential to consider not only the material’s inherent cavitation resistance but also its adhesion to the concrete.
4. After 9 h of cavitation testing, neither of the two joint-filling materials—silicone A and polyurethane A—exhibited any noticeable surface damage, with cumulative mass losses of 1.52 g and 0.83 g, respectively. Under identical cavitation conditions, there was a significant difference in mass loss between these two joint-filling materials. Specifically, polyurethane A exhibited a smaller cumulative mass loss; during the test, this material showed minimal erosion and demonstrated good overall stability, whereas silicone A exhibited a larger cumulative mass loss.
Author Contributions
Conceptualization, S.Z., R.Z. and J.Z.; methodology, S.Z.; validation, R.Z.; formal analysis, S.Z.; investigation, R.Z., K.Z., D.Y. and Y.Q.; data curation, D.Y.; writing—original draft, S.Z. and R.Z.; writing—review and editing, J.Z.; visualization, D.Y.; supervision, J.Z.; funding acquisition, J.Z. All authors have read and agreed to the published version of the manuscript.
Funding
This research was funded by the Science and Technology Program of China Yangtze Power Co., Ltd., grant number No. Z232302054.
Data Availability Statement
The original contributions presented in this study are included in the article. Further inquiries can be directed to the corresponding author.
Conflicts of Interest
Authors Sisi Zhu and Dezhen Ye were employed by the company Overhaul and Maintenance Factory of China Yangtze Power Co., Ltd. The authors declare that this study received funding from the Science and Technology Program of China Yangtze Power Co., Ltd. The funding sponsors had the following involvement with the study: the design of the study, investigation, and writing of the manuscript. The remaining authors declare no conflicts of interest.
References
- Sun, H.; Xu, X.; Du, H. Investigation and Application of Abrasion and Cavitation Resistant Coatings for Hydraulic Structures in China. Hydro-Sci. Eng. 2023, 5, 158–168. (In Chinese) [Google Scholar] [CrossRef]
- Dong, Z.; Xu, X.; Li, Y. Effect of Sand Grain Size on Cavitation Erosion of Concrete Induced by High Velocity Sand Carrying Water Flow. Chin. J. Corros. Prot. 2023, 43, 166–172. (In Chinese) [Google Scholar]
- Ibanez, I.; Zeqiri, B.; Hodnett, M.; Frota, M. Cavitation-erosion measurements on engineering materials. Eng. Sci. Technol. Int. J. 2020, 23, 1486–1498. [Google Scholar] [CrossRef] [Scilit]
- Priyadarshi, A.; Krzemień, W.; Salloum-Abou-Jaoude, G.; Broughton, J.; Pericleous, K.; Eskin, D.; Tzanakis, I. Effect of water temperature and induced acoustic pressure on cavitation erosion behaviour of aluminium alloys. Tribol. Int. 2023, 189, 108994. [Google Scholar] [CrossRef] [Scilit]
- Ma, J.; Hou, G.; An, Y.; Zhao, X.; Zhou, H.; Chen, J.; Duan, W. Research Progress of Thermal Spraying Anti-cavitation Erosion Coatings and Modification Technologies. China Surf. Eng. 2022, 35, 113–127. (In Chinese) [Google Scholar]
- Shen, C.; Li, G.; Yin, N.; Xu, H.; Xue, J.; Tan, G. Numerical Simulation and Experiment of Cavitation Erosion Mechanism of High Speed Internal Cooling Milling Holes. Surf. Technol. 2020, 49, 322–330. (In Chinese) [Google Scholar]
- Li, X.; Xie, W.; Zhang, H.; Qin, R.; Wang, X. Review of Research on Hydraulic Mechanical Abrasion. Pearl River 2021, 42, 99–105+111. (In Chinese) [Google Scholar]
- Osman, O.O.; Abouel-Kasem, A.; Ahmed, S.M. Shock waves as dominant mechanism for cavitation damage. J. Tribol. 2022, 144, 062301. [Google Scholar] [CrossRef] [Scilit]
- Zhai, Y.; Xu, W.; Luo, J.; Li, J. Experimental study on the characteristics of microjets and shock waves of cavitation bubbles near elastic boundaries. Ocean Eng. 2022, 257, 111664. [Google Scholar] [CrossRef] [Scilit]
- Lu, X.; Wang, L.; Chen, C.; Chen, J.; Zhou, J.; Deng, J. Study on the influence mechanism of material damage on the cavitation erosion properties of hydraulic concrete. Constr. Build. Mater. 2023, 400, 132849. [Google Scholar] [CrossRef] [Scilit]
- Franc, J.P.; Riondet, M.; Karimi, A.; Chahine, G.L. Material and velocity effects on cavitation erosion pitting. Wear 2012, 274, 248–259. [Google Scholar] [CrossRef] [Scilit]
- Jayaprakash, A.; Choi, J.-K.; Chahine, G.L.; Martin, F.; Donnelly, M.; Franc, J.-P.; Karimi, A. Scaling study of cavitation pitting from cavitating jets and ultrasonic horns. Wear 2012, 296, 619–629. [Google Scholar] [CrossRef] [Scilit]
- Cosma, D.; Mitelea, I.; Bordeașu, I.; Uțu, I.D.; Crăciunescu, C.M. Ultrasonic Cavitation Erosion Behavior of GX40CrNiSi25-20 Cast Stainless Steel through Yb-YAG Surface Remelting. Materials 2024, 17, 4180. [Google Scholar] [CrossRef] [Scilit] [PubMed]
- Huang, C.S.; He, X.L.; Zhang, J.M. Experimental study on ultrasonic cavitation erosion characteristics of concrete. Constr. Build. Mater. 2025, 486, 142011. [Google Scholar] [CrossRef] [Scilit]
- Mitelea, I.; Bordeaşu, I.; Pelle, M.; Crăciunescu, C. Ultrasonic cavitation erosion of nodular cast iron with ferrite-pearlite microstructure. Ultrason. Sonochem. 2015, 23, 385–390. [Google Scholar] [CrossRef] [Scilit] [PubMed]
- Gao, G.Y.; Zhang, Z. Cavitation erosion mechanism of 2Cr13 stainless steel. Wear 2022, 488–489, 204137. [Google Scholar] [CrossRef] [Scilit]
- Ding, H.; Tang, Q.; Zhu, Y.; Zhang, C.; Yang, H. Cavitation erosion resistance of 316L stainless steel fabricated using selective laser melting. Friction 2021, 9, 1580–1598. [Google Scholar] [CrossRef] [Scilit]
- Correa, C.E.; García, G.L.; García, A.N.; Bejarano, W.; Guzmán, A.A.; Toro, A. Wear mechanisms of epoxy-based composite coatings submitted to cavitation. Wear 2011, 271, 2274–2279. [Google Scholar] [CrossRef] [Scilit]
- Huang, C.; He, X.; Zhang, J. Cavitation pit evolution process of epoxy and polyurea coatings on mortar substrates. Ultrason. Sonochem. 2024, 104, 106813. [Google Scholar] [CrossRef] [Scilit] [PubMed]
- Chi, S.; Park, J.; Shon, M. Study on cavitation erosion resistance and surface topologies of various coating materials used in shipbuilding industry. J. Ind. Eng. Chem. 2015, 26, 384–389. [Google Scholar] [CrossRef] [Scilit]
- Pavlović, M.; Dojčinović, M.; Nikolić, J.; Aleksić, S.; Tucović, N.; Čeganjac, Z.; Drmanić, S. Cavitation Erosion of Protective Coating Based on Cordierite Filler and Epoxy Matrix. Materials 2025, 18, 1034. [Google Scholar] [CrossRef] [Scilit] [PubMed]
- Zhao, X.; Qi, Y.H.; Zhang, Z.P. Study on anti-cavitation performance of elastomer composite coatings in a salt solution. Prog. Org. Coat. 2022, 163, 106629. [Google Scholar] [CrossRef] [Scilit]
- Su, Q.; Wang, T.; Hou, G.; Cui, H.; Chen, L.; An, Y.; Zhou, H.; Chen, J. A Study on the Preparation and Cavitation Erosion Mechanism of Polyether Polyurethane Coating. Materials 2022, 15, 8204. [Google Scholar] [CrossRef] [Scilit] [PubMed]
- Marlin, P.; Chahine, G.L. Erosion and heating of polyurea under cavitating jets. Wear 2018, 414–415, 262–274. [Google Scholar] [CrossRef] [Scilit]
- Li, N.; Yang, R.; Tian, Y.; Lu, P.; Huang, N.; Li, H.; Chen, X. Synthesis of durable hydrophobic fluorinated polyurethanes with exceptional cavitation erosion resistance. Tribol. Int. 2023, 177, 107973. [Google Scholar] [CrossRef] [Scilit]
- Hussain, Z.; Riaz, I.; Wang, X.; Lin, Z.; Nie, W.; Huang, Y. Corrosion-protective nanoclay reinforced epoxy coating for structural applications: Mechanics and molecular dynamics. Constr. Build. Mater. 2026, 526, 146330. [Google Scholar] [CrossRef] [Scilit]
- Riaz, I.; Hussain, Z.; Pan, H.; Lin, Z. Mechanism-guided data-driven adhesion evaluation of nanomaterial-reinforced epoxy coatings. Constr. Build. Mater. 2026, 542, 148136. [Google Scholar] [CrossRef] [Scilit]
- Hofmann, J.; Thiébaut, C.; Riondet, M.; Lhuissier, P.; Gaudion, S.; Fivel, M.C. Comparison of acoustic and hydrodynamic cavitation: Material point of view. Phys. Fluids 2023, 35, 017112. [Google Scholar] [CrossRef] [Scilit]
- Choi, J.K.; Jayaprakash, A.; Chahine, G.L. Scaling of cavitation erosion progression with cavitation intensity and cavitation source. Wear 2012, 278, 53–61. [Google Scholar] [CrossRef] [Scilit]
- Yamaguchi, A.; Kazama, T.; Inoue, K.; Onoue, J. Comparison of cavitation erosion test results between vibratory and cavitating jet methods. Int. J. Fluid Power 2001, 2, 25–30. [Google Scholar] [CrossRef] [Scilit]
- Keya, T.; Shakil, S.I.; Odeshi, A.; Haghshenas, M.; Choi, J.-K.; Hadadzadeh, A. Influence of mechanical properties on cavitation-erosion via cavitating jet. Tribol. Int. 2025, 209, 110754. [Google Scholar] [CrossRef] [Scilit]
- Krella, A.K. Degradation and protection of materials from cavitation erosion: A review. Materials 2023, 16, 2058. [Google Scholar] [CrossRef] [Scilit] [PubMed]
- ASTM G32-16; Standard Test Method for Cavitation Erosion Using Vibratory Apparatus. ASTM International: West Conshohocken, PA, USA, 2016. Available online: http://www.astm.org (accessed on 10 October 2026).
- Zhou, R.; Zhou, J.; Zhou, K.; Qiu, Y.; Chen, Y. Research on gray correlation evaluation method for ultrasonic cavitation anti-cavitation performance of epoxy resin materials. Constr. Build. Mater. 2026, 516, 145691. [Google Scholar] [CrossRef] [Scilit]

Disclaimer/Publisher’s Note: The statements, opinions and data contained in all publications are solely those of the individual author(s) and contributor(s) and not of MDPI and/or the editor(s). MDPI and/or the editor(s) disclaim responsibility for any injury to people or property resulting from any ideas, methods, instructions or products referred to in the content. |
© 2026 by the authors. Licensee MDPI, Basel, Switzerland. This article is an open access article distributed under the terms and conditions of the Creative Commons Attribution (CC BY) license.