


Highlights
- A response-constrained PSD truncation framework is proposed for non-ideal PSDs.
- The unit-mass densification contribution coefficient identifies effective size ranges.
- A preliminary lower fitting limit is supported by geometry and response data.
- Truncated indices improve maximum dry density characterization for non-ideal PSDs.
Abstract
Not all particle-size fractions in widely graded granular materials contribute equally to compaction densification. For non-ideal particle-size distributions (PSDs) with local deviations or fine-end disturbances, the full-range fractal index may be influenced by particle-size fractions that contribute weakly to densification and, therefore, may not consistently represent the maximum dry density response. To address this problem, this study proposes a response-constrained truncation framework to identify a more effective PSD fitting range for fractal characterization. First, 20 concave and S-shaped PSDs from previous experiments were re-analyzed to compare full-range and truncated indices. Then, 21 progressively truncated specimens derived from three standard fractal PSDs were tested by relative density experiments. A unit-mass densification contribution coefficient, ηj, was defined from adjacent maximum dry density differences and particle-fraction mass contents. The ηj-d responses exhibited unimodal patterns, and the transition diameter dc shifted with PSD coarseness. For the two material sources, replacing the full-range index with the truncated index increased the R2 values between the fractal index and maximum dry density from 0.195 to 0.886 and from 0.191 to 0.856, respectively. A continuous percentile search showed that the optimal characteristic scale was concentrated near q ≈ 30, with a robust common optimum of q = 30.53. Sensitivity analysis for β = 0.85–0.95 indicated that 0.225d30 falls within the transition region from highly effective filling to reduced densification efficiency. Accordingly, dL = 0.225d30 is proposed as a preliminary engineering estimate of the lower fitting limit for non-ideal PSDs. The framework is intended for widely graded materials whose full-range fractal parameters are inconsistent with compaction response.
1. Introduction
The compaction performance of engineering granular materials is closely related to particle-size distribution (PSD), particle morphology, and packing structure [1,2,3,4,5,6,7,8,9,10]. Concrete aggregates, mine waste rock, tunnel spoil, rockfill, and coarse-grained fill materials are typically polydisperse systems. Their macroscopic dense state is jointly controlled by skeleton formation, void filling, and particle interference [11,12,13,14]. For widely graded materials, a PSD descriptor that reflects the effective packing structure is essential for compaction evaluation and gradation design [15,16].
From this perspective, different particle-size fractions can be understood as playing different roles during densification. Early studies by Westman and Hugill, Furnas, and McGeary clarified the densification role of small particles filling the voids between larger particles [1,2,3]. The Andreasen–Andersen continuous gradation model, the Dinger–Funk model, the compressible packing model of de Larrard, and the particle-mixture models of Yu and Standish further show that gradation continuity, size ratio, volume fraction, and particle shape jointly influence packing density and pore structure [4,5,6,7,8,9]. These studies indicate that the performance effect of PSD is structurally dependent and cannot be fully represented by a few conventional gradation indices [17,18,19,20].
Fractal models provide a compact way to describe widely graded PSDs and have been widely used for coarse-grained soils, rockfill, waste rock, and soil–rock mixtures [21,22,23,24,25,26,27,28,29,30]. However, practical PSDs often deviate from a single power-law distribution. Fine-end enrichment, local bulges in intermediate size ranges, gap gradation, and sieving uncertainty may alter the slope of a full-range log–log regression [31,32]. As a result, a single fractal index may simultaneously contain information from skeleton particles, effective filling particles, and non-structural fractions, weakening its relationship with compaction performance [32].
This study does not imply that all widely graded PSDs should be truncated. For smooth and continuous PSDs close to a single power law, a full-range fractal index may still be appropriate. The focus here is on a more common engineering case: non-ideal PSDs with local deviations or fine-end disturbances, where the same nominal fractal index may correspond to different curve shapes and different compaction responses. In such cases, the full-range index may not represent the effective particle-size interval that controls packing densification.
These packing theories also imply that different particle-size fractions should not be treated as equally effective in densification. However, conventional full-range fractal fitting gives all size ranges statistical influence in the log–log regression, even when some fine-end or locally deviated fractions contribute weakly to the compaction response. This creates a gap between PSD mathematical fitting and packing-response characterization. Therefore, a response-based criterion is needed to identify the PSD interval that better represents the effective packing structure.
Based on this understanding, larger and skeleton particles form the main contact framework, and intermediate particles may enter skeleton voids and enhance densification, whereas very fine particles may fill micro-voids but do not necessarily contribute proportionally to skeleton rearrangement. Therefore, the fractal fitting of non-ideal PSDs should not mechanically include all size fractions; instead, an effective lower fitting limit related to packing structure and compaction response should be identified.
The main contributions of this study are as follows: (1) a unit-mass packing densification contribution coefficient, ηj, is defined to quantify the normalized contribution of each particle-size interval to maximum dry density; (2) a transition diameter, dc, is identified from the unimodal ηj-d response, revealing the migration of the effective filling size with PSD coarseness; and (3) a geometrically and response-constrained lower fitting limit, dL = 0.225d30, is proposed as an engineering estimate for fractal fitting of non-ideal PSDs.
2. Materials and Methods
2.1. Fractal PSD Model and Full-Range Fitting Bias
For a continuous PSD with maximum particle size dmax, the cumulative passing percentage P(d) can be expressed using a Talbot-type power function or fractal form:
where n is the gradation index. In a mass-based particle-size fractal model, the fractal dimension D commonly satisfies D = 3 − n. Equation (1) provides a single-parameter representation of PSD coarseness, but it assumes that all particle-size intervals approximately follow the same scale law. When local deviations exist, the full-range fitted n may include both the dominant packing structure and non-power-law disturbances.
For widely graded granular materials, even a small amount of fine particles may strongly influence the log–log regression slope because of the large size span. If these particles mainly occupy free-filling or micro-void states, their statistical influence on the fractal index may exceed their actual contribution to skeleton packing. Therefore, response-constrained truncation is needed for non-ideal PSDs to reduce the leverage of low-efficiency fine-end fractions.
2.2. Skeleton-Filling-Interference Roles in Polydisperse Granular Systems
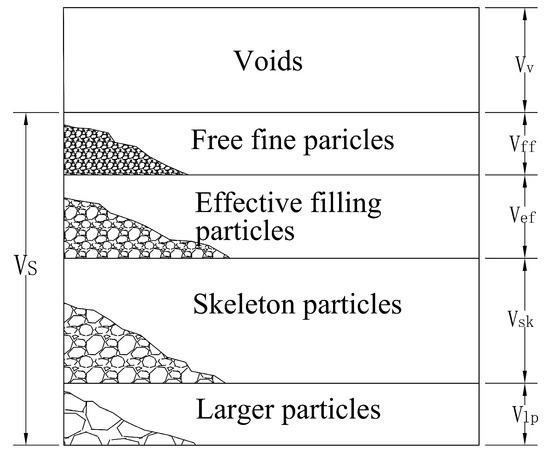
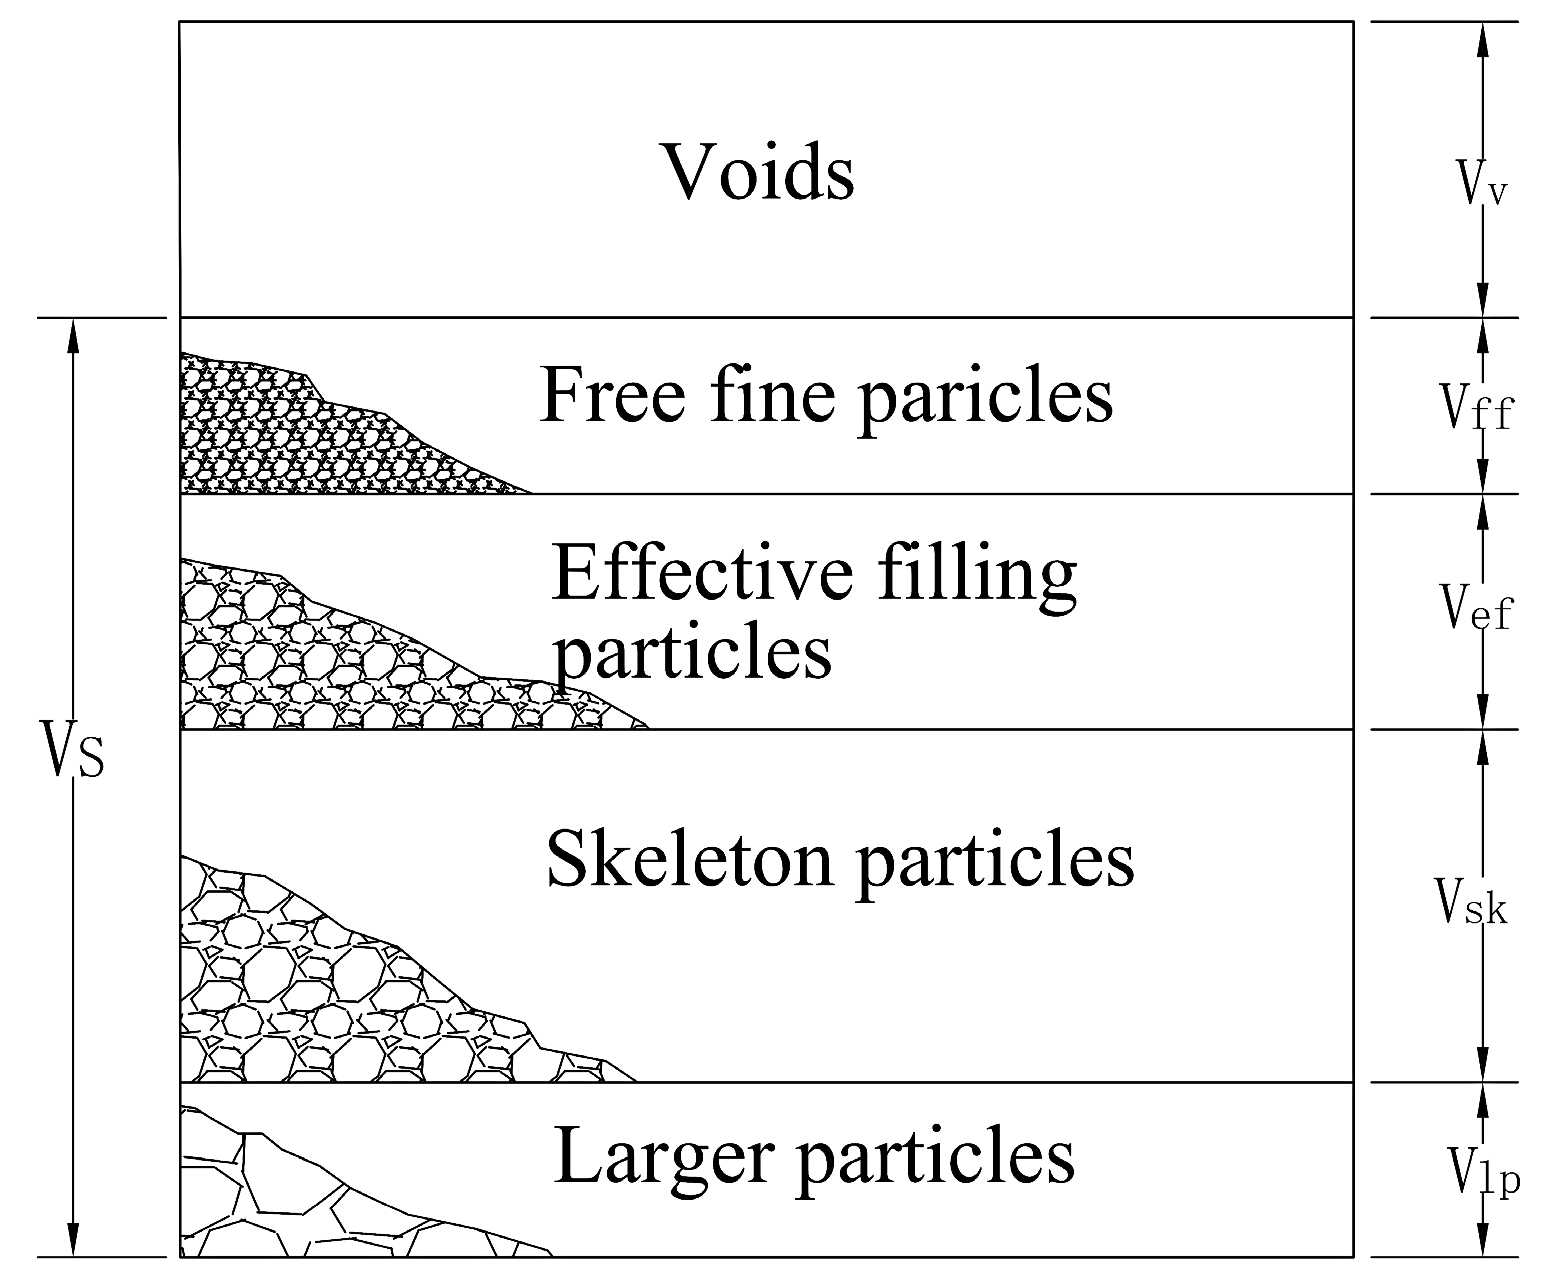
The densification of a polydisperse granular system can be conceptualized as a combination of skeleton formation, pore filling, and interference-induced rearrangement. In this study, particle fractions are divided into larger particles, skeleton particles, effective filling particles, and free fine particles according to their packing functions. Larger particles and skeleton particles form the main load-bearing framework through contact networks. Effective filling particles enter skeleton voids and participate in local rearrangement during vibration or compaction. Free fine particles mainly occupy micro-voids or pore ends, and their variation is more likely to be reflected as a change in the PSD tail. This conceptual partition is illustrated in Figure 1.
Figure 1.
Conceptual model of the functional partition of particle fractions in widely graded granular materials.
This partition is used here as a conceptual interpretation of packing functions rather than as a directly measured contact-network classification. The quantitative boundary between effective and less effective fractions is not prescribed a priori but is inferred from the subsequent ηj-d response and the transition diameter dc.
This functional partition means that the effective PSD fitting range should include skeleton particles and effective filling particles but should not be dominated by free fine particles. Truncation does not deny the filling role of fine particles; instead, it shifts the fitting emphasis toward the size interval that better reflects the dominant packing structure and compaction response.
2.3. Implications of Classical Packing Models for Effective Particle-Size Ranges
The Andreasen–Andersen model emphasizes the role of a continuous size distribution in high-density packing [4]. The Dinger–Funk model introduces a minimum size term to account for finite PSD ranges [5]. The linear packing density model and the compressible packing model describe filling, loosening, and wall effects among particles of different sizes [6,33]. The Yu–Standish series of models incorporates size distribution, non-spherical particles, and multicomponent mixtures into porosity prediction [7,8,9].
These models show that PSD does not affect packing density through equal weighting of all size fractions. Instead, the effect depends on geometric role, size ratio, and volume fraction. The response-constrained truncation method proposed here is consistent with this physical basis, but the objective differs: classical packing models often predict absolute packing density, whereas this study uses compaction response to identify a physically meaningful effective size interval for fractal PSD fitting.
2.4. Tetrahedral Void Scale and Candidate Truncation Ratio
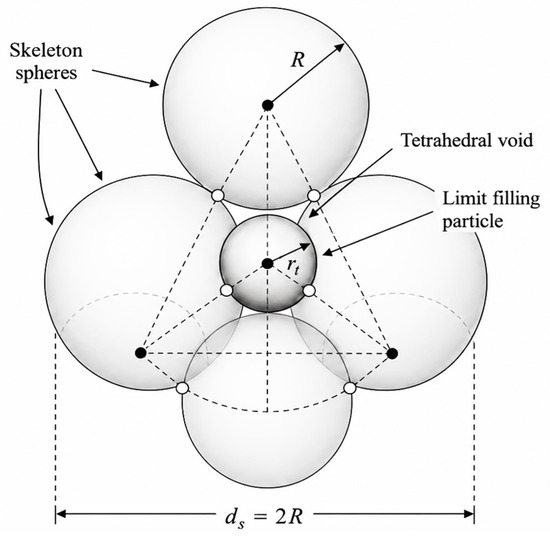
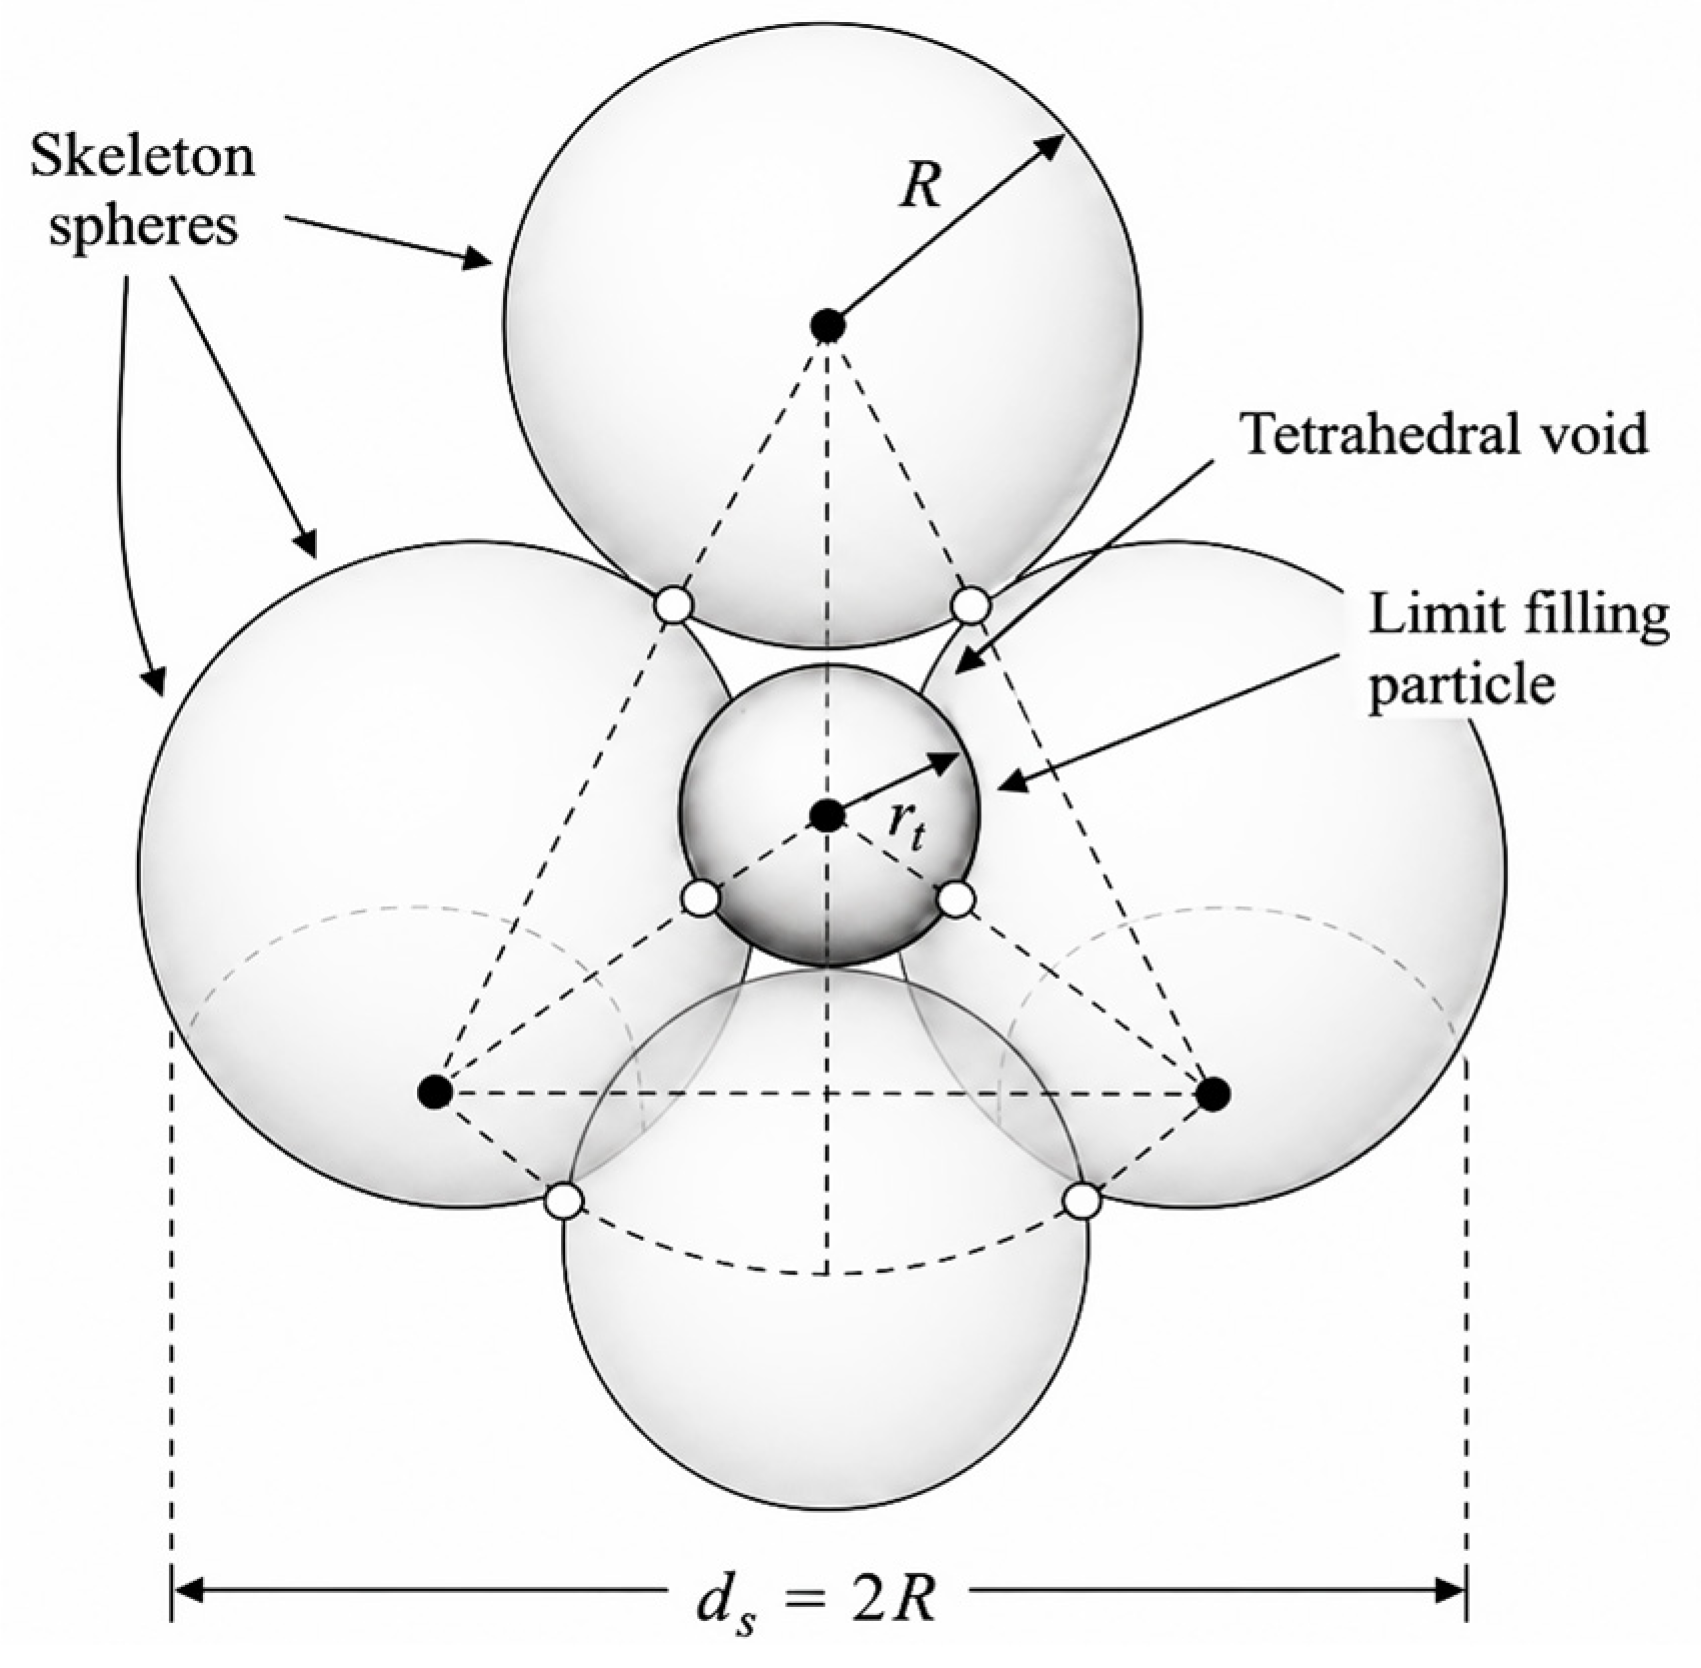
In face-centered cubic or hexagonal close packing of equal spheres, the tetrahedral void formed by four mutually tangent equal skeleton spheres is one of the smallest basic voids. The geometric relation is illustrated in Figure 2.
Figure 2.
Geometric derivation of the 0.225 diameter ratio from a tetrahedral void formed by four equal skeleton spheres. R and rt denote the radii of the skeleton sphere and the limit filling particle, respectively.
If the radius of the skeleton sphere is R, the radius rt of the small sphere that can be accommodated in a tetrahedral void is given by the following:
and because the diameter ratio equals the radius ratio,
The coefficient 0.225 is not an empirical fitting coefficient of this study. It is the classical geometric ratio for a limiting particle accommodated in a tetrahedral void of equal-sphere close packing. In a continuous PSD, however, no unique skeleton diameter ds exists. Therefore, a PSD characteristic scale that is consistent with compaction response must be identified. To avoid relying on a limited set of discrete candidate sizes, a continuous percentile diameter dq is introduced and searched over the percentile space q to match dc.
It should be noted that this ratio is derived from ideal equal-sphere packing and should not be interpreted as the exact pore-throat size of real angular particles. Particle angularity, elongation, surface roughness, and breakage may alter the local void geometry. Therefore, the tetrahedral ratio is used only as a physically interpretable geometric reference, and its relevance is further examined using the ηj-d response and percentile search. Alternative assumptions, such as octahedral voids or cubic packing, would correspond to larger void scales than the tetrahedral case and may, therefore, lead to larger candidate filling or truncation diameters. These packing geometries are not used to define dL in this study, but they may be considered in future work when comparing different geometric reference scales.
2.5. Truncated-Domain Fractal PSD Equation
The lower fitting limit is denoted by dL. For d ≥ dL, the normalized truncated-domain fractal PSD can be written as follows:
where Dt is the fractal dimension in the truncated domain and Pt(d) is the normalized cumulative passing percentage within the truncated interval. Compared with full-range fitting, Equation (4) explicitly includes dL, shifting the key issue from fitting the PSD to determining a physically reasonable lower fitting limit.
2.6. Data Sources, PSD Design, and Progressive Truncation Tests
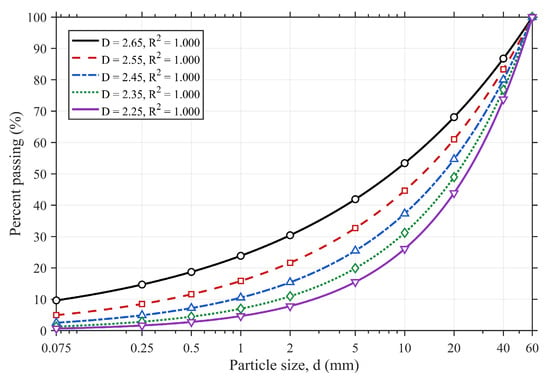
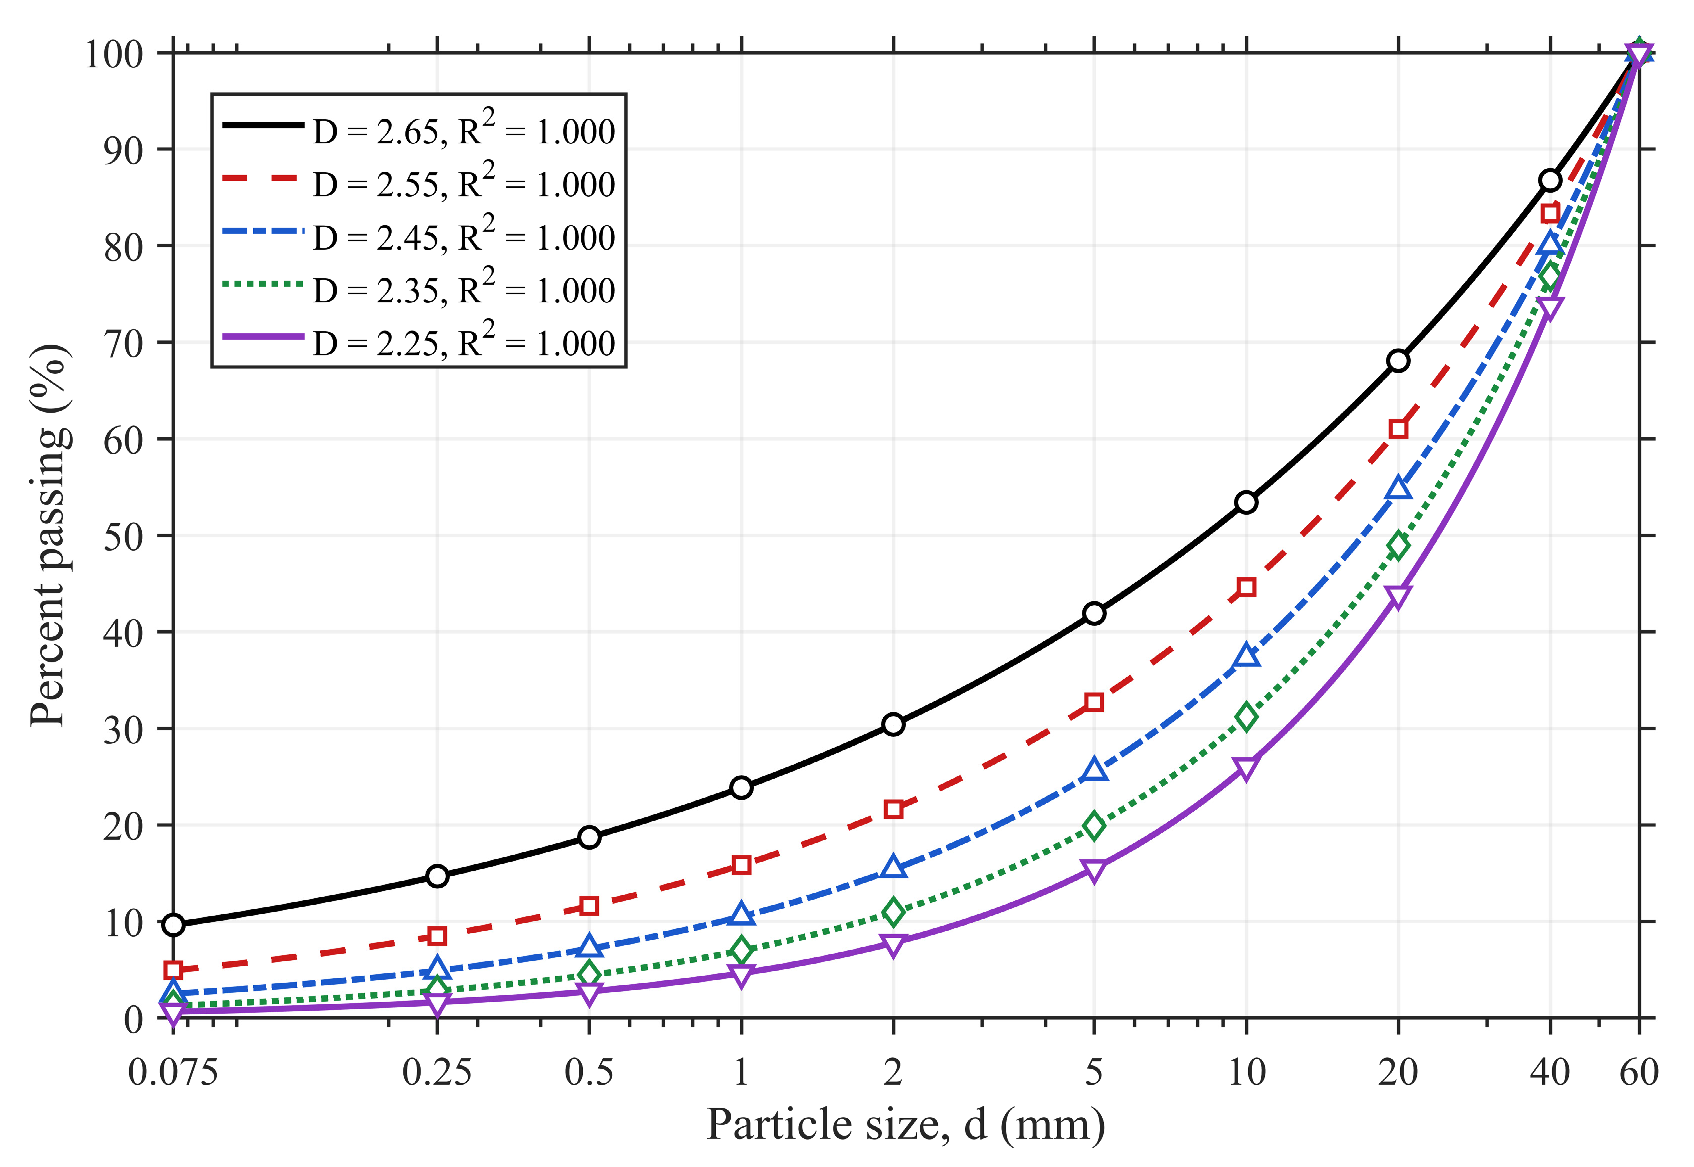
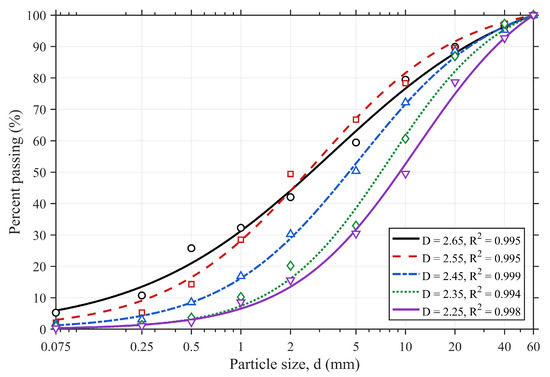
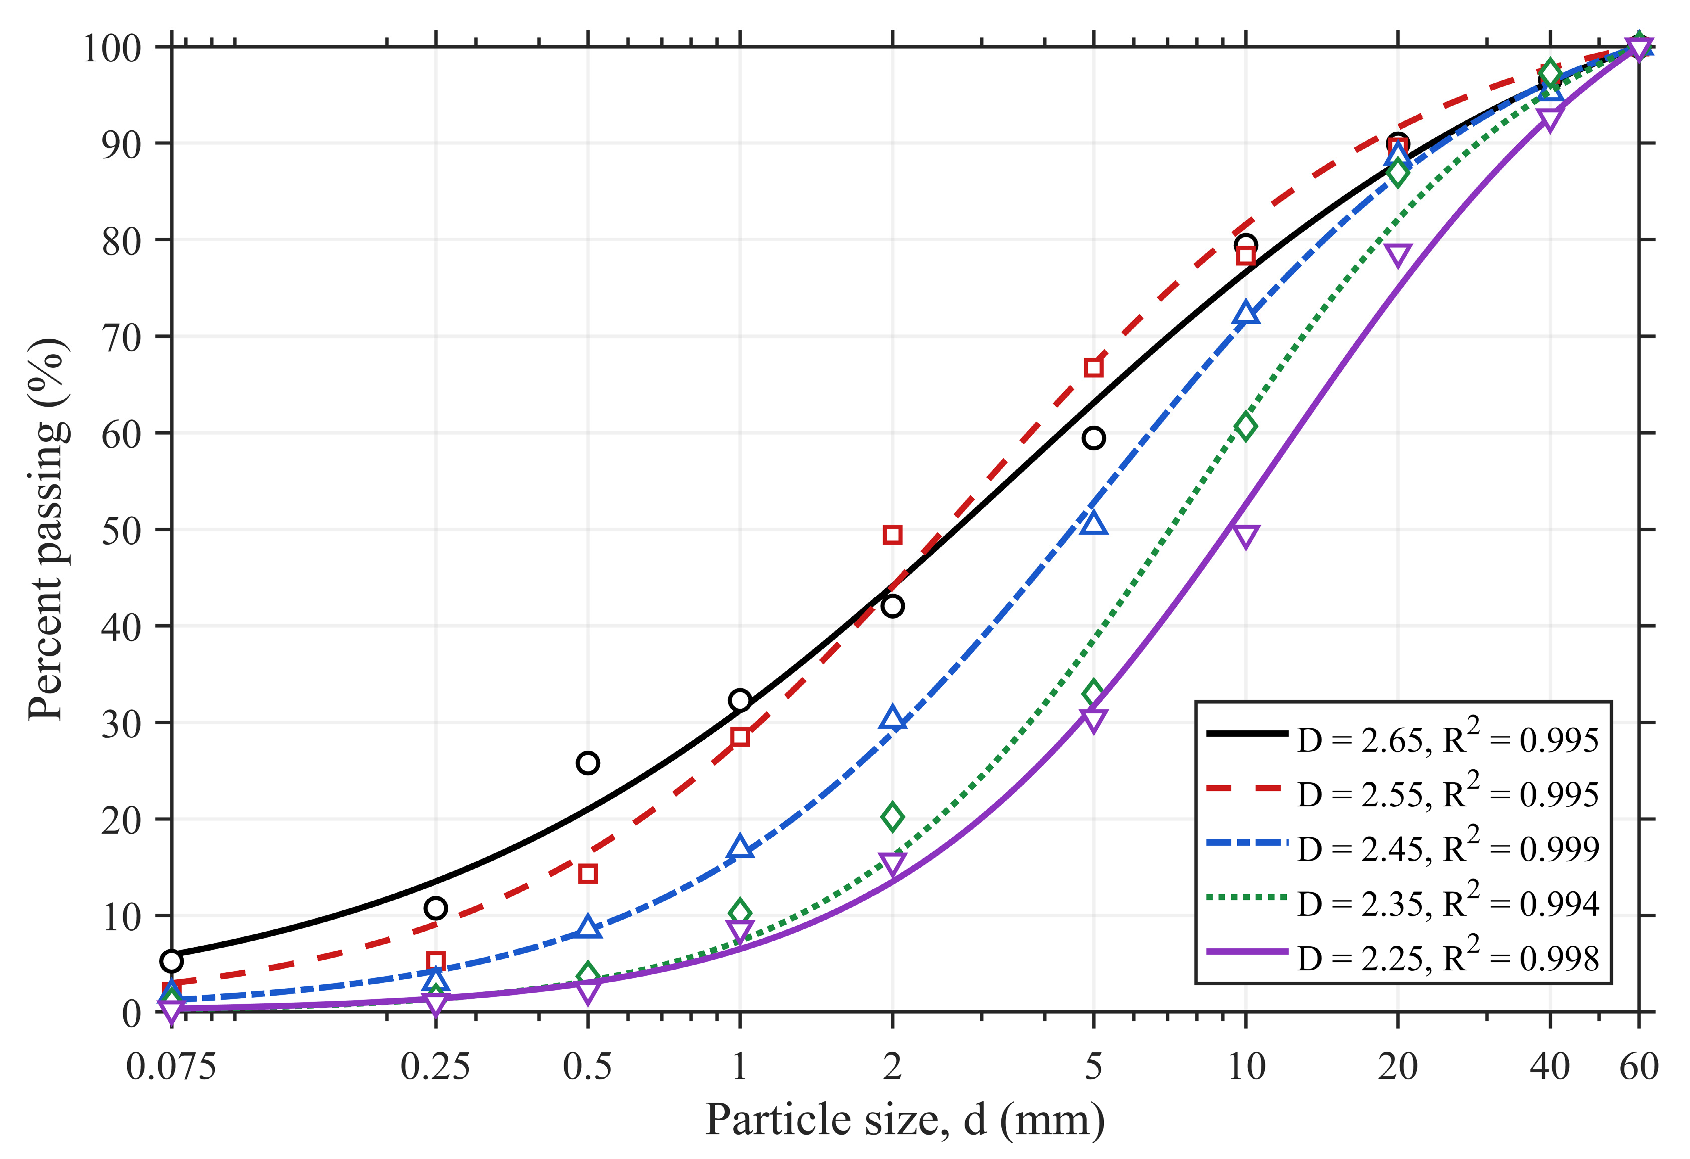
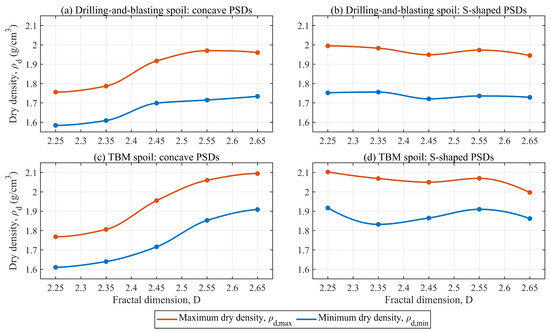
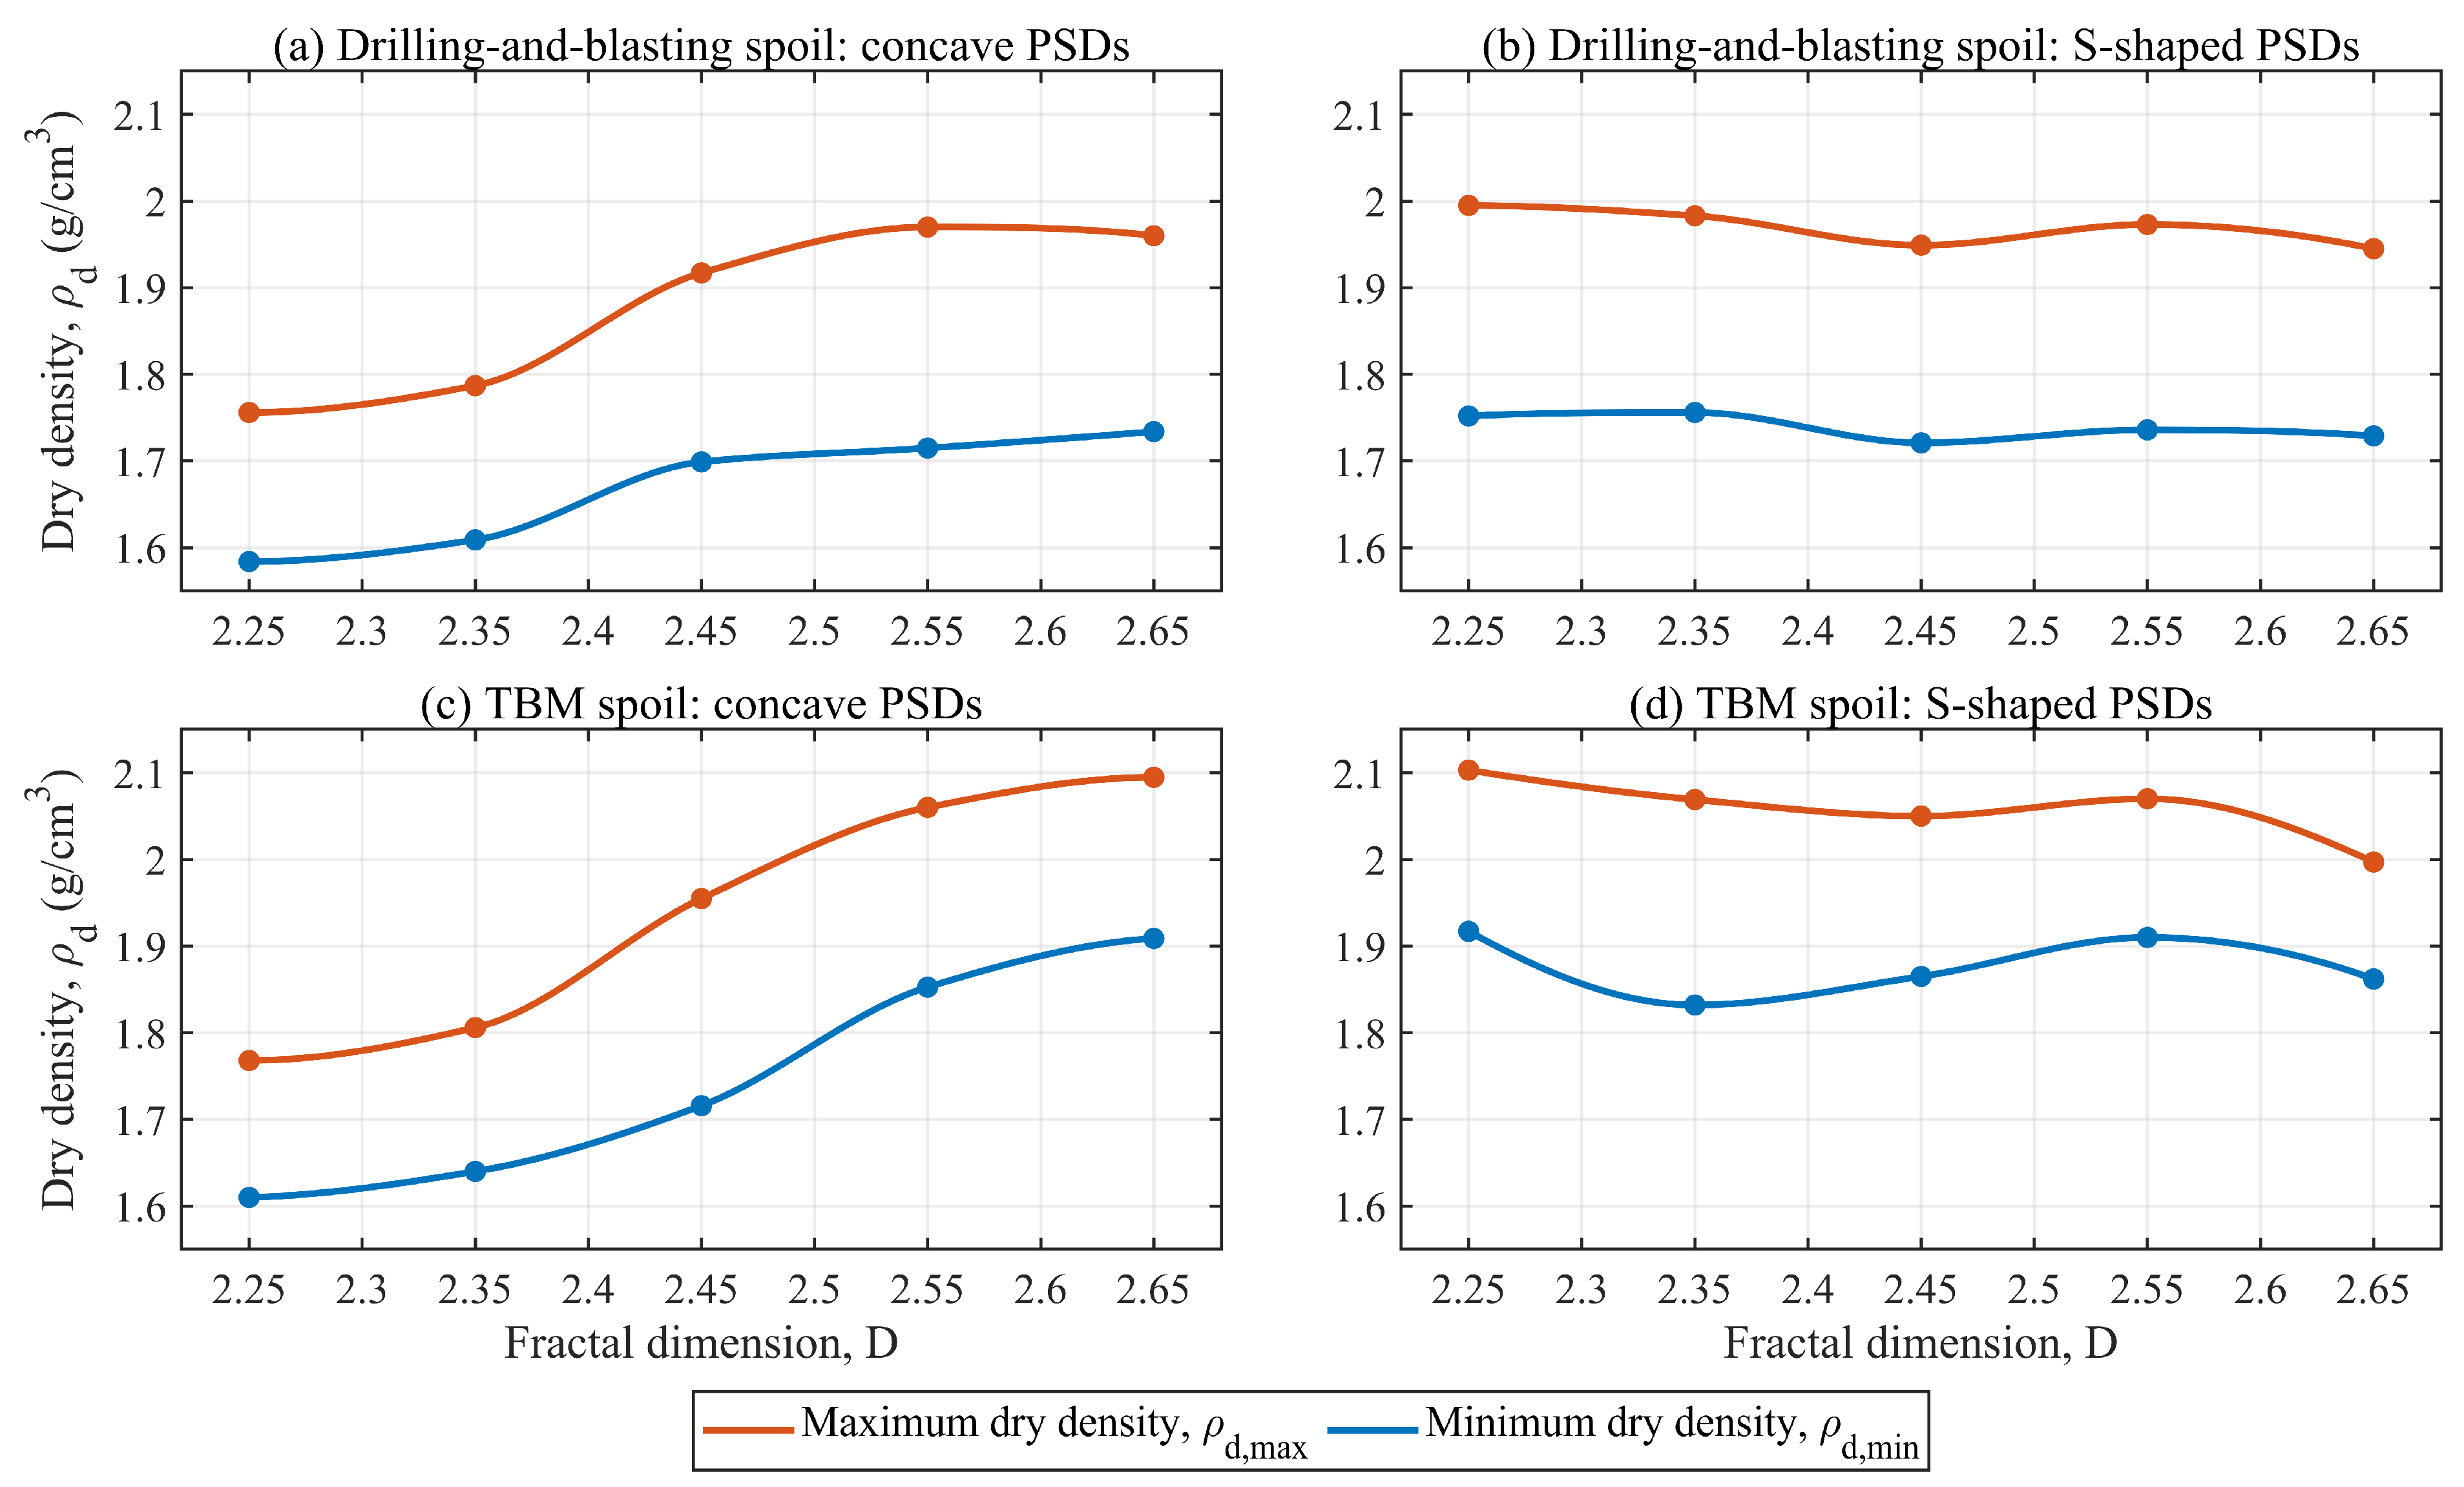
Two types of PSD data were used. The first type consists of 20 concave and S-shaped PSDs obtained in a previous study, where 10 designed PSDs were tested using drilling-and-blasting spoil and TBM spoil. These data were previously used to establish a gradation equation and a maximum dry density prediction model [34]. In the present study, the same data are re-analyzed to examine how full-range and truncated fractal indices characterize non-ideal PSDs. They are used as an internal consistency and parameter-reconstruction dataset rather than as independent external validation data. Figure 3 and Figure 4 show representative concave and S-shaped PSD curves from this dataset, and Figure 5 shows the corresponding extreme dry density responses.
Figure 3.
Gradation curves of concave PSDs.
Figure 4.
Gradation curves of S-shaped PSDs.
Figure 5.
Variations in maximum and minimum dry densities of drilling-and-blasting and TBM spoils under concave and S-shaped PSDs. Panels show concave and S-shaped PSDs for the two material sources.
The second type consists of three standard fractal parent PSDs, denoted as Groups A, B, and C, with n = 0.35, 0.55, and 0.75, respectively. Each group includes one parent PSD and six progressively truncated PSDs, giving 21 specimens in total. The maximum and minimum dry densities were measured using a coarse-grained soil relative density apparatus (ZKM-301A, Sichuan Ruihong Technology Co., Ltd., Chengdu, Sichuan, China) according to ASTM D4253/D4253M-16e1, ASTM D4254-16 and GB/T 50123-2019 [35,36,37]. The maximum dry density was used to calculate ηj, and the minimum dry density was used to help describe the loose packing state.
The characteristic particle sizes of the three parent PSDs are listed in Table 1.
Table 1.
Characteristic particle sizes of the three parent PSDs.
The complete gradation compositions of the progressively truncated specimens are provided in Supplementary Table S1. These three parent PSDs were selected to represent typical fine-to-coarse fractal gradation states within the tested size range, rather than to cover all possible engineering PSDs.
The first dataset was used as a re-analysis and internal consistency dataset, whereas the progressive truncation tests of Groups A–C were used to construct the ηj-d response and identify dc.
2.7. Unit-Mass Packing Densification Contribution Coefficient
Progressive truncation provides the maximum dry density difference between two adjacent PSDs. Because different particle-size intervals have different mass fractions, a direct comparison of density increments would be affected by particle-fraction content. To eliminate this effect, the unit-mass packing densification contribution coefficient ηj is defined as follows:
where Sj and Sj+1 are two adjacent truncated PSDs; ρd,max(Sj) and ρd,max(Sj+1) are their maximum dry densities; Δρj is the maximum dry density difference; and pj is the mass fraction of the corresponding particle-size interval. The mass fraction pj is calculated from the cumulative passing percentage:
The use of Δρj alone would mix the densification effect of a fraction with its mass content. By normalizing Δρj with pj, ηj converts the density change into a unit-mass contribution, allowing different particle-size intervals to be compared on the same basis. Therefore, ηj should be regarded as a response-normalized index for densification efficiency rather than as an intrinsic material constant. A larger ηj indicates a stronger unit-mass contribution to densification. It should be emphasized that ηj is not a directly measured dry density point; it is a response index calculated from adjacent maximum dry density differences and interval mass fractions.
The particle-size intervals, representative diameters, and corresponding mass fractions used for ηj-d fitting are summarized in Table 2.
Table 2.
Particle-size intervals, representative diameters, and mass fractions for ηj-d curve fitting.
The discrete ηj values used for constructing the ηj-d response curves are given in Table 3.
Table 3.
Discrete ηj values calculated from adjacent maximum dry density differences and interval mass fractions.
2.8. Identification of the Packing-Response Transition Diameter dc
After constructing the unimodal response curve from the ηj-d data, the response generally exhibits an ascending stage, a peak region, and a descending stage. The ascending stage indicates that particles gradually enter a more effective void-filling state; the peak region indicates high unit-mass densification contribution; and the descending stage implies that the filling efficiency decreases and that larger particles may begin to interfere with the existing skeleton arrangement.
The transition diameter dc is defined as the first point on the descending branch of the unimodal fitted curve where η(d) decreases to βηmax:
where ηmax is the peak value of the unimodal fitted curve. The value β = 0.90 was selected to identify a near-peak transition zone rather than the exact peak position. When η decreases to 0.90ηmax on the post-peak branch, the unit-mass densification contribution has clearly departed from the peak level but remains within the high-efficiency neighborhood. Therefore, dc is used to represent the transition from highly effective filling to reduced densification efficiency. To examine whether this interpretation depends strongly on a single threshold, β = 0.85, 0.90, and 0.95 were further considered in the sensitivity analysis.
η(dc) = βηmax, β = 0.90,
The discrete ηj values in Table 3 were calculated from the maximum dry density differences between two adjacent progressively truncated specimens and, therefore, may contain local point-to-point fluctuations. To extract the dominant response trend, the ηj–dj data of each group were first transformed into ηj–ln dj space. A shape-preserving piecewise cubic interpolation was then combined with a unimodal constraint to construct a continuous response curve with one dominant peak. The peak value ηmax and the corresponding peak location were obtained from the continuous curve. The transition diameter dc was then determined by interpolating the descending branch of this curve at η(d) = βηmax. The same curve-construction and interpolation procedure was applied to all three groups. Because only six discrete ηj points were available for each group, this procedure was used to identify the dominant response trend and the transition region, rather than to establish a universal analytical response model for all PSDs. The shape-preserving piecewise cubic interpolation, unimodal-constrained curve construction, sensitivity analysis, and figure preparation were performed using MATLAB R2021b (MathWorks, Natick, MA, USA).
3. Results
3.1. Parameter Reconstruction Before and After PSD Truncation
For concave PSDs, which are close to single power-law distributions, the effective gradation index nt obtained after truncation with dL = 0.225d30 remained nearly identical to the original n. For S-shaped PSDs, where the fine end and intermediate size range contain local deviations, nt became markedly lower than the nominal full-range n. To maintain comparability with the full-range Talbot index, the PSD segment d ≥ dL was re-normalized and fitted with the truncated-domain equation.
Table 4 shows that truncation does not artificially alter PSDs that already follow a power law. Instead, it mainly corrects the representation of PSDs with non-structural local deviations. For S-shaped PSDs, nt changed from the nominal range of n = 0.35–0.75 to nt = 0.306–0.485, which reopens the structural distinction between PSDs that share the same nominal index.
Table 4.
Parameter reconstruction results before and after truncation for ten PSDs.
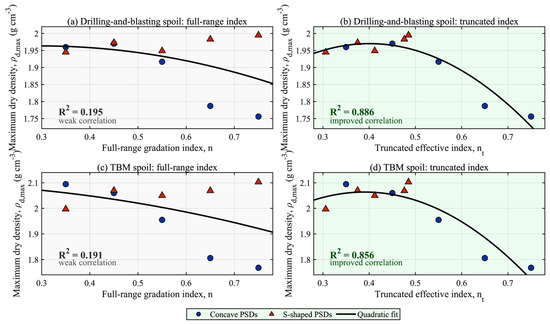
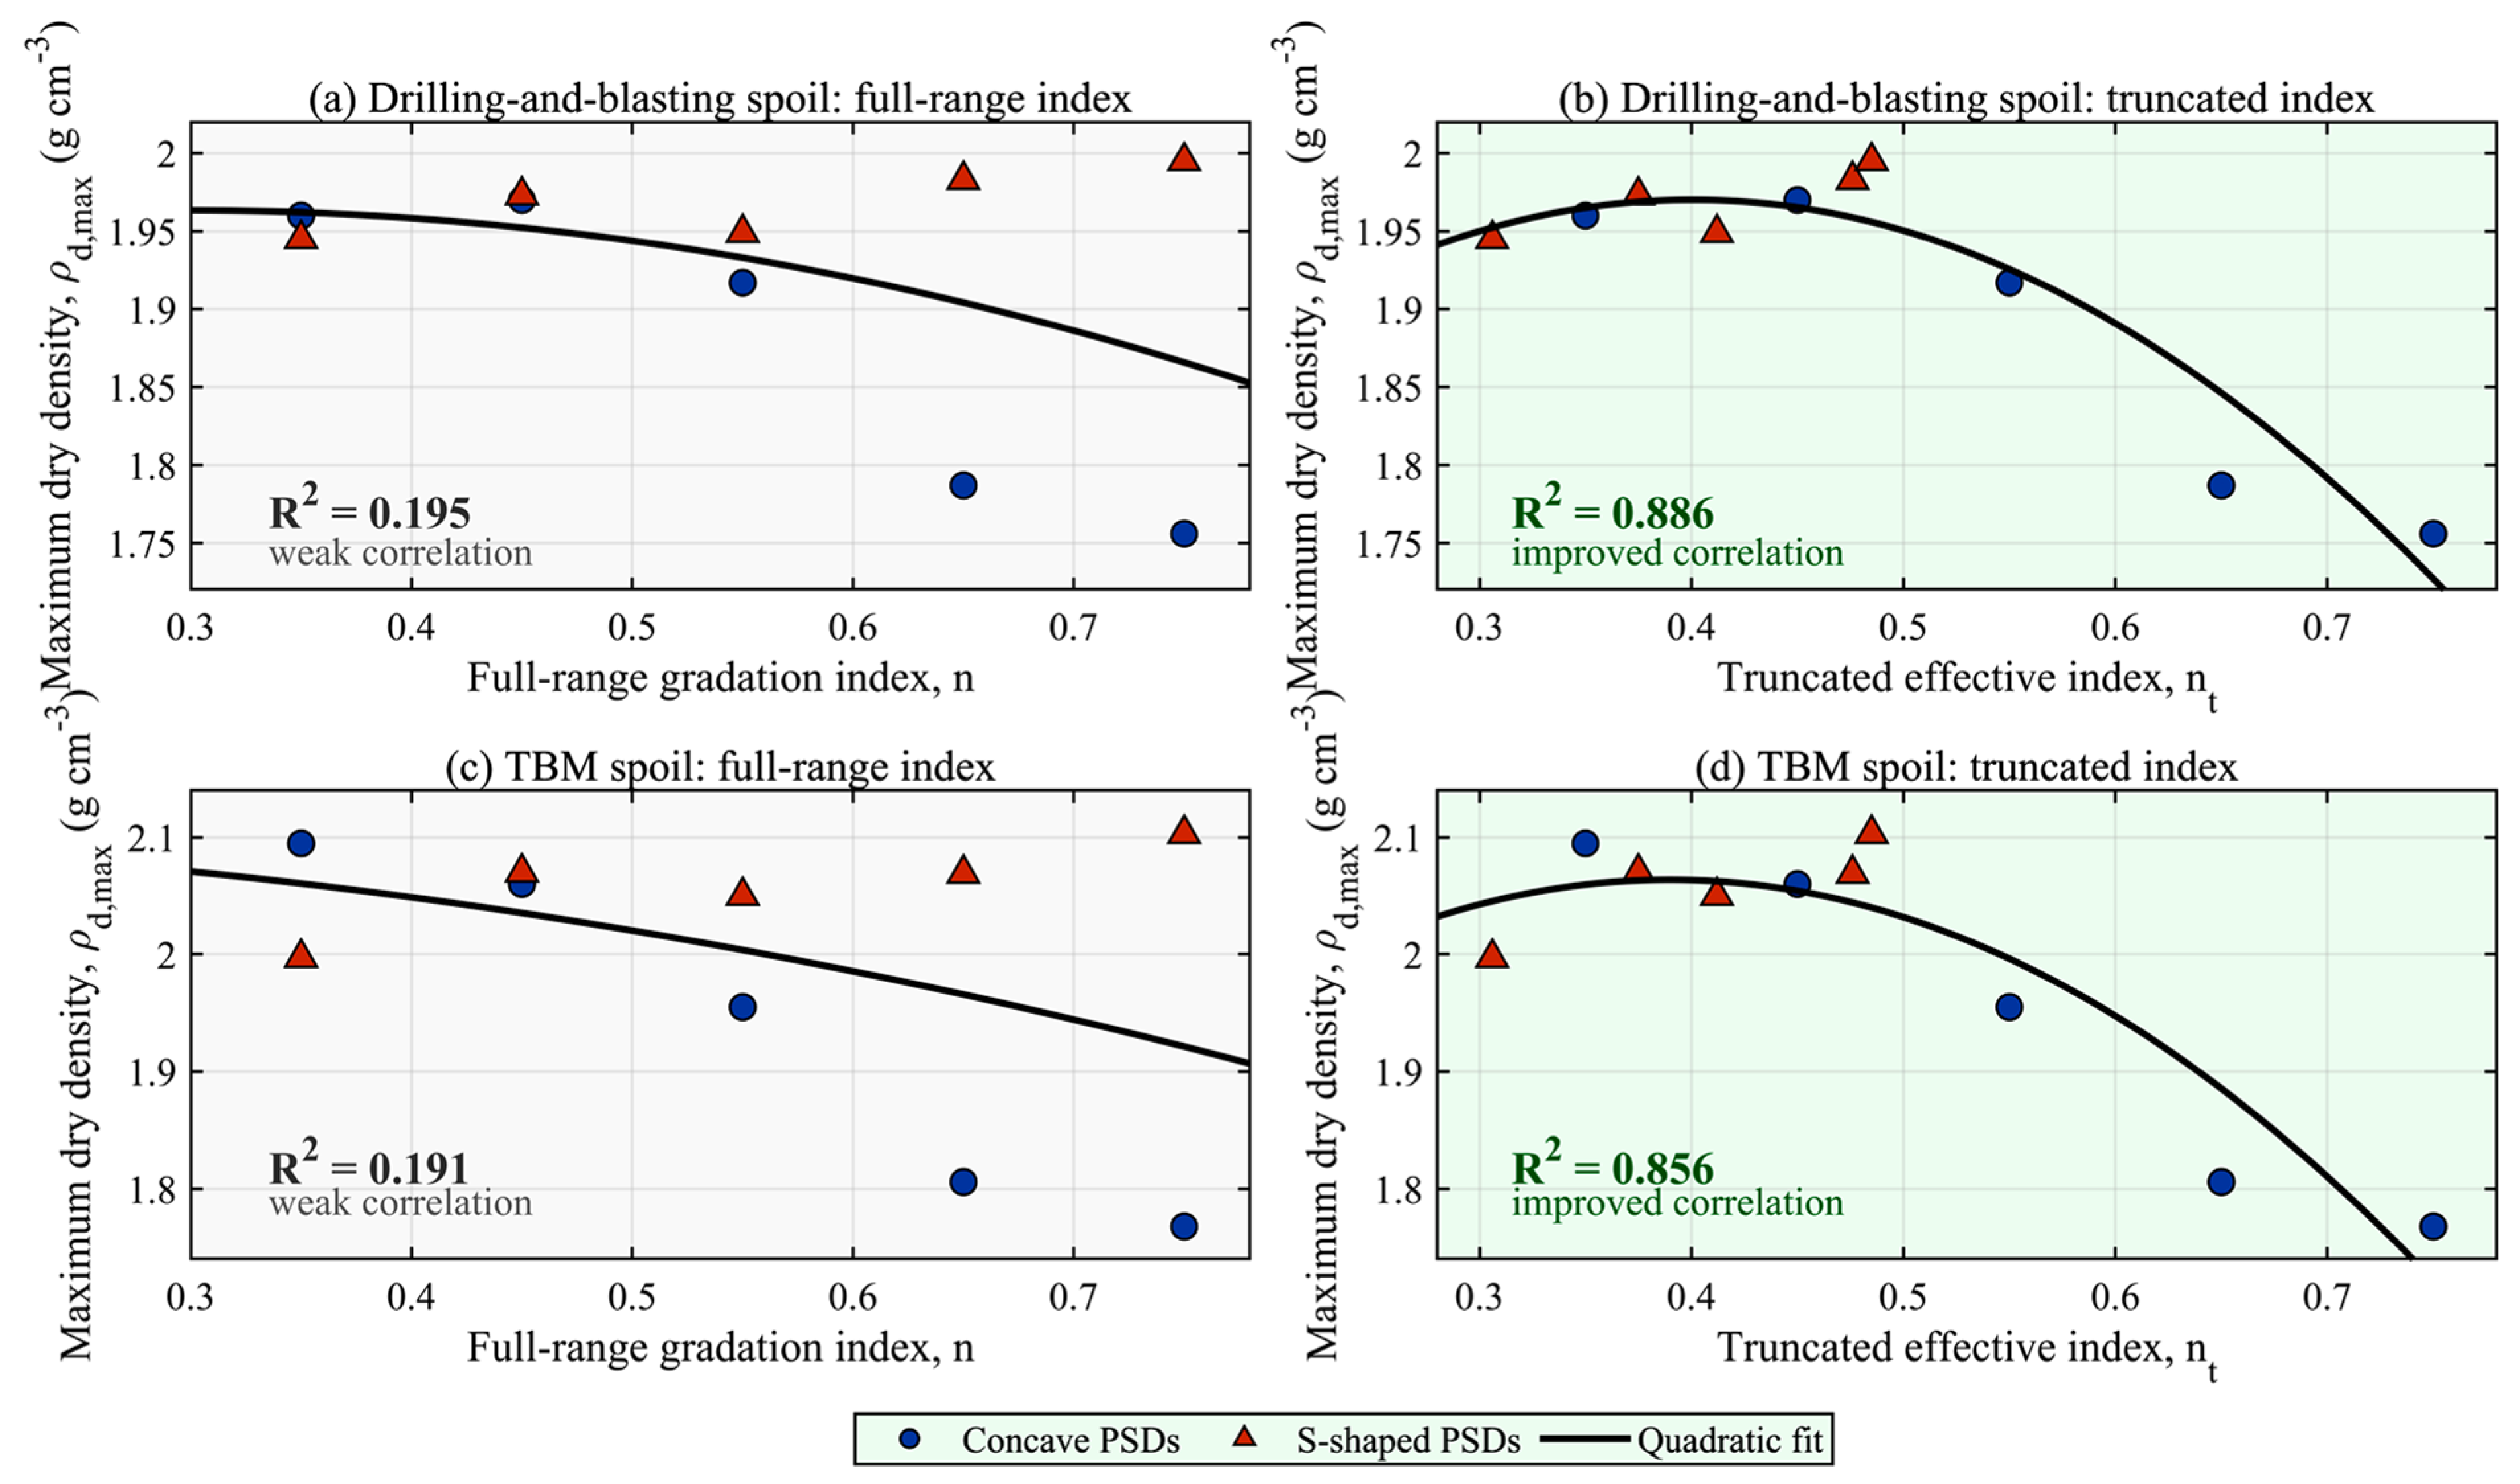
To further evaluate whether truncation improves the characterization of compaction response, the measured maximum dry densities of the 20 concave and S-shaped PSDs were correlated with both the full-range index n and the truncated effective index nt. A quadratic fit was used for each material source. The quadratic fit was used here as a simple and identical comparison form for both n and nt, rather than as an optimized prediction model. The purpose was to compare the relative ability of the full-range and truncated indices to characterize maximum dry density response under the same fitting form.
As shown in Figure 6, the relationship between ρd,max and the full-range index n was weak, with R2 = 0.195 for drilling-and-blasting spoil and R2 = 0.191 for TBM spoil. After replacing n with nt, the corresponding R2 values increased to 0.886 and 0.856, respectively. Because the available datasets were not designed as repeated statistical experiments, this R2 comparison is used as internal consistency evidence rather than as a formal statistical significance test. This indicates that response-constrained truncation improves the ability of the fractal index to characterize the maximum dry density response of non-ideal PSDs.
Figure 6.
Comparison of maximum dry density characterization before and after PSD truncation.
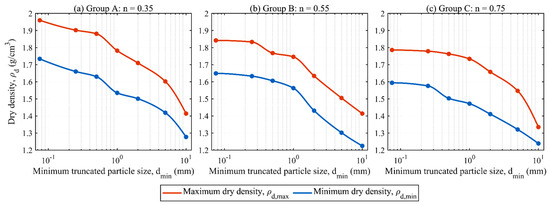
The progressive truncation tests of Groups A–C were then used to quantify the density response caused by the stepwise removal of fine-size fractions. As shown in Figure 7, both ρd,max and ρd,min generally decreased as the minimum truncated particle size increased from 0.075 to 10 mm. This trend shows that fine fractions contribute to void filling and packing densification, and that different particle-size intervals contribute unequally to compaction density. These observations provide the experimental basis for defining the unit-mass packing densification contribution coefficient ηj from the maximum dry density differences between adjacent truncated PSDs.
Figure 7.
Variations in maximum and minimum dry densities of Groups A–C with increasing minimum truncated particle size.
This re-analysis of the previous PSDs and the progressive truncation tests together support the need for a response-constrained effective fitting interval. They also motivate the construction of ηj-d response curves to identify the compaction-response transition diameter dc.
3.2. Density-Response Basis for ηj Calculation
The progressive truncation tests provide the density-response basis for calculating ηj. For each adjacent pair of truncated PSDs, the maximum dry density difference Δρj was normalized by the corresponding interval mass fraction pj to obtain ηj. Therefore, ηj should be interpreted as a response-normalized index derived from the measured density sequence, rather than as an independently measured density parameter. The purpose of introducing ηj is not to reconstruct the density sequence itself, but to compare the relative unit-mass densification contribution of different particle-size intervals and to support the subsequent identification of the ηj-d response trend and transition diameter dc.
3.3. Unimodal Response of ηj to Particle Size
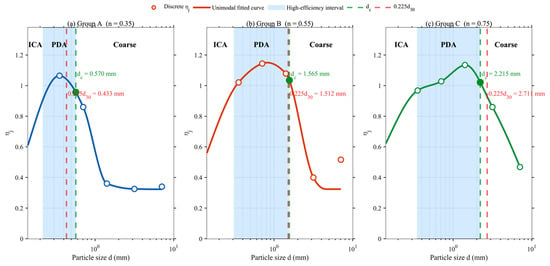
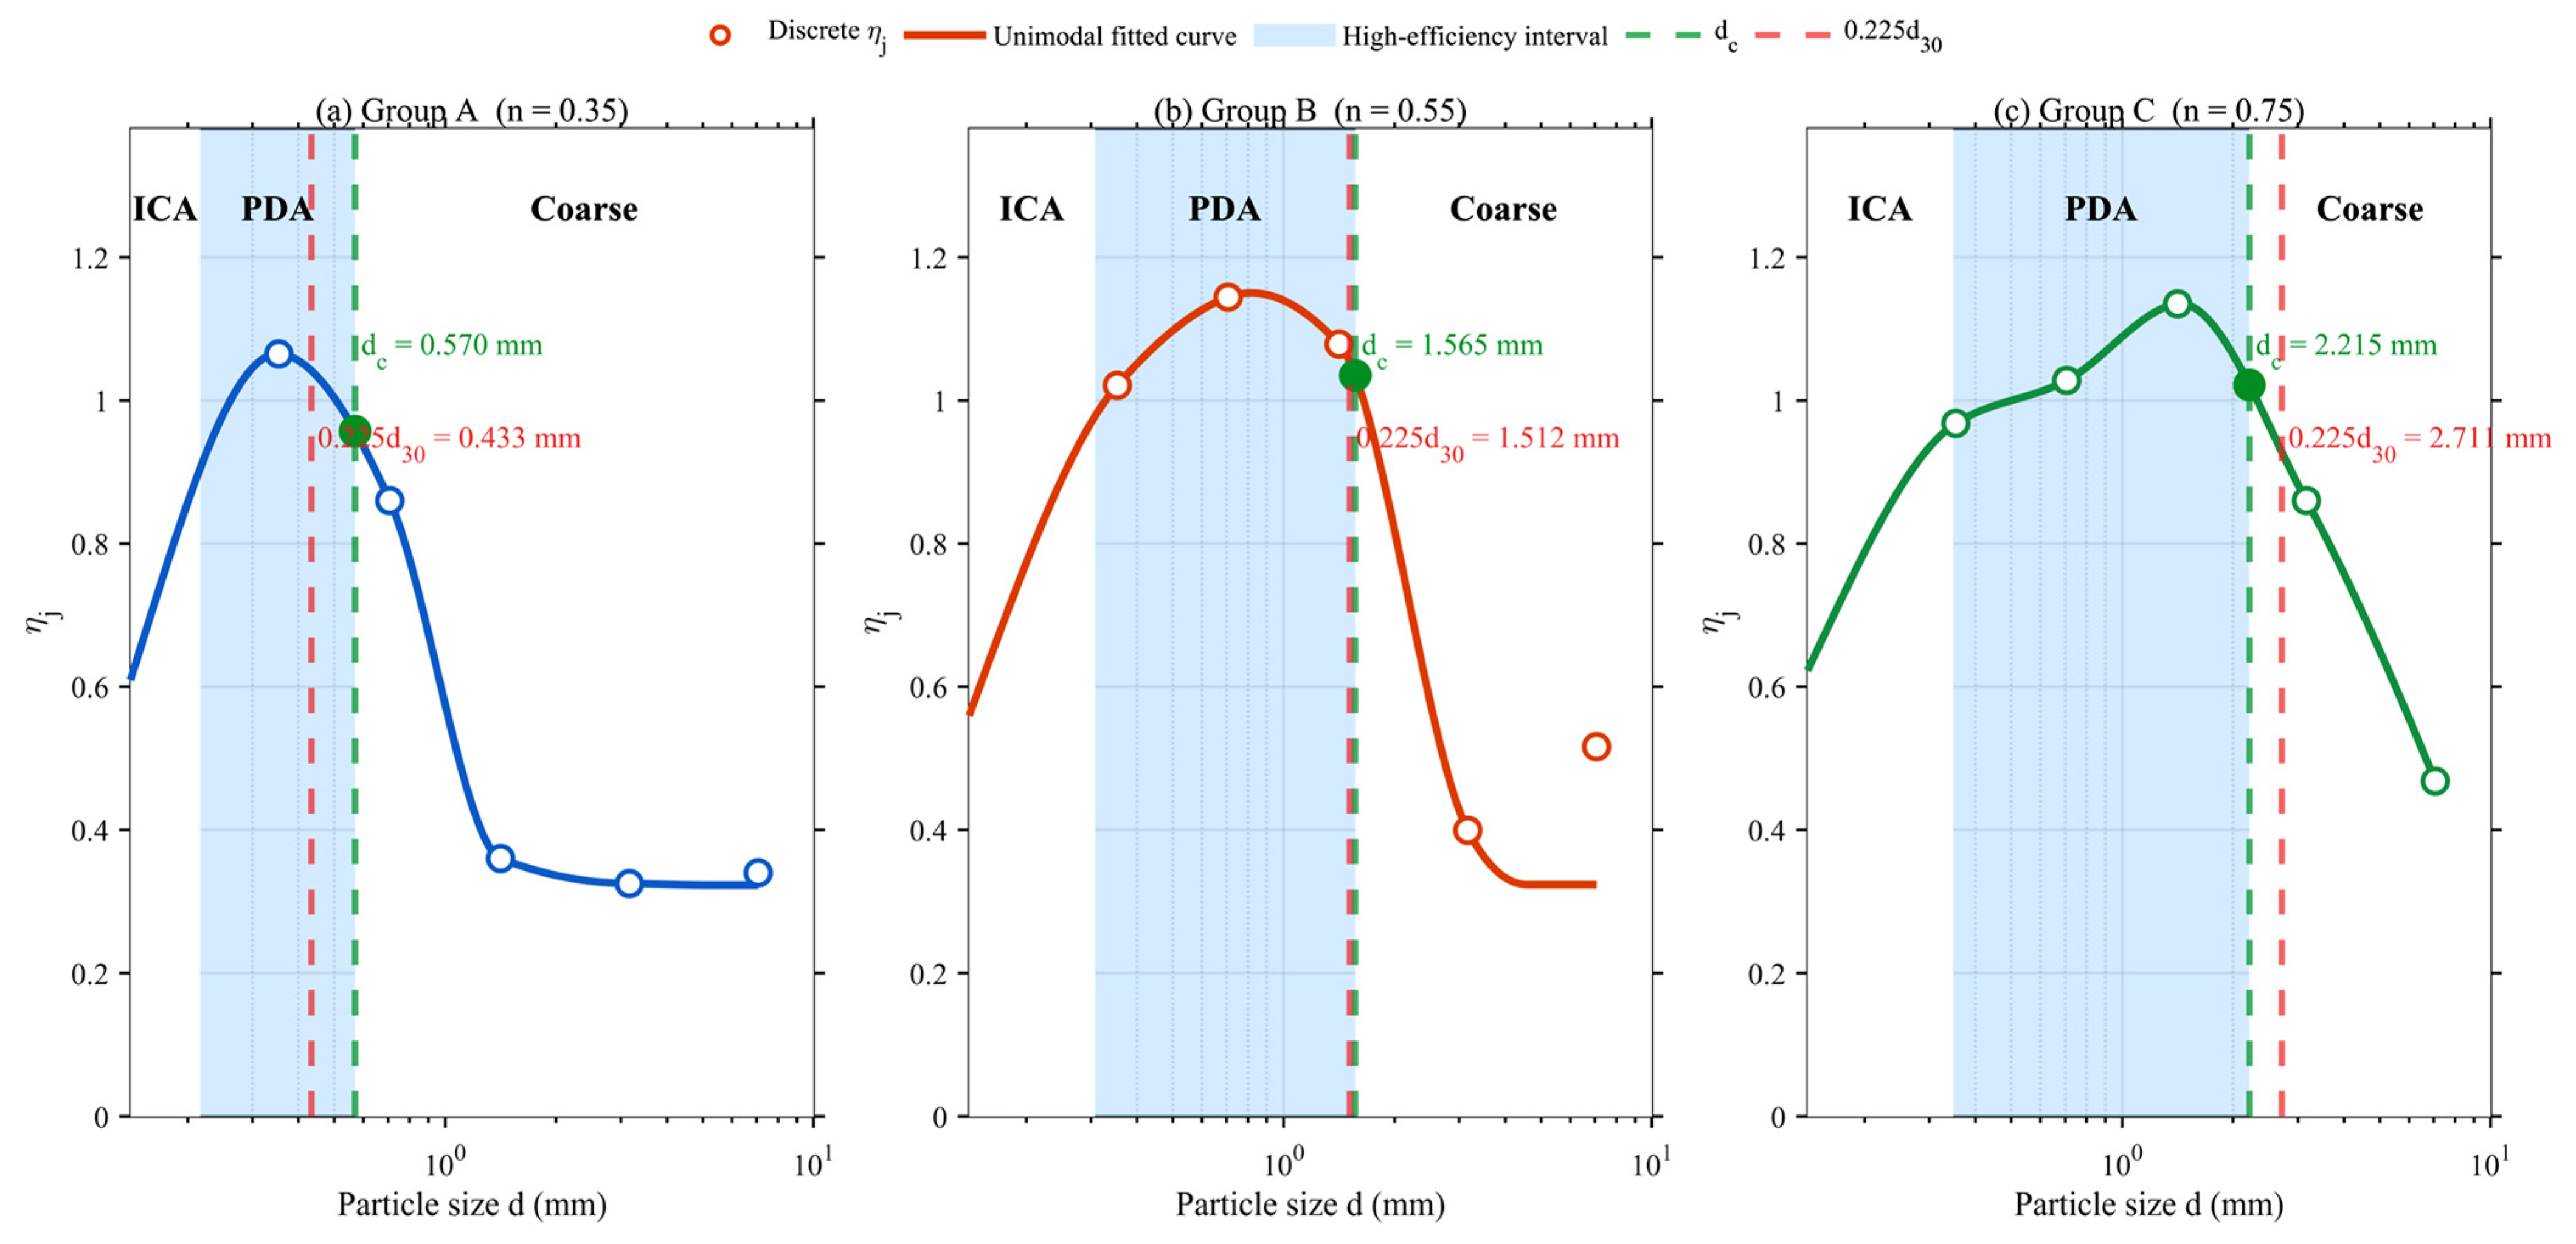
As shown in Figure 8, the ηj-d curves of Groups A–C exhibit clear unimodal responses, indicating that the unit-mass densification contribution first increases from the fine-particle range to an effective filling range and then decreases as particle size further increases. With increasing PSD coarseness, both the peak position and the high-efficiency interval shift toward larger particle sizes. In Group A, the high-efficiency interval is mainly around 0.25–0.5 mm; in Group B, it shifts to approximately 0.5–2 mm; and in Group C, it extends further toward larger particle-size intervals. This migration suggests that the effective filling scale is controlled by the characteristic skeleton-pore size rather than by a fixed particle diameter. Therefore, using a constant lower truncation size for different PSDs may either remove particles that still contribute to densification in finer PSDs or retain low-efficiency fine fractions in coarser PSDs.
Figure 8.
Unimodal response of the unit-mass packing densification contribution coefficient ηj to particle size for Groups A–C. Note: Symbols denote the discrete ηj values listed in Table 3; solid curves denote the unimodal-constrained response curves; and shaded areas denote the high-efficiency intervals.
3.4. Continuous Percentile Search and Engineering Selection of d30
To avoid dependence on a limited set of discrete characteristic diameters, the percentile diameter dq was searched continuously. For the standard fractal PSDs of Groups A–C, Equation (1) gives the following:
dq = dmax(q/100)1/n.
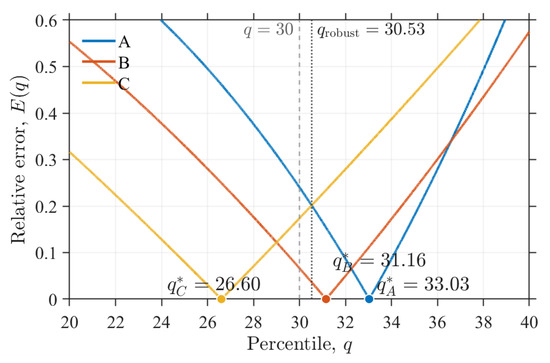
The relative error between the tetrahedral-void estimate 0.225dq and the response-based transition diameter dc is defined as follows:
E(q) = |0.225dq − dc|/dc.
The optimal characteristic scales obtained from the continuous percentile search are summarized in Table 5.
Table 5.
Optimal characteristic scales from the continuous percentile search.
The group-specific optimal percentiles were q* = 33.03, 31.16, and 26.60 for Groups A, B, and C, respectively, all concentrated near q ≈ 30. If only the mean relative error is minimized, the common optimum is approximately q = 31.16. However, a unified engineering scale should also avoid excessive error for any individual PSD. Therefore, a robust criterion was used:
The robust optimum was identified as qrobust = 30.53. At this percentile, the relative errors for Groups A, B, and C were 0.202, 0.036, and 0.201, respectively. Taking E(q) ≤ 0.25 as a practical low-error criterion, the common low-error interval was q = 29.87–31.45, within which q = 30 is included. This threshold is not intended as a theoretical boundary; it is used as a practical tolerance to identify whether the geometric estimate and the response-based dc fall within the same engineering scale range. Therefore, the continuous percentile search does not aim to replace the conventional d30 with the nonstandard d30.53. Instead, it verifies that d30 is located within a stable percentile range that is consistent with the compaction-response transition diameter dc. Figure 9 shows the relative error E(q) as a function of percentile q for Groups A–C.
Figure 9.
Relative error E(q) as a function of percentile q for Groups A–C. The dashed and dotted lines indicate q = 30 and qrobust = 30.53, respectively.
The value qrobust = 30.53 should not be interpreted as a new characteristic particle-size index. Instead, it was used to verify whether the conventional d30 falls within a response-consistent low-error percentile interval. Therefore, the use of d30 is a practical engineering simplification supported by the percentile search, rather than a replacement of d30 by d30.53.
3.5. Sensitivity of dc to the Threshold β
Because the definition of dc includes the threshold parameter β, the sensitivity of the identified transition diameter to β was evaluated for β = 0.85, 0.90, and 0.95. The results are summarized in Table 6. The same curve-construction and interpolation procedure was used for all cases.
Table 6.
Sensitivity of dc and relative error of dL to threshold β.
As β increases from 0.85 to 0.95, dc moves toward the peak of the response curve. The scale dL = 0.225d30 is closest to dc at β = 0.95 for Group A, β = 0.90 for Group B, and β = 0.85 for Group C. This does not indicate that the optimal β changes systematically by group; instead, it indicates that 0.225d30 corresponds to a transition interval rather than to a single fixed-threshold point. Therefore, dL = 0.225d30 is not obtained by tuning β but remains within the neighborhood of the transition from highly effective filling to reduced densification efficiency.
3.6. Proposed Lower Fitting Limit
Combining the tetrahedral void geometry, the unimodal ηj-d response, the continuous percentile search, and the β sensitivity analysis, the following preliminary lower fitting limit is proposed for response-constrained fractal fitting of non-ideal PSDs:
dL = 0.225d30.
In Equation (11), the coefficient 0.225 originates from ideal equal-sphere tetrahedral void geometry, and d30 is not a strict skeleton boundary or a group-specific mathematical optimum. Rather, it is an engineering representative of the response-consistent percentile interval near q ≈ 30. Equation (11) should be interpreted as a preliminary engineering estimate for response-constrained truncation, not as a mandatory preprocessing rule for all PSDs.
4. Discussion
4.1. Mechanism of Fine-End Disturbance in Full-Range Fractal Fitting
The bias of full-range fractal fitting originates from the nearly equal statistical influence of all size points in log–log regression. Although fine fractions may have small mass contents, they may span a large logarithmic size range and, therefore, exert a leverage effect on the regression slope. For concave PSDs, all size intervals approximately follow one power law, and the fine end does not produce strong interference. For S-shaped or locally deviated PSDs, however, the fine end and intermediate segments introduce both structural and non-structural information into the full-range slope, obscuring the physical meaning of the fractal index.
A separate controlled sensitivity analysis of fines content was not conducted in this study. Therefore, the leverage effect is interpreted from the log-scale regression geometry and from the comparison between full-range and truncated indices, rather than as a statistically isolated fines-content effect.
Accordingly, the need for truncation does not depend simply on whether fine particles are present. It depends on whether the full-range parameter is inconsistent with the compaction response. For nearly power-law PSDs with stable full-range response, truncation is unnecessary. For locally deviated PSDs, response-constrained truncation helps reconstruct the meaning of the fractal parameter.
4.2. Differences from Existing Particle-Structure Descriptors
The proposed method differs from the dominant aggregate size range (DASR) method, the Dinger–Funk model, and fixed-sieve truncation. DASR identifies a dominant aggregate size range primarily from the perspective of coarse-aggregate contact networks [38,39]. The ηj method in this study starts from maximum dry density differences between adjacent truncated PSDs and identifies the effective lower fitting limit through unit-mass densification contribution. Thus, DASR emphasizes contact networks, whereas the present method emphasizes packing densification response.
In the Dinger–Funk model, the minimum particle size is a boundary parameter of a distribution function [5]. In contrast, dL in this study is an effective fitting lower limit constrained by compaction response, tetrahedral void geometry, and continuous percentile search. Compared with fixed truncation at 0.075 mm, 0.5 mm, or another sieve size, dL = 0.225d30 adapts to the skeleton scale of the PSD and is, therefore, more suitable for non-ideal, widely graded PSDs.
Therefore, the proposed method is complementary to DASR and packing-density models. DASR focuses mainly on identifying the dominant contact skeleton, and packing-density models aim to predict absolute packing density or porosity, whereas the present framework uses compaction response to identify a lower fitting limit for fractal characterization of non-ideal PSDs.
4.3. Reasonableness of d30 as an Equivalent Skeleton Scale
A real polydisperse granular system does not contain a single particle diameter that strictly defines the skeleton boundary. If only d10, d20, d30, d40, and d50 are compared, the result can depend on the preselected candidates. The continuous percentile search avoids this limitation by examining the match between 0.225dq and dc over the full percentile space.
The three group-specific optima concentrate between q = 26.60 and 33.03, and the robust common optimum is q = 30.53. Because d30 lies within this response-consistent interval and is already widely used in engineering gradation analysis, selecting d30 as the representative equivalent skeleton scale balances physical consistency and practical applicability.
4.4. Applicability and Boundary Conditions
The method is intended for non-ideal PSDs whose full-range fractal characterization is inconsistent with compaction response. In engineering use, non-ideal PSDs and response mismatch can be diagnosed using several indicators: systematic rather than random residuals in full-range log–log fitting, S-shaped trends, local bulges, gap gradation, fine-end enrichment, weak correlation between the full-range fractal index and maximum dry density, or obvious density-response dispersion among PSDs with similar nominal indices. These indicators are intended as practical diagnostic markers rather than fixed universal thresholds.
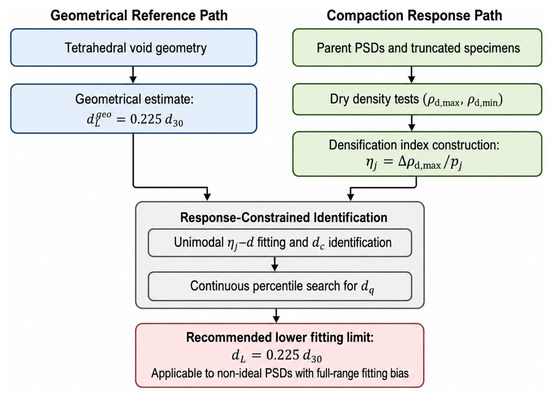
Under such conditions, response-constrained truncation can reduce the regression influence of low-efficiency or non-structural size fractions and refocus the fractal parameter on the effective structural interval. For smooth, continuous PSDs whose full-range parameter already reflects compaction response, truncation may remove fractions that still contribute structurally. Therefore, Equation (11) should be used only after a response mismatch is identified. A suggested workflow is shown in Figure 10.
Figure 10.
Suggested workflow for applying the response-constrained truncation framework to non-ideal PSDs.
4.5. Implications for Structure-Performance Characterization
The proposed framework provides a response-constrained strategy for PSD characterization of non-ideal, widely graded granular materials. For powders, aggregates, waste rock, and engineering spoil, the lower fitting limit of fractal PSD analysis should not be determined only by a fixed sieve size or empirical cutoff. It should be related to the contribution of different particle-size intervals to packing and compaction.
The estimate dL = 0.225d30 links the fitting range to both skeleton scale and densification response. The resulting fractal parameter is, therefore, more closely associated with the dominant packing structure. However, this index cannot replace strength, deformation, permeability, or durability evaluations. For regular continuous PSDs with stable full-range behavior, complete PSD information should still be retained.
4.6. Limitations
This study has several limitations. First, the coefficient 0.225 is derived from ideal equal-sphere close packing, whereas real particle shape, angularity, surface roughness, and breakage can alter pore-throat geometry. Therefore, Equation (11) should be understood as a geometrically referenced estimate rather than a universal constant. For highly angular crushed aggregates or materials with much larger maximum particle sizes, particle interlocking, breakage, and pore geometry may differ substantially from the idealized packing assumption. Mineral composition, surface friction, and moisture-related interparticle forces may further affect particle rearrangement and the effective filling scale. Moreover, the tetrahedral void represents only one idealized packing geometry; alternative assumptions, such as octahedral voids or cubic packing, correspond to larger void scales and would lead to larger candidate truncation diameters. A systematic comparison of different void-geometry assumptions is left for future work.
Second, the maximum particle size of the three progressive-truncation groups is 60 mm, and larger particle-size spans require further verification. Third, the unimodal curve construction of ηj-d responses was used to extract the dominant response trend, but PSDs with dual skeletons or multiple effective filling intervals may require more flexible response models. Fourth, complete repeatability statistics were not available in the present dataset. Therefore, the R2 comparison, ηj-d response analysis, and β sensitivity analysis should be interpreted as internal consistency evidence rather than complete statistical validation.
The proposed method is currently a response-constrained framework for identifying a lower fitting limit, rather than a universal predictive equation. The present dataset supports the feasibility and internal consistency of the framework, but it is not sufficient to establish dL = 0.225d30 as a universal empirical law. Future work should test ηj, dc, and dL across more material types, particle shapes, particle-size spans, and datasets with complete repeatability statistics. In addition, discrete element modeling (DEM), which has been widely used to simulate interparticle contacts, contact-force transmission, and gradation-dependent packing behavior in granular assemblies [31,40,41], could be combined with the present framework in future work to examine the contact-network basis of ηj, dc, and dL, as well as the influence of particle shape and breakage on cross-material applicability.
5. Conclusions
(1) The re-analysis of 20 concave and S-shaped PSDs showed that full-range fractal fitting is appropriate for nearly power-law PSDs but can be biased by fine-end or local deviations in S-shaped PSDs. After applying dL = 0.225d30, concave PSDs remained nearly unchanged, whereas the effective indices of S-shaped PSDs changed from n = 0.35–0.75 to nt = 0.306–0.485. The truncated index substantially improved the relationship with maximum dry density for both material sources.
(2) The unit-mass packing densification contribution coefficient ηj quantified the normalized contribution of each particle-size interval. The ηj-d curves of Groups A–C exhibited unimodal responses, and the peak shifted toward larger particle sizes with increasing PSD coarseness. This indicates that the effective filling scale is controlled by the characteristic skeleton-pore size rather than by a fixed particle diameter.
(3) By combining tetrahedral void geometry with continuous percentile search, dL = 0.225d30 was proposed as a preliminary engineering estimate of the lower fitting limit for non-ideal PSDs. The optimal percentiles of the three groups clustered near q ≈ 30, with a robust common optimum of 30.53. Sensitivity analysis for β = 0.85–0.95 further indicated that 0.225d30 lies within the transition region from highly effective filling to reduced densification efficiency.
(4) The method is mainly applicable to non-ideal PSDs with local deviations, fine-end disturbances, or a mismatch between full-range fractal parameters and compaction response. It should not be used as a mechanical preprocessing rule for smooth power-law PSDs, and its cross-material applicability requires further validation.
Supplementary Materials
The following supporting information can be downloaded at: https://www.mdpi.com/article/10.3390/ma19122675/s1, Table S1. complete gradation compositions of the progressively truncated specimens.
Author Contributions
Conceptualization, X.-Q.W. and X.-J.P.; methodology, X.-Q.W., G.-F.R. and X.-C.Z.; software, G.-F.R. and X.-C.Z.; validation, X.-Q.W. and G.-F.R.; formal analysis, G.-F.R., X.-Q.W., Y.W. and Q.-Y.H.; investigation, G.-F.R., X.-C.Z., Y.W. and Q.-Y.H.; resources, X.-J.P. and X.-C.Z.; data curation, X.-C.Z., G.-F.R., Y.W. and Q.-Y.H.; writing—original draft preparation, G.-F.R.; writing—review and editing, X.-Q.W., X.-J.P., X.-C.Z. and G.-F.R.; visualization, G.-F.R. and X.-C.Z.; supervision, X.-J.P. and X.-C.Z.; project administration, X.-J.P. and X.-C.Z.; funding acquisition, X.-J.P. All authors have read and agreed to the published version of the manuscript.
Funding
This research was funded by the Key Research and Development Program of the Tibet Autonomous Region, “Research, Application, and Demonstration of Ecological Restoration Technologies in Ecologically Sensitive Areas along the Tibet Section of the Sichuan–Tibet Railway” (grant No. XZ202401ZY0091), the Tianfu Yongxing Laboratory Organized Research Project Funding (grant No. 2023KJGG05), and the 2026 Key Scientific Research Project of Sichuan Jiaotong Polytechnic University, “Key Technologies for Classified Resource Utilization of Traffic Engineering Spoil in Alpine Canyon Areas” (grant No. 2026-KJ-11).
Institutional Review Board Statement
Not applicable.
Informed Consent Statement
Not applicable.
Data Availability Statement
The original contributions presented in this study are included in the article/Supplementary Material. Further inquiries can be directed to the corresponding authors.
Acknowledgments
During the preparation of this manuscript, the authors used generative AI tools for language polishing and for drafting preliminary conceptual graphics. The authors reviewed and edited all outputs and take full responsibility for the content of this publication.
Conflicts of Interest
Authors Guo-Feng Ren, Yi Wang and Qiu-Yue Hu were employed by Sichuan Water Development Investigation, Design & Research Co., Ltd. The remaining authors declare that the research was conducted in the absence of any commercial or financial relationships that could be construed as a potential conflict of interest.
Correction Statement
This article has been republished with a minor correction to the existing affiliation information. This change does not affect the scientific content of the article.
Abbreviations
| Abbreviation | Definition |
| PSD | Particle-size distribution |
| DASR | Dominant aggregate size range |
| TBM | Tunnel boring machine |
References
- Westman, A.E.R.; Hugill, H.R. The packing of particles. J. Am. Ceram. Soc. 1930, 13, 767–779. [Google Scholar] [CrossRef] [Scilit]
- Furnas, C.C. Grading aggregates I: Mathematical relations for beds of broken solids of maximum density. Ind. Eng. Chem. 1931, 23, 1052–1058. [Google Scholar] [CrossRef] [Scilit]
- McGeary, R.K. Mechanical packing of spherical particles. J. Am. Ceram. Soc. 1961, 44, 513–522. [Google Scholar] [CrossRef] [Scilit]
- Andreasen, A.H.M.; Andersen, J. Ueber die Beziehung zwischen Kornabstufung und Zwischenraum in Produkten aus losen Körnern. Kolloid-Zeitschrift 1930, 50, 217–228. [Google Scholar] [CrossRef] [Scilit]
- Funk, J.E.; Dinger, D.R. Predictive Process Control of Crowded Particulate Suspensions; Springer: Boston, MA, USA, 1994. [Google Scholar]
- De Larrard, F. Concrete Mixture Proportioning: A Scientific Approach; E & FN Spon: London, UK, 1999. [Google Scholar]
- Yu, A.B.; Standish, N. A study of the packing of particles with a mixture size distribution. Powder Technol. 1993, 76, 113–124. [Google Scholar] [CrossRef] [Scilit]
- Yu, A.B.; Zou, R.P.; Standish, N. Modifying the linear packing model for predicting the porosity of nonspherical particle mixtures. Ind. Eng. Chem. Res. 1996, 35, 3730–3741. [Google Scholar] [CrossRef] [Scilit]
- Yu, A.B.; Zou, R.P.; Standish, N. Packing of ternary mixtures of nonspherical particles. J. Am. Ceram. Soc. 1992, 75, 2765–2772. [Google Scholar] [CrossRef] [Scilit]
- Cavarretta, I.; Coop, M.R.; O’Sullivan, C. The influence of particle characteristics on the behaviour of coarse grained soils. Géotechnique 2010, 60, 413–423. [Google Scholar] [CrossRef] [Scilit]
- Hardin, B.O. Crushing of soil particles. J. Geotech. Eng. 1985, 111, 1177–1192. [Google Scholar] [CrossRef] [Scilit]
- Xiao, Y.; Meng, M.; Daouadji, A.; Chen, Q.; Wu, Z.; Jiang, X. Effects of particle size on crushing and deformation behaviors of rockfill materials. Geosci. Front. 2020, 11, 375–388. [Google Scholar] [CrossRef] [Scilit]
- Wu, E.L.; Zhu, J.G.; Guo, W.L.; Chen, G. Experimental study on the scale effect of compaction density of coarse-grained materials. Chin. J. Geotech. Eng. 2019, 41, 1767–1772. [Google Scholar] [CrossRef] [Scilit] [PubMed]
- Chu, F.Y.; Zhu, J.G.; Weng, H.Y.; Ye, Y.F. Study on maximum dry density of scaled coarse-grained materials. Rock Soil Mech. 2020, 41, 1599–1604. [Google Scholar]
- Zhu, S.; Deng, S.D.; Ning, Z.Y.; Wang, J. Gradation design method of rockfill materials based on fractal theory. Chin. J. Geotech. Eng. 2017, 39, 1151–1155. [Google Scholar]
- Pan, J.J.; Sun, X.J.; Zuo, Y.Z.; Wang, J.P.; Lu, Y.W.; Han, B. Study on the effect of skeleton void ratio on strength and deformation characteristics of coarse-grained soil. Rock Soil Mech. 2023, 44, 2186–2194. [Google Scholar]
- Desmond, K.W.; Weeks, E.R. Influence of particle size distribution on random close packing of spheres. Phys. Rev. E 2014, 90, 022204. [Google Scholar] [CrossRef] [Scilit] [PubMed]
- Chan, K.W.; Kwan, A.K.H. Evaluation of particle packing models by comparing with published test results. Particuology 2014, 16, 108–115. [Google Scholar] [CrossRef] [Scilit]
- Wiącek, J.; Molenda, M.; Stasiak, M. Effect of number of granulometric fractions on structure and micromechanics of compressed granular packings. Particuology 2018, 39, 88–95. [Google Scholar] [CrossRef] [Scilit]
- Wiącek, J.; Molenda, M. Effect of particle polydispersity on micromechanical properties and energy dissipation in granular mixtures. Particuology 2014, 16, 91–99. [Google Scholar] [CrossRef] [Scilit]
- Turcotte, D.L. Fractals and fragmentation. J. Geophys. Res. Solid Earth 1986, 91, 1921–1926. [Google Scholar] [CrossRef] [Scilit]
- Tyler, S.W.; Wheatcraft, S.W. Fractal scaling of soil particle-size distributions: Analysis and limitations. Soil Sci. Soc. Am. J. 1992, 56, 362–369. [Google Scholar] [CrossRef] [Scilit]
- Perfect, E.; Kay, B.D. Applications of fractals in soil and tillage research: A review. Soil Tillage Res. 1995, 36, 1–20. [Google Scholar] [CrossRef] [Scilit]
- Tong, C.X.; Burton, G.J.; Zhang, S.; Sheng, D. A simple particle-size distribution model for granular materials. Can. Geotech. J. 2018, 55, 246–257. [Google Scholar] [CrossRef] [Scilit]
- Zhu, J.G.; Guo, W.L.; Wen, Y.F.; Yin, J.; Zhou, C. New gradation equation and applicability for particle-size distributions of various soils. Int. J. Geomech. 2018, 18, 04017155. [Google Scholar] [CrossRef] [Scilit]
- Zhang, Z.T.; Wang, Y.H.; Zhang, J.Q.; Liu, Z.; Gao, W.H. A new gradation equation for coarse-grained subgrade fillers and its applicability based on the fractal theory. Geomech. Geophys. Geo-Energy Geo-Resour. 2025, 11, 20. [Google Scholar] [CrossRef] [Scilit]
- Ji, J.J.; Yao, Q.; Wu, F.; Li, H. Evaluation of particle size distribution of granular blasting materials based on the fractal theory. Adv. Mech. Eng. 2019, 11, 1–13. [Google Scholar] [CrossRef] [Scilit]
- Li, M.; Zhang, J.X.; Guo, Y.M.; Pu, H.; Peng, Y.F. Influence of particle size distribution on fractal characteristics of waste rock backfill materials under compression. J. Mater. Res. Technol. 2022, 20, 2977–2989. [Google Scholar] [CrossRef] [Scilit]
- Shen, X.; Shen, Y.; Xu, J.; Liu, H. Influence of the fractal distribution of particle size on the critical state of calcareous sand. Fractal Fract. 2022, 6, 165. [Google Scholar] [CrossRef] [Scilit]
- Hu, F.Y.; Zhang, K.N.; Zhu, K.F.; Li, B.T.; Zhang, Z. Fractal analysis on the crushing characteristics of soil-soft rock mixtures under compaction. Fractal Fract. 2024, 8, 90. [Google Scholar] [CrossRef] [Scilit]
- Bian, X.C.; Huang, H.; Tutumluer, E.; Gao, Y. Critical particle size and ballast gradation studied by discrete element modeling. Transp. Geotech. 2016, 6, 38–44. [Google Scholar] [CrossRef] [Scilit]
- McDowell, G.R.; Bolton, M.D.; Robertson, D. The fractal crushing of granular materials. J. Mech. Phys. Solids 1996, 44, 2079–2101. [Google Scholar] [CrossRef] [Scilit]
- Stovall, T.; De Larrard, F.; Buil, M. Linear packing density model of grain mixtures. Powder Technol. 1986, 48, 1–12. [Google Scholar] [CrossRef] [Scilit]
- Wang, X.Q.; Zhang, X.C.; Pei, X.J. Fractal gradation equation and maximum dry density prediction model for spoil soil. Rock Soil Mech. 2025, 46, 3157–3166. [Google Scholar]
- ASTM D4253/D4253M-16e1; Standard Test Methods for Maximum Index Density and Unit Weight of Soils Using a Vibratory Table. ASTM International: West Conshohocken, PA, USA, 2016.
- ASTM D4254-16; Standard Test Methods for Minimum Index Density and Unit Weight of Soils and Calculation of Relative Density. ASTM International: West Conshohocken, PA, USA, 2016.
- GB/T 50123-2019; Standard for Geotechnical Testing Method. China Planning Press: Beijing, China, 2019.
- Kim, S.; Roque, R.; Guarin, A.; Birgisson, B. Identification and assessment of the dominant aggregate size range (DASR) of asphalt mixture. J. Assoc. Asph. Paving Technol. 2006, 75, 789–814. [Google Scholar]
- Kim, S.; Roque, R.; Birgisson, B.; Guarin, A. Porosity of the dominant aggregate size range to evaluate coarse aggregate structure of asphalt mixtures. J. Mater. Civ. Eng. 2009, 21, 32–39. [Google Scholar] [CrossRef] [Scilit]
- Cundall, P.A.; Strack, O.D.L. A discrete numerical model for granular assemblies. Géotechnique 1979, 29, 47–65. [Google Scholar] [CrossRef] [Scilit]
- Adesina, P.; O’Sullivan, C.; Wang, T. Understanding the interplay between particle shape, grading and sample density on the behaviour of granular assemblies: A DEM approach. Granul. Matter 2024, 26, 14. [Google Scholar] [CrossRef] [Scilit]

Disclaimer/Publisher’s Note: The statements, opinions and data contained in all publications are solely those of the individual author(s) and contributor(s) and not of MDPI and/or the editor(s). MDPI and/or the editor(s) disclaim responsibility for any injury to people or property resulting from any ideas, methods, instructions or products referred to in the content. |
© 2026 by the authors. Licensee MDPI, Basel, Switzerland. This article is an open access article distributed under the terms and conditions of the Creative Commons Attribution (CC BY) license.