1. Introduction
Aluminium matrix composite (AMC) has a distinctive characteristic in multifunctional electronic packaging, renewable energy, optoelectronic devices, the telecommunication industry, medical equipment, access control systems, and others [
1]. However, many researchers have confirmed that AMC is an applicable composite to improve magnetic properties in various applications, such as electrical, aeronautical, and automotive applications [
2,
3]. Aluminium is categorised as a paramagnetic alloy with poor magnetic properties compared to ferrous materials such as steel, titanium, cast iron, and carbon steel [
4]. The innovation of new magnetic composite materials with continuous development has resulted in various choices of superconducting permanent magnet applications in electromagnetic shielding or absorption [
5].
Magnetite (Fe
3O
4), on the other hand, is a natural iron oxide magnet, which is the most abundant magnetic mineral on earth. It is one of the important ores of iron. A significant property of magnetite is the Verwey transition (Tv » 120 K), which results from a small distortion in the crystal structure when it changes from inverse cubic spinel to monoclinic and the effect presents itself in the electrical conductivity reduction, thermal expansion, and magnetisation of the mineral at the transition point [
6,
7]. Magnetite is believed to be an appropriate filler because it is abundant, inexpensive, and produces high free energy upon reaction with aluminium. This reaction develops wettability among aluminium and magnetite in providing additional energy for the rest of the process [
8]. Magnetite nanoparticles are favoured for their paramount characterised filler materials because of their noble magnetic properties. In addition, ferromagnetic materials can be classified as “soft” or “hard” depending on their response to an external magnetic field. Hard magnetic materials have a wide hysteresis loop, high saturation induction (Bs), large coercivity (Hc), and high residual induction (Br). On the other hand, soft magnetic materials have a narrow hysteresis loop, low Hc, and high magnetic permeability. Soft magnetic materials with a narrow hysteresis loop and low losses can be used as cores in electronic devices, such as power transformers in AC adapters [
9,
10].
Investigations on aluminium composite characteristics focusing on magnetic properties revealed that Fe
3O
4 nanoparticles led to an improvement in soft magnetic properties [
11,
12,
13].
Ferreira et al. investigated the magnetic properties of AMC reinforced with 10, 20, and 30 wt. % Fe
3O
4 using the powder metallurgy method. It was observed that the Ms of the composites increased by increasing the weight percentage of Fe
3O
4. Meanwhile, the saturation magnetisation (Ms) of Al-10F (0.55 ± 0.02 emu/g) and Al-20F (7.46 ± 0.05 emu/g) (Ferreira et al., 2016) was achieved with the addition of silicon carbide in the experiment, and it was observed that the Ms improved compared to the Ms for the Al-10 Fe
3O
4 of 0.55 emu/g [
10].
Fathy et al. studied the impact of iron on the mechanical, microstructure, and magnetic properties of AMCs. Mechanical ball milling was utilised for the synthesis of 0.5%, 10%, and 15% Fe-Al composites. The outcomes demonstrated that the Hc for Al-15%Fe was higher than that of Al−5%Fe and Al−10%Fe composites. This might be ascribed to the moderately fine microstructure of the 15% Fe-Al composite [
14].
Maleki et al. studied the addition of magnetic nickel ferrite into aluminium. A nickel ferrite-reinforced aluminium matrix should generate a lighter material with exceptional magnetic attributes for multiple applications, including sensitive measurement tools, automotive, and aeronautical purposes. As such, this study synthesised AMCs reinforced with NiFe
2O
4 nanoparticles to determine their magnetic characteristics, microstructure, and mechanical properties. Coercivity and magnetisation of the nanocomposite reinforced with 10 wt. % magnetic nanoparticles were 121 Oe and 1.7 emu/g, respectively [
15].
Borgohain et al. fabricated magnetic composites with cobalt ferrite magnetic nanoparticles scattered in aluminium. Cobalt ferrite contributed to the significant development of the magnetisation estimation of the aluminium matrix with an Ms of 17.07 emu/g for the aluminium sample reinforced with 10 wt.% cobalt ferrite. The Ms and Hc of the composite with 1 wt.% cobalt ferrite were found to be 3.51 emu/g and 967 Oe, respectively, which changed to the Ms of 17.07 emu/g and Hc of 583 Oe with an increase in the ferrite content (10 wt.% cobalt ferrite) in the Al matrix [
16].
Moreover, research on magnetic materials is mostly concentrated on achieving higher magnetic energy in a tiny size for various applications, such as transportation parts, hybrid motors, and sustainable energy technologies [
17]. The thermal stability of modern permanent magnets is highly related to their resistance at elevated temperatures. It implies that permanent magnet variable flux sources are more efficient compared to electromagnets because of their small size; hence, large power supplies or cooling systems are not required [
18]. It is also necessary to design advanced magnetic materials in electrical applications, such as automobiles and aircraft, to withstand higher speeds or high torsion, large loads, and higher temperatures of up to 600 °C. The invention of novel magnetic materials is an ongoing process, leading to a diverse selection of superconducting permanent magnet applications for the electrical industry [
19,
20].
There are limitations to design materials that can eliminate heat and preserve their dimensional stability at elevated temperatures and in corrosive environments in the electronics industry [
21]. Although much research on the thermal properties of AMC has been conducted, there is no information available that focuses on the thermal properties of Al-Fe
3O
4 composites produced using the powder metallurgy method. Moreover, the thermal expansion coefficient of aluminium is higher compared to ceramics and metal oxides; thus, major variations in dimensions with increasing temperatures would cause difficulties with metallic components with close tolerance [
22]. In this regard, one of the new methods to diminish the thermal expansion of aluminium is the addition of particles with a lower coefficient of thermal expansion, as reinforcing aluminium with Fe
3O
4 nanoparticles will lead to a decrease in thermal expansion.
AMCs are commonly manufactured, either using powder metallurgy or liquid route. However, the powder metallurgy method has been recognised as a very promising method and the most attractive option due to several advantages. One of the advantages is the control over the microstructural phases. The low temperature required throughout the process accounts for the severe control of interphase kinetics. Other fabrication techniques such as casting have the drawbacks of reinforcement segregation, reaction between reinforcement particles and matrix, interfacial chemical reactions, and high localised residual porosity along with poor interfacial bonding. Powder metallurgy can fabricate a homogeneous and net-shape product to obtain properties that are not achievable by conventional metal processing technologies [
23].
Powder metallurgy is one of the low-cost methods for fabricating complex shapes. When magnetic powder is involved, interfacial reactions between magnetic powder and the aluminium matrix must be avoided. This is to inhibit the formation of undesirable phases that may reduce the bonding between the matrix and the particles, hence affecting its magnetisation property. On the other hand, porosity negatively affects mechanical and physical properties. The advantages of powder metallurgy include the ability to fabricate complex shapes with precise dimensions, uniform distribution of reinforcements, and lower porosity at low costs. The key advantage of powder metallurgy is that the reinforcement and matrix are mixed in the solid state which prevents the formation of any unwanted phases, the uniform distribution of reinforcement in the matrix and better control of microstructure, low manufacturing temperatures that reduces the interfacial reactions among the matrix and reinforcements.
There are various advantages of isostatic pressing over uniaxial pressing, including uniform strength in all directions. The pressure used to compact the powder is applied equally in all directions and provides uniform density, increases density, and improves the material’s mechanical properties. A two-step compaction results in lower porosity in samples. During the production of samples with the powder metallurgy technique, two factors need to be investigated, firstly the mechanical parameters such as compressing pressure, ball milling time and speed, sintering temperature, and time. Secondly, metallurgical factors such as the amount and shape (fiber or particles) of the reinforcement. Metallurgical factors refer to the metallurgical parameters such as the size and shape of the reinforcements, the interfacial characteristics, and also the volume fraction or weight percentage of the reinforcement [
21,
22,
24,
25,
26].
In this study, aluminium composites that utilise Fe3O4 nanopowder were developed. The magnetic, electrical, thermal, hardness, and compressive properties are systematically investigated to identify the optimum amount of nanofiller with processing operational steps.
3. Results and Discussion
3.1. Microstructural Analysis
The microstructure depends on several factors, such as solidification rate, type, and amount of reinforcement [
27].
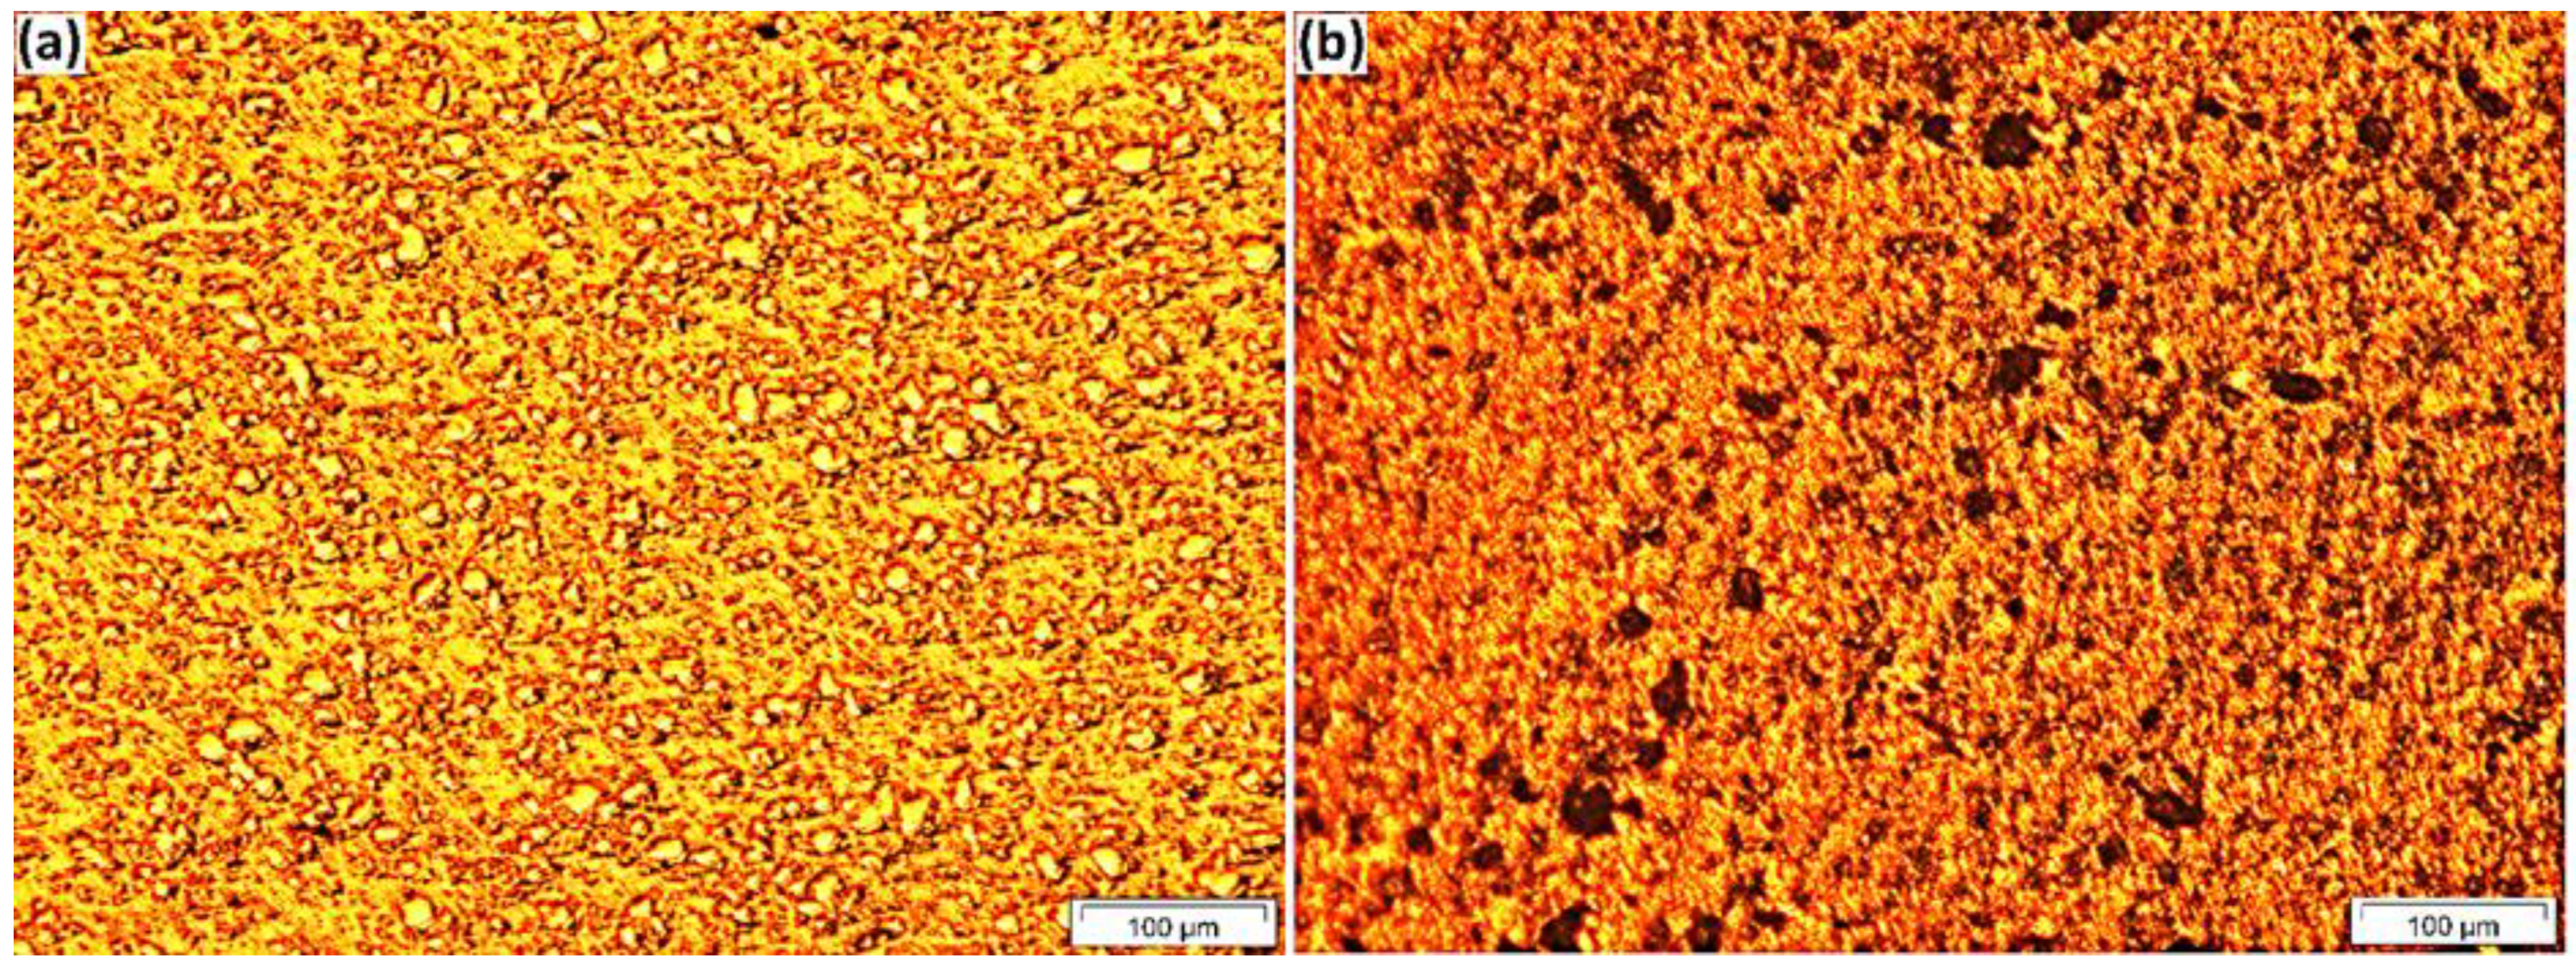
Figure 3 indicates the OM images of the a.5 composite before and after etching, which confirmed that the distribution of Fe
3O
4 particles in the composite is homogeneous, and no pores or cracks could be observed on the composite surface. The optical microscopy for a.5 identified that the microstructure consisted of the following three main phases: aluminium, Fe
3O
4, and intermetallic compound Al
3Fe.
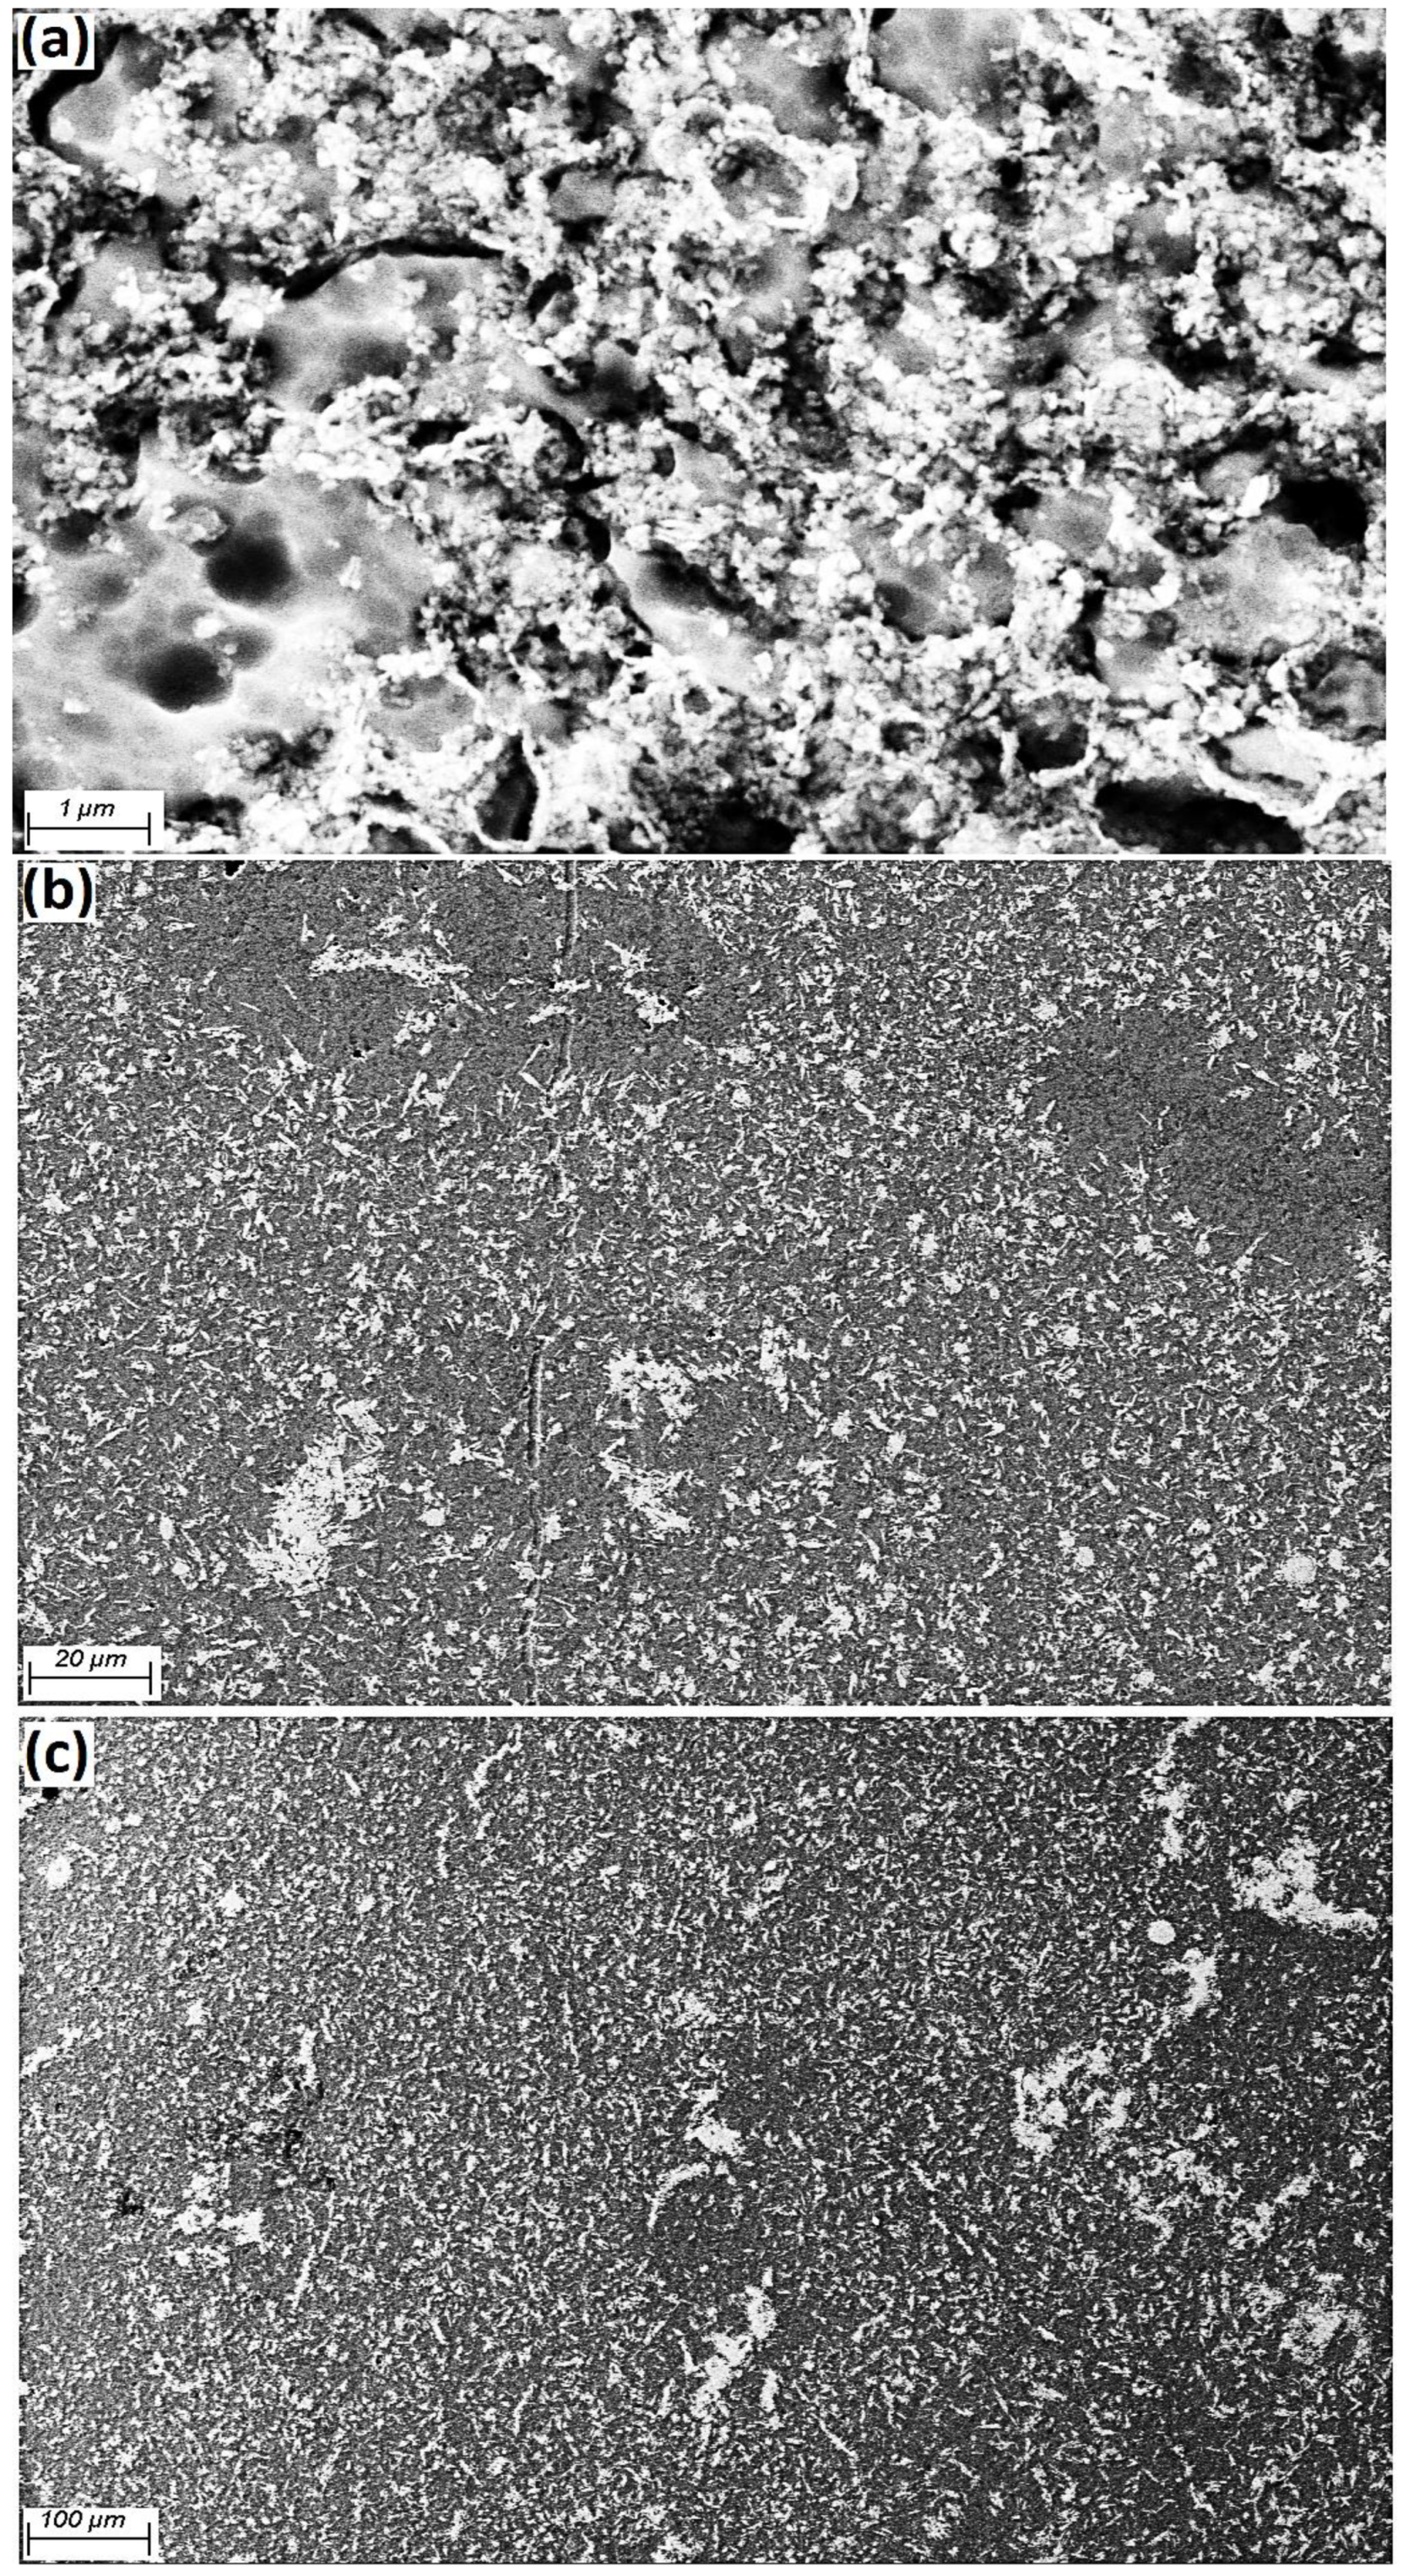
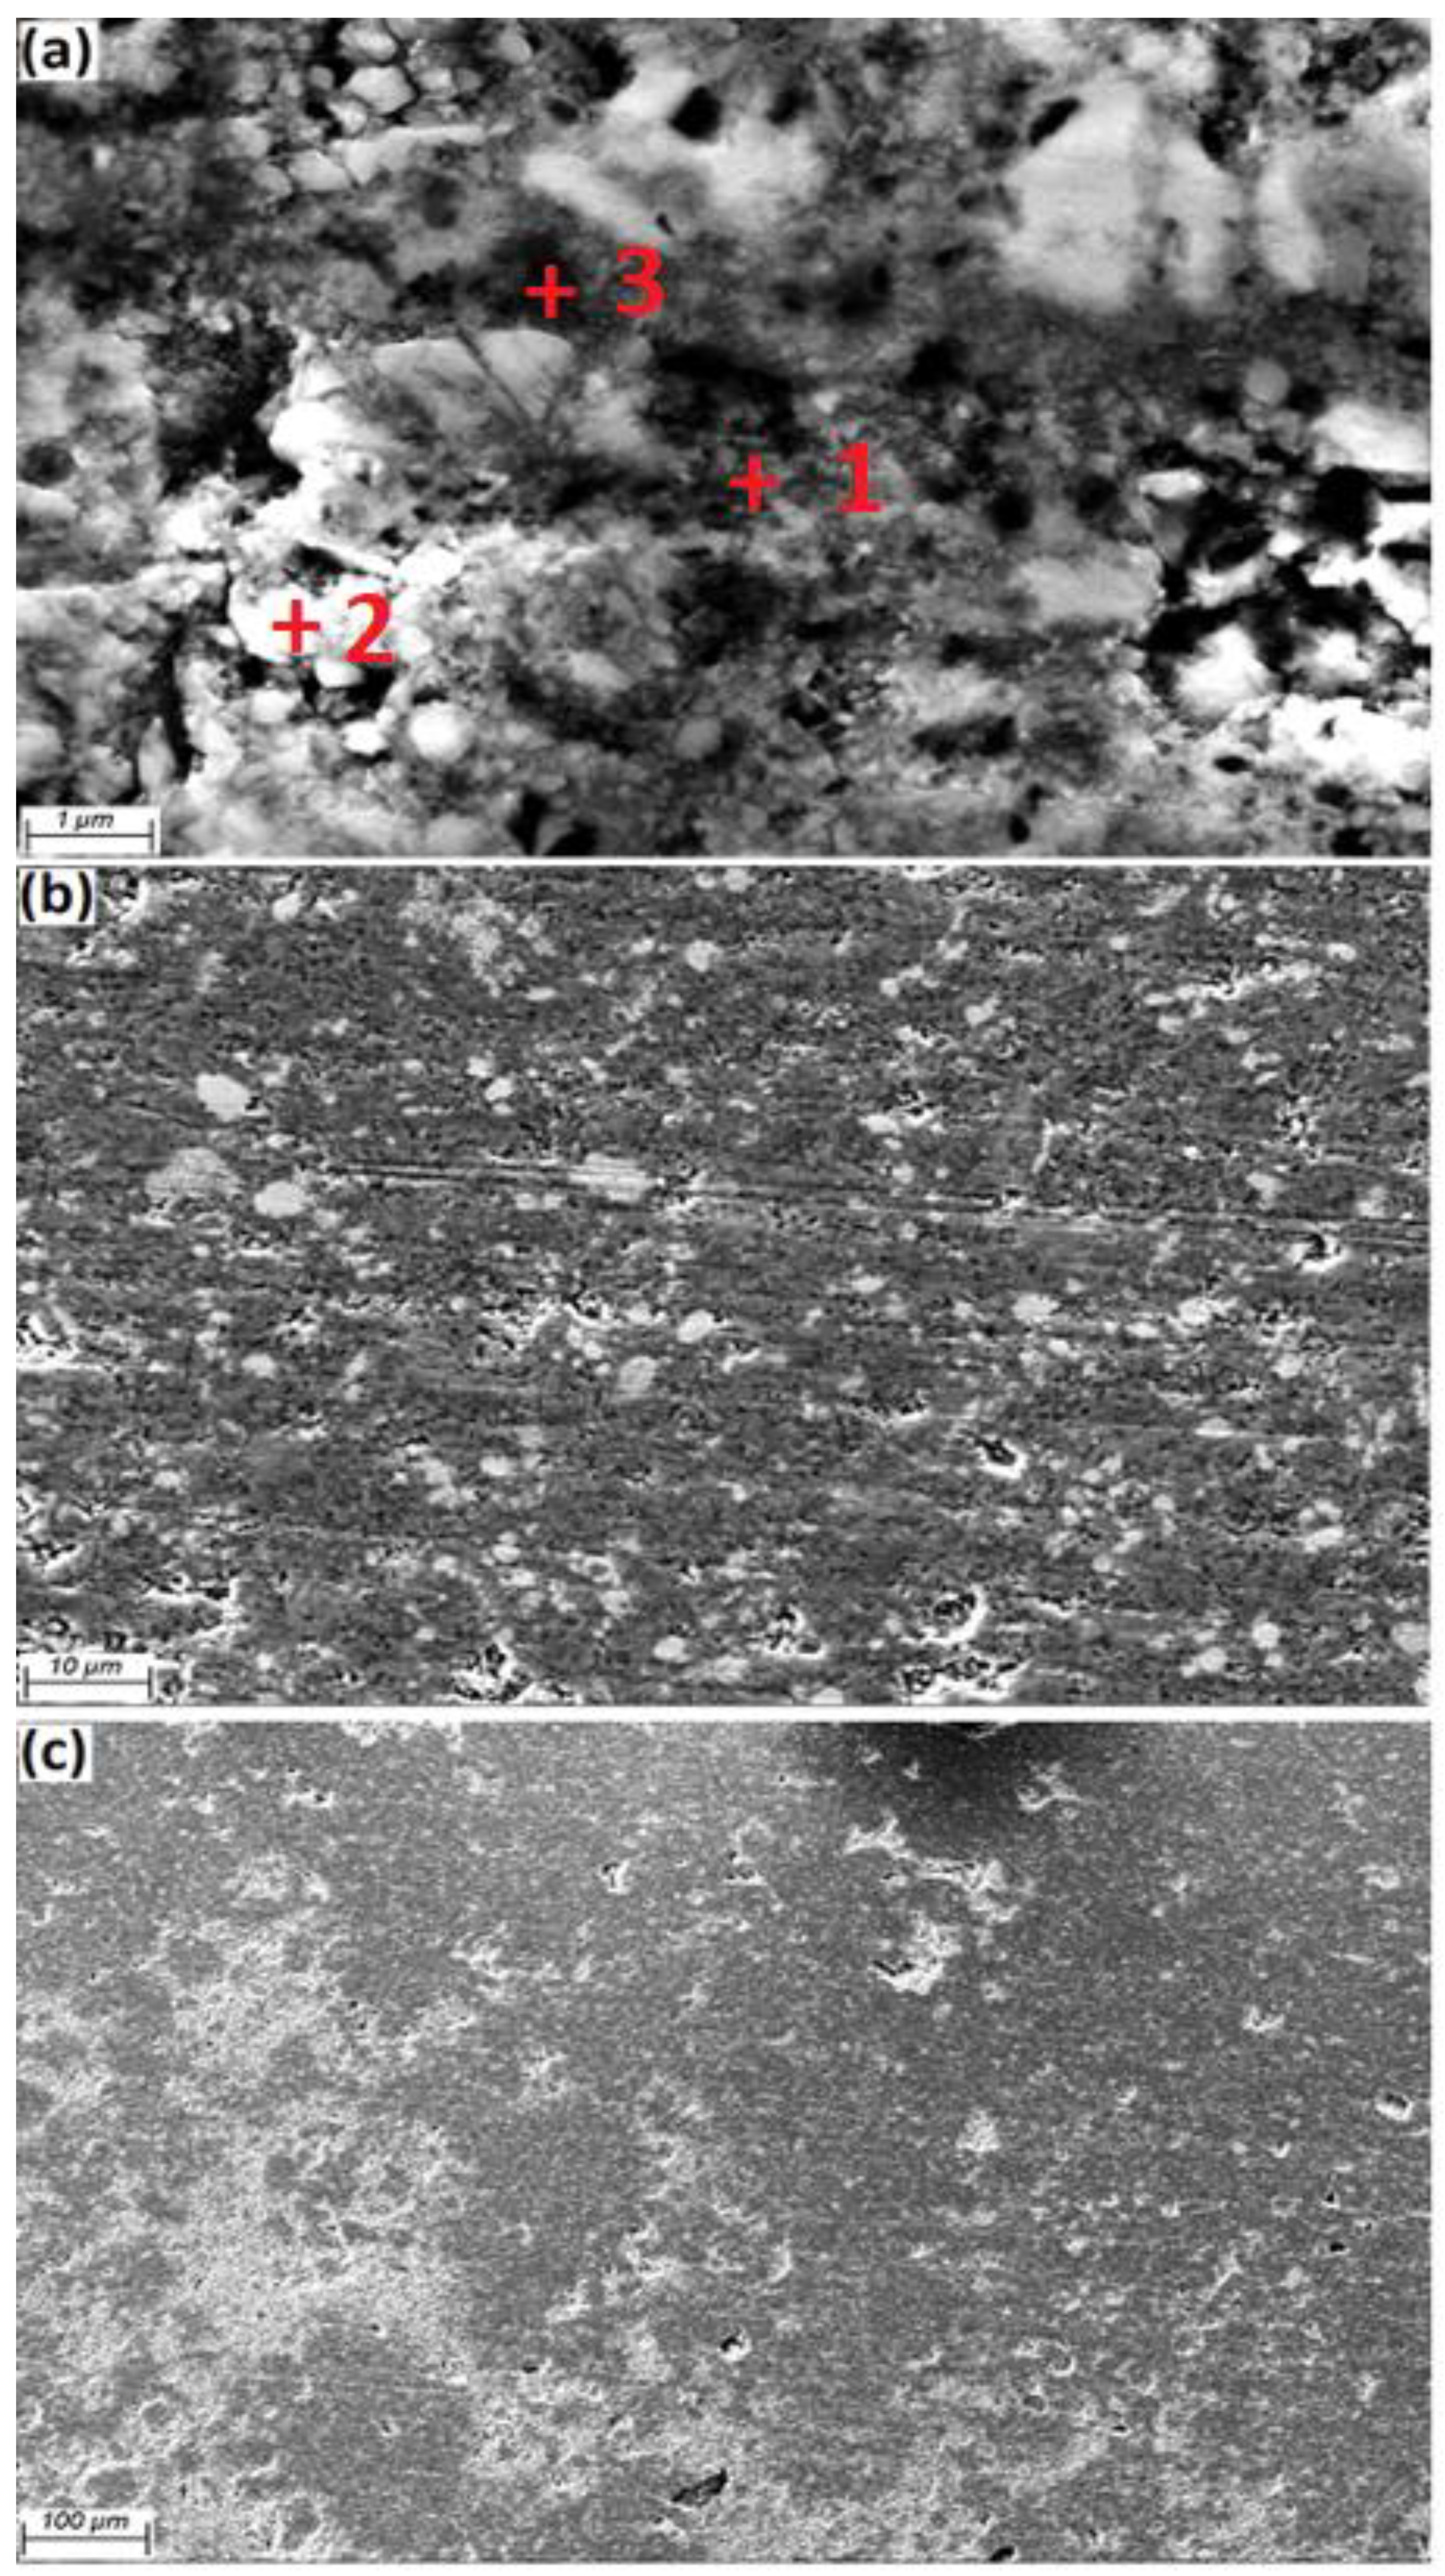
Figure 4 shows the Al grains (grey colour) as a matrix and Fe
3O
4 particles (white colour, 40 nm) available at the Al grain boundaries. Additionally, the homogeneous scattering of particles in the matrix is evidently clarified. By increasing the amount of weight percentage of reinforcement, the likelihood of agglomeration at the grain boundaries also increased. FESEM micrography of the a.5 sample after etching and heat treatment at 600 °C indicated that the Al matrix and Fe
3O
4 powder (white) were placed at the grain boundaries, as presented in
Figure 5.
Concerning soft magnetic properties, such as coercivity, permeability, and saturation magnetization; higher densities, lower quantities of interstitial sites, and larger grain sizes are required. Microstructural defects, such as dislocations and grain boundaries, tend to hinder the movement of domain walls, therefore enlarging and distorting the magnetization curve.
Both magnetic volume and grain size exert huge impacts on coercivity, density, DC losses, magnetic saturation, and mechanical strength, as observed for nanocrystalline and amorphous materials. Composites with larger grain and particle sizes can lower hysteresis losses and coercivities, and can enhance density due to certain defects (e.g., grain boundaries and airgaps) and limited nonmagnetic addition.
The larger grain size seemed to enhance magnetic performance, wherein both nanocrystalline and amorphous materials failed to outperform crystalline powder. As for the powder materials, if additional nonmagnetic regions were found between the particles, their impact on magnetic saturation and coercivity would be stronger than grain size. Particle boundaries may have more regions in terms of air gaps and thicker inclusions, which can lead to a larger demagnetizing field. Small particle sizes not only result in low density but also significantly more regions of boundaries due to low surface-to-volume ratios.
As mentioned before, the microstructure of materials has an impact on coercivity. Similarly, particle size and grain boundaries affect the hysteresis losses. SMCs that utilize organic binders are forced to use low-temperature curing, mainly for a breakdown in the coating consequences in strained ferrous grains and high hysteresis losses. Consequently, by using large-grained, higher-purity ferromagnetic powder, and post-compaction annealing to release impurities and work-hardened areas, the pinned domain walls can be removed and reduce the hysteresis losses.
The EDS spectrum showed for a.5 after heat treatment at 600 °C. The EDS results in
Figure 6 confirmed the presence of Al, Fe, O, and Mg in the grain boundaries. EDS analysis of the revealed surface displays the results for Point 1 is aluminum, where the Al peak (83.83 wt.%) is the main peak, and was detected by using FESEM, in a light gray color and Fe
3O
4 particles (white color) exists in the aluminium matrix, with confirmed peaks of Fe (47.85 wt.%) and O (37.79 wt.%) at point 2. The compositions of Al
3Fe (Al 69.11 and Fe 28.73 wt.%) were detected at point 3, respectively, which were also confirmed by the XRD pattern.
3.2. X-ray Analysis
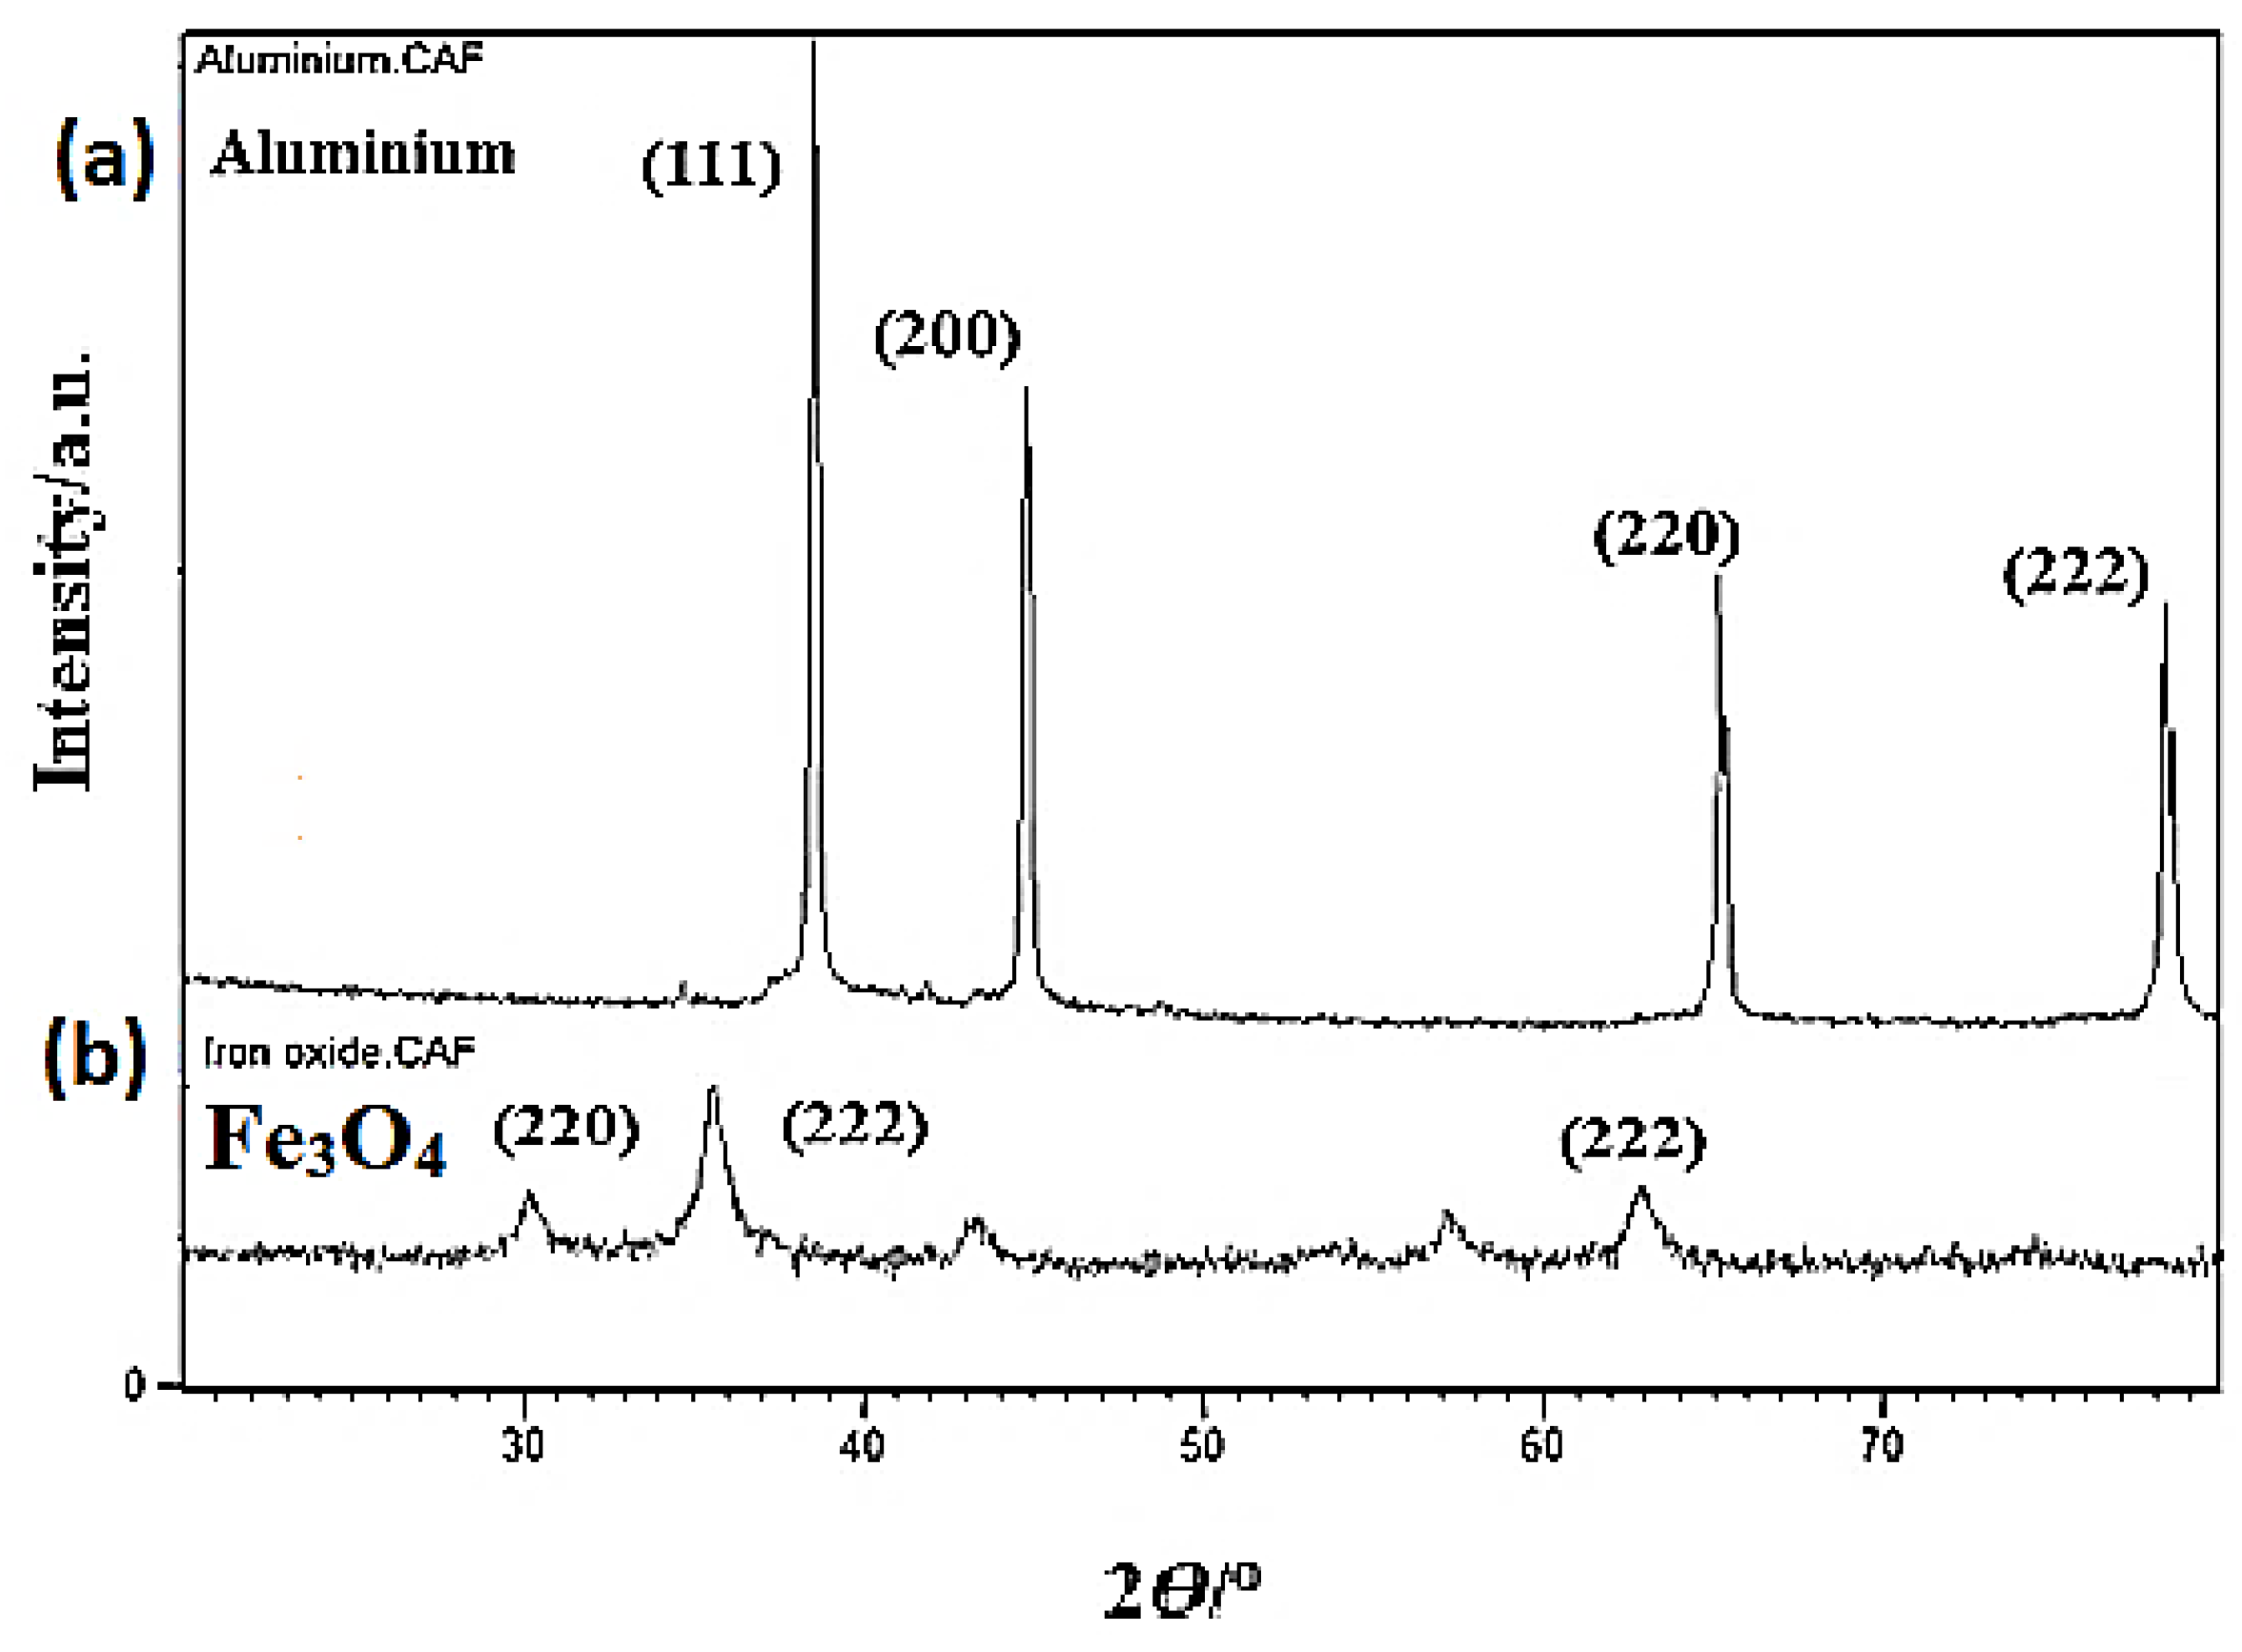
An X-ray analysis was performed before and after sintering. The XRD images of pure aluminium and Fe
3O
4 powder are displayed in
Figure 7a,b. The XRD revealed four key peaks for aluminium (111, 200, 220, 222) as displayed in
Figure 7a and three main peaks for Fe
3O
4 as illustrated in
Figure 7b.
Figure 8 indicates the XRD analysis of a.5 before and after heat treatment. The aluminium matrix has a face-centered cubic structure (FCC). After the addition of Fe
3O
4 nano-particles into aluminium, three peaks appeared, which refer to iron oxide with two crystal systems, Orthorhombic and Cubic, before heat treatment. Moreover, after heat treatment, three new peaks appeared which were assigned to Fe
3O
4 with the cubic phase. The XRD analysis of a.5 after heat treatment identified Al-Fe intermetallic compounds (Al
3Fe, and Al
13Fe
4) and Al
2O
3. The first peak is related to Fe
3O
4 with a cubic crystallography system. After adding Fe
3O
4 nano-particles into aluminium, and heat treatment, five main peaks were revealed for aluminium, three main peaks for Fe
3O
4. 2θ = (38/784, 44/600, 65/186, 78/306, 82/352) were associated with aluminium, and 2θ = (30/125, 35/483, 62/629) was assigned to the Fe
3O
4 cubic crystal system, respectively.
3.3. Density Analysis
The density measurements were conducted using Archimedes’ principle [
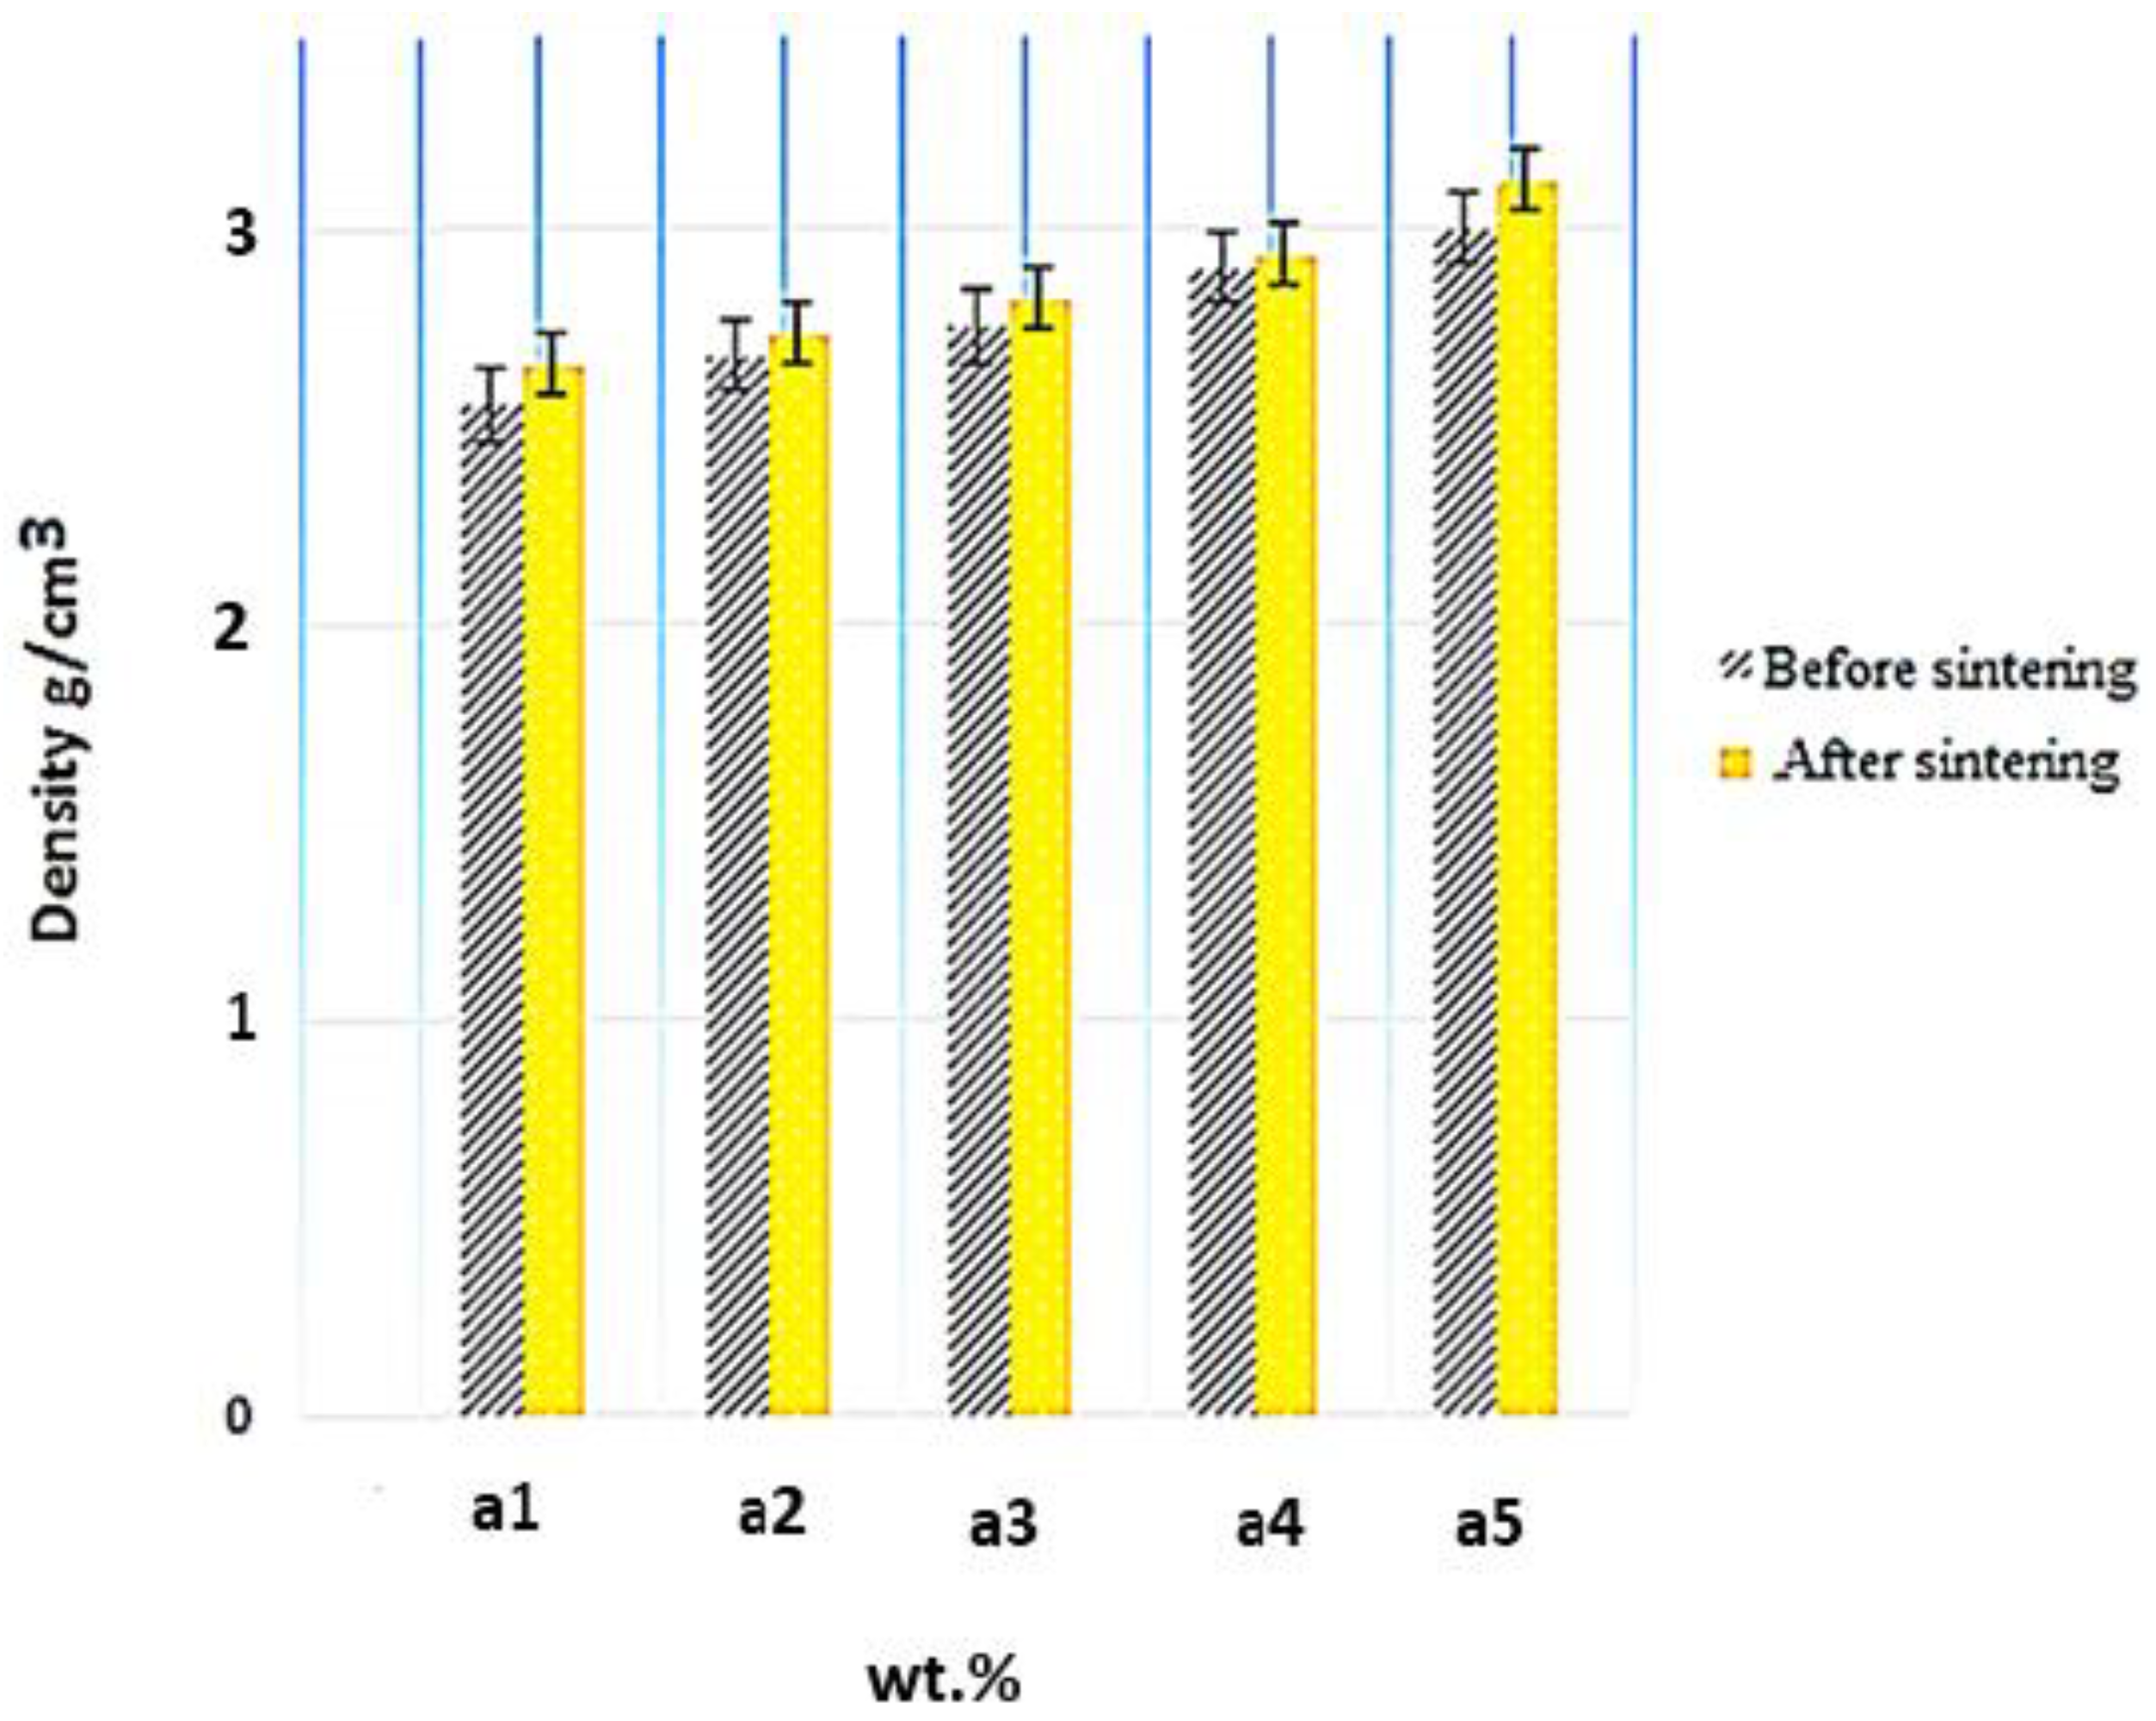
31]. As shown in
Figure 9, the density differs from 2.33 to 3.29 g/cm
3. The density values for Al-10 Fe
3O
4, Al-10 Fe
3O
4, Al-15 Fe
3O
4, Al-20 Fe
3O
4, Al-30 Fe
3O
4, and Al-35 Fe
3O
4 are 2.33, 2.58, 2.74, 2.81, 2.92, and 2.98 g/cm
3 before sintering and 2.67, 2.71, 2.79, 2.86, 2.97, and 3.29 g/cm
3 after sintering, respectively, indicating a 41.2% improvement by increasing the weight percentage of Fe
3O
4. The density of magnetite (4.8 g/cm
3) is higher than aluminium (2.70 g/cm
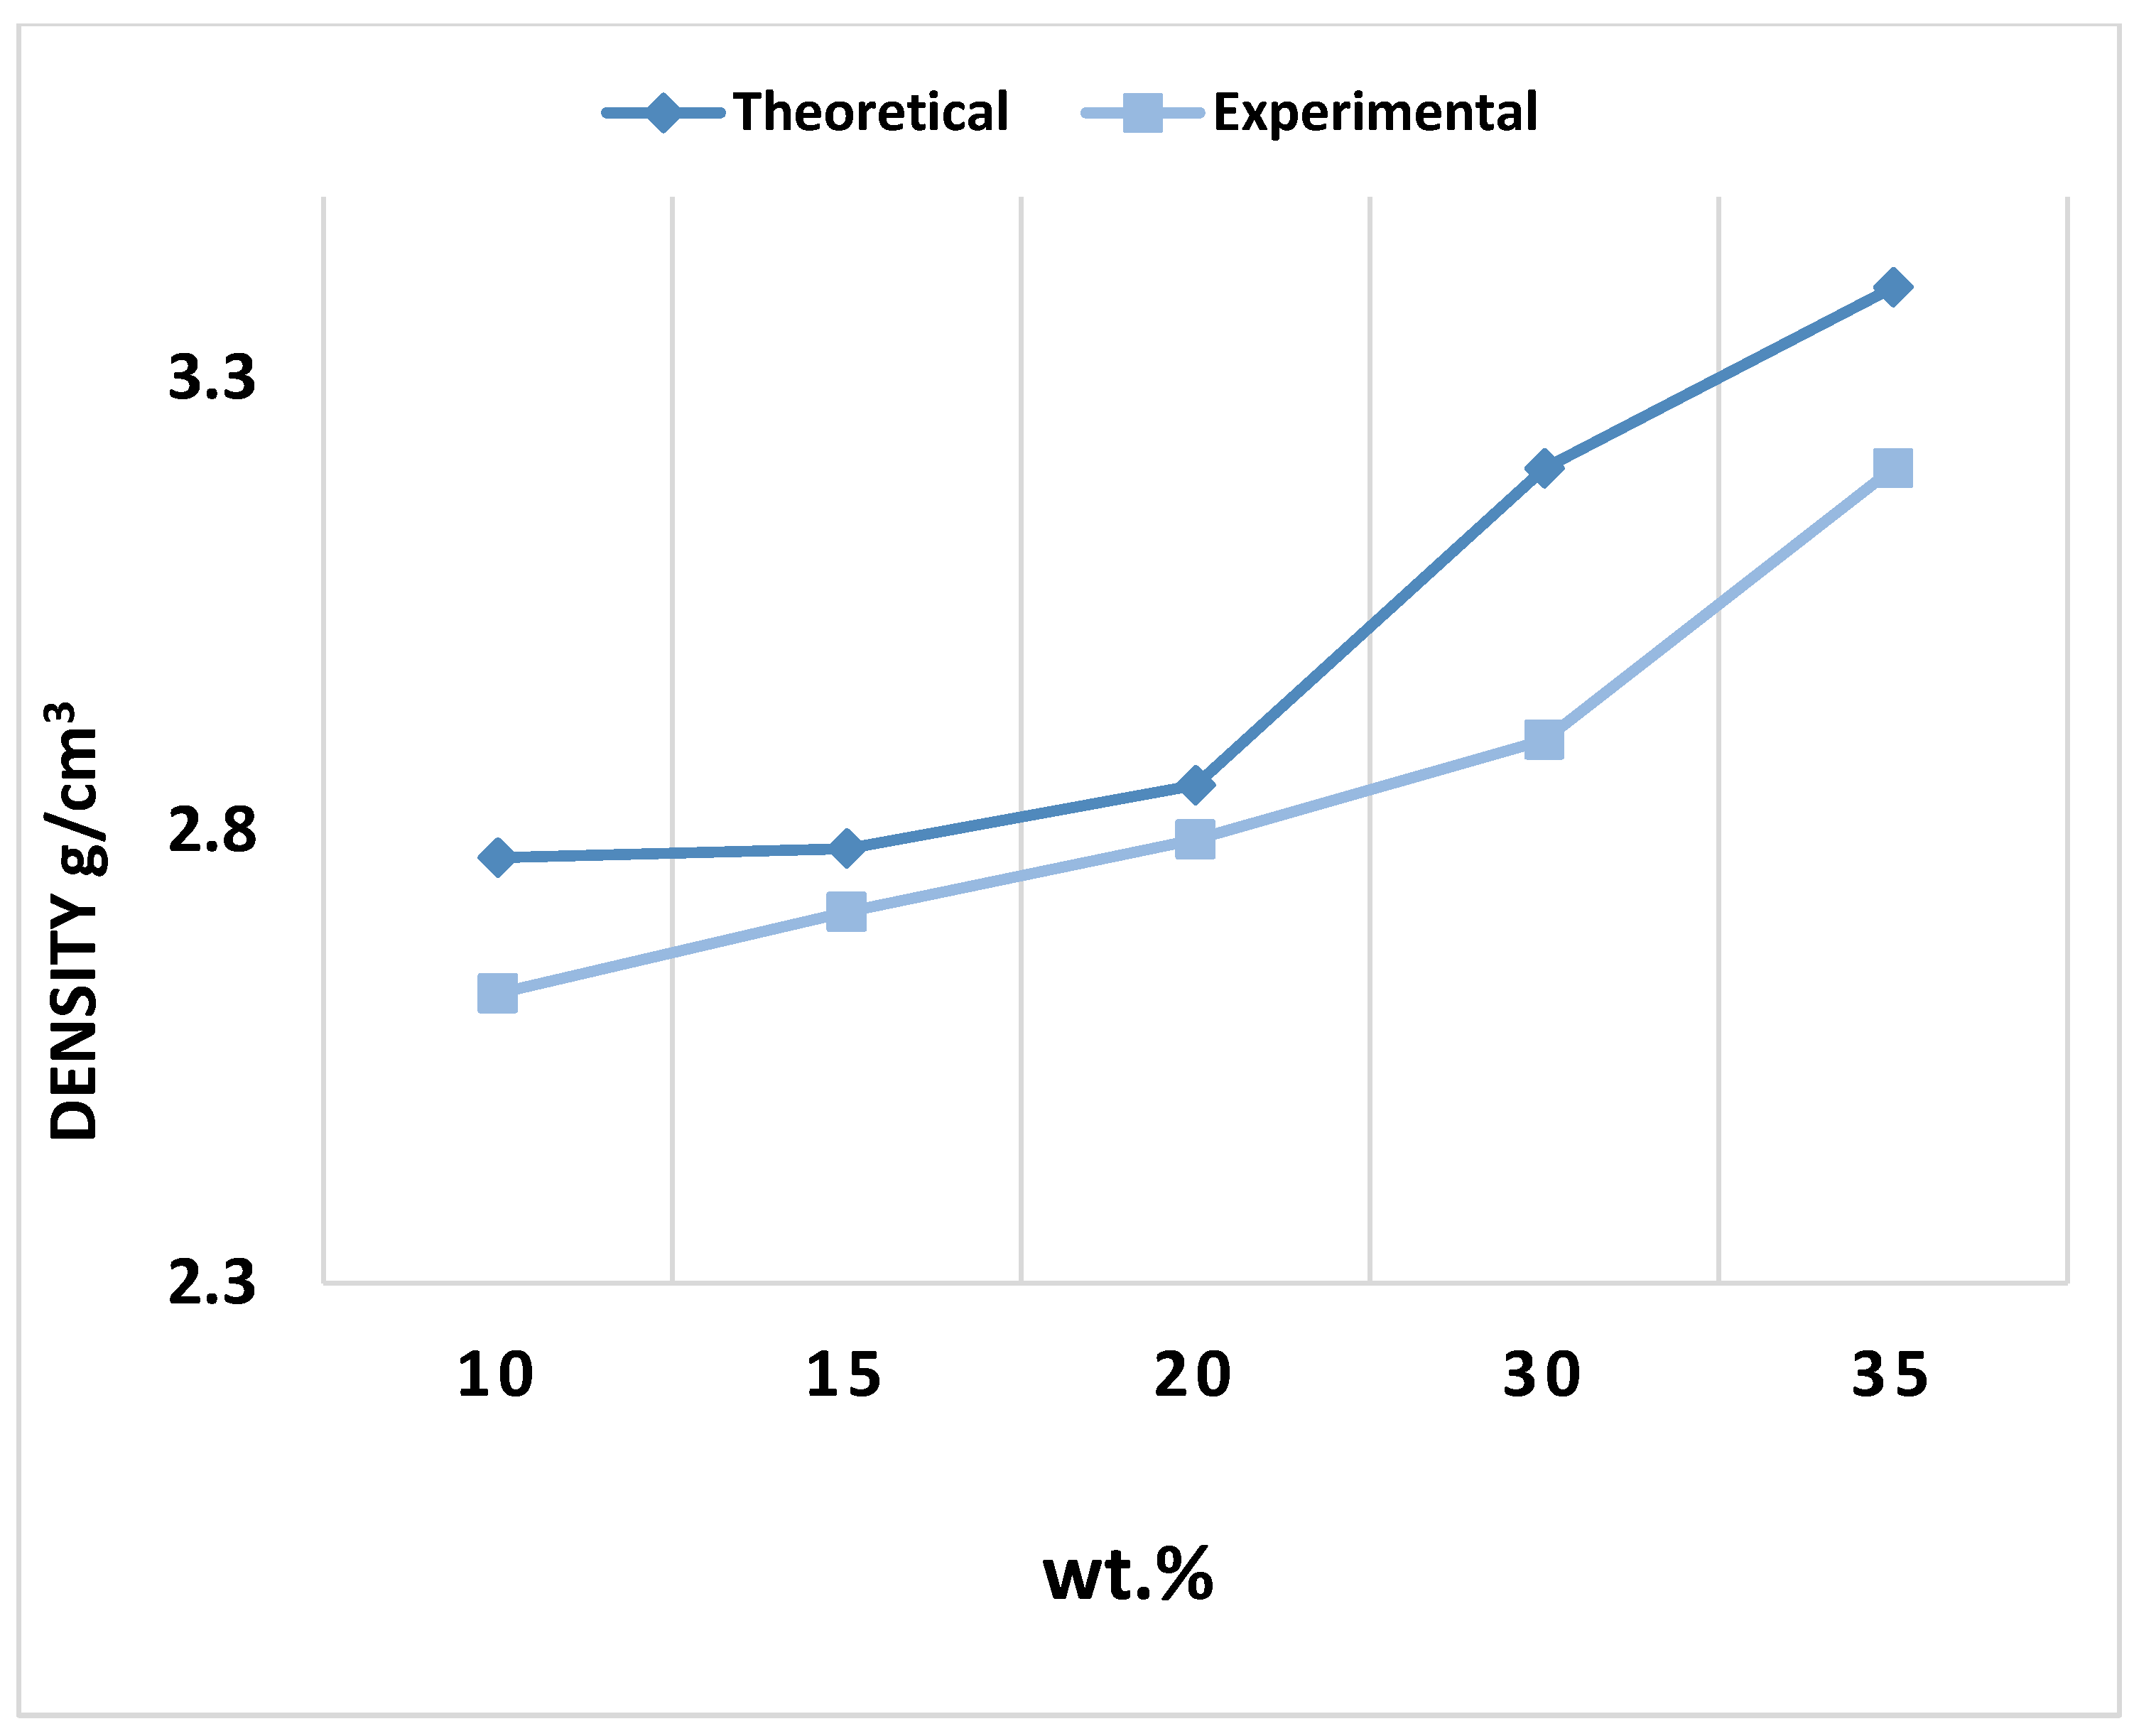
3). The density measurements of the composites were performed using water displacement. The theoretical density of the composites was calculated with the rule of mixtures formula. By comparing the experimental and theoretical densities, the density of the composites were found to be acceptable. As can be seen, the density changed from 2.33 to 2.98 g/cm
3 before sintering by increasing the weight percentage of Fe
3O
4 nanoparticles. Under the same condition, the density of Al-Fe
3O
4 composites after sintering was evaluated. After sintering, the density of each sample increased slightly.
Figure 9 shows the evolution of density before and after sintering, where the density after sintering increased rapidly by 3.29 g/cm
3 for Al-35 Fe
3O
4. Adding different amounts of reinforcements with a higher density increases the density of composites. Moreover, the density of the composites increases at high sintering temperatures. The diffusion of atoms is easier at higher sintering temperatures. As a result, the density of the composites increases.
The density measurement for Al-Fe
3O
4 was performed using Archimedes’ principle. The samples were first weighed in the air and then in water according to ASTM B311-08. The density of the composites, as shown in
Figure 9, varies slightly from 2.20 to 3.00 g/cm
3. The density of the composites was calculated by water displacement, and the theoretical density of the composites was measured using the rule of mixtures equation. The density of the composites was calculated using Equation (9):
where
is the mass of the matrix and
and
are the mass of reinforcements.
refers to the density of the matrix and
are the density of reinforcements.
Figure 10 compares the theoretical and experimental densities of the composites. By comparing the theoretical density values, the density of the composites is found to be acceptable, with the relative density ranging from 90% to 98%. By dividing the density of the samples after sintering with the theoretical density, the relative density was determined to be between 90% and 98%.
3.4. Hardness Assessment
The mechanical properties of composites depend on the weight percentage of reinforcement materials, sintering temperature, and microstructure [
32]. Different weight percentages of nanofiller are added into the aluminium matrix to find an optimal amount of Fe
3O
4 powder and its properties, such as hardness, for composite modification. Therefore, the hardness of the composites with different weight percentages of Fe
3O
4 has been investigated.
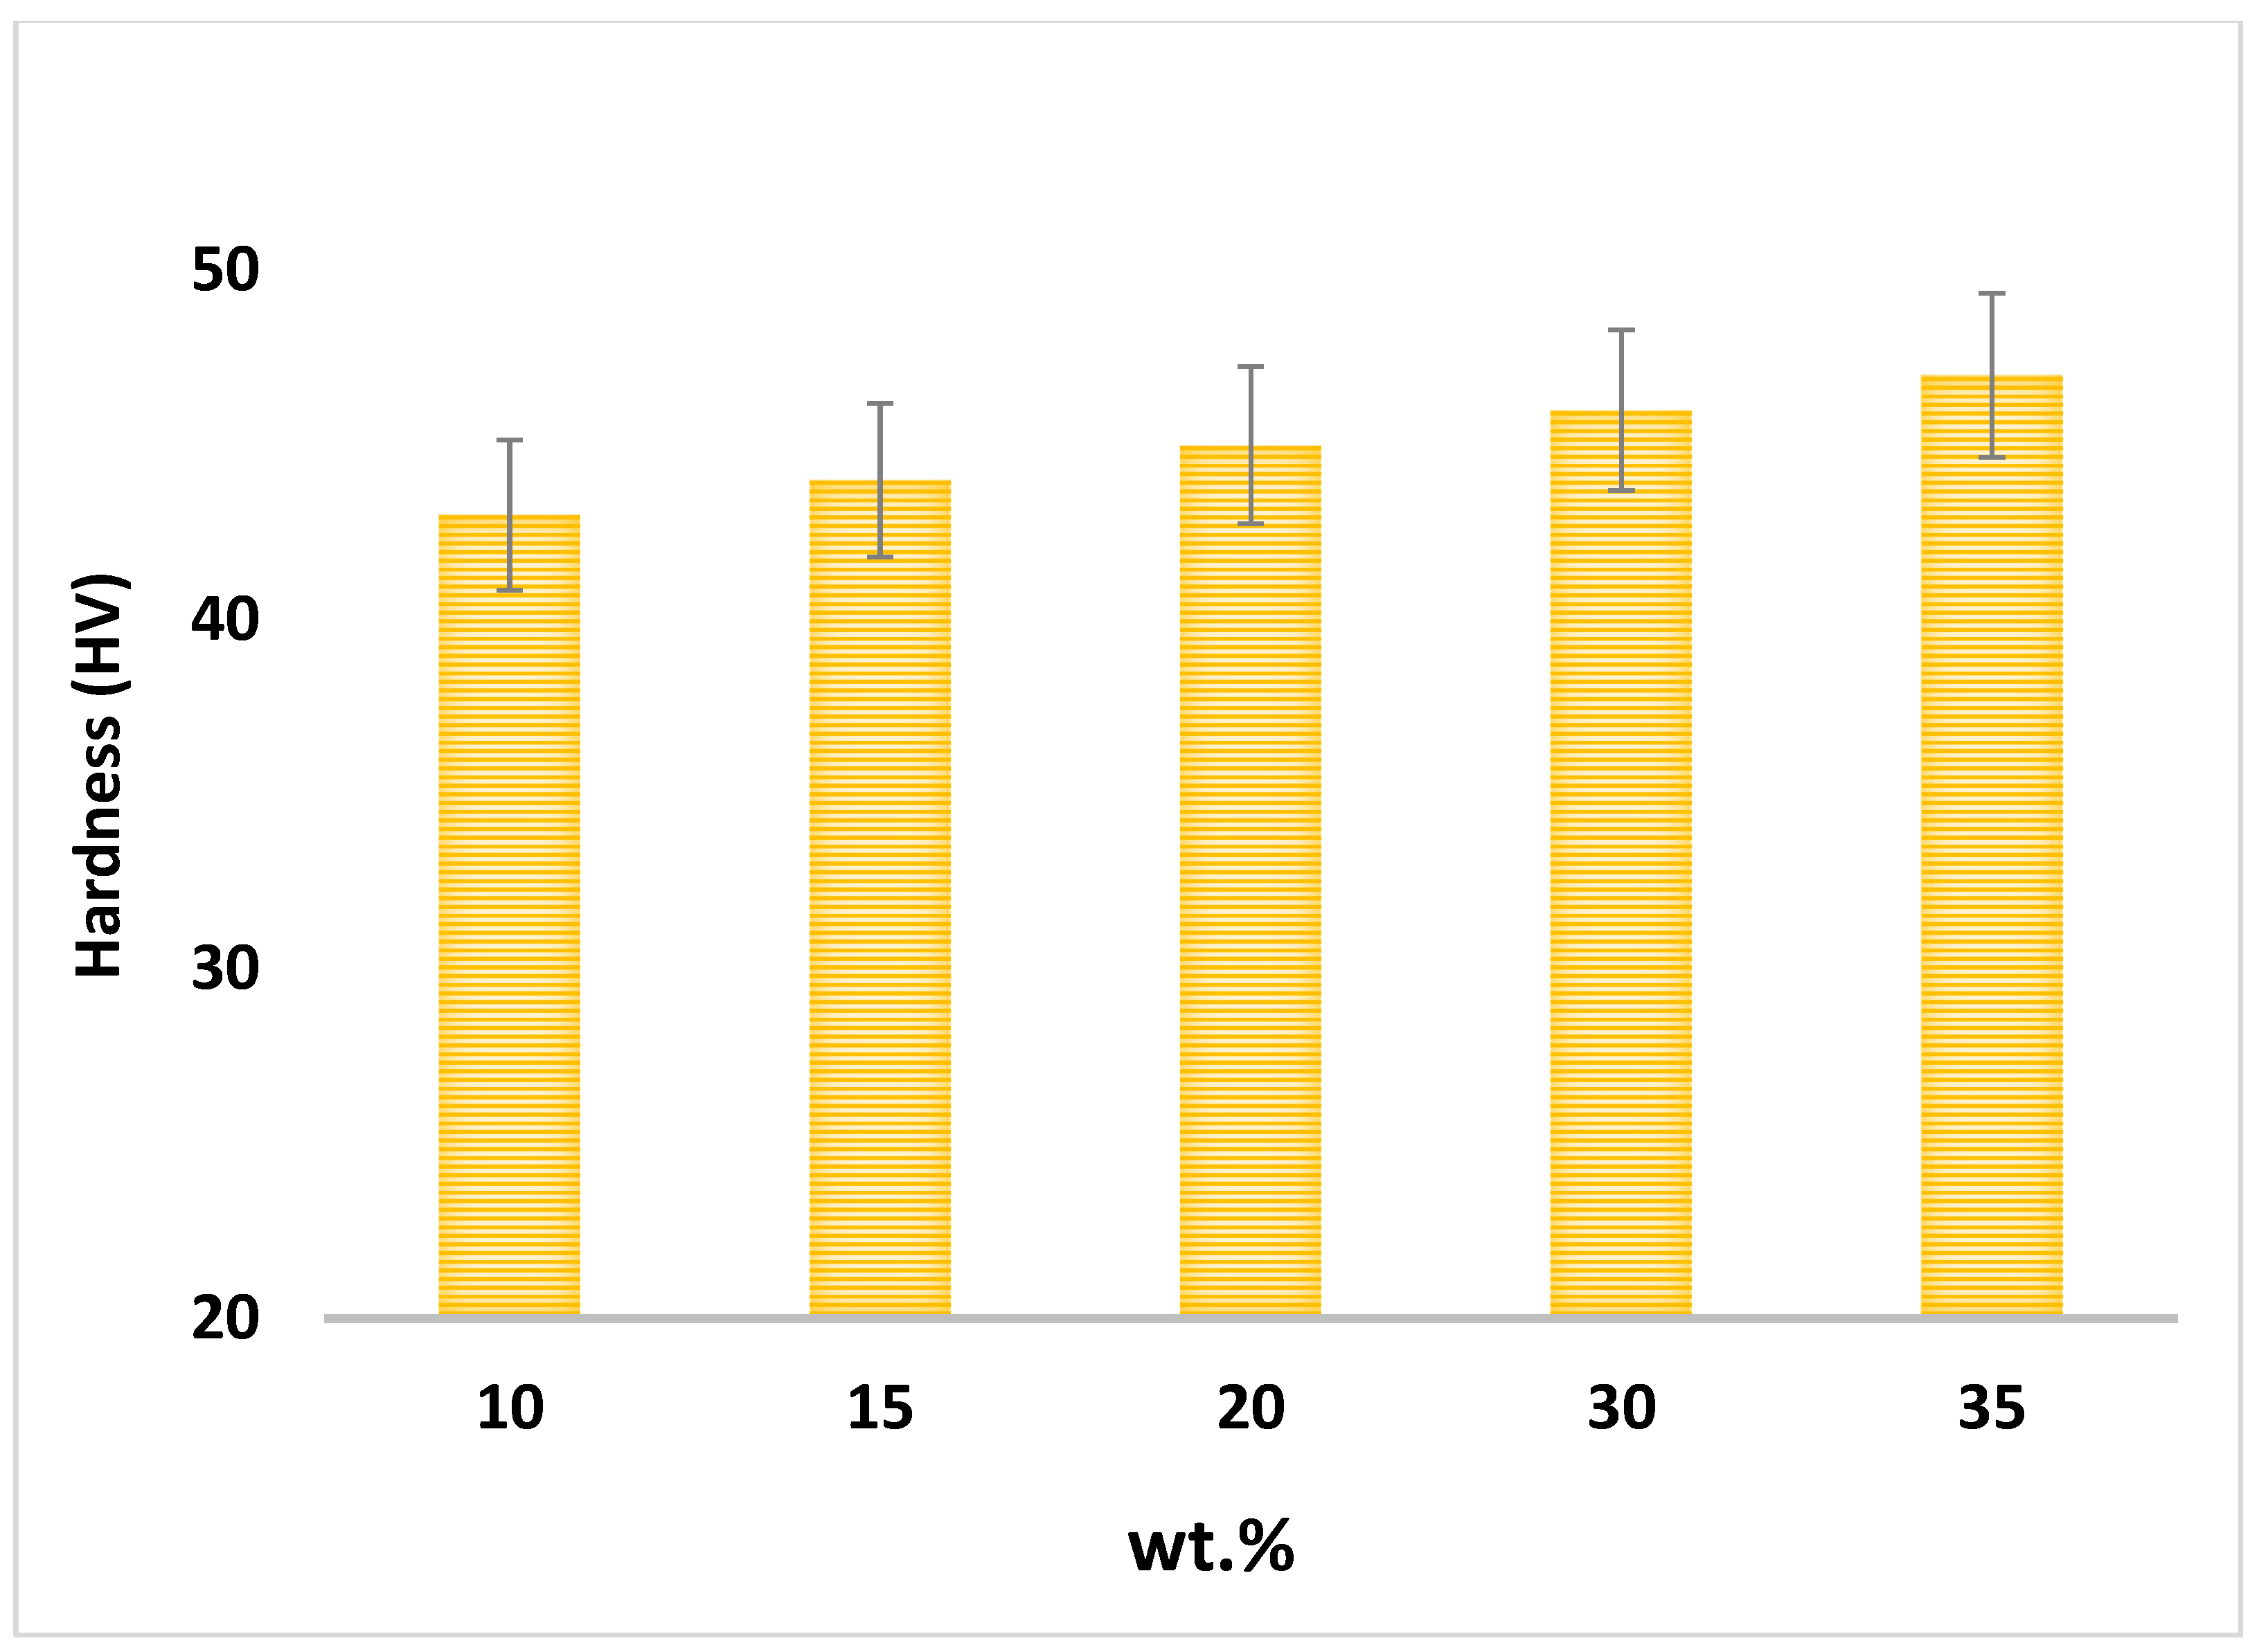
Figure 11 shows the samples’ hardness for different percentages of reinforcement particles in the matrix. The microhardness of the composites improved as the weight percentage of Fe
3O
4 nanoparticles increased to 35 wt.%
Figure 11 shows that the highest hardness value (47 HV) belongs to the sample with 35 wt.% Fe
3O
4, while the hardness remained steady around 43 HV as a low amount of reinforcement (5–10 wt.%) was added. The hardness value improved by 9.3% from Al-5Fe
3O
4 to Al-35Fe
3O
4 composite. The iron oxide nanoparticles block the motion of dislocations and restrain the deformation of the nanocomposites, in addition to providing strong interfacial bonding between Al and ceramic nanoparticles, which are the key reasons for the improvement in microhardness [
33].
3.5. Compressive Test
The effect of the reinforcement on the compressive strength of Al-nano Fe
3O
4- composites fabricated by the cold isostatic pressure method is shown in
Figure 12. As the weight percentage of Fe
3O
4 increased, the compressive strength associated with magnetite reinforcement initially improved and then remained constant. The reason for this increase is due to improved work-hardening, which can be due to the elastic properties of Fe
3O
4 particles, and as a result, prevents the plastic distortion of aluminium. The results confirmed the noticeable effect of Fe
3O
4 particles on the strengthening of the composites. In this regard, the strength increases as the amount of reinforcement increases. On the other hand, with an increasing amount of magnetite reinforcement particles, the homogeneous distribution of particles in the aluminium decreases, which may lead to cluster formation. Thus, Fe
3O
4 particles with low mechanical bonding between them reduce the compressive strength. A lack of bonding between the particles and the matrix alloy can reduce compressive strength. A decrease in compressive strength occurred slightly with an increase in the weight percentage of Fe
3O
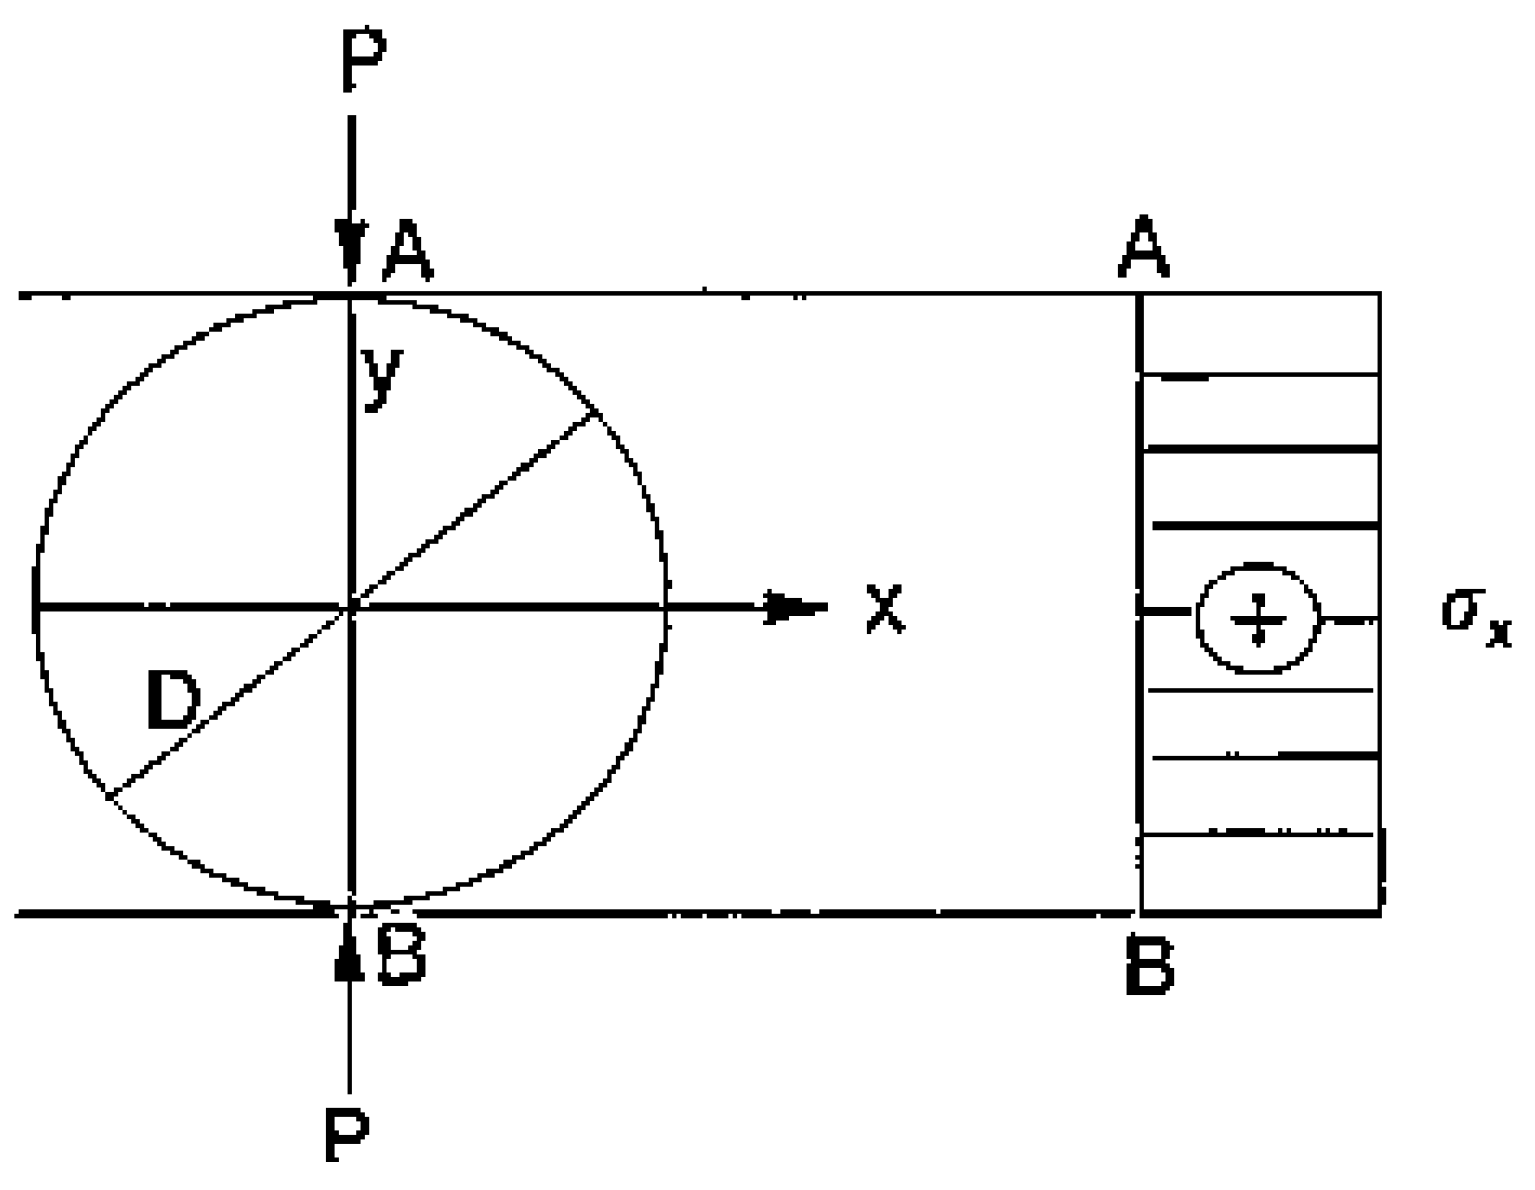
4 particles in aluminium. The crack started in the central section of each disc sample, which is the most extremely stressed tension zone (
Figure 13).
3.6. Magnetic Properties of Al-Fe3O4 Composites
Magnetised materials are named ferromagnetic (or ferrimagnetic). These materials contain nickel, iron, cobalt, and their alloys, with some alloys of rare-earth metals. Magnetism is classified as a physical phenomenon that is mediated by a magnetic field. The source of magnetism is the orbital and spin movement of electrons and how the electrons interact with each other. The magnetic behaviour of a material is related to different factors, such as pressure and temperature. Materials may reveal more than one form of magnetism. The magnetic action of materials can be categorised into diamagnetism, paramagnetism, ferromagnetism, and antiferromagnetism. Diamagnetism and paramagnetism materials exhibit no collective magnetic interactions, whereas ferromagnetism and antiferromagnetism materials indicate long-range magnetic order under a particular temperature [
34]. Ferreira et al. synthesised Al-10 Fe
3O
4 with a particle size of 70 nm using a microwave and investigated its magnetic and Hc properties, which were 0.55 emu/g and 199 G, respectively. Therefore, Al-Fe
3O
4 composites are considered ferromagnetic [
10].
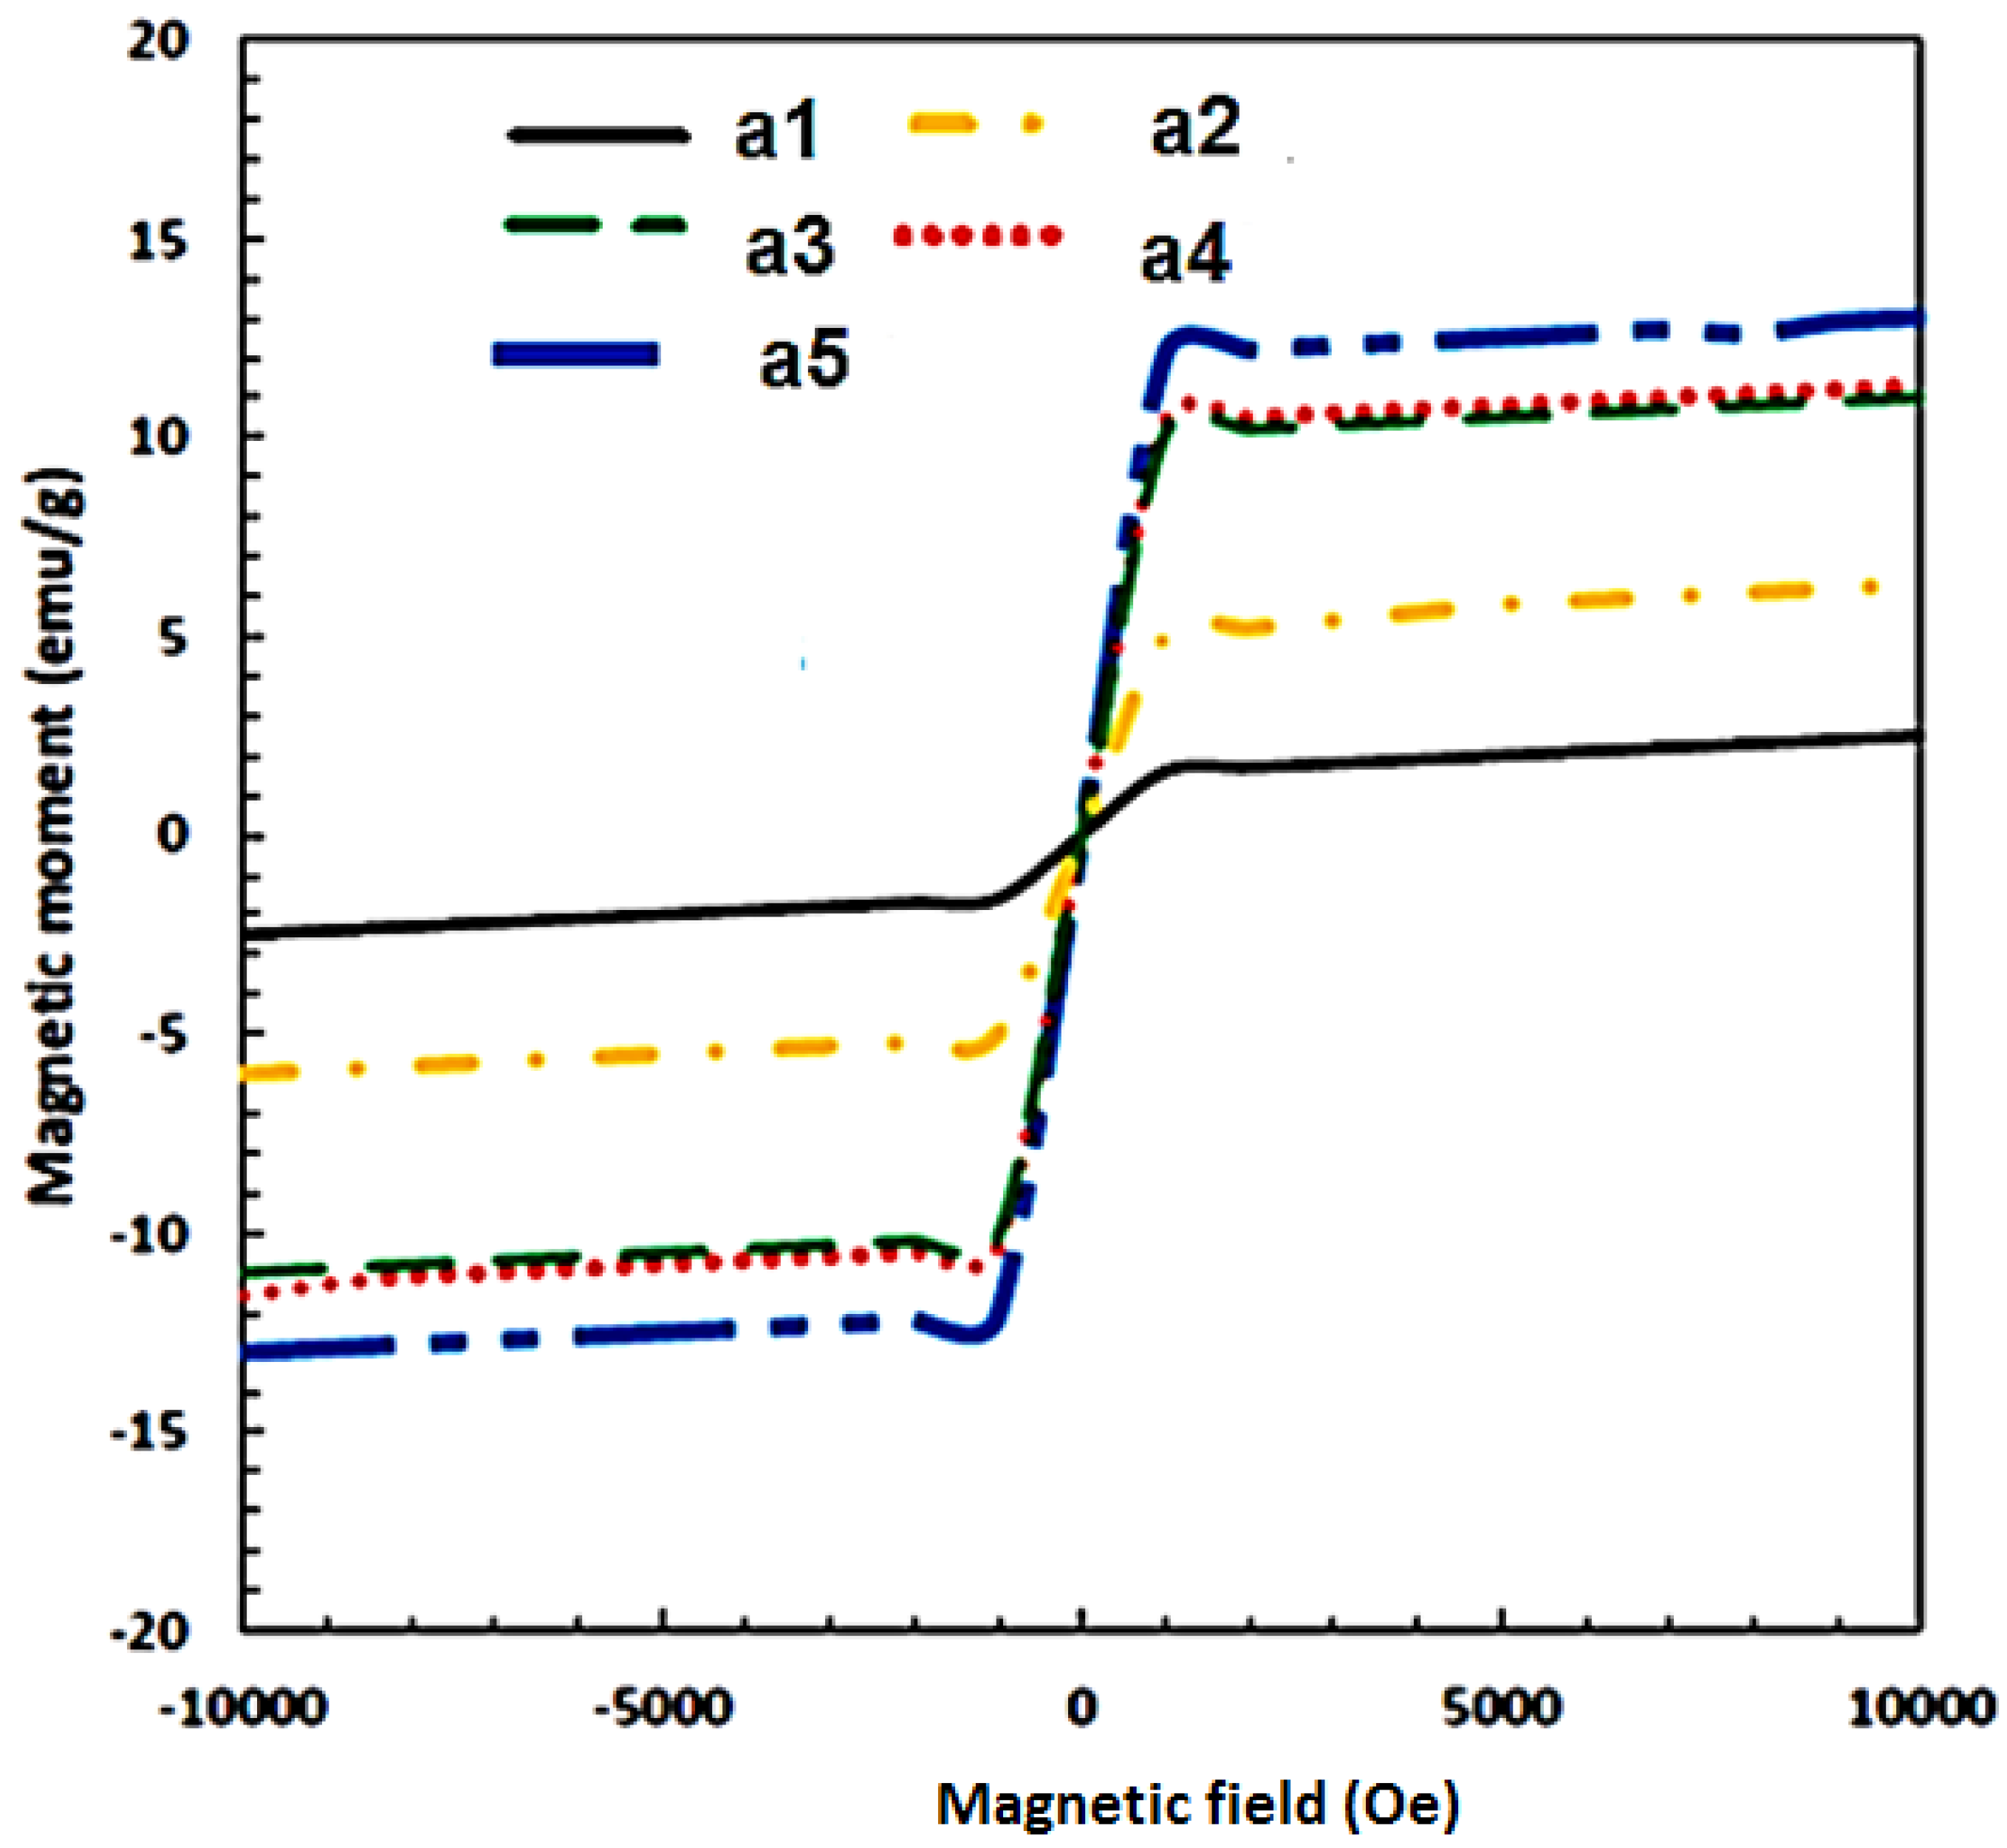
Figure 14 and
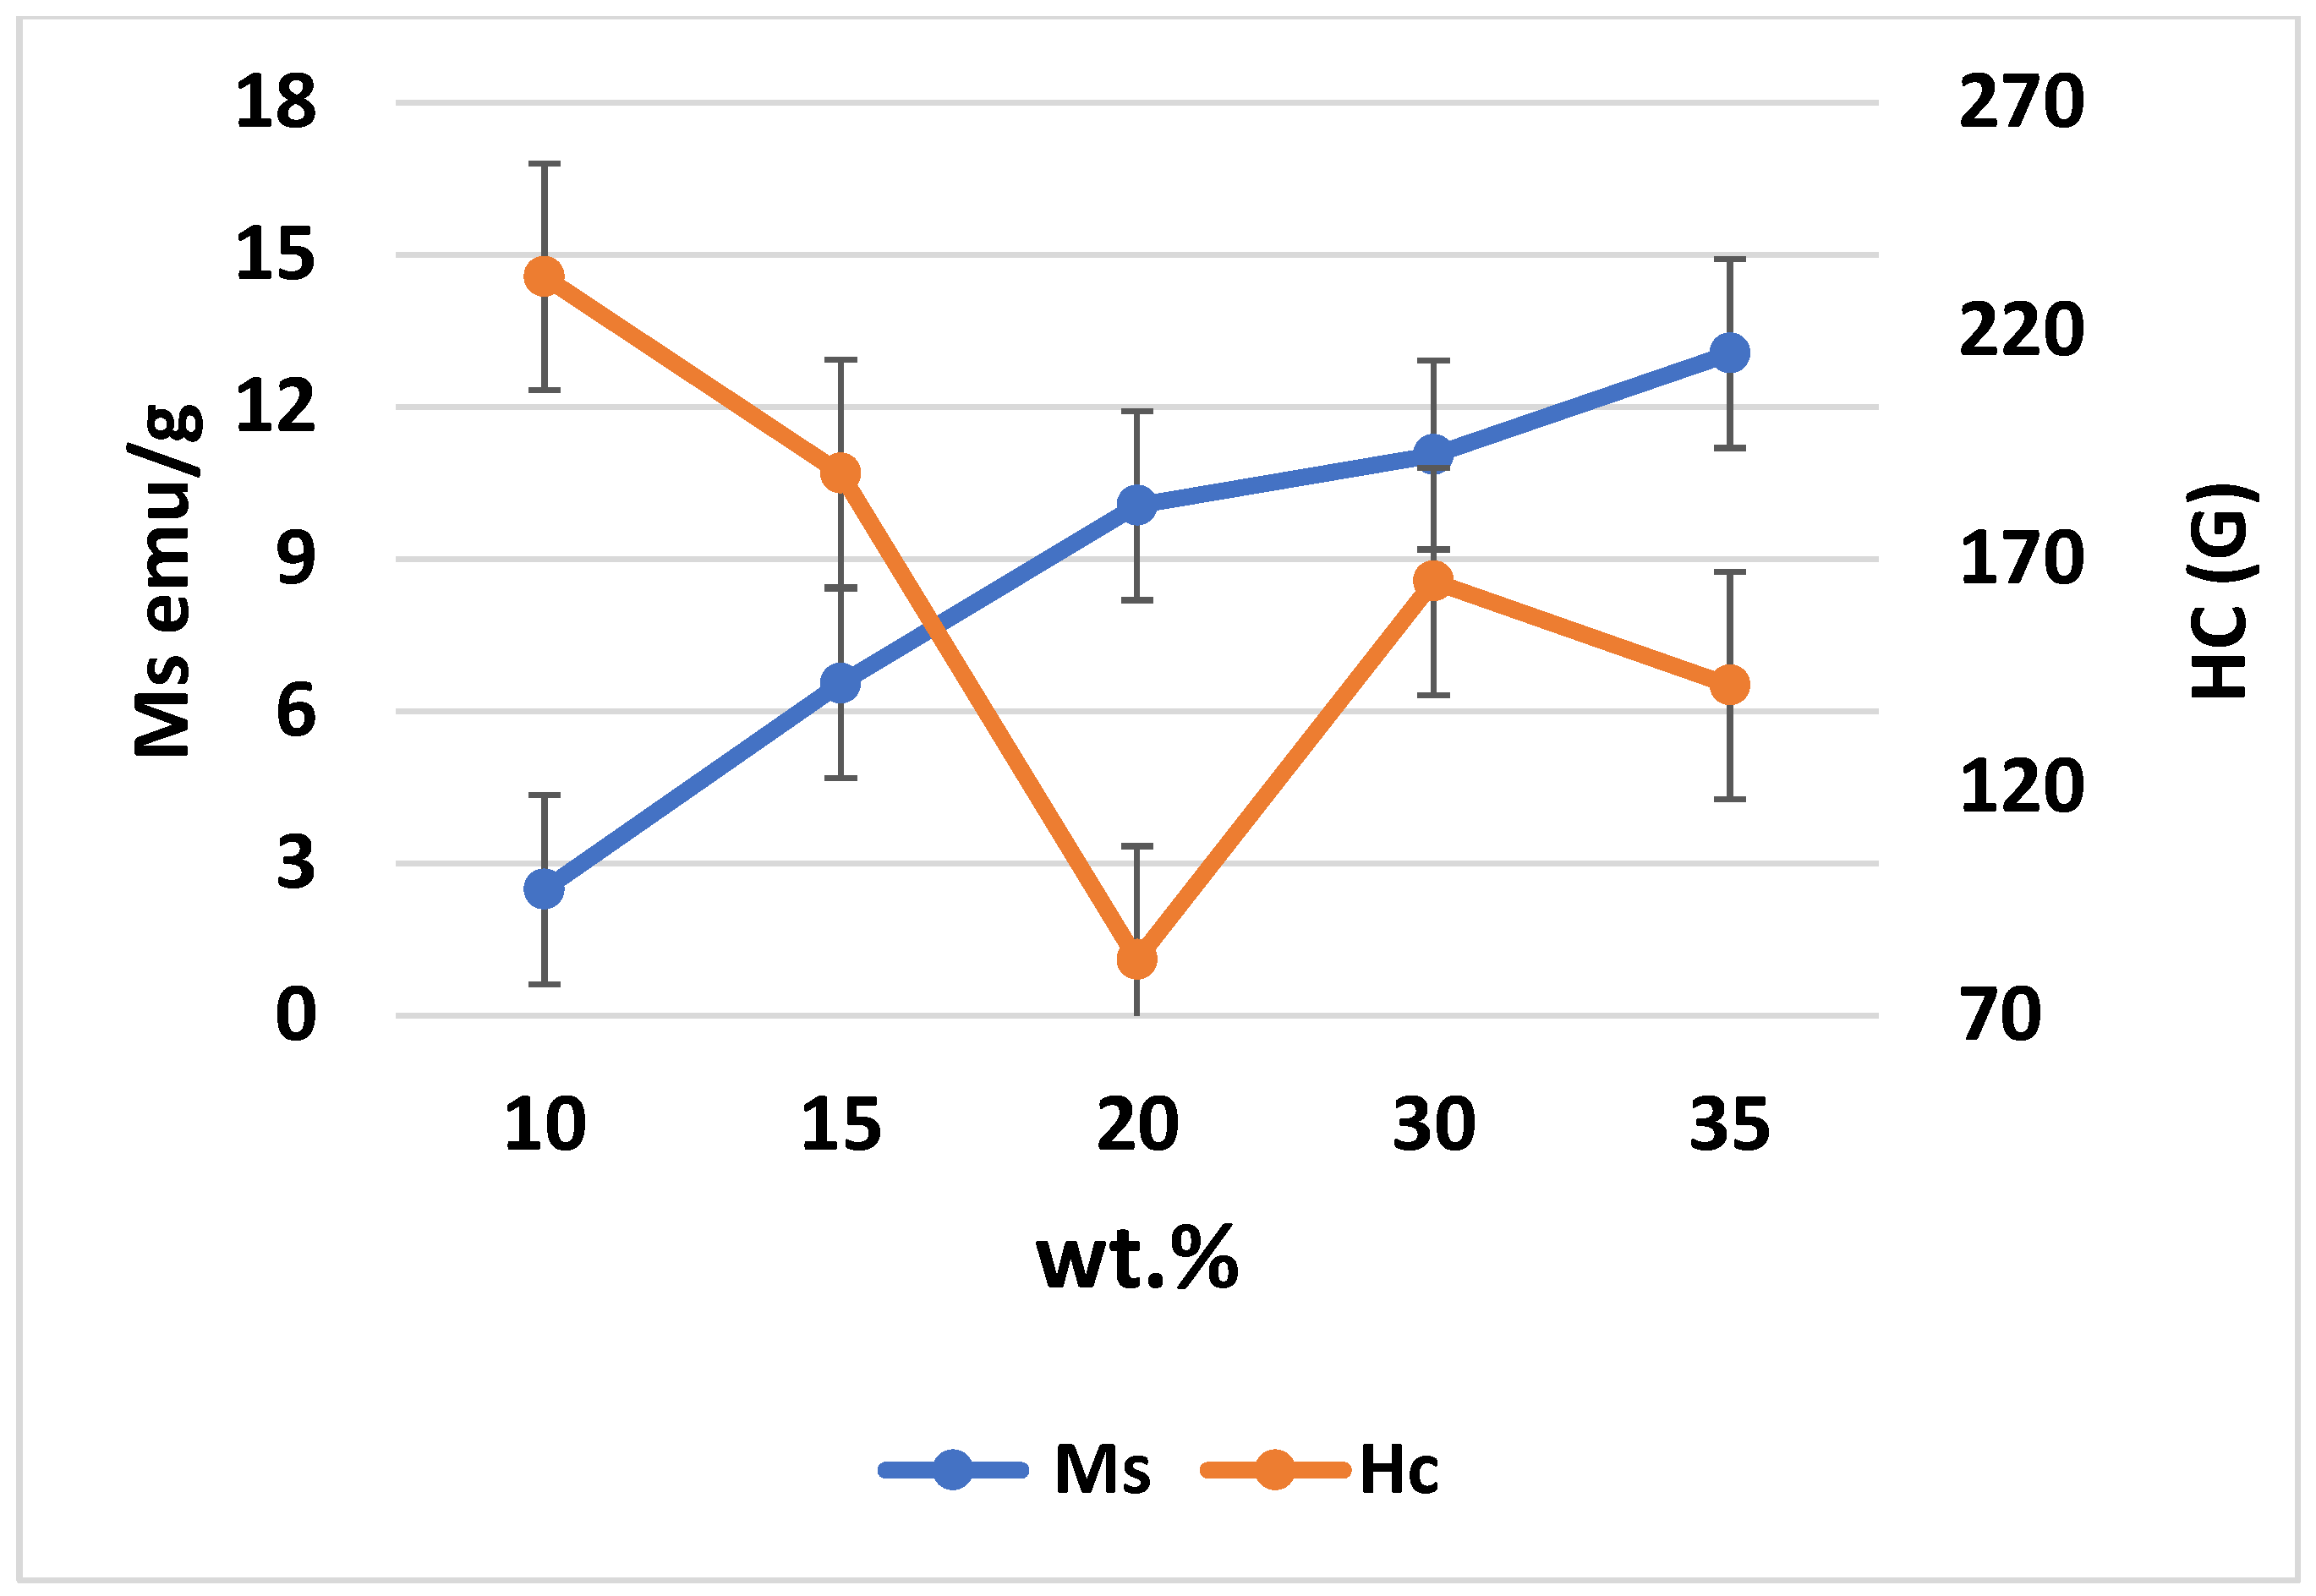
Figure 15 present the magnetic hysteresis curve (N) based on the magnetic moment and field, as well as the saturation coercive field (Hc) and Ms for different weight percentages of Fe
3O
4 in the composites. The values of Ms and Hc varied with increasing weight percentages of Fe
3O
4, where the highest Ms was achieved at 35% Fe
3O
4. Based on the results, the Ms values are 2.49, 6.55, 10.06, 11.06, and 13.06 emu/g for Al-10 Fe
3O
4, Al-15 Fe
3O
4, Al-20 Fe
3O
4, Al-30 Fe
3O
4, and Al-35 Fe
3O
4, respectively. The Ms increased while the Hc decreased as the weight percentage of Fe
3O
4 increased. It means that Hc leads to an opposite trend as opposed to Ms, as shown in
Figure 14. The curves indicated that the values of Hc did not fluctuate with a lower amount of iron oxide (10–15 wt.%). The maximum Hc is 231.87 G for Al-10 Fe
3O
4 and the Hc decreased to 188.82 G as the weight percentage of Fe
3O
4 increased from 10 to 15 wt.%. The addition of 15–20 wt.% Fe
3O
4 resulted in 150.26 G. Coercivity reduces due to the growth of the soft magnetic phase. It is proposed that the reduction in remanence and coercivity is caused by dipolar interaction and the presence of a magnetic vortex state. Besides, with low concentrations of the soft phase, the exchange interaction on the soft magnetic moments emitted by the hard phase is strong, resulting in the increase in Hc. Meanwhile, by increasing the concentration of the soft phase, the exchange force on soft grains would be enervated. Consequently, the reverse domains in the soft phase with a low nucleation field can be nucleated, resulting in a decline in Hc.
Moreover, Hc is a crucial factor in soft magnetic materials and it can be influenced by diverse defects, particularly a non-homogeneous structure, grain boundaries, dislocations, locally agglomerated nanoparticles, precipitates, pores, airgaps, impurities, the distribution of magnetite nanoparticles in the matrix, and non-magnetic particle dispersion. Accordingly, to reduce Hc, these elements should be kept low [
35,
36].
This could be the reason that the Hc increased to 165.12 G for Al-30 Fe3O4. The minimum Hc of 142.34 G for Al-35 Fe3O4 is the optimum value. Although the addition of more nanoparticles in the composite may result in higher Ms and lower Hc values, increasing the weight percentage of Fe3O4 can also lead to mechanical degradation. Defects can happen during milling or due to pores and contaminants, resulting in an increased value of Hc. Magnetic properties are investigated at room temperature and the values can be affected by an increase or change in temperature. In general, electromagnetic absorbing materials can be divided into two types based on the loss mechanism, which are dielectric materials SiC and magnetic materials Fe3O4, and a higher Ms leads to better electromagnetic absorbing properties.
3.7. Electrical Resistivity and Conductivity Measurements
The electrical properties of Al-Fe
3O
4 were assessed with the four-point probe method. To achieve this objective, DC power was applied with the provided current and voltage of 20 A and 20 V, respectively. Ferreira et al. synthesised an Al-20 Fe
3O
4 composite using the microwave method and investigated its electrical resistivity, which was determined to be 0.001028 Ω·m.
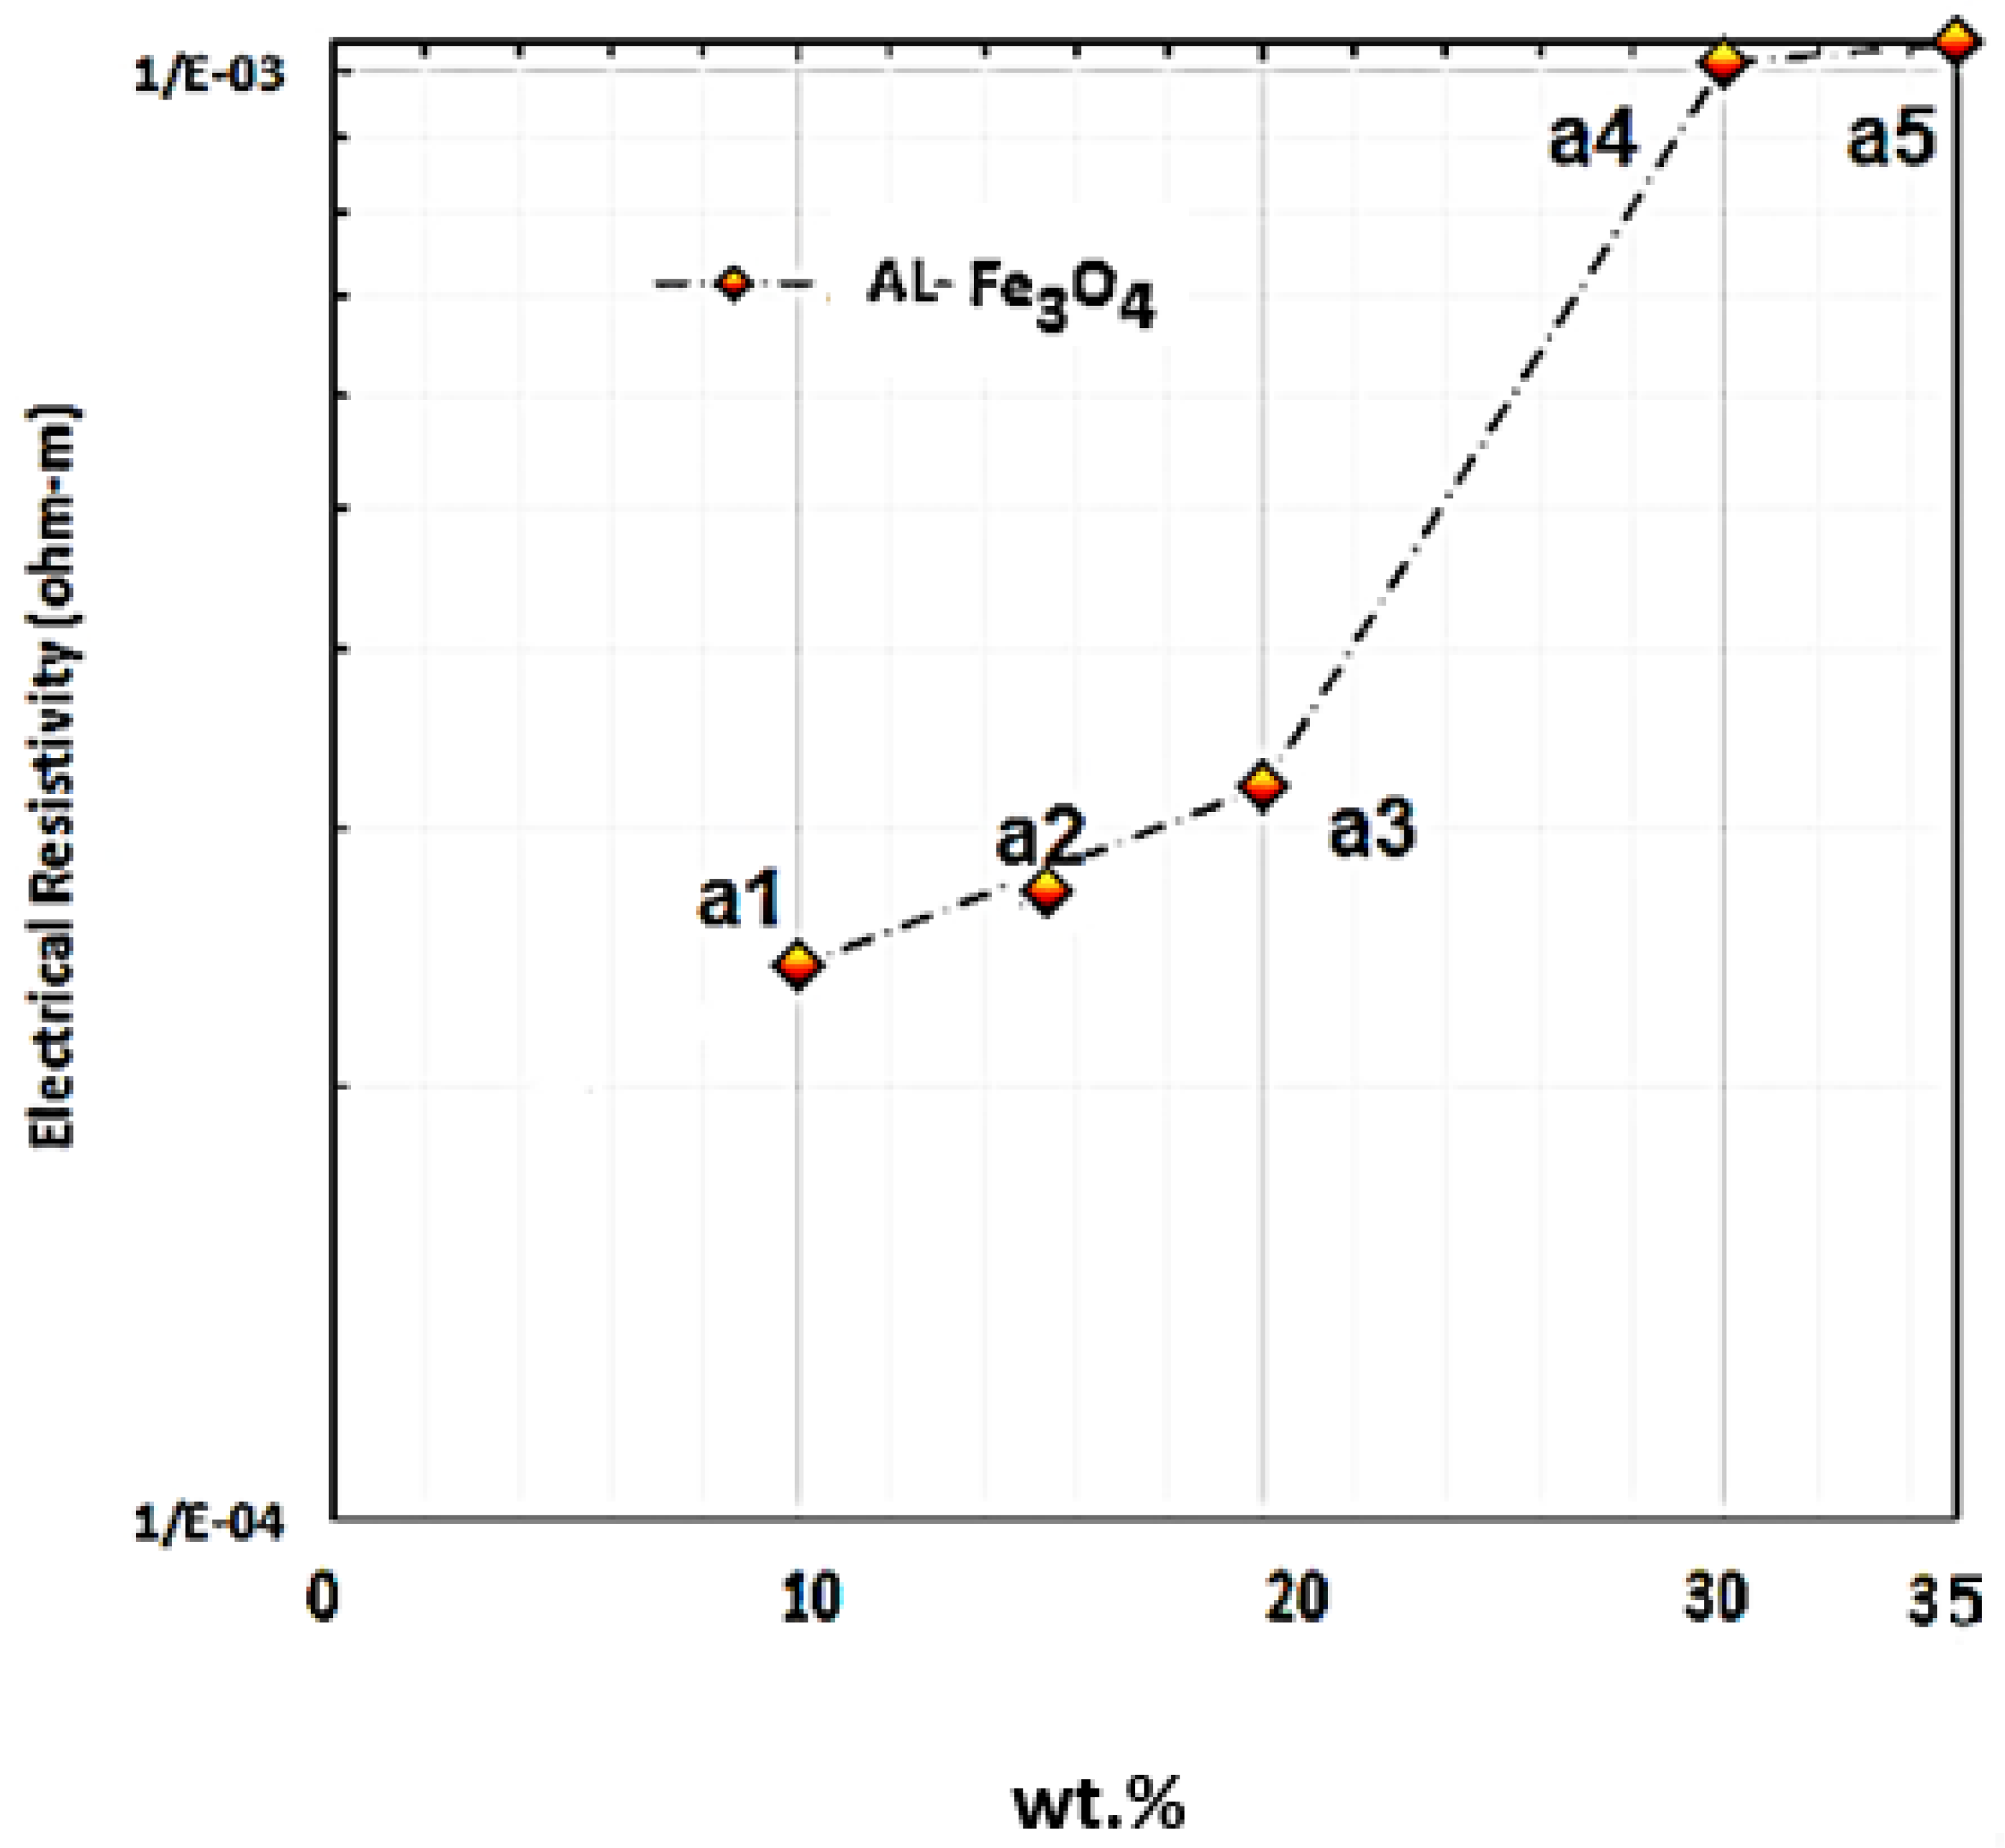
Figure 16 presents the electrical resistivity of Al-Fe
3O
4 composites with different weight percentages of Fe
3O
4 into the matrix at room temperature. Based on the experiment, the electrical resistivity of Al-5Fe
3O
4 and Al-10 Fe
3O
4 are 2 × 10
−4 and 2.81 × 10
−4 Ω·m, respectively, and by increasing the weight percentage of Fe
3O
4 to 15 and 20 wt.%, the electrical resistivity reached up to 3.21 × 10
−4 and 4.32 × 10
−4 Ω·m, respectively. This proved that the electrical resistivity improved slightly with a lower weight percentage of Fe
3O
4. By increasing the addition of Fe
3O
4 from 20 to 30 wt.%, the electrical resistivity increased significantly to 9.7 × 10
−4 Ω·m. The highest electrical resistivity is 9.9 × 10
−4 Ω·m for Al-35Fe
3O
4. The decline in the electrical conductivity of the composites can be explained as follows. In producing metal matrix composites, the higher conductivity of reinforcement particles can enhance the electrical conductivity in composites, but for most of the combinations, the particles play a role as an insulator due to the existence of free electrons, which are important for both electrical and thermal conductivity [
37]. Due to the free path of an electron, metals can exhibit greater electrical conductivity compared to alloys. The electrical resistivity of Al-Fe
3O
4-5% Mg composites increases by adding higher Fe
3O
4 content. The electrical resistance of metals illustrates the integrity of the crystal lattice to scatter electron waves. For the conductive properties of Al-Fe
3O
4 composites, aluminium is an exceedingly conductive constant phase. The continuous Al matrix determines the electrical conductivity of Al-Fe
3O
4 composites and increasing Fe
3O
4 particles strongly block the motion of electrons in the matrix, which increases the chance of scattering of electrons. Subsequently, the electrical resistivity of the composite increases. The composite electrical resistivity is related to microstructure-sensitive, nanoparticle arrangement and morphology, and also the number of particles, which significantly influence the resistivity of the material. There is less dispersion of electrons when the distribution of particles in the composite is consistent [
38].
As the electrical resistance increases, it can be related to the creation of secondary phases, such as Al
3Fe, Fe
3Al, MgAl
2O
4, and others. These phases can influence electrical properties adversely. Furthermore, by adding particles, mixed crystals can be formed, leading to lattice deformation and increasing the possibility of electron scattering. The current distorting structure may act in place of insulating materials to inhibit electron tunnelling and transfer from atom to atom, consequently lowering the electrical conductivity of the Al-Fe
3O
4 composites. However, it has an insignificant influence on the growth in resistivity. In addition, the agglomeration of Fe
3O
4 particles at Al grain boundaries may scatter the charge carrier, and by doing so, the electrical conductivity is reduced. Therefore, the addition of Fe
3O
4 decreases the electrical conductivity of aluminium. In electromagnetic shielding or absorption application in aerospace, high electrical conductivity is not essential although it may have a positive effect, where this hybrid composite is classified as a semiconductor material [
39].
3.8. Measurement of Thermal Properties (Expansion and Conductivity)
The coefficient of thermal expansion “α” explains the change in temperature that leads to the change in object dimensions. The coefficient of thermal expansion of aluminium is high. Hence, by changing the temperature, the dimension of aluminium and its alloy will change, which is approximately two times higher than ferrous metals. As a result, it can cause issues for metallic elements with close tolerances. Conversely, the thermal expansion of ceramic particles is substantially smaller. Thus, it is not unexpected that adding ceramic particles into aluminium will result in a decrease in the thermal expansion of Al-Fe
3O
4 composites [
40].
Figure 17 shows the expansion coefficient of Fe
3O
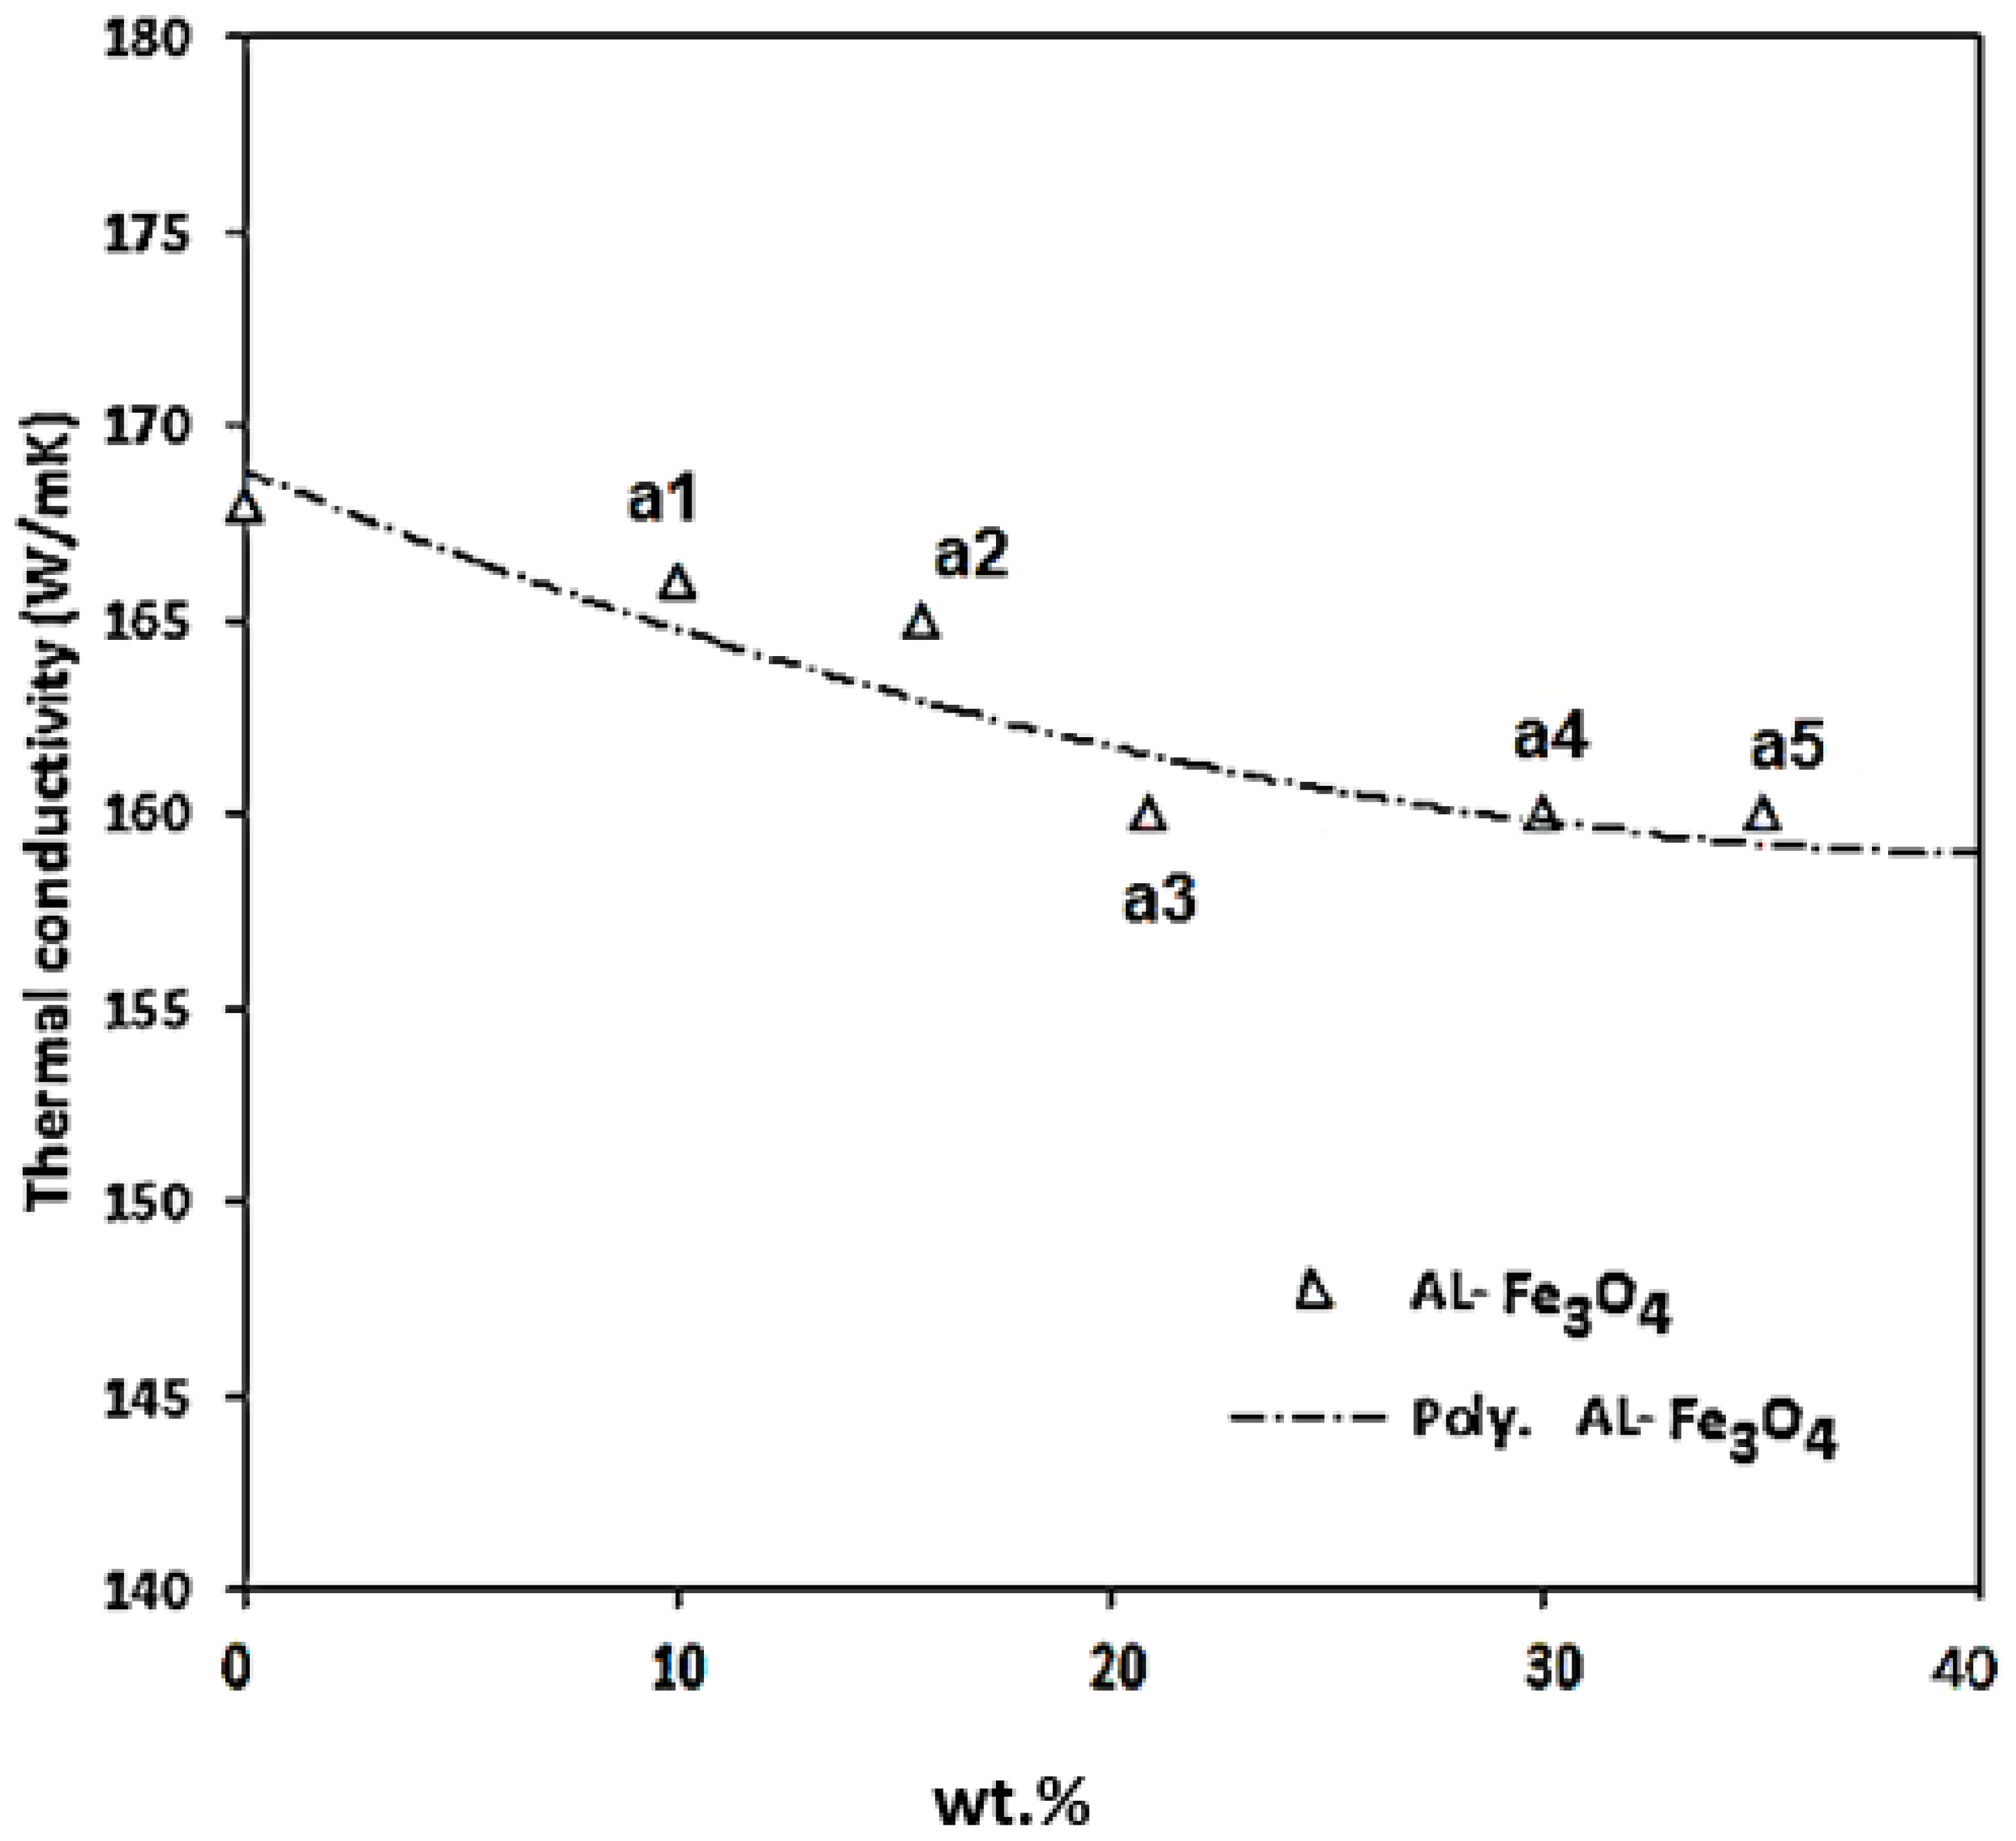
4 at different temperatures, where the values increased by raising the temperature. Generally, the thermal diffusivity and thermal conductivity of composites are enhanced by the amplification of temperature. Thermal diffusivity specifies how rapidly a material responds to a variation in temperature and can be evaluated using the laser flash technique. The thermal conductivity of the composites with various weight percentages of Fe
3O
4 and pure Al is presented in
Figure 18. The test results were obtained at room temperature for Al-Fe
3O
4 nanoparticles. The thermal conductivity of all the composites remained almost steady with a low percentage of Fe
3O
4. The maximum thermal conductivity is 168 W/mK for Al-5Fe
3O
4. The thermal conductivity reduced slightly from 166 to 165 W/mK as the weight percentage of Fe
3O
4 increased from 10 to 15 wt.%. As the Fe
3O
4 content increased to 20 and 30 wt.%, the thermal conductivity reached 163 and 161 W/mK, respectively. The minimum thermal conductivity is 159 W/mK for Al-35Fe
3O
4, which has only a slightly negative influence on these properties, and it is possible that increasing the weight percentage of Fe
3O
4 will significantly affect the composites. Fe
3O
4 has low thermal conductivity. Therefore, it is necessary to find an optimum weight percentage of Fe
3O
4.
A possible explanation of this issue is that lattice vibrations (phonon) and the movement of free electrons conduct the heat in solid materials. By adding Fe
3O
4 and Mg particles into aluminium, a higher number of nanoparticles lead to the growth of the interfacial layer and the increase of the interface temperature resistance, resulting in the decline in thermal conductivity. Moreover, the porosity of composites has a complicated effect on thermal conductivity. The pores can be considered as the scattered phase and the increase in porosity will decrease the thermal conductivity [
41].
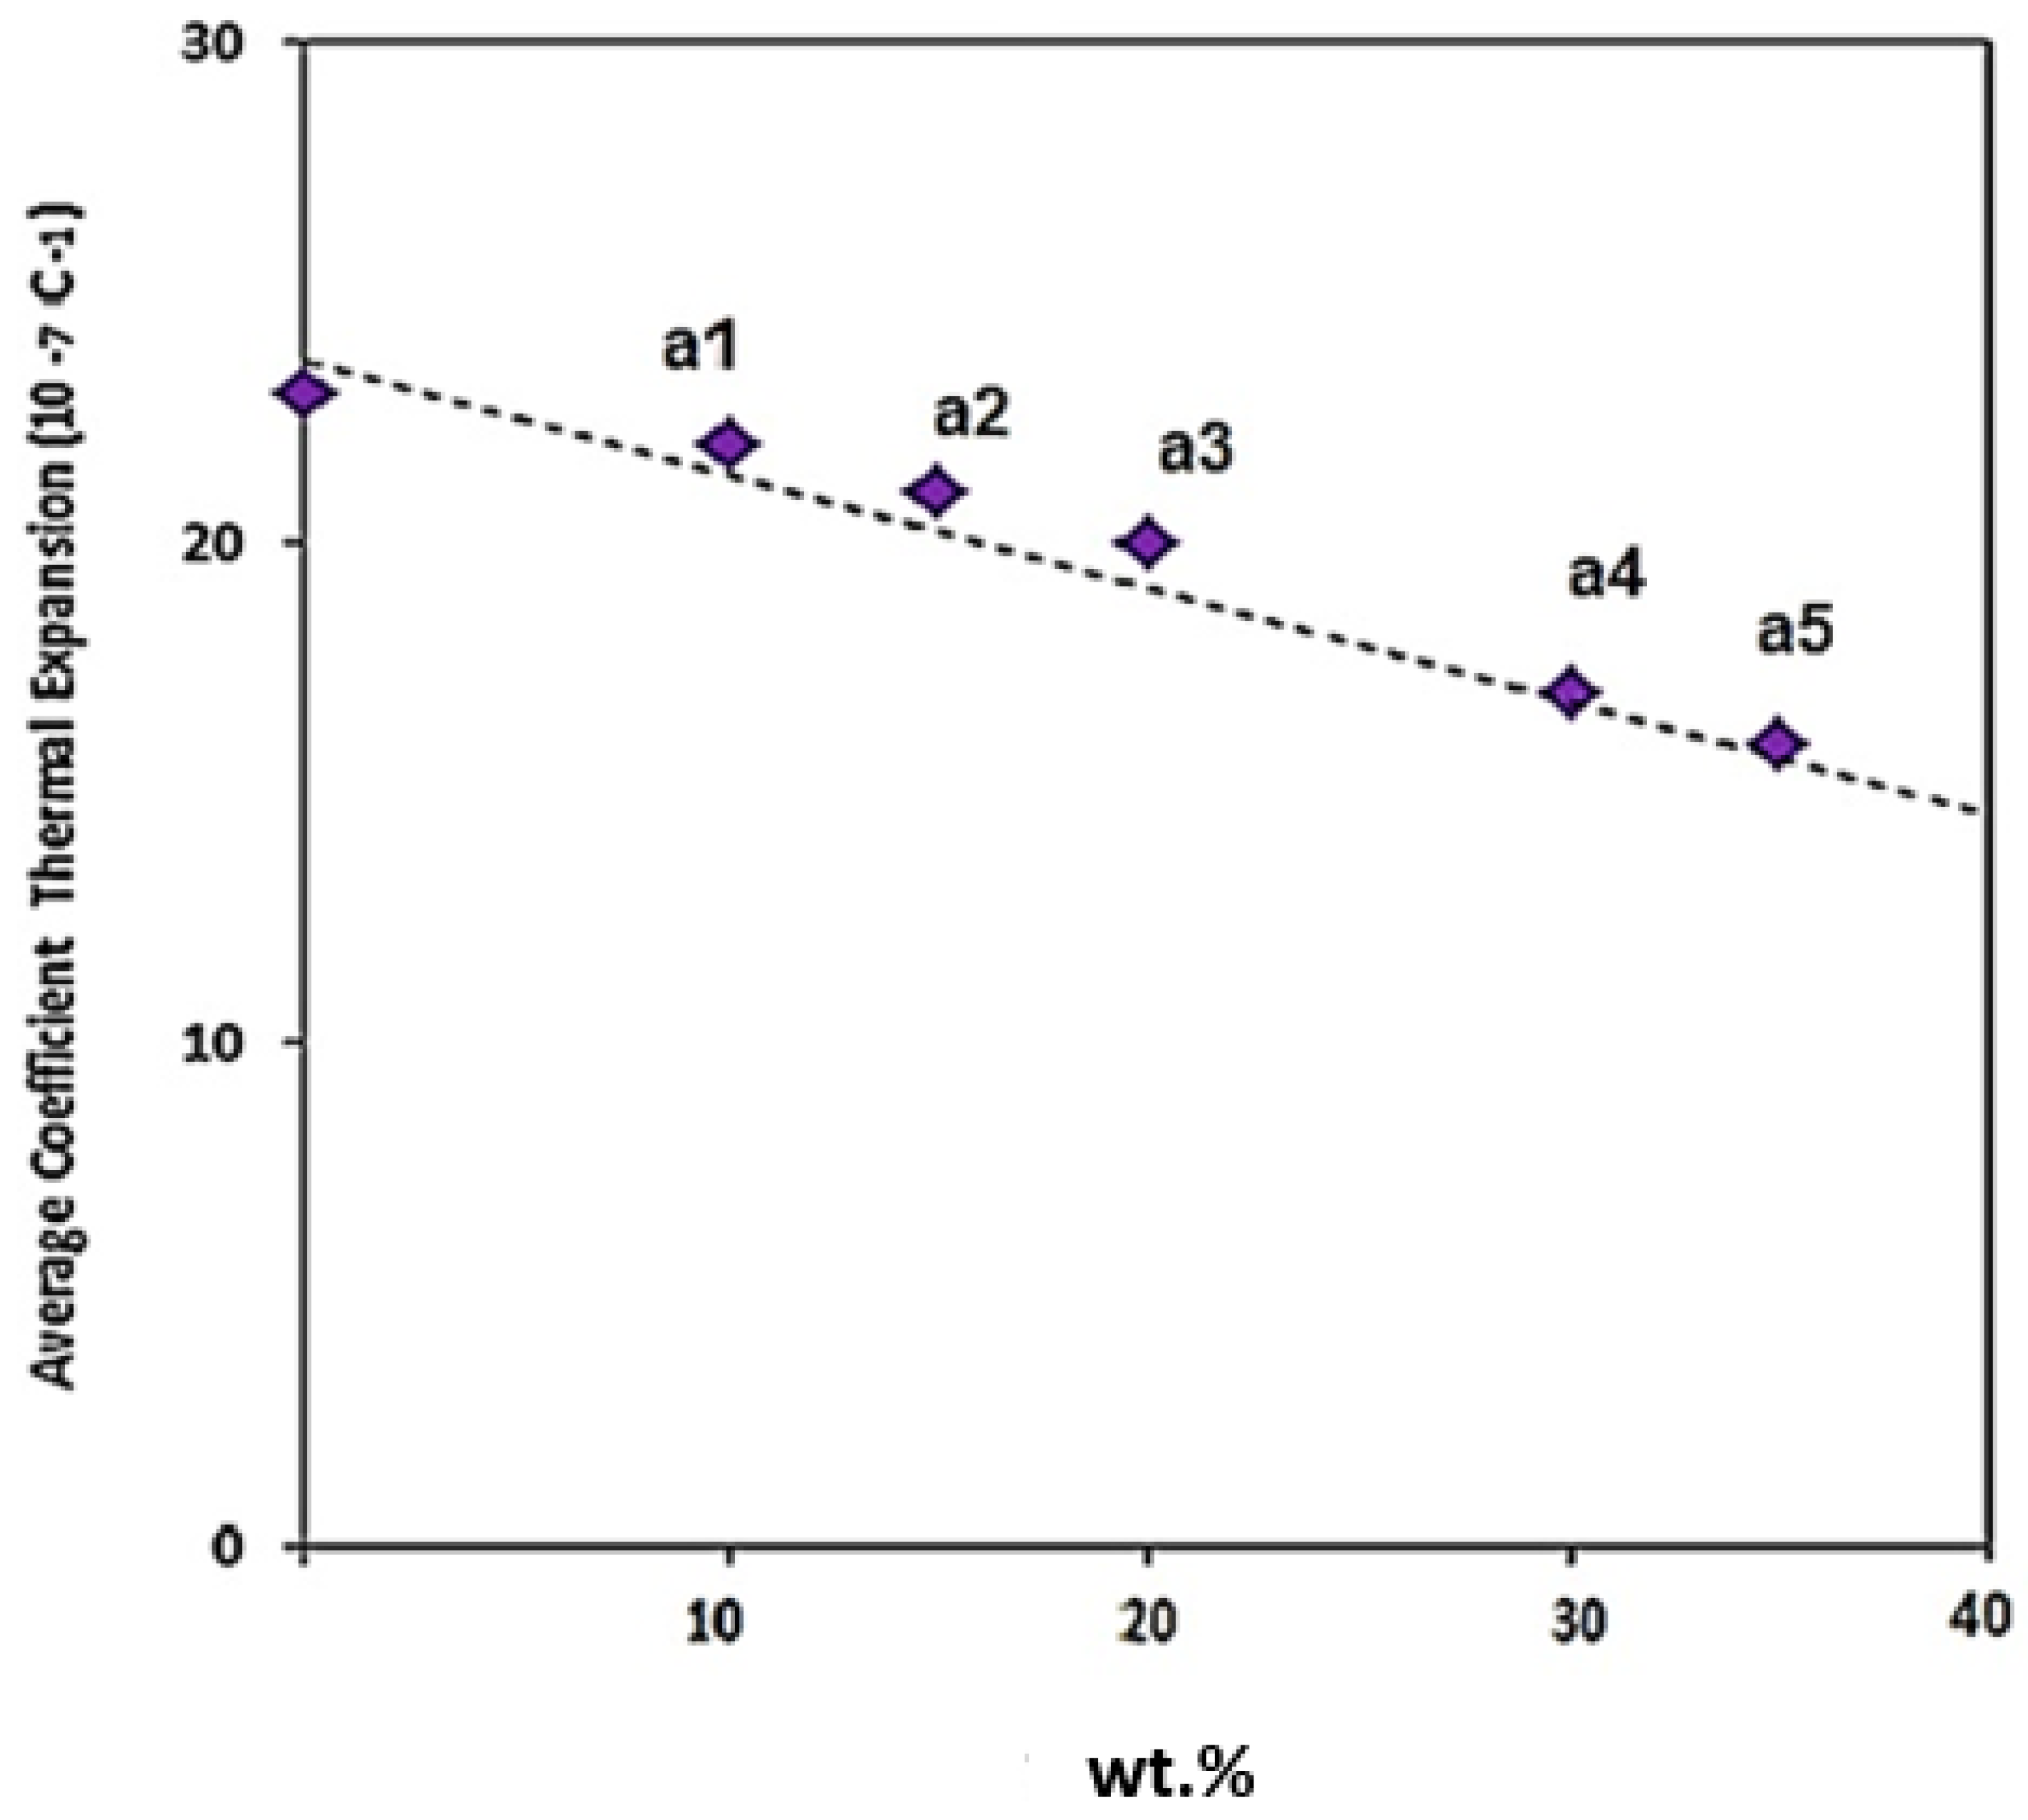
Figure 19 indicates the linear expansion coefficient of the composites with different weight percentages of Fe
3O
4. Based on the results, the thermal expansion coefficient of Al is 2.3 (10
−6 C
−1). The Al-5Fe
3O
4 composite has a thermal expansion coefficient of 2.2 (10
−6 C
−1). As the weight percentage of Fe
3O
4 increased from 10 to 15 wt. %, the thermal expansion coefficient decreased from 2.1 to 2.0 (10
−6 C
−1), and the thermal expansion coefficient declined from 1.9 to 1.8 (10
−6 C
−1) as the weight percentage of Fe
3O
4 increased from 20 to 30 wt.%. The thermal expansion coefficient for Al-35Fe
3O
4 is 1.7 (10
−6 C
−1).
These findings can be explained as follows. First, from Turner’s model, the thermal expansion coefficient of composites mostly correlated with the thermal expansion coefficient of the aluminium matrix and the restriction on the reinforcement through the matrix/reinforcement interface [
42]. The main influence on the thermal expansion coefficient is the weight percentage of reinforcement particles. Secondly, interface stress, as a result of the existing mismatch between matrix and particle’s thermal expansion inside the restrictions of the boundary, will cause residual stress in the matrix close to the interfacial area, which can cause the elastic strain in the aluminium matrix. There are other parameters, including the binding force among atoms, grain size, and porosity, that depend on each specification, which may have a negative or positive effect on thermal expansion [
43,
44].
