


Abstract
Achieving Great Britain’s 2050 net-zero target requires strategic integration of hydrogen into the national energy system. This study evaluates the system-wide impacts of hydrogen blending (0–100%) using a bi-level optimisation framework that combines long-term cooperative investment planning with short-term operational Optimal Power and Gas Flow (OPGF) simulation. The strategic layer models infrastructure investment decisions under a cooperative game-theoretic structure, where system value is allocated among electricity, hydrogen production, and storage technologies using the Shapley-value payoff mechanism. Contrary to traditional centralised cost-minimisation models, our findings demonstrate that a cooperative planning structure identifies superior transition pathways. Comparative results reveal that at 100% hydrogen penetration, the cooperative framework reduces total system CO2 emissions by 31%, lowers operational costs by 26%, and decreases total electricity supply requirements by 8% relative to centralised planning. Furthermore, the cooperative approach significantly enhances economic resilience, yielding a more robust Net Present Value (NPV) across all blending levels compared to centralised planning, while ensuring project profitability at lower blending thresholds (20%) where traditional models remain loss-making. Simulation results indicate that hydrogen blending up to 20% maintains operational stability with manageable increases in operational cost. Full hydrogen conversion (100%) increases peak electricity supply requirements by approximately 30% relative to low-blending scenarios due to electrolysis-driven load expansion and conversion losses. The findings demonstrate that hydrogen blending represents a viable transitional pathway when supported by integrated infrastructure development and cooperative stakeholder coordination, enabling a more efficient and economically sustainable phased progression towards Great Britain’s 2050 net-zero target.
1. Introduction
1.1. Background
The United Kingdom has committed to a legally binding target of net-zero greenhouse gas emissions by 2050. Residential and industrial heating, currently dominated by natural gas, accounts for a significant portion of the UK’s carbon footprint. Hydrogen blending into the existing National Transmission System (NTS) and Local Transmission Systems (LTS) has emerged as a primary strategy to decarbonise gas-reliant sectors without immediate, wholesale infrastructure replacement.
While a 20% volumetric blend is considered technically possible [1], the practical implementation at the transmission level involves significant complexities. Stakeholder engagement has highlighted that blend variability can impact the stability of industrial processes and power generation equipment, while the transition to a blend-ready network requires substantial capital investment and coordinated operational downtime. These factors suggest that blending may serve more effectively as a temporary transitional measure rather than a long-term solution, potentially favouring a more rapid strategic shift towards dedicated 100% hydrogen infrastructure [2].
Our previous regional analysis for the North of Tyne area [3] applied a multi-system-perspective framework to compare hydrogen blending, heat pumps, and socio-technical interventions for residential heating. The results show that hydrogen blending acts primarily as a transitional option, as it delivers significantly lower system-wide efficiency (42–63%) and higher long-term operational costs compared to heat pumps (98–107% efficiency). These findings align with national-level industry evaluations, such as the Arup 2025 Stakeholder Engagement Report [2], which characterises blending as a temporary solution. Stakeholders in that study highlighted significant concerns regarding reduced energy density and the substantial costs for metering and equipment modifications, which further diminish the technical efficiency of blending compared to more enduring decarbonisation pathways. Together, these regional and national perspectives highlight the importance of jointly assessing hydrogen, electrification, and demand reduction within an integrated energy-system framework.
A national-scale assessment is needed to evaluate how hydrogen blending interacts with electricity and gas networks under strategic stakeholder coordination.
This study focuses on national-scale strategic planning rather than high-resolution operational simulation; accordingly, a steady-state formulation is adopted as a deliberate and appropriate modelling choice, enabling tractable optimisation while capturing key cross-vector interactions between electricity and gas networks.
However, conventional centralised planning approaches often oversimplify stakeholder interactions and fail to capture coordination inefficiencies in integrated multi-vector systems, potentially leading to suboptimal transition pathways.
1.2. Objectives and Contributions
This study addresses this gap by developing a cooperative game-theoretic framework for Great Britain’s integrated energy system, assessing both operational performance and strategic investment planning for hydrogen blending. The key contributions of this work are as follows:
- 1.
- National-scale assessment of hydrogen blending: We quantify the operational, economic, and environmental impacts of hydrogen blending (0–100%) across Great Britain’s electricity and gas networks, capturing cross-vector interactions at system-wide scale.
- 2.
- Cooperative planning framework: The paper introduces a bi-level cooperative game-theoretic model that allocates system value among electricity, hydrogen production, and storage technologies, explicitly representing stakeholder coordination and strategic investment behaviour.
- 3.
- Shapley-value technology contributions: We employ Shapley-value analysis to evaluate the individual contributions of key technologies, providing insights into the relative importance of renewables, hydrogen conversion pathways, and storage in multi-vector system operation.
- 4.
- Integration of CCS and hydrogen blending scenarios: The framework examines the combined effect of low- and high-blending hydrogen strategies with and without carbon capture and storage, demonstrating how CCS deployment affects system emissions and economic performance.
- 5.
- Policy-relevant insights: By analysing system sensitivity to feedstock prices and blending proportions, the study offers evidence-based guidance for infrastructure investment prioritisation, transition pathway design, and policy support for hydrogen integration.
- 6.
- Our cooperative framework identifies superior investment pathways by more effectively aligning multi-vector incentives than traditional centralised models, significantly reducing both total system costs and carbon intensity (e.g., a 26% and 31% reduction, respectively, at full hydrogen conversion).
1.3. Related Work
Despite the growing interest in hydrogen blending, national-scale analyses that capture cross-vector interactions, stakeholder coordination, and investment strategies remain limited.
The decarbonisation of the residential heating sector is a critical component of the United Kingdom’s strategy to achieve net-zero emissions by 2050 [4]. Residential gas use contributes approximately 14% of the UK’s total greenhouse gas emissions, primarily due to the continued reliance on natural gas for space heating and cooking [5]. Transitioning this demand requires a diverse technological mix, primarily focusing on electrification through heat pumps and the integration of low-carbon gases such as hydrogen into existing infrastructures [6,7]. Regional studies, such as those conducted in the North of Tyne, emphasise that these transitions must prioritise system-wide energy efficiency and socio-technical interventions, including building insulation and behavioural changes, to effectively reduce aggregate demand [8,9,10]. Our previous NoT-focused work further demonstrated that socio-technical measures and heat pumps can outperform hydrogen-only pathways in terms of primary energy efficiency and operating cost, with hydrogen blending acting as a transitional option rather than the dominant long-term solution [3].
Hydrogen blending in existing natural gas networks has been identified as a vital bridge technology that utilises current infrastructure while scaling up low-carbon production [11,12]. Research suggests that a volumetric blend of up to 20% is operationally feasible without necessitating major upgrades to network pressures or domestic appliances [1,13]. However, the varying thermo-physical properties of hydrogen-gas mixtures require detailed integrated energy system modelling to ensure that technical performance and gas quality are maintained under the uncertainties of variable renewable generation and changing consumption patterns [14,15].
At a national scale, the integration of electricity, gas, and hydrogen vectors facilitates significant flexibility through cross-vector resource shifting [8,16,17], while traditional planning often relies on centralised cost-minimisation models, these approaches frequently overlook the strategic behaviour and misaligned incentives inherent in liberalised energy markets [18,19]. To address this, game-theoretic frameworks are employed to analyse interactions between independent stakeholders. Non-cooperative Nash–Cournot models are used to identify stable market equilibria in competitive settings, whereas cooperative game theory, utilising the Shapley value, provides a mechanism for the fair allocation of costs and benefits among diverse technology participants [20,21,22].
National investment strategies, such as the Leading the Way scenario, underscore the scale of infrastructure required to meet 2050 targets, with hydrogen demand projected to reach up to 150 TWh per year [23,24]. The economic viability of these pathways is highly sensitive to policy instruments, including carbon pricing and commodity price volatility [25,26]. Ultimately, achieving deep decarbonisation through hydrogen blending requires a shift from fragmented, competitive investment toward coordinated planning paradigms that can internalise system-wide costs and mitigate the coordination risks found in highly coupled multi-vector networks [22,27].
To further clarify the positioning of this study relative to existing literature, Table 1 presents a comparative analysis of relevant works based on modelling scope, methodological approach, and system scale.
Table 1.
Comparative Analysis of Integrated Energy System (IES) Planning Literature.
As shown in Table 1, existing studies typically focus on partial aspects of integrated energy system planning, such as either hydrogen blending, dynamic modelling, or centralised optimisation. In contrast, the proposed framework uniquely combines national-scale integrated modelling, hydrogen blending, cooperative planning, and explicit comparison with centralised approaches, thereby addressing a key gap in the literature.
In summary, and as evidenced in Table 1, while hydrogen blending has been widely discussed, it has not, to the best of our knowledge, been evaluated in the context of its system-wide impacts under coordinated national planning that integrates cross-vector interactions, stakeholder behaviour, and strategic investment decisions. Recent advances in integrated electricity–gas system modelling have introduced dynamic and spatially resolved formulations that capture temporal and network-level detail; however, these approaches typically require significant computational effort and detailed data, limiting their applicability at a national scale. In contrast, this study adopts a steady-state framework to enable tractable national-scale planning while capturing essential cross-vector interactions through a cooperative game-theoretic approach applied to Great Britain’s integrated energy system.
2. Methodology
The methodology integrates physical gas-mixture modelling with strategic game-theoretic analysis to capture both the operational constraints and stakeholder interactions in the GB energy system.
The modelling framework and core methodological formulations adopted in this section build upon and extend our previously published works in [3,28]. Specifically, the hydrogen blending formulation and its application to the North of Tyne case study are derived from [3], while the integrated electricity–gas system modelling framework for Great Britain is based on [28].
2.1. Modelling Framework
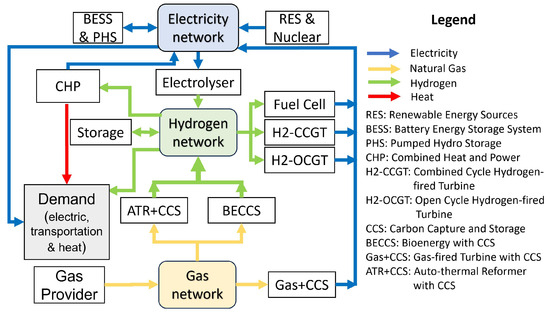
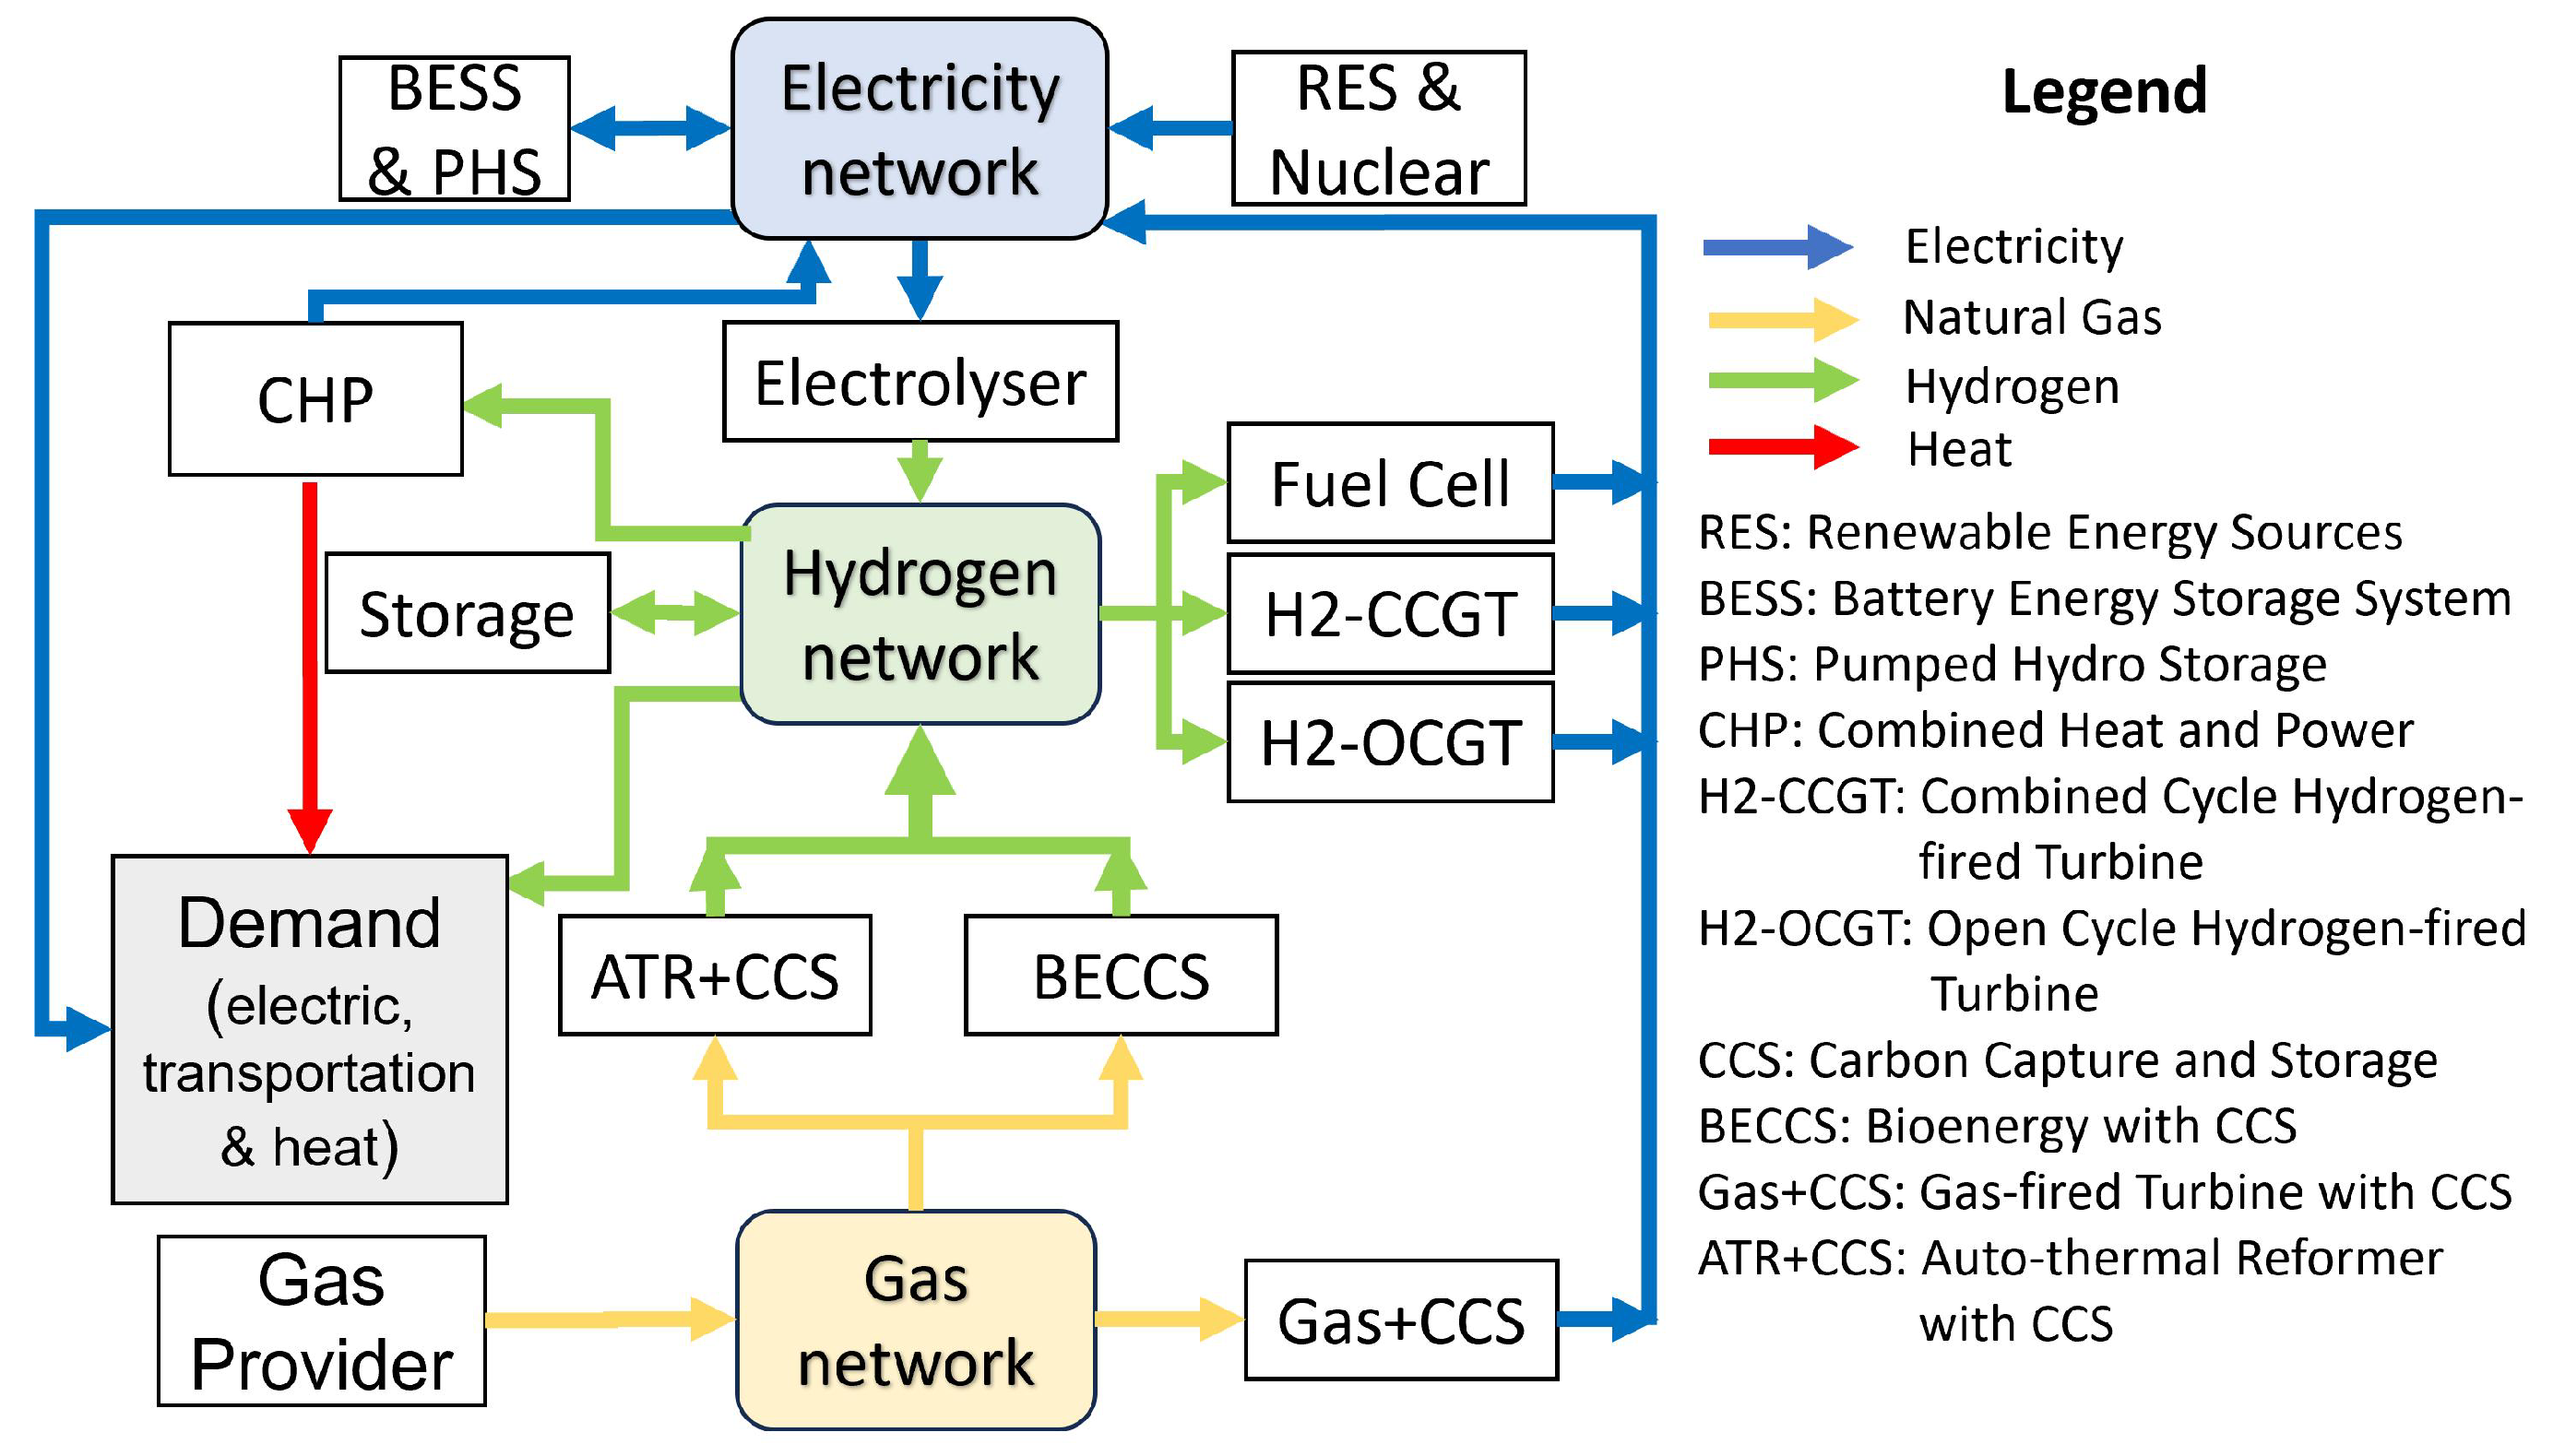
The methodology is based on a high-level resources–technology framework, as illustrated in Figure 1. The model incorporates key energy resources, including electricity and natural gas, along with conversion technologies such as water electrolysers for hydrogen production and, where applicable, H2 reformers for blue hydrogen. It also represents energy networks (electricity, natural gas, and hydrogen), storage systems (H2 storage), and heat demand technologies, including heat pumps, hydrogen boilers, hydrogen-based district heating, and natural gas boilers. In addition, demand-side measures, such as improved insulation and smart control systems, are included to capture energy efficiency interventions.
Figure 1.
Integrated energy system framework for Great Britain, showing coupling between electricity and hydrogen-blended gas networks [28].
2.2. Electric Network Modelling
The electricity network is modelled using nodal power balance equations solved under a steady-state AC power flow formulation. These equations ensure that active and reactive power injections match demand at each bus while enforcing network feasibility.
In this study, power flow calculations are carried out using the open-source Pandapower tool (version 2.7.0) [29], ensuring reproducible modelling of large-scale electricity networks, as validated in Section 4.8.
2.2.1. Active Power Flow
The active power balance at bus i can be expressed as:
where and denote the active power generation and demand at bus i, respectively. and represent the voltage magnitudes at buses i and j, and are the line conductance and susceptance, and and denote the voltage phase angles.
2.2.2. Reactive Power Flow
The reactive power balance at bus i is given by:
where and denote the reactive power generation and demand at bus i, respectively, and the remaining variables are defined as previously.
2.2.3. Electric Network Constraints
In addition to the power balance equations, key operational constraints are explicitly represented as follows. Transmission line loading limits are enforced by:
where denotes the apparent power flow on line , is the voltage at bus k, is the current flowing from bus k to m, and represents the thermal capacity of the line.
Voltage magnitude limits at each bus are given by:
where is the set of buses. These constraints ensure that network congestion, voltage stability, and operational limits are explicitly enforced within the AC power flow formulation.
2.3. Hydrogen Blending in the Gas Network
Hydrogen can be introduced into existing natural gas networks to lower carbon emissions while making use of the current infrastructure. The modelling approach adopted here builds upon our previous work in [3]. Pandapipes [30] is employed to simulate gas mixtures, while Pandapower [29] is used to integrate multiple energy vectors. These tools enable efficient and consistent modelling of coupled energy systems. In this study, hydrogen is blended into the low-pressure natural gas network of the North of Tyne region. The volumetric and energy efficiency of gas distribution is represented through adjusted gas mixture properties.
The hydrogen blending process is represented by modelling gas mixture properties as functions of the hydrogen fraction, , defined as the molar proportion of hydrogen in the overall gas mixture [31]. Key mixture properties, including density, dynamic viscosity, compressibility, and gross calorific value (GCV), are evaluated using standard mixing rules.
Mass-weighted averaging is used to compute the mixture density:
The dynamic viscosity of the mixture is determined as a function of molar properties:
The compressibility factor of the mixture is obtained using a molar fraction-weighted average:
The gross calorific value of the mixture is evaluated using a molar fraction-weighted expression adjusted by compressibility:
where denote the mass fractions of component i, the molar masses, and the molar fractions. The gas mixture is represented using simplified mixing rules within a steady-state framework, while selected non-ideal effects, such as compressibility factor (Zmix) adjustments, are incorporated in the evaluation of thermophysical properties, including the gross calorific value, to account for deviations from ideal gas behaviour [8].
The flow of the gas mixture in each network branch is described using a modified steady-state gas flow equation:
where represents the volumetric flow rate in branch k [m3/s], and denote the pressures at the upstream and downstream nodes [Pa], D is the pipe diameter [m], and L is the pipe length [m]. f is the Darcy–Weisbach friction factor (dimensionless), is the specific gravity of the gas mixture relative to air, and T is the gas temperature [K]. and are the normalisation temperature and pressure [K, Pa], is the compressibility factor of the mixture, and denotes the universal gas constant for air [J/(kg·K)].
Mass conservation at each junction is enforced through the nodal balance:
where and denote the incoming and outgoing volumetric gas flows at node j [m3/s], respectively, and represents the gas demand (load) at node j [m3/s]. This equation enforces mass conservation at each node, ensuring that the net inflow equals the local demand under steady-state operating conditions.
The gas network is modelled under steady-state conditions with pressure-driven flows and nodal mass balance. Operational feasibility is enforced through explicit pressure and flow constraints.
Nodal pressure bounds are defined by:
and pipeline flow limits by:
where is the pressure at node i, is the flow in pipe , is the set of gas nodes, and is the set of pipeline segments. These constraints ensure pressure feasibility, flow capacity, and congestion limits within the steady-state modelling.
The interaction with the electricity system is modelled via Power-to-Gas (P2G) units, which convert electrical energy into hydrogen for injection into the network. The resulting hydrogen production (), expressed as an equivalent volumetric flow or energy rate, is given by:
Here, denotes the electrical power consumed by the P2G unit, represents its efficiency, and is the gross calorific value of pure hydrogen, used to convert electrical input into an equivalent hydrogen energy output. The efficiency of the P2G process () is a key parameter in evaluating the overall performance of hydrogen pathways, as it determines the amount of electrical energy required to produce a given quantity of hydrogen. In this study, is treated as a constant parameter. Its value is specified in Table 2 (Hydrogen Production Technologies), where the electrolyser (P2G) efficiency is assumed to be 60% and the reformer (G2G) efficiency is 75%. This assumption is adopted to ensure model tractability and is consistent with common practice in large-scale integrated energy system modelling, while in reality the efficiency may vary with operating conditions; such variations are not explicitly considered in this work.
Table 2.
Techno-economic assumptions for electricity generation and hydrogen production technologies in the GB integrated energy system model. Capital expenditure (CapEx), operational expenditure (OpEx), fixed operation and maintenance costs (O&M), emissions (CO2), and capacity factor (CF). Hydropower: ROR = Run-of-River, R = Reservoir. CHP: combined heat and power (Micro = micro-scale, Ind = industrial scale). Other RES = other renewables such as wave and tidal energy.
This formulation enables the model to capture the impact of hydrogen blending on network pressure, energy content, and operational feasibility. It also ensures compatibility with existing natural gas infrastructure and provides a comprehensive representation of energy flows and transformations [3].
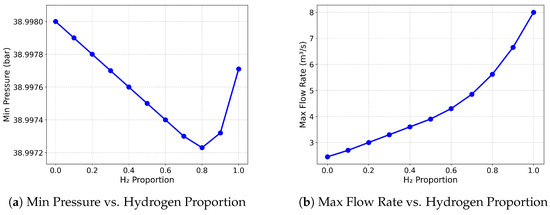
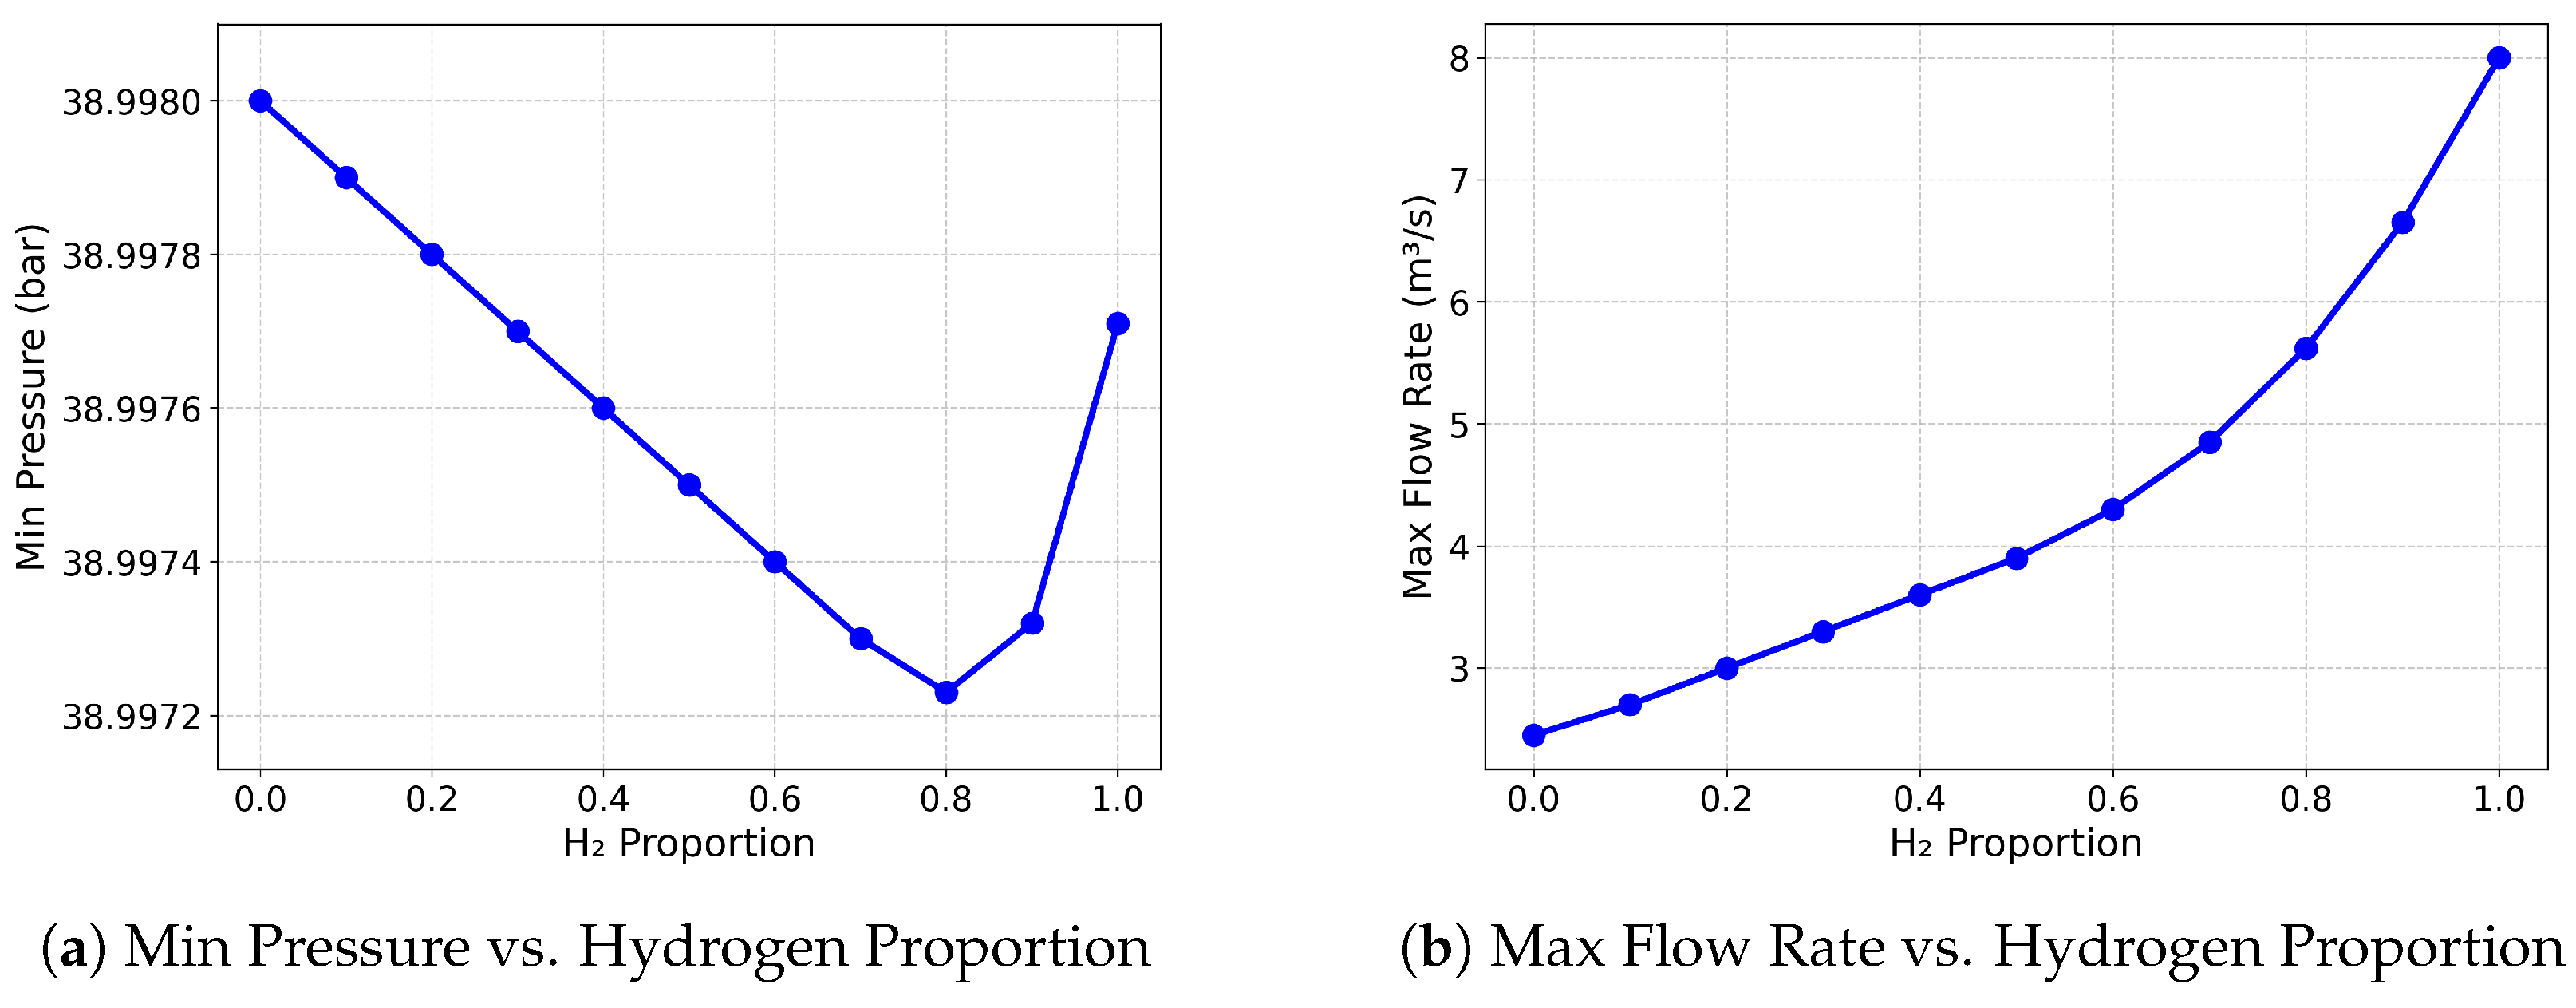
Figure 2 illustrates the operational implications of hydrogen blending in a low-pressure natural gas network. Figure 2a shows that as the hydrogen proportion increases, the minimum network pressure decreases initially and then rises at higher blending levels. This behaviour is attributed to the lower gas density at higher hydrogen fractions, which reduces flow resistance and partially offsets the initial pressure drop, highlighting the need for careful pressure management to maintain supply integrity. Figure 2b indicates that the maximum volumetric flow rate increases with increasing hydrogen content. The hydrogen fraction also influences the Wobbe Index (WI), which is defined as:
where denotes the gross calorific value of the gas mixture and its specific gravity relative to air. The reduction in WI associated with hydrogen’s low molecular weight and energy density limits the maximum safe blending level (typically around 20%) to maintain stable appliance operation [1]. Together with variations in network pressure and volumetric flow, this defines the operational constraints for hydrogen injection into existing natural gas networks.
Figure 2.
(a) Variation of minimum network pressure with hydrogen blending proportion; (b) Variation of maximum volumetric flow rate with hydrogen blending proportion. Both plots are obtained from the simulation of hydrogen blending in the low-pressure natural gas network [3].
It should be noted that the gas mixture properties are modelled using simplified mixing rules within a steady-state framework, while hydrogen–natural gas mixtures exhibit non-linear thermophysical behaviour in reality; such effects are not fully captured in the present formulation. The adopted approach is consistent with common steady-state gas network modelling practices and is used here to maintain computational tractability at the system level.
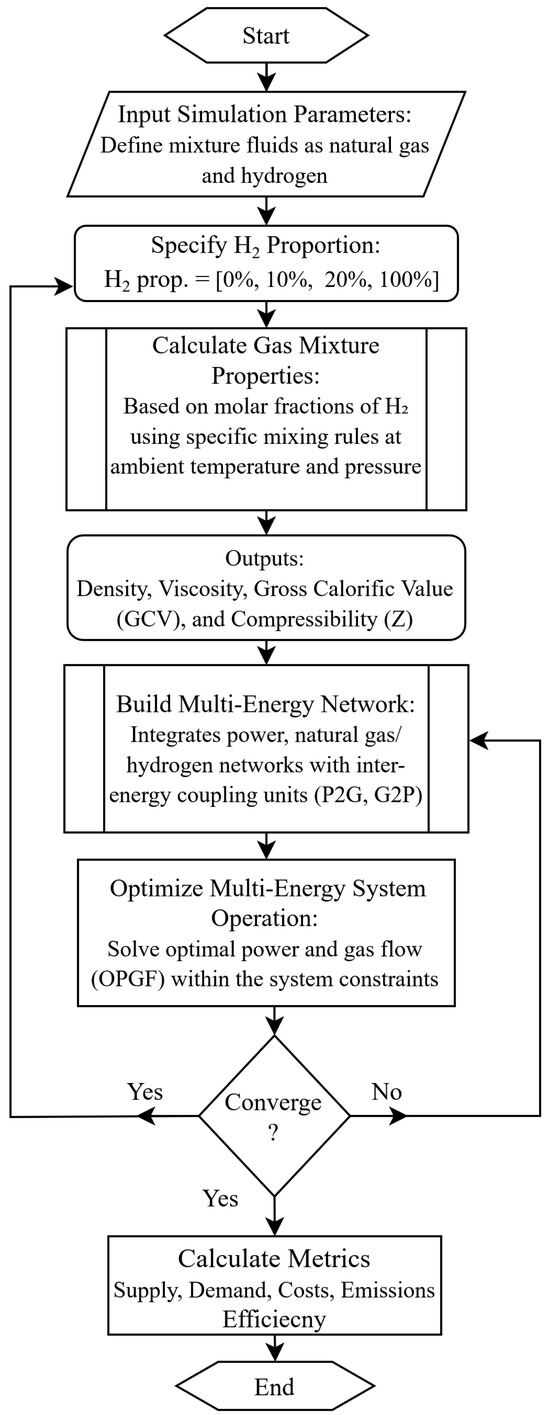
Figure 3 provides an overview of the methodological framework used for hydrogen blending analysis, illustrating the connection between gas mixture property definitions and the integrated optimisation of the multi-energy network.
Figure 3.
Process flowchart of hydrogen blending and multi-energy system optimisation, showing the sequential steps from defining input fluids to optimal power and gas flow analysis [3].
Overall, the combined electricity and gas formulations ensure that network feasibility is maintained through physical balance equations and steady-state flow relationships, thereby implicitly accounting for operational constraints such as congestion, losses, capacity limits, pressure bounds, and voltage limits within the adopted steady-state framework.
2.4. Cooperative Game-Theoretic Investment Model
Given the high capital intensity and cross-vector dependencies of hydrogen–electricity integration, decentralised investment decisions may lead to suboptimal system outcomes due to coordination failures and misaligned incentives. Therefore, a cooperative framework is adopted to evaluate system-wide value creation and ensure efficient joint investment decisions [28].
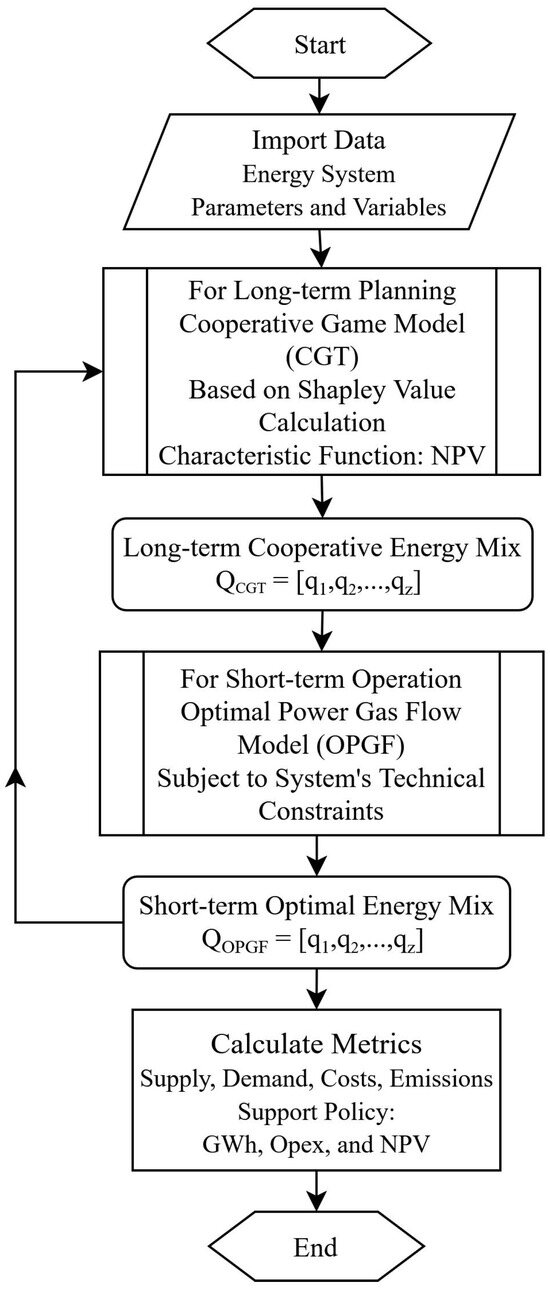
At the strategic level, long-term investment and revenue allocation decisions are modelled using a cooperative game-theoretic approach. All players , representing electricity generation, hydrogen production, and storage technologies, are assumed to participate in a grand coalition that jointly maximises system-wide value. The overall architecture, showing the iterative interaction between strategic investment and the operational Optimal Power and Gas Flow (OPGF) layer, is illustrated in Figure 4.
Figure 4.
Bi-level game-theoretic framework illustrating the iterative interaction between the cooperative investment model and the operational OPGF layer [28].
2.4.1. Objective Function
The characteristic function of the game is the total Net Present Value (NPV) of the coalition. The objective is to maximise the discounted operational revenues net of costs and investments:
where the terms are defined as follows:
- Annuity Factor (): Annualises operational profits over the planning horizon n at a discount rate r:Technology-specific economic assumptions used in the NPV formulation, including the discount rate r, lifetime, and other techno-economic parameters, are defined in Table 2. The analysis is conducted over a long-term planning horizon aligned with the 2050 Future Energy Scenarios framework, ensuring consistency between investment valuation and techno-economic parameters.
- Operational Profit and Carbon Costs: represents energy sales revenue, while and denote operational and carbon costs. Carbon costs are derived from emission intensity and the projected carbon price :
- Fixed Costs (): Reflects fixed O&M costs based on installed capacity and new investment , weighted by the fixed cost fraction and capital expenditure :
- Net Investment (): Represents the capital outlay adjusted for the economic lifetime of each technology:
2.4.2. Shapley Value Allocation of Benefits and Costs
To ensure the stability and fairness of the cooperative outcome, the total system NPV is allocated among players using the Shapley value. This assigns each player a payoff equal to its average marginal contribution across all possible sub-coalitions:
This mechanism identifies technologies critical for system profitability and those that may require policy support (e.g., subsidies) if their marginal contribution to the Net-Zero goal results in a negative individual NPV.
2.4.3. Investment and Capacity Constraints
Investment and operation decisions are subject to physical, policy-driven, and technical limits:
- Capacity constraint: The output of each technology is bounded by existing and newly installed capacity:
- Investment upper bound: New investments are limited by scenario-specific maximum levels:
These constraints ensure that all investment and operational decisions remain feasible within realistic technical and scenario-specific limits across the integrated energy system.
2.4.4. Cooperative Planning Implementation Using Shapley Values
It is noted that the exact computation of Shapley values requires evaluation of all possible coalitions, resulting in a computational complexity that grows exponentially with the number of players, i.e., . In this study, the number of players () remains within a tractable range, allowing full coalition enumeration.
The cooperative approach determines energy allocations among players based on Shapley values, reflecting each player’s contribution to joint welfare. While the allocations are computed in a decentralised manner, they operationally resemble a centralised allocation, as players form coalitions to maximise joint welfare and share demand according to well-defined contribution-based weights. The flowchart of the solution is illustrated in Figure 4, and the solution algorithm is as follows:
- Initialise system parameters, player capacities, and decision variables.
- Run the cooperative allocation to determine investment and generation decisions endogenously, where energy shares are computed via Shapley values to maximise joint welfare.
- Use the Shapley-based allocations as input to the OPGF model to verify operational feasibility under technical network constraints. The electrical network is simulated using Pandapower, and the hydrogen/gas network using Pandapipes.
- Check convergence: the process iterates until successive energy allocations are consistent with the OPGF solution within a tolerance of .
- The maximum number of iterations is set to 10, consistent with the default limit used in the Newton-based power and gas flow solvers; if convergence is not reached within this limit, the last feasible solution is used for reporting.
- Upon convergence, final metrics including supply, demand, costs, and emissions are computed, enabling assessment of system-wide efficiency. The framework remains cooperative and non-strategic, as allocations are determined by Shapley contributions rather than individual profit-maximising behaviour.
The interaction between the upper-level cooperative investment model and the lower-level OPGF model is implemented through an iterative feedback loop, where operational feasibility is enforced at each iteration until convergence within a prescribed tolerance is achieved.
In this framework, all possible coalitions are explicitly enumerated and evaluated to compute exact Shapley values, and the overall solution procedure remains computationally tractable for the considered system size.
The proposed framework adopts a cooperative optimisation formulation, where stakeholders are assumed to coordinate towards a system-wide objective rather than act strategically. Strategic behaviour under uncertainty is not explicitly modelled. Instead, a centralised (non-cooperative) optimisation case is included as a benchmark to evaluate the performance of the cooperative framework under coordinated versus independently optimised operation.
2.5. Centralised Planning Formulation
The centralised planning model is introduced as a benchmark optimisation framework to evaluate system performance under coordinated infrastructure decision-making. In this configuration, a single system planner is assumed to determine both operational dispatch and long-term capacity expansion across electricity and hydrogen networks.
Unlike the cooperative game-theoretic formulation, the centralised model does not incorporate strategic interaction between technologies or stakeholders. Instead, investment and operational decisions are determined simultaneously through a nonlinear programming (NLP) optimisation problem, subject to network physics, technical feasibility, and policy-driven constraints.
The objective of the centralised planner is to maximise overall system net present value by selecting optimal generation dispatch and infrastructure investment levels. Let the decision variables denote technology-specific output levels and capacity expansion choices. The optimisation problem can be expressed as:
where the parameters follow the definitions adopted in the system modelling framework. However, in contrast to the cooperative model, all technologies are optimised jointly by the central planner rather than being treated as independent strategic agents.
Operational and Investment Feasibility
System operation is constrained by technology capacity availability and allowable infrastructure expansion. For each technology z, the generation output is limited by the sum of existing installed capacity and newly added investment:
Investment activity is further restricted by scenario-dependent expansion limits:
All network flow, storage, and technical feasibility constraints described in Section 2.1, Section 2.2 and Section 2.3 are enforced directly within the optimisation procedure.
The centralised planning solution therefore serves as a reference case for assessing the benefits of coordinated coalition-based infrastructure management relative to conventional system-wide optimisation without strategic technology interaction.
2.6. Modelling of CCS Deployment
When carbon capture and storage (CCS) is deployed, a capture efficiency parameter is applied. This represents the fraction of CO2 captured at the emission source.
2.6.1. Emissions Under CCS
The residual emission factor, (tCO2/MWh), accounts for the uncaptured fraction of CO2 emissions:
where is the baseline emission factor. The mass of CO2 captured per unit of output, defined as , is used to calculate capture-related operational costs.
2.6.2. Effective Capacity and Energy Penalty
The parasitic load required for CO2 separation and compression imposes an energy penalty, , which reduces the net available capacity:
where and represent the nameplate and maximum allowable investment capacity (MW), respectively.
2.6.3. Cost Components
The economic impact of CCS is represented through both capital and operational components. Increased capital expenditure (CapEx) for capture units is incorporated into the investment cost of CCS-enabled technologies. In addition, a variable operating cost increment, , is introduced to represent the costs of solvent regeneration, CO2 conditioning, and transport:
where (£/tCO2) is the unit cost of the CCS value chain.
These adjustments propagate through the bi-level framework, influencing the objective function (total system cost) and the equilibrium constraints governing the interaction between the gas, hydrogen, and electricity networks.
3. Case Study: Great Britain (GB) Energy System
The framework is applied to the GB energy system to demonstrate how integrated electricity and gas networks, combined with hydrogen blending and socio-technical interventions, can be coordinated to achieve decarbonisation objectives while simultaneously enhancing energy efficiency and promoting conservation.
3.1. System Description
The GB energy system is modelled as a highly coupled multi-vector network linking electricity, gas, hydrogen, and heat infrastructures. This model encompasses 18 distinct technology groups acting as strategic players in a liberalised market. These include variable renewable energy sources (offshore and onshore wind, utility-scale solar PV), firm low-carbon generation (nuclear, hydropower), and critical conversion technologies such as electrolysers (P2G) for green hydrogen and Autothermal Reforming (ATR) of the national gas for grey hydrogen (G2G) and with carbon capture and storage for blue hydrogen (G2G+CCS).
The analysis is aligned with the National Grid Future Energy Scenarios (FES), specifically focusing on the Leading the Way pathway to 2050. The system assumes a national electricity peak demand of GWh and a hydrogen peak demand of GWh, as derived from the National Grid ESO Future Energy Scenarios (FES) 2023 Leading the Way pathway [23]. To ensure policy alignment, a carbon price of £165/tCO2 is applied. The geographical layout of the integrated GB system and its coupled networks is illustrated in Figure 1.
3.2. Techno-Economic Parameters
The techno-economic assumptions for the primary generation and hydrogen production technologies are sourced from [23,32] and summarised in Table 2. For the 2050 planning horizon, the model endogenously determines the cost-optimal utilisation of these assets under varying commodity prices.
The data and code scripts for the model applied to the GB case study are available at: https://github.com/MohamedAbuella/GB_IES (accessed on 9 April 2026).
For consistency with standard carbon capture and storage (CCS) performance parameters (see Section 2.6), the capture efficiency is assumed to be . The specific cost of CO2 capture is set at , while the associated CCS energy penalty is assumed to be . The CCS configuration is applied across all gas-based technologies, including gas turbines, combined heat and power (CHP) units, and gas-fired reformers.
3.3. Feedstock Price Scenarios
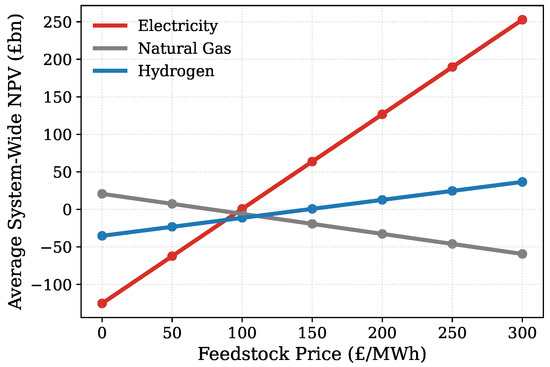
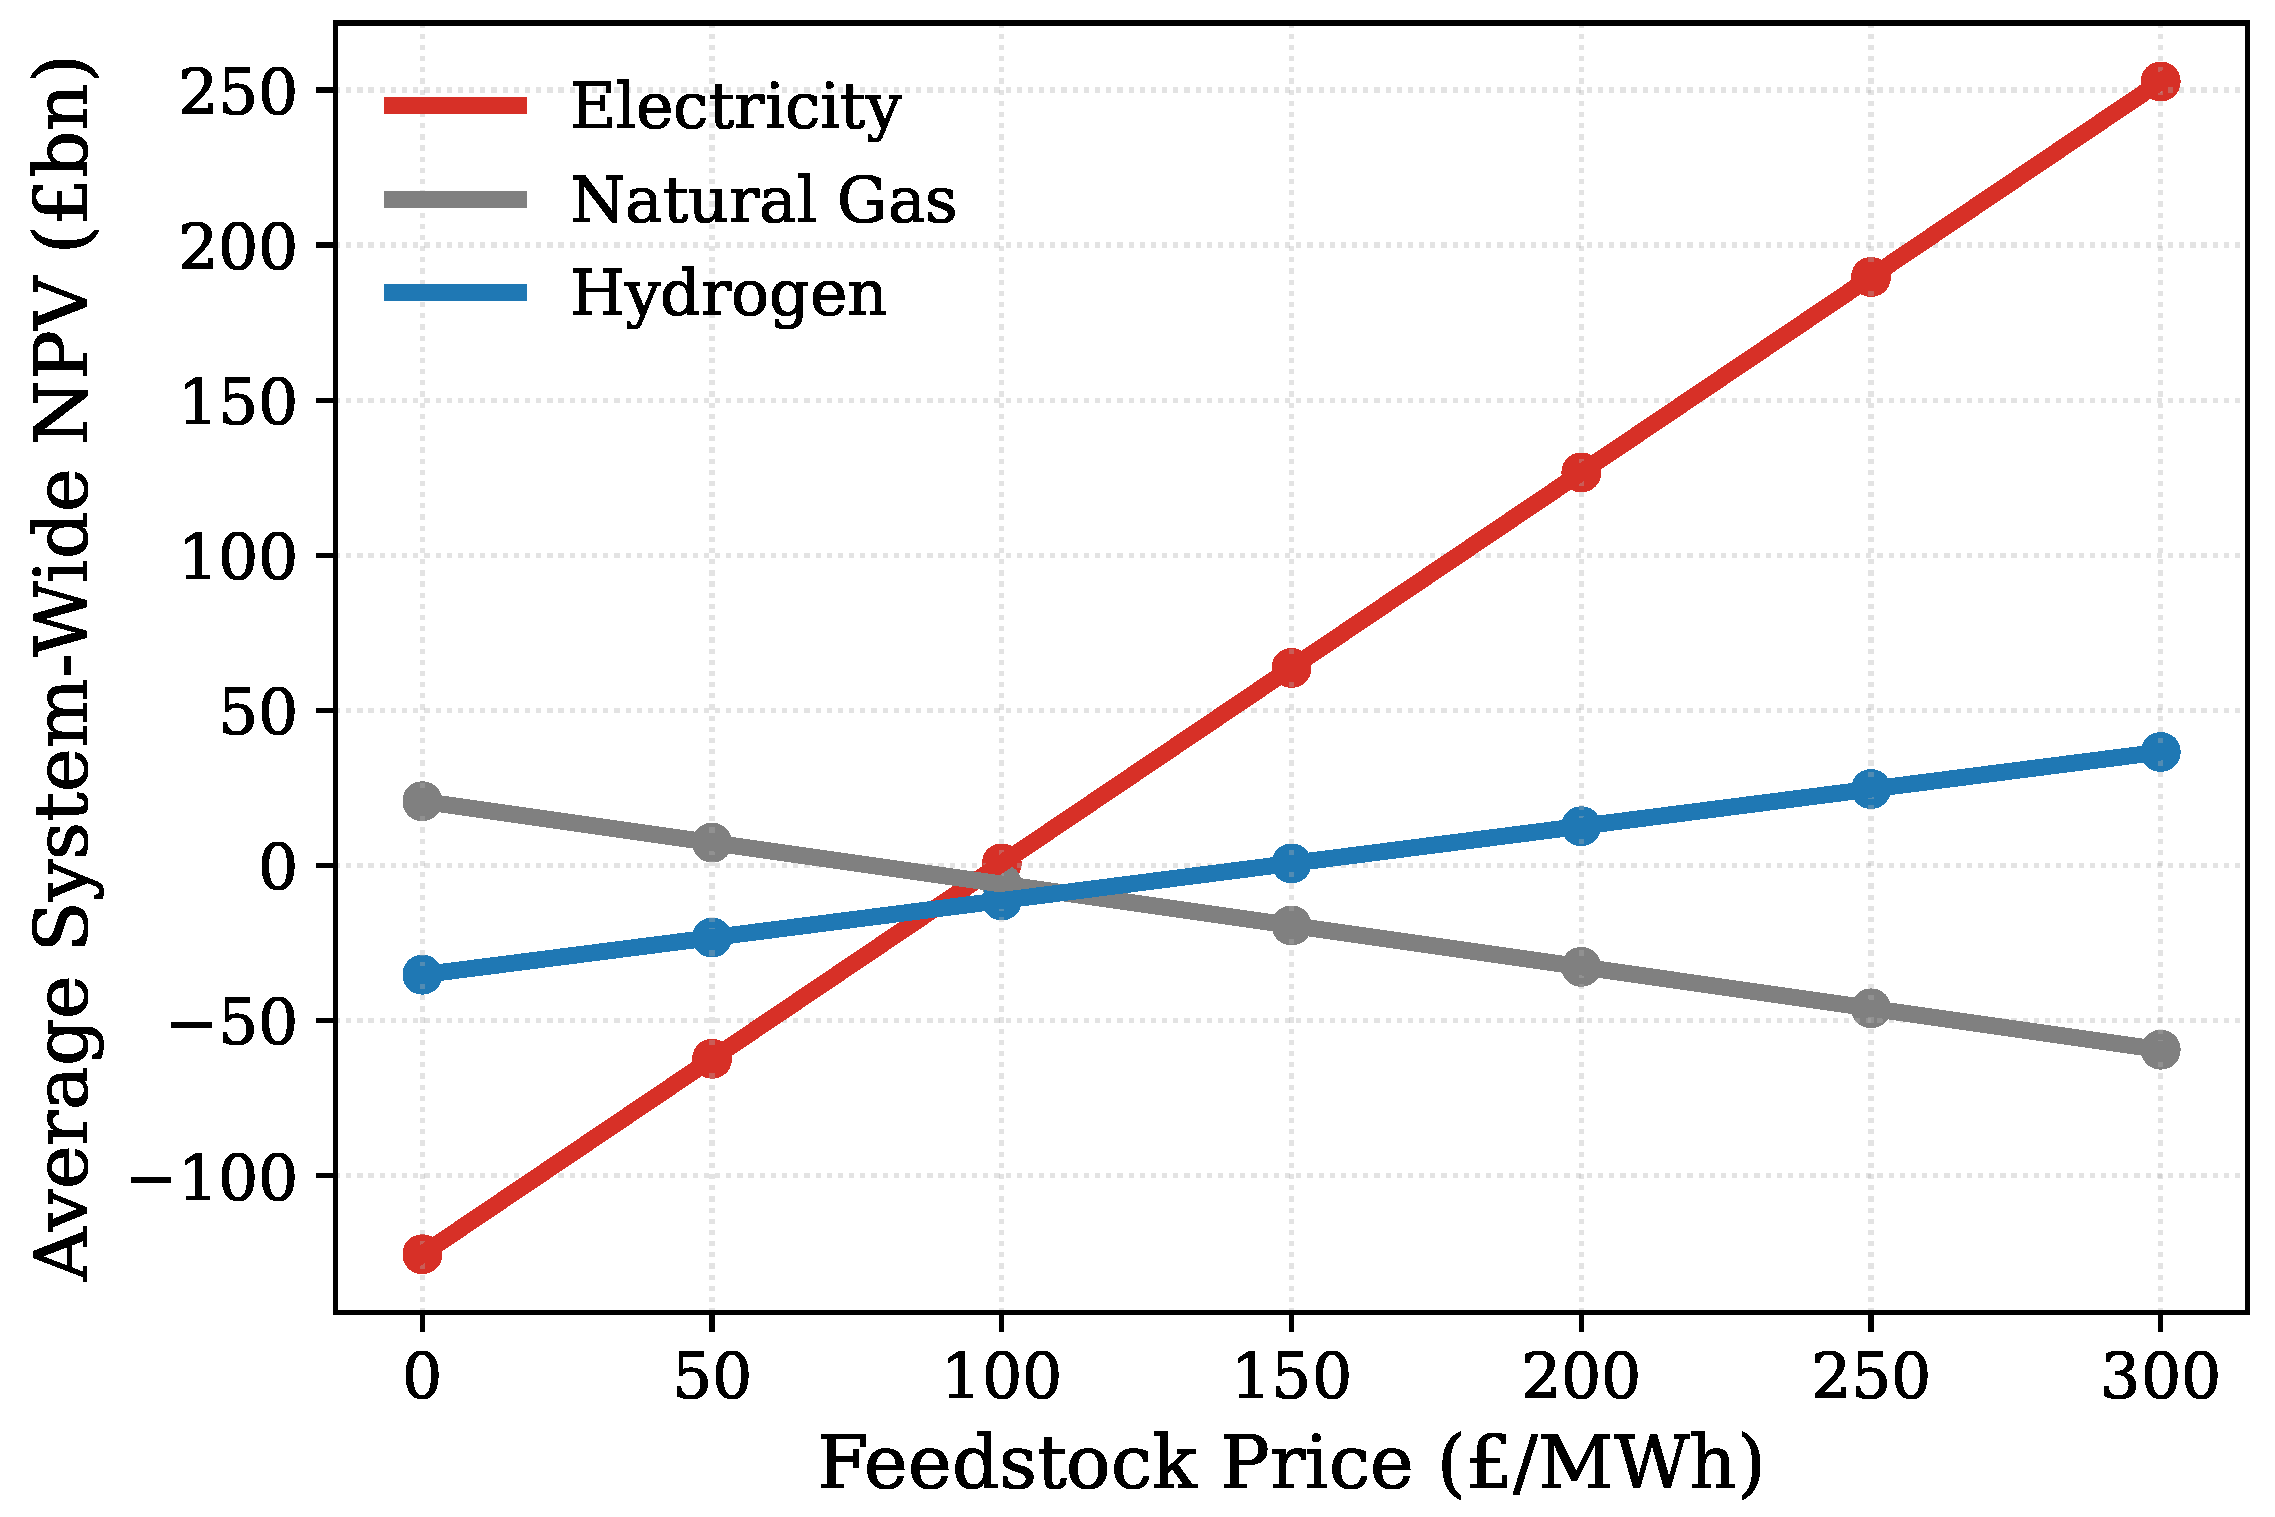
To define the feedstock price scenarios used in this study, we draw on a sensitivity analysis of investment profitability conducted in our previous GB energy system modelling work. In that analysis, the Net Present Value (NPV), defined in Equation (15), was evaluated across a wide range of electricity, hydrogen, and natural gas price assumptions.
Figure 5 illustrates the sensitivity of the system-level average NPV to variations in electricity, natural gas, and hydrogen prices.
Figure 5.
System-level average Net Present Value (NPV) sensitivity to electricity, natural gas, and hydrogen prices.
As shown in Figure 5, system profitability is highly sensitive to feedstock prices. The high-price case (electricity £100/MWh, natural gas £75/MWh, and hydrogen £150/MWh) is selected near the transition point where net present value (NPV) becomes positive, as defined in Equation (15), where NPV represents the discounted difference between system revenues and costs. Variations in feedstock prices directly influence both revenue streams and operational expenditures, and thus determine the point at which NPV becomes positive, indicating economic viability. The low-price case (Electricity £50/MWh, Natural Gas £37/MWh, Hydrogen £75/MWh) represents a less favourable market environment. These two representative price environments are used throughout the study to capture the impact of feedstock costs on system performance.
4. Results and Discussion
This section presents the simulation results for 2050 multi-vector energy system transition scenarios. The analysis focuses on evaluating alternative planning strategies, hydrogen deployment levels, and carbon management measures, with the aim of informing economically and environmentally sustainable transition pathways.
The subsequent subsections are organised as follows: (i) comparison of cooperative and centralised planning structures, with centralised planning serving as a benchmark for counterfactual assessment; (ii) assessment of individual technology contributions using Shapley values under cooperative planning; (iii) evaluation of carbon capture and storage (CCS) deployment to support deep decarbonisation; and (iv) sensitivity analysis of CO2 pricing to examine regulatory impacts on system operation and economics.
Unless stated otherwise, all results correspond to the profitable feedstock prices, representing the economically viable pathway identified as a high-price scenario in Section 3.3.
4.1. Impact of Planning Structure: Cooperative vs. Centralised Energy System Operation
This subsection explicitly compares cooperative and centralised planning to quantify the benefits of coordinated multi-vector investment and highlight the limitations of conventional centralised approaches.
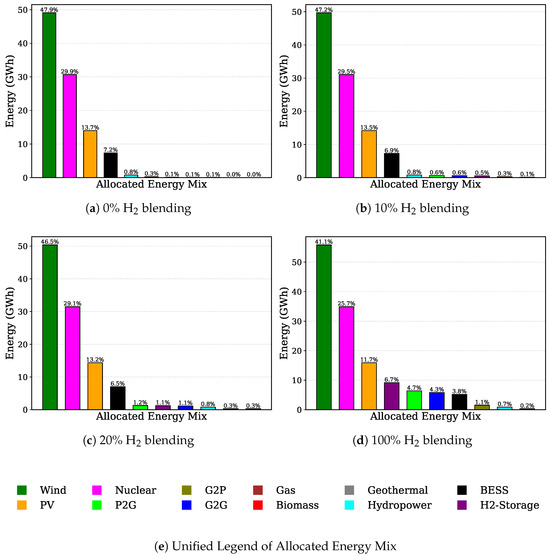
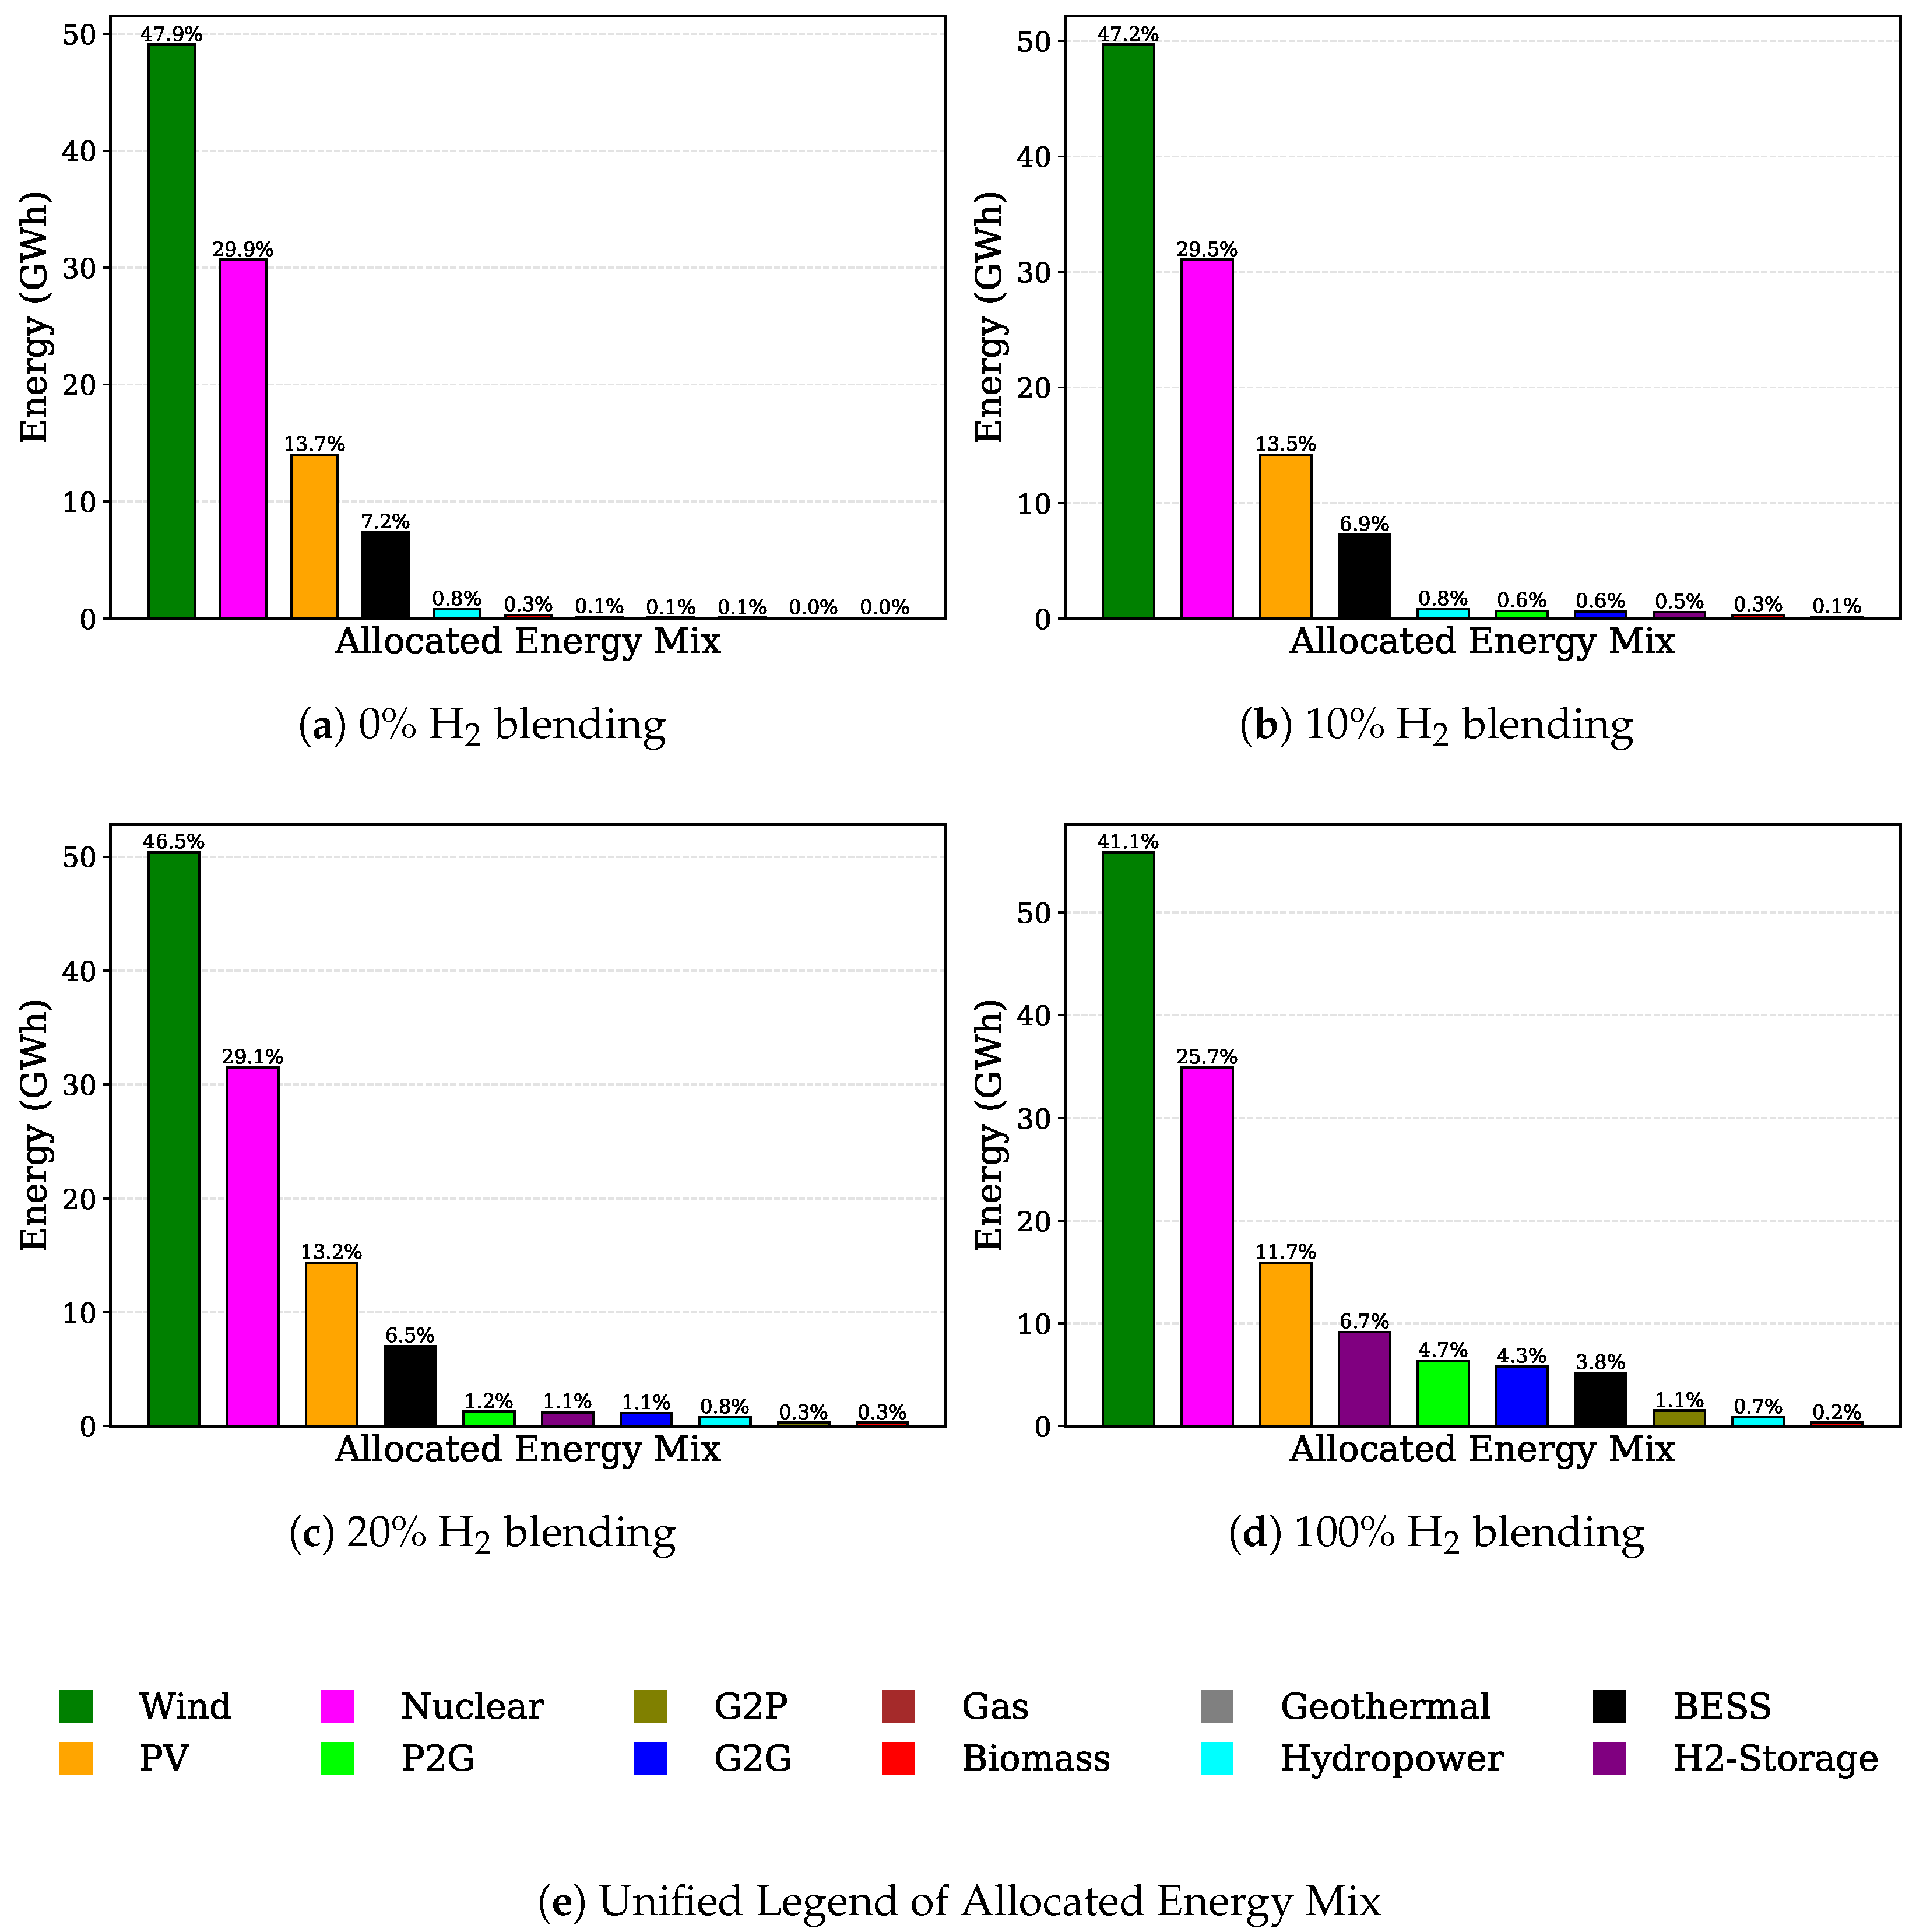
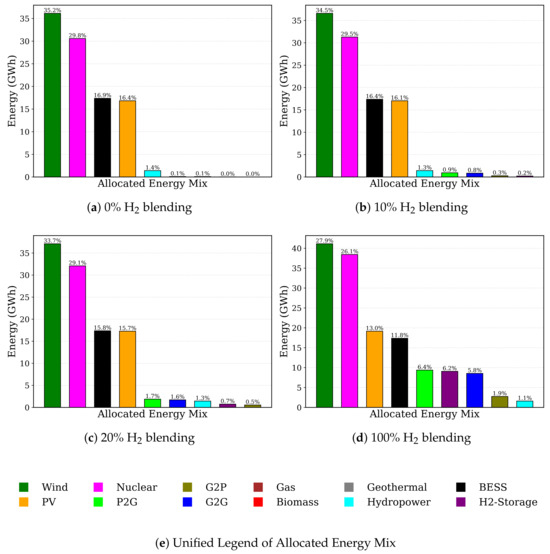
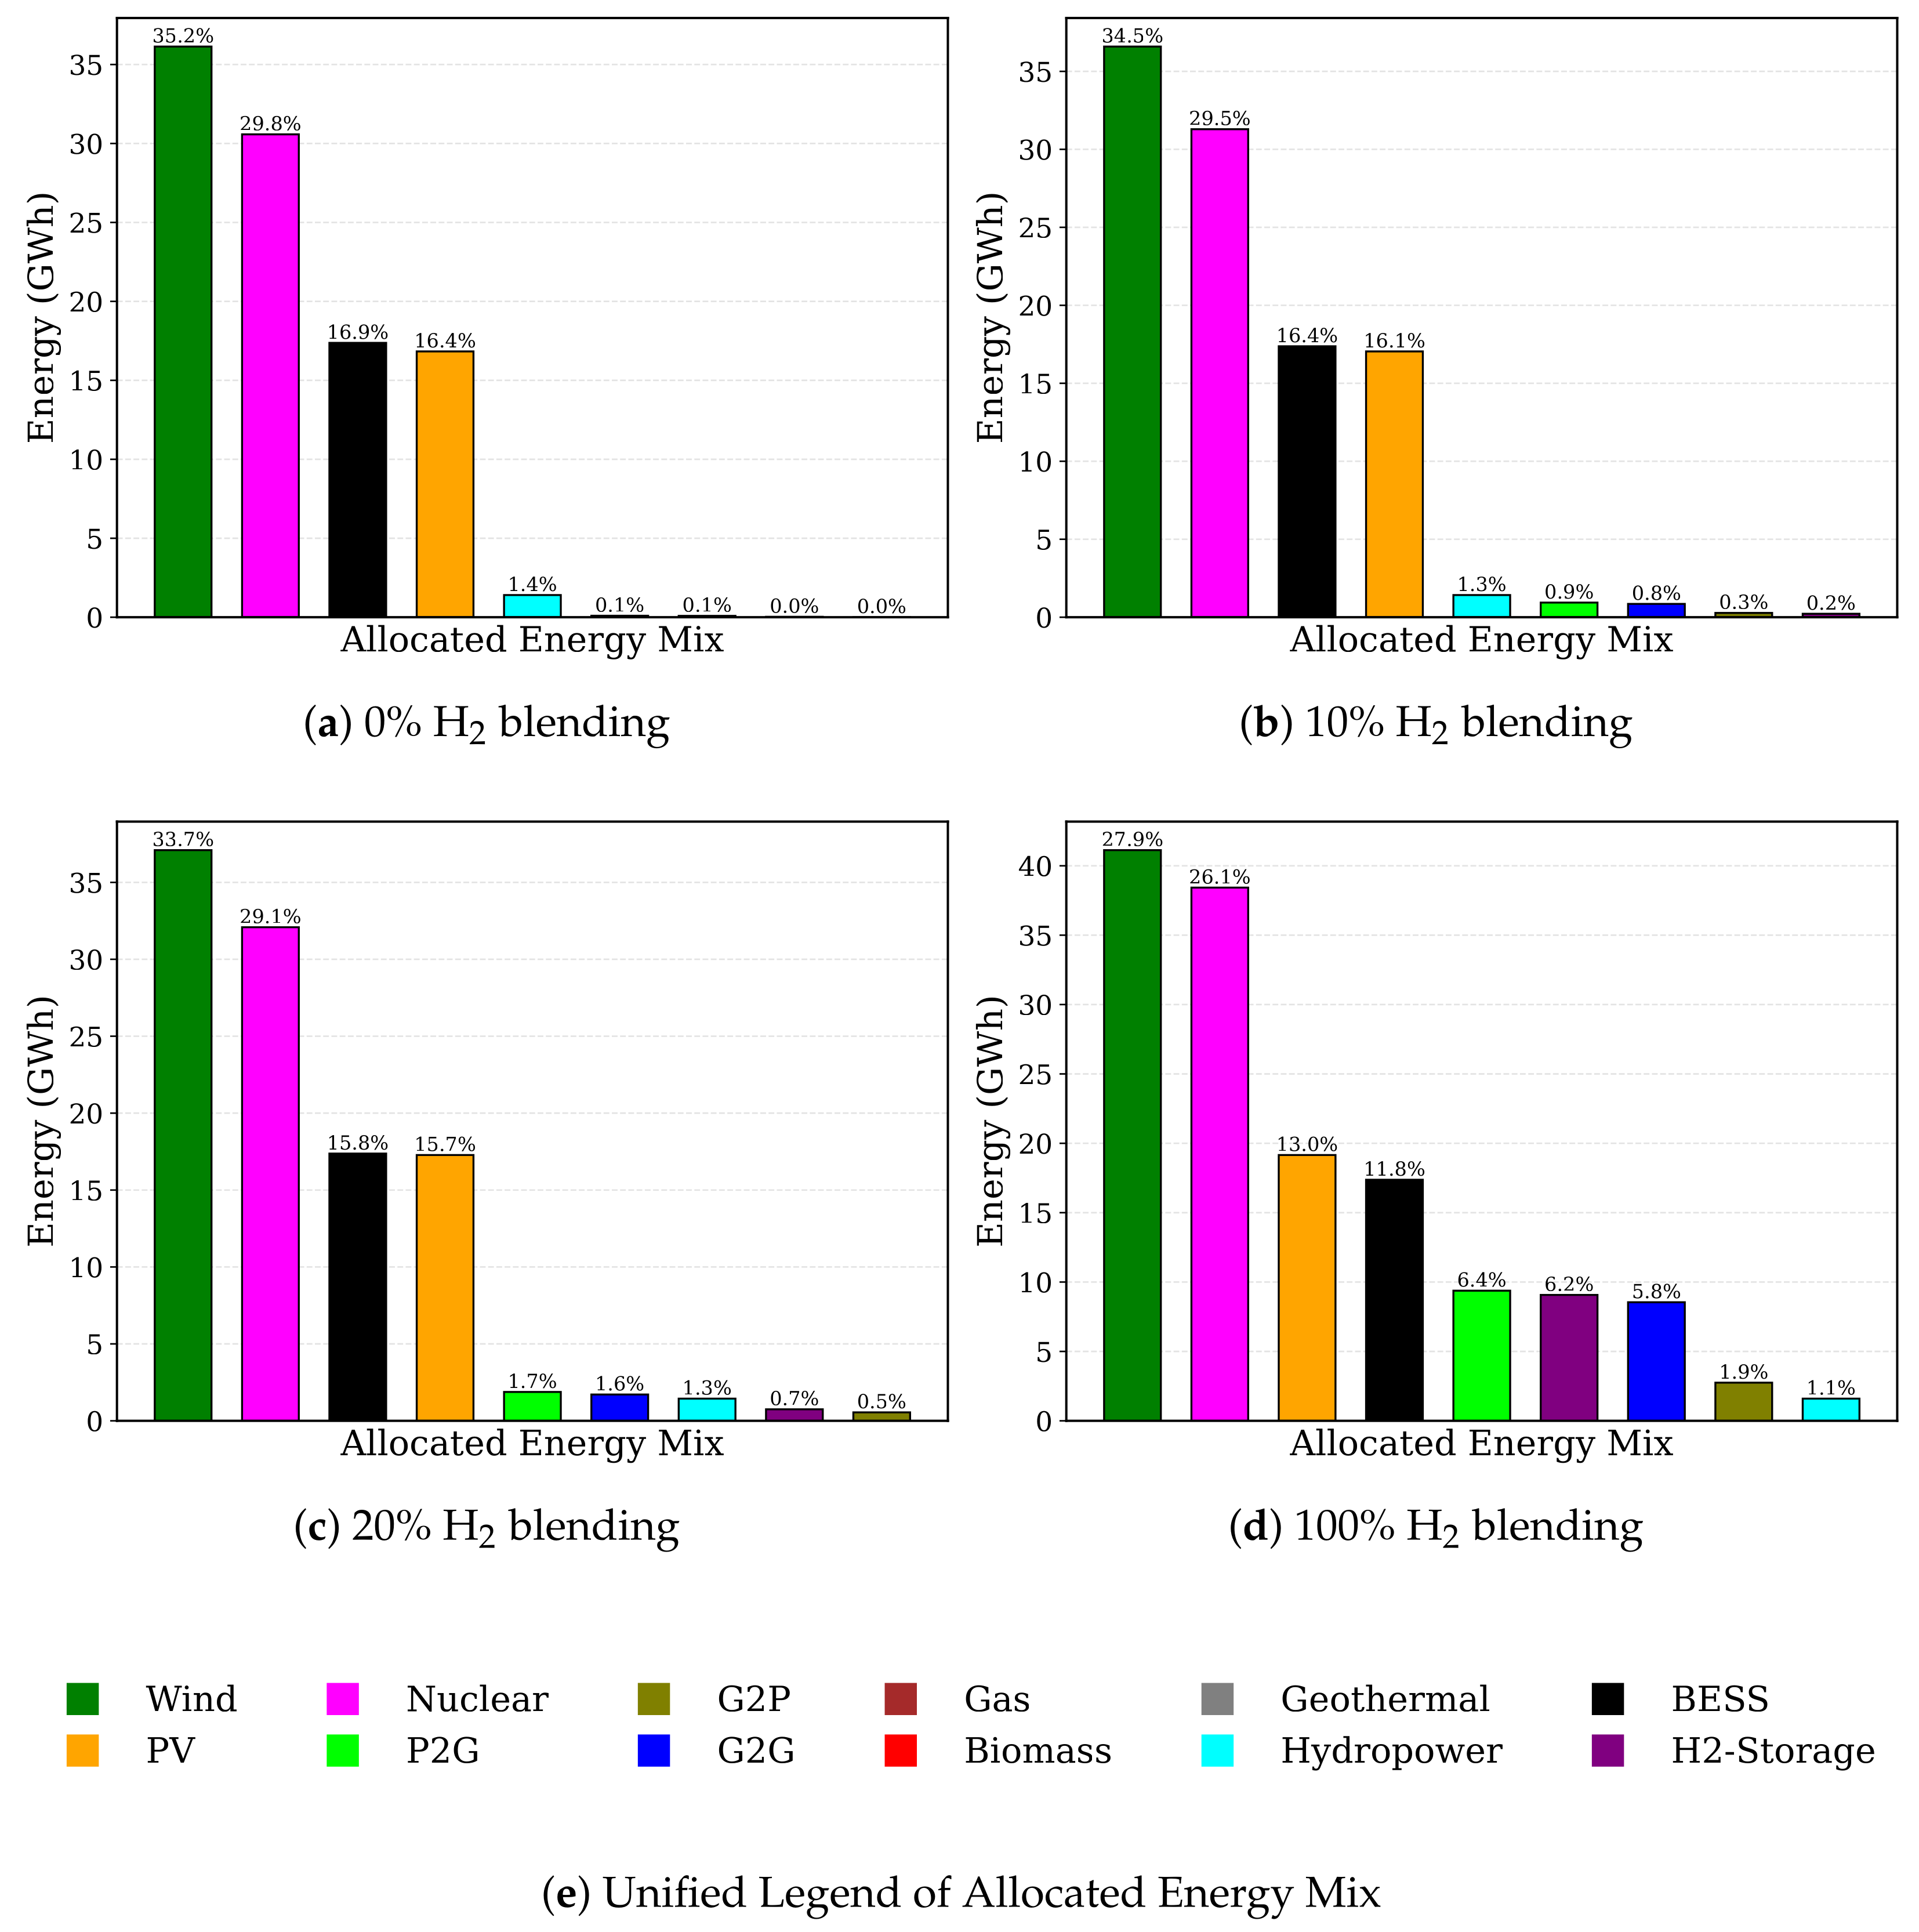
Figure 6 and Figure 7 illustrate the comparative dispatch structure of the integrated energy system under cooperative and centralised planning regimes.
Figure 6.
Cooperative Planning: Generation mix at 2050 peak demand under different hydrogen blending proportions without CCS deployment.
Figure 7.
Central Planning: Generation mix at 2050 peak demand under different hydrogen blending proportions without CCS deployment.
Under cooperative planning (Figure 6), renewable and nuclear generation consistently maintain dominant contributions to total electricity supply across hydrogen blending levels. Wind generation provides the largest share of electricity supply, accounting for approximately 48% of total generation at the baseline and remaining the dominant resource even under full hydrogen conversion. Nuclear generation provides stable baseload support, contributing around 30% of total supply, while solar PV contributes approximately 12–14%, depending on the hydrogen blending level.
System flexibility within the cooperative configuration is primarily supported through coordinated utilisation of hydrogen conversion pathways, hydrogen storage operation, and battery energy storage systems (BESS). As hydrogen blending increases, the utilisation of power-to-gas (P2G), gas-to-gas (G2G), and hydrogen storage technologies expands significantly, reflecting the growing electricity demand associated with electrolysis-based hydrogen production and the need for flexible energy vector coupling.
In contrast, the centralised planning configuration (Figure 7) exhibits a different generation structure characterised by a more balanced contribution from nuclear, solar PV, and battery storage resources. Wind generation remains an important contributor but represents a smaller proportion of total supply compared with the cooperative configuration. Solar PV deployment is relatively higher, while battery energy storage plays a significantly larger role in providing system flexibility across all hydrogen blending scenarios.
Hydrogen-related conversion technologies also increase with higher hydrogen blending levels under centralised planning. In particular, P2G, G2G, and hydrogen storage operations expand substantially as hydrogen penetration increases, reflecting the additional electricity demand required for hydrogen production and reconversion within the integrated energy system.
At full hydrogen conversion (100% blending), system operation becomes characterised by significantly higher electricity demand associated with electrolysis-based hydrogen production. The resulting increase in generation dispatch reflects the inherent thermodynamic efficiency limitations of hydrogen conversion processes rather than simple fuel substitution effects. Both planning structures therefore exhibit expanded utilisation of hydrogen conversion infrastructure at high blending levels.
Overall, the dispatch patterns indicate that coordinated multi-vector planning promotes a generation structure with stronger reliance on wind resources and integrated hydrogen flexibility mechanisms. By contrast, centralised planning relies more heavily on battery storage and maintains a more balanced distribution across nuclear, solar PV, and wind generation resources to meet system demand.
The performance metrics reported in Table 3 and Table 4 further quantify the structural advantages of cooperative planning coordination. Net Present Value (NPV) results are reported for two feedstock price scenarios: a high-price case (HP) and a low-price case (LP), as defined in Section 3.3.
Table 3.
Cooperative Planning: System performance at 2050 peak demand under different hydrogen blending proportions without CCS deployment.
Table 4.
Central Planning: System performance at 2050 peak demand under different hydrogen blending proportions without CCS deployment.
A direct comparison of the results shows that cooperative optimisation consistently requires lower total system supply than the centralised approach across all hydrogen blending levels (e.g., 135.96 GWh vs. 147.43 GWh at 100% blending). This reduction reflects improved system-wide efficiency arising from coordinated decision-making among stakeholders, which reduces redundant generation and enhances resource utilisation.
Under cooperative planning, the integrated energy system maintains positive net present value under the high-price scenario (NPV(HP)) across all hydrogen penetration levels, indicating that multi-vector infrastructure collaboration enhances transition pathway sustainability. By contrast, centralised planning produces negative economic returns at low hydrogen blending levels under the same price conditions, although profitability improves significantly as hydrogen penetration approaches full conversion.
Under the low-price scenario (NPV(LP)), both planning structures exhibit negative economic outcomes across all blending levels, reflecting the reduced market value of energy carriers under unfavourable market conditions. Nevertheless, cooperative planning generally produces less negative NPV outcomes than centralised planning, indicating improved economic resilience through coordinated utilisation of electricity and hydrogen infrastructures even when feedstock prices remain low. These results indicate that negative NPV outcomes under low-price scenarios reflect adverse market conditions rather than system infeasibility. They also highlight the importance of targeted policy support mechanisms, as further informed by the Shapley-based analysis in Section 4.2, where technologies with negative contributions are identified as candidates for financial support.
Emission outcomes are also influenced by the planning structure; while centralised planning achieves slightly lower emissions in the baseline case without hydrogen blending, cooperative planning delivers significantly lower emissions as hydrogen penetration increases. For example, at 100% hydrogen blending, cooperative planning reduces system-wide emissions from 2735 t under centralised planning to 1892 t, while maintaining comparable operational costs. This improvement reflects the ability of coordinated optimisation to internalise cross-vector energy interactions and improve the dispatch efficiency of low-carbon generation and hydrogen conversion technologies.
From a system operational perspective, increasing hydrogen blending levels raises overall system demand and supply requirements due to the additional electricity needed for electrolysis-based hydrogen production. In both planning structures, higher hydrogen penetration leads to greater utilisation of power-to-gas (P2G) and gas-to-power (G2G) conversion pathways. Notably, centralised planning requires a higher total electricity supply than cooperative planning (147 GWh versus 136 GWh at 100% H2 blending), indicating lower system efficiency. Nevertheless, the coordinated utilisation of renewable generation, hydrogen conversion technologies, and storage resources under cooperative planning mitigates operational inefficiencies and supports more stable system operation.
These findings collectively indicate that cooperative multi-vector planning provides a more resilient, environmentally efficient, and economically sustainable pathway for hydrogen-enabled energy system transition compared with centralised planning structures. This highlights the importance of explicitly modelling stakeholder coordination in integrated energy systems, which is not adequately captured in conventional centralised planning approaches.
4.2. Shapley-Based Assessment of Technology Contributions
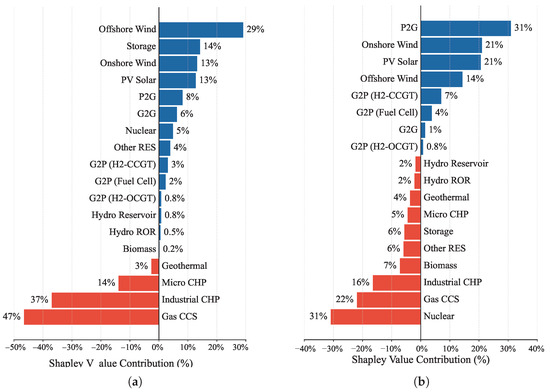
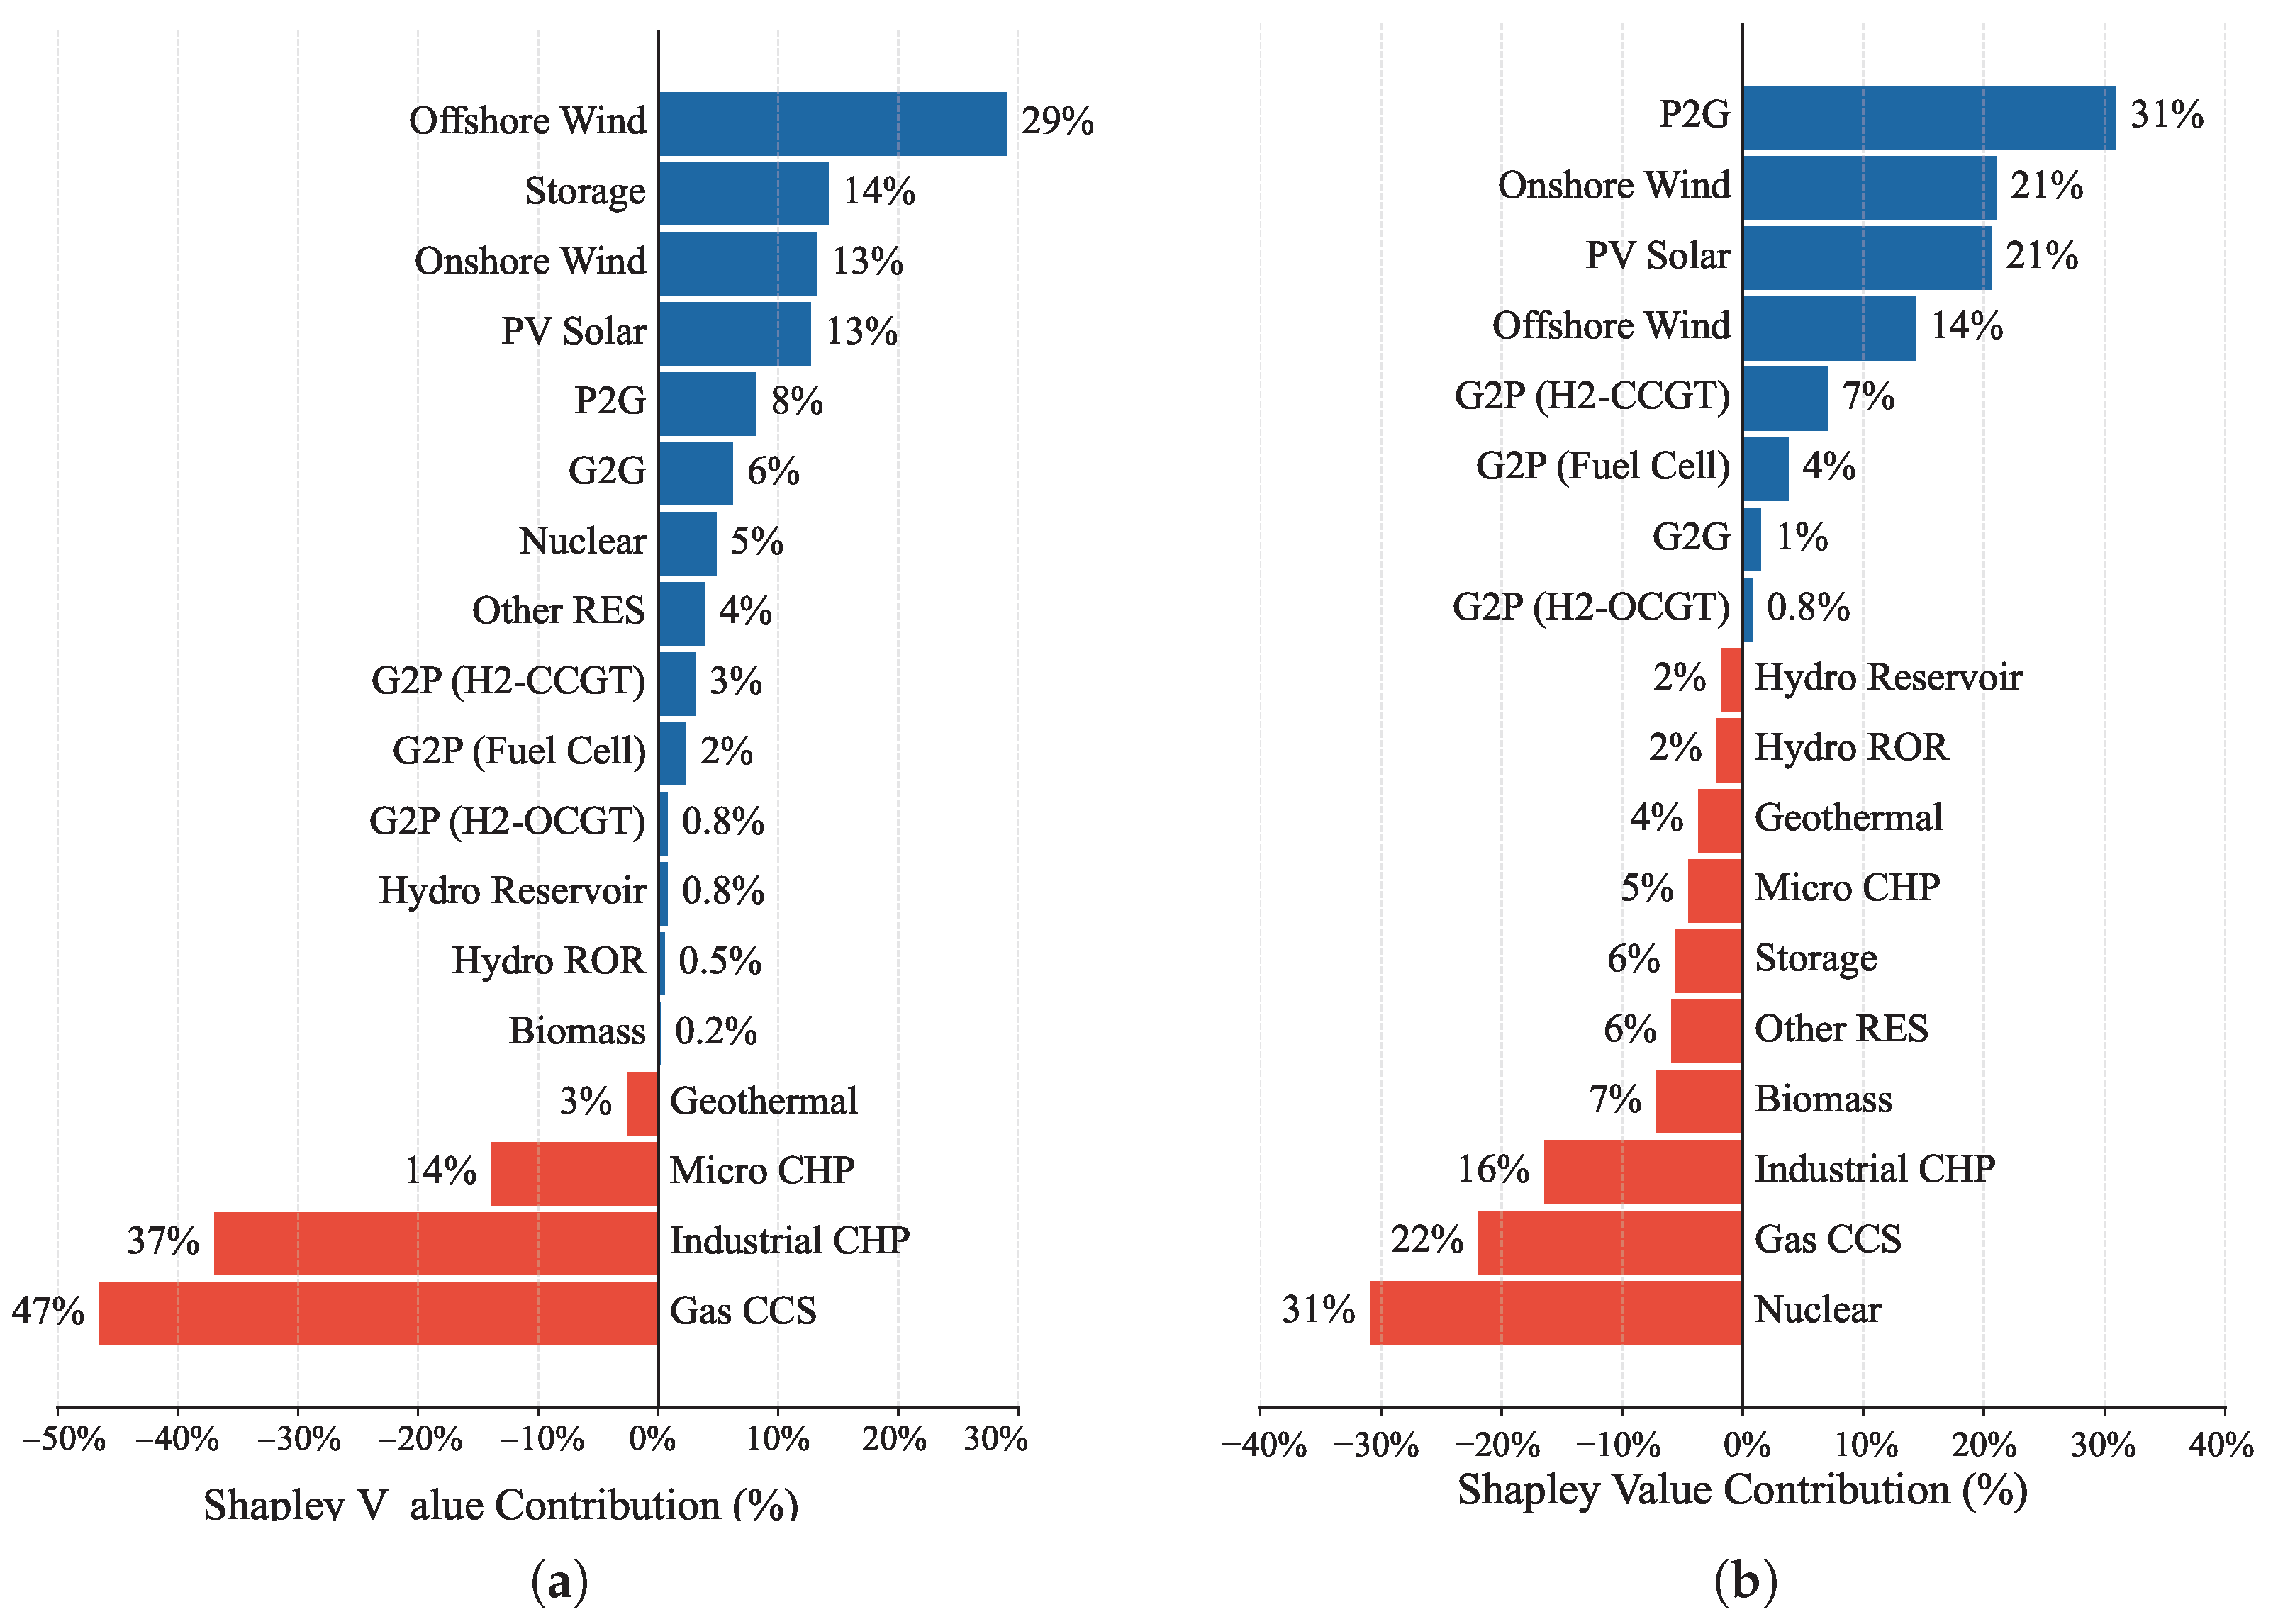
The key advantage of using a cooperative game-theoretic (CGT) approach is that Shapley values provide a quantitative measure of each technology’s contribution to the overall cooperative energy system. Figure 8 presents these Shapley value contributions of electricity and hydrogen-related technologies under both high and low energy price conditions.
Figure 8.
Shapley value contributions of electricity and hydrogen-related technologies. Positive contributions (blue) enhance the cooperative system value; negative contributions (red) reduce it. Subfigure (a) corresponds to high energy prices (electricity £100/MWh, natural gas £75/MWh, and hydrogen £150/MWh), and subfigure (b) corresponds to low energy prices (electricity £50/MWh, natural gas £37/MWh, and hydrogen £75/MWh).
Positive contributions (in blue) indicate technologies that enhance the cooperative system value, while negative contributions (in red) reduce it. Under high energy prices (Figure 8a), renewables and electricity storage dominate the positive contributions, with hydrogen conversion and storage (P2G and G2G) also substantial. Conventional generation technologies, such as geothermal, micro CHP, and gas CCS, exhibit negative contributions.
At low energy prices (Figure 8b), the contribution of renewables, particularly onshore wind and PV, increases slightly. Hydrogen conversion technologies retain positive contributions, reflecting shifts in economic incentives under lower feedstock costs. Conversely, the negative impacts of gas CCS and nuclear decrease. These results highlight how energy prices shift the relative importance of technologies in a cooperative system and can guide targeted policy support and incentive schemes for decarbonisation. These Shapley values can be directly linked to policy design, where technologies with negative contributions may require targeted financial support, as further quantified in Table 5.
Table 5.
Shapley-based policy support under low energy prices for different H2 blending levels at the 2050 peak demand hour.
Table 5 summarises the Shapley-based policy support under low energy prices for different H2 blending levels. No support is required under high energy price conditions, as the system remains profitable.
As shown in Table 5, storage consistently receives the highest allocation at low energy prices due to its negative contribution to system profitability. Hydro technologies have smaller Shapley values and corresponding support allocations, reflecting their stable operational role in the system. With increasing H2 blending levels, energy allocations for storage increase substantially, particularly at full hydrogen conversion, while hydro allocations rise modestly but are distributed according to their negative Shapley contributions.
4.3. Impact of Carbon Capture Infrastructure Under Cooperative Planning
This section presents the results for 2050 under representative hydrogen blending proportions of 20% and 100% in the gas network. The two blending levels are selected to represent transitional and deep hydrogen deployment regimes, allowing assessment of system behaviour under moderate and extreme electrification pressures.
The CCS-related results are based on the modelling and parameter assumptions defined in Section 2.6 and the Case Study section, where the CCS capture efficiency, energy penalty, and cost of £30/tCO2 are specified.
The analysis focuses on cooperative planning, which is considered a more efficient coordination mechanism for multi-vector energy system transition.
Two infrastructure configurations are compared: (i) Without Carbon Capture and Storage (CCS) deployment and (ii) with CCS deployment.
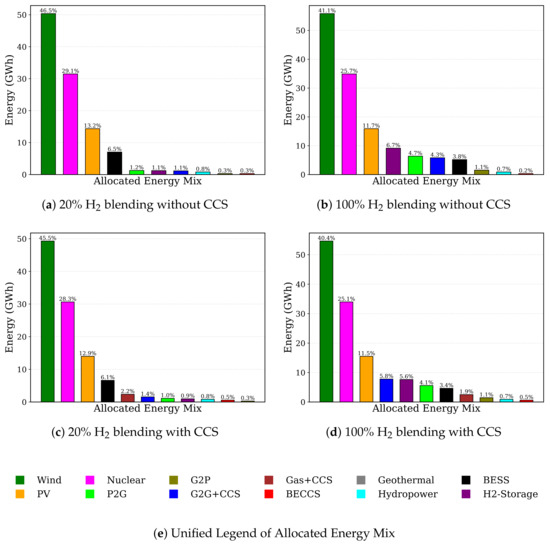
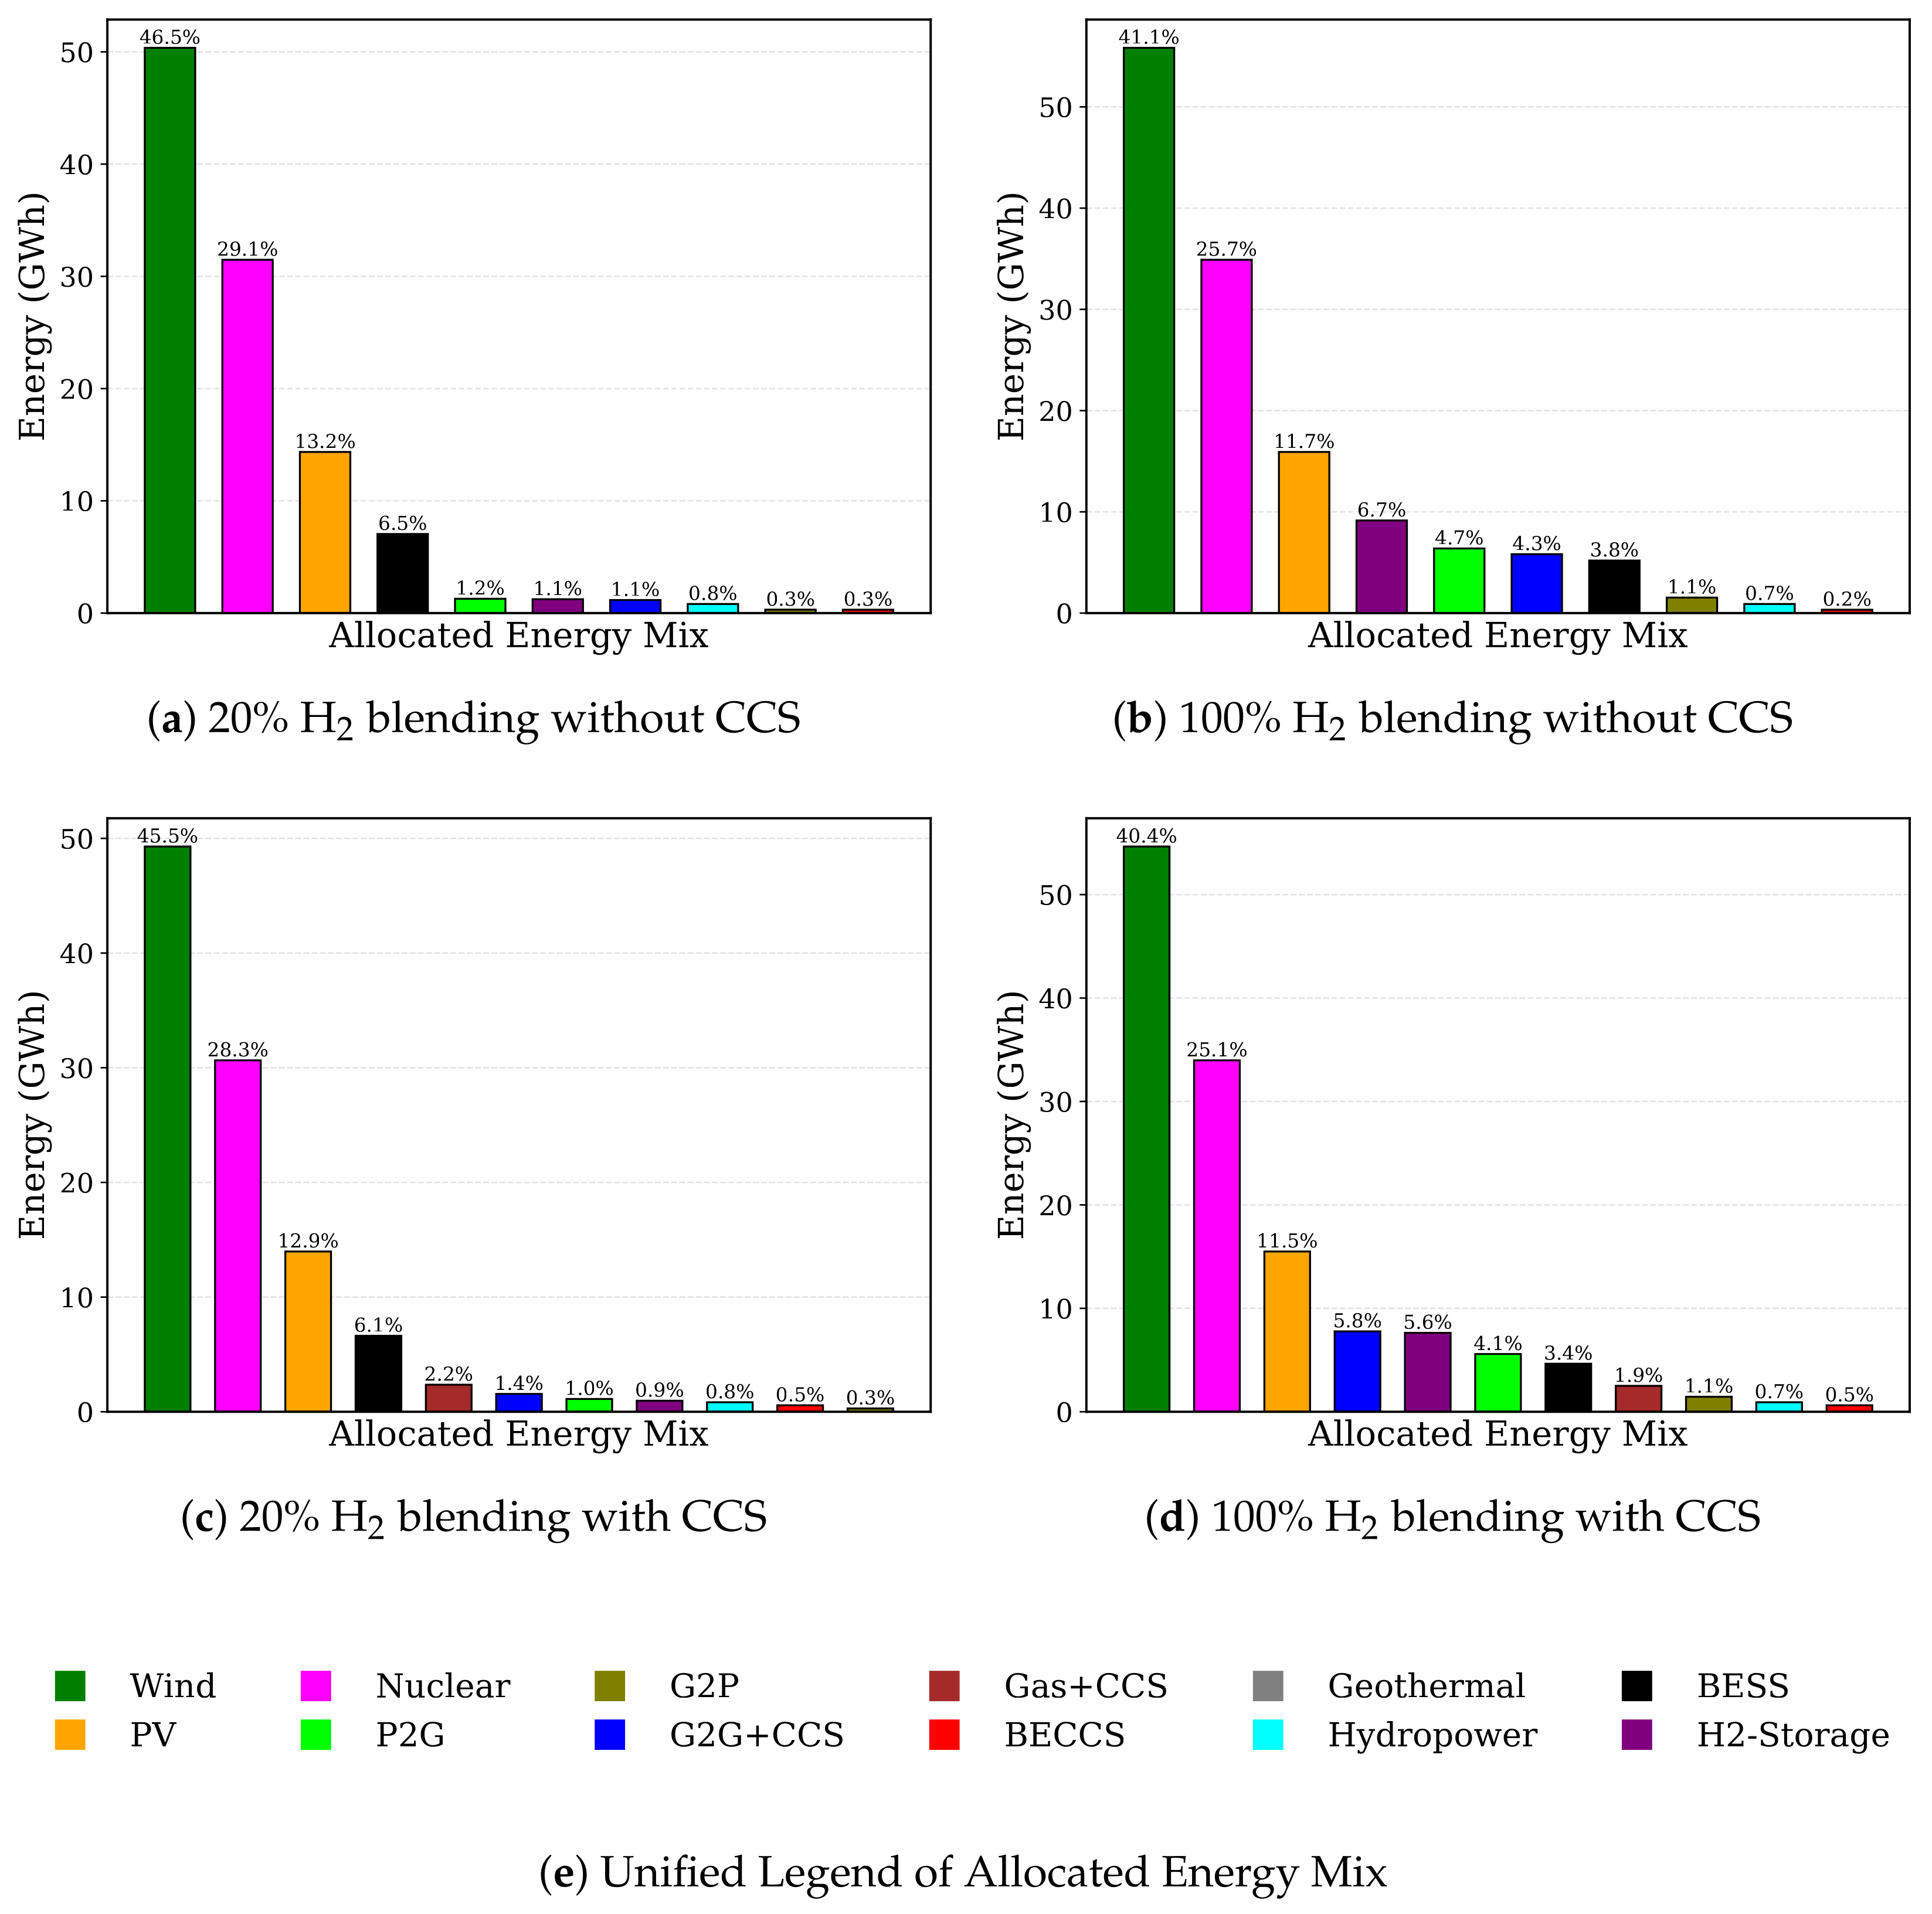
The upper row of Figure 9 presents generation dispatch without CCS, while the lower row shows the corresponding results with CCS integration.
Figure 9.
Cooperative Planning: Comparison of generation mix at 2050 peak demand under 20% and 100% hydrogen blending proportions with and without CCS deployment.
The comparison results summarised in Table 6 highlight the interaction between hydrogen penetration level, carbon management infrastructure, and cooperative planning coordination.
Table 6.
Cooperative Planning: Comparison of system performance at 2050 peak demand for hydrogen blending proportions of 20% and 100%, with and without CCS deployment.
Hydrogen blending at 20% represents a transitional operational regime where the integrated energy system maintains stable dispatch characteristics while supporting moderate decarbonisation. In this regime, system performance remains relatively efficient, with controlled operational cost growth and improved long-term value creation.
Under deep hydrogen conversion (100% blending), the system exhibits structural expansion in electricity supply requirements due to the energy intensity of electrolysis-based hydrogen production and conversion losses. This behaviour reflects fundamental thermodynamic constraints rather than simple fuel substitution effects.
Carbon capture deployment plays a critical role in enabling low-carbon system operation under high hydrogen penetration. CCS integration eliminates direct operational emissions and allows the system to sustain high NPV levels by supporting flexible low-carbon dispatch options.
Economically, cooperative planning consistently enhances system performance by internalising cross-vector coordination benefits. The unified coalition-based optimisation structure reduces operational friction, improves renewable utilisation, and supports long-term infrastructure value accumulation.
Overall, the results demonstrate that cooperative multi-vector planning combined with carbon management infrastructure is a key enabler for economically viable hydrogen-based energy system transition pathways in Great Britain.
4.4. Sensitivity Analysis of CO2 Pricing
To evaluate the influence of carbon pricing on system behaviour, a sensitivity analysis was conducted for CO2 prices of £0/tCO2, £165/tCO2, and £300/tCO2 for selected hydrogen blending levels (20% and 100%). The resulting system performance indicators are summarised in Table 7.
Table 7.
Sensitivity of system performance to CO2 pricing under selected hydrogen blending levels at 2050 peak demand. MCH: Marginal cost of hydrogen.
As shown in Table 7, carbon pricing strongly influences both system emissions and economics. Without a carbon price (£0/tCO2), emissions are relatively high, reaching 3637 t at 100% hydrogen blending. Introducing a moderate carbon price (£165/tCO2) substantially lowers emissions to 1892 tonnes at full hydrogen conversion, while a high carbon price (£300/tCO2) further reduces emissions to 1021 tonnes.
Operational costs remain broadly similar across CO2 price levels, whereas NPV decreases with increasing carbon price due to compliance costs, e.g., from £78.36 billion at £0/tCO2 to £57.70 billion at £300/tCO2 under full hydrogen blending.
Hydrogen marginal cost (MCH) also rises with carbon pricing, from £125/MWh at zero price to £180.15/MWh at £300/tCO2, reflecting the increased cost of carbon-intensive inputs in hydrogen production.
The sensitivity analysis indicates that stronger carbon pricing substantially reduces emissions, with moderate impacts on system profitability and hydrogen costs, emphasising the importance of carbon pricing as a policy tool for low-carbon hydrogen deployment in the future GB energy system.
While high carbon prices effectively drive the transition towards hydrogen and CCS, they carry significant socioeconomic implications. Strategically, such pricing levels may increase the financial burden on end-users, potentially exacerbating energy poverty unless offset by revenue-recycling mechanisms. Moreover, excessively high domestic carbon costs without international coordination could lead to carbon leakage, as energy-intensive industries relocate to jurisdictions with less stringent environmental regulations.
4.5. Sensitivity Analysis of Energy Prices
To further evaluate the robustness of the proposed framework under varying market conditions, an additional energy price sensitivity analysis is conducted. In addition to the previously defined low- and high-price scenarios, an extra-high price scenario is introduced (electricity £200/mwh, natural gas £150/mwh, and hydrogen £300/MWh). Table 8 summarises the system performance under low-, high-, and extra-high price scenarios across different hydrogen blending levels.
Table 8.
Sensitivity of cooperative planning system performance to energy price scenarios under different hydrogen blending levels at 2050 peak demand.
The results indicate that system profitability is highly sensitive to energy price levels. Under the extra-high price scenario, NPV increases substantially across all hydrogen blending levels, reflecting strong revenue generation in high-price environments.
Higher energy prices also lead to increased operational costs and greater utilisation of hydrogen conversion pathways (P2G and G2G), indicating intensified sector coupling. In addition, total system supply increases at high hydrogen blending levels, reflecting the higher energy demand associated with electrolysis.
While emissions remain relatively low at low hydrogen blending levels, they increase significantly at higher blending levels due to the expansion of system activity.
Overall, the analysis confirms that energy price assumptions play a critical role in determining the economic viability and operational behaviour of integrated energy systems, further highlighting the importance of robust sensitivity analysis in long-term planning studies.
4.6. Sensitivity Analysis of Hydrogen Technology Efficiencies
To further strengthen the robustness of the analysis, a sensitivity study is conducted on key hydrogen conversion technologies, namely power-to-gas (P2G), gas-to-gas reforming (G2G), and gas-to-power (G2P). The baseline efficiencies are assumed to be 0.60 for P2G, 0.75 for G2G, and 0.60 for G2P. Storage losses are not explicitly separated but are included within these aggregate efficiency assumptions and are therefore indirectly represented in the sensitivity analysis. Two additional scenarios are evaluated: a 20% increase in efficiency, resulting in values of 0.72 for P2G, 0.90 for G2G, and 0.72 for G2P; and a 20% decrease in efficiency, resulting in values of 0.48 for P2G, 0.60 for G2G, and 0.48 for G2P.
Table 9 summarises the system performance under these scenarios across different hydrogen blending levels.
Table 9.
Sensitivity of system performance to hydrogen technology efficiencies under cooperative planning at 2050 peak demand.
The results indicate that system-level conclusions remain robust under efficiency variations. Changes in hydrogen technology efficiencies have a negligible impact on total system supply, while emissions and operational costs exhibit moderate sensitivity. In particular, improved efficiencies reduce both CO2 emissions and operational costs across all hydrogen blending levels, reflecting lower energy losses in conversion processes.
Economic performance is more sensitive to efficiency assumptions. Higher efficiencies reduce hydrogen marginal costs and improve system utilisation but may lead to lower NPV under certain scenarios due to reduced overall energy throughput and associated revenues. Conversely, lower efficiencies increase system costs and emissions, but can result in higher NPV values due to increased energy flows within the system.
Hydrogen conversion activity (P2G and G2G) remains broadly consistent across scenarios, with slight increases under improved efficiencies, indicating enhanced utilisation of hydrogen pathways.
The sensitivity analysis confirms that while efficiency assumptions influence economic and environmental outcomes, the main structural findings of the study, particularly the benefits of cooperative planning and the role of hydrogen in providing system flexibility, remain unchanged.
4.7. Computational Performance and Scalability
To demonstrate computational tractability, we evaluate the computational performance of the proposed framework under full hydrogen blending levels. Table 10 reports the solution times for the cooperative planning approach, its Monte Carlo-based approximation, and the centralised benchmark, using the same simulation snapshot.
Table 10.
Computational time (seconds) required for each planning approach and hydrogen blending level.
The simulations were performed on a workstation equipped with an AMD Ryzen AI 7 350 processor with Radeon 860M, featuring 8 cores (16 threads) operating at 2.0 GHz, and 24 GB of RAM.
The results indicate that the cooperative framework remains computationally tractable for the considered system size. In addition, the use of Monte Carlo approximation significantly reduces the computational burden associated with Shapley value evaluation, while maintaining comparable solution times to the centralised benchmark.
It is important to note that the proposed framework is designed for strategic planning rather than real-time or online dispatch. Consequently, the reported computational performance is consistent with its intended application, where the emphasis is placed on evaluating coordination strategies and long-term economic and environmental outcomes rather than instantaneous operational optimisation. These results therefore confirm the scalability and suitability of the framework for large-scale energy system planning studies.
Furthermore, for larger systems with a higher number of players, approximation techniques such as Monte Carlo sampling can be employed to alleviate the computational complexity of Shapley value computation, further enhancing the scalability of the proposed approach.
4.8. Quantitative Validation of Pandapower Results
For completeness, representative numerical results of the AC power flow solution obtained using the Pandapower tool [29] are summarised in Table 11 and Table 12. Pandapower provides a detailed and reproducible framework for steady-state analysis of large-scale electricity networks, and the presented results serve to further validate the correctness of its implementation for the Great Britain system considered in this study.
Table 11.
Bus voltage results for the GB transmission network.
Table 12.
Transmission line flow and loading results.
The electricity network model used in this study consists of 17 buses, 33 transmission lines, 357 generators, 81 loads, and one external grid connection. It is implemented using an element-based modelling (EBM) approach, where all components are represented using their nameplate parameters. The simulation snapshot corresponds to peak demand conditions under the 2050 scenario, representing a high-stress operating point used to evaluate the steady-state performance of the system.
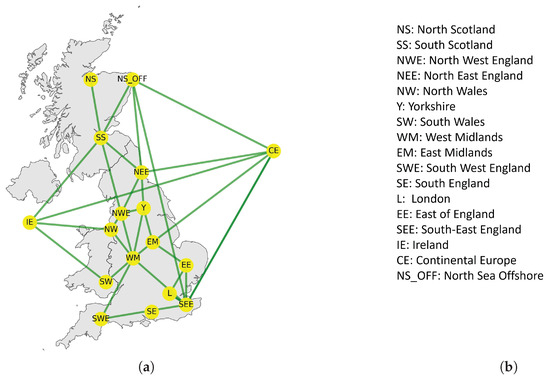
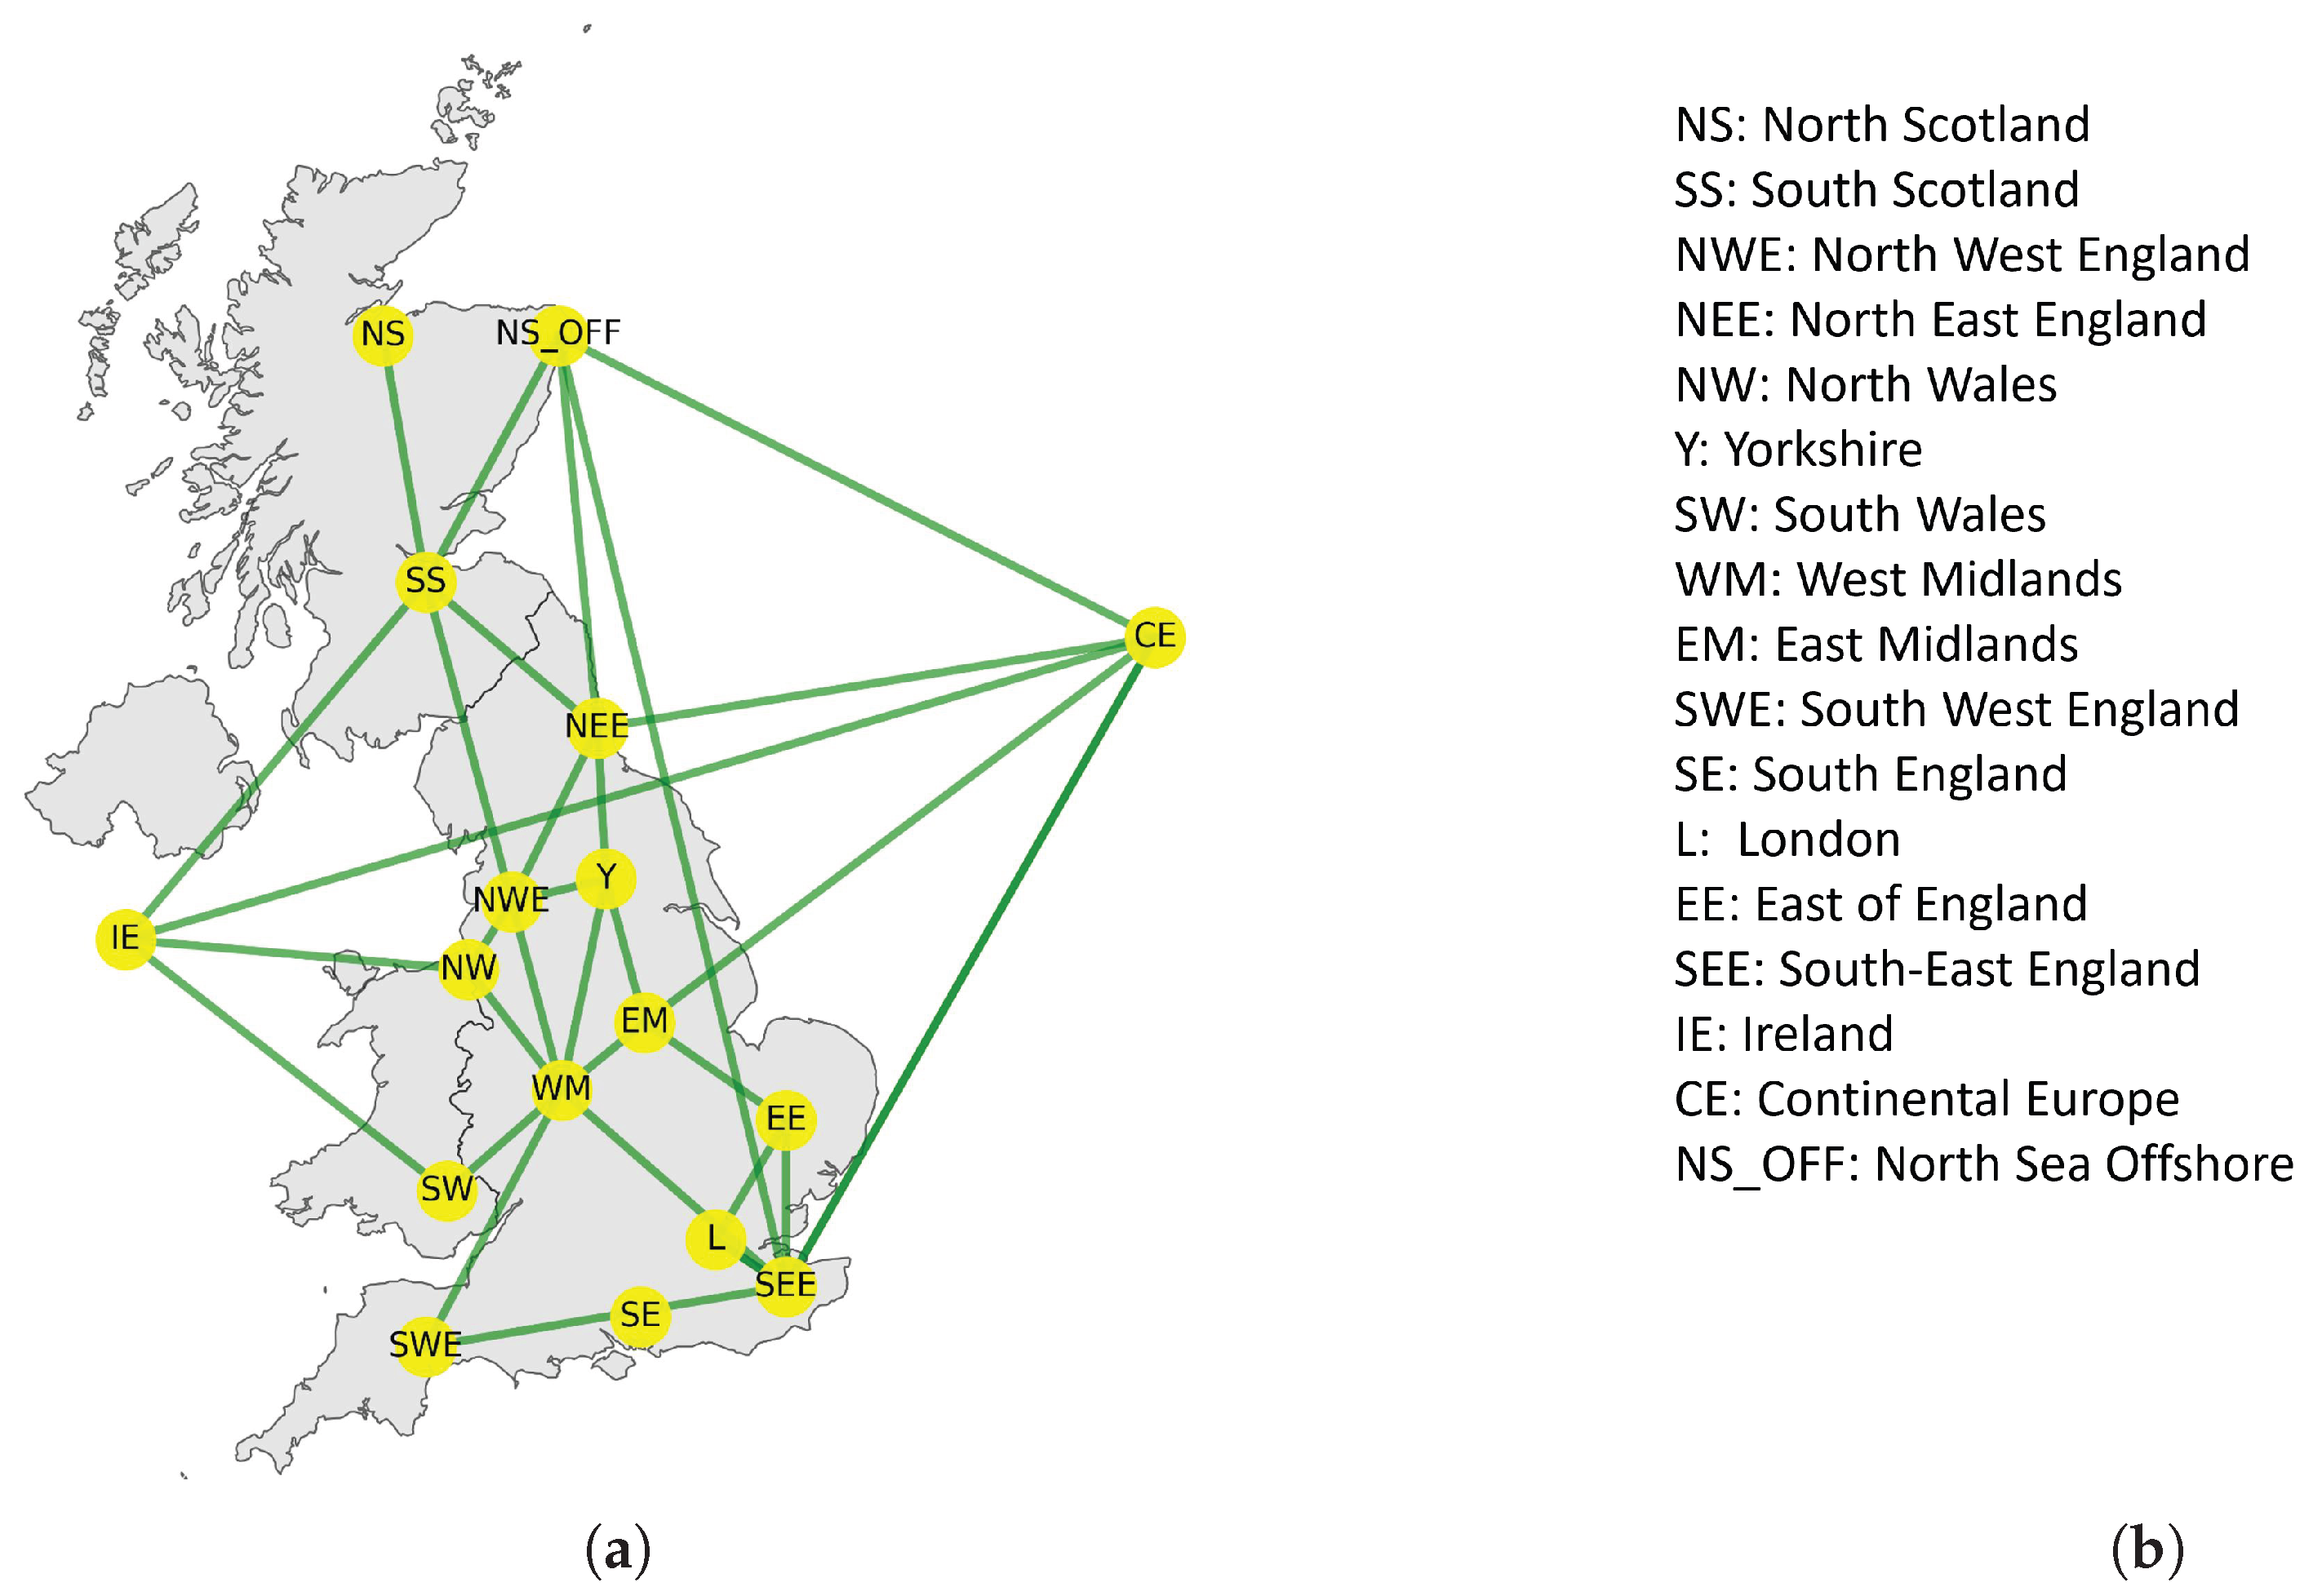
Figure 10 illustrates the Great Britain electricity network model used in the Pandapower simulations, including the spatial representation of the 14 DNO regions and interconnected zones. The transmission network representation is consistent with the Great Britain high-voltage system, which predominantly operates at 275 kV and 400 kV levels, ensuring realistic modelling of inter-regional power transfers.
Figure 10.
(a) Great Britain electricity transmission network used in the Pandapower simulations, including 14 distribution network operator (DNO) regions and three interconnected external zones; (b) corresponding legend of network regions and interconnections.
The reported bus and line results demonstrate that the Pandapower implementation converges to a physically feasible operating point. In particular, the voltage profile remains tightly regulated around nominal values, and the line loading levels are consistent with secure transmission operation.
5. Conclusions
This study demonstrates that coordinated multi-vector planning is a critical enabler of efficient hydrogen integration within Great Britain’s net-zero transition pathway. The simulation results indicate that cooperative planning consistently outperforms centralised coordination in terms of operational efficiency, emission reduction at higher hydrogen penetration levels, and long-term economic value, highlighting the importance of cross-vector infrastructure coordination for future hydrogen-integrated energy systems.
Comparative analysis of cooperative and centralised planning shows that coordinated multi-vector investment improves system performance and exposes the limitations of conventional centralised approaches. At 100% hydrogen blending, cooperative planning reduces operational costs by up to 26% and total system CO2 emissions by approximately 31% relative to centralised planning, while also decreasing total electricity supply requirements by 8% and improving system-wide resource allocation.
Hydrogen blending supports system transition under both moderate and deep deployment regimes. However, moving towards full hydrogen conversion requires substantial expansion of electricity supply capacity, increasing peak system demand by approximately 30% in the 100% hydrogen scenario due to the energy requirements of electrolysis-based hydrogen production.
Environmental performance is strongly influenced by carbon management infrastructure. Without CCS deployment, emissions remain relatively high under deep hydrogen penetration, whereas CCS integration enables near-zero operational emissions across blending levels. Sensitivity analysis further shows that stronger carbon pricing significantly reduces system-wide emissions across hydrogen blending scenarios, although it increases hydrogen marginal costs and moderately reduces overall system profitability.
Economically, cooperative planning maintains positive Net Present Values across hydrogen penetration scenarios, while centralised planning exhibits negative economic returns during the early stages of hydrogen integration before becoming profitable under high hydrogen penetration. This highlights the importance of coordinated infrastructure planning for maintaining economically viable transition pathways.
Overall, the results indicate that cooperative multi-vector planning provides a more resilient, environmentally favourable, and economically sustainable pathway for hydrogen-enabled energy system transition compared with centralised planning structures. Hydrogen blending represents a viable transitional energy vector for decarbonisation, with near-term deployment focusing on moderate blending levels supported by CCS, while large-scale hydrogen conversion should be pursued alongside expanded low-carbon electricity generation and mature carbon transport and storage infrastructure.
Despite the insights provided, this study has several limitations. It adopts a steady-state representation of the integrated energy system with simplified network constraints, which do not fully capture temporal dynamics and detailed spatial effects. In addition, constant efficiency parameters are assumed, and a cooperative optimisation framework is employed, implicitly assuming coordinated behaviour among stakeholders, while a centralised optimisation case is used as a non-cooperative benchmark for comparison. Strategic interactions between agents are not explicitly modelled under uncertainty. Therefore, the results should be interpreted as indicative rather than exact predictions.
In addition, key techno-economic parameters such as electrolyser efficiency and hydrogen storage losses are treated as fixed values based on established literature sources (DESNZ and National Grid ESO projections for 2050), and while this ensures consistency with standard assumptions, variations in these parameters may influence system performance. Although the present study partially addresses robustness through extensive sensitivity analysis of energy prices, future work will extend the framework to include systematic sensitivity analysis of technical performance parameters to further strengthen the robustness of the conclusions.
Finally, although sensitivity analysis demonstrates that stronger carbon pricing effectively reduces system-wide emissions, achieving and sustaining high carbon prices would have important socioeconomic implications—including potential increases in energy costs for households and industries, risks to competitiveness in trade-exposed sectors, and requirements for revenue recycling or just transition support to ensure equity. A detailed assessment of these distributional and macroeconomic effects falls outside the scope of the present energy-system optimisation study and is recommended for future research.
Author Contributions
M.A.: Conceptualisation, Data curation, Formal analysis, Investigation, Methodology, Validation, Visualisation, Writing—original draft, Writing—review and editing. A.A.: Conceptualisation, Data curation, Formal analysis, Funding acquisition, Investigation, Methodology, Software, Supervision, Validation, Writing—review and editing. S.L.W.: Supervision and funding acquisition. All authors have read and agreed to the published version of the manuscript.
Funding
This work was supported in part by the EPSRC “Hydrogen Integration for Accelerated Energy Transitions Hub (HI-ACT)” project (EP/X038823/2).
Data Availability Statement
The dataset and model scripts supporting this study are openly available at: https://github.com/MohamedAbuella/GB_IES (accessed on 9 April 2026).
Conflicts of Interest
The authors declare that they have no known competing financial interests or personal relationships that could have appeared to influence the work reported in this paper.
References
- Isaac, T. HyDeploy: The UK’s first hydrogen blending deployment project. Clean Energy 2019, 3, 114–125. [Google Scholar] [CrossRef] [Scilit]
- Arup Limited. National Transmission System Hydrogen Blending; Stakeholder Engagement Report; Arup Limited: London, UK, 2025. [Google Scholar]
- Abuella, M.; Allahham, A.; Rufa’I, N.A.; Walker, S.L. Hydrogen-Based Decarbonisation Strategies for Residential Heating: An Energy Efficiency and Conservation Analysis in the North of Tyne Region. Energies 2025, 18, 6237. [Google Scholar] [CrossRef] [Scilit]
- Bouckaert, S.; Pales, A.F.; McGlade, C.; Remme, U.; Wanner, B.; Varro, L.; D’Ambrosio, D.; Spencer, T. Net Zero by 2050: A Roadmap for the Global Energy Sector; International Energy Agency: Paris, France, 2021. [Google Scholar]
- Climate Change Committee. The Sixth Carbon Budget: The UK’s Path to Net Zero; Climate Change Committee: London, UK, 2020. [Google Scholar]
- Royapoor, M.; Allahham, A.; Hosseini, S.H.R.; Rufa’I, N.A.; Walker, S.L. Towards 2050 net zero carbon infrastructure: A critical review of key decarbonization challenges in the domestic heating sector in the UK. Energy Sources Part B Econ. Plan. Policy 2023, 18, 2272264. [Google Scholar] [CrossRef] [Scilit]
- Staffell, I.; Scamman, D.; Abad, A.V.; Balcombe, P.; Dodds, P.E.; Ekins, P.; Shah, N.; Ward, K.R. The role of hydrogen and fuel cells in the global energy system. Energy Environ. Sci. 2019, 12, 463–491. [Google Scholar] [CrossRef] [Scilit]
- Berjawi, A.E.H.; Allahham, A.; Walker, S.L.; Patsios, C.; Hosseini, S.H.R. Whole energy systems evaluation: A methodological framework and case study. In Whole Energy Systems: Bridging the Gap via Vector-Coupling Technologies; Springer: Cham, Switzerland, 2022; pp. 41–82. [Google Scholar] [CrossRef] [Scilit]
- Palmer, J.; Terry, N.; Pope, P. How Much Energy Could Be Saved by Making Small Changes to Everyday Household Behaviours; A Report for Department of Energy and Climate Change; Department of Energy and Climate Change: London, UK, 2012. [Google Scholar]
- Love, J.; Smith, A.Z.; Watson, S.; Oikonomou, E.; Summerfield, A.; Gleeson, C.; Biddulph, P.; Chiu, L.F.; Wingfield, J.; Martin, C.; et al. The addition of heat pump electricity load profiles to GB electricity demand: Evidence from a heat pump field trial. Appl. Energy 2017, 204, 332–342. [Google Scholar] [CrossRef] [Scilit]
- Klatzer, T.; Bachhiesl, U.; Wogrin, S.; Tomasgard, A. Ramping up the hydrogen sector: An energy system modeling framework. Appl. Energy 2024, 355, 122264. [Google Scholar] [CrossRef] [Scilit]
- Erdener, B.C.; Sergi, B.; Guerra, O.J.; Chueca, A.L.; Pambour, K.; Brancucci, C.; Hodge, B.M. A review of technical and regulatory limits for hydrogen blending in natural gas pipelines. Int. J. Hydrogen Energy 2023, 48, 5595–5617. [Google Scholar] [CrossRef] [Scilit]
- Azimipoor, A.; Zhang, T.; Qadrdan, M.; Jenkins, N. Operational implications of transporting hydrogen via a high-pressure gas network. Energy Convers. Manag. X 2025, 26, 100937. [Google Scholar] [CrossRef] [Scilit]
- Huang, Y.; Sun, Q.; Chen, Z.; Gao, D.W.; Pedersen, T.B.; Larsen, K.G.; Li, Y. Dynamic modeling and analysis for electricity-gas systems with electric-driven compressors. IEEE Trans. Smart Grid 2025, 16, 2144–2155. [Google Scholar] [CrossRef] [Scilit]
- Dassios, I.; Syron, E. Dynamic Modeling and Analysis of Coupled Hydrogen-Gas-Electricity Networks. J. Comput. Appl. Math. 2026, 482, 117333. [Google Scholar] [CrossRef] [Scilit]
- Hosseini, S.H.R.; Allahham, A.; Taylor, P.C.; Sadeghian, O. Optimal planning and operation of multi-vector energy networks: A systematic review. Renew. Sustain. Energy Rev. 2019, 133, 110216. [Google Scholar] [CrossRef] [Scilit]
- Li, Y.; Zhang, F.; Li, Y.; Wang, Y. An improved two-stage robust optimization model for CCHP-P2G microgrid system considering multi-energy operation under wind power outputs uncertainties. Energy 2022, 223, 120048. [Google Scholar] [CrossRef] [Scilit]
- Fattahi, A.; Sijm, J.; Faaij, A. A systemic approach to analyze integrated energy system modeling tools: A review of national models. Renew. Sustain. Energy Rev. 2020, 133, 110195. [Google Scholar] [CrossRef] [Scilit]
- Zhang, T.; Qadrdan, M.; Wu, J.; Couraud, B.; Stringer, M.; Walker, S.; Hawkes, A.; Allahham, A.; Flynn, D.; Pudjianto, D.; et al. A systematic review of modelling methods for studying the integration of hydrogen into energy systems. Renew. Sustain. Energy Rev. 2025, 208, 114964. [Google Scholar] [CrossRef] [Scilit]
- Churkin, A.; Bialek, J.; Pozo, D.; Sauma, E.; Korgin, N. Review of cooperative game theory applications in power system expansion planning. Renew. Sustain. Energy Rev. 2021, 145, 111056. [Google Scholar] [CrossRef] [Scilit]
- Andoni, M.; Robu, V.; Früh, W.G.; Flynn, D. Game-theoretic modeling of curtailment rules and network investments with distributed generation. Appl. Energy 2019, 201, 174–187. [Google Scholar] [CrossRef] [Scilit]
- Joseph, A.; Allahham, A.; Walker, S.L. Investment decisions in a liberalised energy market with generation and hydrogen-based vector coupling storage in Integrated Energy System: A game-theoretic model-based approach. Int. J. Electr. Power Energy Syst. 2025, 166, 110518. [Google Scholar] [CrossRef] [Scilit]
- National Grid ESO. Future Energy Scenarios 2023; Technical Report; National Grid ESO: Warwick, UK, 2023. [Google Scholar]
- Department for Energy Security and Net Zero. UK Hydrogen Strategy: Enabling a Low-Carbon Hydrogen Economy in the Run up to 2050; Technical Report; DESNZ: London, UK, 2022.
- Jafari, M.; Botterud, A.; Sakti, A. Decarbonizing power systems: A critical review of the role of energy storage. Renew. Sustain. Energy Rev. 2022, 158, 112077. [Google Scholar] [CrossRef] [Scilit]
- Eitan, A.; Hekkert, M.P. Locked in transition? Towards a conceptualization of path-dependence lock-ins in the renewable energy landscape. Energy Res. Soc. Sci. 2023, 106, 103316. [Google Scholar] [CrossRef] [Scilit]
- Lejano, R.P.; Davos, C.A. Cooperative solutions for sustainable resource management. Environ. Manag. 1999, 24, 167–175. [Google Scholar] [CrossRef] [Scilit]
- Abuella, M.; Allahham, A.; Walker, S.L. Game theory approaches to hydrogen infrastructure investment planning in Great Britain: A comparative analysis of competitive and cooperative frameworks. Int. J. Hydrogen Energy 2026, 220, 154064. [Google Scholar] [CrossRef] [Scilit]
- Thurner, L.; Scheidler, A.; Schäfer, F.; Menke, J.H.; Dollichon, J.; Meier, F.; Meinecke, S.; Braun, M. pandapower—An open-source python tool for convenient modeling, analysis, and optimization of electric power systems. IEEE Trans. Power Syst. 2018, 33, 6510–6521. [Google Scholar] [CrossRef] [Scilit]
- Lohmeier, D.; Cronbach, D.; Drauz, S.R.; Braun, M.; Kneiske, T.M. Pandapipes: An open-source piping grid calculation package for multi-energy grid simulations. Sustainability 2020, 12, 9899. [Google Scholar] [CrossRef] [Scilit]
- Osiadacz, A. Simulation and Analysis of Gas Networks; Gulf Publishing Company: Houston, TX, USA, 1987. [Google Scholar]
- Department for Energy Security and Net Zero. Electricity Generation Costs 2023; Technical Report; The Stationery Office: London, UK, 2023.

Disclaimer/Publisher’s Note: The statements, opinions and data contained in all publications are solely those of the individual author(s) and contributor(s) and not of MDPI and/or the editor(s). MDPI and/or the editor(s) disclaim responsibility for any injury to people or property resulting from any ideas, methods, instructions or products referred to in the content. |
© 2026 by the authors. Licensee MDPI, Basel, Switzerland. This article is an open access article distributed under the terms and conditions of the Creative Commons Attribution (CC BY) license.