


Abstract
The large-scale penetration of Distributed Energy Resources (DERs), the proliferation of Energy Communities, and the increasing provision of flexibility services are fundamentally transforming distribution network operation, rendering traditional Distribution Management Systems (DMSs) structurally inadequate. This paper addresses this structural gap by proposing and experimentally validating A-ISolE, a novel hybrid Artificial Intelligence (AI) architecture that natively integrates centralized and distributed intelligence within a unified DMS framework. The core scientific contribution of this work lies in the formulation and deployment of a coordinated, hierarchical AI paradigm in which cloud-level predictive and optimization modules dynamically interact with edge-level autonomous control agents. Specifically, the paper introduces: (1) an integrated forecasting state estimation pipeline with AI-enhanced grid observability; (2) intelligent fault location and optimal feeder reconfiguration algorithms embedded into operational control loops; and (3) distributed edge control strategies enabling autonomous yet coordinated microgrid stabilization. The architecture is validated on a real pilot microgrid in Sanremo (Italy). Experimental results demonstrate quantifiable gains in many parameters, substantiating the feasibility of hybrid centralized/distributed AI as a foundational paradigm for future resilient and decarbonized distribution networks.
1. Introduction
The acceleration of the European Union (EU) decarbonization roadmap has placed increasing technical and regulatory demands on electricity distribution networks. The revision of the EU emissions reduction target from 40% to 55% requires extensive renewable energy source (RES) deployment, significant efficiency improvements, and a deep reconfiguration of distribution infrastructures to accommodate stochastic, decentralized, and bidirectional power exchanges [1]. As distribution grids evolve into complex cyber-physical systems, classical operational paradigms—characterized by centralized, deterministic control—are rendered inadequate for ensuring stability and optimality in highly dynamic and uncertain environments [2,3]. High penetration of Distributed Energy Resources (DERs), the widespread adoption of electric mobility, the proliferation of demand-side flexibility, and the emergence of Energy Communities (ECs) introduce new technical challenges related to voltage regulation, congestion management, power quality, and system observability [4,5]. These challenges require advanced predictive and control capabilities beyond the scope of conventional Distribution Management Systems (DMSs), which typically lack the high-resolution forecasting and real-time optimization capabilities required for operating under high-RES penetration. Additionally, Demand Response strategies represent one of the most impactful and cost-effective paradigms in modern Smart Grids (SGs), because they enhance operational flexibility without requiring significant new infrastructure investments [6].
Recent technological developments enable the deployment of data-driven operational strategies based on Artificial Intelligence (AI). Machine learning, deep learning, and multi-agent control architectures have shown strong potential in load and RES forecasting [7], short-term operational planning [8], decentralized control [9], and fault management applications [10]. These methods provide DSOs with the ability to exploit heterogeneous data sources, better capture nonlinear system behaviors, and implement adaptive control logic even under scarce or uncertain measurements.
The A-ISolE project (Management Solutions for Electric Power Distribution Systems with Centralized and Distributed AI) addresses these needs by defining a hybrid AI-based operational framework that integrates centralized decision support optimization with distributed intelligence deployed at the edge. Building upon the technological basis of the national PODCAST research initiative [11,12], the project extends an existing DMS platform enhanced for the A-Isole project based on eXPert SCADA and eXPert DMS designed and produced by SDI Automazione. This platform features advanced load modeling, RES-driven forecasting, smart-meter-enabled analytics, and Common Information Model (CIM)-compliant SCADA integration according to IEC 61970/61968 standards. This platform provides a robust substrate for embedding new optimization, prediction, and control functionalities grounded in state-of-the-art AI techniques.
A-ISolE project advances this architecture by incorporating:
- AI-enhanced forecasting models for short-term and ultra-short-term prediction of loads and Photovoltaic (PV) generation, leveraging deep learning extraction [7,8,9,10,11,12,13];
- Distributed optimization algorithms suitable for local energy districts and ECs, exploiting consensus-based and multi-agent formulations [9,10,11,12,13,14].
The centralized layer implements advanced algorithms for load and generation forecasting, state estimation, fault location, and optimal network reconfiguration. The distributed layer, implemented on the eXPert cSTAR PLC Controller with PAC (Programmable Application Controller) functionality, designed and manufactured by SDI Automazione, performs local monitoring, anomaly detection, and flexible control of distributed assets (edge computing logics). The expected result is an advanced DMS capable of enhanced situational awareness, adaptive operational planning, and resilient real-time control across both MV and LV networks. These capabilities support increased RES hosting capacity, improved EV charging performance, more efficient storage utilization, and reduced balancing costs for the system operator. The proposed architecture is validated on a real pilot microgrid in Sanremo (Italy).
The paper is structured as follows: Section 2 presents an overview of AI techniques in power systems. Section 3 describes the DMS architecture extended during the A-ISolE project, while in Section 4, the main results obtained are discussed. Finally, some conclusions are drawn at the end of the paper.
2. AI Techniques in Power Systems: Literature Overview
This section is devoted to the literature review that provides a comprehensive state-of-the-art overview of AI methods in distribution systems, including machine learning-based forecasting, with a special focus on topic included in the proposed DMS. These techniques are fundamental in the present project. In fact, according to the title “A-ISolE” (“Management Solutions for Electricity Distribution Systems with Centralized and Distributed Artificial Intelligence”), it is significant to analyze the state of the art regarding AI applications in power systems, as follows.
Recently, AI has found and is finding multiple applications in distribution networks, bringing benefits in terms of efficiency, reliability, and sustainability. Compared to traditional models, large AI models, trained on vast datasets, have revealed richer knowledge and patterns. When handling large-scale and high-dimensional data, they demonstrate greater accuracy and a stronger generalization capacity. This significantly improves system responsiveness and operational efficiency, enabling more precise forecasts of energy demand and supply, optimizing resource allocation, reducing operating costs, and improving system stability and economic performance [15].
The AI concept originated from the definitions provided by Turing in the mid-1940s [16], although a single definition still does not exist. However, most agree that it is an information processing system influenced by an environment and capable of learning and adapting [17]. The main AI methods can be divided into [18]:
- Machine learning (ML) techniques, which represent a group of techniques widely used in recent studies. Considerable progress has been made in the field of ML-based computing with technologies such as GPT [19] and BERT [20], which represent large AI models applied to natural language processing, image recognition, and data analysis.
- Meta-heuristic methods, a group of algorithms for solving optimization problems.
- Rule-based systems, which represent AI techniques that allow direct integration of human knowledge. By developing a set of “if–then” rules, the system can decide based on the rules provided by an expert, and therefore, these systems are often called expert systems. Fuzzy logic is frequently adopted in rule-based systems [21].
The IRENA Agency has rigorously evaluated the potential use cases of AI in the energy sector, with a particular focus on the integration of variable-RES technologies [22]. In particular, the identified use cases include maintaining grid stability and reliability, improving demand forecasts, efficient demand management, and optimization of energy storage. A very similar set of use cases was identified by EPRI in 2019 [23]. A recent and more detailed study [24] groups nine broad domains of AI applications in power systems mainly into three fields: maintenance and security, decision support, and customer services.
In the next subsections, the main AI methods will be described, including the main applications of AI in power systems. However, it is important to highlight some critical aspects related to practical application: the integration of extensive measurement systems increases vulnerability to cyberattacks. Although this topic is not an essential part of the current analysis, it represents a relevant issue in the integration of AI approaches, and for this reason, some approaches already take this aspect into account, such as Reference [25].
2.1. Machine Learning Methods
ML methods are widely applied to tasks involving forecasting, classification, and pattern recognition. ML models can be divided into three subgroups:
- Supervised-learning ML, where a dataset consisting of input and output/target data is used, as in neural networks, for training and validation [26]. Training is performed with an optimizer that minimizes an error function based on a distance measure between the actual output value and the reference (target) value of the data. Supervised-learning methods include Artificial Neural Networks (ANNs), support vector regressors (SVRs), Support Vector Machine (SVM), ensemble methods, and deep neural networks (DNNs). They are widely used for load and PV forecasting, state estimation with pseudo-measurements, and anomaly detection.
- Unsupervised-learning ML, where target values are not included in the dataset, leads to a training procedure in which the learning algorithm must independently identify the target [27]. Unsupervised-learning methods, such as k-means clustering and Principal Component Analysis (PCA) support customer segmentation, topology identification, and detection of abnormal behavior without labeled data.
- Reinforcement learning (RL) ML is an agent-based method for learning a specific strategy [28]. This ML method provides agent-based optimization for problems including Volt/Var control, storage dispatch and grid reconfiguration.
2.2. Meta-Heuristic Optimization Methods
Meta-heuristic approaches are effective for nonlinear, combinatorial, and multi-objective problems with large solution spaces. The most important algorithms are: Particle Swarm Optimization (PSO), the Fruit Fly Optimization Algorithm (FFOA), Ant Colony Optimization (ACO), and Genetic Algorithms (GAs).
Of these methods, PSO is probably the most famous among population-based methods. The basic version uses a swarm of particles with an initial position and velocity in a search field to find a global optimum, while each particle knows its own best position and the global best [29]. Another popular meta-heuristic optimization method is FFOA, where “fruit flies” implicitly collaborate to build the solution [30]. The ACO method, inspired by the food-seeking behavior of ant colonies, is known for solving complex problems in a short time [31]. The GA is inspired by natural evolution, selecting only the fittest individuals through the crossing of parent genes [32]. The Tabu Search algorithm guides a local heuristic procedure to explore the global solution space using adaptive memory [33].
These methods are top in Volt/Var optimization and the sizing and placement of devices. Compared to classical optimization, they offer faster convergence and robustness.
2.3. AI Applications in Power Systems
The main applications of AI in power systems concern: (1) load forecasting and load modeling, (2) generation forecasting, (3) dispatch algorithms, (4) voltage regulation, (5) Fault Detection and Diagnostics, and (6) predictive maintenance, with AI analyzing data from IoT sensors to anticipate failures, reducing operating costs and service interruptions (for details, ref. [34]). Some AI applications will be described in the next subsections.
2.3.1. Load Forecasting and Load Modeling
Load forecasting represents a fundamental functionality for the modern DMSs: AI predictive models can be useful to estimate the daily trend of demand. AI-driven forecasting approaches have demonstrated superior performance compared to statistical methods, especially in LV networks characterized by highly variable demand patterns.
In the present project, load forecasting is necessary to provide crucial inputs to other algorithms within DMSs, such as state estimation, optimization, voltage regulation, optimal reconfiguration, etc. A reliable load-forecasting function is essential to coordinate the uncertainty arising from the use of RESs, also considering the possible and potential spread of active demand management strategies.
The topic of load forecasting has been extensively explored by the scientific community, which has proposed a variety of solutions. Artificial Neural Networks (ANNs), including multilayer perceptrons, Wavelet–ANN hybrids, and ensemble neural architectures, have been successfully used for short-term load forecasting, as evidenced in some research projects. For example, in [35], Wavelet decomposition was used for short-term load forecasting, while in [36], a probabilistic methodology based on quantile regression averaging was employed to forecast load absorption. Concerning the use of AI works, [37,38,39] propose different ANN-based load-forecasting models.
Load modeling—estimating representative daily load profiles for transformers, LV feeders, or customer clusters—is another key application. AI approaches such as clustering (k-means, fuzzy c-means) and neural inference models allow DSOs to reconstruct pseudo-measurements in unmetered segments, improving the performance of distribution state estimators. These methods are crucial for DSOs like DEA (the A-ISolE test network operator partner), where full observability remains economically unfeasible.
2.3.2. Generation Forecasting
Generation forecasting is particularly aimed at evaluating RES expected production, which is inherently subject to meteorological variability. High-penetration PV systems introduce strong uncertainty due to the stochastic nature of irradiance and cloud dynamics; day-ahead PV forecasting is essential for scheduling, congestion management, storage operation, and participating in local flexibility markets [40,41,42]. As the share of solar energy fed into the grid increases, it becomes more complex to regulate voltage, allocate reserves and efficiently coordinate DERs [43,44]. The synergistic use of forecasting, storage, and automated control transforms PV generation into a predictable and optimizable component of the power system, enabling higher RES penetration without compromising reliability [45]. AI-based methods have demonstrated significant improvements in forecast accuracy. A-ISolE integrates these techniques to support both centralized and local edge-based DMS functions installed in the pilot site [46].
The different strategies can be classified into direct and indirect forecasting methods [47]. In the indirect approach, solar irradiation is predicted, which is then used to predict PV power; direct methods, on the other hand, aim to directly predict PV production. Statistical methods use historical data related to weather conditions and PV production to define statistical methods, which can range from classic techniques (time series [48]) to advanced techniques (such as machine learning [49] or deep learning [50]).
2.3.3. Dispatch Algorithms for Distributed Generation
Dispatch algorithms are historically a very important topic [51]. Many studies using meta-heuristic methods are available in the literature. In [52], an FFOA is proposed, while [53] uses a PSO optimizer. RL has also been applied in many cases to this problem [54].
2.3.4. Voltage Regulation
Voltage regulation in distribution grids with high DG is increasingly challenging. AI-driven strategies enable fast, adaptive-control actions unachievable by traditional controllers, as discussed in [55]. A multi-agent system using deep RL is proposed in [56]. In regard to meta-heuristic optimization, in [57,58], PSO is formulated as an MINLP problem.
2.3.5. Fault Detection and Diagnostics
A critical aspect of power system operation concerns Fault Detection and Diagnostics [59]. AI-enabled fault detection systems leverage high-frequency measurements and smart meter data to classify anomalies more quickly and accurately than protection-only schemes [59]. Reference [60] propose a fault diagnosis system based on a distributed diagnostic framework. A different method, in [61], employs a hybrid system that combines the advantages of GAs and Tabu Search for fault diagnosis. In [62], a two-stage approach for fault classification is introduced, consisting of a Wavelet transform followed by a GA. Conversely, in [63] the strengths of meta-heuristics and ML are combined by employing an SVM for anomaly classification, using a PSO algorithm. In [64], different ML techniques were investigated for fault analysis and classification. Detection is typically performed after the occurrence of an anomaly; therefore, a forecasting algorithm can be valuable for system operators to enable preventive actions. To this end, [65] develops a two-stage fault prediction system based on historical data.
3. DMS Architecture in the A-ISolE Project
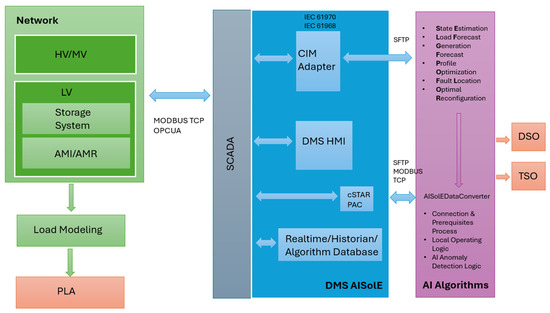
The A-ISolE architecture is structured into three main layers:
- (i)
- The SCADA/DMS layer, which acquires measurements and executes control actions;
- (ii)
- The centralized AI layer, which processes network data and handles optimal set-points;
- (iii)
- The edge layer, which hosts local controllers and IoT devices with AI capabilities.
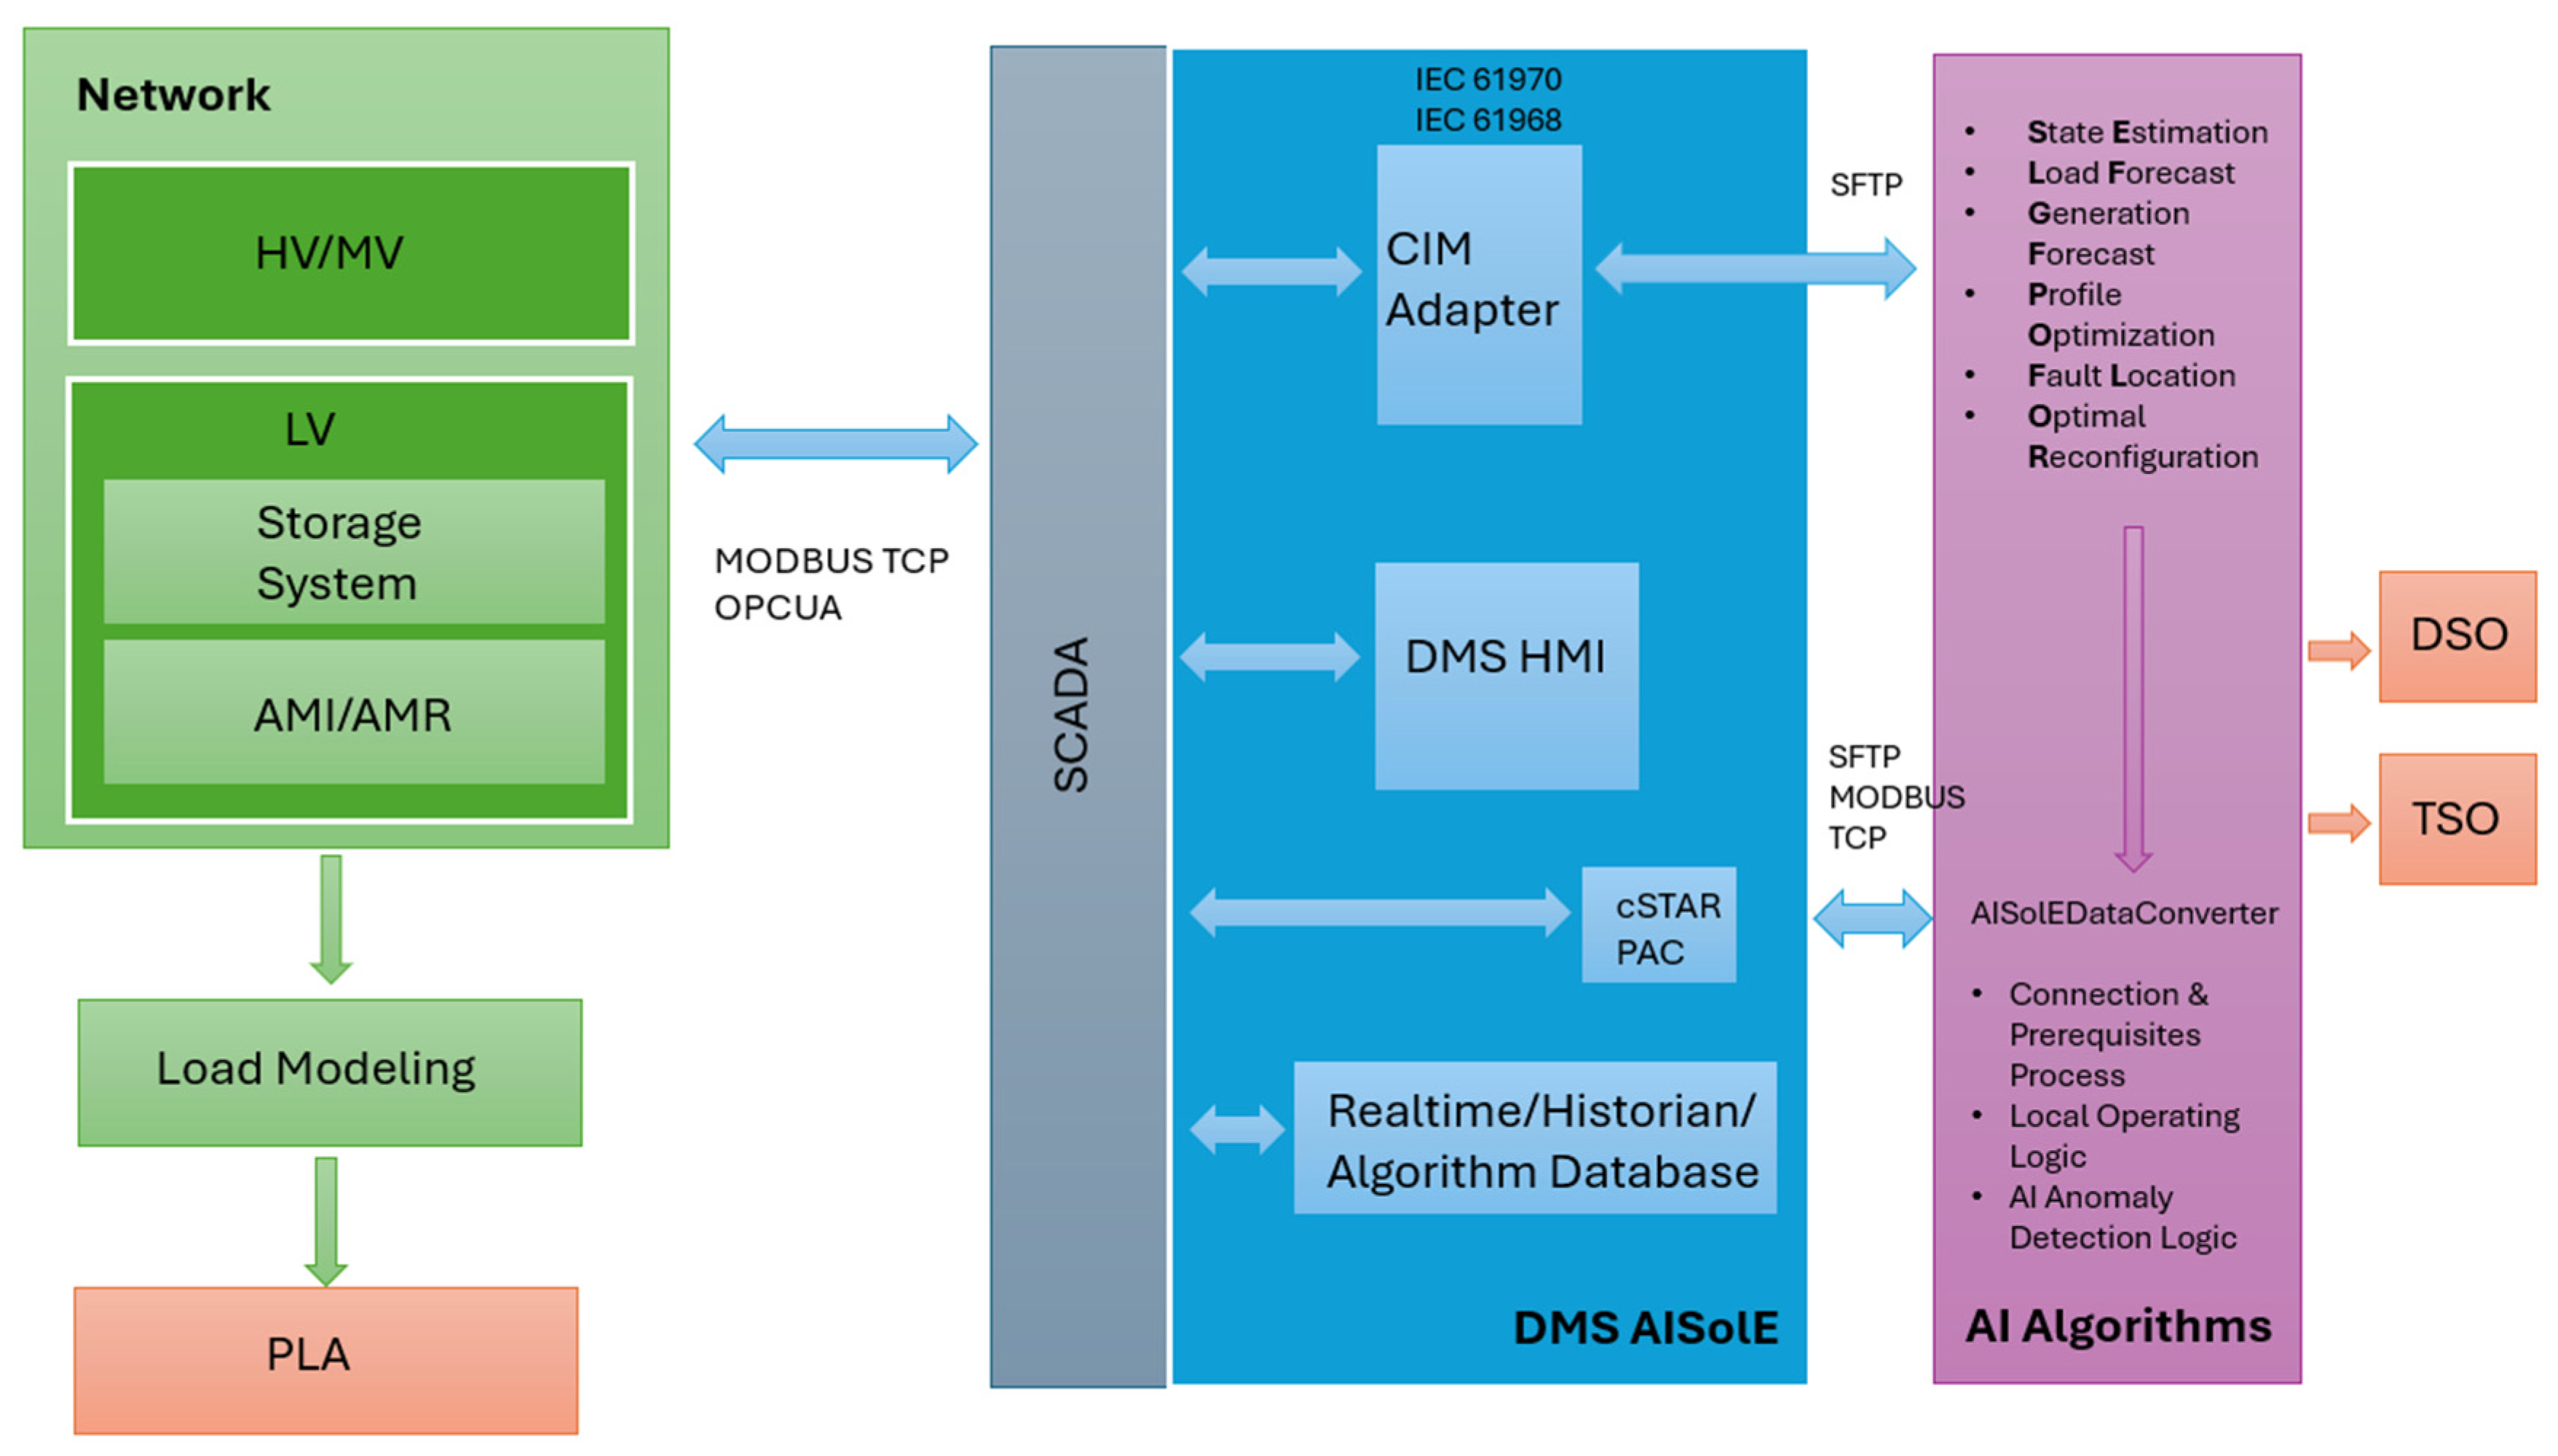
The SCADA system exports network state, topology, and operating data, adopting the CIM, as defined by IEC 61970 and IEC 61968 (Figure 1). A CIM Adapter manages the conversion of SCADA-exported CIM data into the data format used by the AI layer and conversely re-encodes the outputs back into CIM for reintegration into the SCADA.
Figure 1.
DMS architecture [46].
The centralized AI layer implements several algorithmic modules. In particular, the modules included address several critical functions for modern DMS:
- Short-term load forecasting, which combines building energy models and statistical time series forecasting techniques. The proposed tool combines a Basic Ensemble Method (BEM) of a multilayer perceptron with an ARIMAX residual model, similarly to [66]. ARIMAX is a standard method for time series, while the BEM based on MLP neural networks is defined as the average of the outputs of several ANNs.The BEM output is defined bywhere n is the total number of ANNs and is the single-network outputs defined as a function of time index t. In the proposed method, the ANN architecture used for each network within the ensemble is the MLP.ARIMAX models characterize stationary stochastic processes. As a result, ARIMAX methods are commonly applied to short-term load forecasting. In this study, an ARIMAX framework is employed to estimate the BEM residual based on the following relationship:where
- √
- is the estimation of the BEM residual ε(t) at time t.
- √
- indicates the dth order difference of .
- √
- X(t) is the Residual Features at time t, which are:
- ○
- Boolean indicating if value lies in Holiday;
- ○
- Cyclical Features of Hour.
- √
- ϕ are the autoregressive coefficients.
- √
- θ are the moving average coefficients.
- √
- r(t) is the residual process at time t; it is assumed to be Gaussian with null mean.
- √
- β are the exogenous input coefficients.
- PV generation forecasting is performed using a hybrid approach that selects between clear-sky models and ensembles of ANNs depending on meteorological conditions. The model adopted is defined by a decision tree that consists of a sequence of If/Else rules applied to the input variables that ultimately determine the model output. To generate a prediction, one traverses the tree from the root node down to a terminal (leaf) node, which contains the predicted value. In this framework, the If/Else rules are referred to as splits, while the input variables are commonly called attributes. Various methods exist for constructing and implementing decision trees. In this study, the Classification and Regression Trees (CART) approach has been adopted. Starting from a training dataset, the algorithm first grows the tree to its maximum size. It then performs a pruning step, removing splits that contribute little to overall predictive performance and may lead to overfitting. Splits are determined by evaluating all possible partitioning values for each attribute; each candidate split divides the data at a node into two subsets. The CART procedure generates a sequence of progressively pruned nested trees that serve as potential final models. The optimal tree is selected by evaluating its performance on an independent validation dataset. Under clear-sky conditions, the PV system operates without cloud-induced shading. Consequently, the uncertainty in the PV power output profile is minimal, allowing the use of a deterministic model to represent this weather scenario. The predicted PV power output, , is expressed as follows, where denotes time dependency:where represents the global irradiance incident on the plane of the array , is the total rated peak power of the PV array , denotes the relative efficiency of the panels [p.u.], is the inverter efficiency [p.u.], accounts for performance degradation [p.u.], and corresponds to the irradiance under standard test conditions .The original CSM assumes clear-sky conditions; to improve accuracy under cloud cover, it is extended using a Stepwise Linear Regression (SLR) model trained on clear or nearly clear days. The regressors include CSM output and the cloud cover (CC) index (0–100 scale), with variables expanded up to the fifth power to capture nonlinear effects. Regressors are iteratively added or removed based on p-value thresholds (0.05 for entry, 0.1 for removal), providing a practical compromise between optimality and computational cost. The adopted procedure can be summarized as follows:
- Begin with a model containing only the intercept term.
- Add the candidate regressor with the smallest p-value, provided it is below a predefined entry threshold. Repeat this step until no additional regressors satisfy the inclusion criteria.
- Remove the regressor with the largest p-value if it exceeds a predefined removal threshold. If no such regressor exists, terminate the procedure; otherwise, return to step 2.
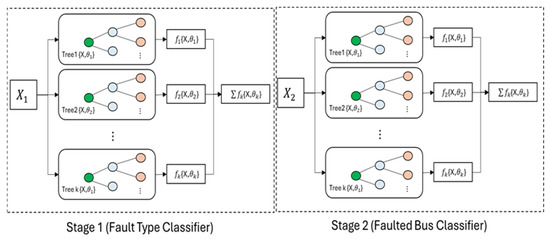
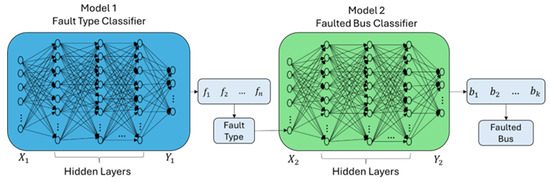
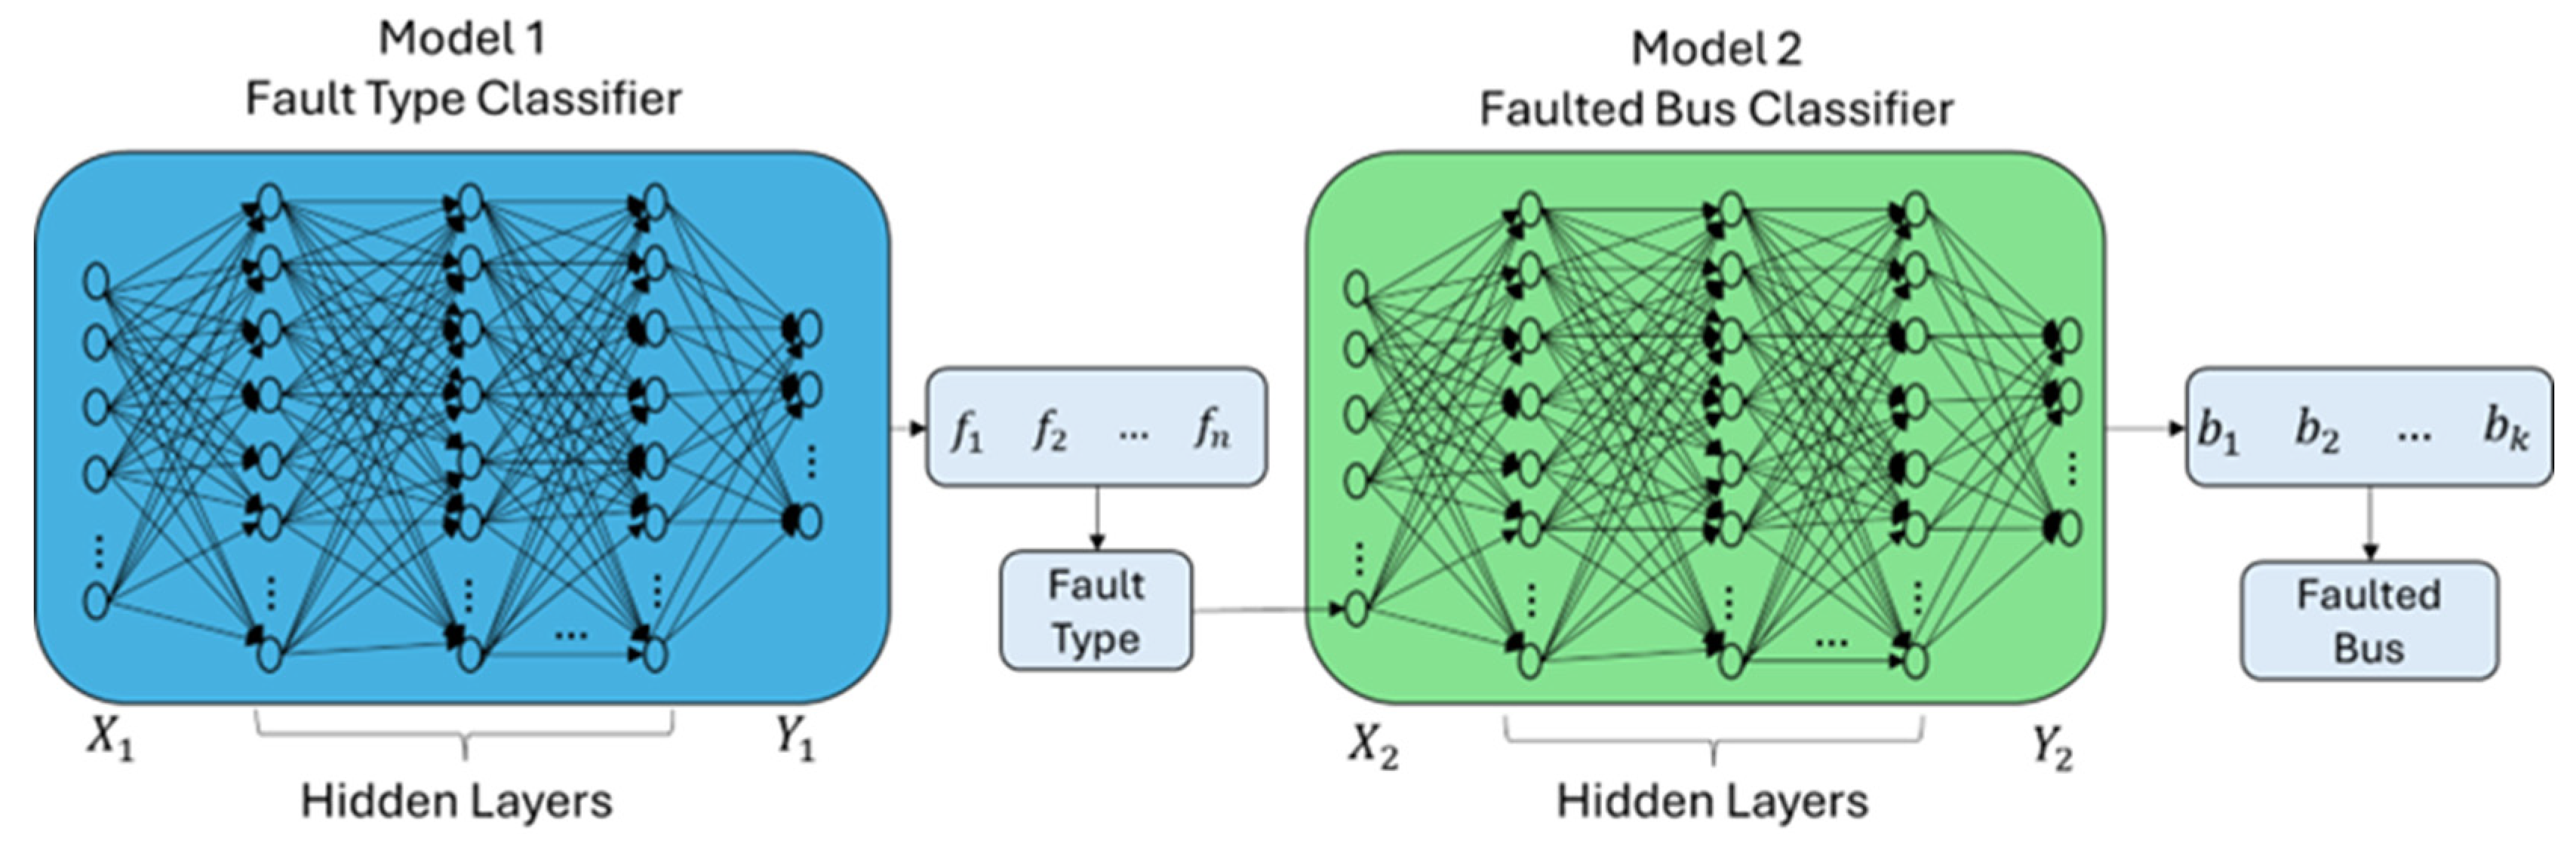
- Fault Detection and Localization: a data-driven fault location module based on gradient-boosted trees identifies the most probable faulted segment after a protection operation. A fault analysis technique, developed according to [67,68], is proposed to use only the measurements already available in the distribution system. The proposed method exploits the existing infrastructure to extract meaningful information from steady-state fault data. By applying advanced data-processing techniques and ML algorithms, the method aims to identify distinctive features and patterns associated with different fault types and fault locations.The objective is to develop ML models capable of locating faults regardless of operational topology. In a distribution system with N tie lines, there are combinations of switches, rendering exhaustive search computationally infeasible even with a modest number of tie lines. Hence, we use the Sobol algorithm to sample the combination of switches, faulted buses and fault types to create a training dataset: with respect to random sampling, the resulting combination is more uniform in combination space than simple random sampling, hence being more representative.The ith component of a d-dimensional Sobol sequence is defined aswhere are the binary representations of , while are direction numbers for each variable . The nth Sobol point is defined as
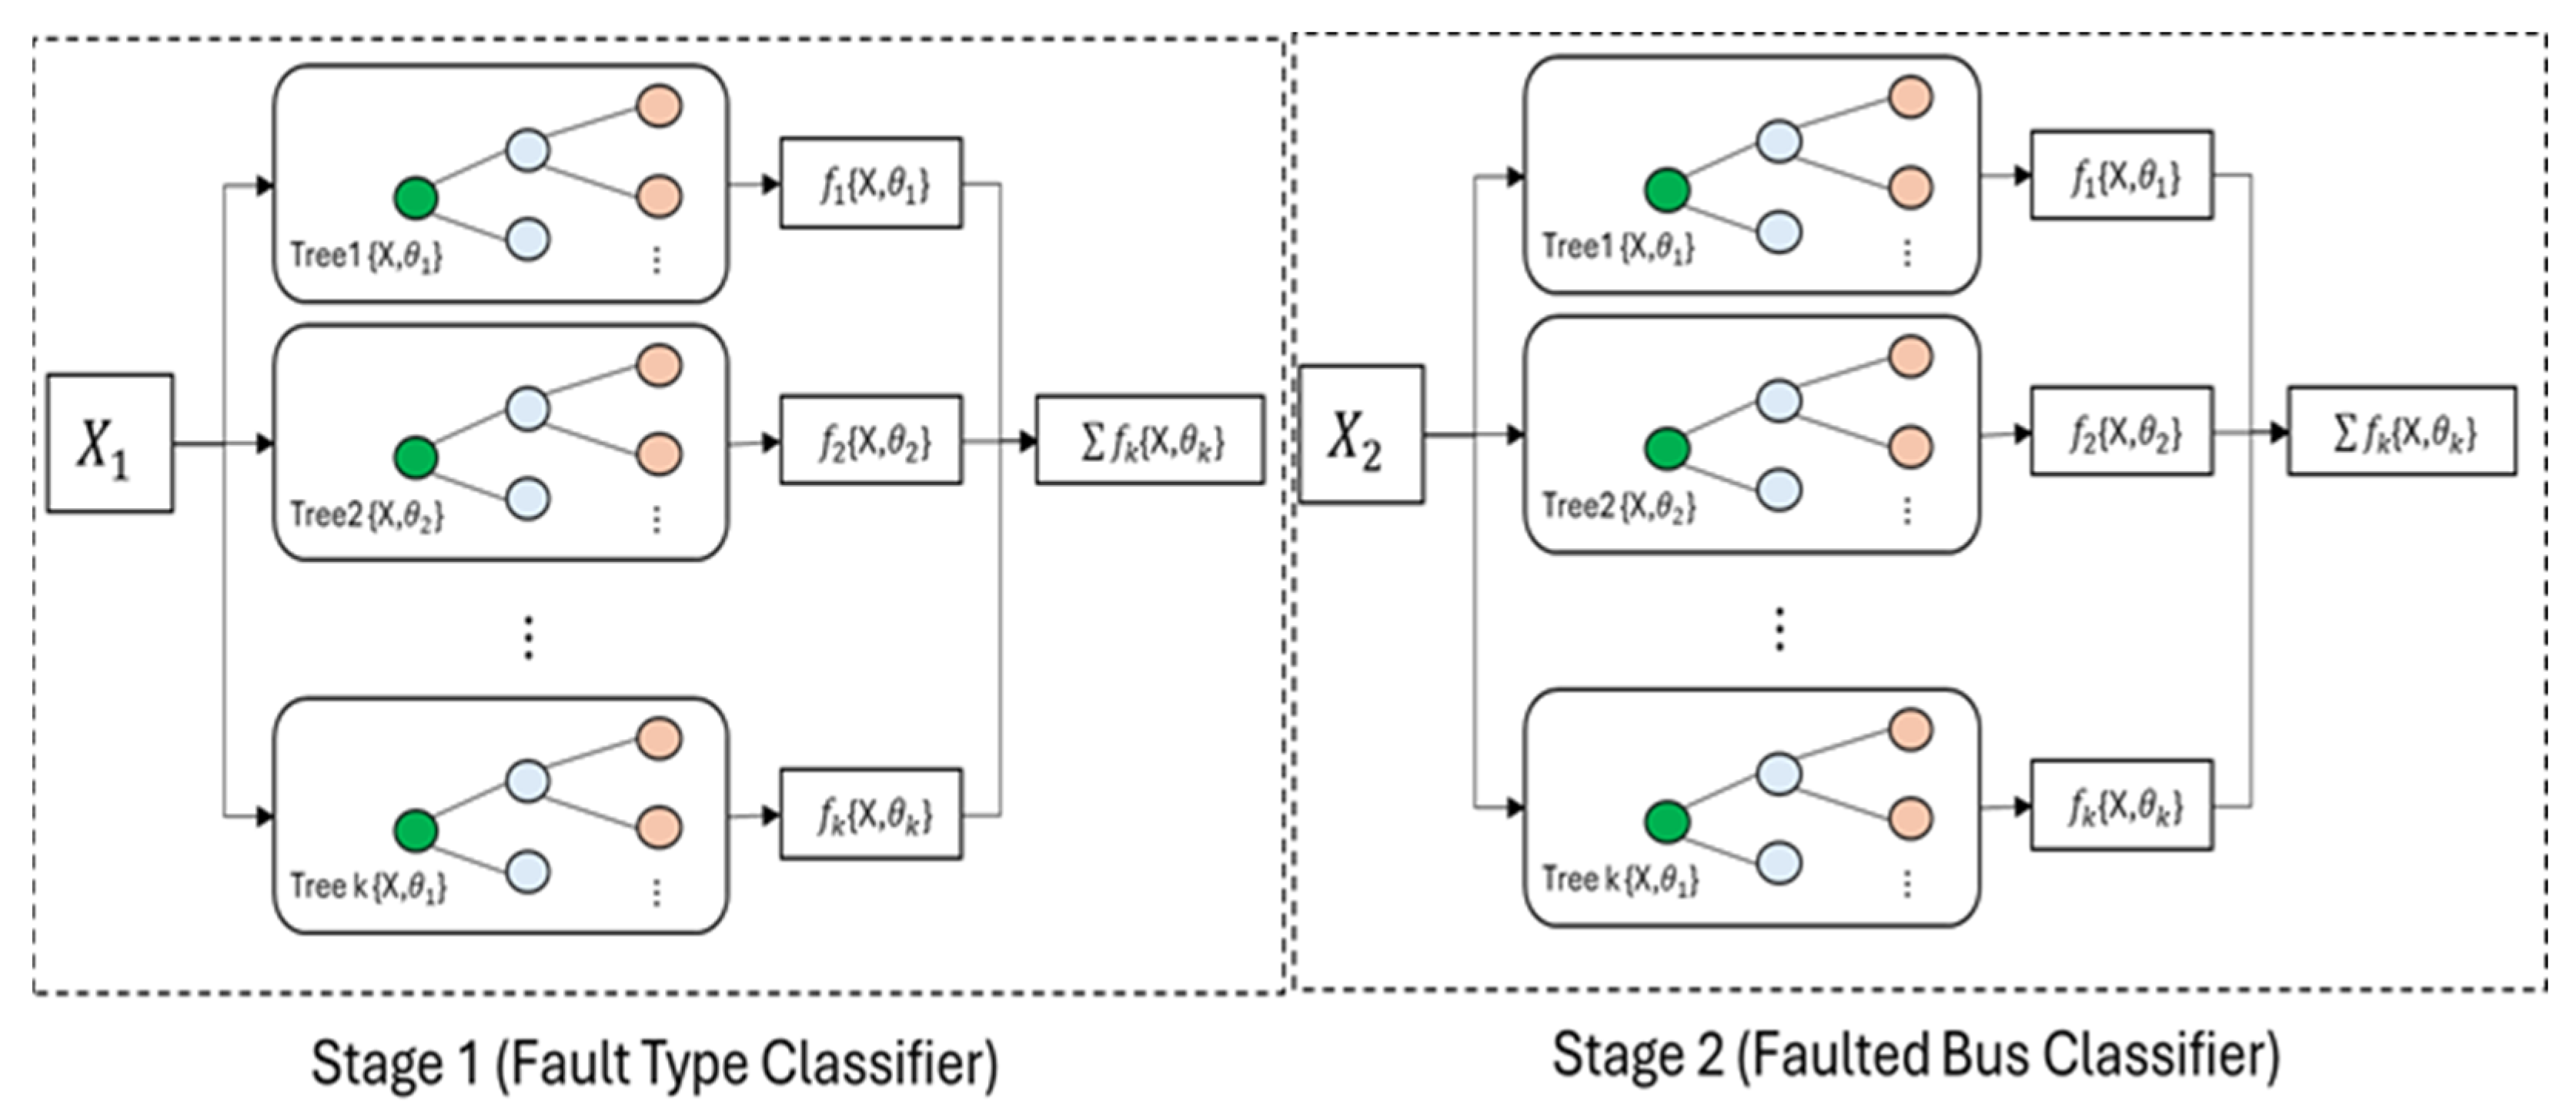
Figure 2.
Two-stage XGBoost ensemble for fault location.
Figure 3.
Two-stage ANN ensemble.
- Optimal network reconfiguration is a complex task in distribution system management, due to the high number of possible actions that can be performed. Deep Q-Networks (DQNs) can be effectively combined in multi-agent systems to solve such problems and achieve cooperative behavior. Several approaches have been proposed to combine actions from different DQN agents. One method uses a network of DQN agents, where each agent is responsible for a specific task or domain. For example, in a flexible job-shop problem, one agent selects operation sequences while another allocates jobs to machines [69]. This approach allows specialization and reduces the search space for each agent, which can improve performance compared with single-agent systems. We propose a cooperative multi-agent reinforcement learning (MARL) solution to the feeder reconfiguration problem, by adopting the Centralized Training with Decentralized Execution (CTDE) framework, a widely used paradigm in MARL that reduces partial observability and communication constraints. It allows agents to use global information during training while acting independently at execution. CTDE is popular in MARL because it balances full use of global observations during training with feasible decentralized execution for inference. An important concept of CTDE framework is that the mixing network should satisfy the requirement that the optimal joint action induced from the optimal centralized action–value function is equivalent to the collection of individual optimal actions of agents. In practice, a multi-agent RL-based optimal reconfiguration module searches for switching configurations that minimize losses and mitigate voltage violations. This multi-agent structure operates by distributing control responsibilities among several agents. Each agent is assigned to a specific feeder and controls a subset of switches, allowing the overall system to reflect the physical and operational segmentation of the distribution network.The state of the system at time is represented by a vector that captures both electrical operating conditions and network topology:where denotes the voltage magnitude at bus , and represents the status of the -th switch. In this way, the learning agents have access to a comprehensive description of the network configuration and its electrical state. The action at time consists of the switching decisions applied to the controllable devices:In the multi-agent setting, the global action is decomposed into a joint action:where each corresponds to the switching decisions of agent . This decentralized formulation reduces the dimensionality of each agent’s decision space and facilitates coordinated learning across feeders.A central aspect of the framework is the design of the reward function, which must guide the agents toward operationally desirable configurations while ensuring system security. The problem is inherently multi-objective. Three main goals are considered: minimizing active power losses, limiting switching operations, and preserving service reliability. Active power losses are modeled aswhere and denote the resistances of lines and transformers, and , are the corresponding currents. Minimizing directly improves network efficiency and reduces operational costs. However, feeder reconfiguration should not rely on excessive switching, as each operation contributes to equipment wear and may introduce transient disturbances. To account for this, a switching penalty is introduced.Operational constraints are explicitly enforced to guarantee secure network operation. Voltage magnitudes must remain within ±5% of nominal values.Finally, radiality constraints are imposed to preserve the tree structure of distribution networks. Representing the network as a graph , each feeder subgraph must be connected and acyclic, satisfying:The optimal solution provided by the approach is compared between two configurations: one where all tie switches are open and another where all tie switches are closed. The configuration with all switches open results in the highest load peaks, indicating potential overloads on several lines. In contrast, the optimal solution provides a more balanced distribution and lower loads on most lines. The configuration with all switches closed represents an intermediate case, with moderate loads. Overall, the optimal solution reduces network stress by distributing power flows more evenly.
- Load modeling: The algorithm examined in this section will be employed to generate the pseudo-measurements required by the state estimation algorithm, ensuring the observability of the DEA distribution network. For training the proposed Artificial Intelligence technique (BEM + ARIMAX + k-means), all MV/LV substations monitored by the DEA network were used, except for two substations, reserved exclusively for performance evaluation of the implemented algorithm.
- Optimization of ECs: A specific use case has been implemented and experimentally validated on a pilot site hosted in the DEA distribution network. In fact, according to the energy transition, ECs are emerging as innovative solutions to address the challenges related to sustainability and energy efficiency.
The edge layer is based on the SDI eXPert cSTAR controller that interfaces with smart meters and loads. Measurement data from IoT devices are collected using MQTT and MODBUS TCP protocols, stored locally, and forwarded to the central DMS when communication is available.
The “A-ISolE” project goal was to develop and implement operational algorithms based on both centralized and distributed AI to ensure accurate forecasting of load systems and RESs. This enables the creation of a value-added service platform for DSOs as well as other stakeholders, including energy traders, RES producers, and final users. The outcome is an advanced DMS featuring extended grid management algorithms, leveraging data analysis from smart meters for the control of storage systems.
3.1. A-ISolE Site Pilot
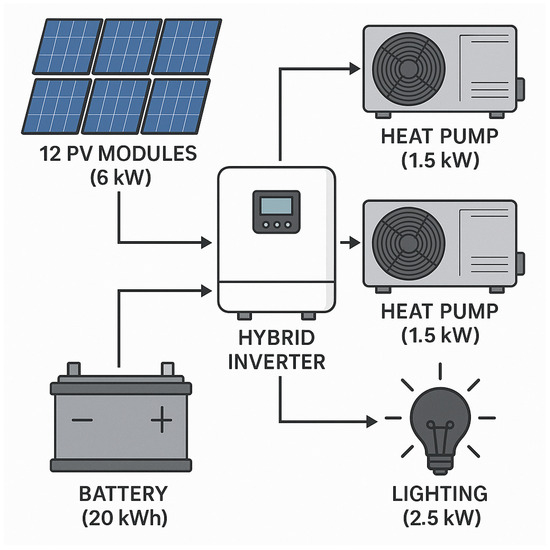
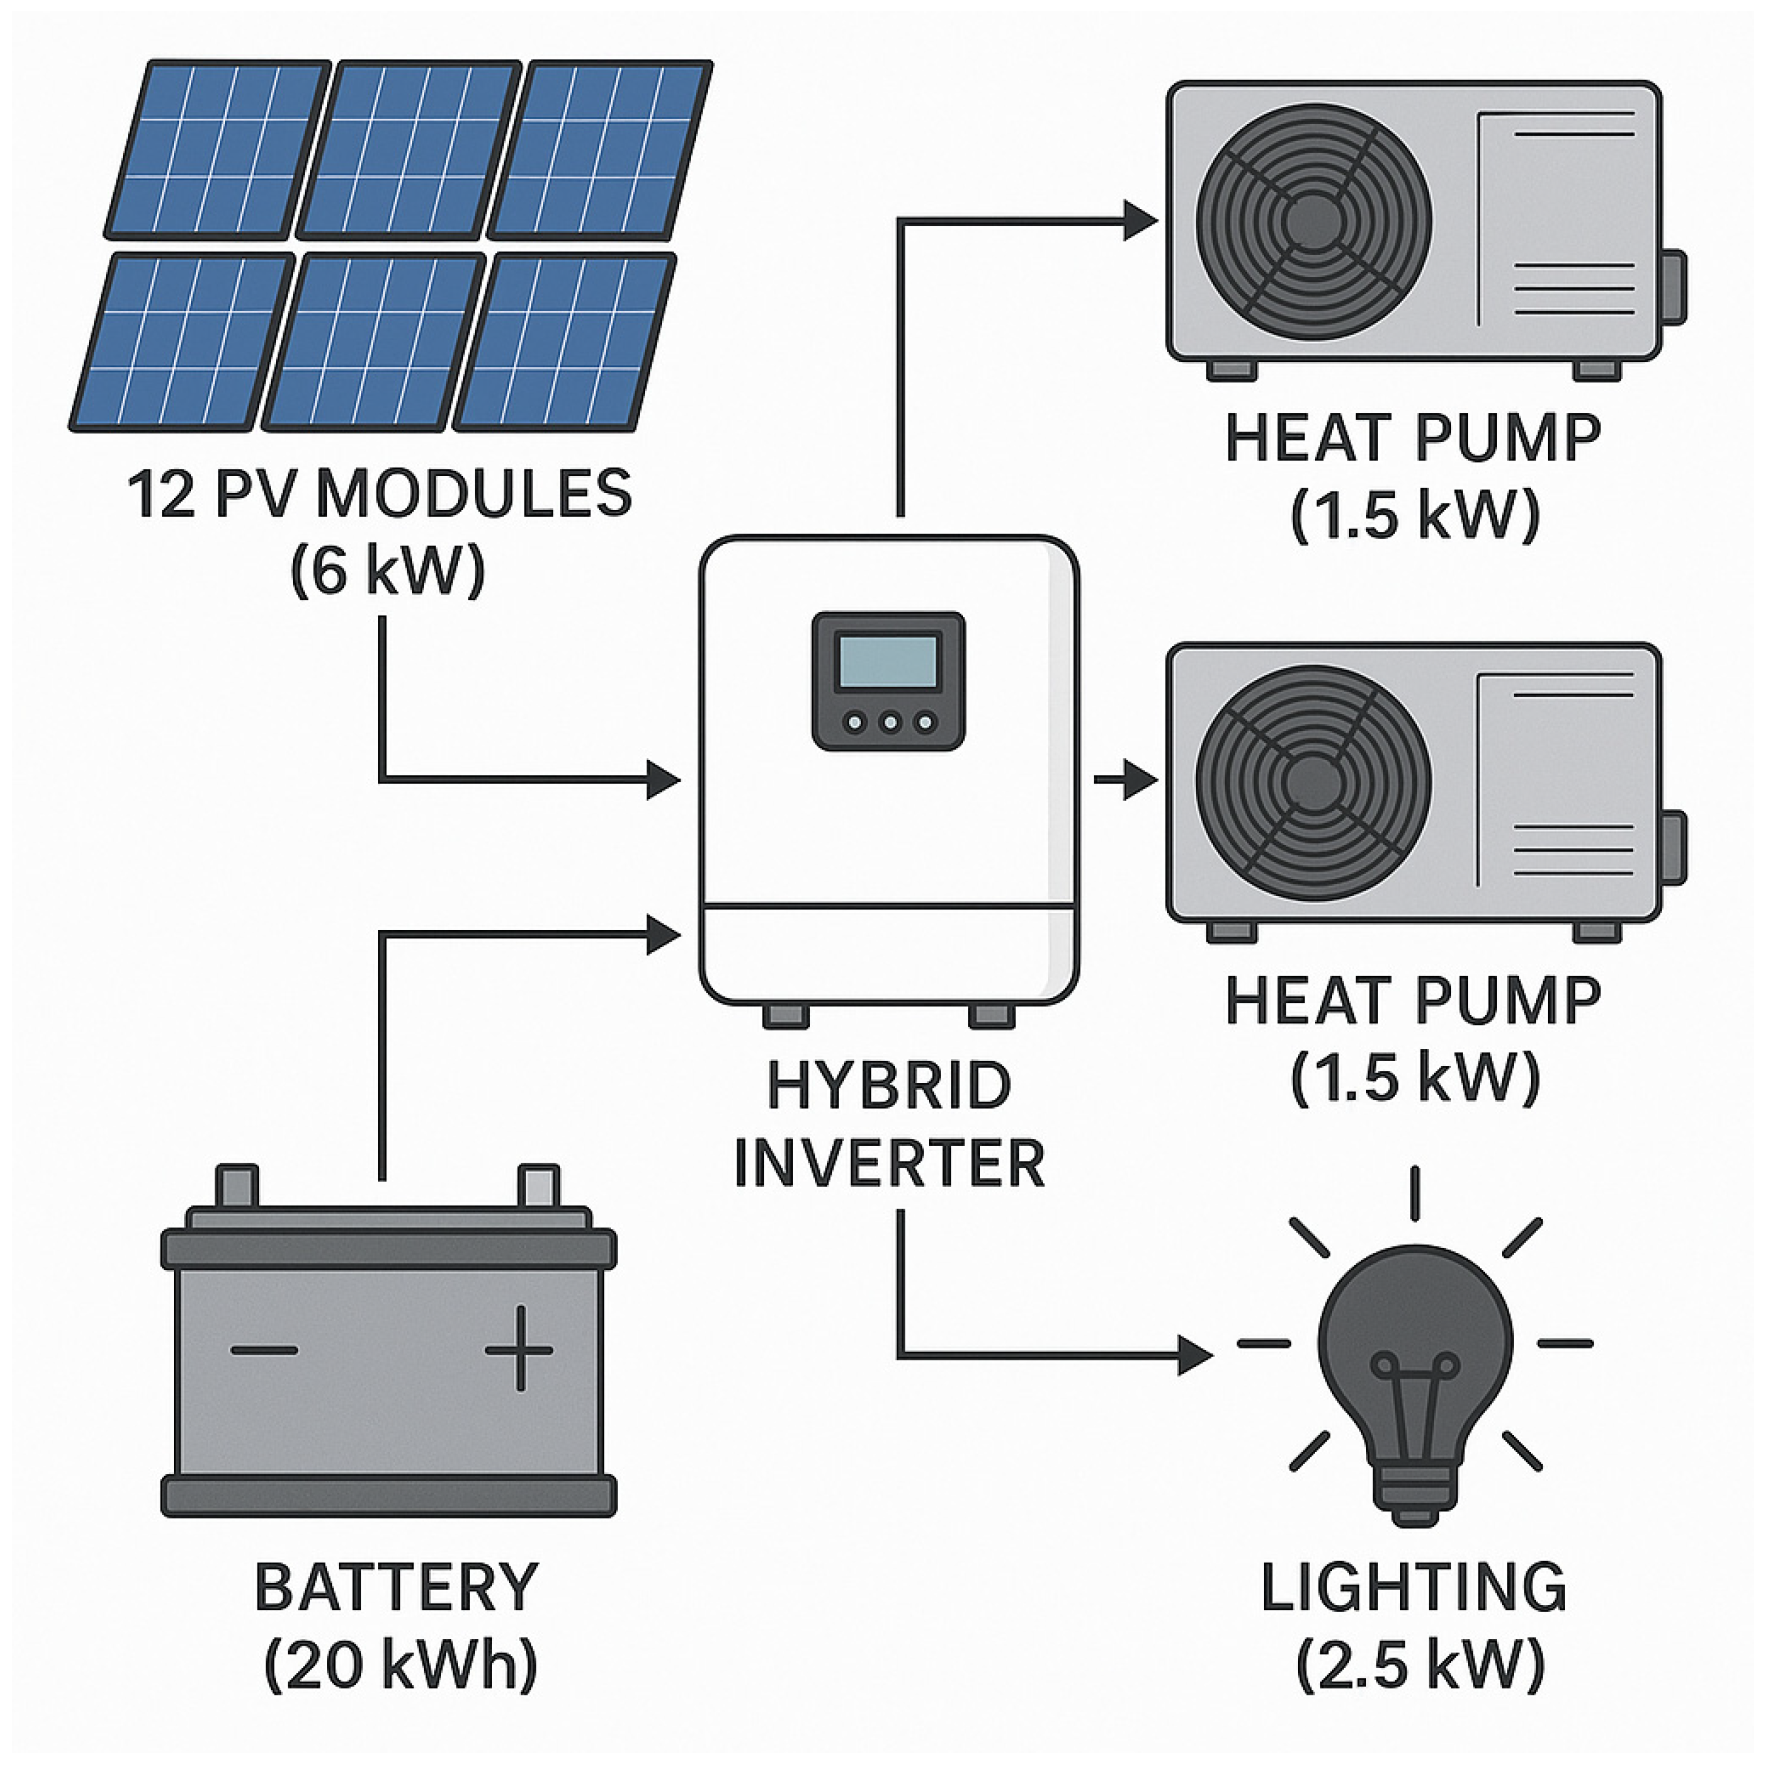
The pilot site configuration includes the following components (Figure 4):
Figure 4.
Pilot site in the DEA distribution network (Sanremo, Italy) [46].
- A 6 kW PV system (12 modules);
- A 20 kWh energy storage system (lithium batteries);
- A 6 kW hybrid inverter for storage management, capable of managing the islanding operation in the “off-grid” mode;
- Inverter heat pumps (controllable loads), with a total load of 3 kW;
- Lighting systems (controllable load) (2.5 kW).
The objective was the implementation of a pilot site that can serve as a reference model for future implementations in other parts of the distribution network. In fact, according to the budget available, only a small pilot site can be realized, but the results can be discussed and applied to the whole distribution system, without a lack of generality. The selected test site is located within the DEA LV distribution network in Sanremo (Italy), already equipped with a DMS integrating SCADA- and CIM-based interoperability modules. The modular architecture allows generalization of results to broader network sections, enabling scalability analyses and modeling of district-scale ECs.
3.2. Energy Community Use Case for the Site Pilot
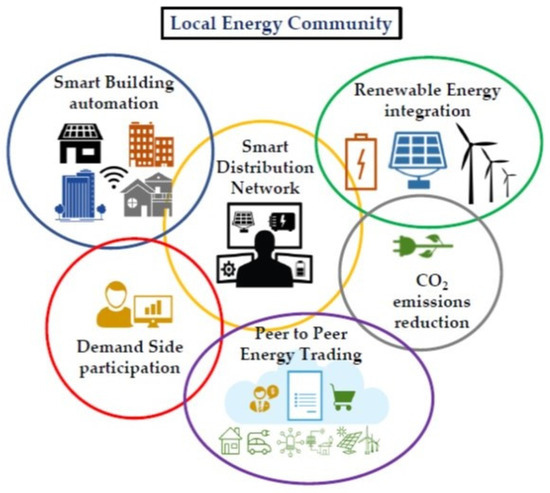
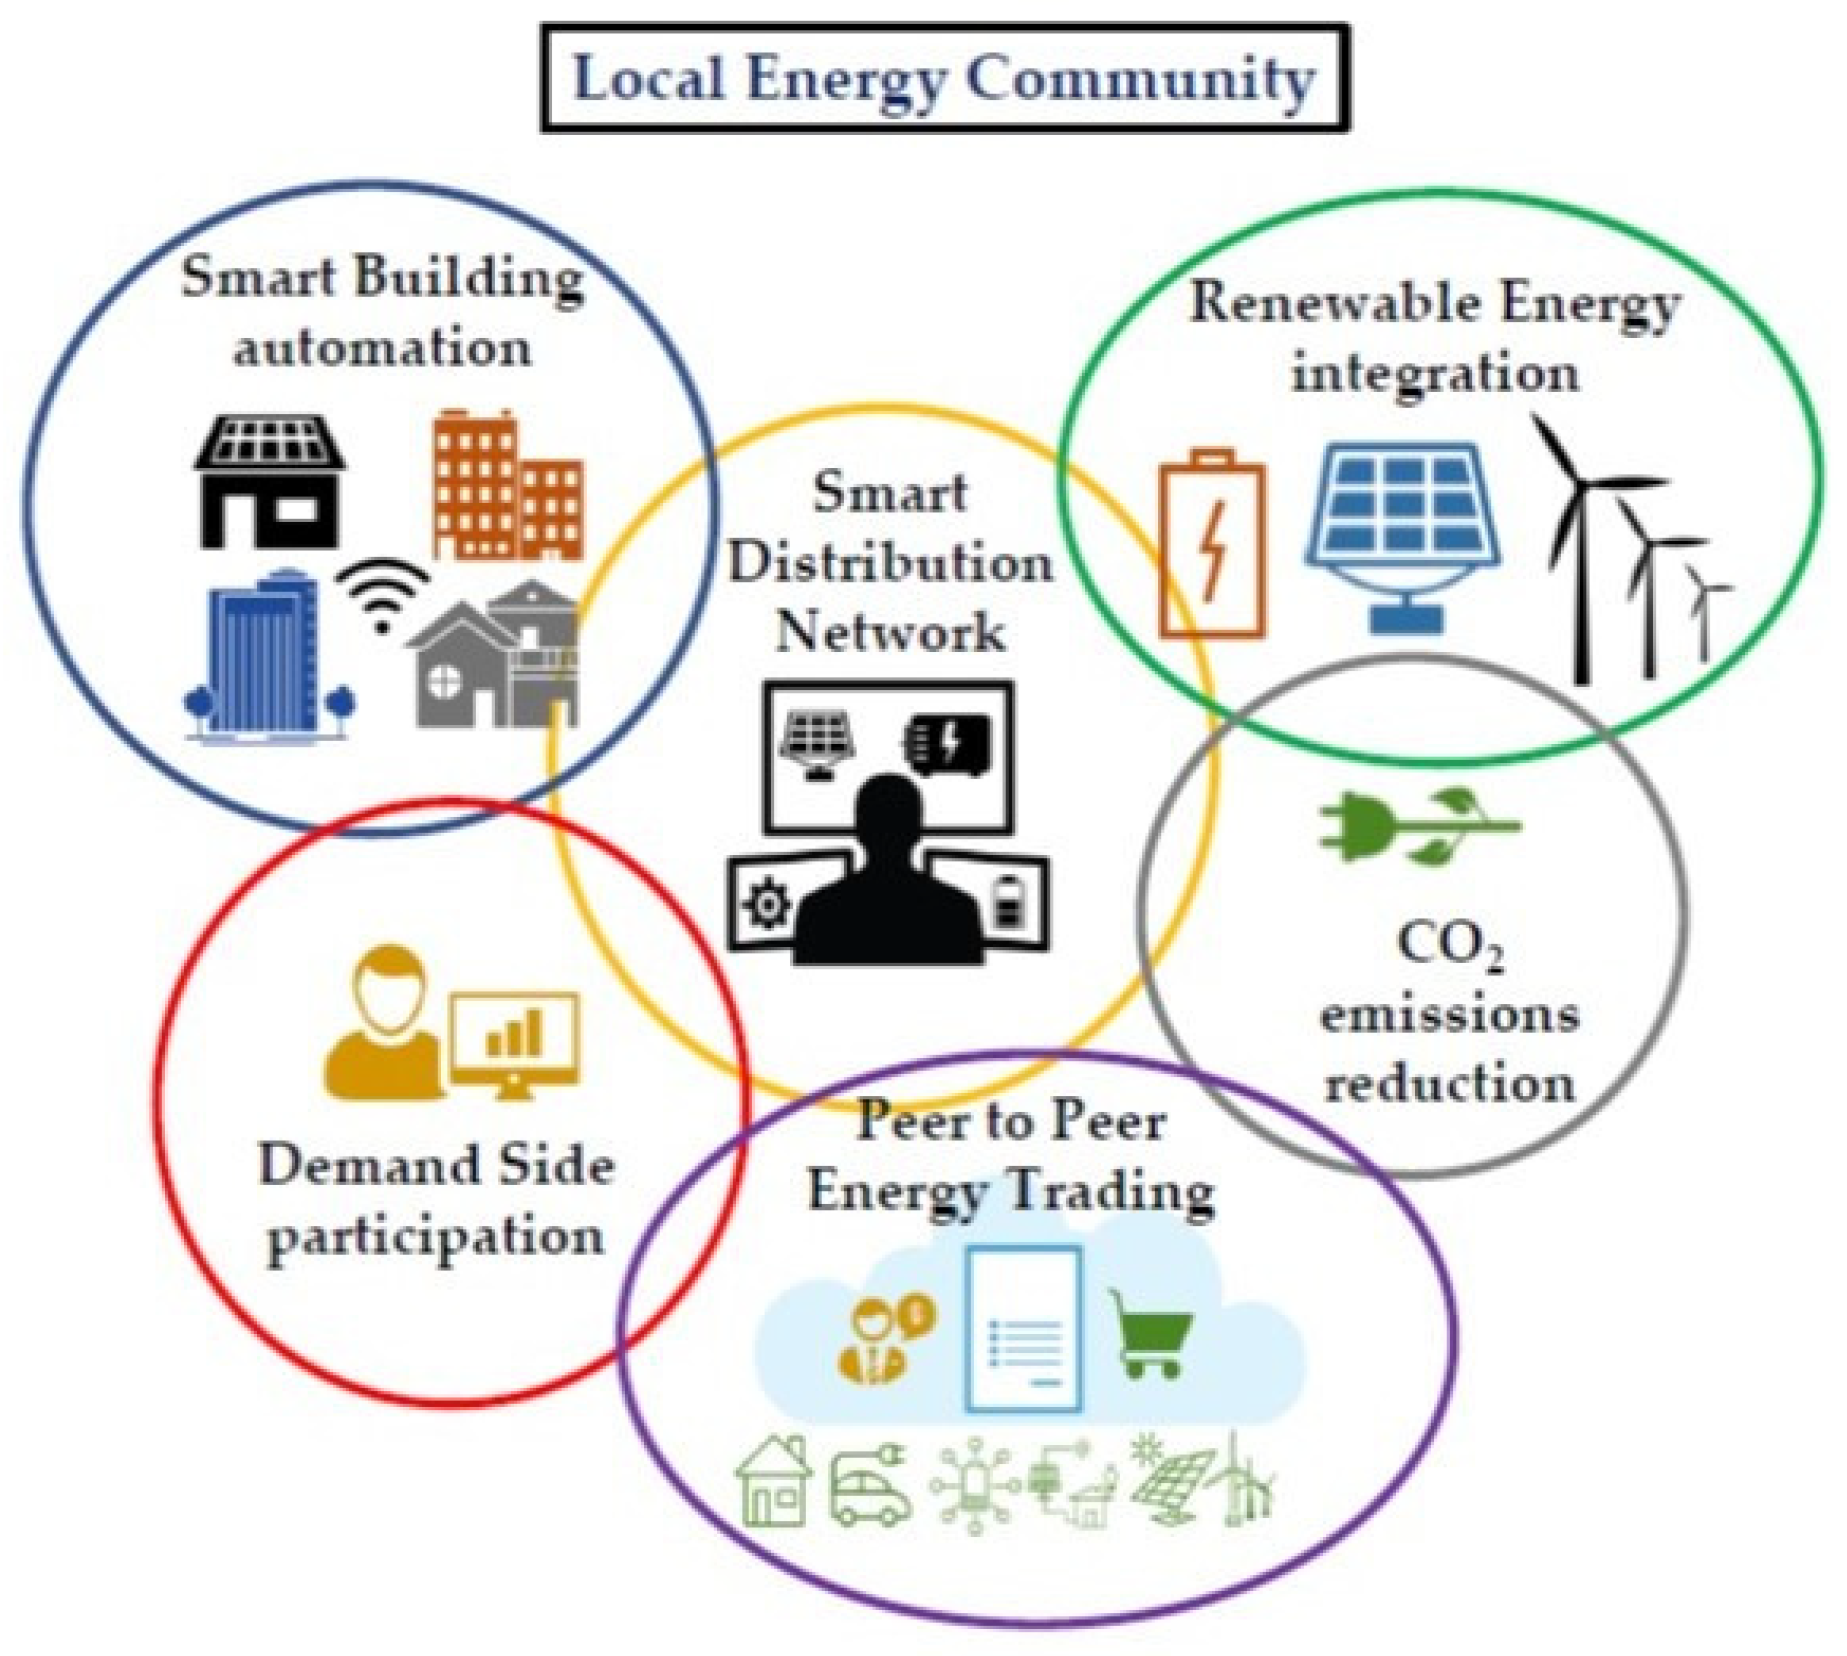
ECs emerge as key instruments in the European energy transition, enabling groups of users to share locally generated renewable energy, enhance self-consumption, and improve grid resilience. A-ISolE pilot tests advanced EC management strategies supported by distributed AI. ECs represent a collaborative model where citizens, businesses, and local administrations unite to produce, share, and consume renewable energy locally. This approach not only promotes energy self-sufficiency but also contributes to reducing greenhouse gas emissions and improving the resilience of electricity grids. An EC is an association of people, businesses, and local administrations that collaborate to produce, exchange, and consume energy locally [70]. Figure 5 in the provided material illustrates the conceptual structure of an EC, showing producers, consumers, and prosumers interacting through a coordinated energy management framework.
Figure 5.
Energy Community [46].
This model allows members to share the benefits of RES production, reducing energy costs and promoting greater energy independence. In an EC, consumers can become “prosumers,” meaning they not only consume energy but also produce it, for example, through PV panels installed on their roofs. The energy produced in excess can be shared with other members of the community or fed back into the grid, creating a virtuous cycle of resource optimization. The EC implementation requires a robust and intelligent management infrastructure capable of monitoring energy flows in real-time, optimizing production and consumption, and managing exchanges between members. AI plays a crucial role in this process, enabling precise forecasting of energy demand and supply, optimizing the use of energy storage systems, and facilitating peer-to-peer energy trading.
The EC use case focuses on minimizing reliance on external energy supply and maximizing local consumption of PV generation through: (i) optimal scheduling of controllable loads, (ii) coordinated ESS charging/discharging, (iii) energy exchanges among EC members, and (iv) real-time decisions based on forecasts and grid conditions. AI is used to compute the optimal actions across these dimensions. In other words, the EC use case regards the “management of an EC with optimization of energy flows”.
The goal is to design algorithms capable of intelligently managing energy within an Energy Community. The models aim to minimize the overall energy cost for members, considering renewable generation, storage systems, consumption profiles, and interaction with the power grid.
The objective function is as follows:
where the buying energy cost ( is multiplied by the imported energy profile , and is offset by the revenue from the energy sold and from the incentive due to the self-consumption ().
The respective constraints include:
- Power balance:where and are the output and input of the storage system, and and are the PV production and the uncontrollable load of the Energy Community respectively.
- Minimum and maximum power withdrawal from the main grid:where and are the input and output limits, and is a binary variable indicating whether the Energy Community is drawing or supplying power to the grid.
- Maximum charge ( and discharge ( power of the storage system:where is a binary variable indicating whether the battery charging or discharging.
- Constraints related to the dynamics of the storage system’s state of charge:where and are input and output efficiencies, is the nominal energy capacity, and is a known value.
- Minimum and maximum SoC constraints:with and being the storage.
- The final state of charge must be approximately equal to the initial one, within a tolerance:where is the last period of optimization, and the initial state of charge.
- Limit on the number of complete charge and discharge cycles:where is the maximum number of cycles allowed.
- Shared energy (self-consumption) constraintswhere is the PV profile, the storage output, the HVAC load, other types of uncontrollable load, and the input of the storage.
The approach adopted is deterministic and based on MILP, which rigorously models both continuous variables and binary decisions. The approach was implemented in MATLAB-GAMS-CPLEX.
4. Results and Discussion
This section presents the experimental validation of a comprehensive suite of AI algorithms developed within the A-ISOLE project and tests using real operational data from the DEA distribution network and/or the pilot site described in Section 3. In particular, the results for some modules presented in previous sections are discussed in the following.
4.1. Short-Term Load Forecasting
The short-term load-forecasting algorithm was validated in offline mode, using data from the existing experimental DMS. The load measurements with a 15 min granularity were downloaded from the DMS and cover dates from 30 October 2024 to 31 August 2025. The reported results pertain to six substations. The number of neurons in the single neural network is between 3 and 99. The number of networks in the BEM ensemble is between 2 and 70.
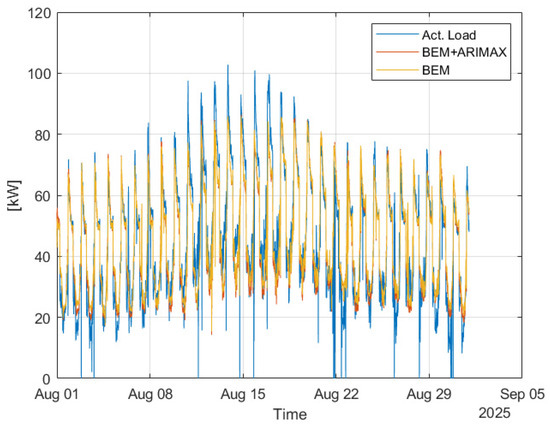
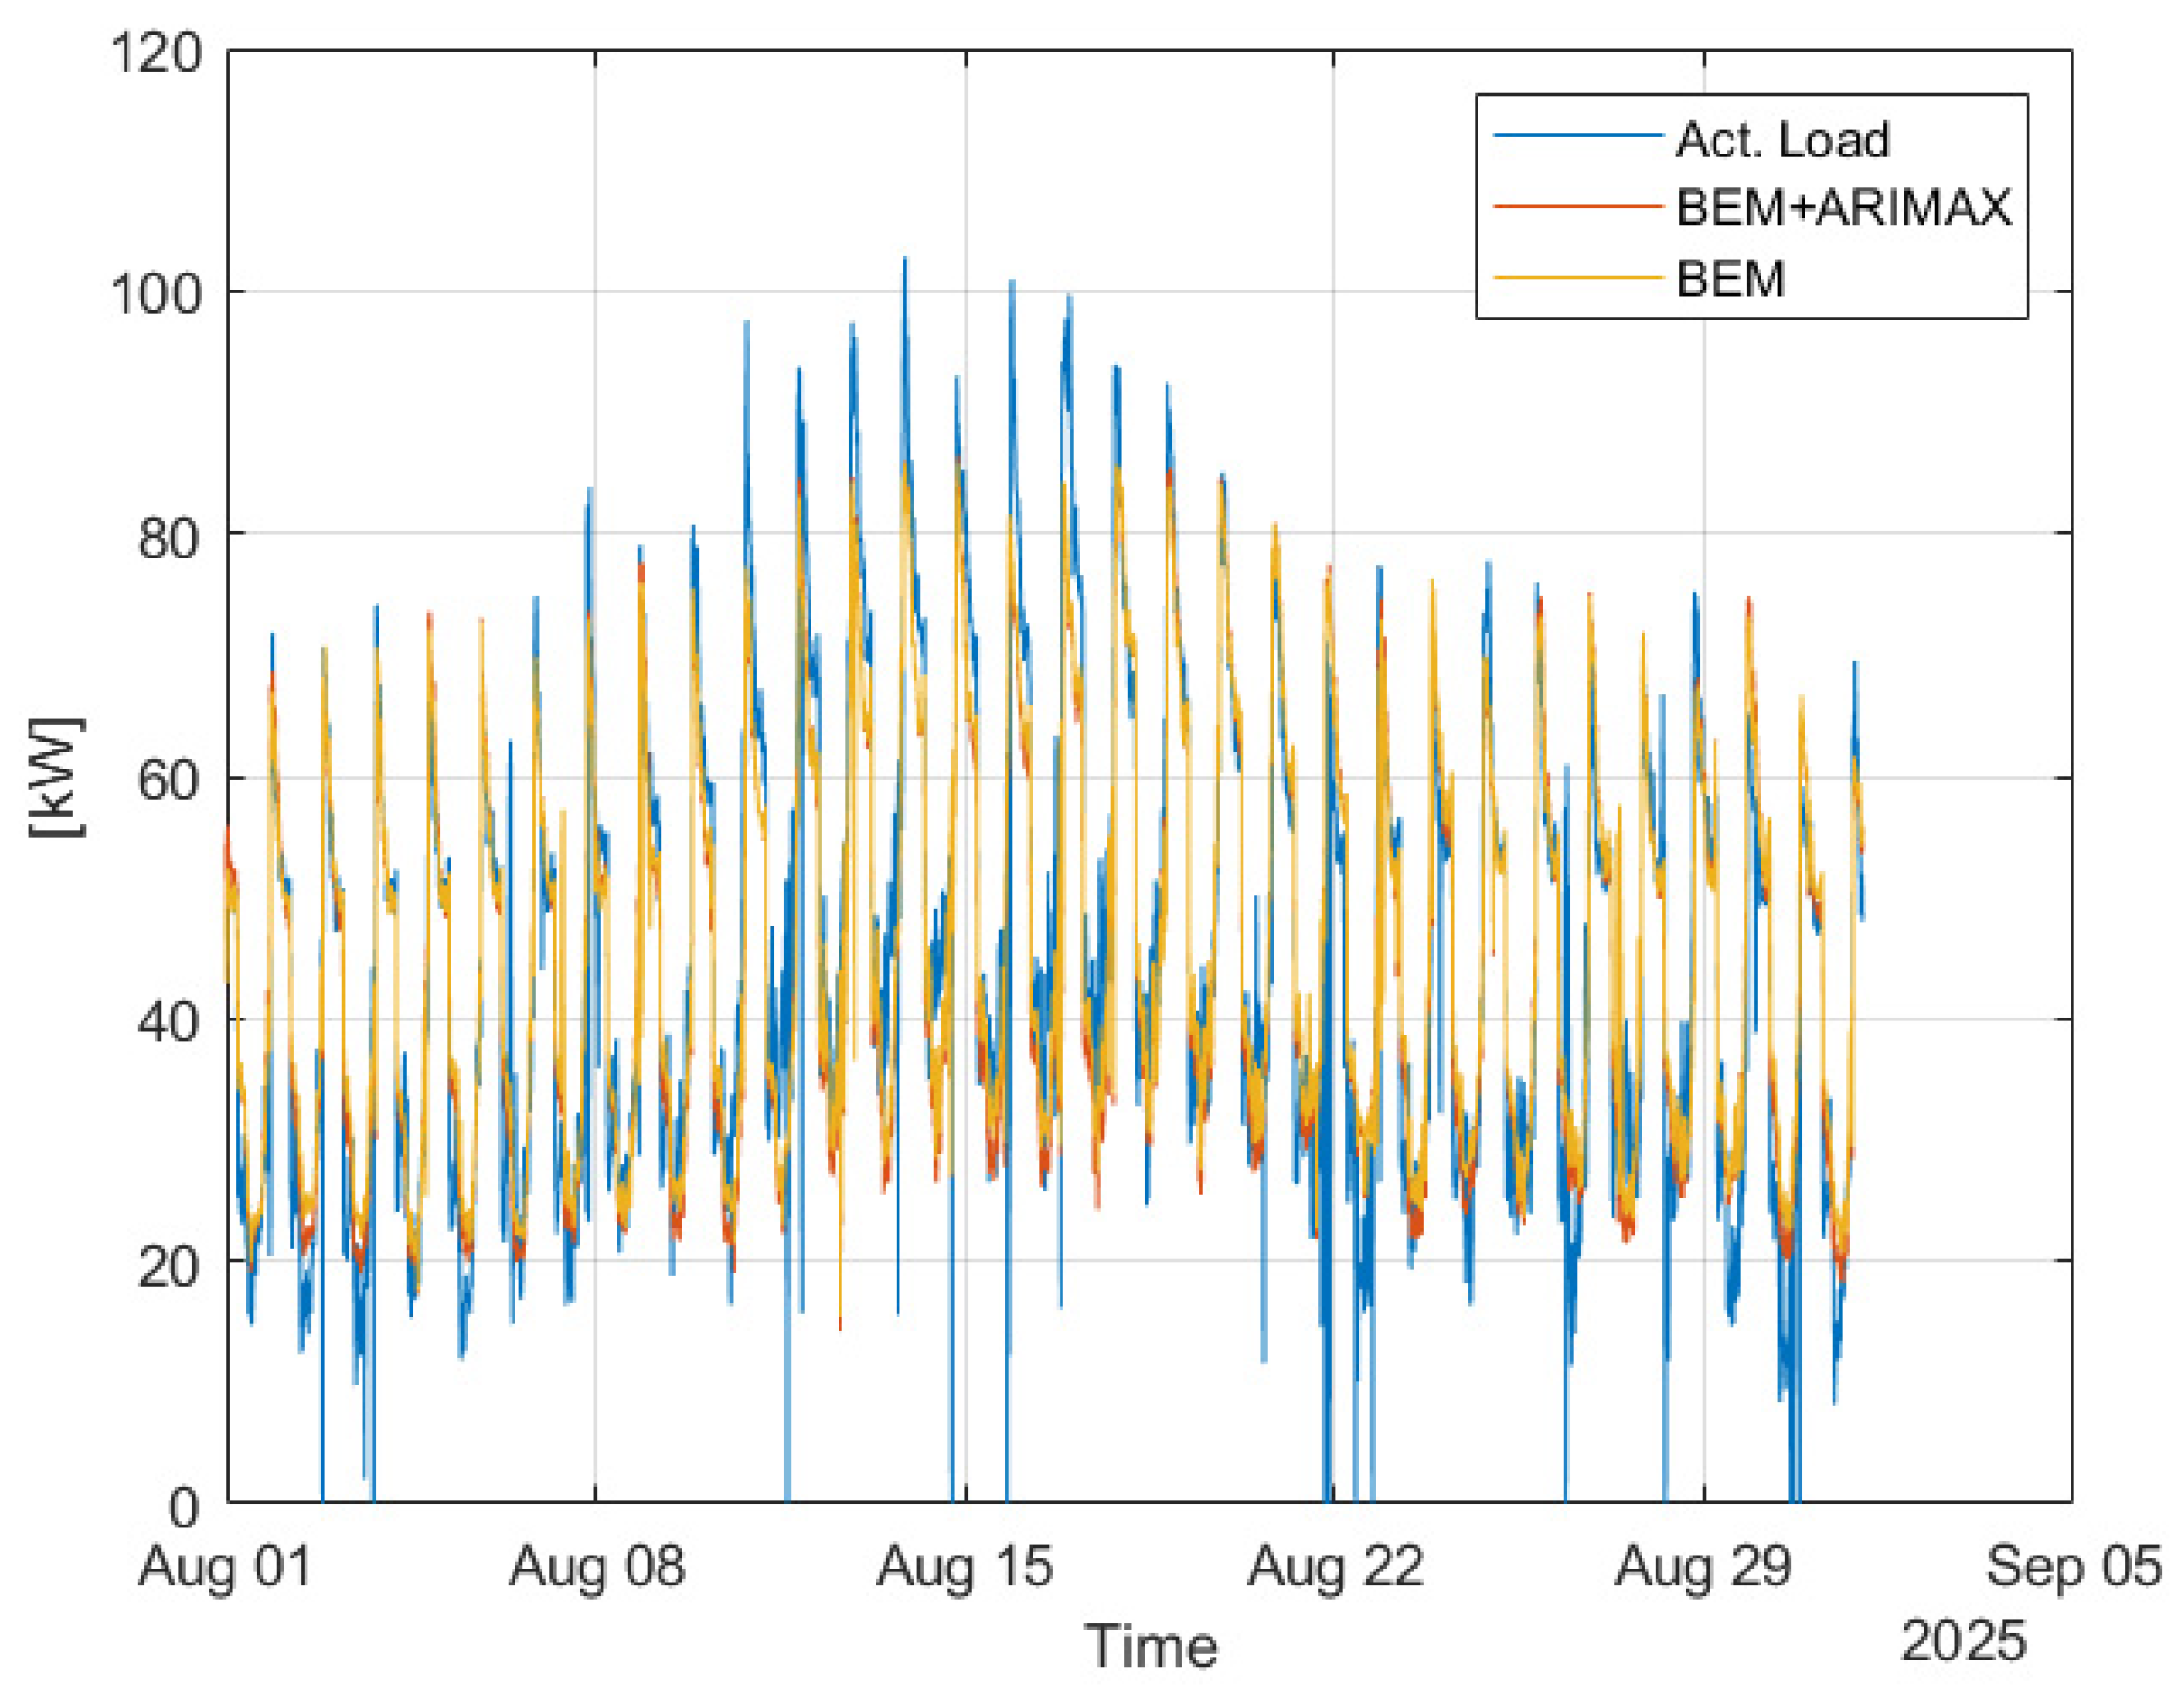
The KPIs used to evaluate this algorithm are the MAE (Mean Absolute Error), MAPE (Mean Absolute Percentage Error) and DPMAPE (Directional Penalized Mean Absolute Percentage Error). MAE is a deterministic accuracy metric used to measure the average magnitude of errors in a set of predictions, without considering their direction, while MAPE is expressed in percentage terms. DPMAPE is an extension of MAPE designed to incorporate directional sensitivity into forecasting error evaluation. It penalizes over-forecasting and under-forecasting differently, which is particularly relevant in energy systems and demand-side applications where error asymmetry has economic consequences. Table 1 shows the results for the short-term load-forecasting algorithm, to highlight the reasonable performance obtained with the proposed approach. Figure 6 shows the load of substation #9 from the test set, along with its BEM (in yellow) and BEM + ARIMAX counterparts.
Table 1.
Short-term load forecasting results.
Figure 6.
Substation 009 load: Comparison between data measured and forecast.
4.2. PV Generation Forecasting
The BEM + ARIMAX model is the same as the one used for load forecasting, although based on a different set of features. In the following, the experimental proof of concept of this algorithm is presented, validated offline, but using data coming from the experimental DMS, which recorded the PV production of two large PV plants in the distribution system: “Pecollo” and “Villa Ada”.
The meteorological data corresponding to the period in which PV production data were available, collected with a 3 h granularity, was interpolated to match the granularity of the PV production data, which is 15 min. In addition, after inspection, some days (42 in total) were removed due to missing PV production data, particularly around January. The features used for the decision trees in the hybrid method include all BEM features, except for the quarter-hour within the day and rainfall.
The hyperparameters of CSM (such as the Direct Horizontal Irradiance—DHI—model to be used) are computed on the training set; the hyperparameters of CCSM are also determined on the training set. BEM uses the first validation set to determine the number of neurons (from 3 to 99) and the number of networks in the ensemble, while ARIMAX uses the second validation set. The third validation set is used for the hybrid method. The test set is used exclusively for the final results.
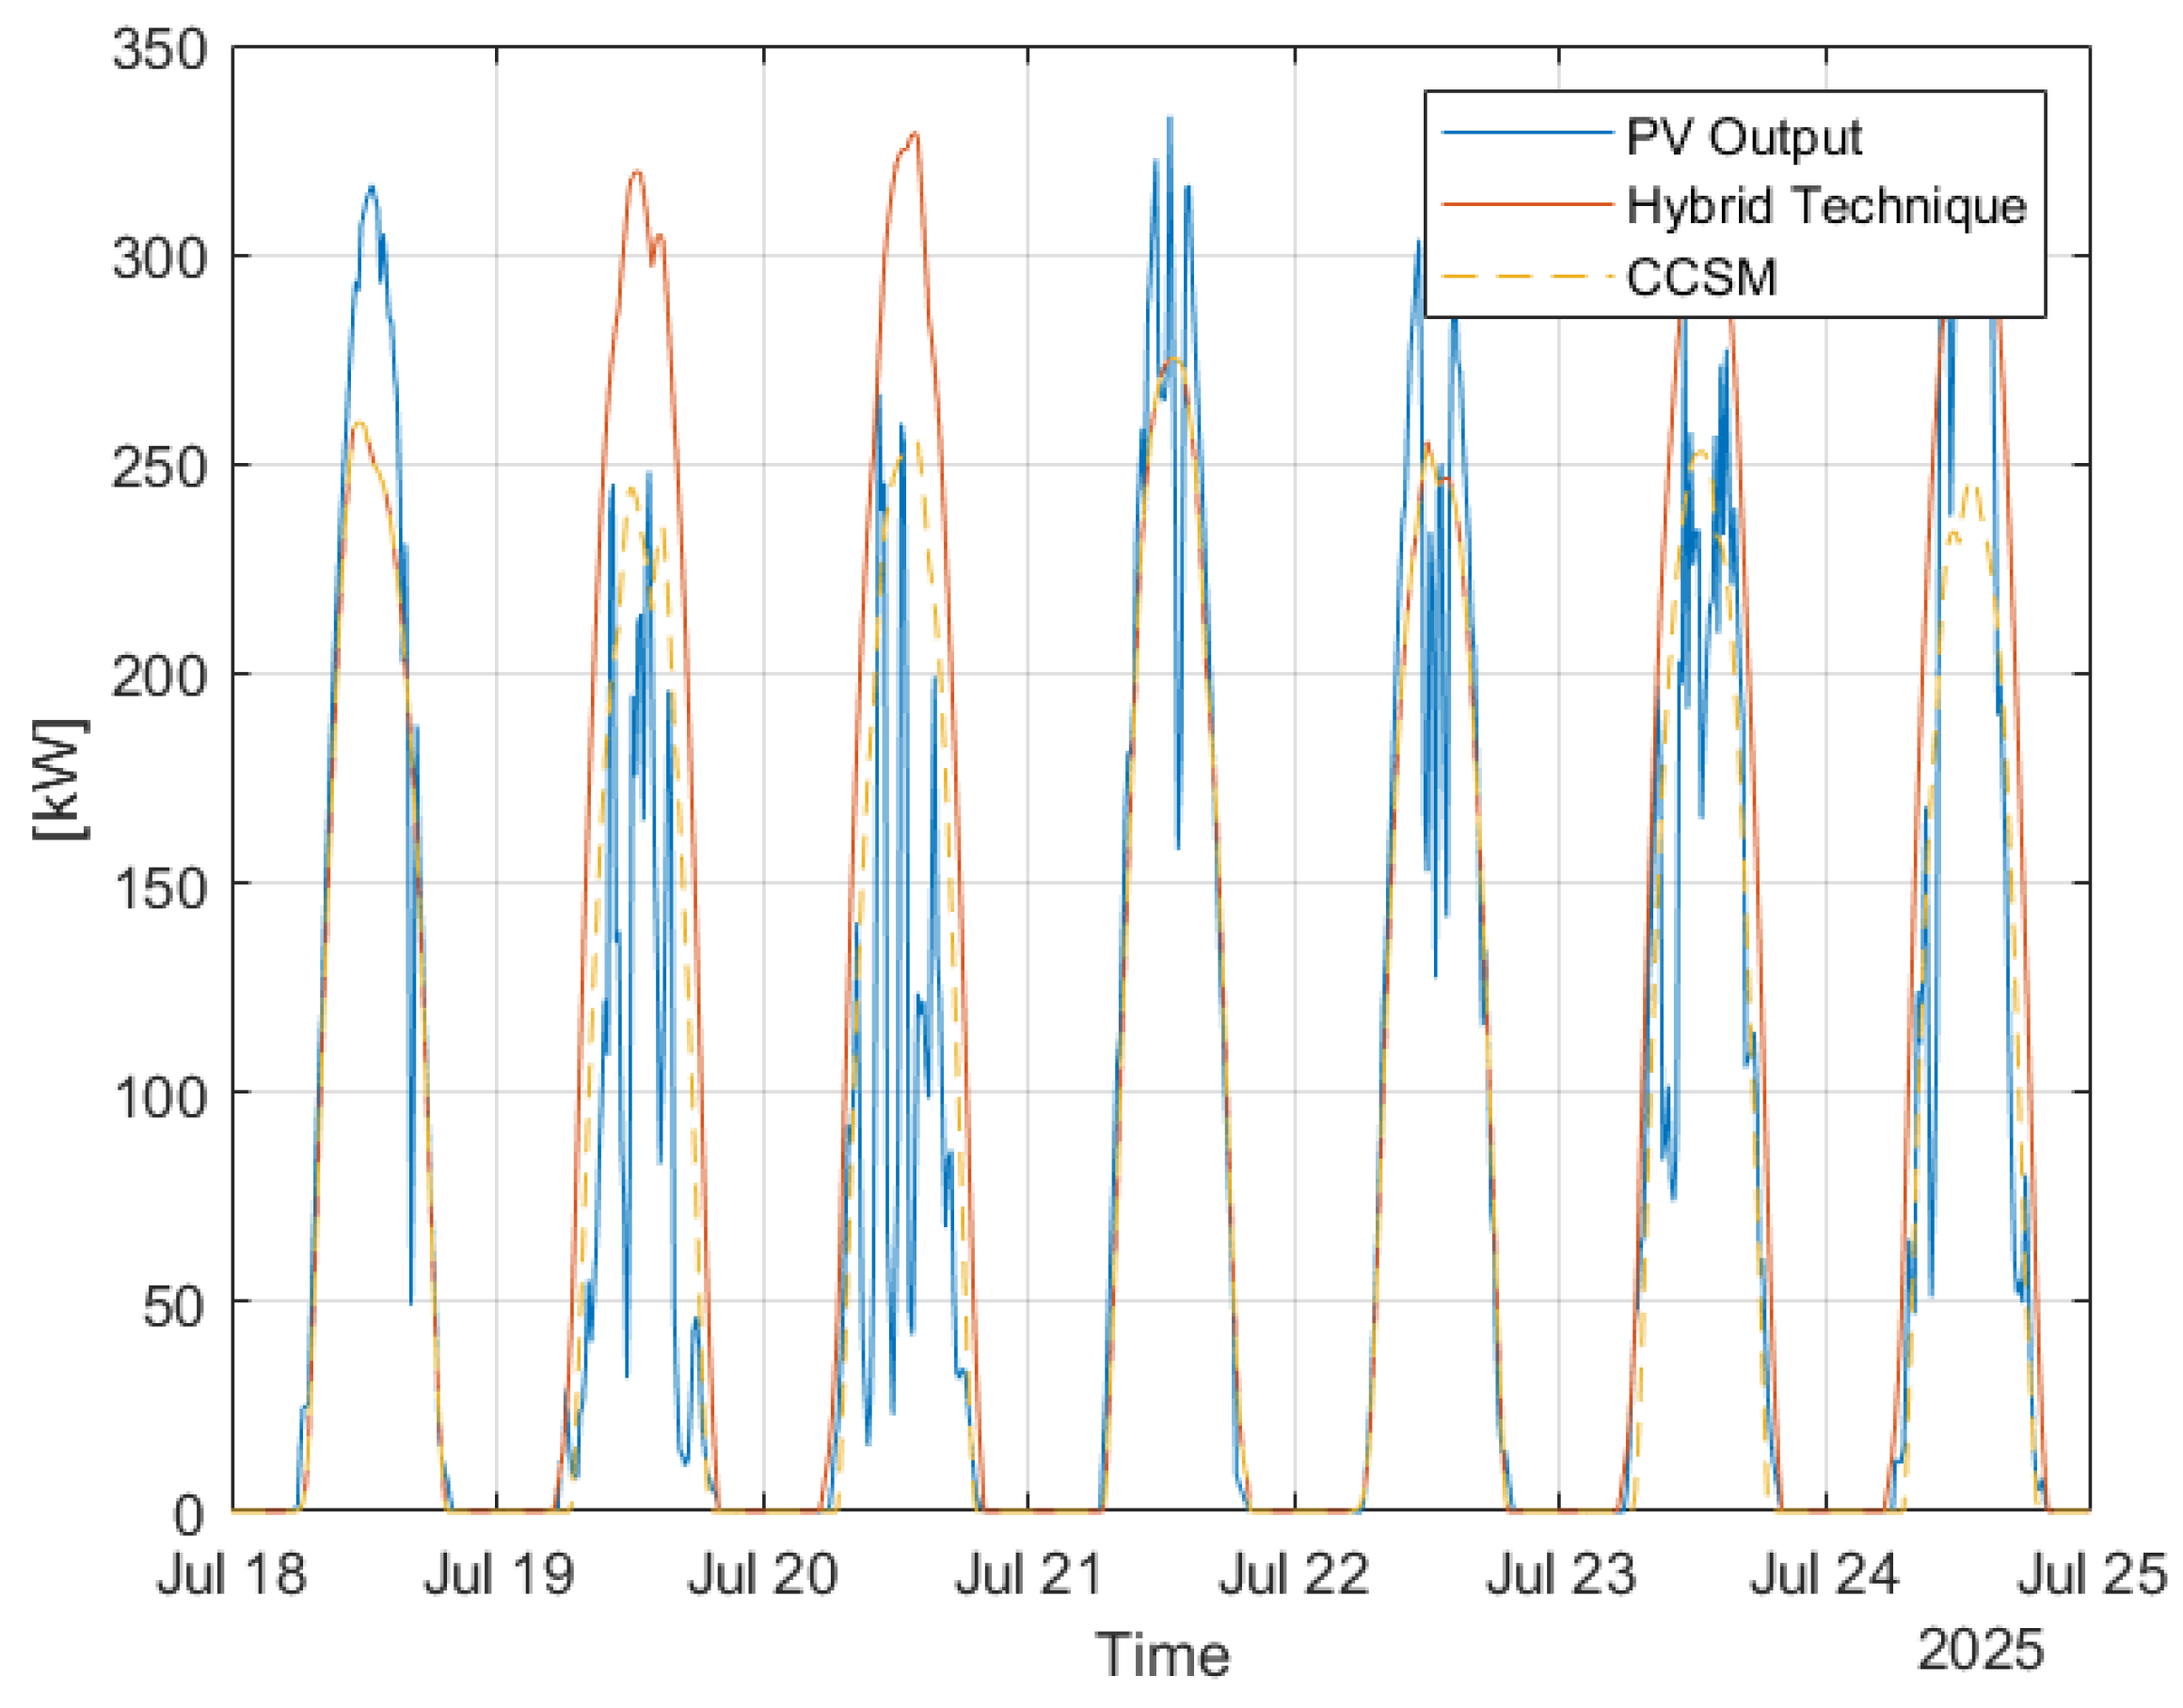
Table 2 shows the KPIs of the various methods; the best method is CCSM. The KPIs used to evaluate PV forecasting algorithms are the MAE and the Root Mean Square Error (RMSE). RMSE is a quadratic loss metric used to quantify the dispersion of prediction errors; it measures the square root of the average squared differences between predicted and actual values. Also in Table 2, ‘Hybrid 15 by 15’ is the hybrid method, but selected every 15 min, not every day. In Figure 7 are reported the results of the CCSM (the best method) and the standard hybrid technique.
Table 2.
KPIs for Pecollo/substation.
Figure 7.
Test set results of the hybrid method vs. CCSM–Pecollo.
4.3. Fault Detection and Localization
Real faults cannot be artificially generated on the effective distribution network; therefore, the Fault Detection and Localization algorithm was tested entirely in a simulation environment. The DEA distribution network model, implemented in DigSilent, was used for all simulations. Several fault types were simulated: LG (single-phase-to-ground), LL (two-phase), LLG (two-phase-to-ground), LLL (three-phase), and LLLG (three-phase-to-ground), with fault impedances being randomly varied. The adopted procedure generated 75,095 fault samples (80% training, 10% validation, 10% test). For the faulty-node classifier, the input features include topological information, fault type, and sequence voltage measurements; for the fault type classifier, only topological information and sequence voltages are used.
Among all models, XGBoost exhibited the best performance in faulty node classification, achieving good F1-scores (Table 3). Traditional classifiers such as kNN and SVM were also tested but achieved lower performance and are therefore not recommended for this type of application.
Table 3.
KPIs for fault node classification.
4.4. Load Modeling
The load-modeling algorithm, based on BEM + ARIMAX and clustering, produced accurate pseudo-measures for state estimation, with MAPE values of 3–6% on unseen substations. The forecasting modules were first validated offline using historical data from multiple substations. The hybrid load-forecasting approach reduced the Mean Absolute Percentage Error compared to baseline building energy models, particularly for substations characterized by pronounced daily patterns and temperature sensitivity.
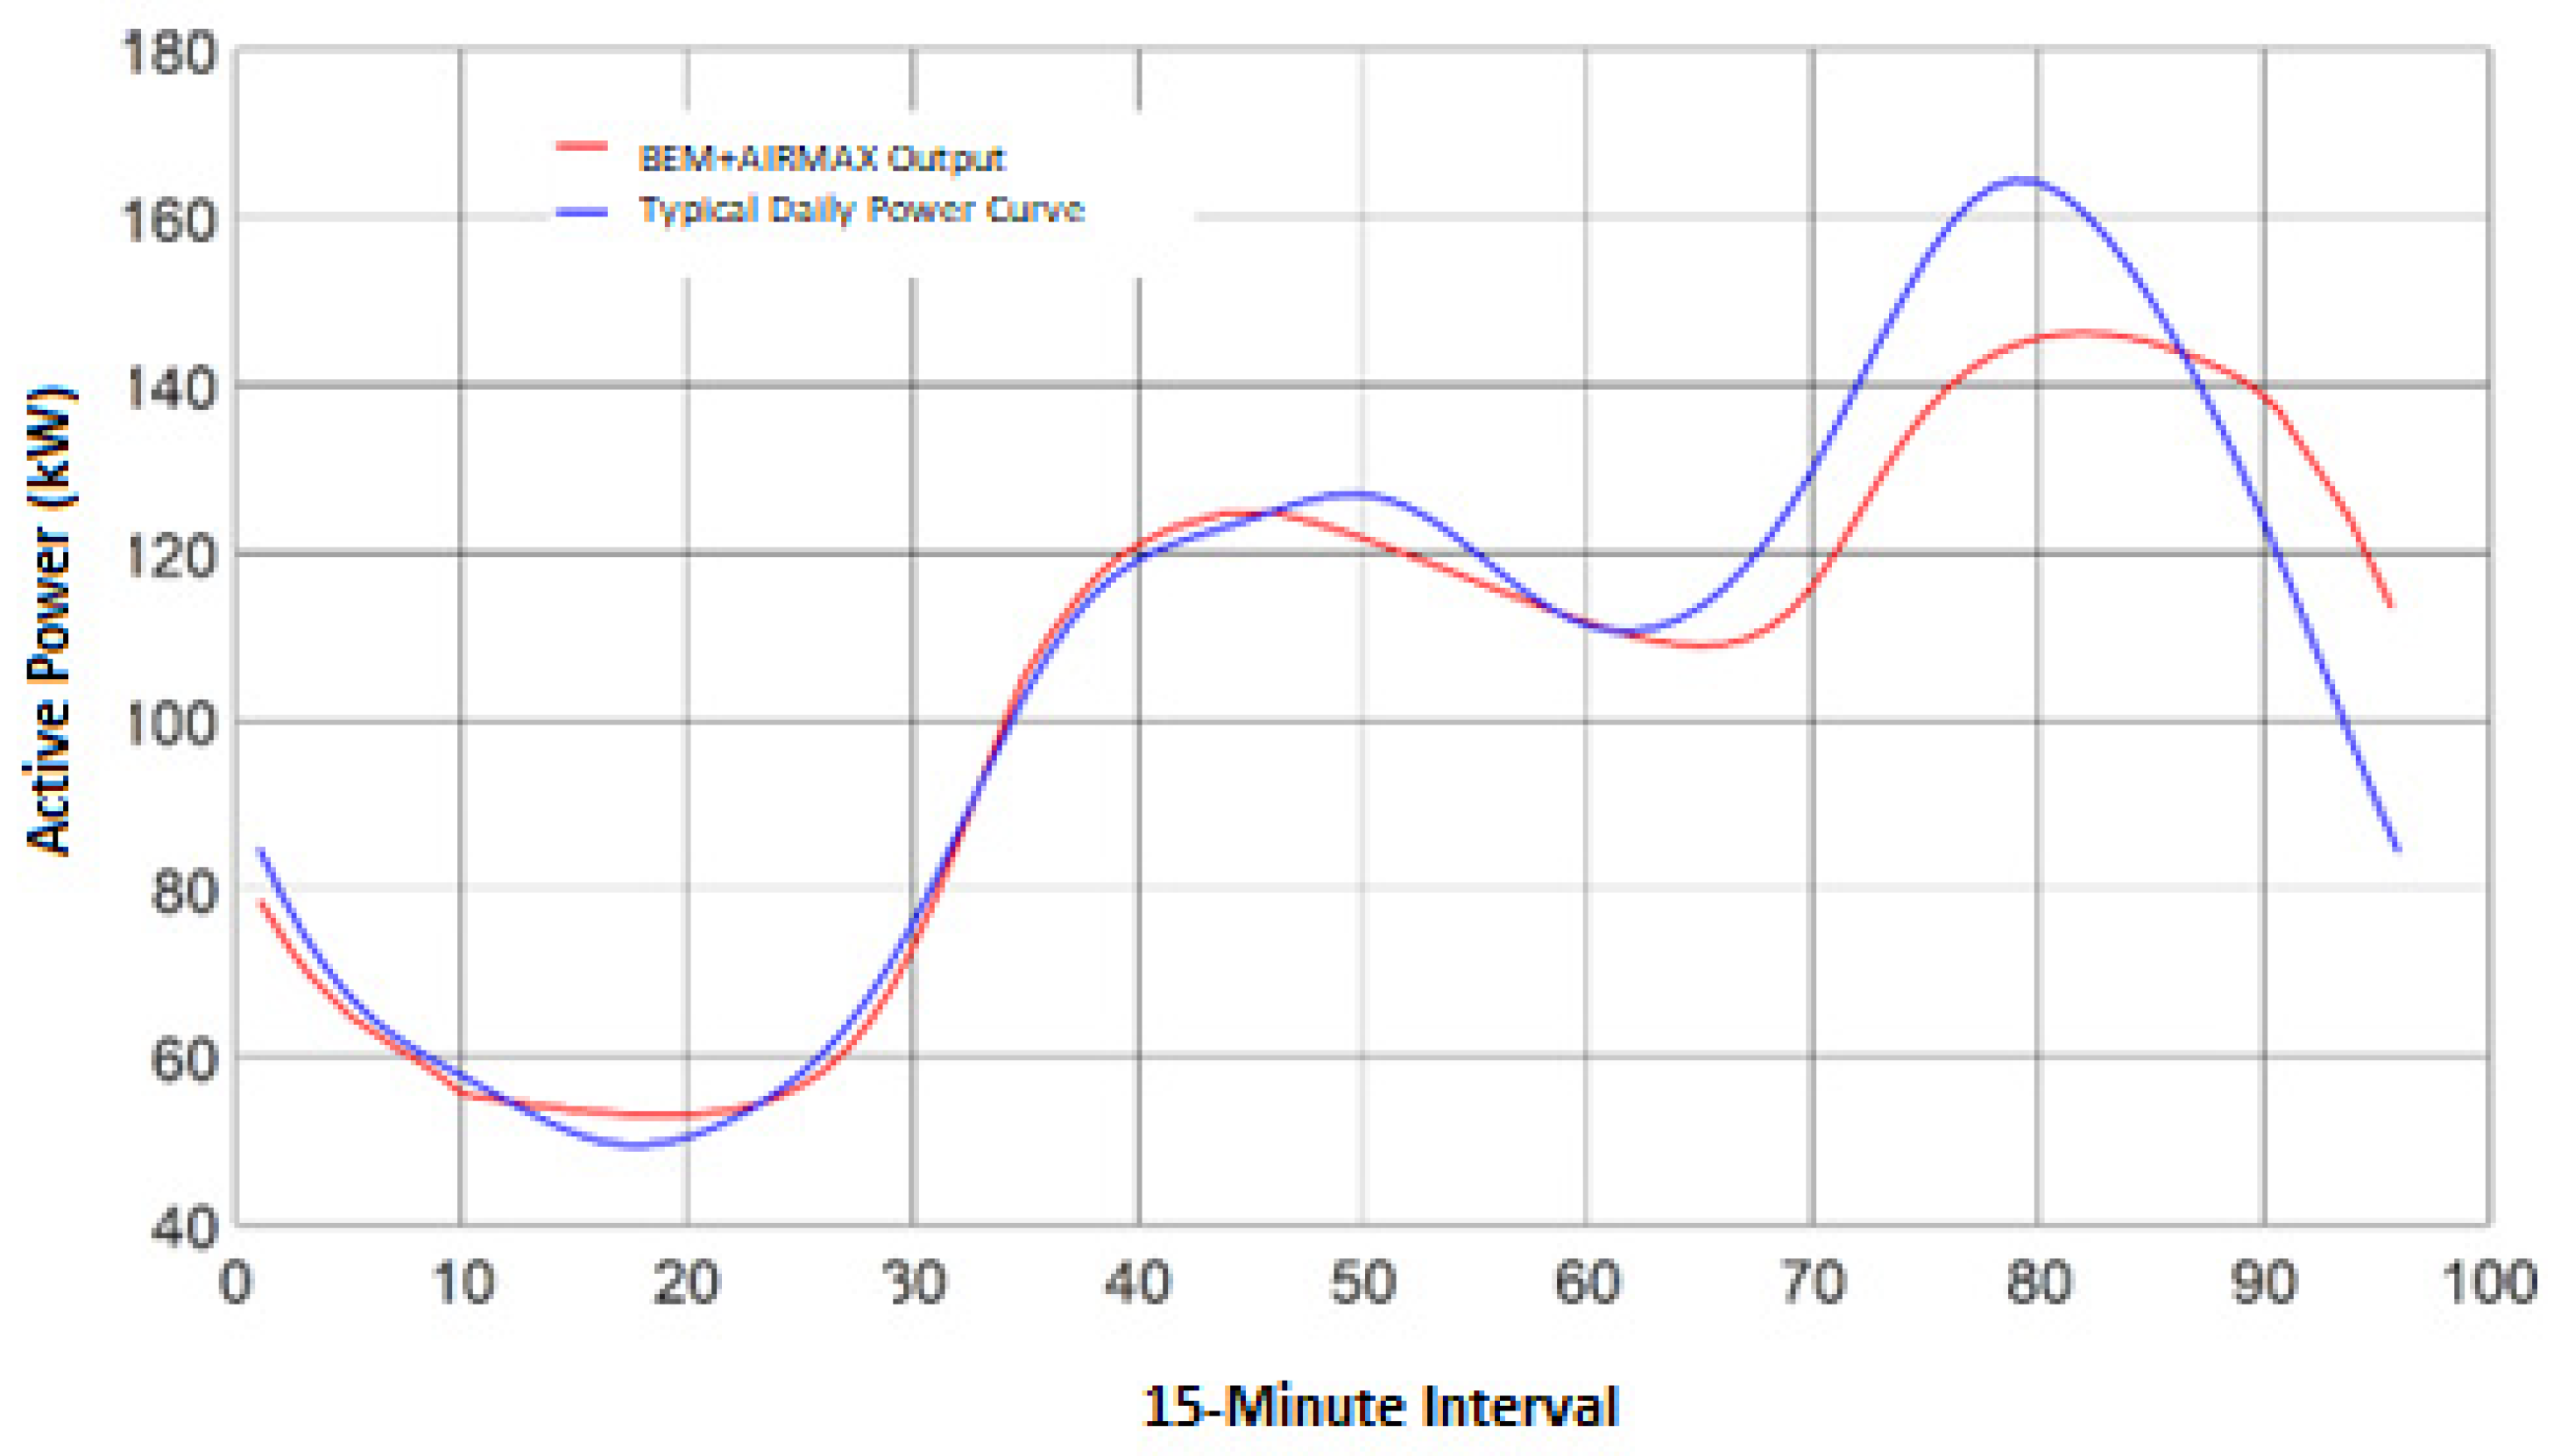
Figure 8 shows the output of the load-modeling algorithm (red curve) for a single substation, compared with the typical daily power curve (blue curve), obtained by averaging actual consumption over each 15 min interval for the 96 quarters of an hour of a day, smoothed by Fourier decomposition, as described in [12]. As is apparent, the load-modeling algorithm can estimate with good precision the smoothed load shape.
Figure 8.
Load modeling results for a substation (weekday).
The algorithm under consideration will be used for generating the pseudo-measurements required for the operation of the state estimation algorithm, in order to ensure the observability of the DEA network. It is important to highlight that the adopted procedure is based on an ensemble of ANNs, combined with an ARIMAX approach and a data clustering technique based on k-means. The performance of the load-modeling algorithms was evaluated using MAPE and MPE (Maximum Percentage Error—Maximum value of MAPE within the test set). Table 4 shows the results obtained.
Table 4.
Load modeling performances.
In this case as well, the result is satisfactory, and the trend of the curve predicted by the load-modeling algorithm compared with the typical one obtained by averaging actual consumption for each 15 min interval is very similar. The numerical results show a satisfactory outcome. The comparison highlights a very close alignment between the predicted and typical load curves, as well as an accurate modeling of daily load patterns, peaks, and transitions. Overall, the load modeling results are considered satisfactory. In quantitative terms, performance significantly improves upon the load-modeling methodology previously developed, demonstrating advances in algorithm design and feature selection.
4.5. Energy Community Use Case
The parameters used for the simulation are as follows:
- Buying cost of energy: 1.0 €/kWh for all time intervals;
- Sell cost of energy: 0.8 €/kWh for all time intervals;
- REC incentive: 0.10 €/kWh for all time intervals;
- A 6 kW import limit from the grid;
- A 9 kW limit export from the grid;
- Maximum charge and discharge limit of the storage: 2 kW;
- Efficiency of charge and discharge of the storage: 0.95;
- Nominal capacity of the battery: 2 kWh;
- State-of-charge (SoC) limits: 10% and 90% of nominal capacity;
- Tolerance of 10% on final SoC difference;
- Maximum number of charging/discharge cycles: 10.
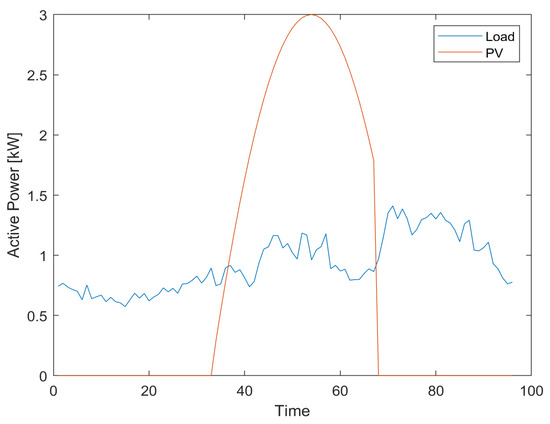
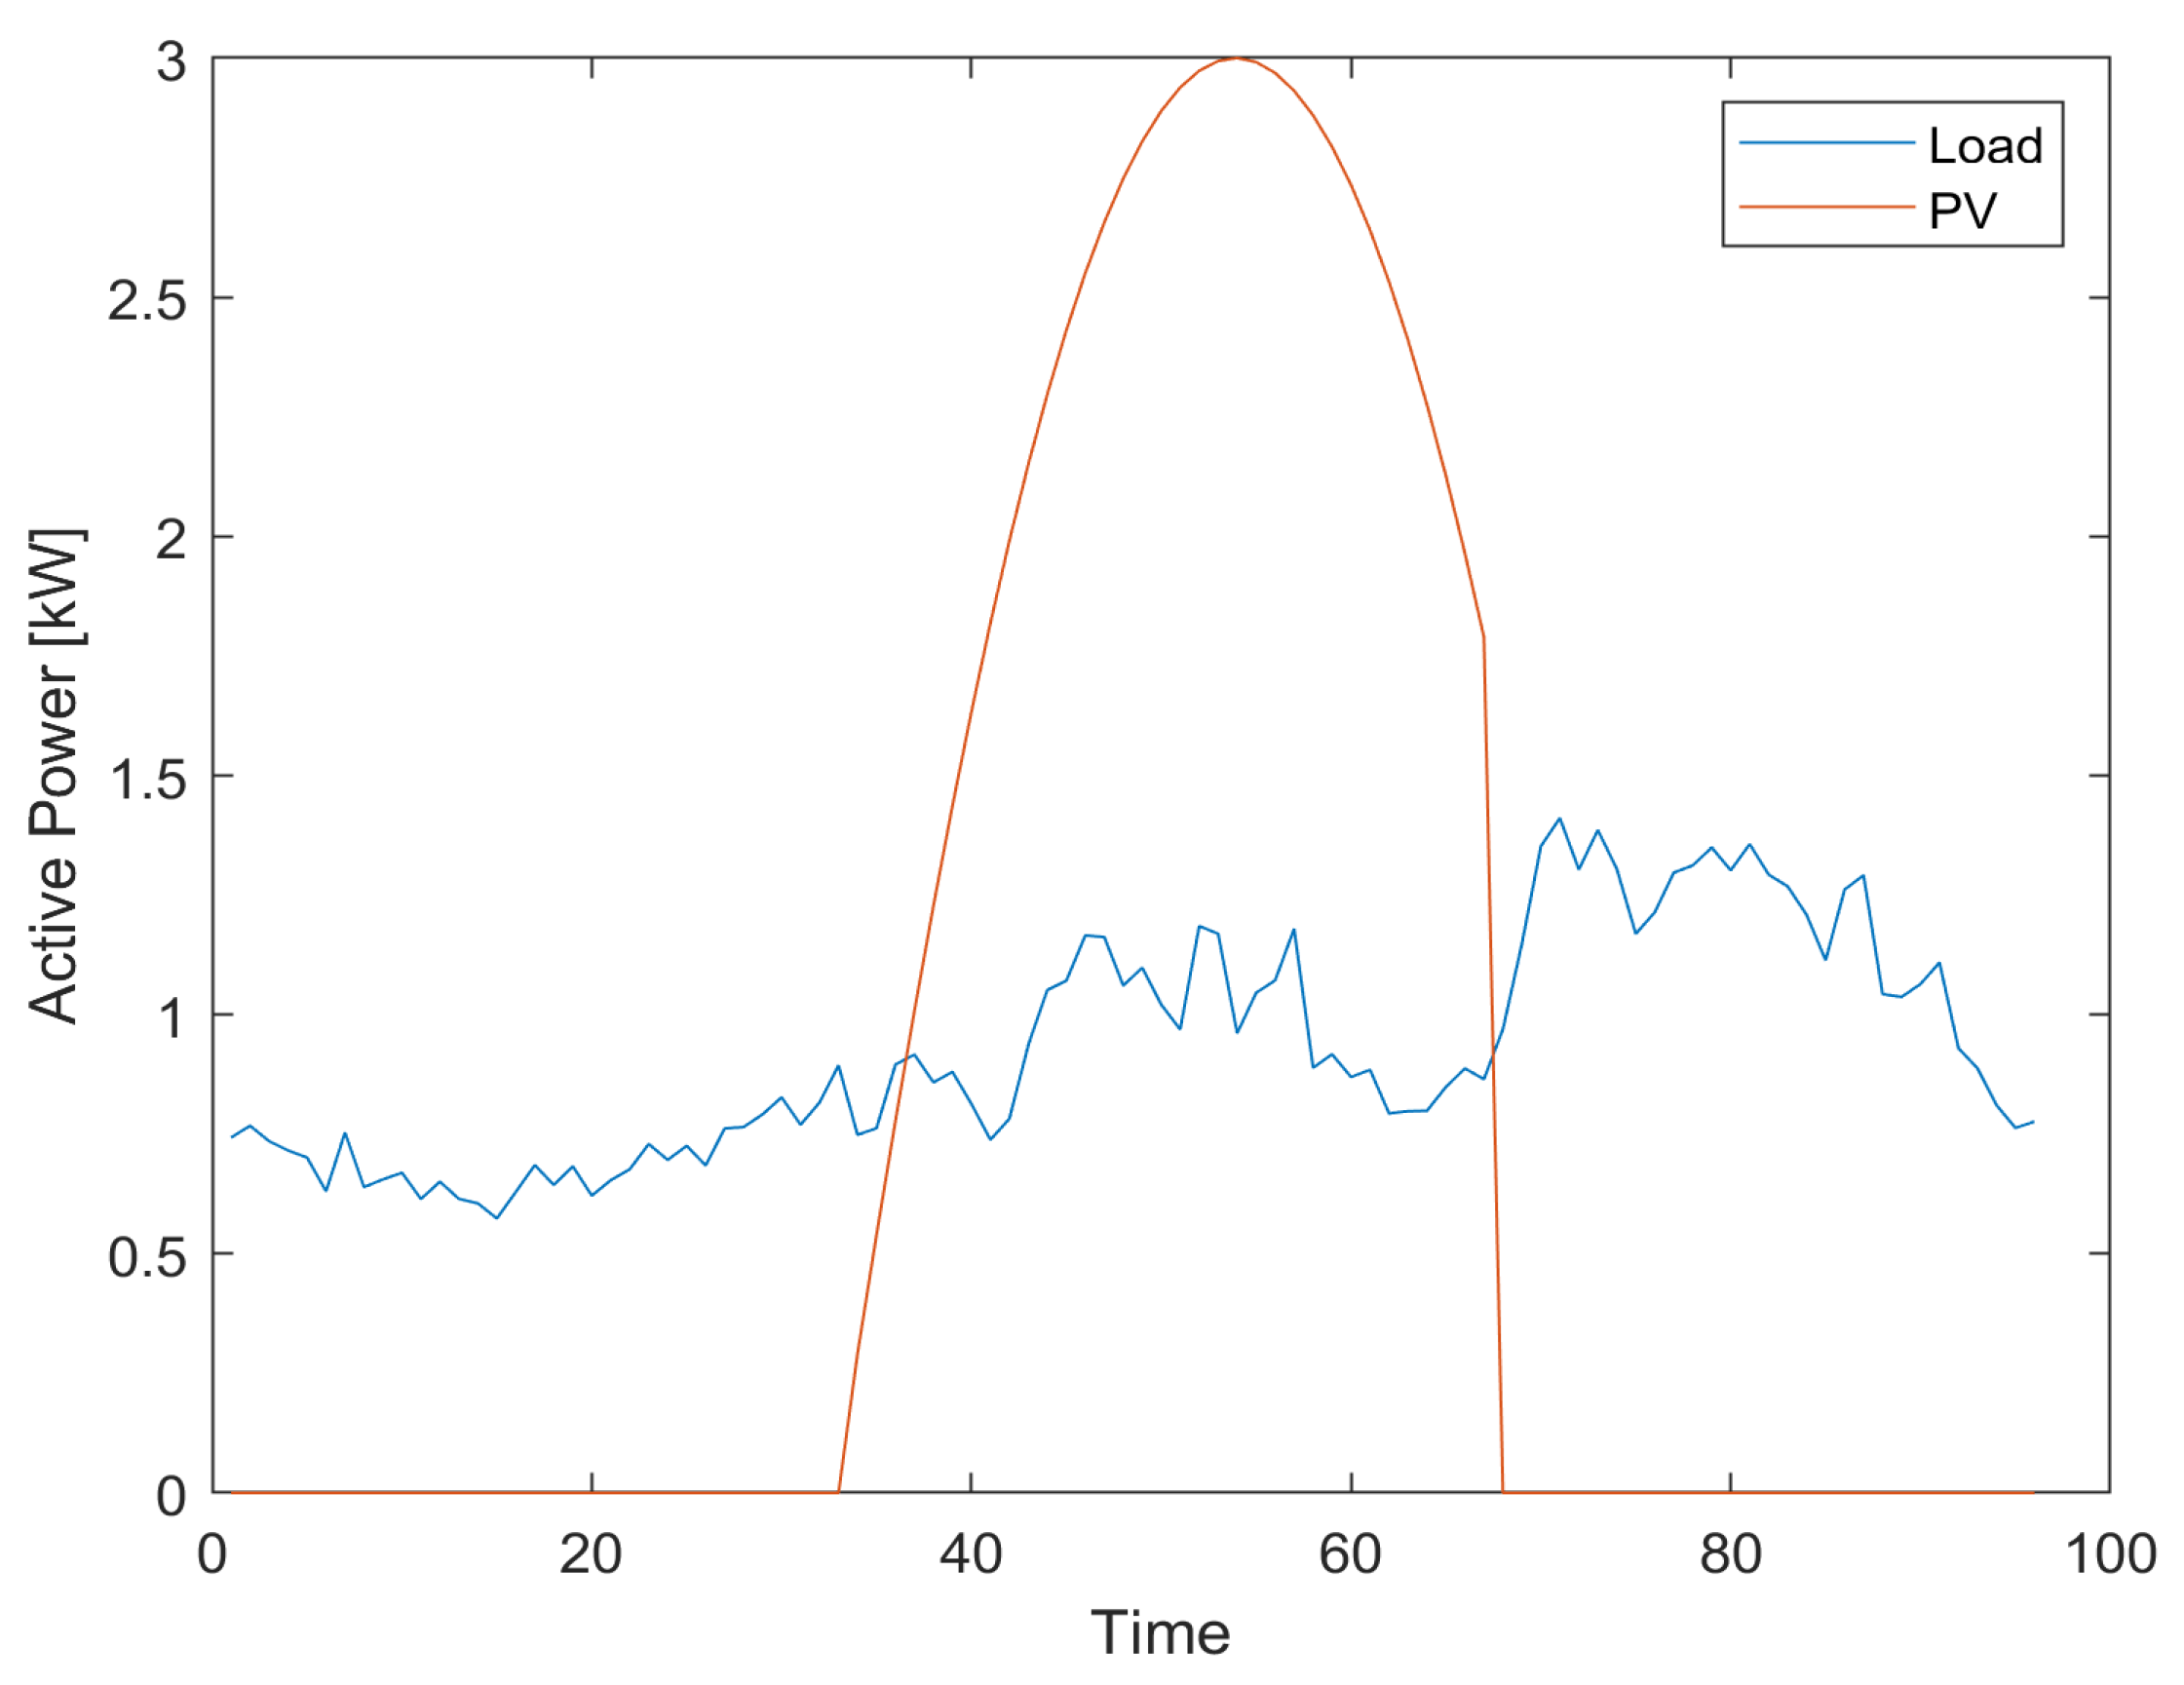
Similarly, the load and PV daily profiles (kW of load and production throughout the 96 quarters of an hour of the day) adopted as input can be visualized in Figure 9. Accordingly, the following remarks can be made:
Figure 9.
Load and PV, inputs of the optimization case.
- Before the middle part of the day, the only way to maximize the self-consumption is to either discharge the battery or, with a monetary cost, to import energy;
- In the middle part of the day, some self-consumption is naturally possible—the excess of produced PV energy can be either sold or used to recharge the battery;
- In the latter part of the day, the situation is the same as the previous part, but with the battery possibly recharged.
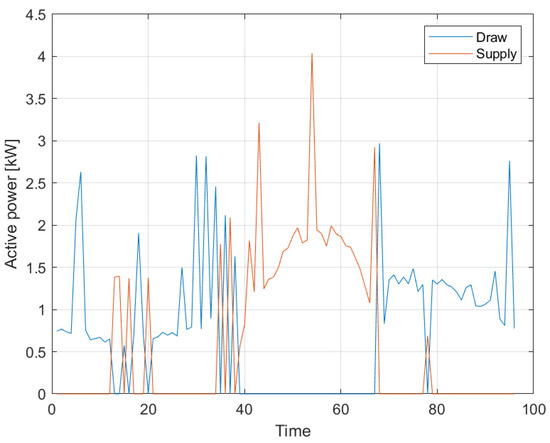
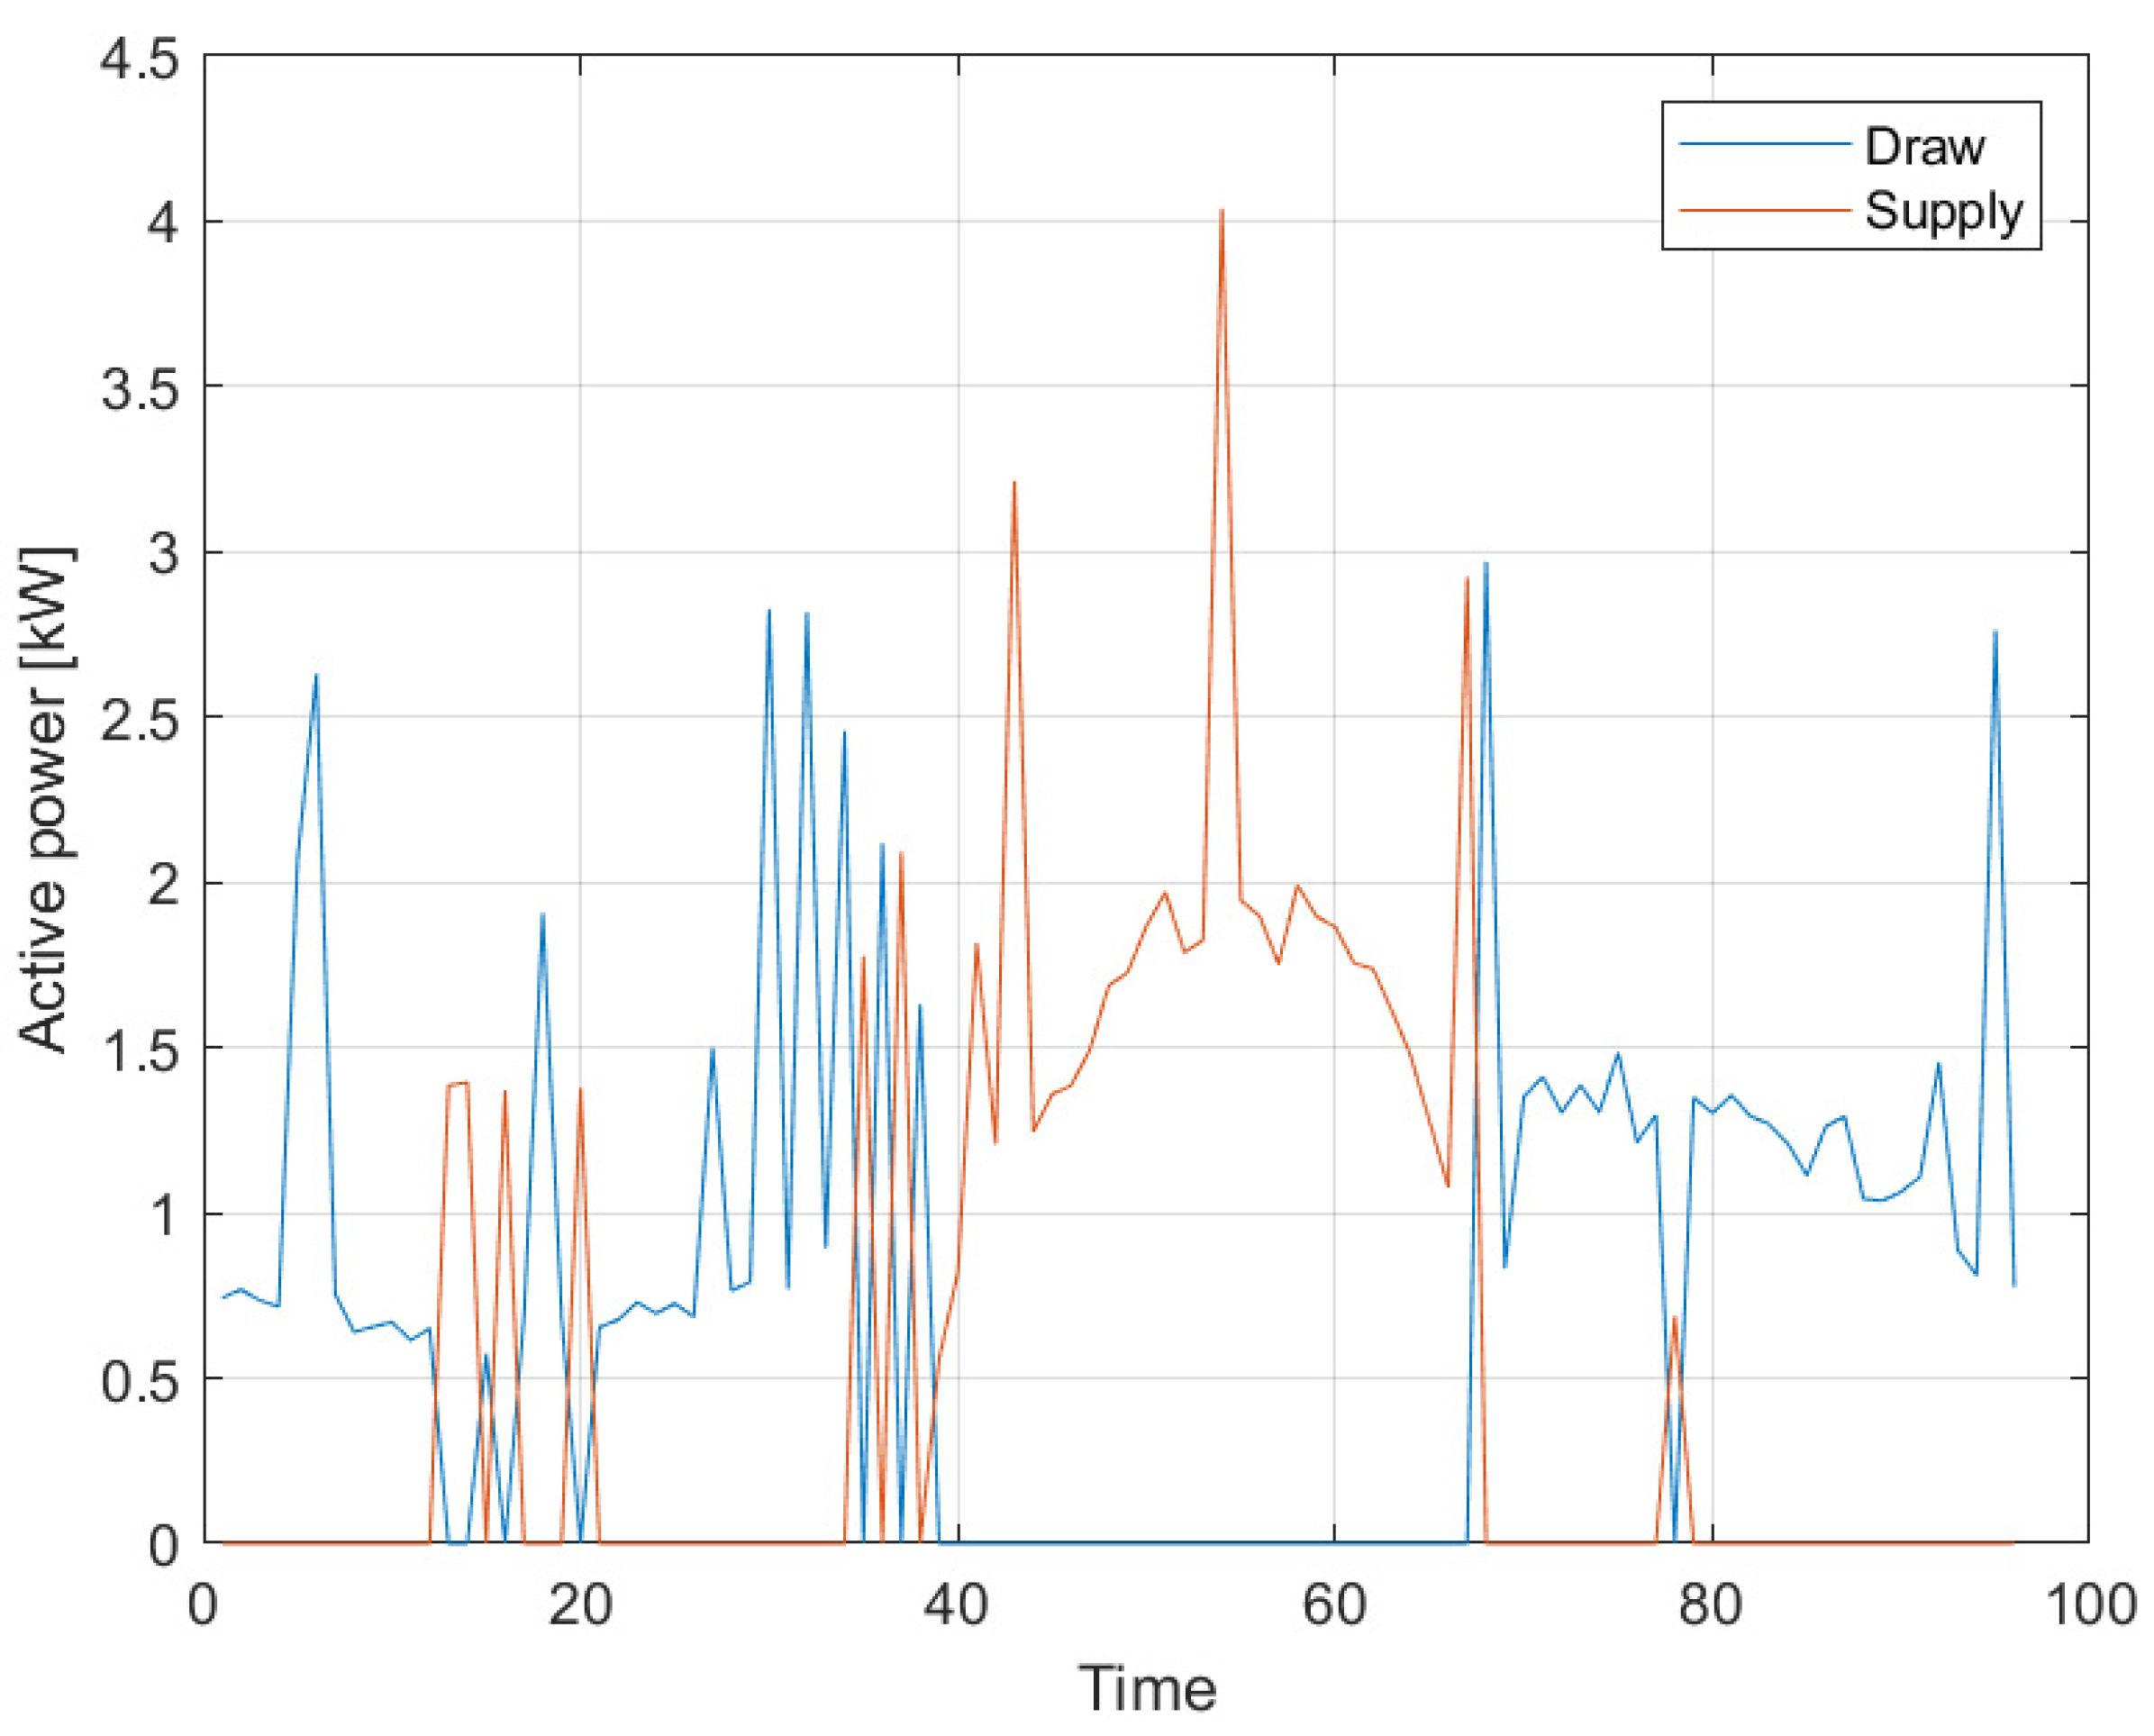
Figure 10 reports the results of the simulation (draw and supply from/to the grid).
Figure 10.
Exchanges of energy with the grid.
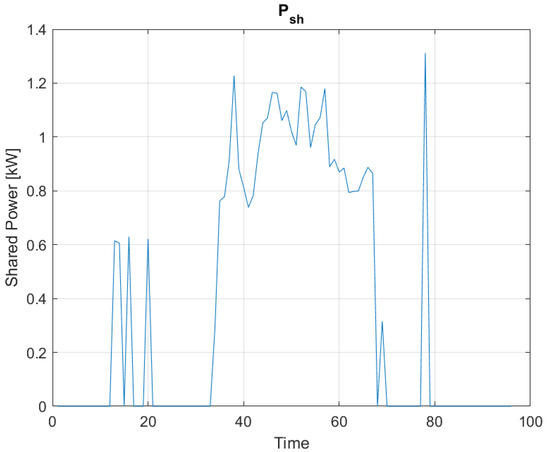
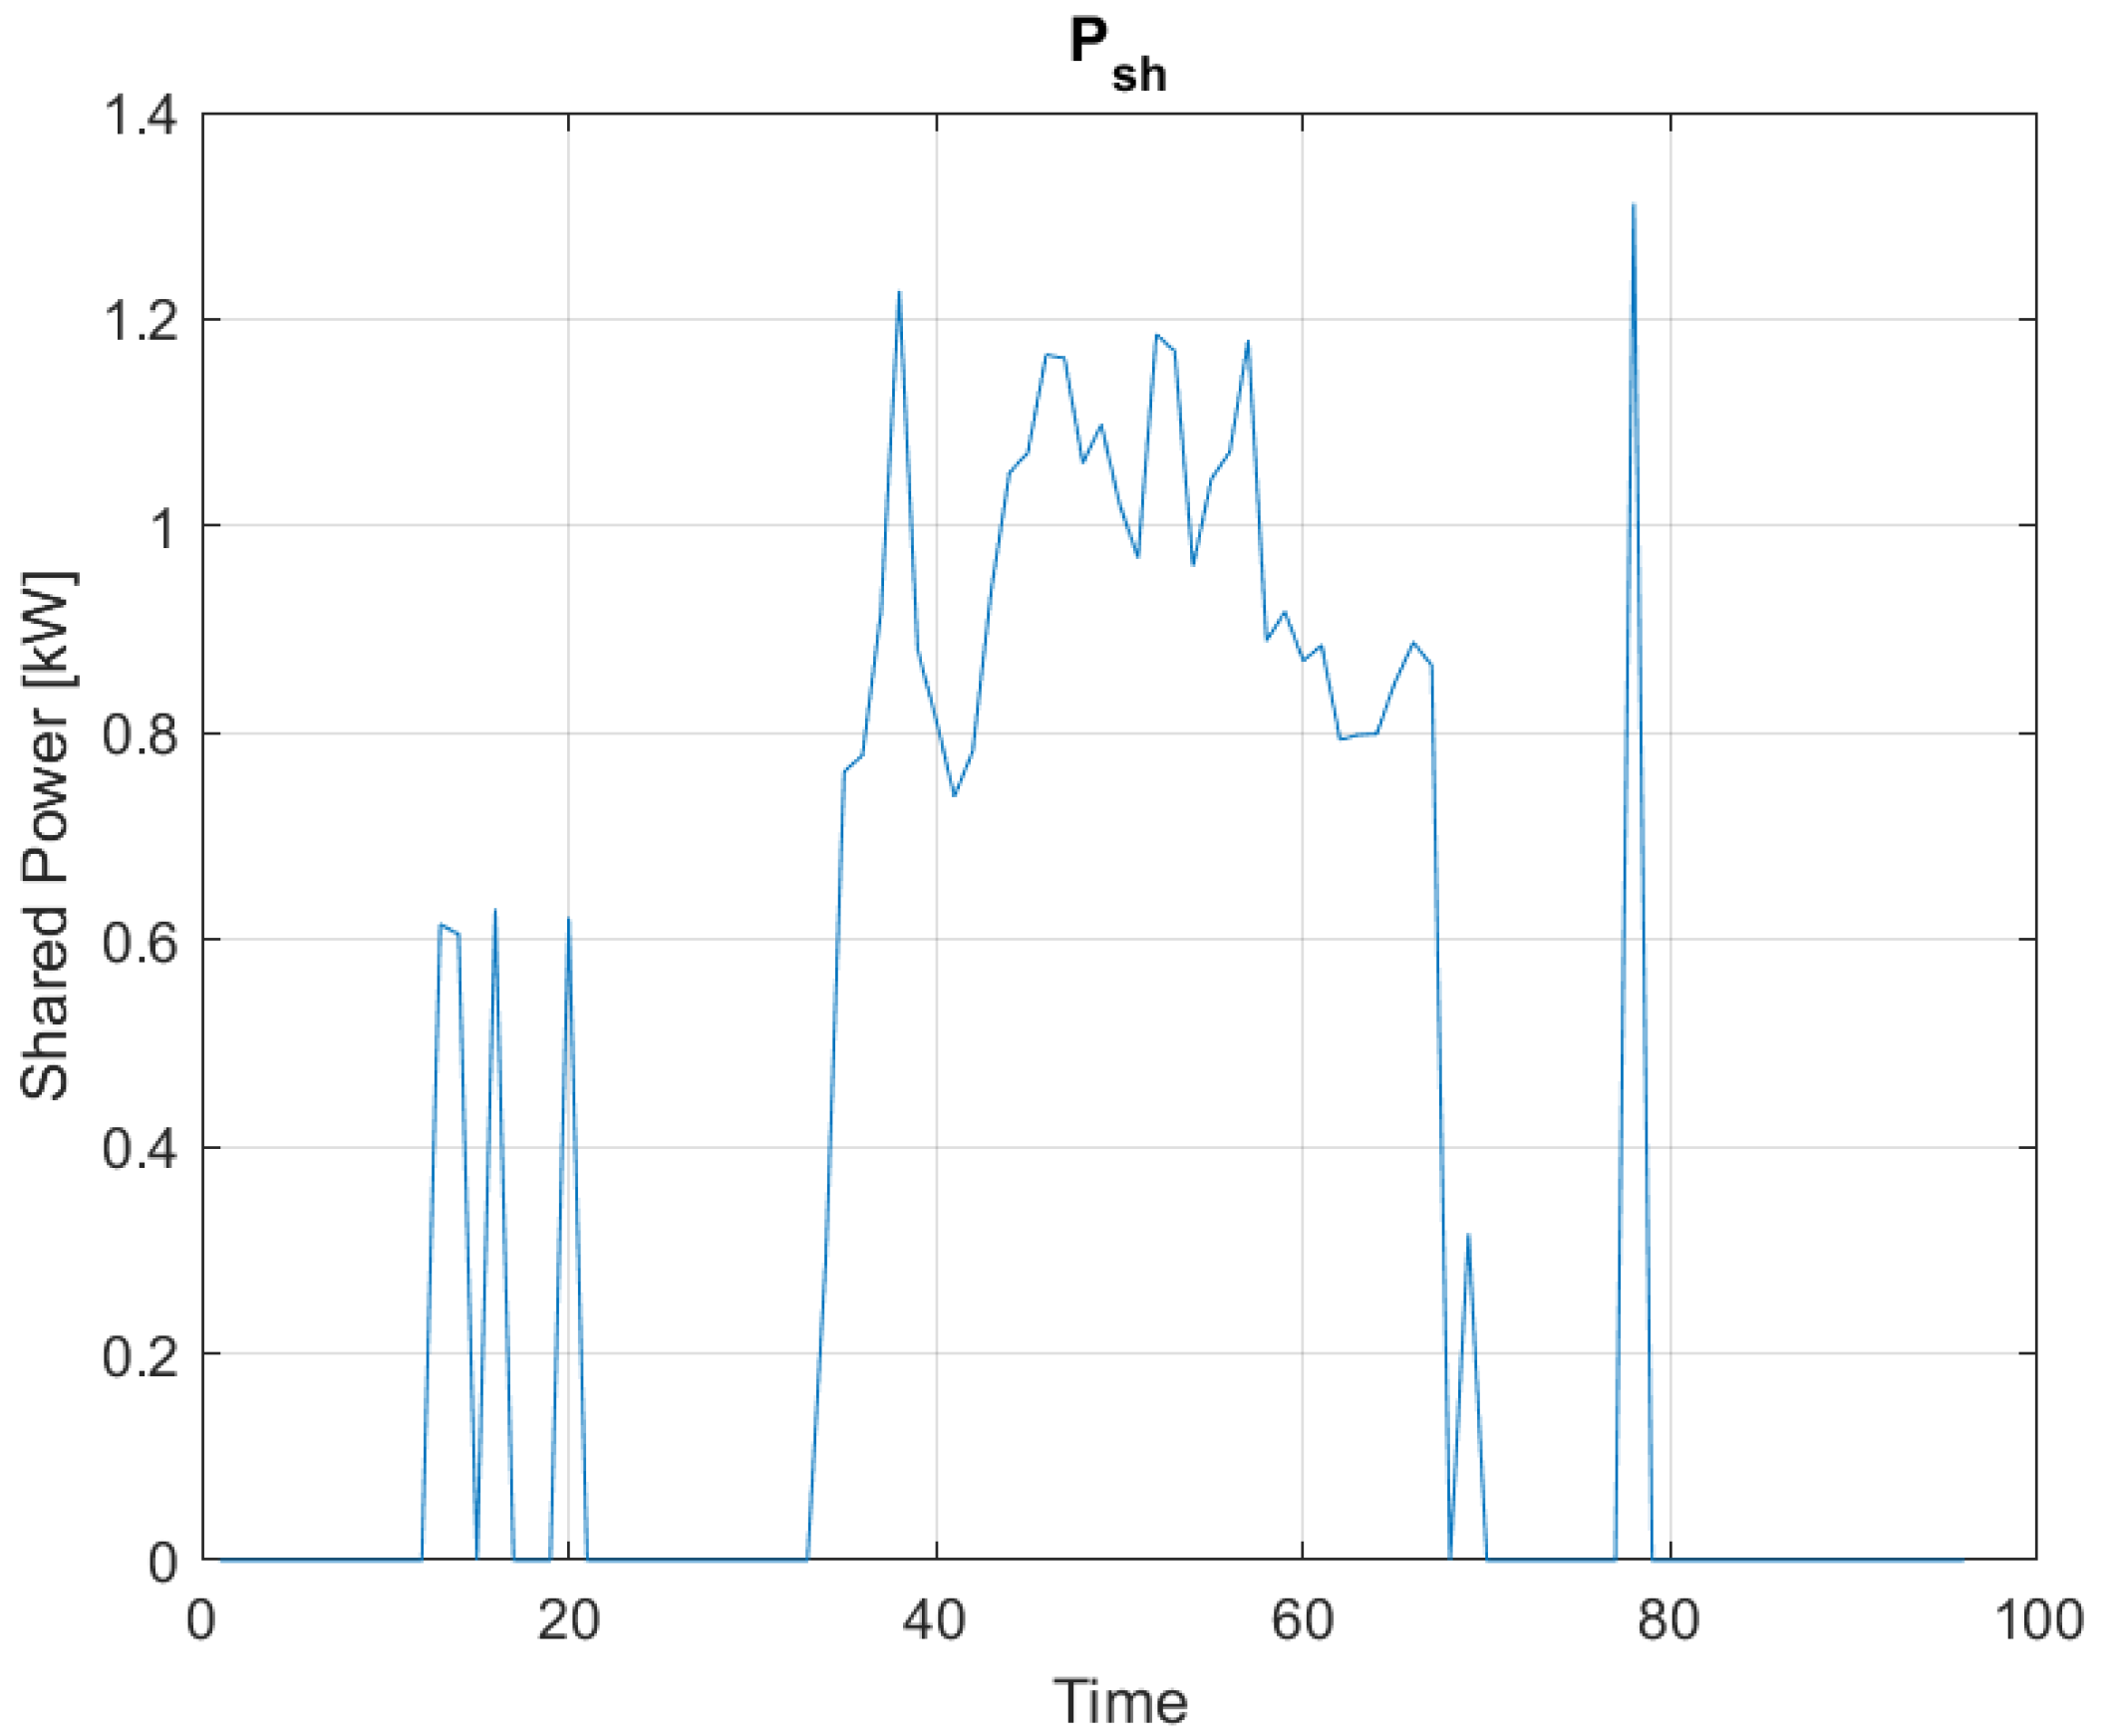
As expected, there is a fundamental difference between the three parts of the day. In Figure 10, the predominant draw in the first part of the day and the third can be seen, together with the middle part of the day, when a considerable amount of energy is supplied to the grid. The fact that battery is being used in the first and last parts of the day for delivering some extra revenue by energy sharing can be seen in Figure 11, where, together with the foreseeable self-consumption in the middle part of the day, some is also present in the first and last parts of the day.
Figure 11.
Shared power (self-consumption) over the simulation day.
In conclusion, the developed algorithm is capable of using the available EC assets in a smart way, in order to maximize the EC revenue.
5. Conclusions
The A-ISolE project demonstrates the feasibility of integrating centralized and distributed AI techniques into a DMS platform for the optimized management of distribution networks with high penetration of renewable energy sources. The combination of advanced forecasting, optimization, state estimation, fault location, and edge control algorithms improves observability, operational efficiency, and resilience.
The experimental results indicate that hybrid centralized and distributed AI architectures can provide tangible benefits for DSOs facing increasing complexity in distribution network operation. Centralized algorithms exploit global visibility and historical data to deliver accurate forecasts and optimized set-points, while edge intelligence enables fast, autonomous reactions to local events and enhances system resilience.
Future work will extend the approach to multiple pilot sites, investigate additional flexibility products and market mechanisms, and further refine edge AI capabilities for supporting electric vehicle charging and more-complex EC configurations.
Author Contributions
Conceptualization, all authors; methodology, all authors; software, A.V., G.G.S. and M.S.; validation, M.G.P., C.D., F.M., A.V., E.B. and G.M.; data curation, F.M., A.V., E.B. and G.M.; writing—original draft preparation, G.G.S.; writing—review and editing, all authors; visualization, M.G.P. and G.G.S.; supervision, G.G.S.; project administration, G.V.; funding acquisition, all authors. All authors have read and agreed to the published version of the manuscript.
Funding
This work is funded by the European Union—NextGenerationEU and by the Ministry of University and Research (MUR), National Recovery and Resilience Plan (NRRP), Mission 4, Component 2, Investment 1.5, project “RAISE—Robotics and AI for Socio-economic Empowerment” (ECS00000035). The partners of the project are: Teknofield Srl, SDI Automazione Industriale SpA, DEA SpA, IESolutions srl, Abika Srl, and Respect Srl. M. Saviozzi and G. Mosaico are part of the RAISE Innovation Ecosystem.
Data Availability Statement
Data analyzed in this study are confidential. Data sharing is not applicable to this paper.
Conflicts of Interest
Author Gian Giuseppe Soma was employed by the company “RESPECT Srl”, Authors Maria Giulia Pasquarelli and Massimo Pentolini were employed by the company “SDI Automazione Industriale SpA”, Authors Cristina Dore and Francesco Martini were employed by the company “Abika Srl”, Authors Andrea Bagnasco and Andrea Vinci were employed by the company “IESolutions Srl”, Author Giulio Valfrè was employed by the company “Teknofield Srl” and Author Enrico Bessone was employed by the company “DEA SpA”. The remaining authors declare that the research was conducted in the absence of any commercial or financial relationships that could be construed as a potential conflict of interest.
References
- Silva, N. Tracing the Transition from Passive to Active Distribution Networks. 2017. Available online: https://www.incite-itn.eu/blog/tracing-the-transition-from-passive-to-active-distribution-networks/ (accessed on 3 February 2026).
- Bouffard, F.; Galiana, F.D. Stochastic security for operations planning with significant wind power generation. IEEE Trans. Power Syst. 2008, 23, 306–316. [Google Scholar] [CrossRef] [Scilit]
- Kundur, P.; Paserba, J.; Ajjarapu, V.; Andersson, G.; Bose, A.; Canizares, C.; Hatziargyriou, N.; Hill, D.; Stankovic, A.; Taylor, C.; et al. Definition and classification of power system stability. IEEE Trans. Power Syst. 2004, 19, 1387–1401. [Google Scholar]
- Chicco, G.; Mancarella, P. Distributed multi-generation: A comprehensive view. Renew. Sustain. Energy Rev. 2009, 13, 535–551. [Google Scholar] [CrossRef] [Scilit]
- Ackermann, T.; Andersson, G.; Söder, L. Distributed generation: A definition. Electr. Power Syst. Res. 2001, 57, 195–204. [Google Scholar] [CrossRef] [Scilit]
- Fotopoulou, M.; Tsekouras, G.; Rakopoulos, D.; Kontargyri, V. Demand response optimization for the enhancement of the distribution system’s operation. Sustain. Energy Grids Networks 2025, 44, 1–5. [Google Scholar] [CrossRef] [Scilit]
- Peng, L.-L.; Yang, X.-Y.; Hua, X.-X.; Fan, G.-F.; Wang, Y.-J.; Umbarkar, A.J.; Hong, W.-C. Short-term electric load forecasting based on deep learning and multi-modal fusion. Electr. Power Syst. Res. 2026, 254, 112593. [Google Scholar] [CrossRef] [Scilit]
- Conejo, A.J.; Carrión, M.; Morales, J.M. Decision Making Under Uncertainty in Electricity Markets; Springer: Berlin/Heidelberg, Germany, 2010. [Google Scholar]
- Mhadhbi, Z.; Zairi, S.; Gueguen, C.; Zouari, B. Real-Time Distributed Management for Control of Smart Grids. IEEE J. Emerg. Sel. Top. Power Electron. 2017, 5, 490–503. [Google Scholar] [CrossRef] [Scilit]
- Sah, R.K.; Maharjan, R.; Maharjan, S.; Shrestha, N.; Bhaskar, K.; Maharjan, B.S.; Kumar, P.; Lamsal, P.; Salkuti, S.R. AI-Based Fault Detection, Classification, and Localization in Power Distribution Systems. In Proceedings of the 2025 Fourth International Conference on Power, Control and Computing Technologies (ICPC2T), Raipur, India, 20–22 January 2025. [Google Scholar]
- Crosa, M.; D’Agostino, F.; Massucco, S.; Pongiglione, P.; Saviozzi, M.; Silvestro, F. The Podcast Project: An Application of Volt/Var Optimization to the Electric Distribution Network of Sanremo (Italy). In Proceedings of the 2019 SyNERGY MED, Cagliari, Italy, 28–30 May 2019. [Google Scholar]
- Massucco, S.; Mosaico, G.; Pongiglione, P.; Saviozzi, M.; Silvestro, F. Probabilistic Planning for Distribution Networks including Optimal DER Regulation and Storage Allocation. In Proceedings of the 2020 IEEE Power & Energy Society General Meeting (PESGM), Montreal, QC, Canada, 2–6 August 2020. [Google Scholar]
- Jang, S.Y.; Oh, B.T.; Oh, E. A Deep Learning-Based Solar Power Generation Forecasting Method Applicable to Multiple Sites. Sustainability 2024, 16, 5240. [Google Scholar] [CrossRef] [Scilit]
- Dhorbani, A.; Abbes, D.; Robyns, B.; Ouari, K.H. Multi-Agent Energy Allocation Optimization in Local Energy Communities: A Comparative Study. Am. J. Appl. Sci. 2025, 22, 20–38. [Google Scholar] [CrossRef] [Scilit]
- Danish, M.S.S.; Senjyu, T. AI-enabled energy policy for a sustainable future. Sustainability 2023, 15, 7643. [Google Scholar] [CrossRef] [Scilit]
- Hodges, A. Alan Turing and the Turing test. In Parsing the Turing Test; Epstein, R., Roberts, G., Beber, G., Eds.; Springer: Dordrecht, The Netherlands, 2007. [Google Scholar]
- Wang, P. On defining artificial intelligence. J. Artif. Gen. Int. 2019, 11, 1–37. [Google Scholar] [CrossRef] [Scilit]
- Zhao, S.; Blaabjerg, F.; Wang, H. An overview of artificial intelligence applications for power electronics. IEEE Trans. Power Electron. 2021, 36, 4633–4658. [Google Scholar] [CrossRef] [Scilit]
- Roumeliotis, K.I.; Tselikas, N.D. Chatgpt and open-ai models: A preliminary review. Futur. Internet 2023, 15, 192. [Google Scholar] [CrossRef] [Scilit]
- Wanxiang, C.; Zhicheng, D.; Yansong, F. Towards a comprehensive understanding of the impact of large language models on natural language processing: Challenges, opportunities, and future directions. Sci. Sin. Inform. 2023, 53, 1645–1687. [Google Scholar]
- Caponetti, L.; Castellano, G. Fuzzy Logic for Image Processing a Gentle Introduction Using Java; Springer: Cham, Switzerland, 2017. [Google Scholar]
- IRENA. Artificial Intelligence and Big Data; Report, September 2019; IRENA: Abu Dhabi, United Arab Emirates, 2019. [Google Scholar]
- EPRI. Developing a Framework for Integrated Energy Network Planning (IEN-P); EPRI: Palo Alto, CA, USA, 2018. [Google Scholar]
- Vogel, L.; Richard, P.; Brey, M.; Mamel, S.; Schätz, K.; Klobasa, M.; Pelka, S.; Plötz, P. dena-Report. Artificial Intelligence for the Integrated Energy Transition; Deutsche Energie-Agentur: Berlin, Germany, 2019. [Google Scholar]
- Brand, M.; Ansari, S.; Castro, F.; Chakra, R.; Hassan, B.H.; Kruger, C.; Babazadeh, D.; Lehnhof, S. A framework for the integration of ICT-relevant data in power system applications. In Proceedings of the IEEE Power Tech; IEEE: New York, NY, USA, 2019. [Google Scholar]
- Kingma, D.P.; Ba, J.L. Adam: A method for stochastic optimization. In Proceedings of the 3rd International Conference on Learning Representations (ICLR); ArXiv: Ithaca, NY, USA, 2015. [Google Scholar]
- Kiran, B.; Thomas, D.; Parakkal, R. An overview of deep learning based methods for unsupervised and semi-supervised anomaly detection in videos. J. Imaging 2018, 4, 36. [Google Scholar] [CrossRef] [Scilit]
- Arulkumaran, K.; Deisenroth, M.P.; Brundage, M.; Bharath, A.A. Deep reinforcement learning: A brief survey. IEEE Signal Process. Mag. 2017, 34, 26–38. [Google Scholar] [CrossRef] [Scilit]
- Abualigah, L.; Diabat, A. Advances in sine cosine algorithm: A comprehensive survey. Artif. Intell. Rev. 2021, 54, 2567–2608. [Google Scholar] [CrossRef] [Scilit]
- Mohar, S.S.; Goyal, S.; Kaur, R. Fruit fly optimization algorithm for intelligent IoT applications. In Fog, Edge, and Pervasive Computing in Intelligent IoT Driven Applications; John Wiley & Sons: Hoboken, NJ, USA, 2020. [Google Scholar]
- Nurcahyadi, T.; Blum, C. Adding negative learning to ant colony optimization: A comprehensive study. Mathematics 2021, 9, 361. [Google Scholar] [CrossRef] [Scilit]
- Katoch, S.; Chauhan, S.S.; Kumar, V. A review on genetic algorithm: Past, present, and future. Multimed. Tools Appl. 2020, 80, 8091–8126. [Google Scholar] [CrossRef] [Scilit] [PubMed]
- Toorajipour, R.; Sohrabpour, V.; Nazarpour, A.; Oghazi, P.; Fischl, M. Artificial intelligence in supply chain management: A systematic literature review. J. Bus. Res. 2021, 122, 502–517. [Google Scholar] [CrossRef] [Scilit]
- Baboli, P.T.; Babazadeh, D.; Raeiszadeh, A.; Horodyvskyy, S.; Koprek, I. Optimal temperature-based condition monitoring system for wind turbines. Infrastructures 2021, 6, 50. [Google Scholar] [CrossRef] [Scilit]
- Li, B.W.; Zhang, J.; He, Y.; Wang, Y. Short-term load-forecasting method based on wavelet decomposition with second-order gray neural network model combined with adf test. IEEE Access 2017, 5, 16324–16331. [Google Scholar] [CrossRef] [Scilit]
- Liu, B.; Nowotarski, J.; Hong, T.; Weron, R. Probabilistic load forecasting via quantile regression averaging on sister forecasts. IEEE Trans. Smart Grid 2017, 8, 730–737. [Google Scholar] [CrossRef] [Scilit]
- Ahmad, A.; Javaid, N.; Guizani, M.; Alrajeh, N.; Khan, Z.A. An accurate and fast converging short-term load forecasting model for industrial applications in a smart grid. IEEE Trans. Ind. Inform. 2017, 13, 2587–2596. [Google Scholar] [CrossRef] [Scilit]
- Bagnasco, A.; Fresi, F.; Saviozzi, M.; Silvestro, F.; Vinci, A. Electrical consumption forecasting in hospital facilities: An application case. Energy Build. 2015, 103, 261–270. [Google Scholar] [CrossRef] [Scilit]
- Saviozzi, M.; Massucco, S.; Silvestro, F. Implementation of advanced functionalities for Distribution Management Systems: Load forecasting and modeling through Artificial Neural Networks ensembles. Electr. Power Syst. Res. 2019, 167, 230–239. [Google Scholar] [CrossRef] [Scilit]
- Lim, S.; Kim, T.; Lee, K.Y.; Choi, D.; Park, J.-W. Impact of high penetration of renewables on power system frequency response: A review and verification. Renew. Sustain. Energy Rev. 2025, 217, 115728. [Google Scholar] [CrossRef] [Scilit]
- Ayalew, M.; Khan, B.; Giday, I.; Mahela, O.P.; Khosravy, M.; Gupta, N.; Senjyu, T. Integration of Renewable Based Distributed Generation for Distribution Network Expansion Planning. Energies 2022, 15, 1378. [Google Scholar] [CrossRef] [Scilit]
- Wang, Z.; Bu, S.; Wen, J.; Huang, C. A comprehensive review on uncertainty modeling methods in modern power systems. Int. J. Electr. Power Energy Syst. 2025, 166, 110534. [Google Scholar] [CrossRef] [Scilit]
- Lingohr, D.; Müller, G. Stochastic modeling of intraday photovoltaic power generation. Energy Econ. 2019, 81, 175–186. [Google Scholar] [CrossRef] [Scilit]
- Sorour, A.; Fazeli, M.; Monfared, M.; Fahmy, A.A.; Searle, J.R.; Lewis, R.P. Forecast-Based Energy Management for Domestic PV-Battery Systems: A U.K. Case Study. IEEE Access 2021, 9, 58953–58965. [Google Scholar] [CrossRef] [Scilit]
- Liu, Z.; Du, Y. Evolution towards dispatchable PV using forecasting, storage, and curtailment: A review. Electr. Power Syst. Res. 2023, 223, 109554. [Google Scholar] [CrossRef] [Scilit]
- Soma, G.G.; Pasquarelli, G.; Pentolini, M.; Dore, C.; Martini, F.; Bagnasco, A.; Vinci, A.; Valfrè, G.; Bessone, E.; Saviozzi, M. AI techniques for the optimization of distribution networks with renewable energy sources: The A-IsolE project. In Proceedings of the AEIT 2025, Amantea, Italy, 10–12 September 2025. [Google Scholar]
- Das, U.K.; Tey, K.S.; Seyedmahmoudian, M.; Mekhilef, S.; Idris, M.Y.I.; Deventer, W.V.; Horan, B.; Stojcevski, A. Forecasting of photovoltaic power generation and model optimization: A review. Renew. Sustain. Energy Rev. 2018, 81, 912–928. [Google Scholar] [CrossRef] [Scilit]
- Li, Y.; Su, Y.; Shu, L. An ARMAX model for forecasting the power output of a grid connected photovoltaic system. Renew. Energy 2014, 66, 78–89. [Google Scholar] [CrossRef] [Scilit]
- Rana, M.; Koprinska, I.; Agelidis, V. 2D-interval Forecasts for Solar Power Production. Sol. Energy 2015, 122, 191–203. [Google Scholar] [CrossRef] [Scilit]
- Xie, T.; Zhang, G.; Liu, H.; Liu, F.; Du, P. A Hybrid Forecasting Method for Solar Output Power Based on Variational Mode Decomposition, Deep Belief Networks and Auto-Regressive Moving Average. Appl. Sci. 2018, 8, 1901. [Google Scholar] [CrossRef] [Scilit]
- Mahor, A.; Prasad, V.; Rangnekar, S. Economic dispatch using particle swarm optimization: A review. Renew. Sustain. Energy Rev. 2009, 13, 2134–2141. [Google Scholar] [CrossRef] [Scilit]
- Liang, J.; Zhang, H.; Wang, K.; Jia, R. Economic dispatch of power system based on improved fruit optimization algorithm. In Proceedings of the 14th IEEE Conference on Industrial Electronics and Applications (ICIEA 2019), Xi’an, China, 19–21 June 2019. [Google Scholar]
- Chen, X.; Xu, B.; Du, W. An improved particle swarm optimization with biogeography-based learning strategy for economic dispatch problems. Complexity 2018, 2018, 7289674. [Google Scholar] [CrossRef] [Scilit]
- Dai, P.; Yu, W.; Wen, G.; Baldi, S. Distributed reinforcement learning algorithm for dynamic economic dispatch with unknown generation cost functions. IEEE Trans. Ind. Informatics 2020, 16, 2258–2267. [Google Scholar] [CrossRef] [Scilit]
- Sun, H.; Guo, Q.; Qi, J.; Ajjarapu, V.; Bravo, R.; Chow, J.; Li, Z.; Moghe, R.; Nasr-Azadani, E.; Tamrakar, U.; et al. Review of challenges and research opportunities for voltage control in smart grids. IEEE Trans. Power Syst. 2019, 34, 2790–2801. [Google Scholar] [CrossRef] [Scilit]
- Wang, S.; Duan, J.; Shi, D.; Xu, C.; Li, H.; Diao, R.; Wang, Z. A data-driven multi-agent autonomous voltage control framework using deep reinforcement learning. IEEE Trans. Power Syst. 2020, 35, 4644–4654. [Google Scholar] [CrossRef] [Scilit]
- Yoshida, H.; Fukuyama, Y. Parallel multipopulation differential evolutionary particle swarm optimization for voltage and reactive power control. Electr. Eng. Jpn. 2018, 204, 31–40. [Google Scholar] [CrossRef] [Scilit]
- Iwata, S.; Fukuyama, Y. Dependability evaluations of parallel differential evolutionary particle swarm optimization for voltage and reactive power control. IEEJ Trans. Power Energy 2017, 137, 52–55. [Google Scholar] [CrossRef] [Scilit]
- Gururajapathy, S.S.; Mokhlis, H.; Illias, H. Fault location and detection techniques in power distribution systems with distributed generation: A review. Renew. Sustain. Energy Rev. 2017, 74, 949–958. [Google Scholar] [CrossRef] [Scilit]
- Peng, H.; Wang, J.; Ming, J.; Shi, P.; Perez-Jimenez, M.J.; Yu, W.; Tao, C. Fault diagnosis of power systems using intuitionistic fuzzy spiking neural P systems. IEEE Trans. Smart Grid 2018, 9, 4777–4784. [Google Scholar] [CrossRef] [Scilit]
- Lin, X.; Ke, S.; Li, Z.; Weng, H.; Han, X. A fault diagnosis method of power systems based on improved objective function and genetic algorithm-tabu search. IEEE Trans. Power Deliv. 2010, 25, 1268–1274. [Google Scholar] [CrossRef] [Scilit]
- Jamil, M.; Sharma, S.K.; Chaturvedi, D.K. Fault classification of three-phase transmission network using genetic algorithm. Int. J. Eng. Appl. Sci. 2015, 5, 84–88. [Google Scholar]
- Wang, Z.; Fu, Y.; Song, C.; Zeng, P.; Qiao, L. Power system anomaly detection based on OCSVM optimized by improved particle swarm optimization. IEEE Access 2019, 7, 181580–181588. [Google Scholar] [CrossRef] [Scilit]
- Goswami, T.; Roy, U.B. Predictive model for classification of power system faults using machine learning. In Proceedings of the IEEE Region 10 Conference (TENCON), Kerala, India, 17–20 October 2019; pp. 1881–1885. [Google Scholar]
- Zhang, S.; Wang, Y.; Liu, M.; Bao, Z. Data-based line trip fault prediction in power systems using LSTM networks and SVM. IEEE Access 2018, 6, 7675–7686. [Google Scholar] [CrossRef] [Scilit]
- Almaleck, P.; Massucco, S.; Mosaico, G.; Saviozzi, M.; Serra, P.; Silvestro, F. Electrical consumption forecasting in sports venues: A proposed approach based on neural networks and ARIMAX Models. Sustain. Cities Soc. 2024, 100, 105019. [Google Scholar] [CrossRef] [Scilit]
- D’Agostino, F.; Mahlalela, J.S.; Massucco, S.; Mosaico, G.; Saviozzi, M.; Silvestro, F. Fault Classification in Distribution Networks Using Graph Neural Networks and Discrete Stockwell Transform. In Proceedings of the 2025 IEEE Kiel PowerTech, Kiel, Germany, 29 June–3 July 2025. [Google Scholar]
- Mahlalela, J.; Mosaico, G.; Saviozzi, M. Fault Classification and Localization for Advanced Distribution Management Systems Using Sobol Sequence Data Generation. In Proceedings of the 2025 IEEE AFRICON, Polokwane, South Africa, 10–12 December 2025. [Google Scholar]
- Lang, S.; Behrendt, F.; Lanzerath, N.; Reggelin, T.; Muller, M. Integration of Deep Reinforcement Learning and Discrete-Event Simulation for Real-Time Scheduling of a Flexible Job Shop Production. In Proceedings of the Winter Simulation Conference (WSC); IEEE: New York, NY, USA, 2020; pp. 3057–3068. [Google Scholar] [CrossRef] [Scilit]
- Ghiani, E.; Giordano, A.; Nieddu, A.; Rosetti, L.; Pilo, F. Planning of a Smart Local Energy Community: The Case of Berchidda Municipality (Italy). Energies 2019, 12, 4629. [Google Scholar] [CrossRef] [Scilit]

Disclaimer/Publisher’s Note: The statements, opinions and data contained in all publications are solely those of the individual author(s) and contributor(s) and not of MDPI and/or the editor(s). MDPI and/or the editor(s) disclaim responsibility for any injury to people or property resulting from any ideas, methods, instructions or products referred to in the content. |
© 2026 by the authors. Licensee MDPI, Basel, Switzerland. This article is an open access article distributed under the terms and conditions of the Creative Commons Attribution (CC BY) license.