1. Introduction
The global transition toward low-carbon energy systems has intensified the need for decentralized thermal technologies capable of reducing fossil-fuel-based heating demand. Recent assessments report that global energy-related CO
2 emissions reached approximately 37.8 Gt in 2024, while atmospheric CO
2 concentrations exceeded 424 ppm in early 2025 [
1,
2]. At the same time, the global mean surface temperature has increased by approximately 1.2 °C above pre-industrial levels [
3,
4]. These trends highlight the urgency of deploying renewable thermal technologies capable of contributing to greenhouse gas mitigation in distributed energy systems. Solar radiation represents an abundant energy resource, with the Earth receiving approximately 173,000 TW of continuous solar input [
5].
Solar air heaters (SAHs) are among the simplest and most deployable solar thermal technologies for low-temperature heating applications such as agricultural drying, building heating, and low-grade industrial processes [
6]. However, the thermal performance of conventional SAHs is often limited by the formation of a laminar or weakly turbulent boundary layer along the heated absorber plate, which reduces the effective convective heat transfer coefficient and limits the achievable air temperature rise.
One widely adopted strategy to overcome this limitation is the use of artificial roughness elements on the absorber surface to disturb the boundary layer and enhance turbulence. Rib-roughened ducts have been extensively investigated and are known to enhance heat transfer through separation and reattachment mechanisms [
7,
8,
9]. For example, Lanjewar et al. [
8] reported a maximum Nusselt number enhancement of 2.36 times with a friction factor increase of 2.01 times for W-shaped ribs compared with a smooth duct. Similarly, Hans et al. [
9] investigated multiple V-rib roughness over a Reynolds number range of 2000–20,000, demonstrating substantial heat transfer enhancement relative to smooth channels. Reviews of artificial roughness geometries further highlight the influence of rib pitch, height, and attack angle on thermo-hydraulic performance in solar air heaters [
10].
Subsequent studies explored additional surface modifications to intensify near-wall mixing, including trapezoidal ribs, rhombus roughness elements, and pin-type protrusions, which generate localized vortex structures near the absorber surface [
11,
12,
13]. Surface area augmentation strategies have also been investigated; for instance, triangular finned absorber configurations have been reported to achieve thermo-hydraulic enhancement factors of about 1.51 at Reynolds numbers near 3500 [
14]. In addition to heat transfer enhancement, several studies have applied integrated energy–exergy–economic evaluation frameworks to assess the thermodynamic and economic viability of modified solar air heaters [
15,
16,
17].
Beyond conventional rib geometries, a range of turbulence-promoting devices have been proposed to improve airflow mixing within solar air heaters. These include porous absorbers, perforated fins, and hybrid turbulator inserts [
18,
19,
20,
21]. Experimental studies have also examined transverse wire ribs, circular detached ribs, turbulator tapes, and modified absorber geometries to enhance thermo-hydraulic performance [
22,
23,
24,
25,
26,
27,
28,
29,
30,
31,
32,
33,
34,
35,
36]. For example, Mondloe and Ghritlahre [
22] reported a maximum thermal efficiency of 85.5% and a thermo-hydraulic performance parameter of 2.12 using transverse wire ribs with an optimized gap configuration. Similarly, hybrid turbulator tapes have demonstrated a Nusselt number enhancement of about 91% with a friction factor increase of approximately 39%, indicating improved heat transfer with moderate hydraulic penalties relative to heat transfer enhancement [
24]. These approaches primarily enhance heat transfer through near-wall turbulence generation within straight flow channels. Vortex generators used in heat transfer systems commonly include delta-wing vortex generators and longitudinal vortex generators, which produce streamwise vortices that transport high-momentum fluid toward the heated surface while removing heated boundary-layer fluid. These mechanisms have been widely investigated in compact heat exchangers and solar thermal systems.
Another enhancement approach involves modifying the internal flow path of the collector. The serpentine channel extends the airflow path within the collector, increasing absorber–air interaction time while generating curvature-induced secondary motion, commonly referred to as Dean vortices. These vortices promote mixing between the core flow and near-wall regions and increase airflow residence time within the collector. Experimental studies of serpentine collectors have demonstrated improved performance; for example, serpentine-channel solar collectors have achieved energy efficiencies up to 78.9% and exergy efficiencies of about 6.47% under optimized conditions [
37]. Numerical investigations have also shown that curved flow paths can influence temperature distribution and heat transfer characteristics depending on Reynolds number and channel geometry, with reported efficiencies around 45–46% for spiral or serpentine configurations under controlled-heat-flux conditions [
36].
More recently, solar air heater performance has been increasingly evaluated using integrated energy–exergy–economic–environmental (4E) frameworks to assess sustainability and thermodynamic efficiency simultaneously [
38]. Exergy analysis provides insight into irreversibility within solar thermal systems and allows for a more comprehensive evaluation of collector performance [
39,
40,
41,
42,
43]. Experimental studies integrating energy and exergy analysis have reported thermal efficiencies around 65.2% with exergy efficiencies approaching 34.7% for advanced configurations [
38]. Similarly, finned solar air heaters have achieved average thermal efficiencies of about 71.15% and maximum exergy efficiencies near 3.7%, together with measurable environmental benefits such as CO
2 mitigation rates of approximately 1.04 kg CO
2 h
−1 [
44]. Numerical investigations further indicate that geometric obstacles can increase thermal efficiency by approximately 69% while achieving thermo-hydraulic performance parameters near 1.2 [
45]. In addition, solar thermal modeling and exergo-economic approaches have been widely applied for evaluating renewable thermal systems [
46,
47].
Recent work has also explored the use of internal baffles to guide airflow and promote stronger mixing within solar air heaters. A comprehensive review by Jia et al. [
48] summarized the evolution of baffled solar air heaters and reported that strategically placed baffles can significantly enhance absorber–air interaction by inducing flow redirection, vortex formation, and repeated boundary layer disruption, thereby improving convective heat transfer performance. The Summary of few relevant recent experimental studies on modified solar air heaters is presented in
Table 1.
Despite these significant advances, most previous investigations examine near-wall turbulence enhancement through artificial roughness or curvature-induced secondary motion in serpentine channels independently. Experimental studies that integrate both mechanisms within a single solar air heater configuration remain limited, and the transport interaction between curvature-driven secondary flow and distributed vortex generation has not been systematically examined. Moreover, although many enhancement techniques report improved thermal efficiency, comparatively few investigations evaluate whether such geometric modifications translate into system-level sustainability benefits, including improvements in thermodynamic utilization, environmental impact, and economic feasibility.
In this context, the present study experimentally investigates a serpentine-channel solar air heater equipped with distributed three-dimensional vortex generators. The proposed configuration integrates curvature-induced secondary flow generated by the serpentine channel with vortex-induced mixing introduced by inclined wire-type vortex generators, thereby promoting compound transport interaction within the airflow passage. Unlike conventional roughened collectors that rely solely on near-wall turbulence generation, the present design introduces spatially distributed vortex structures along a curved flow path, which is expected to intensify absorber–air thermal interaction while maintaining practical airflow operation.
Furthermore, the system performance is evaluated experimentally under outdoor operating conditions using an integrated energy–exergy–economic–environmental assessment framework, enabling comprehensive evaluation of thermo-hydraulic performance and sustainability implications. Recent experimental studies on jet-impingement collectors, serpentine channels, and turbulator-based solar air heaters provide useful benchmarks for comparison with the present configuration [
44,
49,
50,
51].
Objectives of the Present Study
In response to the limited experimental evidence on the combined effects of vortex-induced mixing and curvature-driven secondary motion, the present study investigates a serpentine-channel solar air heater equipped with distributed three-dimensional vortex generators. The objectives of the study are as follows:
To experimentally evaluate the thermo-hydraulic performance of the modified serpentine configuration over practical Reynolds number ranges under outdoor operating conditions.
To investigate the influence of the combined effects of curvature-induced secondary flow and vortex generation on convective heat transfer and pressure drop characteristics.
To assess the overall system performance using an integrated energy–exergy–environmental framework in order to determine whether compound geometric transport intensification yields a measurable low-carbon advantage when hydraulic penalties and heat loss effects are explicitly considered.
To achieve these objectives, an outdoor experimental campaign was conducted using a baseline smooth solar air heater and the modified serpentine configuration under identical boundary conditions. Performance evaluation included thermal efficiency, thermo-hydraulic behavior, and exergy performance across a range of mass flow rates representative of practical operation. The experimental methodology adopted for this comparative evaluation is described in the following section.
2. Experimental Setup and Methodology
2.1. Experimental Facility and Test Configuration
The experimental investigation was conducted under outdoor winter conditions using two independent solar air heater (SAH) configurations:
- (i)
A smooth-duct reference system (S-SAH),
- (ii)
A modified serpentine-channel solar air heater equipped with distributed three-dimensional serpentine vortex generators (SCSVG-SAH).
Both systems were fabricated with identical external dimensions to ensure controlled comparison. The collector aperture area was 0.25 m2. The duct width and height were 0.5 m and 0.10 m, respectively. The collector casing was constructed from 23 mm thick plywood, providing structural rigidity for the experimental setup. To minimize heat losses to the surroundings, the bottom and side walls of the collector were insulated using 4 mm thick thermocol sheets (expanded polystyrene, EPS), procured from local commercial suppliers in India. In addition, an insulation layer of 35 mm thick XLPE (cross-linked polyethylene) insulation was installed directly beneath the absorber plate to reduce conductive heat losses through the bottom surface. The collector was covered with a single transparent glass glazing of 4 mm thickness, allowing solar radiation to reach the absorber plate while reducing convective heat losses.
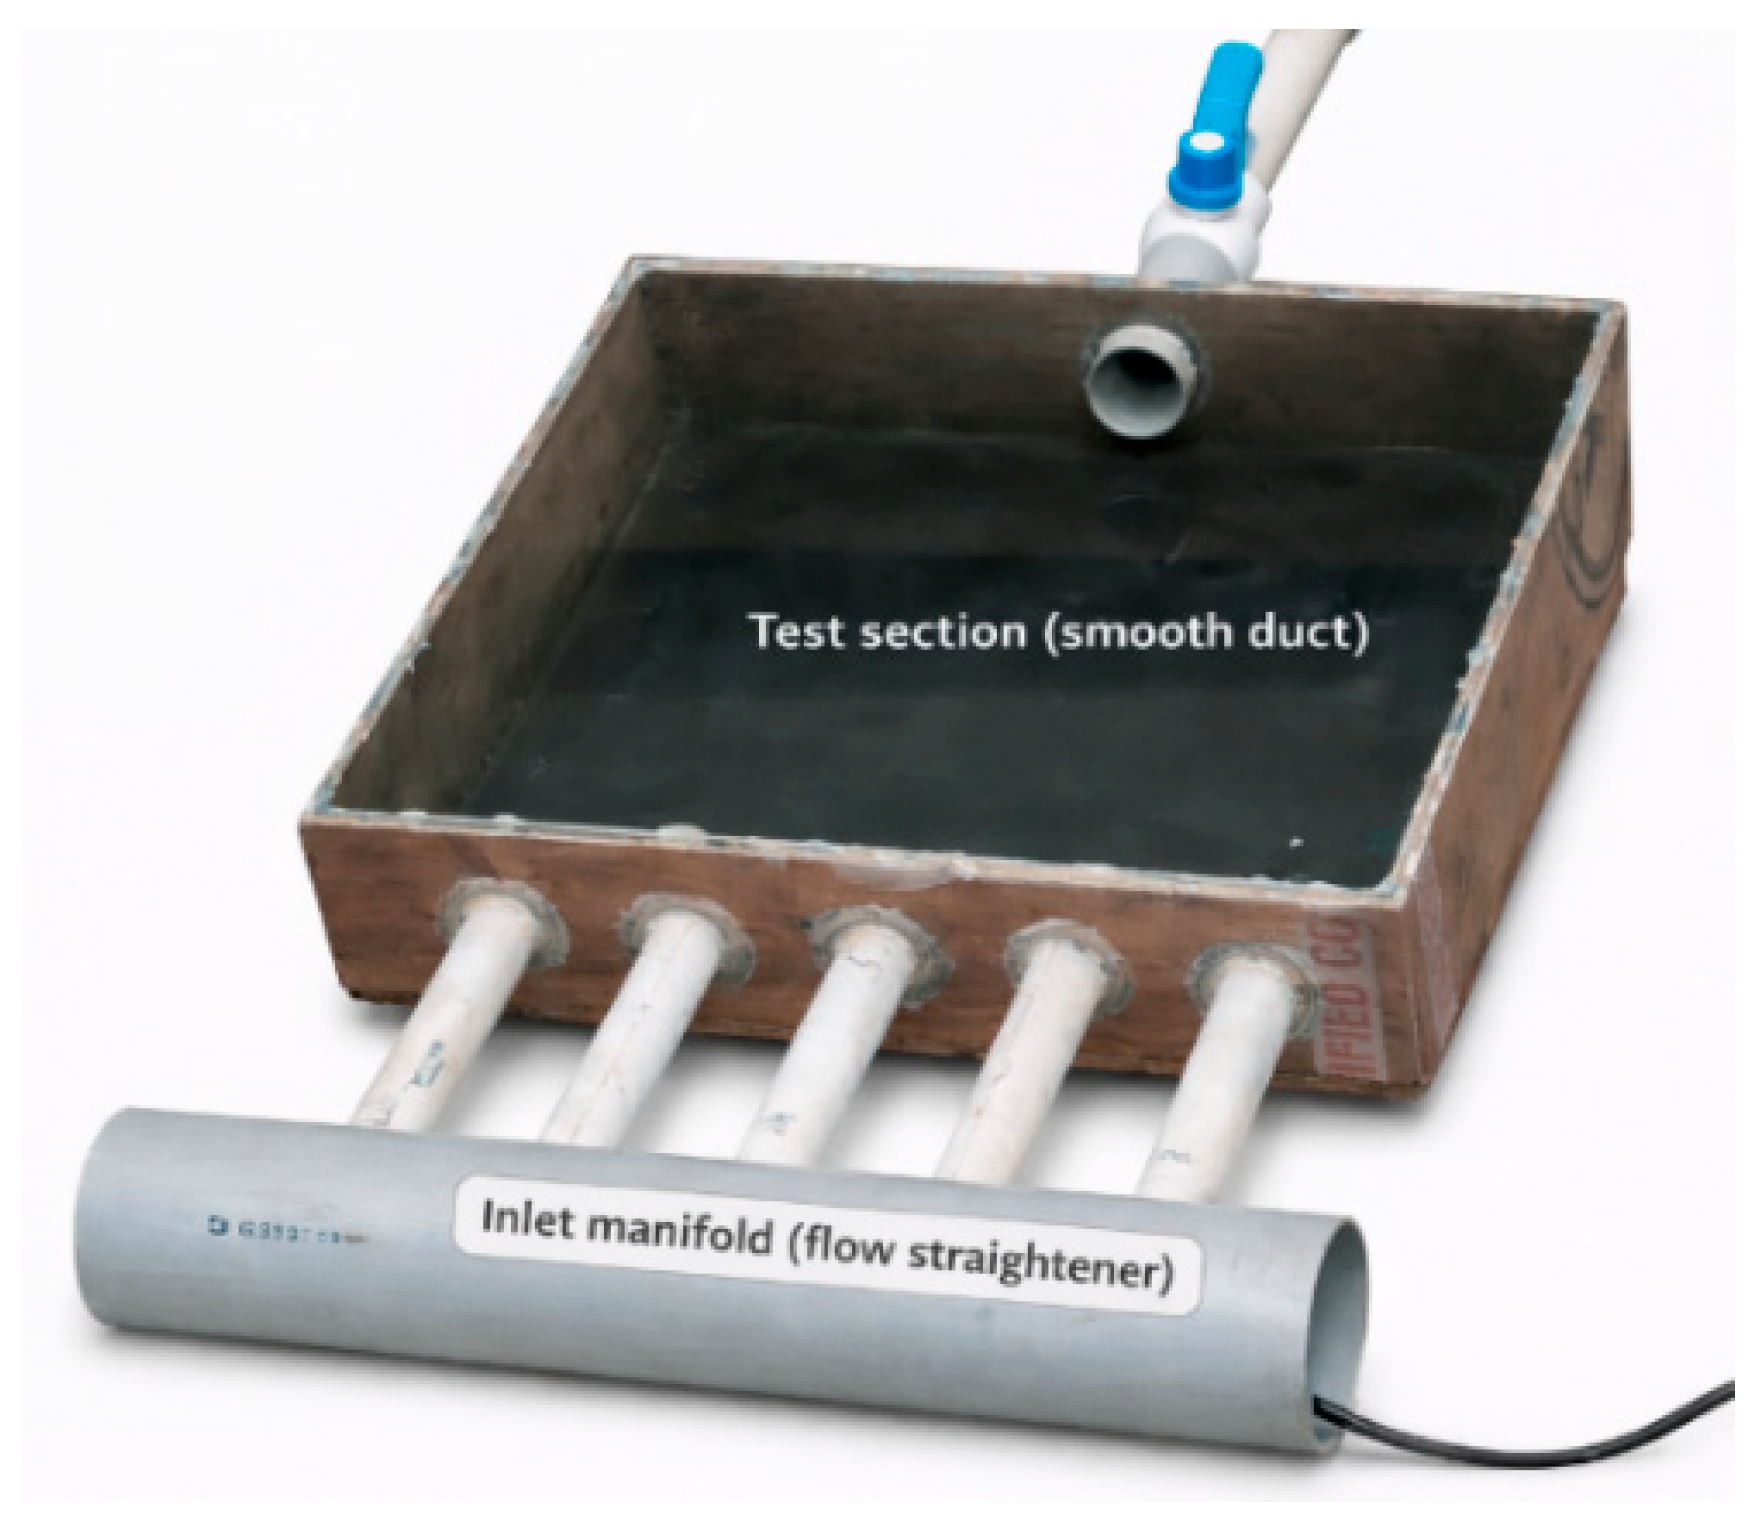
The experiments were conducted at Banda, India (latitude 25.3117° N, longitude 80.5438° E), under natural solar radiation conditions. Both collectors were installed side-by-side and oriented toward the south, with a collector tilt angle of 25° relative to the horizontal plane, ensuring consistent solar exposure during the experimental campaign. The modified configuration incorporated a six-turn serpentine airflow path formed by internal partitioning of the duct. Distributed vortex-generating elements fabricated from 2.3 mm diameter aluminum wire were mounted on the absorber surface and aligned along the serpentine flow direction. The geometric arrangement was designed to introduce controlled flow disturbance while limiting excessive blockage and pressure penalty. A schematic representation of the smooth solar air heater test section (S-SAH) is shown in
Figure 1.
2.2. Three-Dimensional Serpentine Vortex Generator Geometry
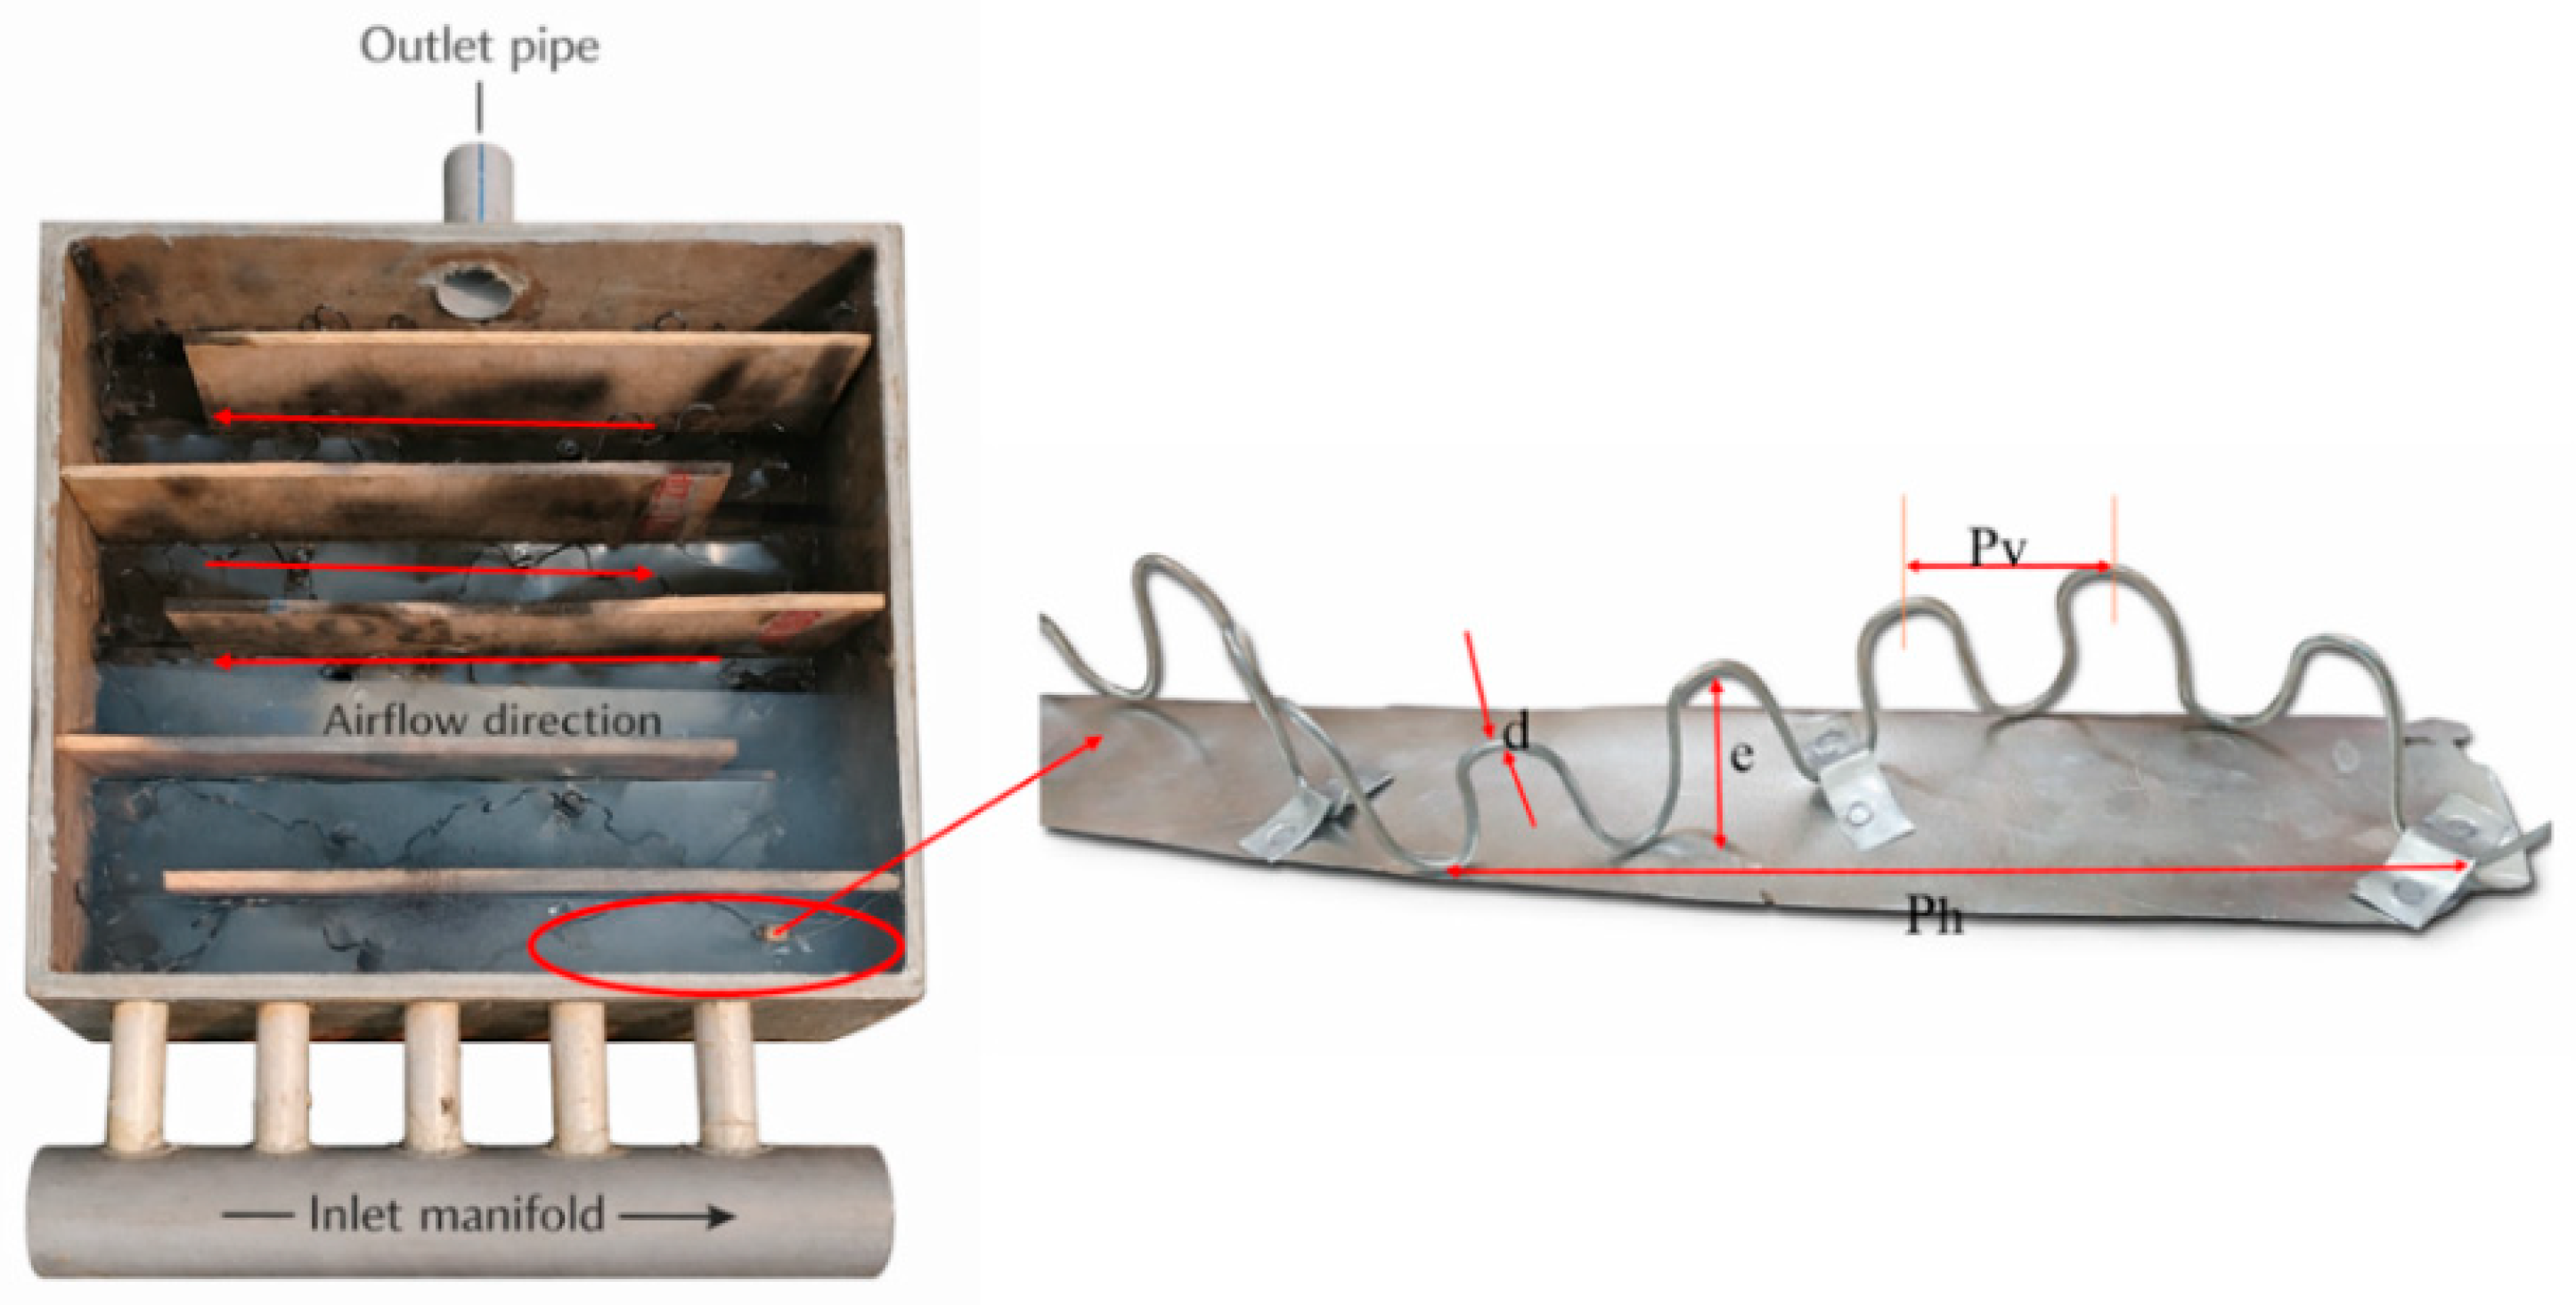
The SCSVG-SAH incorporates surface-mounted serpentine vortex generators fabricated from aluminum wire of 2.3 mm diameter (≈99% purity). The vortex generators were manufactured by manually bending the aluminum wire into the required serpentine loop geometry and subsequently fixing the formed elements onto the absorber plate. Unlike conventional solid-rib roughness elements, these generators consist of slender curved loops that extend into the flow domain while preserving a largely open cross-sectional passage.
The geometric loop amplitude of the vortex generators was approximately 40 mm within the 100 mm duct height, corresponding to a relative rib height ratio e/H ≈ 0.40. However, since the effective obstruction thickness corresponds only to the wire diameter (2.3 mm), the projected frontal blockage ratio remained relatively small. This configuration promotes distributed vortex formation while minimizing excessive pressure drop penalties.
The vortex generators were installed at a rib inclination angle of 45° relative to the primary airflow direction, producing combined longitudinal and transverse disturbance components that enhance mixing within the airflow. The pitch between adjacent vortex loops (Pv) was 20 mm, resulting in a pitch-to-height ratio Pv/e = 0.5. These geometric proportions were selected to promote boundary layer disruption and vortex interaction along the absorber surface.
Each serpentine pass contained 24 vortex generators, resulting in a total of 144 vortex elements distributed across the six-turn serpentine channel. The serpentine-channel bend radius was approximately 50 mm, generating repeated curvature-induced directional changes in the airflow. The interaction between the serpentine flow path and the distributed vortex generators promotes three-dimensional mixing through the combined effects of Dean-type secondary flow and vortex-induced turbulence, thereby enhancing convective heat transfer within the collector. The principal geometric parameters of the vortex generators are summarized in
Table 2. The slender wire geometry allows for effective flow disturbance while maintaining relatively low blockage compared with conventional solid-rib roughness elements. A top view of the serpentine-channel solar air heater with vortex generators (SCSVG-SAH) and an enlarged view of a 3D serpentine vortex generator is shown in
Figure 2.
2.3. Airflow and Operating Conditions
Air was supplied using a variable-speed centrifugal blower connected downstream of the collector to maintain suction-mode operation and ensure uniform inlet flow distribution. The mass flow rate was controlled and measured using a calibrated flow measurement device. Experiments were conducted over a mass-flow range of 0.012–0.061 kg s
−1, corresponding to Reynolds numbers of approximately 2.1 × 10
3 to 1.07 × 10
4. This range spans transitional to turbulent flow regimes commonly encountered in forced-convection solar air heater operation and was selected to represent practical operating conditions. Similar Reynolds number ranges have been adopted in experimental investigations of solar air heaters to evaluate thermo-hydraulic performance under realistic operating conditions [
7,
8,
9,
22]. Within this operating range, the serpentine-channel curvature and distributed vortex generators introduce controlled flow disturbance that promotes enhanced mixing and convective heat transfer.
Each operating condition was maintained until steady-state thermal behavior was achieved prior to data acquisition. To minimize the influence of short-term solar fluctuations, experiments were repeated over three consecutive clear days. Performance parameters were calculated using three-day-averaged datasets to ensure representative and stable evaluation under outdoor conditions.
2.4. Instrumentation and Data Acquisition
Accurate measurement of thermal and hydraulic parameters is essential for reliable performance evaluation of the experimental solar air-heating system. The instrumentation framework was designed to simultaneously monitor temperature distribution, solar irradiance, airflow rate, and pressure drop under outdoor operating conditions.
2.4.1. Temperature Measurement
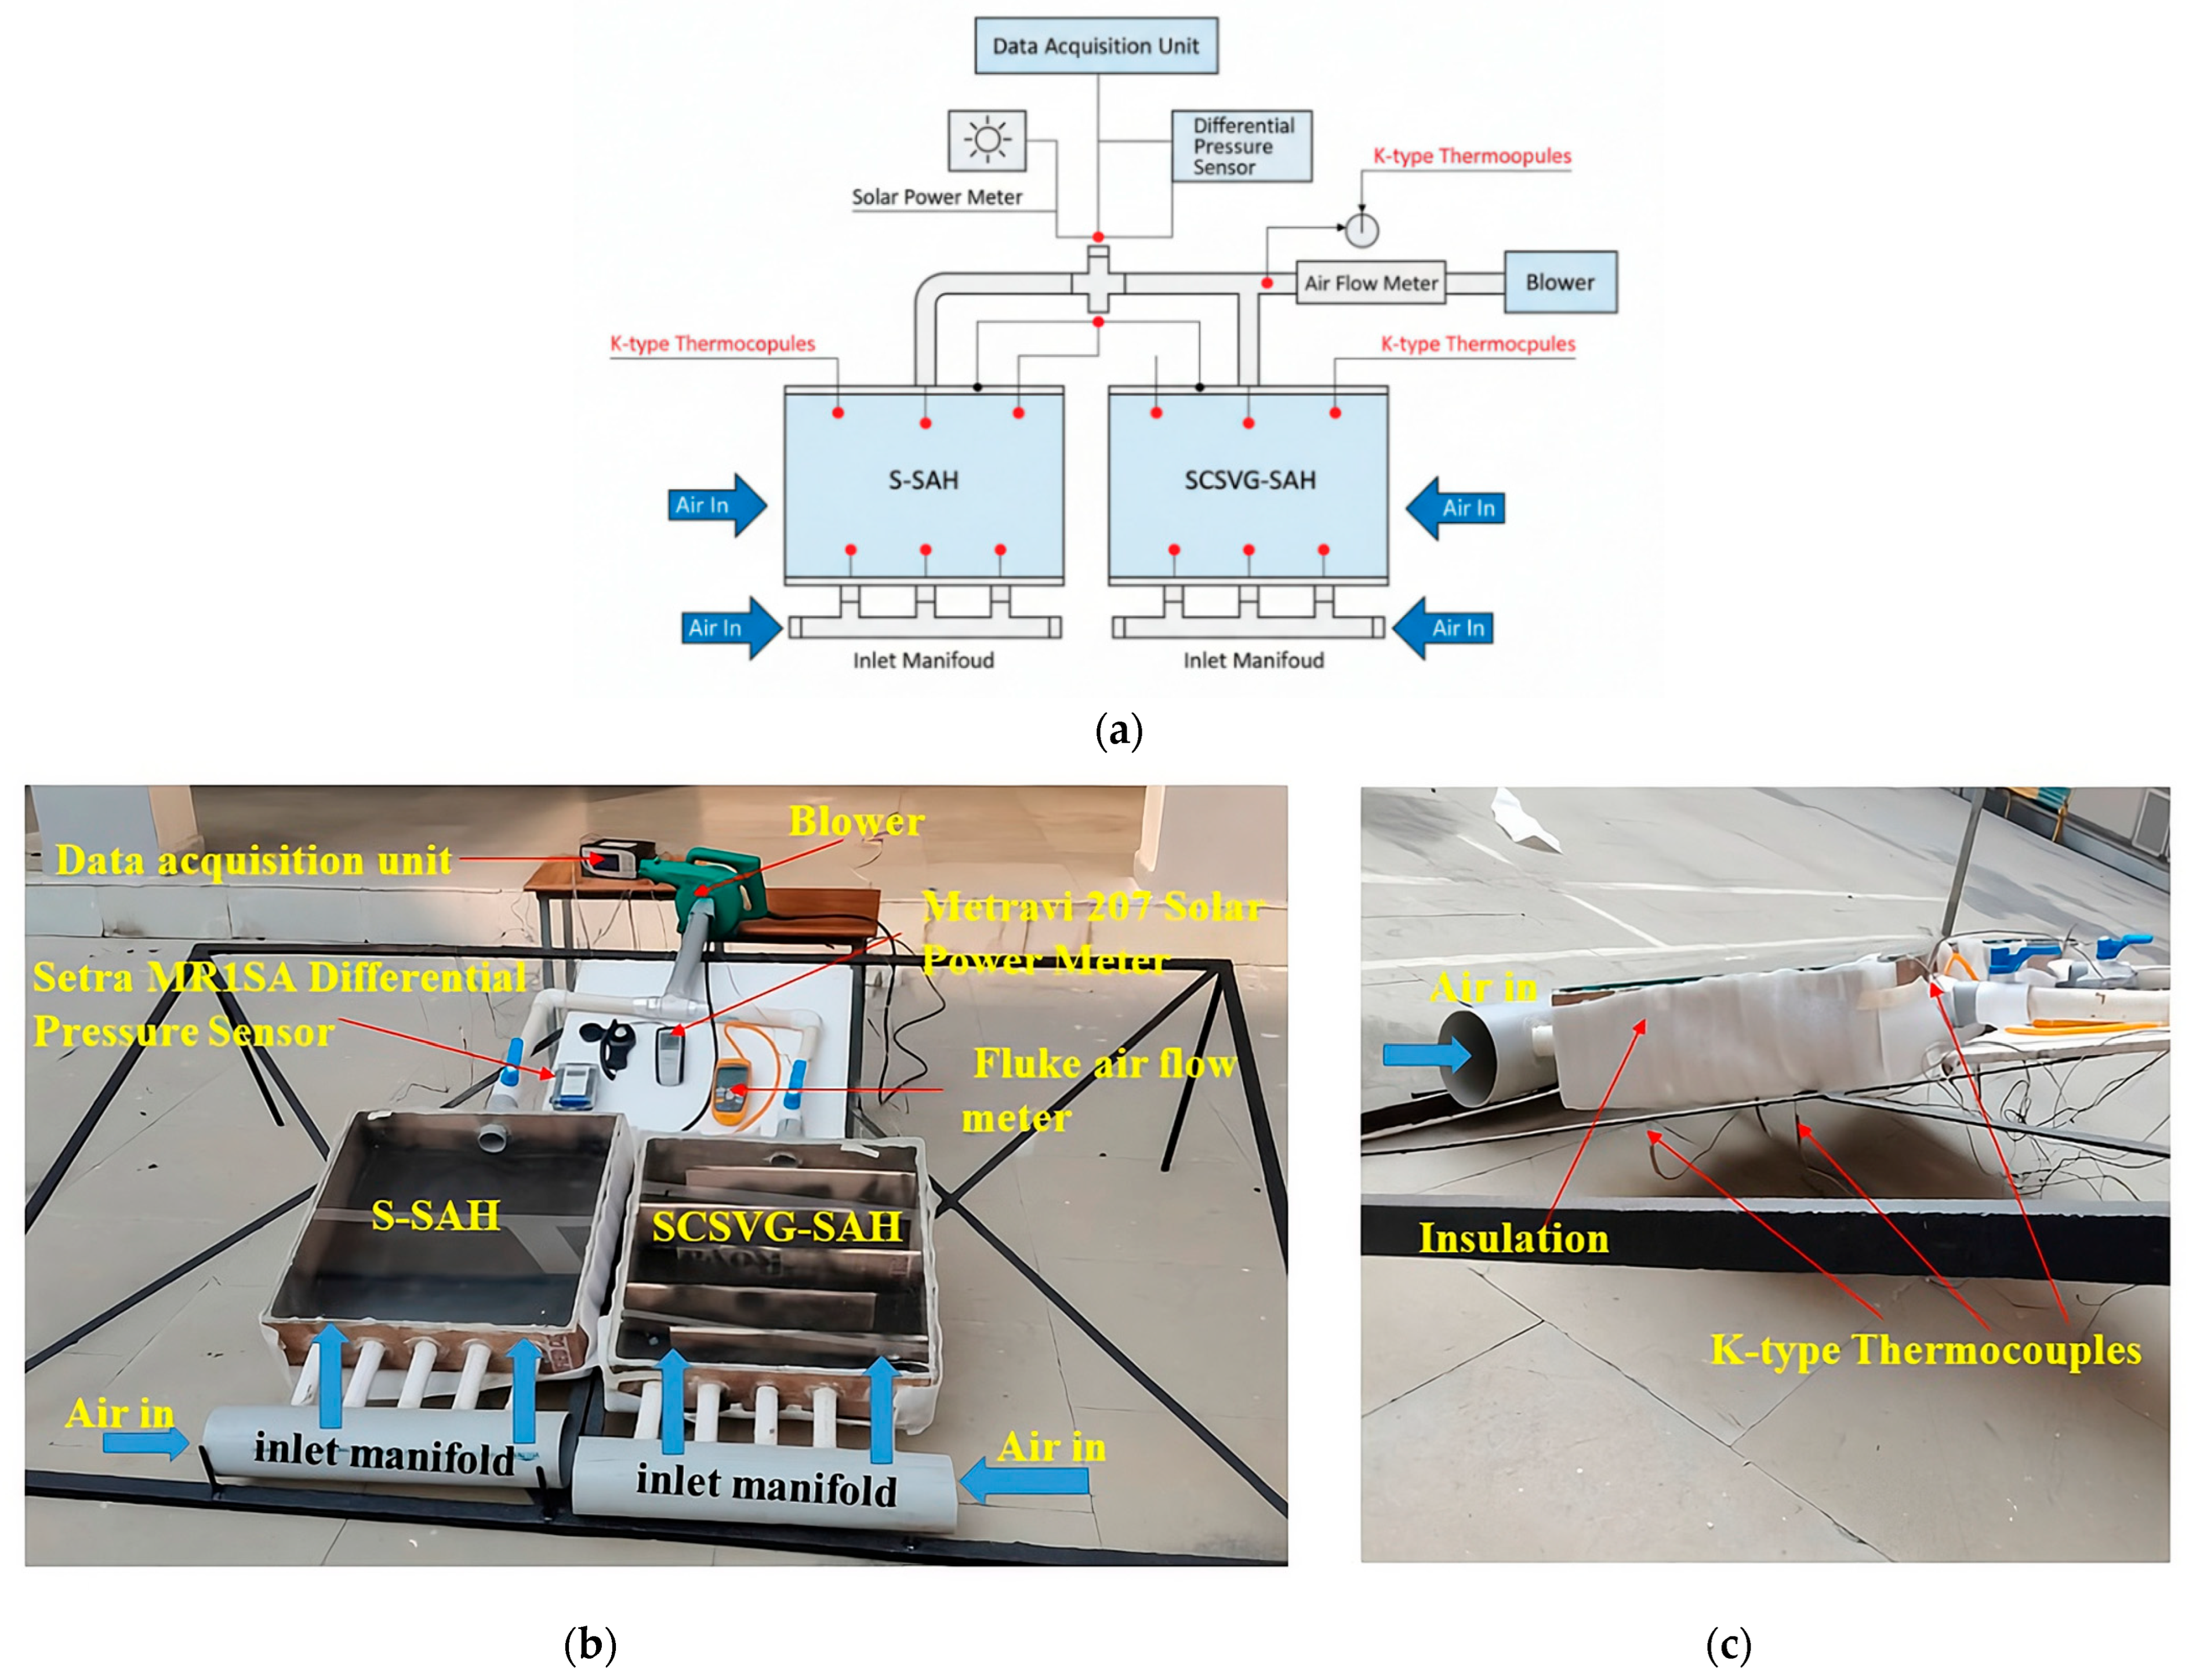
Temperature measurements were performed using calibrated K-type thermocouples (Omega Engineering Inc., Norwalk, CT, USA) with an accuracy of ±0.5 °C. Thermocouples were positioned at or in:
The spatial distribution of thermocouples along the absorber surface enabled the capture of temperature gradients associated with curvature-induced secondary motion and rib-induced mixing. All thermocouple signals were connected to a multi-channel data acquisition system for continuous logging.
2.4.2. Solar Irradiance Measurement
The global solar irradiance incident on the collector aperture was measured using a calibrated solar power meter (Metravi Instruments Pvt. Ltd., Mumbai, India; Model: Metravi 207) with an accuracy of ±10 W m−2. The sensor was placed in the collector plane to ensure representative measurement of incident radiation under winter outdoor conditions.
2.4.3. Airflow Measurement
The air mass flow rate was controlled using a variable-speed blower and regulated through a control valve installed between the collector outlet and blower inlet. The airflow rate was measured using a calibrated airflow meter (Fluke Corporation, Everett, WA, USA; Model: Fluke 922) with an uncertainty of ±1.8%. The investigated mass flow range was 0.012–0.061 kg s−1, corresponding to Reynolds numbers of approximately 2.1 × 10³ to 1.07 × 10⁴.
2.4.4. Pressure Drop Measurement
Hydraulic performance was evaluated using a differential pressure sensor (Setra Systems Inc., Boxborough, MA, USA; Model: MR1SA) with an uncertainty of ±0.1 Pa installed across the test section. The pressure taps were positioned at the inlet and outlet manifolds to capture the total system pressure loss, including entrance, exit, curvature, and rib-induced losses.
2.4.5. Data Logging and Sampling Procedure
All sensors were interfaced with a centralized multi-channel data acquisition unit to ensure synchronized and continuous monitoring of thermal and hydraulic parameters. Measurements were logged at 30 min intervals between 09:00 and 17:30 under clear-sky winter conditions. Selected readings were periodically cross-verified manually using digital display units to confirm measurement consistency. Reported values correspond to three-day-averaged datasets to minimize short-term environmental fluctuations. Details of instrumentation and measurement specifications used in experiments are presented in
Table 3.
2.5. Non-Dimensional Parameters and Curvature–Vortex Interaction Mechanism
The flow and heat transfer behavior of the present configuration can be interpreted using non-dimensional parameters governing internal flow in curved rectangular ducts. The hydraulic diameter of the duct is 0.1667 m. The airflow Reynolds number is defined as:
Across the investigated mass flow range (0.012–0.061 kg s
−1), the Reynolds number varies approximately from Re ≈ 2.1 × 10
3 to 1.07 × 10
4, corresponding to transitional to fully turbulent flow conditions. Because the airflow follows a serpentine path with a bend radius R
c = 50 mm, curvature effects are characterized using the Dean number:
For the present configuration, the Dean number ranges approximately from 2.7 × 10³ to 1.38 × 10⁴. Since significant secondary motion develops for De > 40, the entire operating range lies within a regime dominated by curvature-induced secondary flow. These Dean-type vortices introduce transverse velocity components within the duct cross-section and promote cross-sectional momentum redistribution beyond that observed in straight ducts.
The distributed three-dimensional serpentine vortex generators are fabricated from 2.3 mm diameter aluminum wire (commercial-grade, approximately 99% purity), procured from local industrial suppliers in India, with a geometric loop amplitude of approximately 40 mm and a pitch of 20 mm. Although the serpentine waveform spans a notable portion of the duct height, the effective obstruction thickness corresponds to the wire diameter, occupying a small fraction of the duct cross-sectional area. Consequently, the elements function as distributed vortex generators rather than high-blockage obstructions.
At lower Reynolds numbers, the wire diameter is comparable to the estimated near-wall laminar sublayer thickness, facilitating localized boundary layer disturbance. The inclined three-dimensional geometry induces asymmetric wake formation downstream of each element. These localized vortex structures interact with the curvature-induced secondary motion generated within the serpentine channel, producing compound flow patterns and sustained mixing along successive passes.
Therefore, convective enhancement in the present configuration arises from the coupled interaction of:
Curvature-induced secondary motion in a high-De regime,
Distributed three-dimensional vortex generation near the absorber surface,
Repeated flow redirection across multiple serpentine passes.
This compound transport mechanism provides a physical basis for the experimentally observed improvement in convective heat transfer and overall thermal performance across the investigated operating range.
2.6. Experimental Procedure
Schematic view and real pictorial view of the experimental setup is shown in
Figure 3. For each selected mass flow rate, the system was operated continuously under outdoor conditions. Because solar irradiance varies throughout the day, the collector performance was evaluated under transient operation rather than true steady-state conditions.
Data were recorded at 30 min intervals between 09:00 and 17:30. At each interval, instantaneous performance parameters were calculated using the measured temperatures, irradiance, and flow conditions corresponding to that time period.
Experiments were conducted over multiple clear-sky days under comparable environmental conditions. Only days exhibiting stable irradiance profiles and minimal cloud interruption were included in the analysis. To reduce the influence of short-term fluctuations, performance results were averaged over three consecutive days for each mass flow rate.
Both the smooth reference configuration (S-SAH) and the serpentine-channel configuration with distributed three-dimensional vortex generators (SCSVG-SAH) were tested under identical environmental conditions. The collectors were positioned side-by-side to ensure comparable solar exposure, ambient temperature, and wind effects during each measurement interval.
2.7. Governing Equations
2.7.1. Energy Analysis
The useful energy gain of the solar air heater is calculated as:
where
is the mass flow rate of air (kg s−1),
Cp is the specific heat of air (J kg−1 K−1),
To and Ti are the outlet and inlet air temperatures (K), respectively.
The thermal efficiency is defined as:
where
IT is the solar irradiance (W m−2),
Ac is the collector aperture area (m2).
2.7.2. Hydraulic Performance and Pumping Power
The electrical pumping power required to overcome flow resistance is calculated as:
where
ΔP is the measured pressure drop (Pa),
ρa is the density of air (kg m−3).
2.7.3. Thermo-Hydraulic Performance
To simultaneously account for thermal enhancement and hydraulic penalty, the thermo-hydraulic performance (THP) is defined as:
where
ηconv is the thermal–electric conversion factor used to convert blower electrical input into equivalent thermal energy penalty. In the present study,
ηconv = 0.18, following ref. [
43].
2.7.4. Exergy Analysis
Exergy efficiency is defined as:
where
is useful exergy gain, including blower irreversibility,
is the exergy of incident solar radiation.
The useful exergy is calculated as:
where
Ta is the ambient temperature (K).
The solar exergy input is
where Ψ is the Petela factor [
39]:
where
Ts is the apparent sun temperature (≈4350 K).
2.7.5. Environmental Indicators
Environmental analysis quantifies the operational carbon mitigation potential of the system, which includes studies of reduced CO2 emissions and carbon footprint.
Annual CO
2 mitigation is estimated as:
where
is the annual useful thermal energy expressed in kWh year
−1 and
is the grid emission factor (kg CO
2 kWh
−1) [
48]. The analysis reflects operational carbon displacement only and does not include embodied lifecycle emissions.
2.7.6. Economic Analysis
Economic analysis evaluates the cost-effectiveness of the artificially roughened SAHs, which includes estimation of investment and operating costs.
The levelized cost of heating is defined as:
where
TCI is the total cost of investment,
CRF is the capital recovery factor and
AMC is the annual maintenance cost, AMC was assumed to be 10% of the annualized capital cost (TCI × CRF), representing a conservative estimate for small-scale decentralized solar thermal systems.
The capital recovery factor is calculated as:
where
n is the SAH service life, and
i is the yearly interest rate.
The joint performance and economic evaluation is based on the following assumptions:
Thermophysical properties of air were evaluated at the mean bulk temperature and treated as constant over the investigated operating range.
Radiation heat exchange between internal duct surfaces was neglected relative to convective heat transfer within the airflow passage.
The grid emission factor used for CO2 mitigation estimation represents winter heating displacement under fossil-fuel-dominated electricity conditions.
AMC was taken as 10% of the annualized capital cost.
The annual interest rate was assumed as 10%, representing a typical mid-range financial condition for decentralized renewable energy systems.
Identical economic and environmental parameters were applied to both configurations to ensure consistent comparative assessment.
2.8. Uncertainty Analysis
Reliable interpretation of experimental results requires explicit assessment of measurement uncertainty, particularly in outdoor solar thermal testing, where multiple measured variables influence calculated performance indicators. In the present study, uncertainty estimation was performed using standard error propagation methods, incorporating both instrument-related and data processing uncertainties.
Systematic uncertainties were determined based on manufacturer specifications and pre-test verification. Random uncertainties were evaluated from repeated measurements.
2.8.1. Primary Measurement Uncertainties
All instruments used for monitoring solar irradiance, temperature, mass flow rate, air velocity, and pressure drop contribute individual uncertainties that propagate into calculated performance parameters.
Table 4 summarizes the principal instruments and their associated uncertainties.
Because temperature rise (ΔT = Tout − Tin) is a derived quantity, the combined uncertainty in ΔT was obtained using a root-sum-square (RSS) approach:
where
and
are the uncertainties of the inlet and outlet thermocouples, respectively.
Performance parameters such as thermal efficiency, exergy efficiency, pressure drop, and mass flow rate depend on several measured variables. Therefore, the propagation of uncertainty for any derived parameter R was calculated using the general expression:
2.8.2. Repeatability and Random Error Assessment
To evaluate repeatability, each operating condition was monitored over three consecutive clear-sky days. The standard deviation (σ) of repeated measurements was calculated, and data were screened using a ± 3σ acceptance criterion. All observations satisfied this criterion, confirming acceptable experimental repeatability.
2.8.3. Combined Uncertainty in Performance Indicators
The final combined uncertainties for the major performance indicators are given below in
Table 5.
Error bars corresponding to these uncertainties are included in the performance plots to visually represent confidence intervals. The obtained uncertainty levels (±2.9% for thermal efficiency and ±3.1% for exergy efficiency) are consistent with those reported in recent experimental solar air heater studies [
16,
22,
34], indicating acceptable experimental accuracy.
2.9. Validation of Experimental Setup
To verify the reliability of the experimental facility and data reduction methodology, validation experiments were conducted using the smooth-duct solar air heater (S-SAH) configuration as a reference case. The present system operates under outdoor conditions with variable solar irradiance and multi-pass airflow, resulting in non-uniform heat flux distribution as well as additional entrance, exit, and turning losses. Therefore, classical Nusselt–Reynolds correlations developed for idealized laboratory straight ducts are not directly applicable for strict analytical validation. Instead, validation was performed at the system level by comparing the measured thermal efficiency magnitude and trend with previously reported outdoor experimental studies of conventional solar air heaters.
Based on three-day-averaged peak values, the smooth configuration exhibited thermal efficiencies ranging from 65.8% at ṁ = 0.012 kg s
−1 to 67.7% at ṁ = 0.061 kg s
−1 across the investigated mass flow interval. These values fall within the typical range of 60–70% reported for conventional single-pass solar air heaters tested under outdoor conditions in experimental investigations by Momin et al. [
7], Lanjewar et al. [
8], Hans et al. [
9], Bhagoria et al. [
33], and Hassan et al. [
19]. Similar performance magnitudes and increases in monotonic efficiency with mass flow rate have been documented in more recent outdoor studies by Gilani et al. [
13], Wang et al. [
27], Mondloe and Ghritlahre [
22], Alrashidi et al. [
42], and Chand et al. [
43]. The observed agreement in both absolute efficiency level and mass-flow-dependent trend suggests that the present smooth configuration exhibits performance characteristics consistent with the established experimental solar air heater literature, thereby validating the measurement framework and data reduction methodology adopted in this study. The agreement in both absolute magnitude and mass-flow-dependent trend, combined with the quantified uncertainty bounds (±2.9%), indicates that the experimental deviation from literature-reported ranges remains within acceptable limits for outdoor solar thermal testing.
3. Results and Discussion
This section presents a systematic evaluation of the thermal, hydraulic, exergetic, environmental, and economic performance of the serpentine-channel solar air heater with vortex generators (SCSVG-SAH) in comparison with the smooth configuration (S-SAH). All values include propagated uncertainties (±2.9% for thermal efficiency, ±3.1% for exergy efficiency).
3.1. Transient Temperature Characteristics
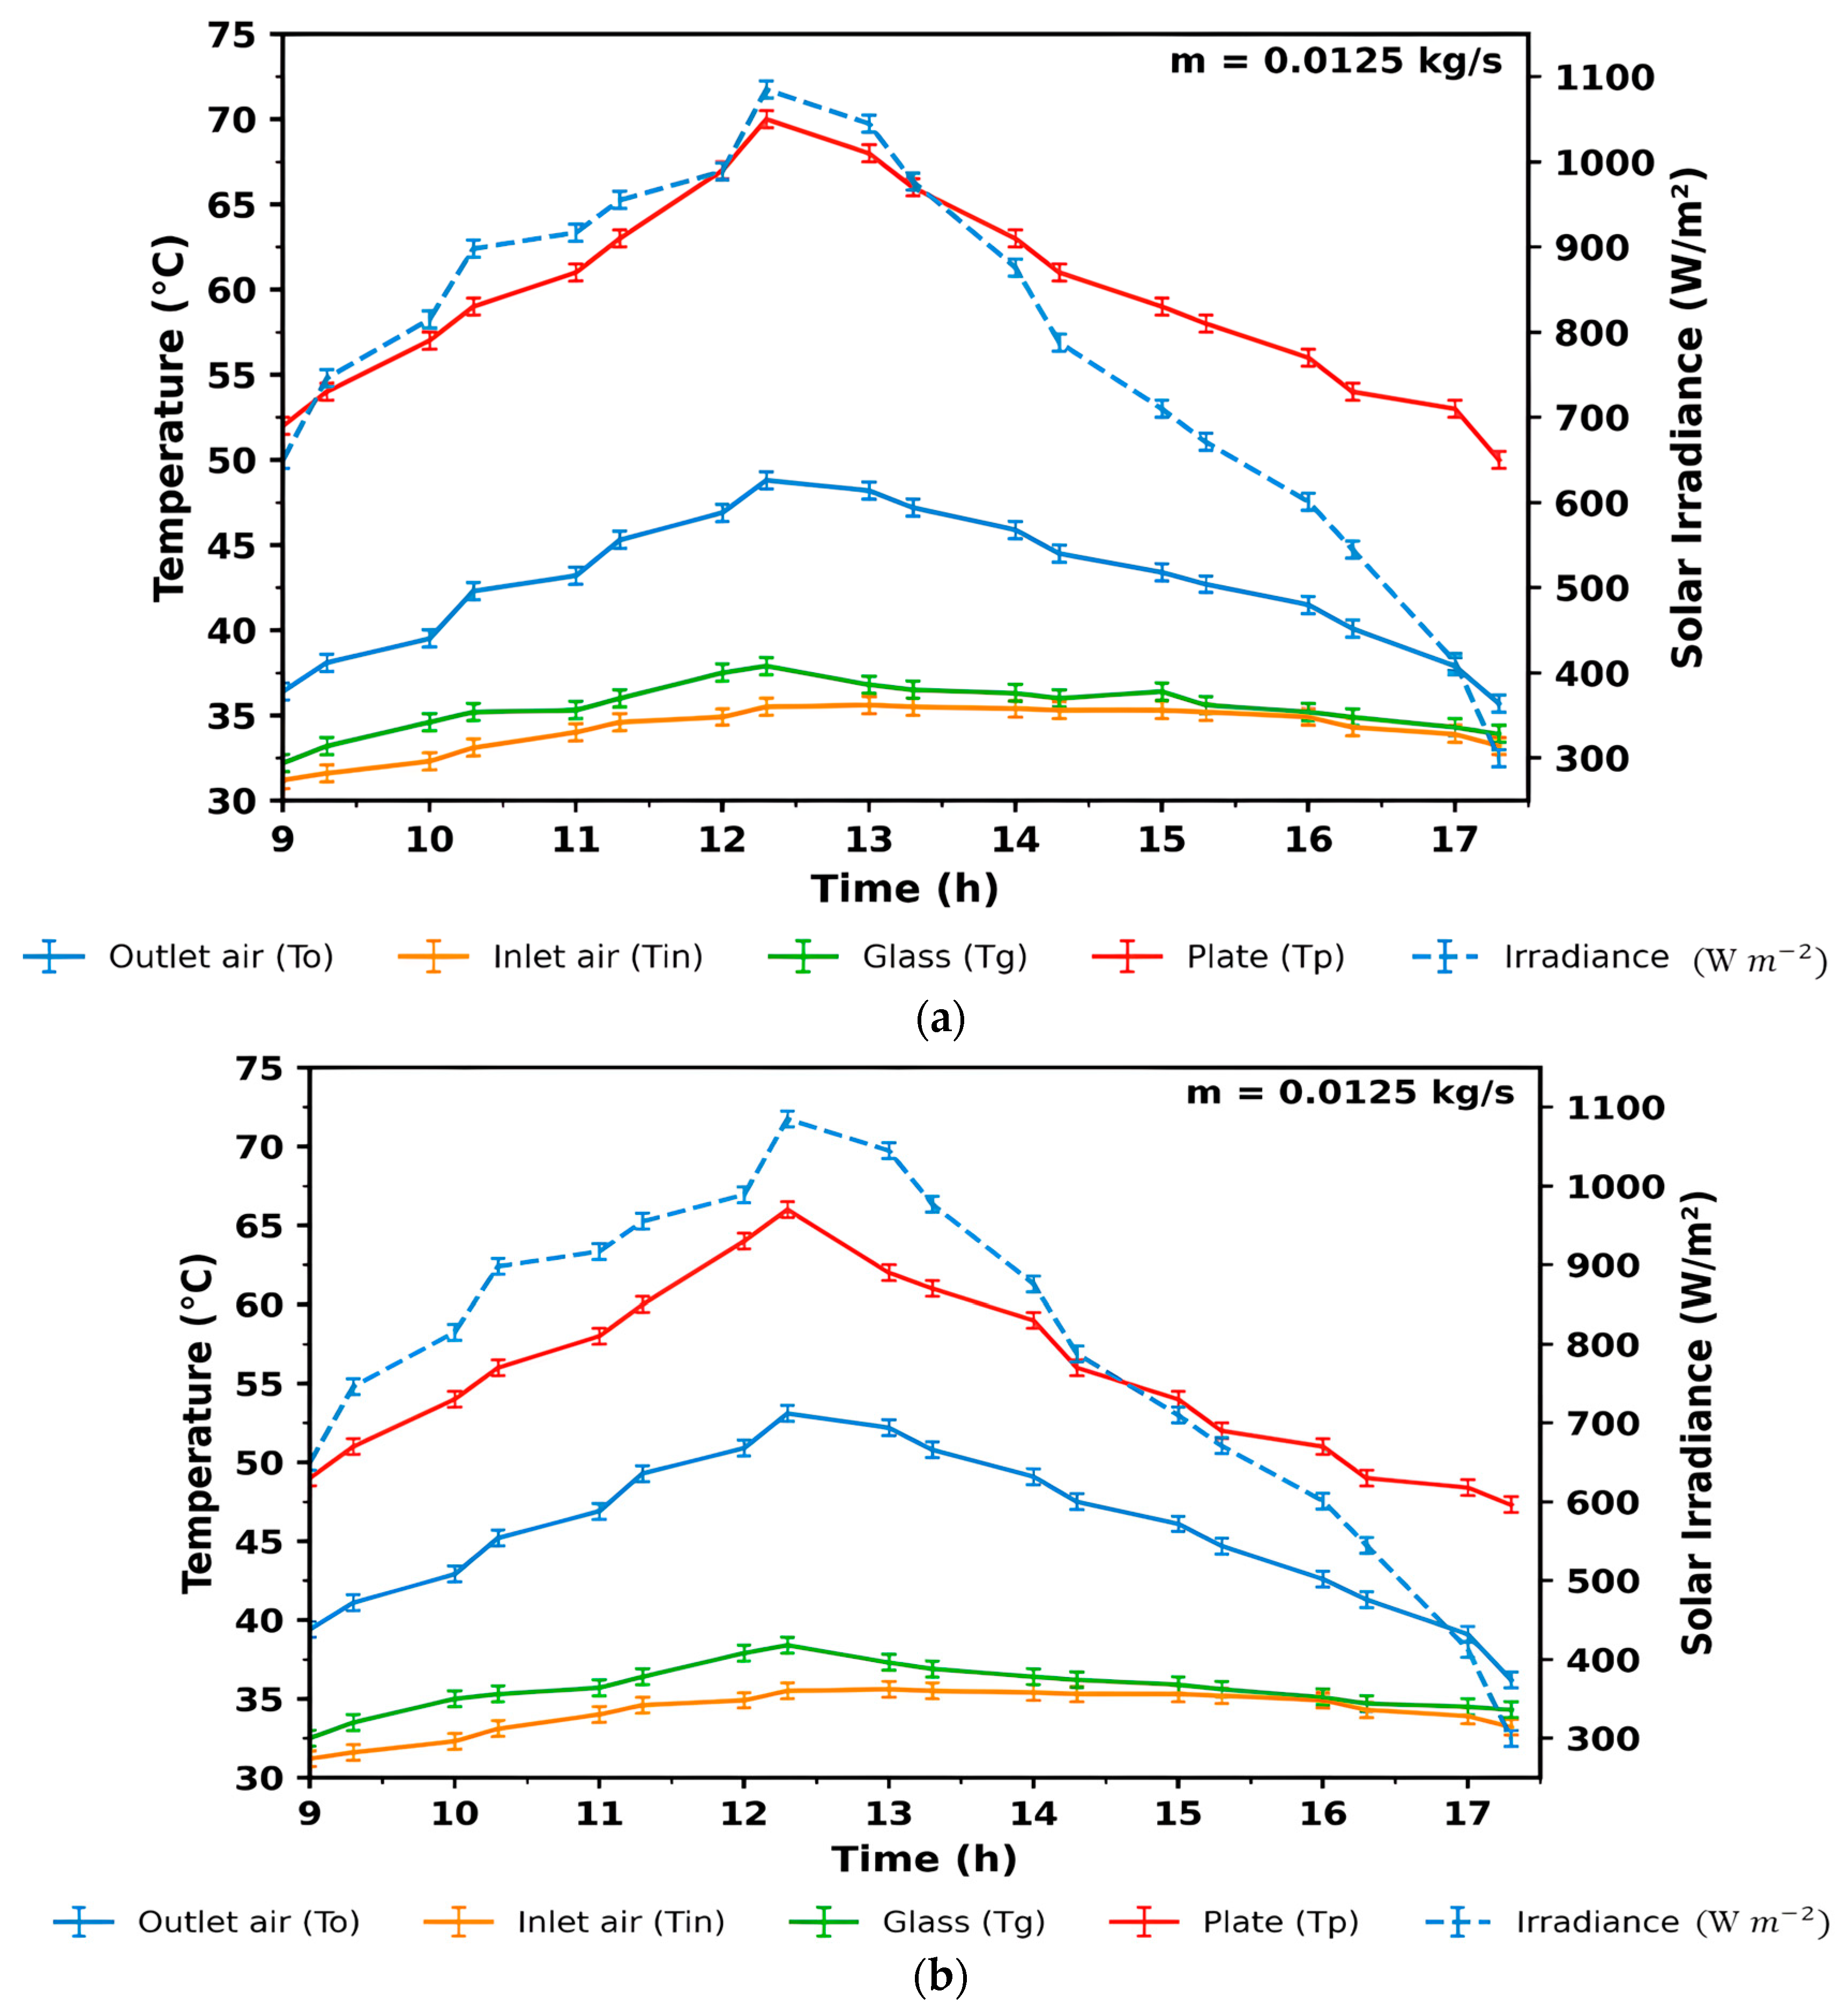
Figure 4a,b present the temporal variation in inlet air temperature, outlet air temperature, absorber plate temperature, and glass cover temperature for the smooth solar air heater (S-SAH) and the modified serpentine-channel configuration with vortex generators (SCSVG-SAH) under representative winter operating conditions.
Both systems were tested under comparable inlet temperature and irradiance profiles, ensuring that performance differences arose primarily from internal flow and heat transfer mechanisms rather than external boundary variations. For the smooth configuration, the peak outlet air temperature reached 48.8 °C at midday (12:30), while the absorber plate temperature increased to approximately 70 °C. In contrast, the SCSVG-SAH achieved a higher peak outlet temperature of 53.1 °C, accompanied by a reduced absorber temperature of approximately 66 °C under identical operating conditions. The simultaneous increase in outlet temperature (≈4.3 °C) and reduction in absorber temperature (≈4 °C) provides direct experimental evidence of intensified convective heat extraction from the absorber surface.
The six-pass serpentine configuration increases the effective flow length to approximately 3.0 m, extending the absorber–air interaction time. The combined action of curvature-induced secondary motion and rib-induced wake formation produces sustained three-dimensional mixing throughout the duct, reducing thermal stratification and strengthening absorber–air thermal coupling. The observed reduction in absorber temperature, together with the elevated outlet air temperature, suggests that heat extraction from the absorber surface is intensified in the modified configuration, resulting in improved thermal transport from the absorber to the working fluid.
3.2. Convective Enhancement and Thermal Efficiency
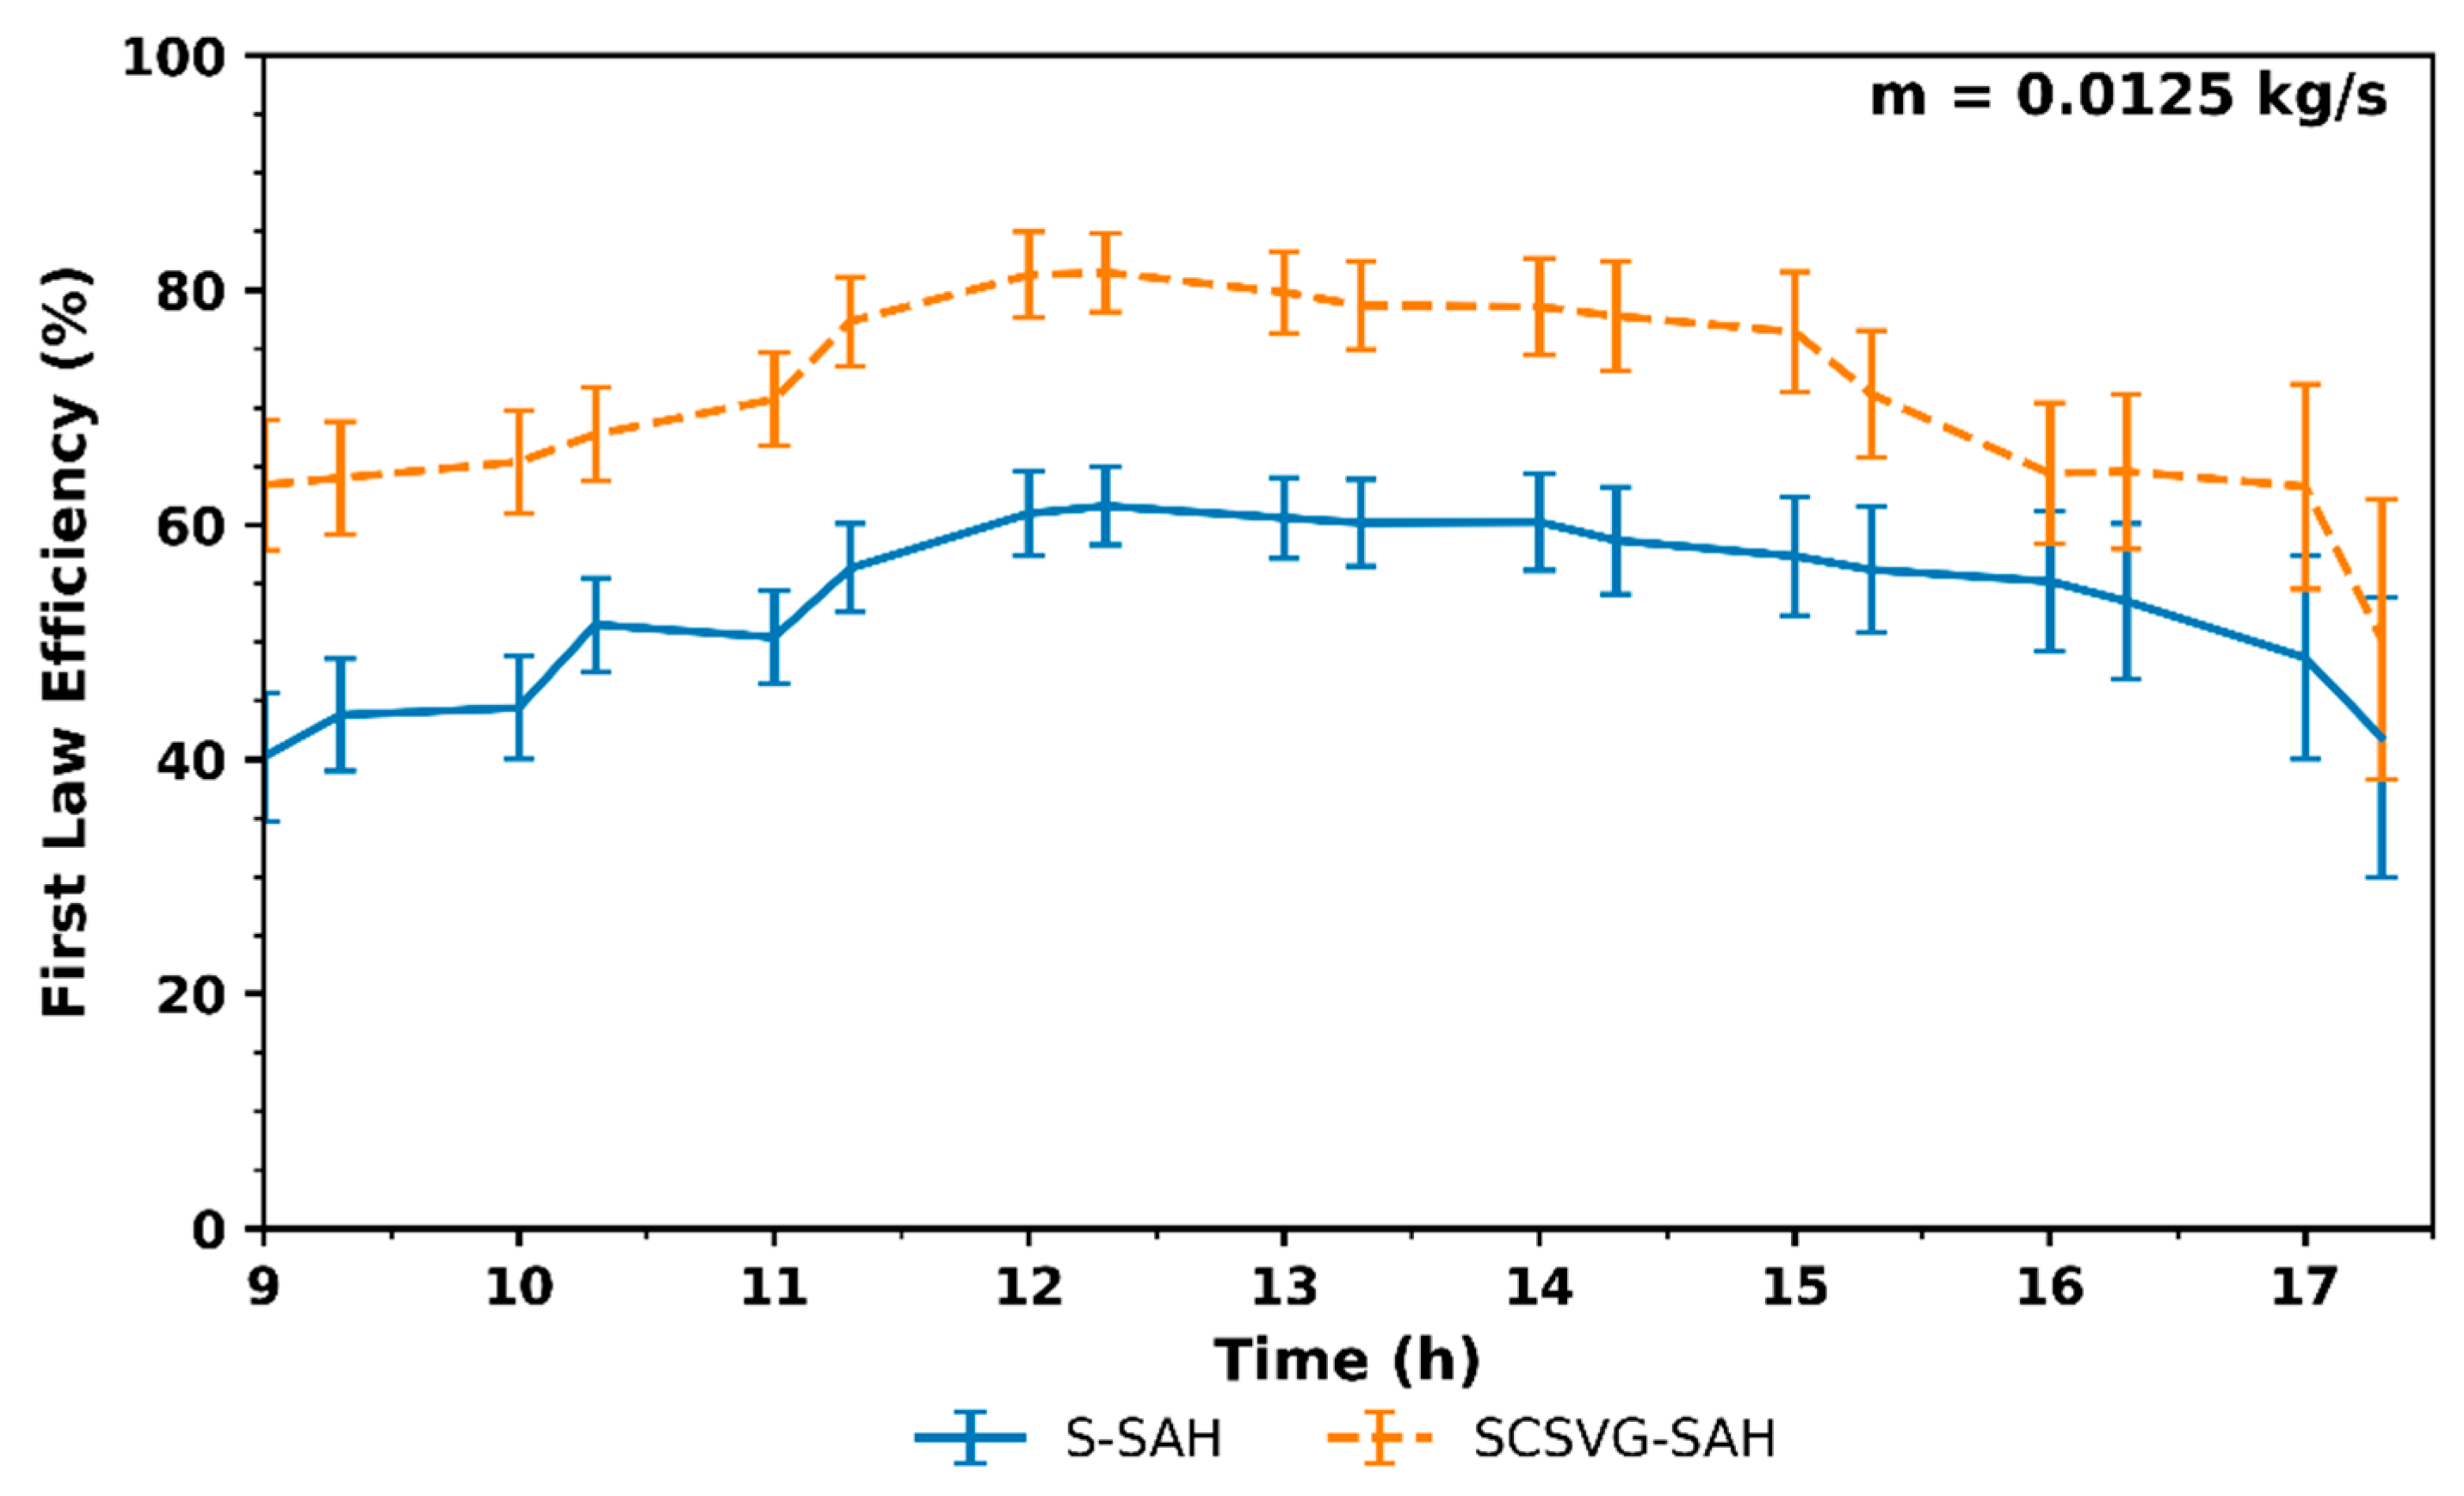
Figure 5 presents the temporal variation in thermal efficiency under representative winter operation, while
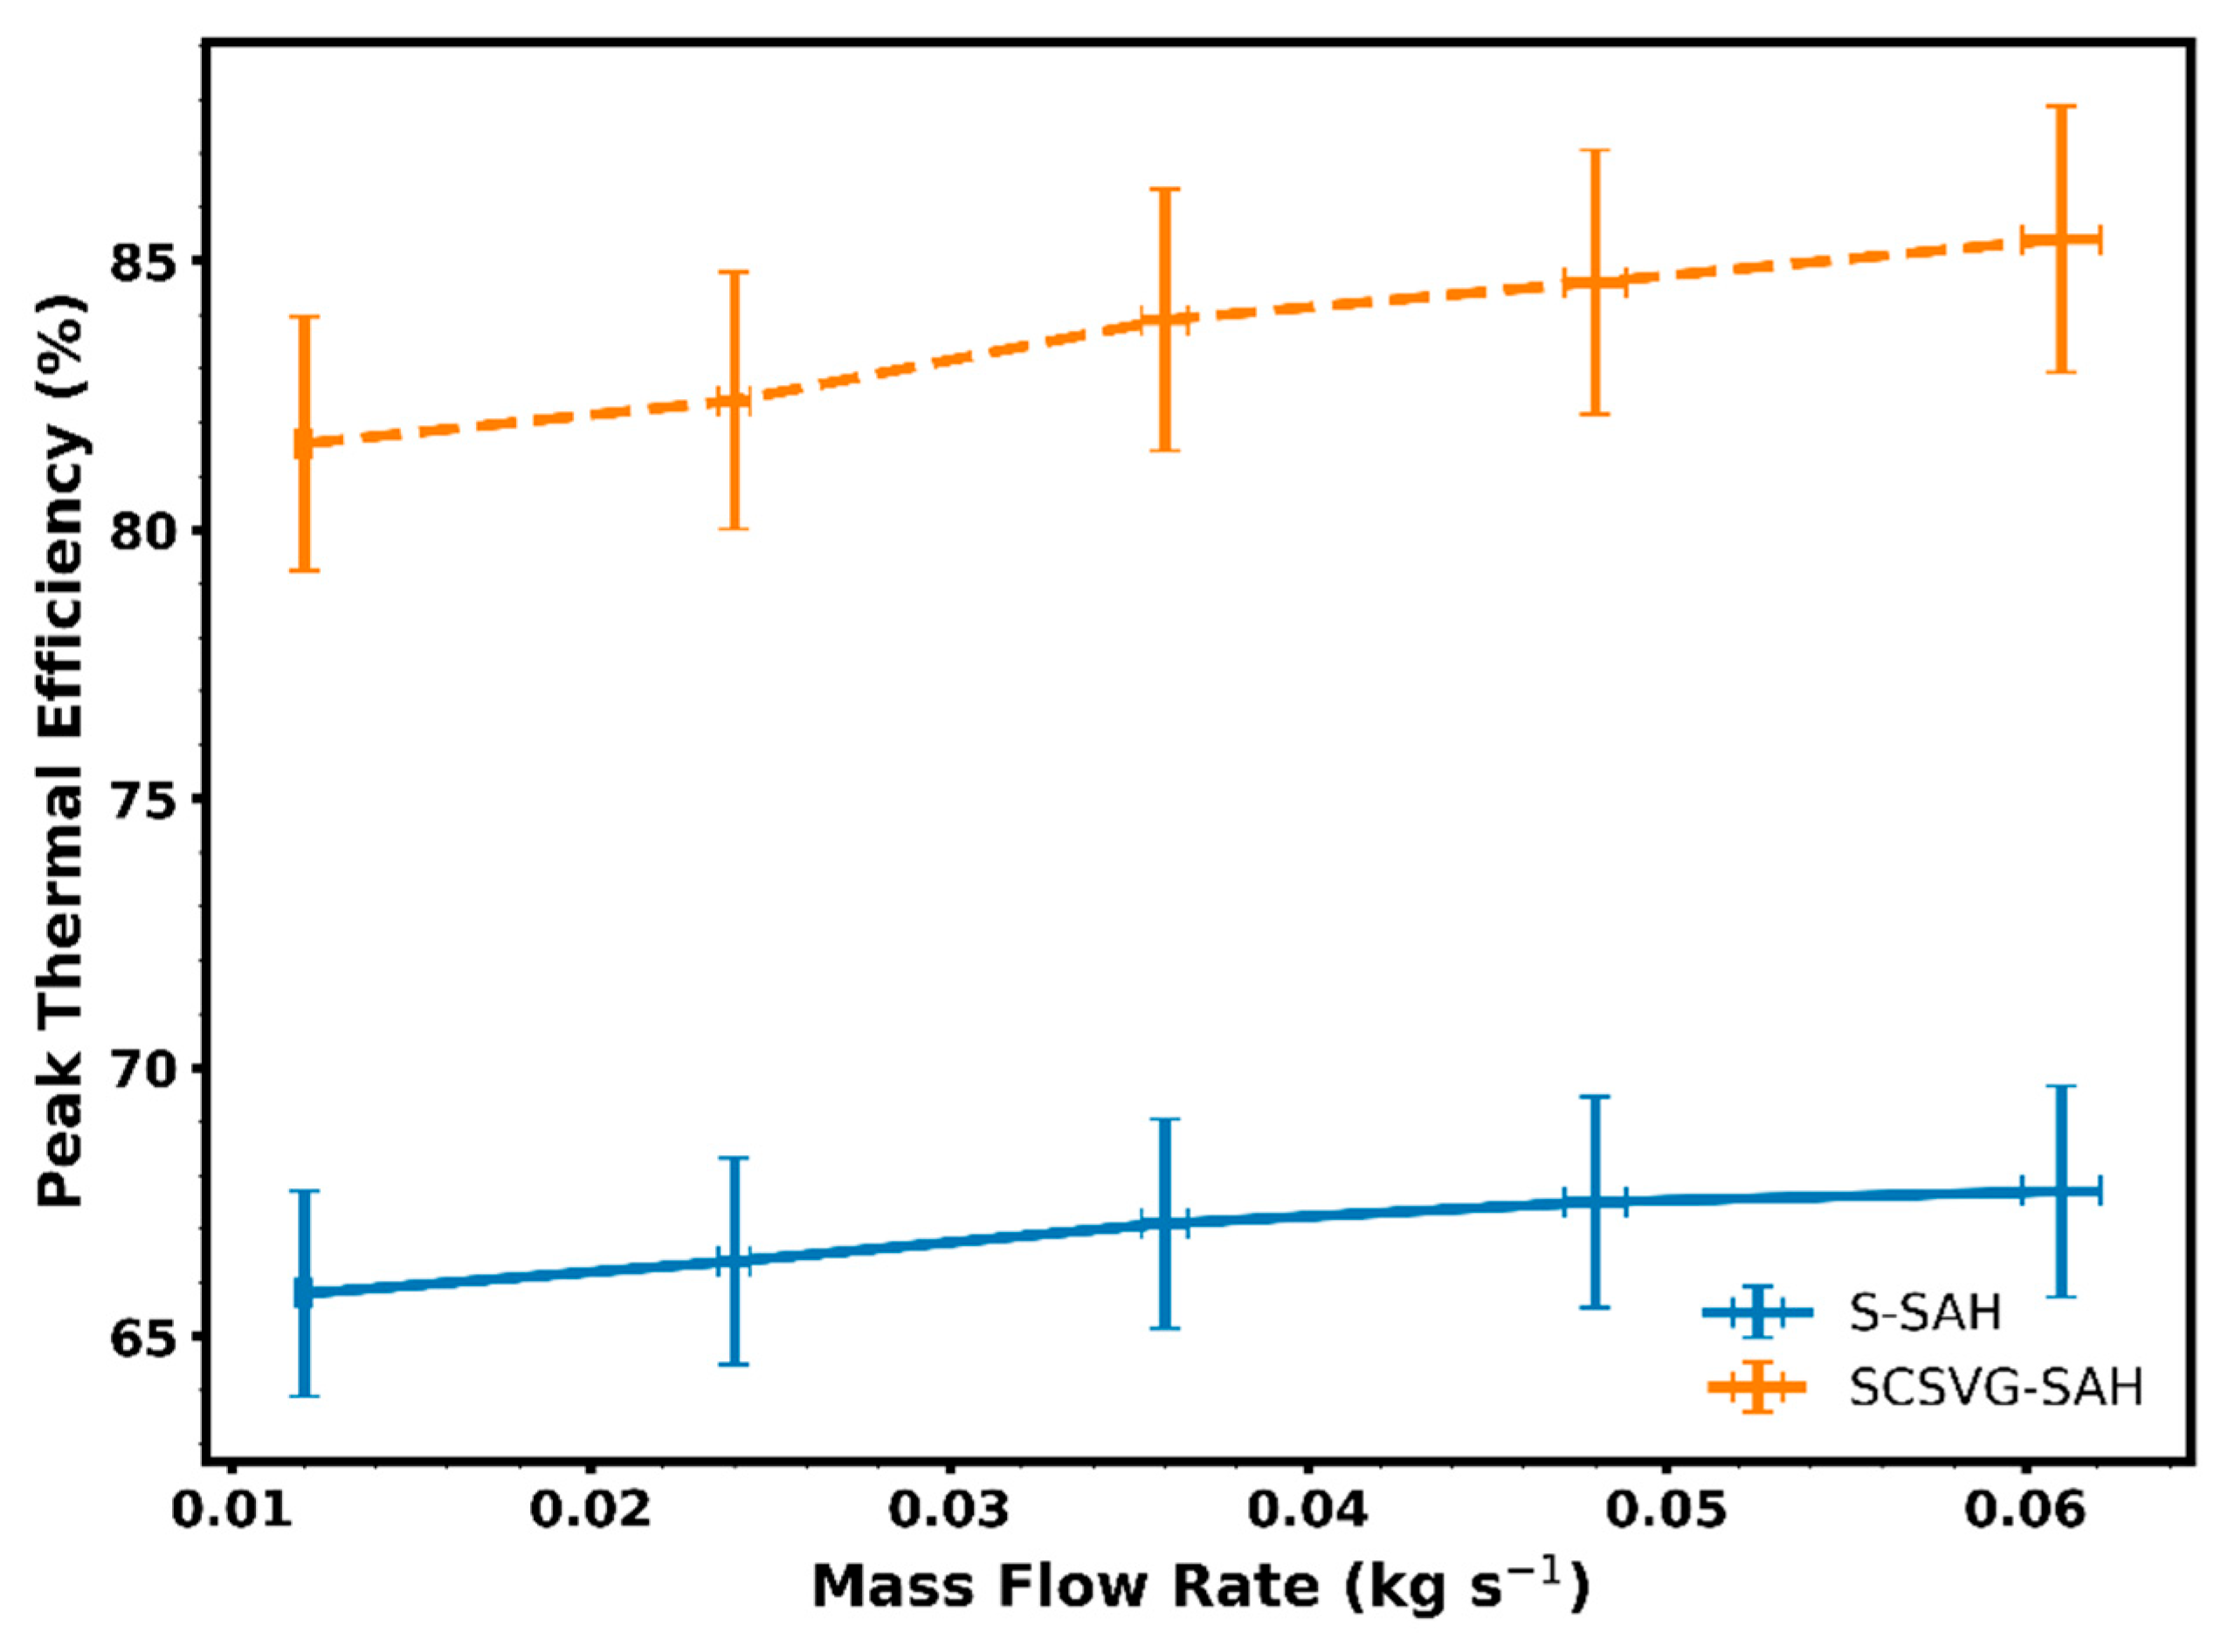
Figure 6 illustrates the dependence of three-day-averaged peak thermal efficiency on the mass flow rate. Across all tested conditions, the SCSVG-SAH consistently indicates higher thermal efficiency than the smooth configuration under comparable irradiance and inlet temperature conditions.
3.2.1. Mass Flow Rate Dependence
Based on three-day-averaged peak values, the smooth SAH exhibits efficiencies ranging from 65.8% at ṁ = 0.012 kg s−1 to 67.7% at ṁ = 0.061 kg s−1. In contrast, the SCSVG-SAH achieves efficiencies from 81.6% to 85.4% across the same mass flow interval. The efficiency of both configurations increases with mass flow rate due to enhanced convective heat transfer coefficients and reduced absorber temperature. However, the magnitude of improvement differs substantially. The smooth configuration shows a modest increase of approximately 1.9 percentage points, whereas the enhanced configuration exhibits an increase of approximately 3.8 percentage points across the investigated Reynolds number range (Re ≈ 2.1 × 10³ to 1.07 × 10⁴).
More importantly, the absolute efficiency enhancement between configurations remains consistently high, varying between 15.8 and 17.7 percentage points. This stable gap indicates that geometric transport intensification plays a primary role in performance enhancement beyond the effect of airflow increase alone. In comparison with previously reported rib-roughened and artificial-roughness solar air heaters, the magnitude of enhancement observed in the present study is comparatively higher. Experimental investigations employing V-shaped ribs, S-shaped ribs, transverse wire ribs, and louvered fins typically report thermal efficiency improvements in the range of approximately 8–12 percentage points under comparable Reynolds number regimes [
7,
8,
9,
22,
27,
33,
43]. In contrast, the coupled serpentine–vortex configuration investigated here delivers a sustained improvement of approximately 15.8–17.7 percentage points over the smooth reference system. This indicates that compound curvature–vortex interaction provides a stronger enhancement mechanism than single-mode near-wall roughness strategies. The enhanced performance therefore arises not merely from localized boundary layer disruption but from sustained cross-sectional mixing driven by the combined action of Dean-type secondary flow and distributed three-dimensional vortex generation.
3.2.2. Transient Daily Behavior
The time-resolved data (09:00–17:30) further confirm sustained performance enhancement throughout the operating window. During peak midday irradiance, thermal efficiency reaches approximately 65.8% for the smooth SAH and 81.6% for the SCSVG-SAH. Even during lower irradiance periods in the morning and late afternoon, the enhanced configuration maintains a clear and consistent efficiency advantage. The reduction from instantaneous peak values to daily averaged values reflects natural variations in solar irradiance and ambient temperature. Importantly, the relative efficiency difference between configurations remains nearly uniform throughout the daily cycle, indicating stable transport enhancement rather than isolated peak amplification.
3.2.3. Daily Averaged Performance Assessment
While peak efficiencies provide insight into maximum system capability under favorable irradiance conditions, daily averaged efficiency offers a more realistic representation of operational performance under transient outdoor exposure. Based on complete 30 min interval datasets (09:00–17:30) averaged over three consecutive clear days, the smooth SAH exhibits daily averaged thermal efficiencies in the range of approximately 56–59% across the investigated mass flow interval. In contrast, the SCSVG-SAH achieves daily averaged efficiencies of approximately 71–75% under identical operating conditions. The enhanced configuration therefore maintains an average efficiency advantage of approximately 14–16 percentage points over the smooth collector throughout the full operating day. This sustained improvement suggests that the performance enhancement is not limited to short-duration peak irradiance periods but persists under varying solar intensity and ambient conditions. The difference between peak and daily averaged values reflects natural irradiance fluctuations and transient heat loss effects during morning and late-afternoon operation. However, the relative efficiency gap between configurations remains stable, demonstrating that the compound curvature–vortex mechanism delivers consistent thermal benefit over practical operating cycles.
3.2.4. Physical Interpretation of Thermal Efficiency Results
The observed increase in efficiency with mass flow rate follows established solar air heater behavior: higher airflow strengthens convective heat transfer coefficients, reduces thermal boundary layer thickness, and lowers absorber temperature, thereby improving useful heat gain. In the SCSVG-SAH, curvature-induced secondary motion combined with distributed three-dimensional vortex generation intensifies absorber–air thermal coupling across successive serpentine passes. This compound transport interaction promotes sustained cross-sectional mixing and periodic boundary layer disruption, leading to consistently higher heat transfer effectiveness across the full Reynolds number range without excessive sensitivity to mass flow variation.
3.2.5. First-Law Consistency Check
For flat-plate solar air heaters, the theoretical upper bound under negligible heat loss conditions is governed by the optical efficiency term (τα), typically in the range 0.88–0.91 for single-glazed collectors. The experimentally obtained efficiency range of 81.6–85.4% for the SCSVG-SAH remains within this optical efficiency band. Considering the experimental uncertainty (±2.9%), the measured efficiencies are fully consistent with first-law constraints and do not indicate overestimation of absorbed solar energy. Importantly, the achieved peak efficiency (85.4%) remains below the optical upper bound (τα ≈ 0.90), indicating that the observed enhancement arises from improved internal heat transfer rather than overestimation of absorbed solar energy. This suggests physical realism of the compound curvature–vortex transport mechanism. Even when considering the upper bound of experimental uncertainty, the maximum measured efficiency does not exceed the theoretical optical constraint, confirming the physical realism of the measured dataset.
3.3. System-Level Heat Loss Analysis
To quantify the influence of internal convective enhancement on overall collector heat dissipation, a system-level energy balance was applied. The absorbed solar energy incident on the collector aperture is expressed as:
where
τα is the optical absorption product.
The total system heat loss is then obtained as
This total loss term inherently includes heat losses from the top glazing, bottom insulation, and side walls of the collector. An effective overall heat loss coefficient,
UL, is estimated using
3.3.1. Heat Loss Behavior
Across the investigated mass flow range, the SCSVG-SAH consistently exhibits lower effective UL values than the smooth configuration. The reduction becomes more evident at higher mass flow rates, where intensified convective heat extraction lowers the absorber plate temperature. Because radiative and convective heat losses through the glazing are proportional to the temperature difference (Tp − Ta), a reduction in absorber temperature directly suppresses external heat dissipation.
Thus, the enhanced configuration improves performance through two primary mechanisms:
The improvement is therefore not attributable to increased airflow alone but to the coupled effect of transport intensification and loss suppression.
3.3.2. Representative Sample Calculation
The representative heat loss calculation is based on instantaneous peak irradiance data (12:30), whereas reported efficiency trends are based on three-day-averaged datasets. A sample calculation at representative peak irradiance conditions (ṁ = 0.012 kg s
−1) is given in
Table 6, Data are as follows:
Common data: Time: 12:30, Ac = 0.25 m2, Ti = 35.5 °C, Ta = 34.8 °C, IT = 1085 W m−2, Cp = 1007 J kg−1 K−1, τα = 0.90
SCSVG-SAH: To = 53.1 °C, Tp = 66 °C
Smooth SAH (S-SAH): To = 48.8 °C, Tp = 70 °C
This represents an approximate 57% reduction in effective heat loss coefficient at peak irradiance conditions.
3.3.3. Daily Averaged Heat Loss Coefficient
To ensure realistic performance representation, daily averaged values were computed using the complete 30 min interval dataset (09:00–17:30) and evaluated through cumulative energy balance rather than arithmetic averaging of instantaneous coefficients.
The resulting daily averaged overall heat-loss coefficients are:
This corresponds to an approximate 24.7% reduction in daily averaged effective heat loss coefficient for the enhanced configuration relative to the smooth collector. The higher daily averaged UL values compared to peak-condition estimates reflect the influence of reduced irradiance levels and increased relative thermal losses during morning and late-afternoon operation. Importantly, the sustained reduction across the entire operating window suggests that the serpentine–vortex configuration suppresses external heat dissipation under realistic outdoor conditions rather than only at peak irradiance.
3.3.4. Physical Interpretation of Heat Loss Results
The reduction in UL is primarily attributed to intensified internal convective heat extraction within the serpentine–vortex configuration. Enhanced absorber–air coupling lowers the absorber plate temperature, thereby reducing the driving temperature difference (Tp − Ta) responsible for radiative and convective losses through the glazing.
Although absolute UL values may vary with wind velocity and ambient conditions, both collectors were tested simultaneously under identical environmental exposure. Consequently, the observed reduction in system-level heat loss is directly attributable to the compound interaction between curvature-induced secondary motion and distributed three-dimensional vortex generation.
These results confirm that geometric transport intensification not only strengthens internal convection but also mitigates external heat losses under realistic outdoor operating conditions.
3.4. Pressure Drop and Pumping Power Characteristic
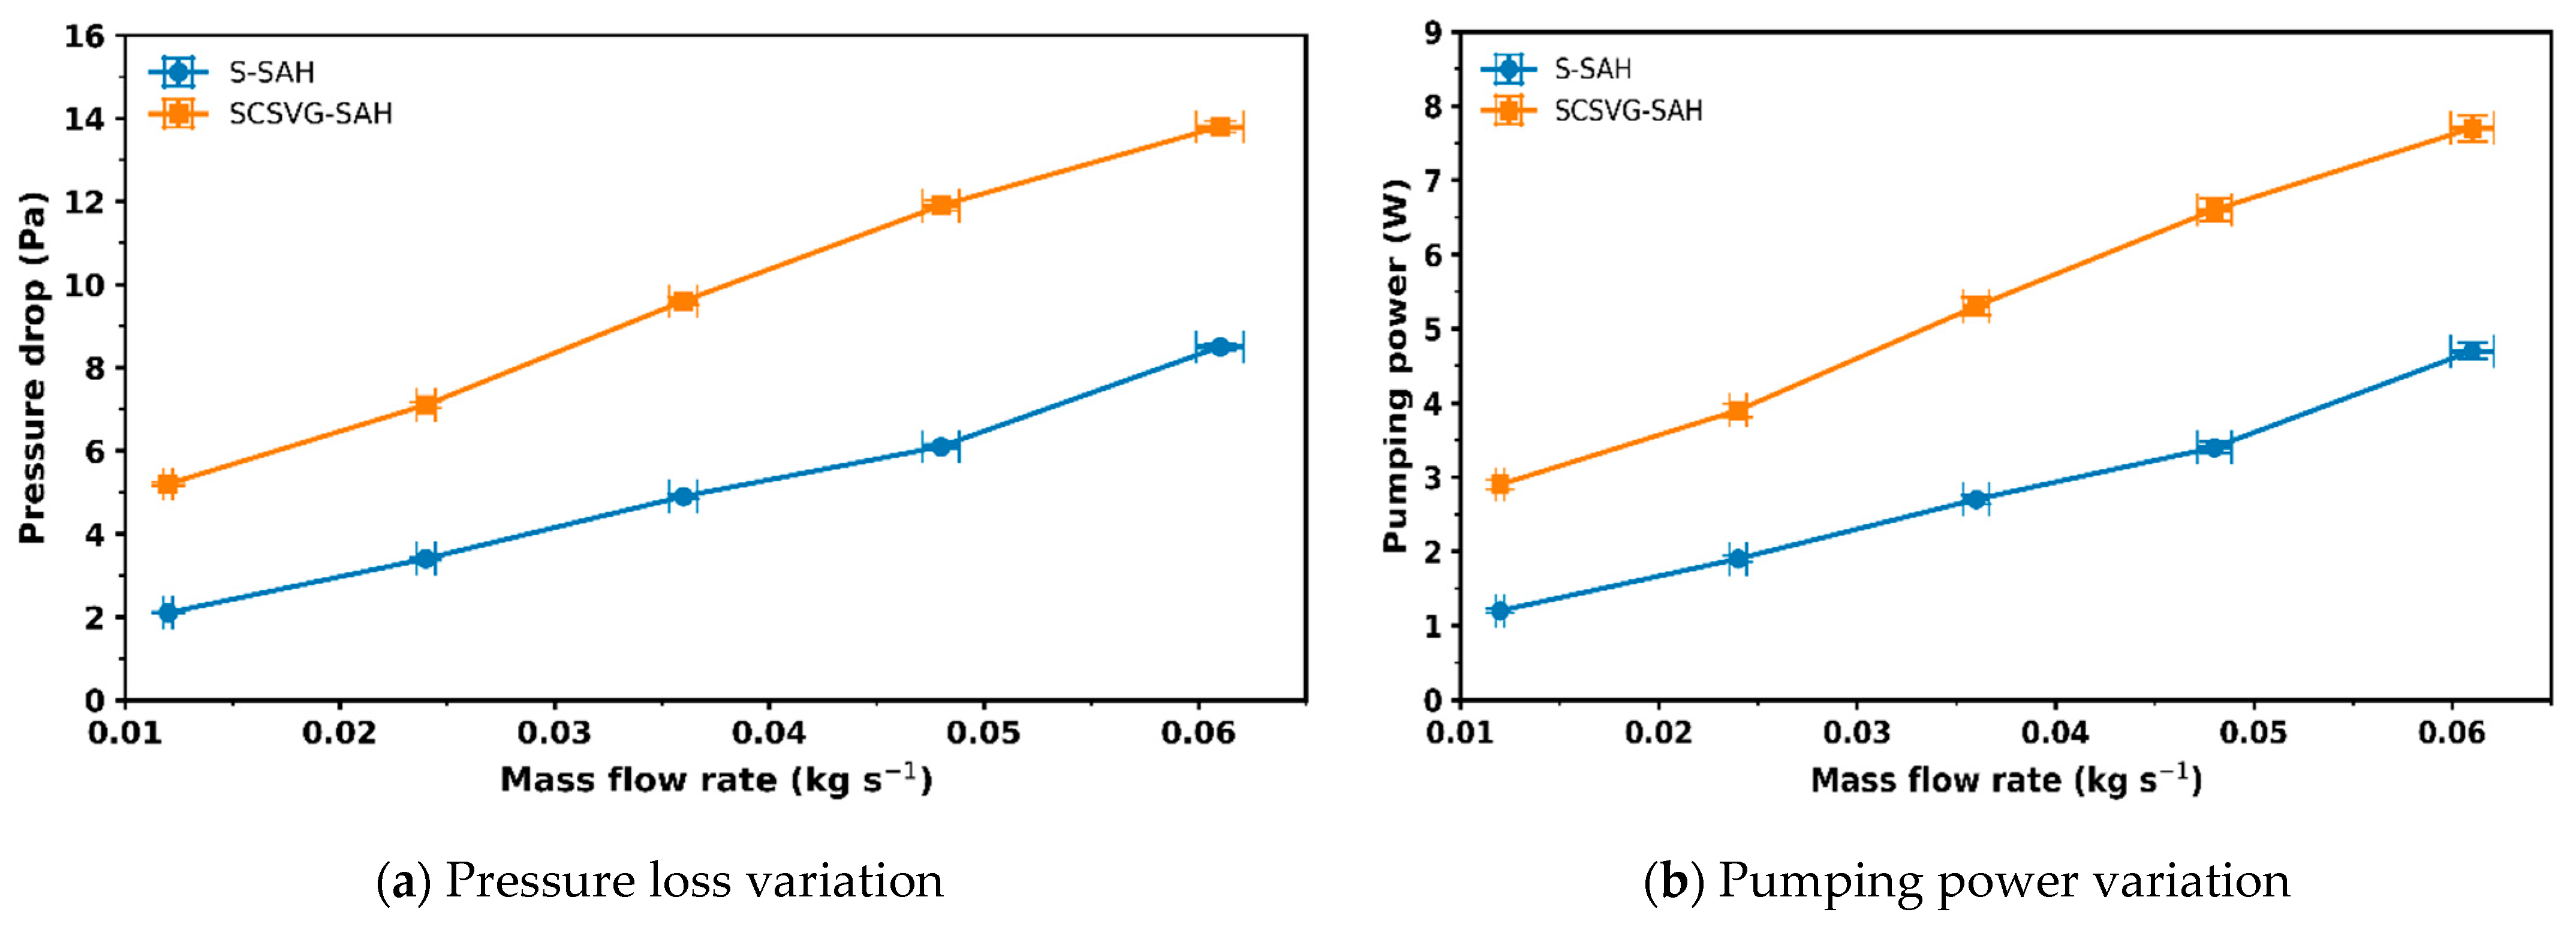
Figure 7a,b illustrate the variation in pressure drop and pumping power with mass flow rate over ṁ = 0.012–0.061 kg s
−1 for both configurations. For the smooth SAH, the pressure drop increases from 2.1 Pa at ṁ = 0.012 kg s
−1 to 8.5 Pa at ṁ = 0.061 kg s
−1. The corresponding pumping power rises from 1.2 W to 4.7 W following the expected increase in dynamic pressure and frictional losses with mass flow rate. In contrast, the SCSVG-SAH exhibits higher hydraulic resistance, with the pressure drop increasing from 5.2 Pa to 13.8 Pa across the same mass flow range. This corresponds to an approximately 2.5 times higher pressure drop at the lowest mass flow rate and an approximately 1.6 times higher one at the highest mass flow rate compared to the smooth duct. The associated pumping power increases from 2.9 W to 7.7 W.
The elevated pressure loss in the SCSVG-SAH arises from three coupled mechanisms:
Curvature-induced centrifugal effects within the serpentine channel, which generate secondary motion and increase viscous dissipation.
Repeated flow redirection across successive bends, producing additional acceleration–deceleration losses.
Rib-induced form drag resulting from wake formation and localized separation behind the three-dimensional serpentine spring ribs.
The combined interaction of curvature-induced secondary flow and distributed vortex generation increases momentum loss relative to the straight smooth duct. The nonlinear increase in pressure drop with mass flow rate is consistent with the transitional-to-turbulent Reynolds number regime investigated.
Physical Interpretation of Pressure Loss Results
In the present configuration, the same geometric features responsible for convective heat transfer enhancement also contribute to the increase in hydraulic resistance. The serpentine-channel curvature induces Dean-type secondary vortices that redistribute momentum across the duct cross-section, while the inclined three-dimensional vortex generators disturb the near-wall boundary layer and generate localized wake regions downstream of each element. These flow disturbances promote stronger mixing and boundary layer disruption, thereby intensifying absorber–air heat transfer. However, the additional mixing and flow redirection simultaneously increase viscous dissipation and form drag within the airflow passage, resulting in a higher pressure drop compared with the smooth collector.
Despite this increase in hydraulic resistance, the resulting pumping power requirement remains relatively small compared with the additional useful heat recovered by the enhanced configuration. Consequently, the thermal performance improvement outweighs the hydraulic penalty, which explains the superior thermo-hydraulic performance observed for the SCSVG-SAH across the investigated operating range.
The quantified uncertainty in pressure measurement (±1%) and mass flow rate (±1.8%) was propagated into pumping power estimation using a root-mean-square approach, yielding a combined uncertainty of approximately ±2.9% in pumping power.
3.5. Thermo-Hydraulic Performance (THP)
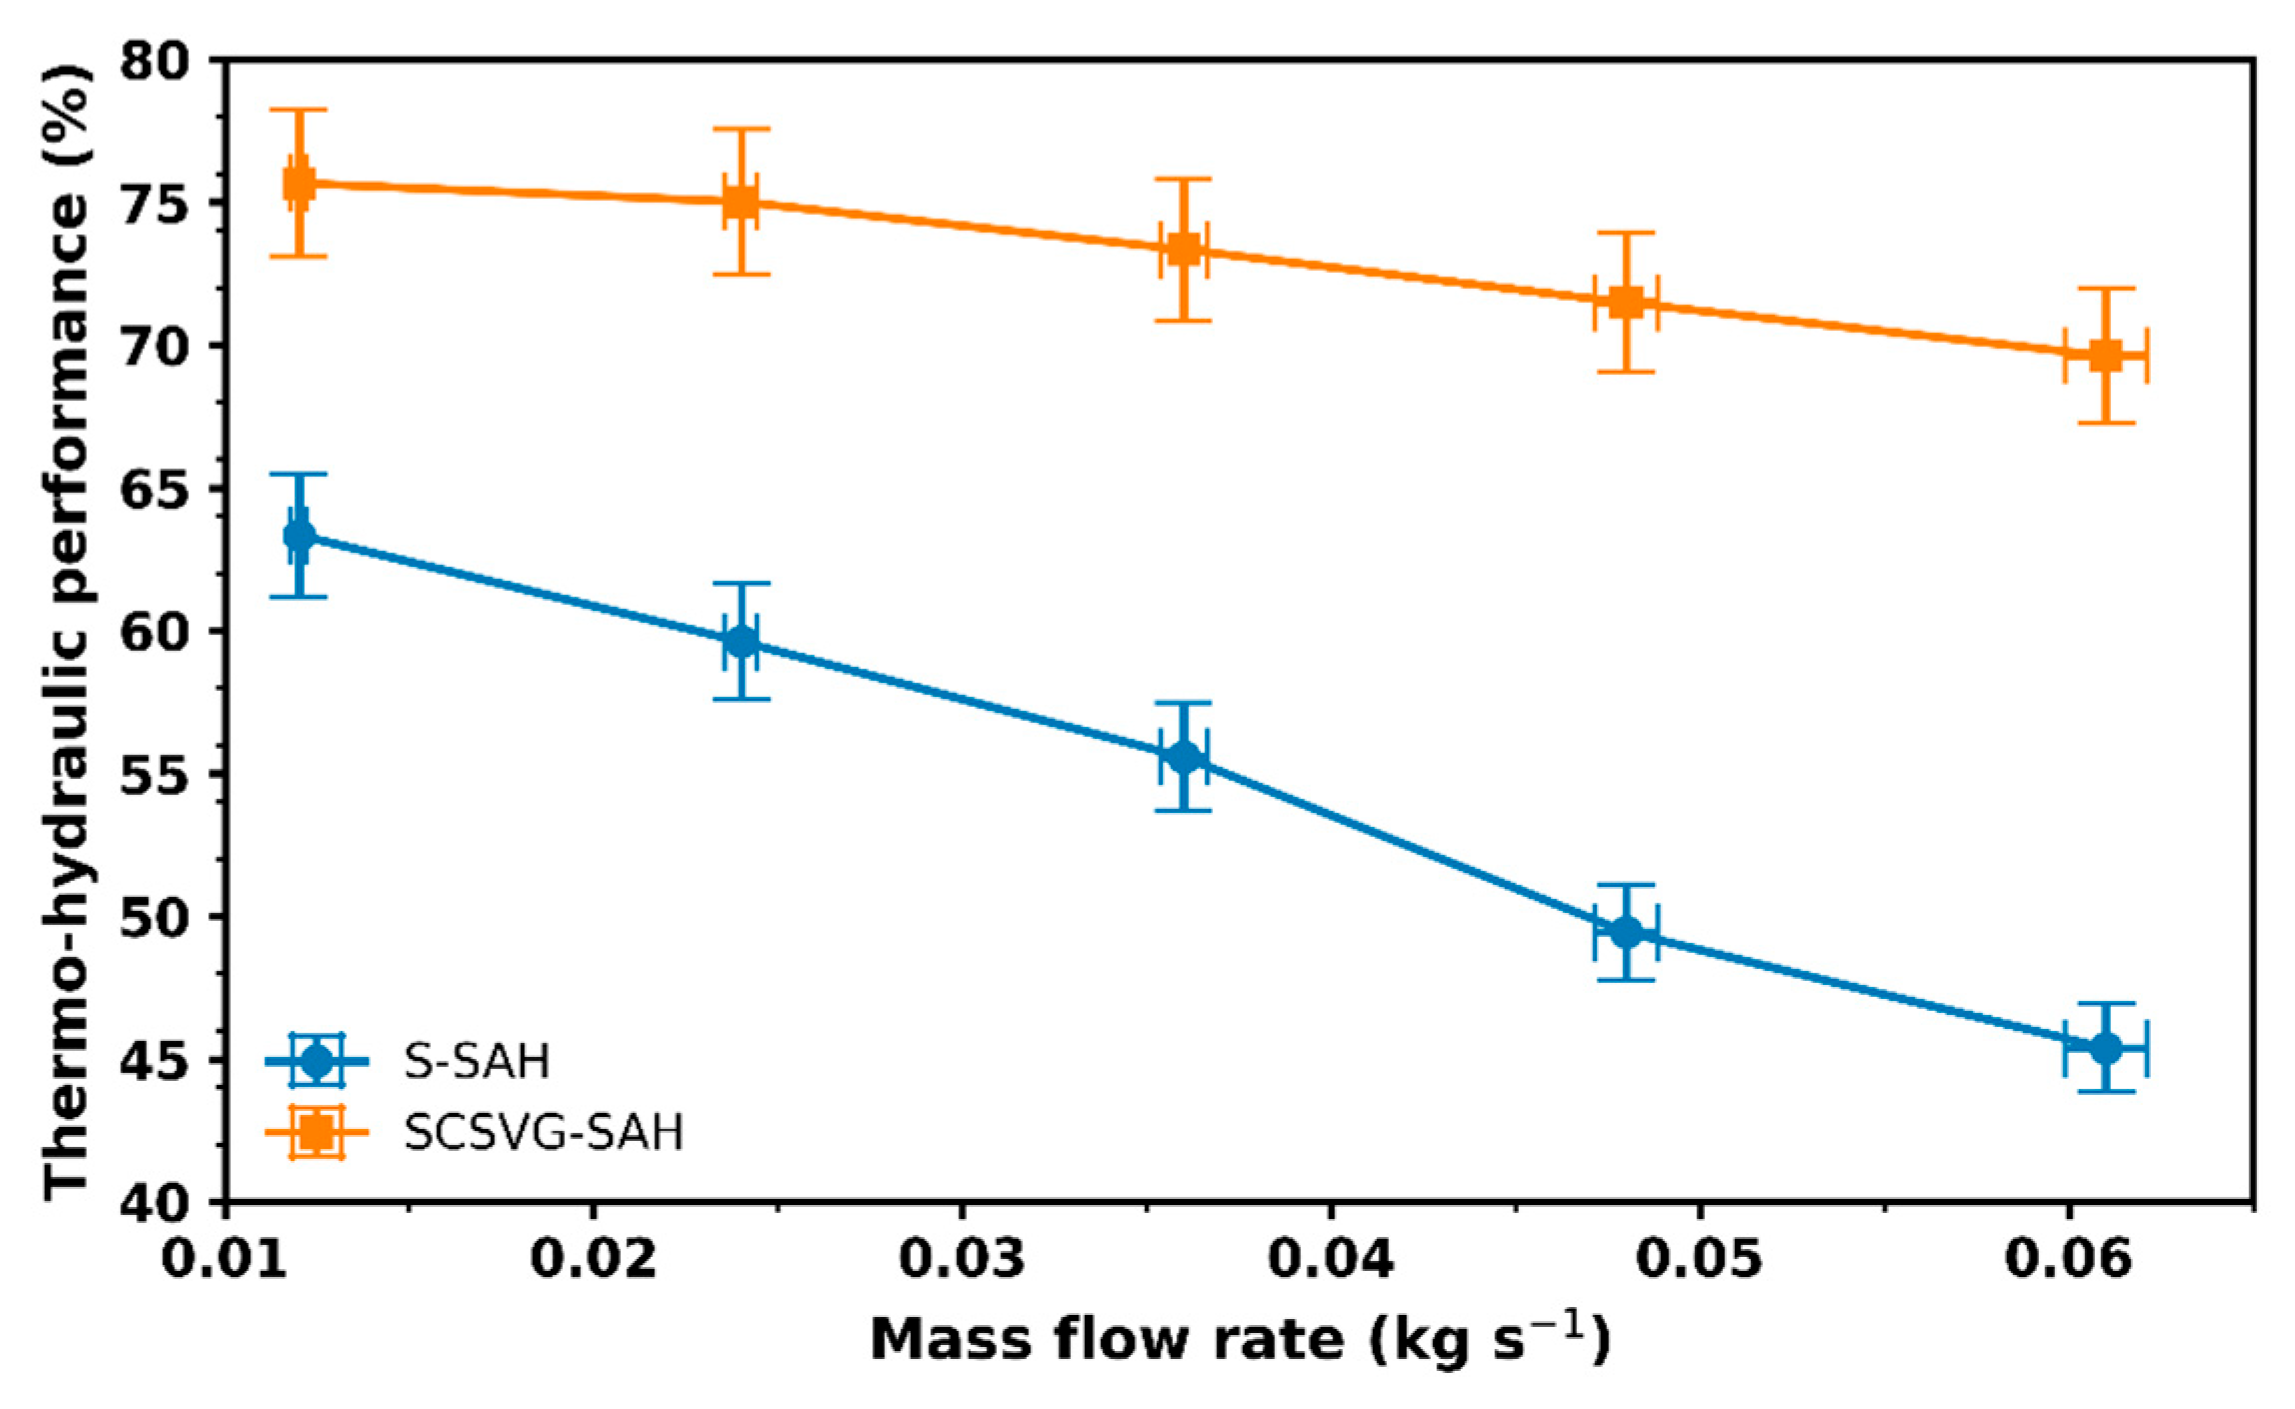
Figure 8 presents the thermo-hydraulic performance (THP) of both configurations as a function of mass flow rate. THP was evaluated using the net useful heat gain after accounting for blower power conversion into thermal-equivalent energy in accordance with Equation (6). Using the updated pumping power dataset, the SCSVG-SAH exhibits THP values decreasing from 75.66% at ṁ = 0.012 kg s
−1 to 69.62% at ṁ = 0.061 kg s
−1, whereas the smooth SAH shows values declining from 63.34% to 45.38% over the same flow interval. Across the entire operating range, the enhanced configuration maintains consistently higher thermo-hydraulic performance.
At lower mass flow rates (0.012–0.024 kg s−1), the SCSVG-SAH exceeds the smooth configuration by approximately 12–16 percentage points, indicating a strong net performance advantage when hydraulic penalties remain moderate. As the mass flow rate increases, both systems exhibit a gradual reduction in THP due to increasing pumping power penalties. However, the decline is significantly steeper for the smooth configuration. Even at the highest investigated flow rate (ṁ = 0.061 kg s−1), the enhanced configuration maintains an advantage of approximately 24 percentage points, indicating that transport intensification offsets the additional hydraulic resistance introduced by curvature and vortex generation.
3.5.1. Physical Interpretation of THP Results
THP represents the balance between convective heat transfer enhancement and mechanical energy expenditure. In the SCSVG-SAH, increasing the mass flow rate raises the Reynolds number from approximately 2.1 × 10³ to 1.07 × 10⁴, intensifying both convective transport and viscous dissipation. Curvature-induced centrifugal effects generate Dean-type secondary motion, while the distributed three-dimensional serpentine ribs promote wake formation and near-wall boundary layer disruption. These mechanisms substantially enhance absorber–air thermal coupling. Although hydraulic resistance increases with mass flow rate, the measured pumping power penalties remain sufficiently small relative to the thermal gain, resulting in sustained superiority of the enhanced configuration. The more pronounced reduction in THP for the smooth duct arises from its comparatively lower thermal efficiency; therefore, the hydraulic penalty term represents a larger fraction of the useful energy gain at higher flow rates.
3.5.2. Key Finding
Despite the additional pressure loss introduced by serpentine curvature and distributed vortex generation, the SCSVG-SAH maintains superior thermo-hydraulic performance across the full operating range. The design objective of the slender wire vortex generators was to introduce controlled flow disturbance while avoiding excessive blockage of the airflow passage. Consequently, although the enhanced configuration exhibits higher pressure drop than the smooth collector, the increase remains moderate relative to the improvement in useful heat transfer. The advantage is particularly pronounced at low-to-moderate mass flow rates, where geometric transport intensification yields substantial net thermal benefit without disproportionate hydraulic penalty. These results indicate that the combined serpentine-channel and vortex-generator configuration achieves a favorable thermo-hydraulic balance and remains energetically advantageous for decentralized solar air-heating applications.
3.6. Exergy Efficiency and Irreversibility Characteristics
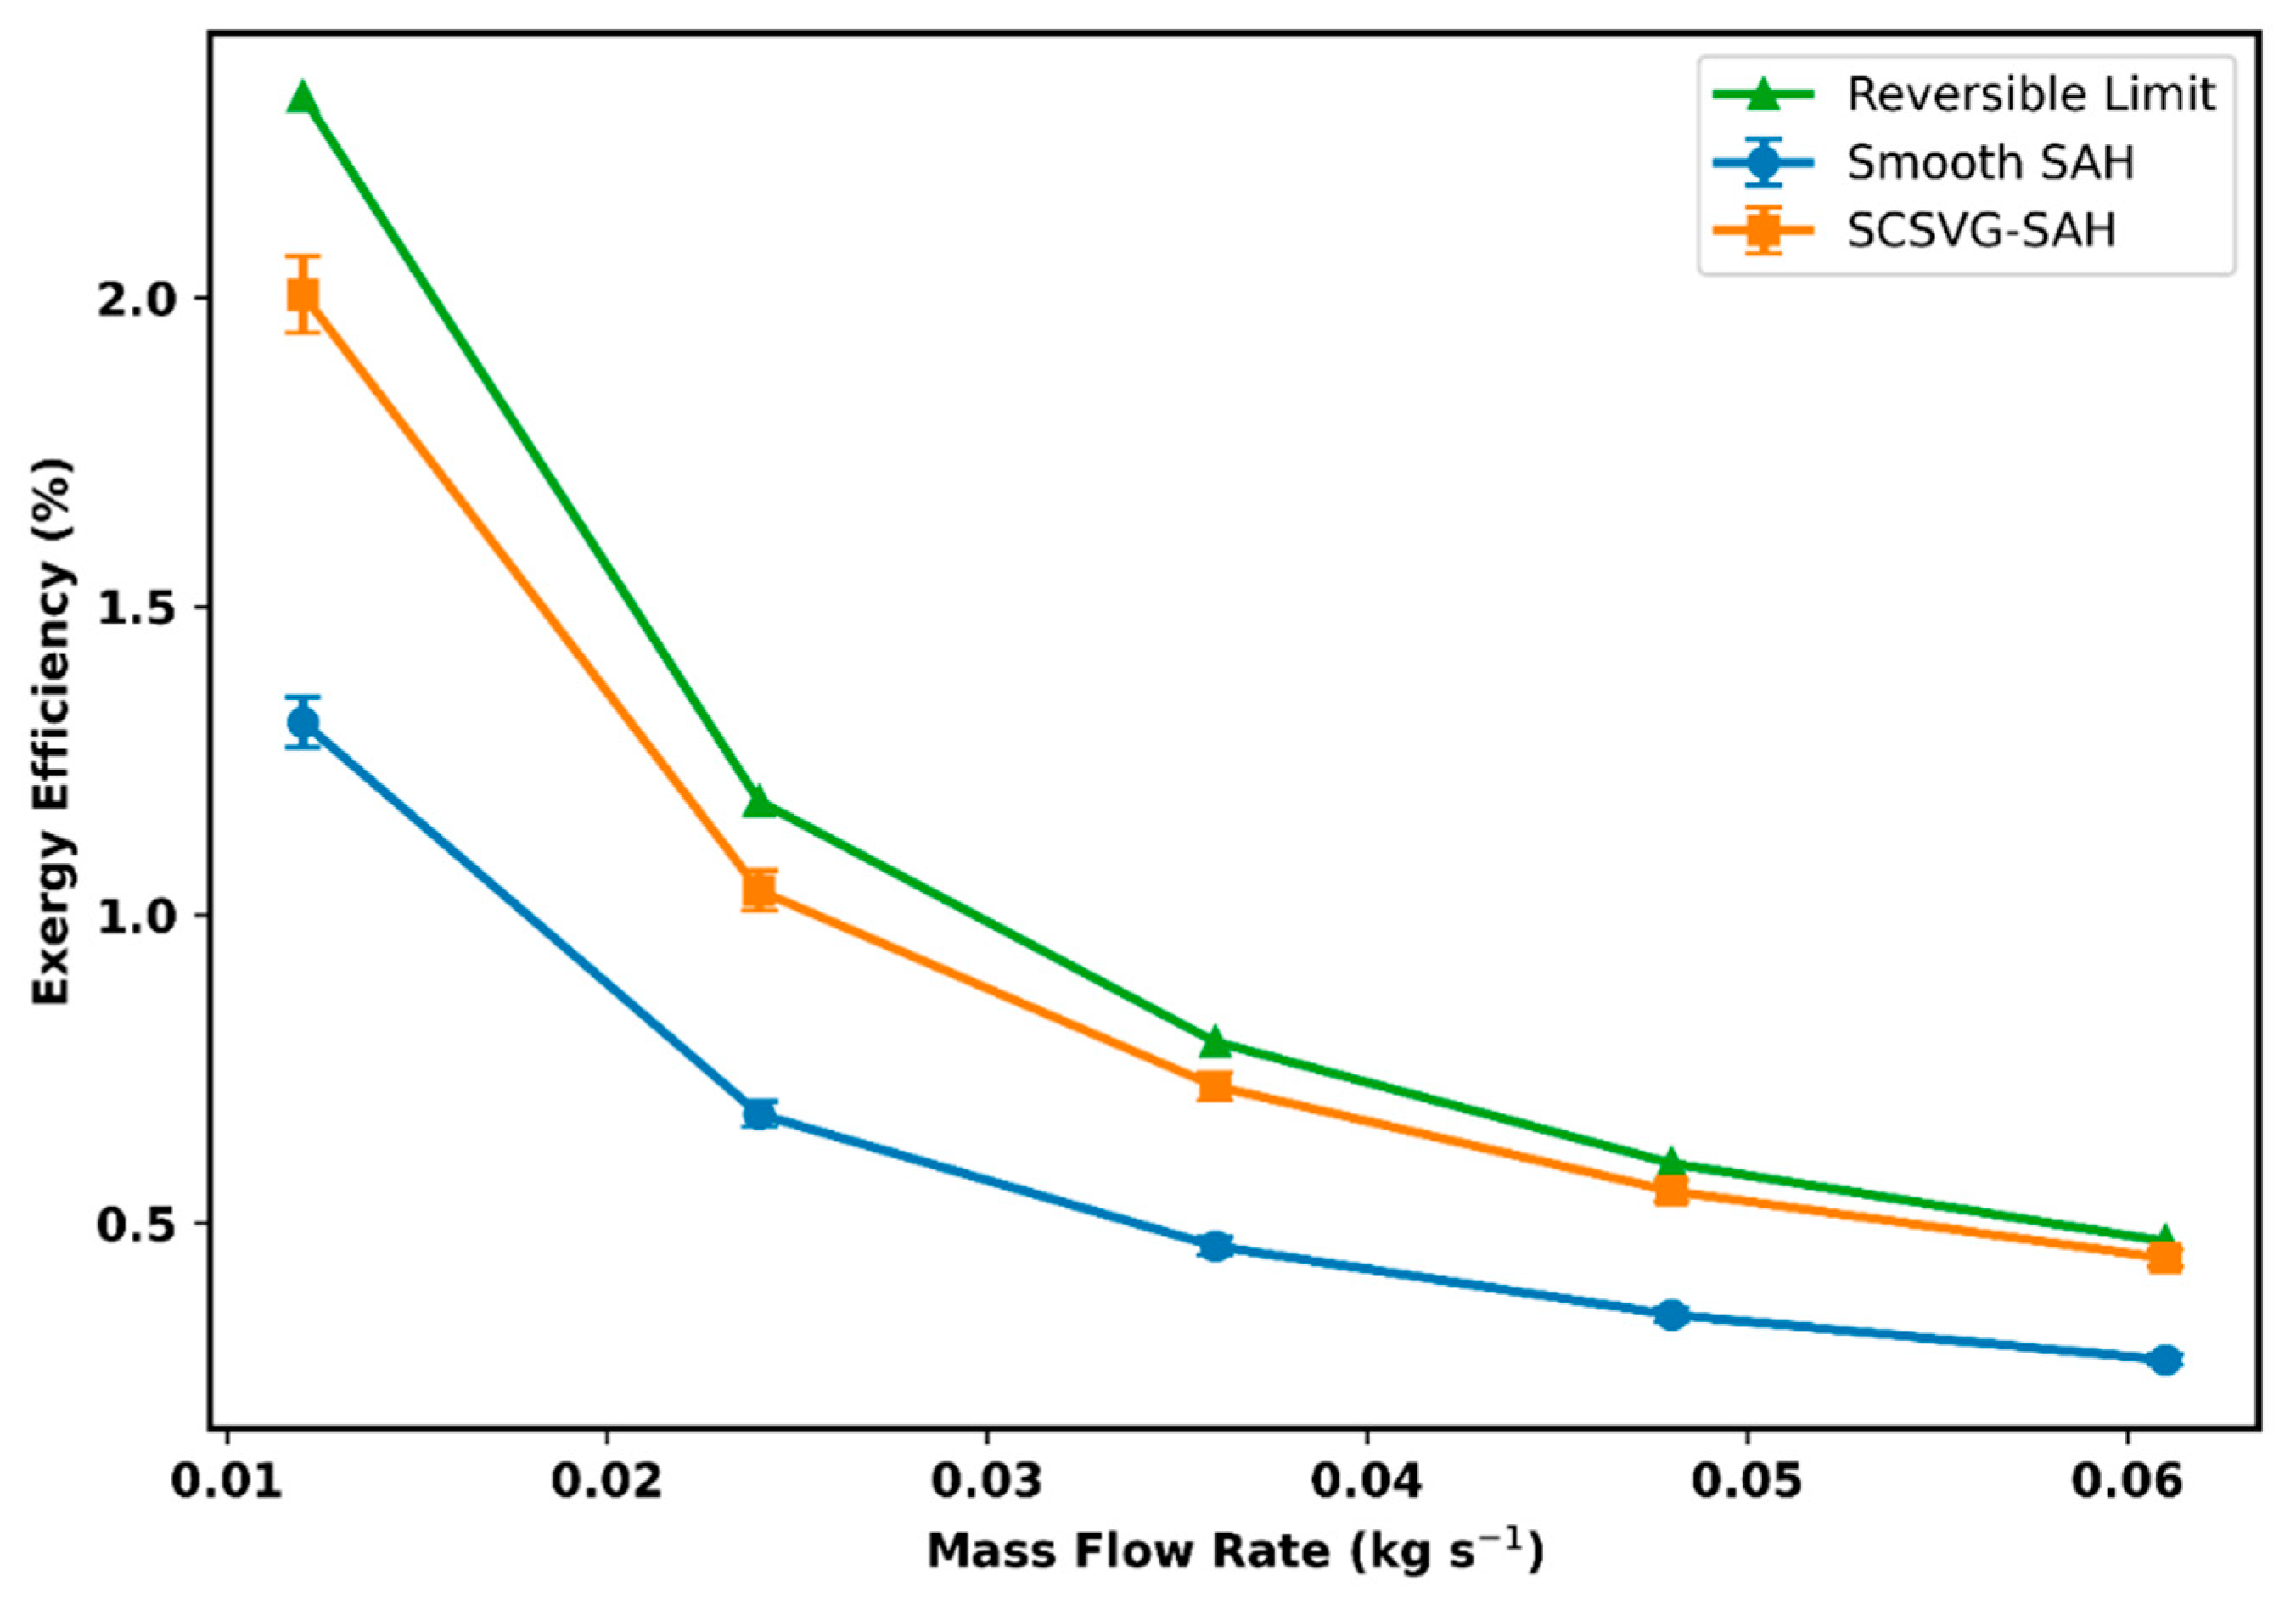
Figure 9 presents the variation in exergy efficiency with mass flow rate for the smooth SAH and the SCSVG-SAH and the corresponding reversible limit defined by the optical absorption constraint (τα = 0.90). For both configurations, exergy efficiency decreases monotonically with increasing mass flow rate. However, the SCSVG-SAH consistently maintains higher exergy efficiency across the entire operating range. At ṁ = 0.012 kg s
−1, the enhanced configuration achieves an exergy efficiency of approximately 2.01%, compared with 1.31% for the smooth collector. As the mass flow rate increases to 0.061 kg s
−1, exergy efficiency decreases to approximately 0.44% for the SCSVG-SAH and 0.28% for the smooth configuration. The reversible limit, governed by the optical constraint (τα = 0.90), varies between approximately 2.33% and 0.47%, remaining strictly above the experimental values at all operating conditions and thereby confirming second-law consistency. Although exergy efficiency values appear numerically low, this is characteristic of low-temperature solar thermal systems operating near ambient conditions, where the thermodynamic quality of heat is inherently limited. Such low exergy efficiencies are typical for low-temperature solar thermal systems operating with temperature lifts below 20–25 K.
3.6.1. Thermodynamic Interpretation
The observed decline in exergy efficiency with increasing mass flow rate is fundamentally linked to the reduction in temperature lift of the working fluid. While higher airflow increases the total useful heat transfer, exergy depends on the thermodynamic quality of the energy, which is governed by:
As the mass flow rate increases, the outlet temperature rise (ΔT) decreases due to reduced residence time and enhanced convective removal. Because the logarithmic exergy term is highly sensitive to the temperature ratio, the reduction in temperature lift leads to a disproportionately larger decrease in useful exergy relative to total energy transfer. This behavior is characteristic of low-temperature solar air heaters, where moderate temperature elevation above ambient inherently limits second-law performance.
3.6.2. Effect of Transport Intensification
The SCSVG-SAH exhibits higher exergy efficiency at all flow rates because intensified absorber air coupling driven by curvature-induced secondary motion and distributed three-dimensional vortex generation produces:
Higher and more uniform outlet temperatures;
Reduced absorber temperature gradients;
Lower localized thermal irreversibility.
Thus, the enhanced configuration improves not only the quantity of recovered heat (first-law performance) but also its thermodynamic quality (second-law effectiveness).
3.6.3. Second-Law Consistency
Importantly, all measured exergy efficiencies remain below the reversible limit defined by the optical absorption constraint (τα = 0.90). This suggests that the experimentally obtained performance does not violate second-law bounds and that the enhancement mechanism improves system effectiveness without implying unrealistic energy conversion. The persistent gap between the reversible limit and experimental values across all operating conditions suggests that irreversibility remains dominated by finite-temperature heat transfer rather than measurement overestimation, reinforcing the second-law consistency of the reported performance.
These results indicate that the enhanced absorber–air interaction produced by the combined serpentine-channel curvature and distributed vortex generators improves not only the quantity of recovered heat but also its thermodynamic quality. Consequently, the SCSVG-SAH exhibits consistently higher exergy efficiency than the smooth collector across the entire operating range, indicating reduced internal irreversibility and improved second-law utilization of the absorbed solar energy.
3.7. Environmental Assessment
The environmental performance of the proposed solar air heater configurations was evaluated based on operational carbon mitigation potential using the grid emission factor method described in
Section 2.7.5. Annual CO
2 mitigation was calculated as:
where
Eannual is the annual useful thermal energy (kWh year
−1) and
EF is the grid emission factor (kg CO
2 kWh
−1). The analysis considers only operational carbon offset benefits and does not include embodied lifecycle emissions.
3.7.1. CO2 Mitigation Under Different Grid Scenarios
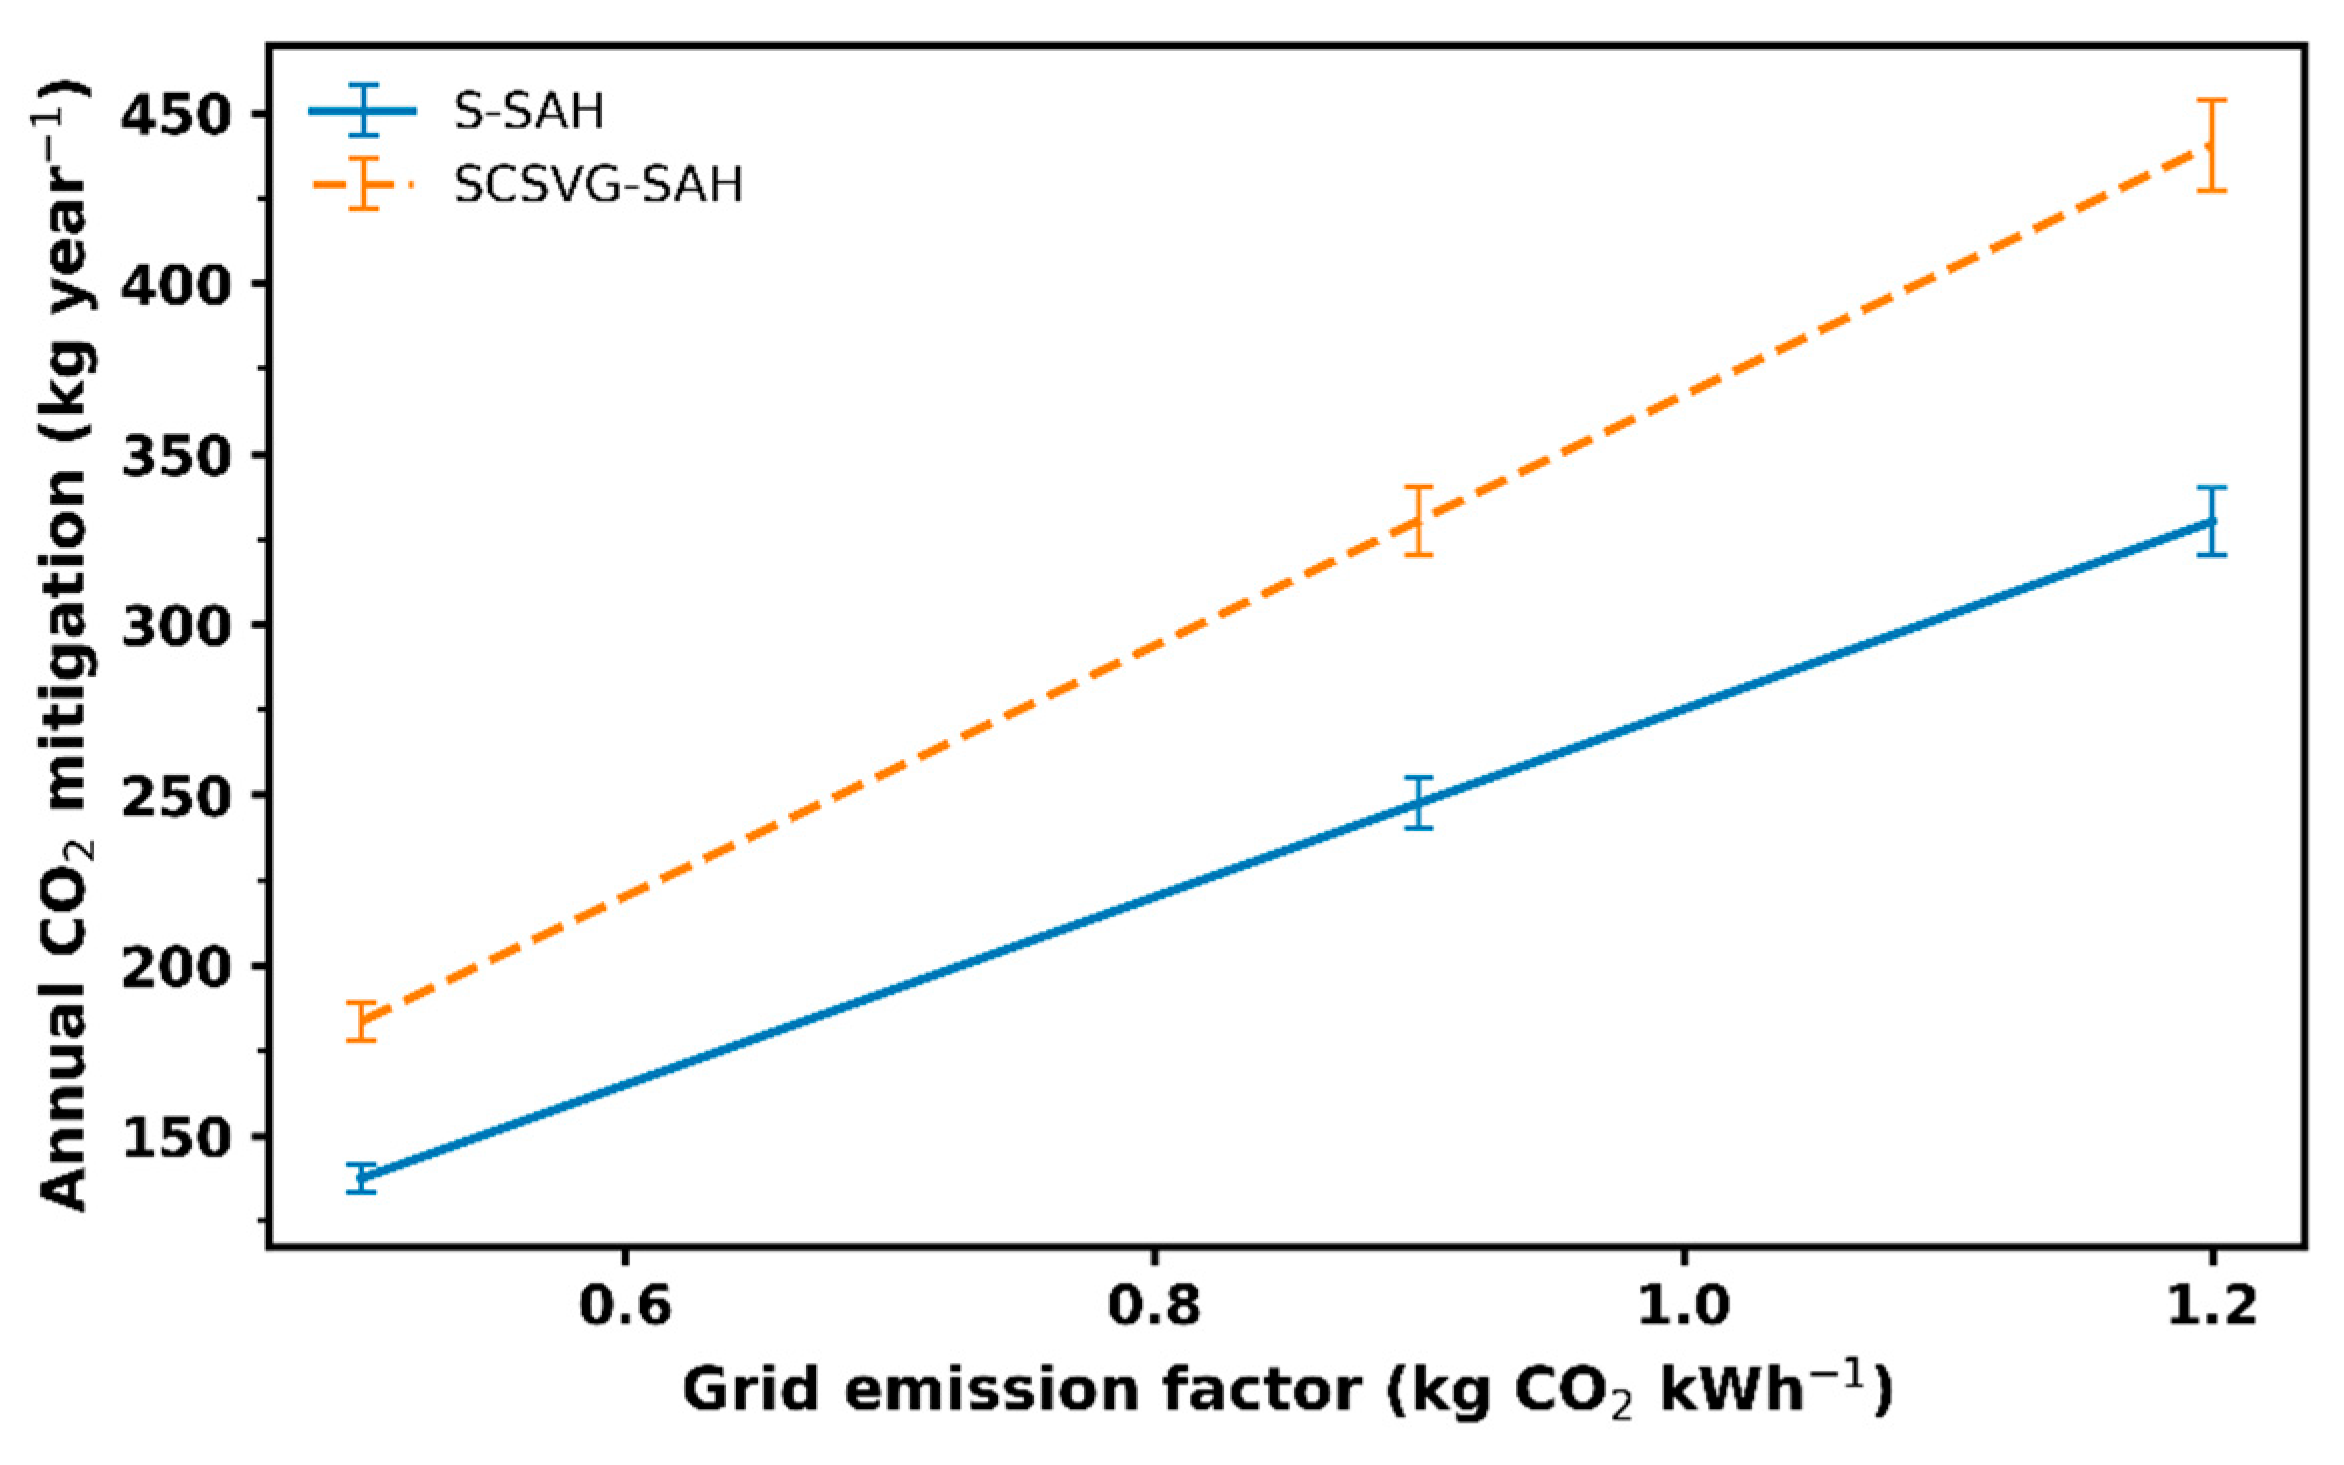
Figure 10 presents the variation in annual CO
2 mitigation with the grid emission factor for representative low-carbon (0.5 kg CO
2 kWh
−1), average Indian grid (0.9 kg CO
2 kWh
−1), and fossil-dominant (1.2 kg CO
2 kWh
−1) conditions [
52].
Based on 300 effective operating days:
At EF = 0.5 kg CO2 kWh−1:
Smooth SAH offsets ≈ 138 kg CO2 year−1;
SCSVG-SAH offsets ≈ 184 kg CO2 year−1.
At EF = 0.9 kg CO2 kWh−1:
Smooth SAH offsets ≈ 248 kg CO2 year−1;
SCSVG-SAH offsets ≈ 331 kg CO2 year−1.
At EF = 1.2 kg CO2 kWh−1:
Smooth SAH offsets ≈ 330 kg CO2 year−1;
SCSVG-SAH offsets ≈ 441 kg CO2 year−1.
Across all grid scenarios, the enhanced configuration consistently provides approximately 33% higher annual carbon mitigation, directly reflecting its superior thermal performance. A ±20% variation in the grid emission factor results in a proportional variation in annual CO2 mitigation but does not alter the relative 33% improvement between configurations. The relative carbon mitigation advantage remains proportional under varying grid emission factors, indicating robustness of the enhancement across regional electricity mixes.
3.7.2. Lifetime CO2 Mitigation
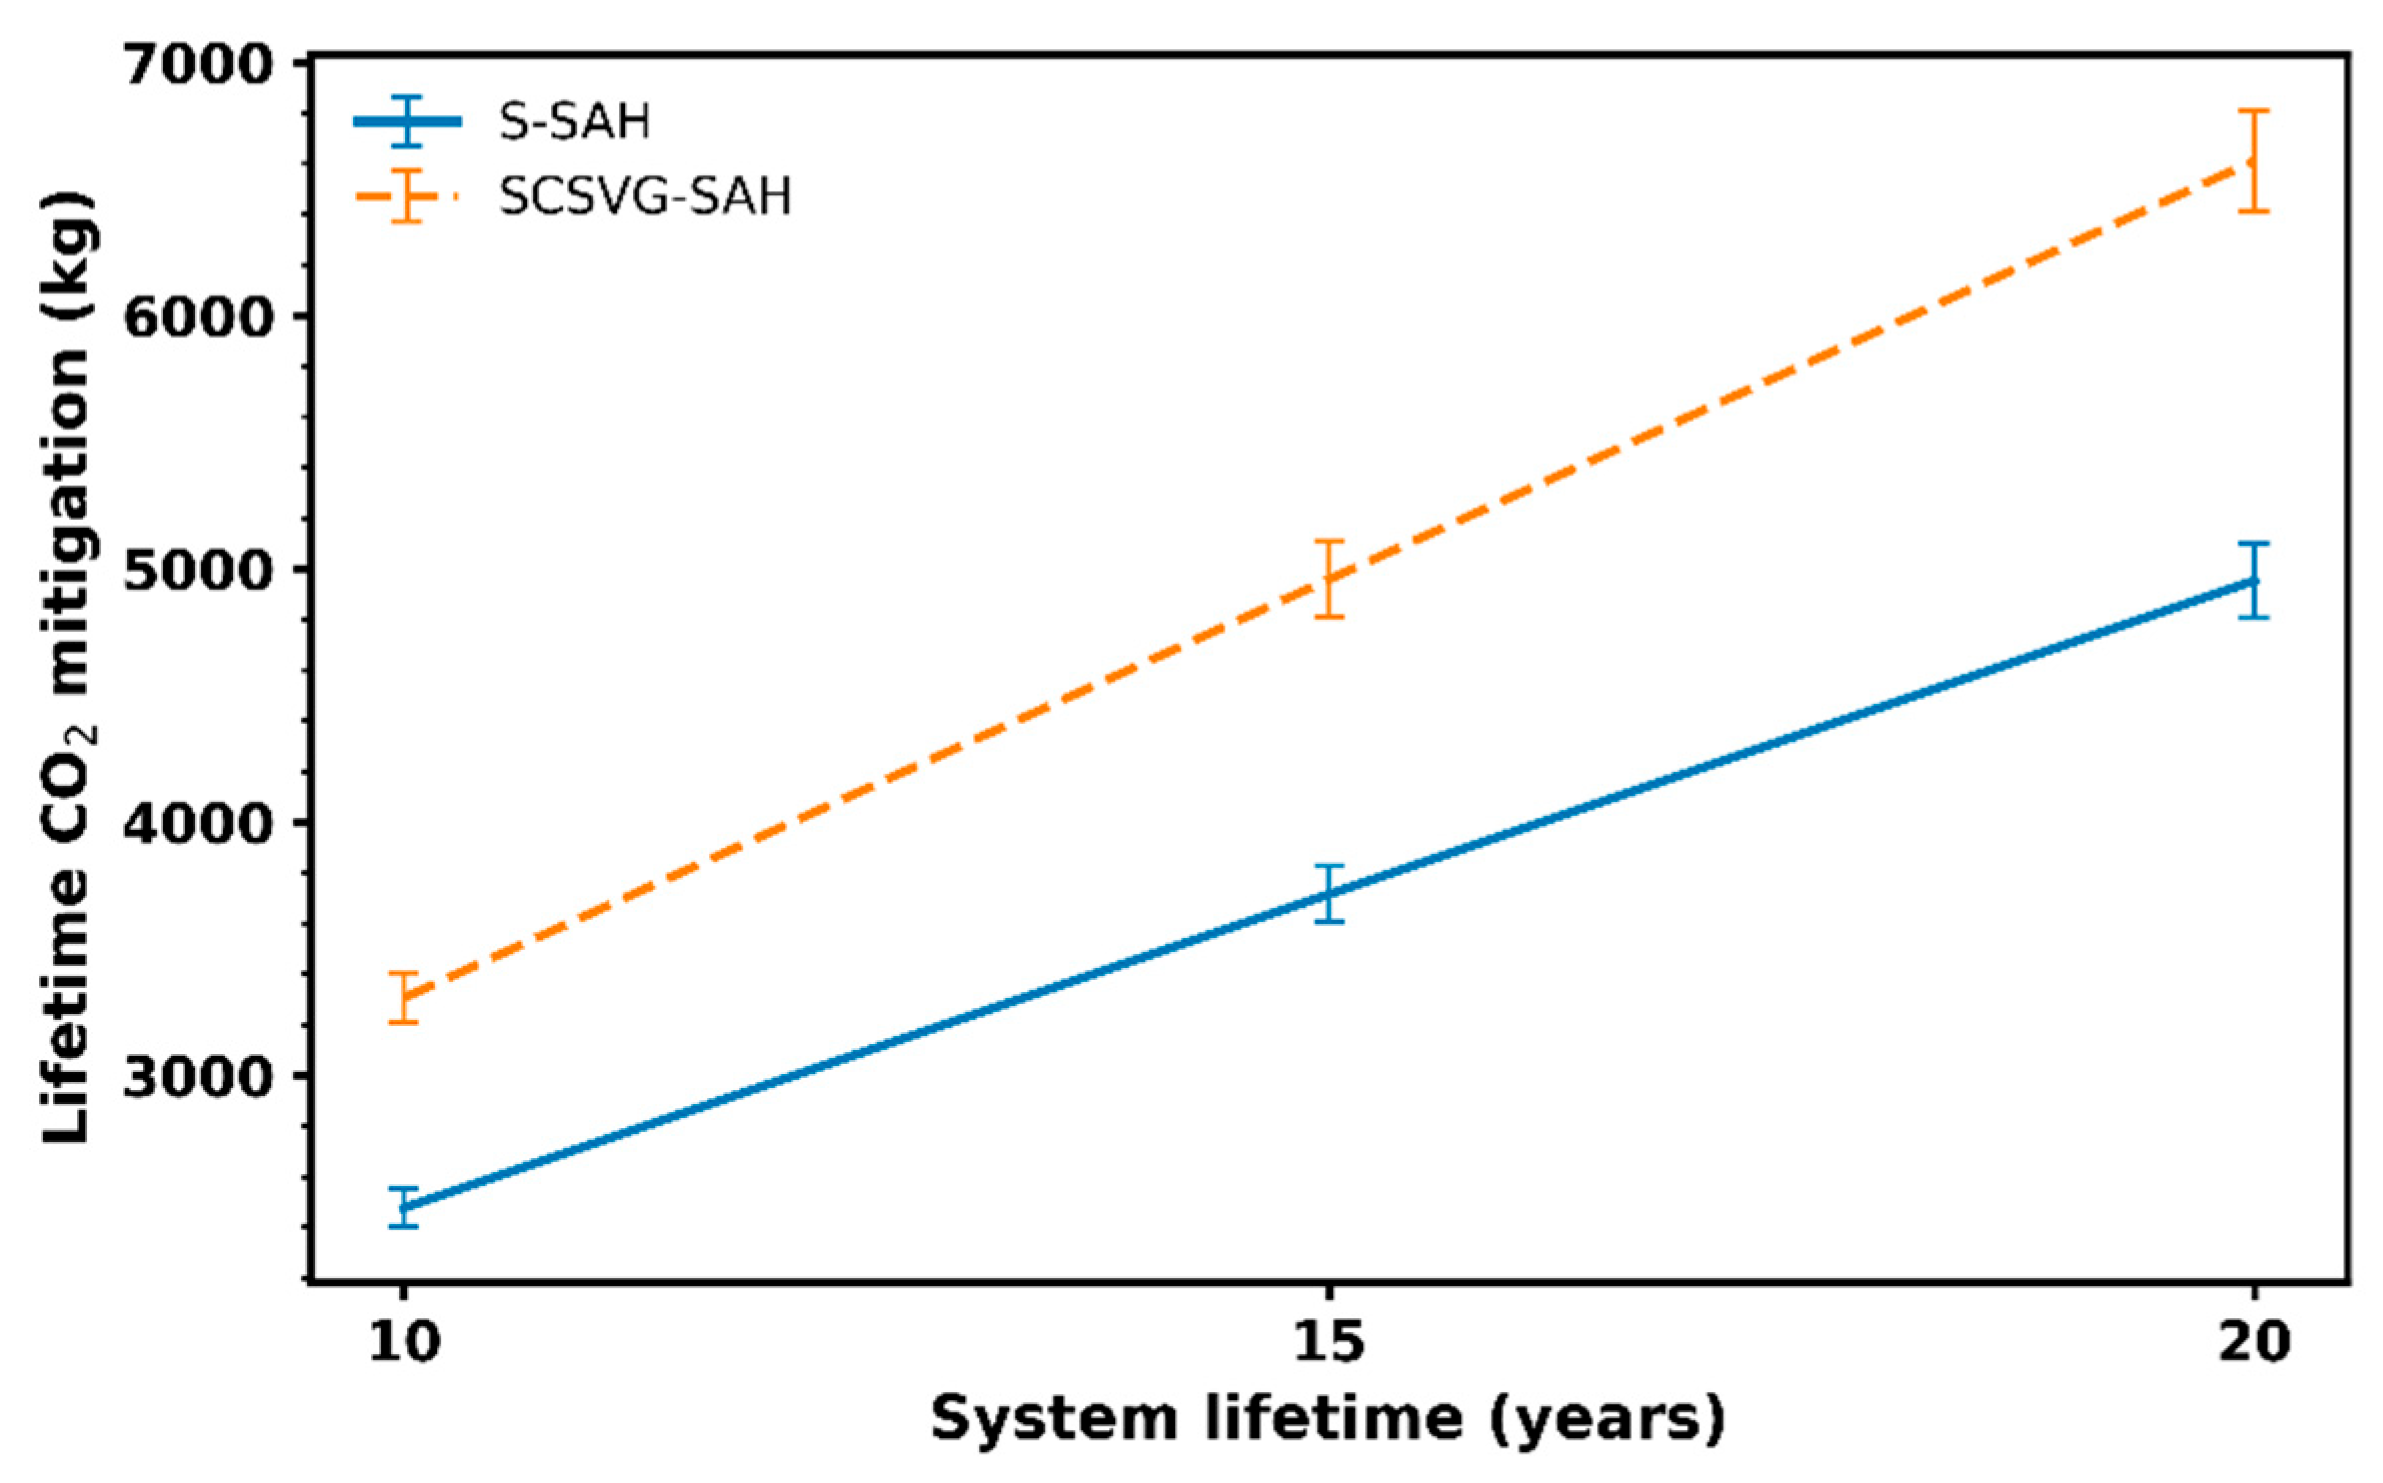
Figure 11 further illustrates the cumulative CO
2 mitigation over system lifetimes of 10, 15, and 20 years (based on EF = 0.9 kg CO
2 kWh
−1). The cumulative lifetime carbon offset is given below.
| Lifetime | Smooth SAH | SCSVG-SAH |
|---|
| 10 years | ≈2.48 t CO2 | ≈3.31 t CO2 |
| 15 years | ≈3.71 t CO2 | ≈4.96 t CO2 |
| 20 years | ≈4.95 t CO2 | ≈6.61 t CO2 |
Over 20 years, the enhanced configuration mitigates approximately 1.66 tonnes of additional CO2 relative to the smooth collector.
3.7.3. Environmental Interpretation
The results indicate that geometric transport intensification not only improves thermal efficiency but also yields measurable environmental benefits under diverse grid conditions. The proportional increase in CO2 mitigation remains consistent across emission factor scenarios and service lifetimes, indicating that the environmental advantage of the SCSVG-SAH is robust and scalable. Although absolute mitigation depends on regional electricity carbon intensity, the enhanced configuration consistently provides superior carbon offset performance without increasing operational emissions.
3.8. Economic and Exergo-Economic Assessment
Economic evaluation was performed using the levelized cost of heating (LCOH) framework described in
Section 2.7.6. The capital cost represents the total installed system cost, including collector fabrication, blower, electrical wiring, and supporting structure. The installed capital cost was ₹7350 (Indian Rupees, INR) for the smooth SAH and ₹9850 for the SCSVG-SAH, with the ₹2500 difference arising solely from the modified absorber geometry. Annual operation was assumed for 300 effective days, and an interest rate of 10% was applied. Operating and maintenance costs were considered negligible due to the passive nature of the system and the identical auxiliary components used in both configurations.
3.8.1. Levelized Cost of Heating (LCOH)
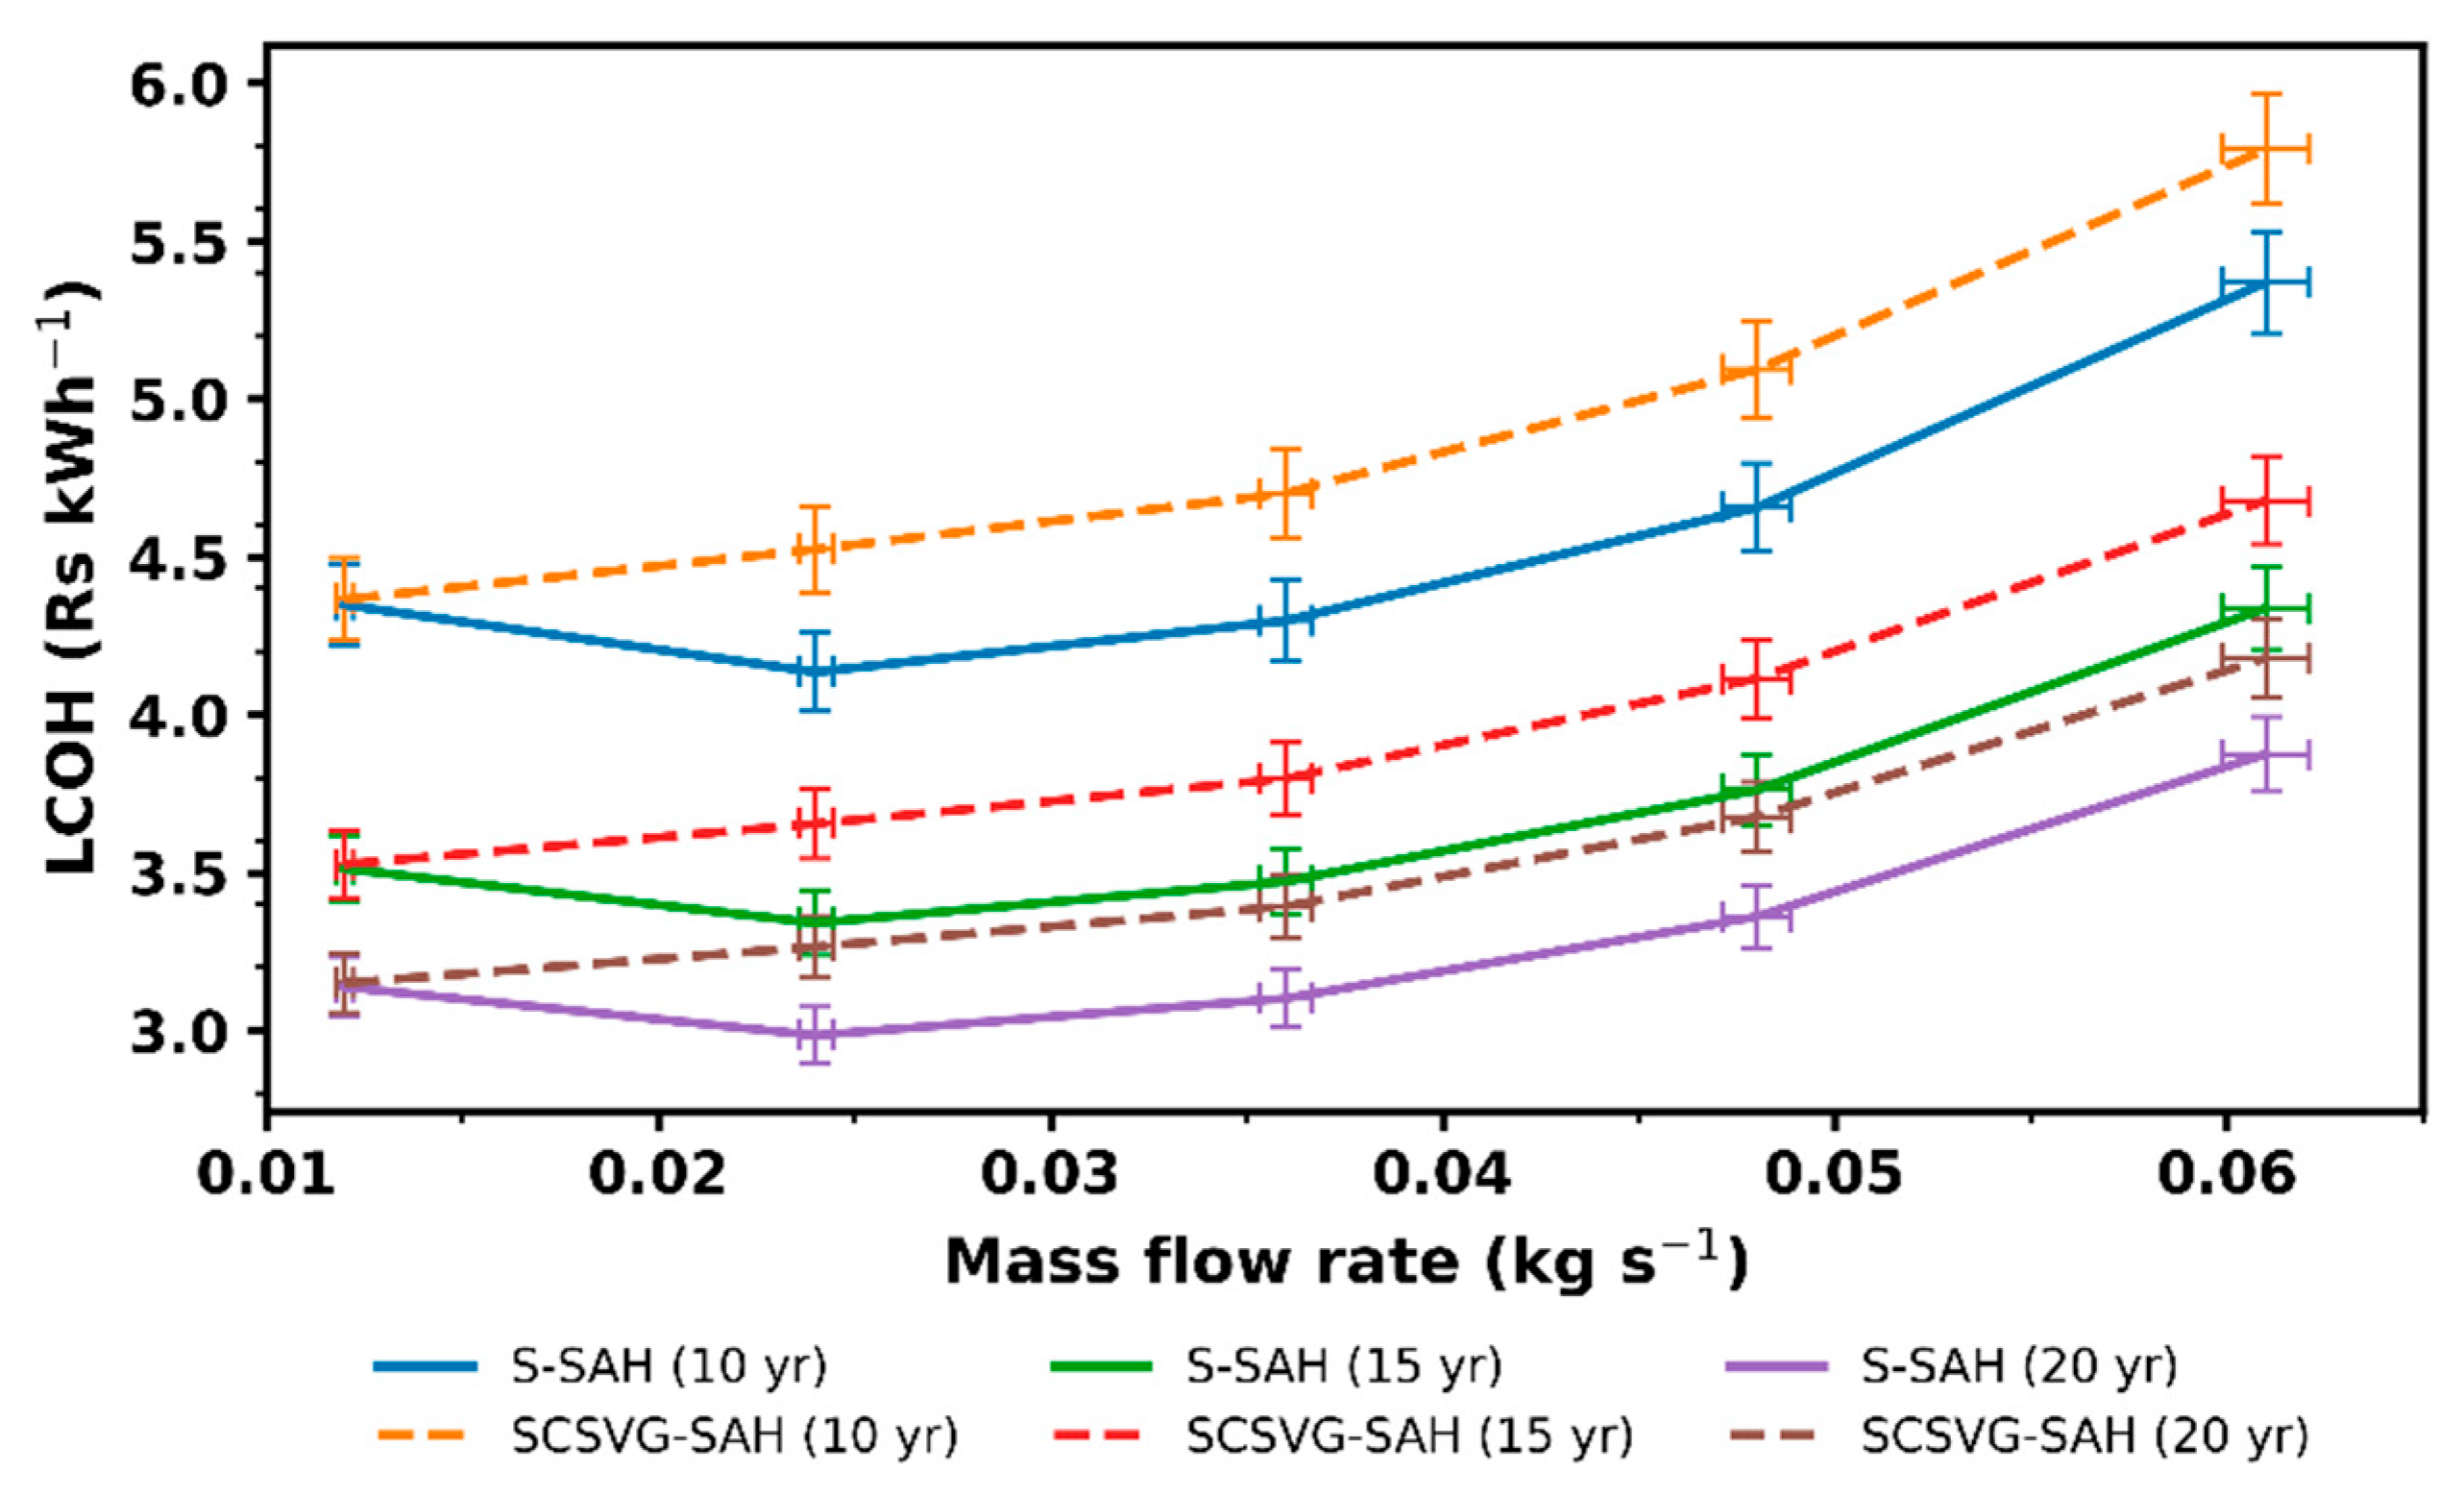
Figure 12 shows the variation in LCOH with mass flow rate for service lifetimes of 10, 15, and 20 years. As expected, LCOH decreases with increasing lifetime due to reduction in the capital recovery factor.
For the baseline mass flow rate (ṁ = 0.012 kg s−1), LCOH values are approximately:
4.35–3.14 ₹ kWh−1 (smooth SAH);
4.37–3.15 ₹ kWh−1 (SCSVG-SAH) for 10–20-year lifetimes, respectively.
Across the investigated mass flow range, both configurations exhibit comparable LCOH values. Although the enhanced system requires a moderately higher capital investment, its improved annual useful heat output compensates for the additional fabrication cost, resulting in nearly identical heating costs per unit energy delivered. The calculated LCOH range of approximately ₹3.14–₹4.37 kWh−1 is comparable to or lower than typical residential electricity tariffs in India, which generally range between ₹5–₹7 kWh−1 depending on the region and consumption category. Therefore, when solar air heaters are used to offset grid-based electrical heating, the proposed configuration can provide economically competitive thermal energy. Considering the small collector size (0.25 m2) used in the present experimental system, larger-scale installations would further distribute capital cost over greater useful heat output, potentially improving long-term economic performance.
The LCOH calculation incorporates the annual useful energy output obtained from the experimentally measured thermal performance.
3.8.2. Economic Interpretation
The results indicate that geometric transport intensification increases thermal and exergetic performance without imposing disproportionate economic penalties. Although the SCSVG-SAH requires a moderately higher fabrication cost due to the serpentine-channel partitions and distributed vortex generators, the additional capital investment is relatively small compared with the total system cost. Because the enhanced configuration delivers higher useful heat output across the operating range, the increase in thermal energy recovery offsets the added fabrication expense when evaluated on a levelized basis. Consequently, both systems exhibit nearly identical LCOH values, while the enhanced configuration provides higher useful heat delivery and greater carbon mitigation potential.
3.9. Overall 4E Performance Assessment and Implications for Low-Carbon Thermal Systems
Within the context of decentralized low-carbon thermal systems, the primary performance indicator is not efficiency alone but net carbon displacement per unit collector area. The integrated 4E evaluation indicates that compound curvature–vortex transport intensification directly amplifies carbon mitigation potential through simultaneous enhancement of useful heat recovery and suppression of thermodynamic irreversibility.
The proposed serpentine–vortex configuration increases the daily averaged thermal efficiency from approximately 56–59% for the smooth collector to 71–75% under realistic outdoor conditions. This corresponds to a sustained improvement of approximately 14–16 percentage points across the investigated mass flow range. Because useful heat gain is directly proportional to fossil fuel displacement in conventional heating scenarios, this improvement translates directly into greater carbon mitigation potential when the system is used to offset grid-based or fossil-fuel-derived heating.
From a thermodynamic perspective, intensified absorber–air coupling in the SCSVG-SAH reduces the effective heat loss coefficient by approximately 24.7% on a daily averaged basis. Lower absorber temperatures reduce the driving temperature difference responsible for external convective and radiative heat losses, thereby increasing the fraction of incident solar energy converted into useful thermal output. Exergy analysis further indicates that the enhanced configuration maintains higher second-law utilization while remaining below the theoretical optical reversible limit, confirming thermodynamic consistency.
Environmental assessment based on a representative grid emission factor of 0.9 kg CO2 kWh−1 indicates that the enhanced configuration provides approximately 33% higher annual CO2 mitigation compared with the smooth collector. Over a 20-year service life, this corresponds to a cumulative mitigation increase of approximately 1.66 tonnes of CO2 per collector unit. Importantly, this improvement in emission displacement potential is achieved without proportional growth in auxiliary energy consumption, as thermo-hydraulic performance remains favorable across the investigated operating range.
Economic assessment demonstrates that the increased thermal output and carbon mitigation potential are not achieved at the expense of affordability. The levelized cost of heating remains within the range of ₹3.1–₹4.4 kWh−1, which is competitive with typical residential electricity tariffs in India. Consequently, the enhanced configuration provides higher useful heat recovery and environmental benefit while maintaining comparable heating cost relative to the smooth collector.
Overall, the integrated 4E evaluation indicates that the combined use of serpentine flow paths and distributed vortex generators can improve absorber–air thermal interaction and enhance useful heat recovery under practical operating conditions. The resulting increase in useful solar heat output contributes directly to higher emission displacement potential when solar air heaters are deployed as decentralized renewable heating systems. These findings highlight geometric transport modification as a promising design strategy for improving the performance and sustainability of low-temperature solar thermal technologies.
3.10. Comparison with Previous Studies
To place the present results in context, the performance of the proposed SCSVG-SAH configuration was compared with selected recent solar air heater enhancement studies (
Table 7). The modified collector achieved thermal efficiencies ranging from 81.6% to 85.4% over the investigated mass flow range. These values fall within the upper range of efficiencies reported for several turbulence-promoting solar air heater configurations, including jet-impingement deflectors, serpentine channels, turbulator absorbers, and finned collectors [
44,
49,
50,
51], where reported thermal efficiencies generally range from approximately 58% to 86% depending on geometry and operating conditions.
4. Conclusions
This study demonstrates that controlled geometric transport intensification can improve the thermal performance of decentralized solar air-heating systems under realistic outdoor operating conditions. By integrating a serpentine flow path with distributed vortex generators, the modified configuration exhibited improved thermal performance compared with the smooth collector. The experimental results indicate an increase in useful heat output and a reduction in effective heat-loss intensity, suggesting improved thermal coupling between the absorber surface and the airflow. The vortex generators are fabricated from corrosion-resistant aluminum wire and introduce minimal structural mass, supporting compatibility with decentralized and low-maintenance installations. Although detailed flow-field measurements were not performed in the present study, the observed improvements in thermal and thermo-hydraulic performance are consistent with enhanced internal mixing associated with the serpentine-channel geometry and the presence of vortex generators.
Beyond thermal enhancement, the modified configuration improves thermodynamic utilization while maintaining first- and second-law consistency. The increased useful heat output also leads to a measurable improvement in carbon displacement potential when the system is used to offset grid- or fossil-fuel-based heating sources. Within the investigated operating conditions, this improvement in emission reduction potential results from increased useful heat recovery rather than additional external energy input.
From an engineering perspective, the results suggest that serpentine-channel configurations combined with passive turbulence-promoting elements provide a practical approach for improving collector performance in low-temperature applications such as space heating, agricultural drying, and decentralized thermal systems in rural or off-grid regions. Because the enhancement relies on passive geometric modification rather than active control or complex materials, the proposed configuration remains compatible with cost-sensitive and small-scale deployment contexts.
Overall, the findings highlight the potential of geometric flow path modification to improve useful heat recovery and thermo-hydraulic performance in solar air heaters under practical operating conditions. The results indicate that combining serpentine-channel curvature with distributed vortex generators can enhance absorber–air thermal interaction while maintaining a favorable thermo-hydraulic balance, thereby increasing the potential for useful energy recovery and carbon displacement in decentralized solar thermal systems. Further investigation using detailed flow-field measurements or numerical simulations could provide deeper insight into the interaction between serpentine-channel curvature and vortex-generation mechanisms in the proposed configuration.