


Abstract
In the single-winding consequent-pole bearingless permanent magnet synchronous motor (SW-CP-BPMSM), the torque and suspension systems utilize a shared winding configuration. This structure significantly intensifies inter-system coupling. Furthermore, the presence of non-linear and strongly coupled relationships among structural parameters, combined with inherent coupling and conflicts between optimization objectives, makes the unified optimization of key performance indicators for both the torque and suspension systems a substantial challenge. To address these issues, this paper proposes a dual-system interactive optimization strategy based on the classification of sensitive variables. First, the strategy employs the Sobol method to conduct a global sensitivity analysis. By defining dual-system coupled sensitive parameters and single-system sensitive parameters, the method achieves dimensionality reduction through parameter classification. Subsequently, Response Surface Methodology (RSM) and Back Propagation (BP) neural network surrogate models are constructed for the suspension and torque systems, respectively. A progressive optimization process—comprising single-system optimization followed by dual-system interactive optimization—is then performed on the single-system and dual-system sensitive variables to determine the final optimal parameters. Finally, a comparative simulation analysis of the key performance indicators for both the torque and suspension systems before and after optimization is conducted. The results validate the feasibility and effectiveness of the proposed optimization strategy.
1. Introduction
Permanent Magnet Synchronous Motors are renowned for their advantages, including high power density, high torque density, reliable structure, and high efficiency [1]. However, traditional PMSMs typically rely on mechanical bearings to support the rotor. During operation, mechanical bearings suffer from friction and wear, which intensifies significantly as the rotational speed increases. To address these issues, scholars proposed the concept of the Bearingless Permanent Magnet Synchronous Motor [2]. By injecting both torque and suspension currents into the stator windings, this type of motor generates electromagnetic torque and controllable suspension force simultaneously, ensuring stable rotor suspension. Consequently, BPMSMs hold broad application prospects in fields such as flywheel energy storage systems and semiconductor manufacturing.
Currently, there are two primary winding configurations for BPMSMs. The first is the dual-winding structure, where a set of suspension windings [3,4]—with a pole pair number differing by one from the torque windings—is embedded in the stator alongside the original torque windings. This method offers a clear structure and ease of control but results in increased size compared to traditional motors of equal power. The second is the single-winding structure, where torque and suspension currents are superimposed within a single set of windings to generate both forces simultaneously. Although the control complexity is higher, this approach enables a more compact motor structure and reduced losses. Regarding rotor topology, BPMSMs primarily utilize surface-mounted or interior structures. However, both require a large volume of permanent magnets (PMs), leading to high costs. As a novel rotor topology, the consequent-pole structure not only reduces PM usage but also decouples suspension control from the rotor position angle. Therefore, the SW-CP-BPMSM is attracting increasing attention from researchers.
The SW-CP-BPMSM possesses a complex structure with numerous critical parameters. Since variations in certain parameters may yield distinct effects on the performance of the torque and suspension systems, it is essential to conduct optimization research on design parameters [5,6,7]. Currently, domestic and international scholars have conducted extensive research on the multi-objective optimization of motors. For instance, to improve the operational stability of BPMSMs, Reference [8] employed the Taguchi method to optimize the structural parameters of unequal-amplitude modulation magnetic poles, thereby reducing fluctuations in torque and suspension force. The results indicated that this method effectively enhances BPMSM performance. Reference [9] proposed a Taguchi-Response Surface method for multi-objective optimization to increase the output torque and suspension force of the motor. An orthogonal matrix was established based on factor levels, followed by Finite Element Analysis (FEA) to obtain experimental results for each group. Subsequently, sensitivity analysis was conducted to identify the optimal variable combination. Finally, an optimal motor was manufactured, and its performance was experimentally verified. However, optimization methods based directly on finite element models [10] face significant computational challenges and are extremely time-consuming when handling high-dimensional multi-objective optimization problems. Consequently, scholars have proposed multi-objective optimization methods based on surrogate models [11].
To achieve high power generation performance and stable suspension capability, Reference [12] proposed a multi-objective optimization method utilizing a Response Surface model and an improved Multi-Objective Particle Swarm Optimization algorithm. First, design variables and objectives were determined via sensitivity analysis to narrow the design space. Then, an RS model of the design objectives was constructed, and the improved MOPSO algorithm was applied to obtain the Pareto optimal set. This method increased the average suspension force by 21% and reduced suspension force ripple by 52%. Reference [13] addressed the issues of high pulsation and low efficiency in Switched Reluctance Motors by proposing a multi-objective optimization strategy combining a prediction model based on Genetic Algorithm-optimized Support Vector Machine with the third-generation Non-dominated Sorting Genetic Algorithm. Simulation results showed significant improvements in average torque and efficiency, along with reduced torque ripple. Reference [14] presented a design method based on sensitivity analysis, response surface fitting, and the Multi-Objective Whale Optimization Algorithm to enhance the torque and suspension performance of a Bearingless Interior Permanent Magnet Synchronous Motor. The study first introduced the BIPMSM structure and working principle, extracted significant variables via sensitivity analysis, fitted regression equations for the significant variables and optimization objectives, and performed global optimization using MOWOA. Comparative results demonstrated that the proposed scheme significantly improved BIPMSM performance and effectively shortened the design cycle.
In SW-CP-BPMSMs, not only do non-linear and strong coupling relationships exist among parameters, but coupling and conflicts also exist between optimization objectives, making the unified optimization of key performance indicators for both torque and suspension systems difficult. Addressing this problem, this paper proposes a dual-system interactive optimization strategy based on the classification of sensitive variables. Based on the determination of initial dimensions, the Sobol method is utilized to conduct a global sensitivity analysis on motor parameters. By defining single-system sensitive variables and dual-system sensitive variables, dimensionality reduction in the parameters is achieved. Furthermore, combining surrogate models and multi-objective optimization algorithms, different optimization strategies are formulated for the classified sensitive variables, including independent single-system optimization and dual-system interactive optimization. Finally, the effectiveness and feasibility of the proposed optimization strategy are verified through simulation.
2. Basic Structure and Operating Principle of Single-Winding Consequent-Pole BPMSM
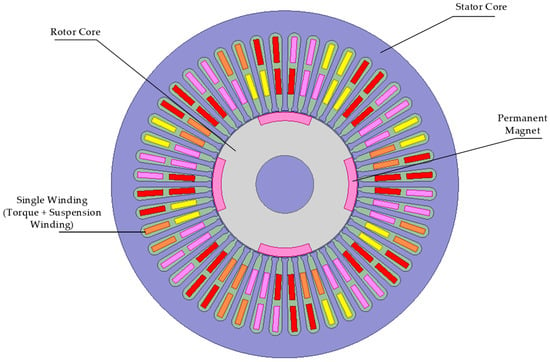
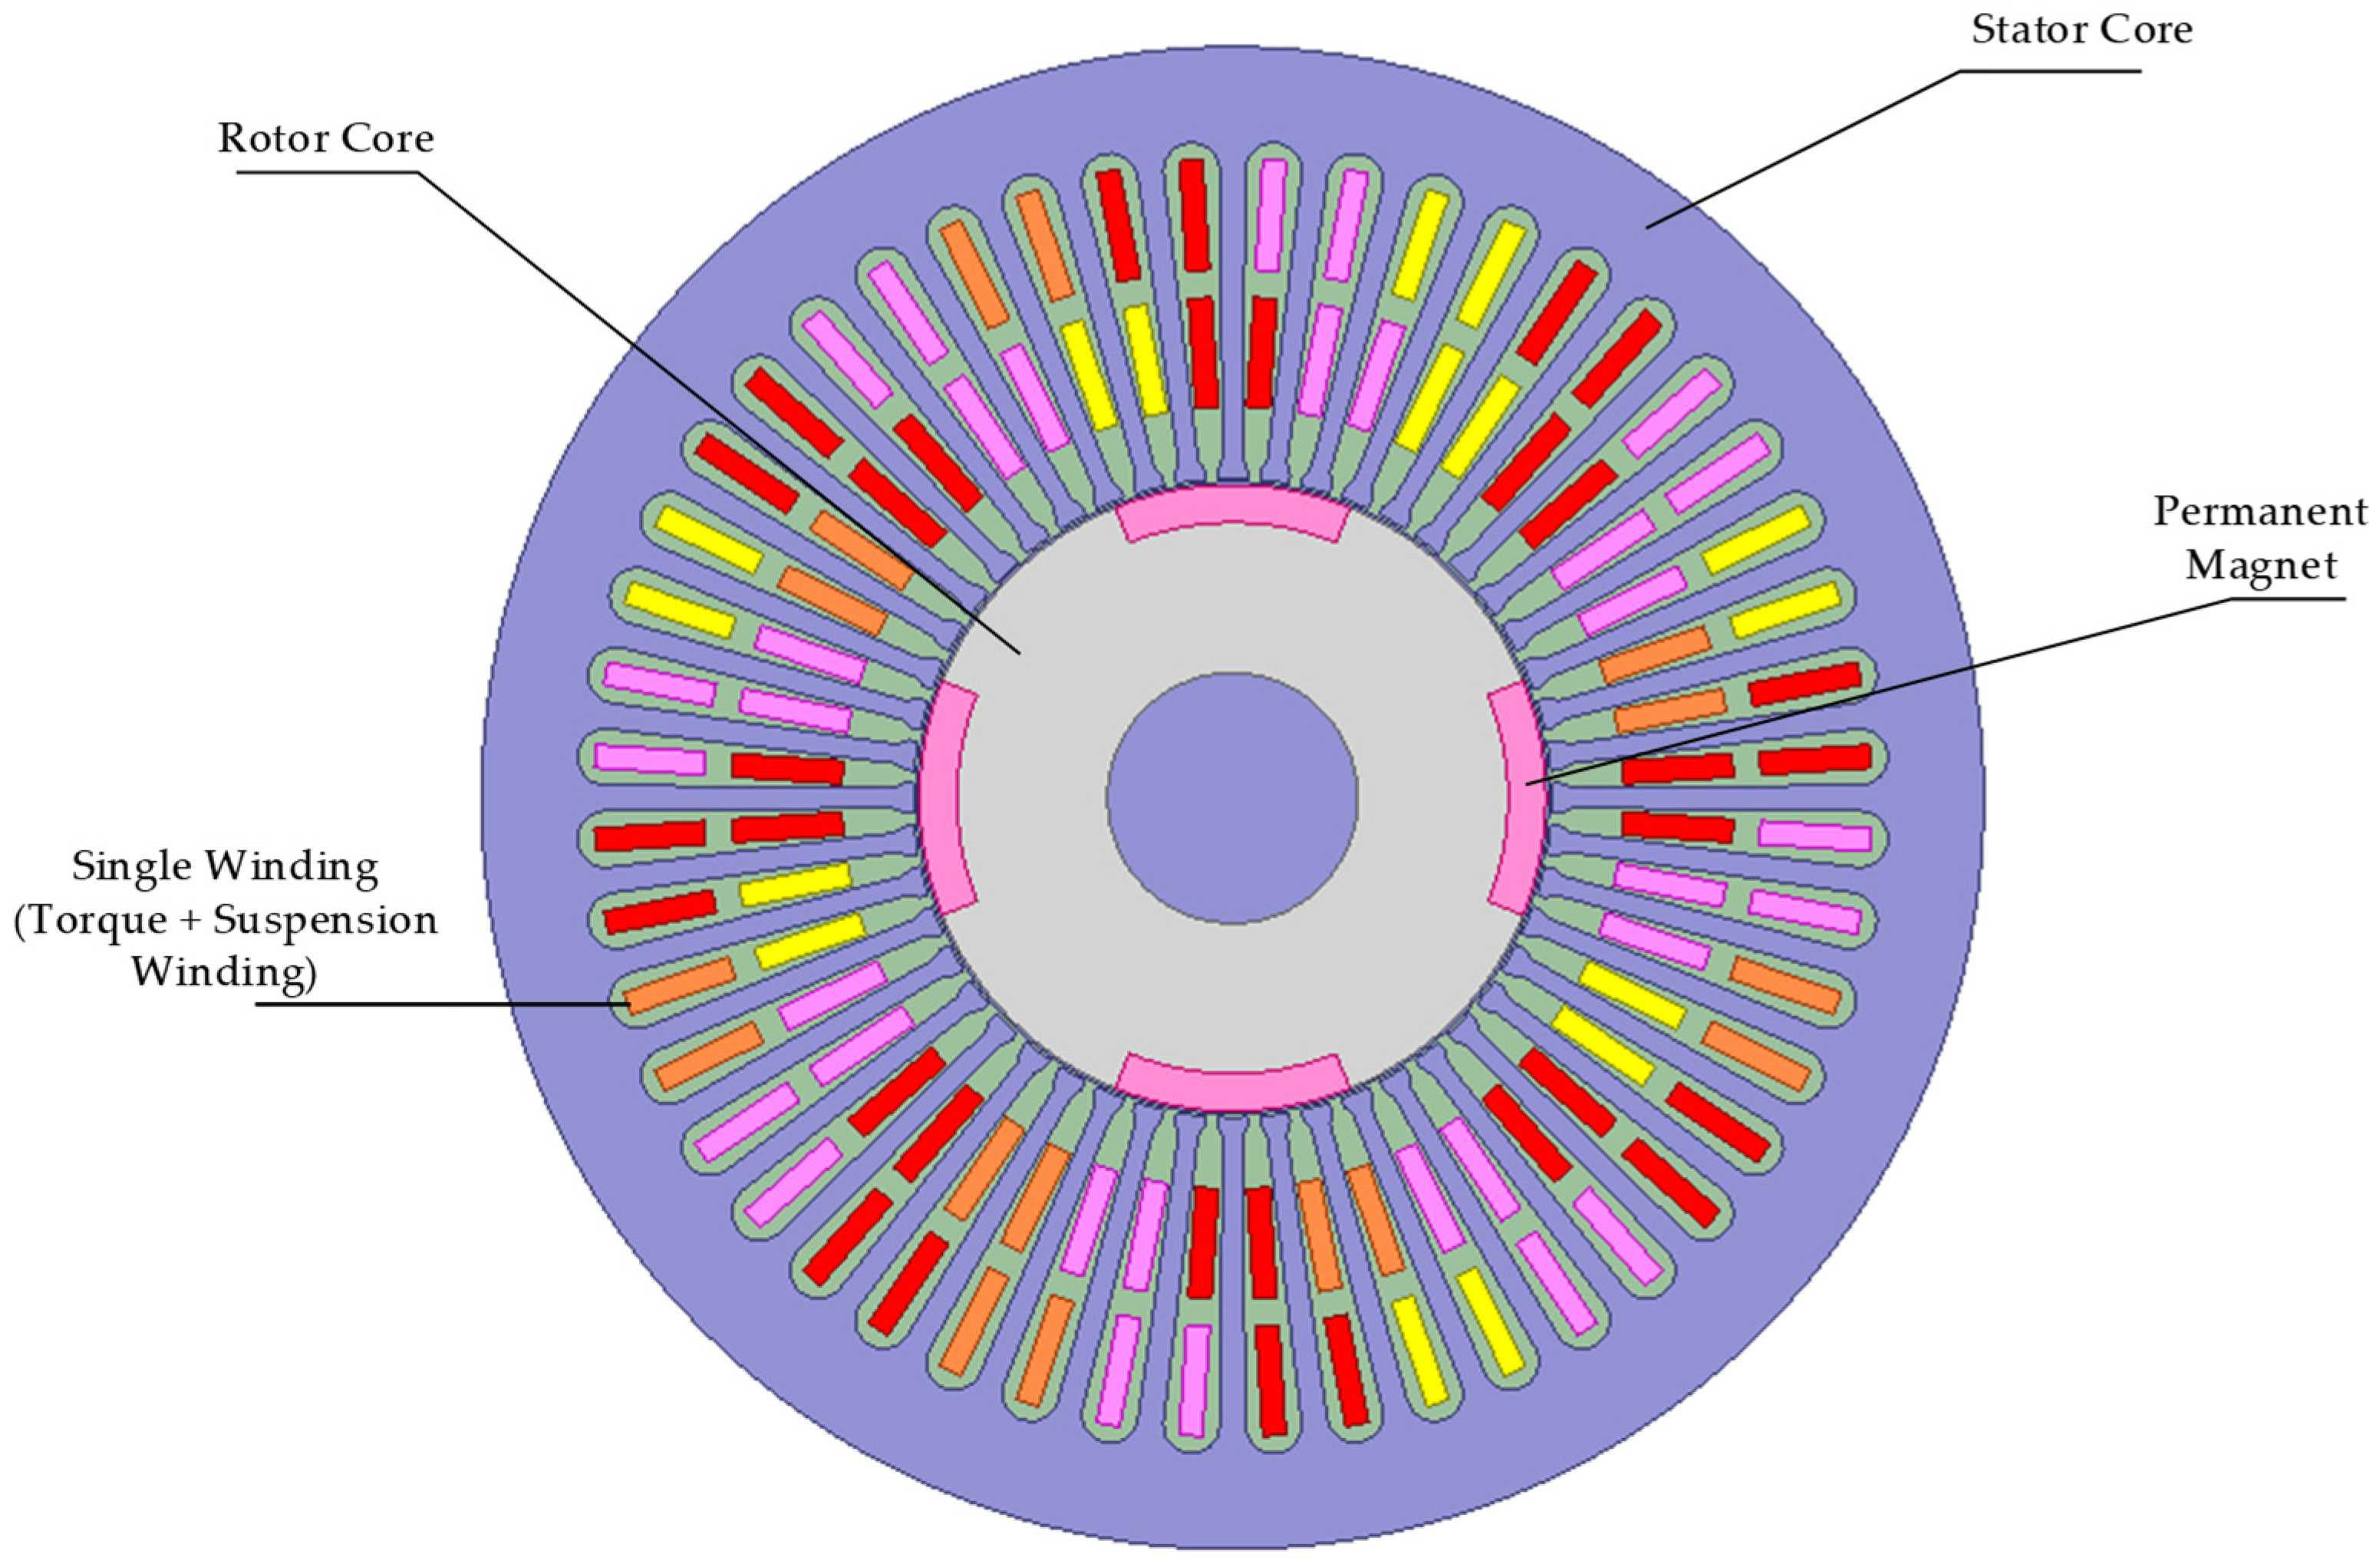
Figure 1 illustrates the schematic structure of the SW-CP-BPMSM. Herein, the red, pink, and yellow colors denote the phase-c, phase-a, and phase-b windings, respectively. The stator structure is identical to that of a traditional BPMSM, featuring a single set of windings shared by both the suspension and torque systems.
Figure 1.
Basic Structure of the Single-Winding Consequent-Pole BPMSM.
The rotor is composed of iron poles and permanent magnets. The PMs are embedded within the rotor core and arranged with the same polarity along the rotor surface. The magnetic flux generated by the PMs forms a closed loop through the iron poles located between the PMs, thereby magnetizing the iron poles to the opposite polarity. Consequently, the PMs and iron poles are distributed alternately.
In this type of motor, the generation principle of the suspension force differs from that of traditional bearingless permanent magnet motors. Since the magnetic permeability of the iron core is significantly higher than that of the PMs, the magnetic flux generated by the windings predominantly links through the iron core. Therefore, the bias magnetic field for the suspension force is essentially the unipolar magnetic field located within the “iron poles.” To achieve a stable and controllable suspension force, the pole pair number of the suspension winding () is set to 1. Notably, the relationship between and the torque winding pole pair number () is no longer constrained by the condition .
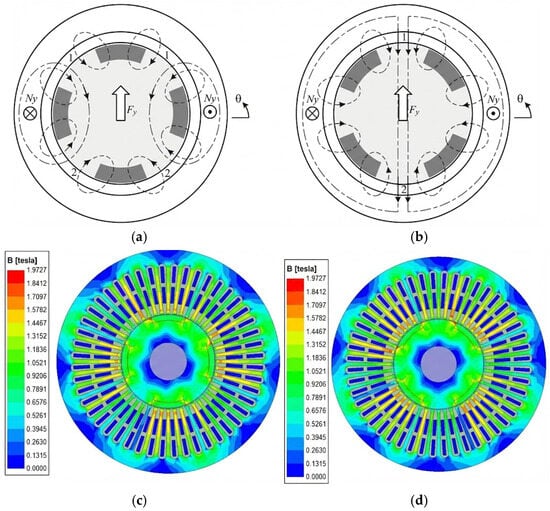
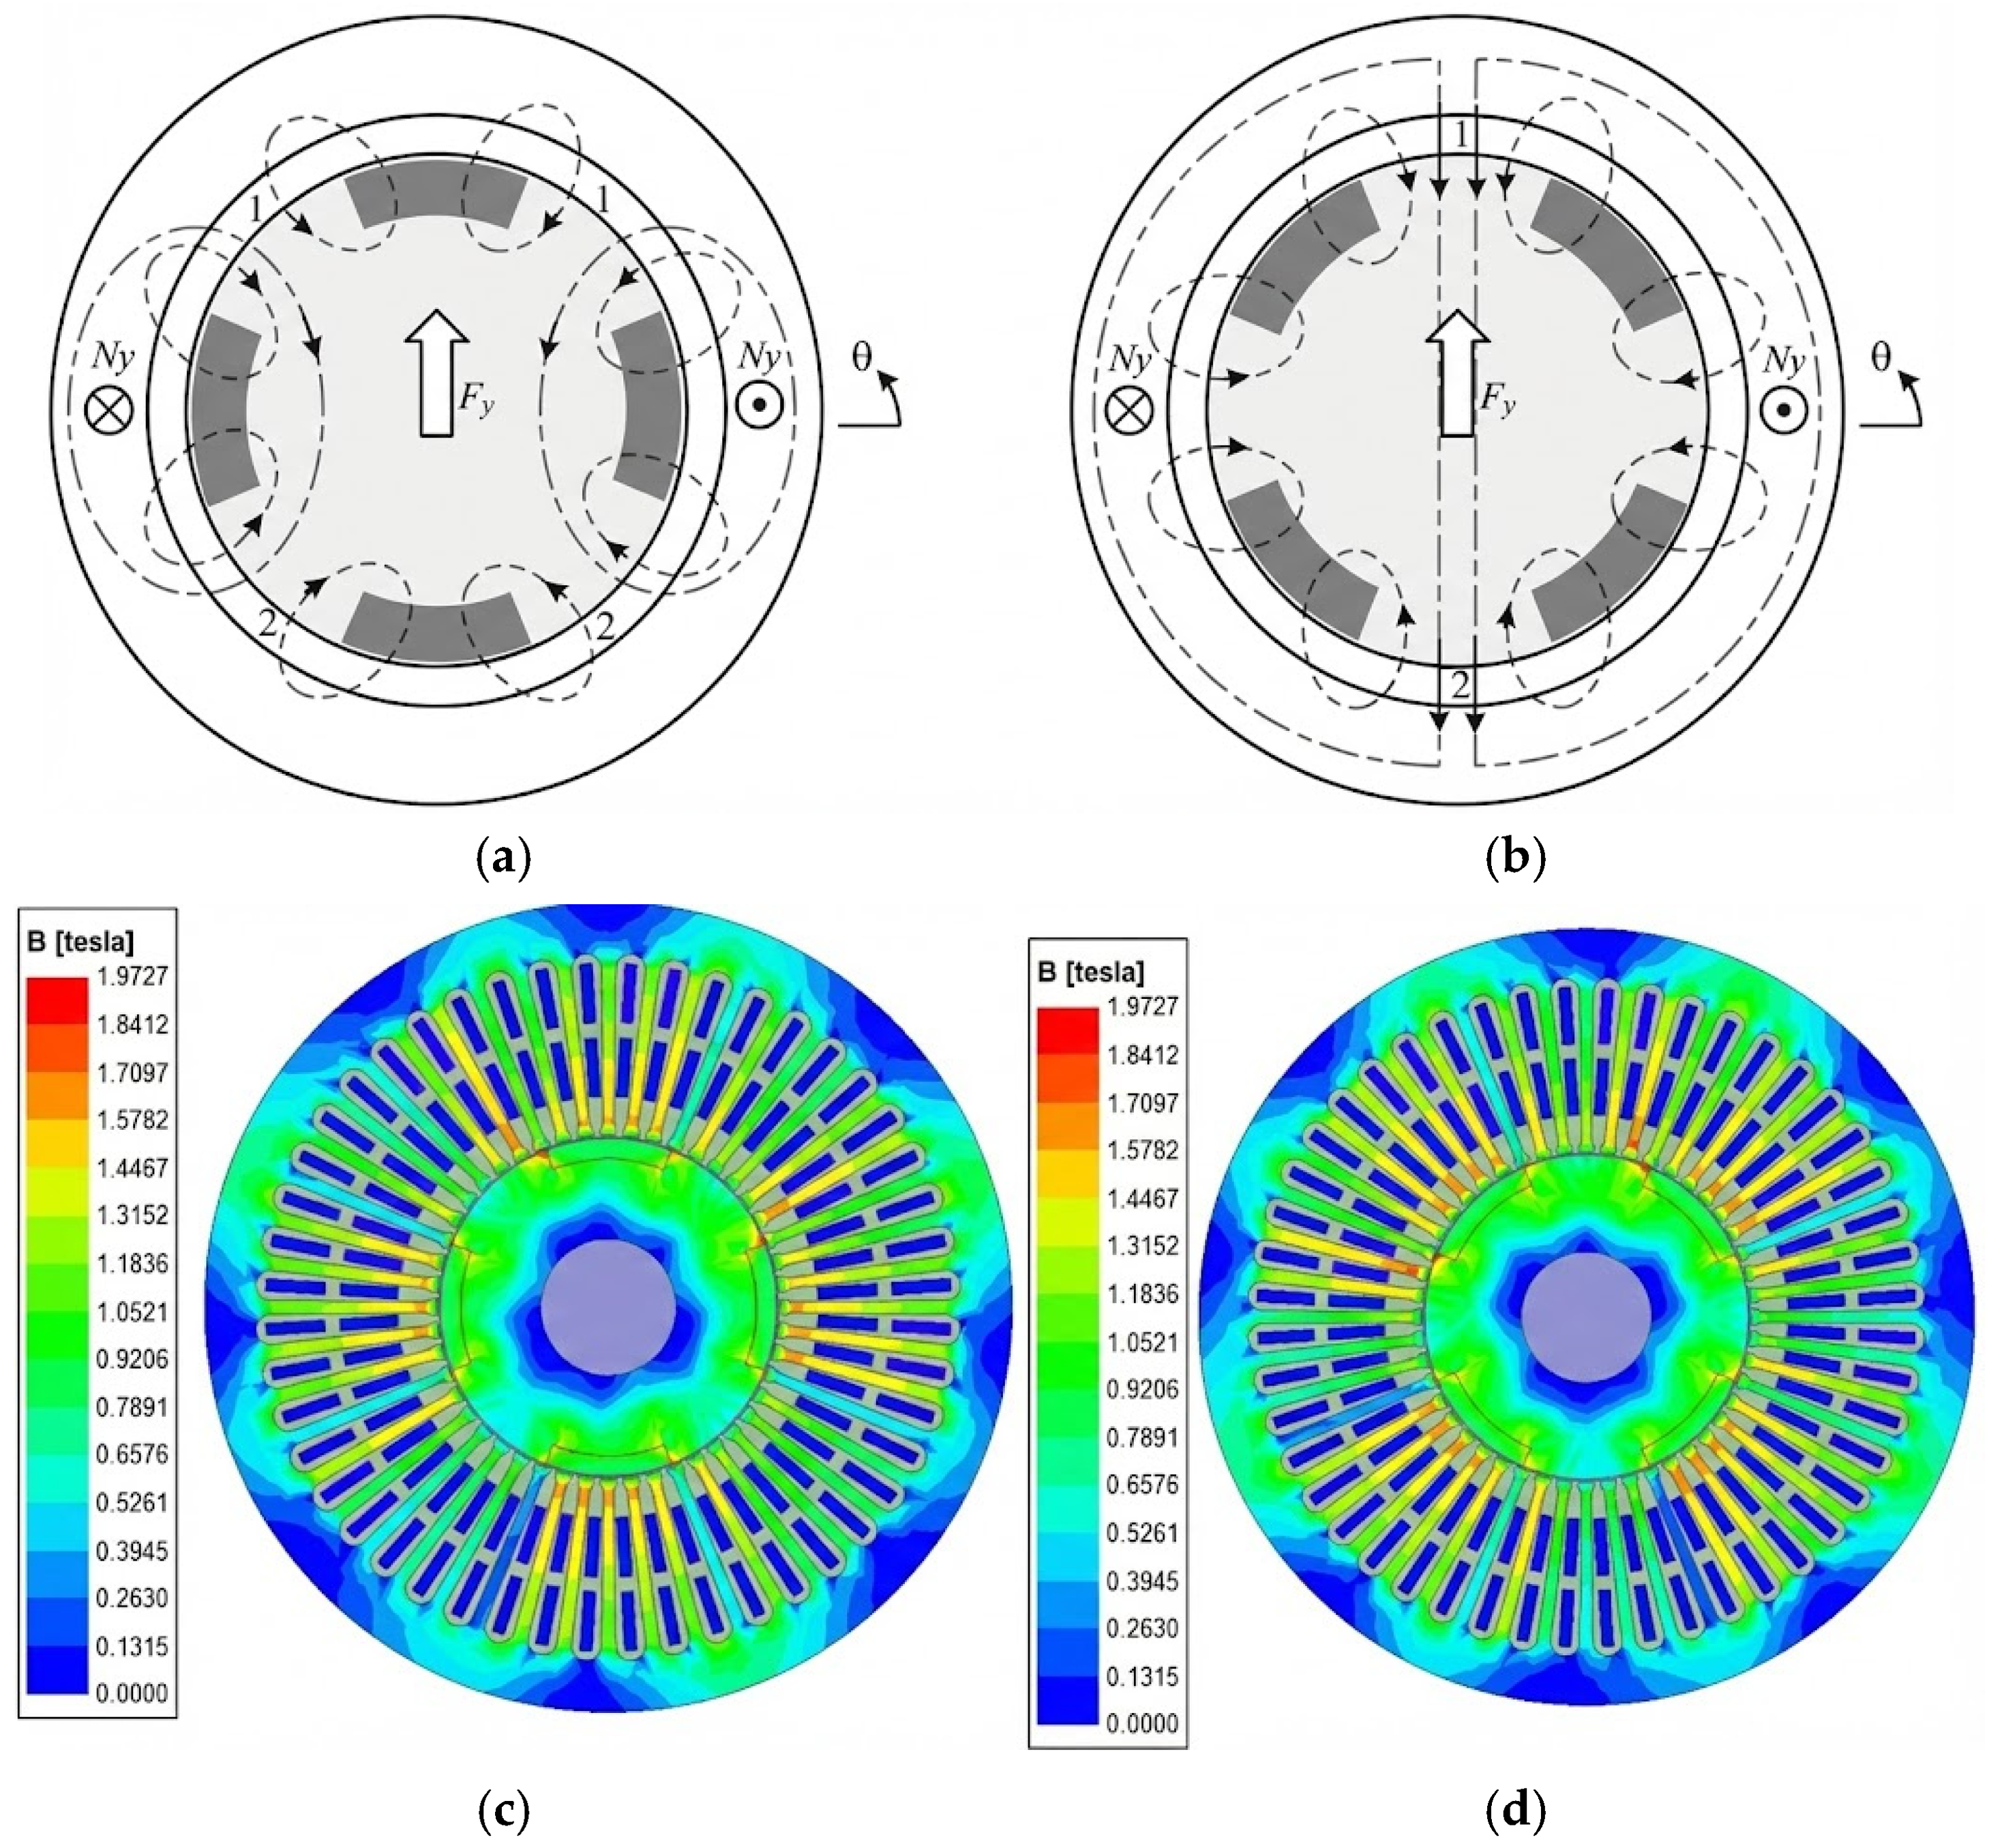
Figure 2 illustrates the principle of suspension force generation in the CP-BPMSM. The air-gap magnetic field of the CP-BPMSM is the superposition of the magnetic fields excited by the permanent magnets (PMs), the torque current, and the suspension current. In Figure 2a,b, the thin dashed lines represent the magnetic flux generated by the PMs, while the dash-dotted lines represent the magnetic flux produced by the suspension winding .
Figure 2.
Suspension principle and magnetic flux density distribution. (a) θ = 0°. (b) θ = 45°. (c) θ = 0° Magnetic Flux Density Contour Plot. (d) θ = 45° Magnetic Flux Density Contour Plot.
Throughout one electrical cycle, regardless of the rotor position, the superposition of the magnetic field generated by the suspension winding and that of the PMs results in an increased magnetic flux density at air gap 1 and a decreased flux density at air gap 2. Consequently, a radial force along the positive y-axis is generated. Conversely, applying a reverse current produces a radial force along the negative yaxis. The generation principle of the radial force along the x-axis is analogous to that of the yaxis.
Let pm be the number of PM pole pairs; Ap and As be the magnetomotive forces (MMFs) generated by the PMs and the suspension winding, respectively; g be the air-gap length; r be the average air-gap radius; and l be the axial length of the rotor core. Furthermore, Apm denotes the pole arc angle of the PM within each pole pair, with a value range of , where the sum of the PM pole arc angle and the iron pole arc angle in each pole pair equals . When , the expression for the suspension force can be written as:
Based on Equation (1), it can be observed that the suspension force is independent of the rotor position angle and the rotating magnetic field excited by the torque current. Figure 2c,d present the magnetic flux density distributions obtained from FEA. These figures demonstrate that the suspension winding can generate a controllable and stable suspension force regardless of the rotor position.
High-efficiency torque and suspension performance constitute the primary requirements for the SW-CP-BPMSM. Consequently, the average output torque (Tavg), average output suspension force (Favg), and torque ripple are selected as the optimization objectives. Specifically, Tavg and Favg are defined as maximization objectives (positive optimization objectives). The torque ripple is characterized by the torque ripple coefficient (Tp), calculated via Equation (2), and is defined as a minimization objective (negative optimization objective).
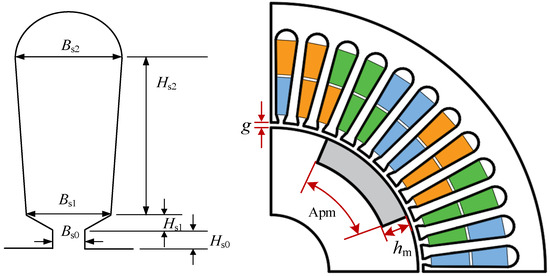
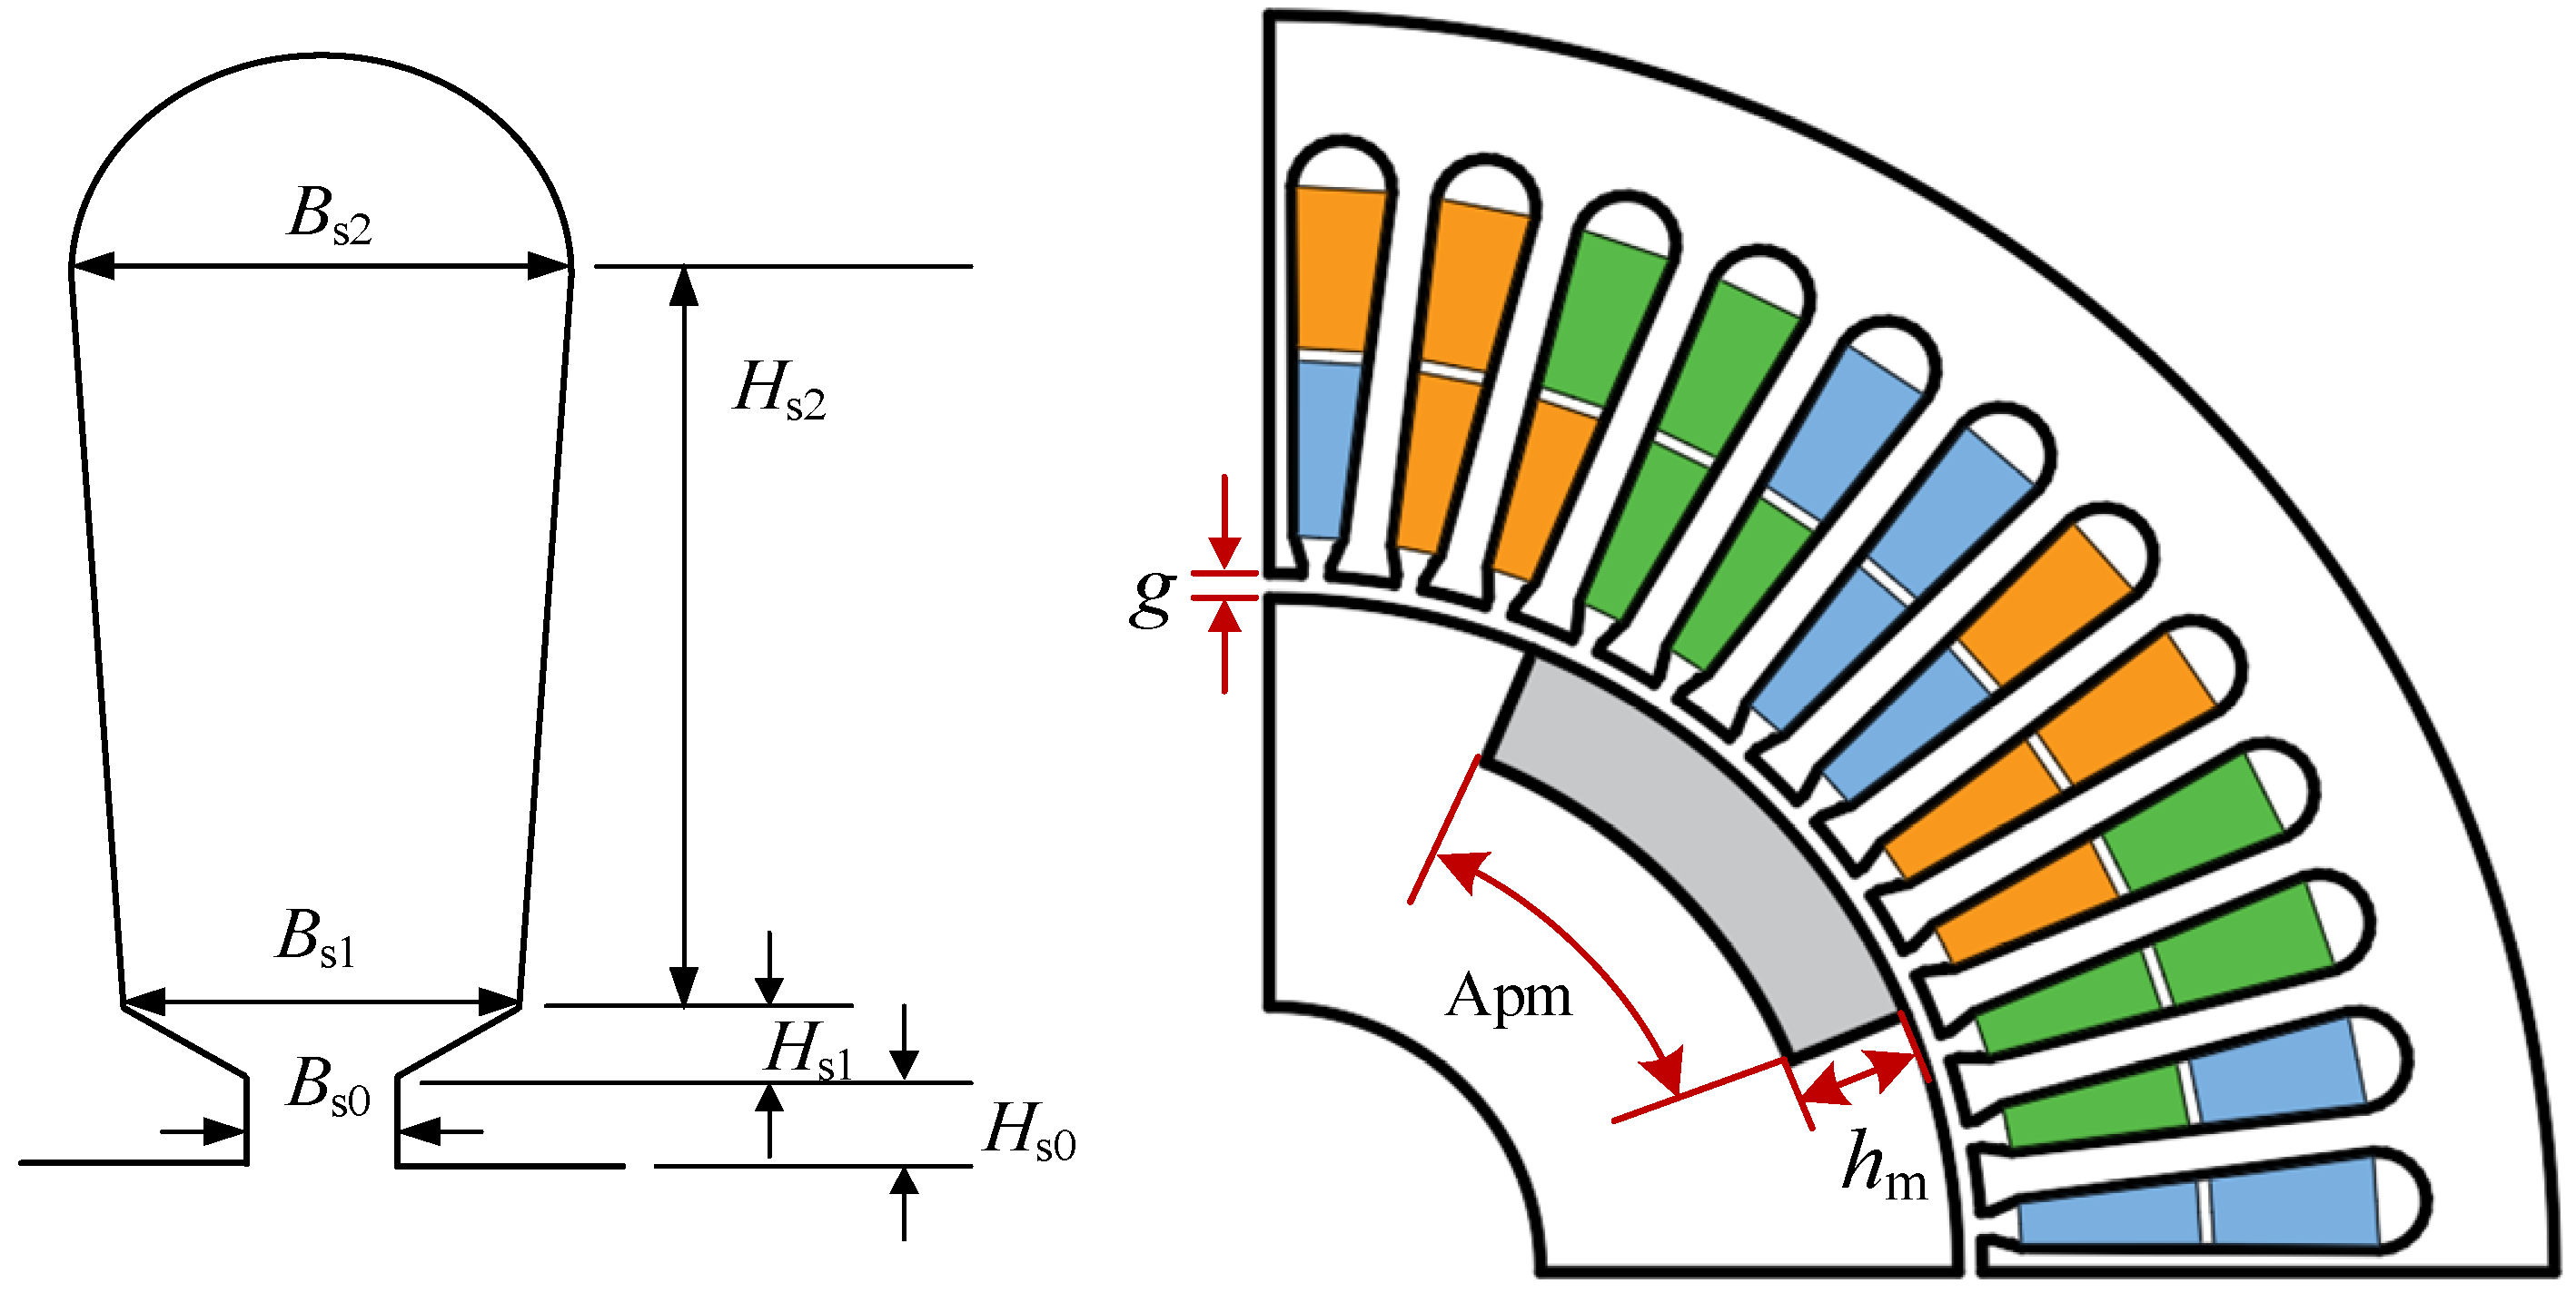
The design parameters that significantly influence motor performance are shown in Figure 3.
Figure 3.
Optimization parameters schematic diagram.
Based on the structural characteristics of the CP-BPMSM, let Apm denote the permanent magnet pole arc per pole, and let denote the corresponding iron pole arc. Consequently, the permanent magnet pole-arc ratio α is defined as:
Apm and satisfy the following relationship:
When the permanent magnets possess a certain thickness, given that the magnetic permeability of the permanent magnets is close to that of air, it can be assumed that the magnetic flux lines of the suspension field pass almost exclusively through the iron poles. Consequently, the permanent magnet pole-arc ratio directly influences the air-gap magnetic flux and exerts a significant impact on the electromagnetic performance of the motor. Therefore, it is selected as a key parameter for optimization. The main parameters of the motor and the design parameters to be optimized are listed in Table 1 and Table 2, respectively.
Table 1.
Main parameters of the prototype.
Table 2.
Optimization design parameters and value ranges of the motor.
3. Optimization Strategy Based on Sensitivity Classification
3.1. Principle of the Strategy
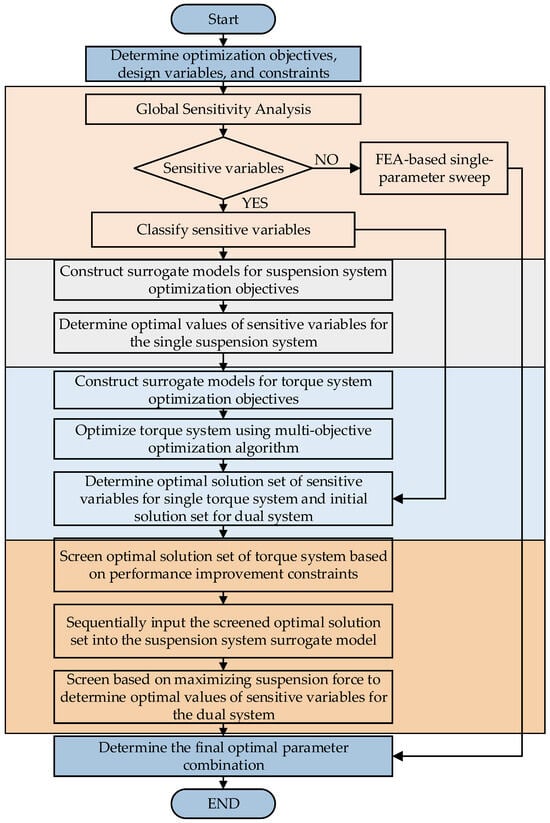
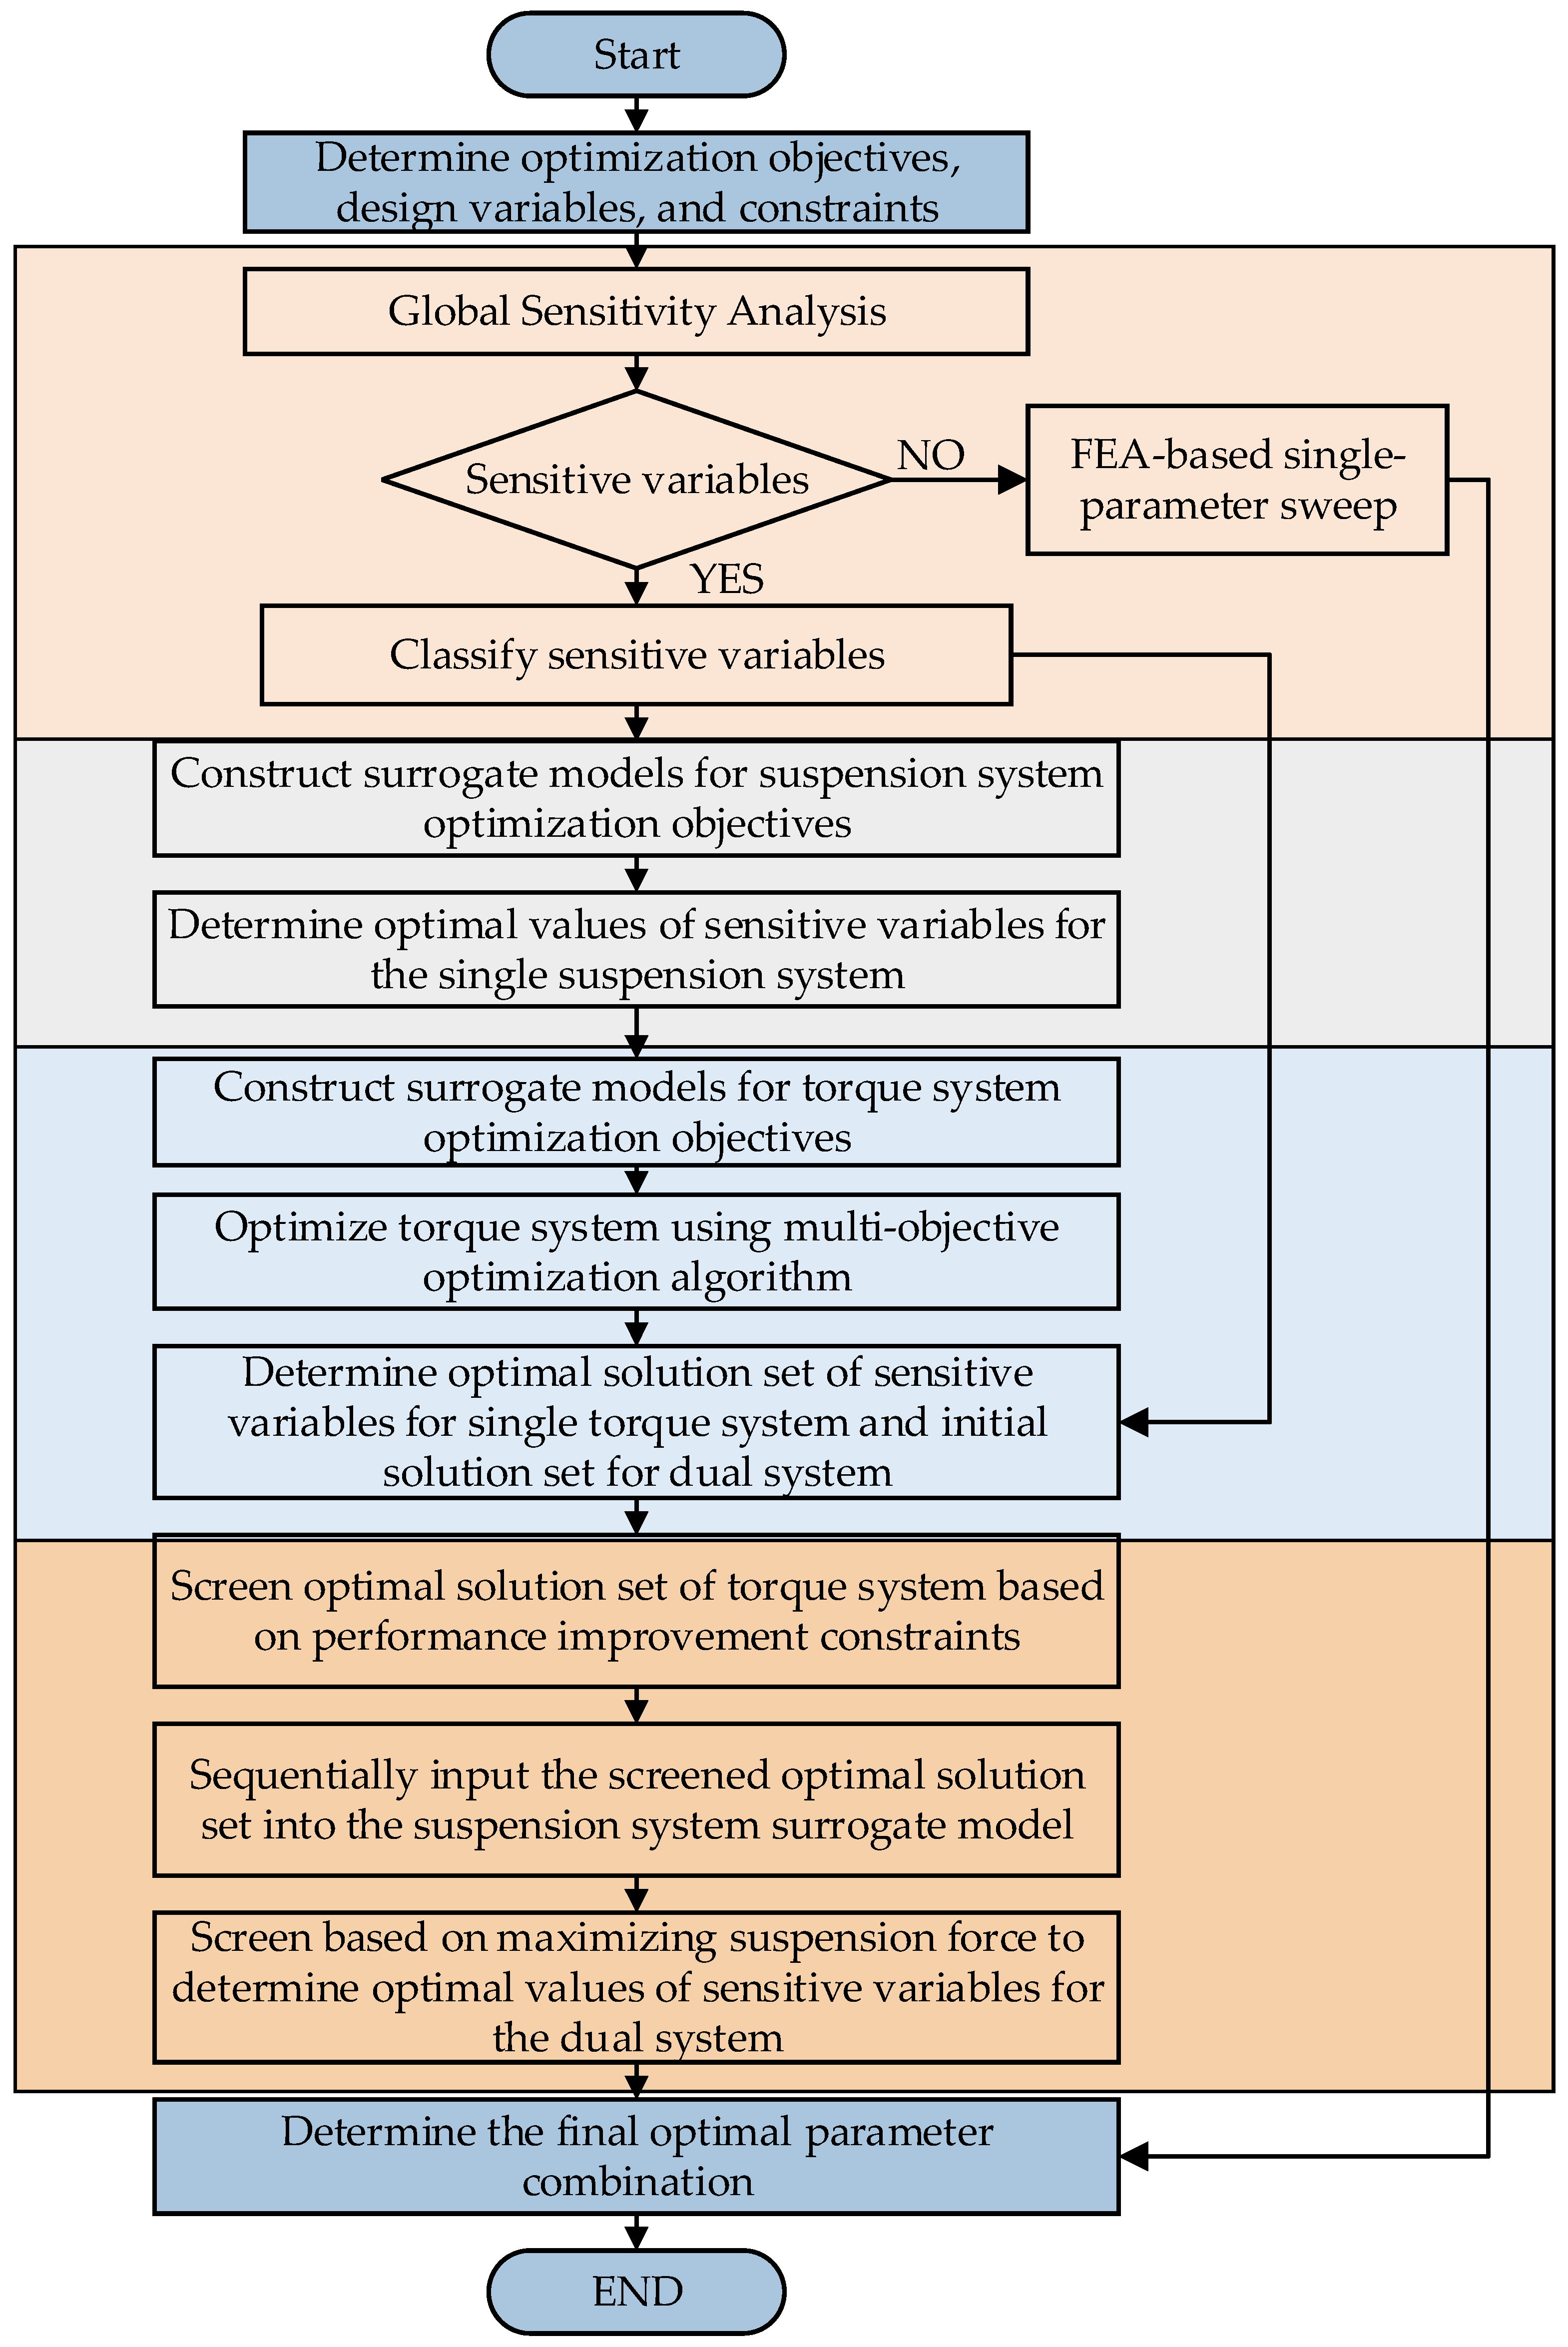
Due to the specific consequent-pole topology and bearingless structure of the SW-CP-BPMSM, its design parameters exhibit characteristics of strong coupling and a high-dimensional parameter space, which pose severe challenges to traditional optimization methods. To address this, a dual-system interactive optimization strategy based on sensitivity classification is proposed in this paper, as shown in Figure 4.
Figure 4.
Flowchart of the optimization strategy.
The proposed strategy consists of four steps:
- Classification of Design Variables: Sensitivity analysis is conducted on the parameters of both the suspension and torque systems to distinguish between insensitive and sensitive variables. The sensitive variables are further categorized into dual-system sensitive variables and single-system sensitive variables. Sensitive variables are incorporated into the optimization design, whereas insensitive variables are determined using a finite element single-parameter sweeping method. This approach is adopted to reduce parameter dimensionality and enhance optimization efficiency.
- Preliminary Optimization of Torque/Suspension Systems: The RSM is utilized to perform preliminary optimization on the suspension system to ascertain the optimal values for the single-suspension system sensitive variables. Simultaneously, a BP neural network surrogate model combined with a multi-objective optimization algorithm is employed for the preliminary optimization of the torque system. This process determines the optimal solution set for the single-torque system sensitive variables and the initial solution set for the dual-system sensitive variables.
- Dual-System Interactive Optimization: This phase is divided into three sub-steps:
- The parameter values of the single-suspension system sensitive variables are fixed, and the critical performance metrics of the torque system are optimized based on this foundation;
- Solutions within the torque system’s optimal solution set that fail to meet specific performance indices are eliminated;
- The screened optimal solution set of the torque system is fed back into the surrogate model of the suspension system. Subsequently, the parameter combination yielding the best suspension performance is selected to finalize the optimal values for the dual-system sensitive variables.
3.2. Key Technologies
3.2.1. Global Sensitivity Analysis
To enhance optimization efficiency, it is essential to conduct a sensitivity analysis to identify and select sensitive parameters for the optimization design. Given that the design parameters of the single-winding consequent-pole BPMSM exhibit severe coupling, and that variations in different parameters exert distinct influences on the optimization objectives, a global sensitivity analysis is imperative to elucidate the interactive effects among these parameters. The Sobol method, which is based on variance decomposition, is utilized here as it is one of the most widely applied techniques for global sensitivity analysis [15]. For a model containing k analysis parameters the Sobol method decomposes the output variance of the objective function into 2k−1 partial variance terms
Dividing Equation (5) by the total variance D, the sensitivity indices of all orders satisfy:
where the first-order sensitivity index, Si, represents the individual contribution of each design parameter to the objective function; the second-order sensitivity index, Sij, reflects the interaction effect between two design parameters on the objective function; and higher-order sensitivity indices denote the interaction effects among a greater number of design parameters. The total sensitivity index of a single design parameter with respect to the objective function is defined as the sum of all sensitivity indices associated with that parameter in Equation (6).
3.2.2. Surrogate Model Construction
Since the optimization of the suspension system constitutes a single-objective problem, the RSM surrogate model is adopted [16]. The fitting approach in RSM typically utilizes high-order polynomial functions. Although increasing the order of the function enhances the fitting accuracy for the sampling points, it inevitably results in increased computational costs. Therefore, in practical applications, the order of the function must be judiciously selected according to the complexity of the sampling points. This research employs a second-order polynomial response surface methodology (RSM) to achieve an optimal trade-off between computational efficiency and predictive accuracy. Compared to first-order models, the quadratic formulation incorporates cross-product and squared terms, enabling it to effectively capture nonlinear coupling effects among design variables and the local curvature of the response surface, thereby significantly reducing residual error. Furthermore, in contrast to higher-order surrogate models, the quadratic model requires a moderate number of finite element simulation samples, effectively mitigating the “curse of dimensionality” and preventing the numerical oscillations often associated with high-order fitting. By ensuring global convergence while maintaining low computational overhead, the model provides a robust approximation of the complex physical characteristics of the suspension system. In general, a second-order function model adequately satisfies the requirements of most scenarios, and its mathematical expression can be formulated as follows:
where yr denotes the output variable; Xm and Xn represent the individual input variables; λ0 is the constant term; and λm, λmm, and λmn serve as the coefficients for the linear, quadratic, and interaction terms of the input variables, respectively.
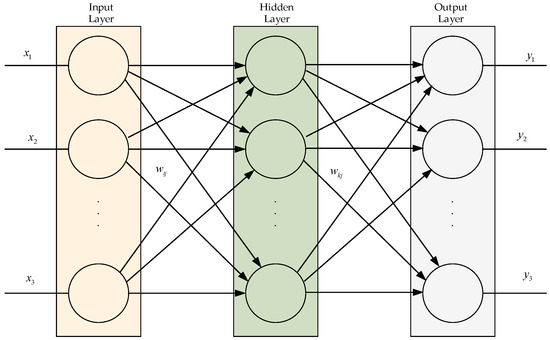
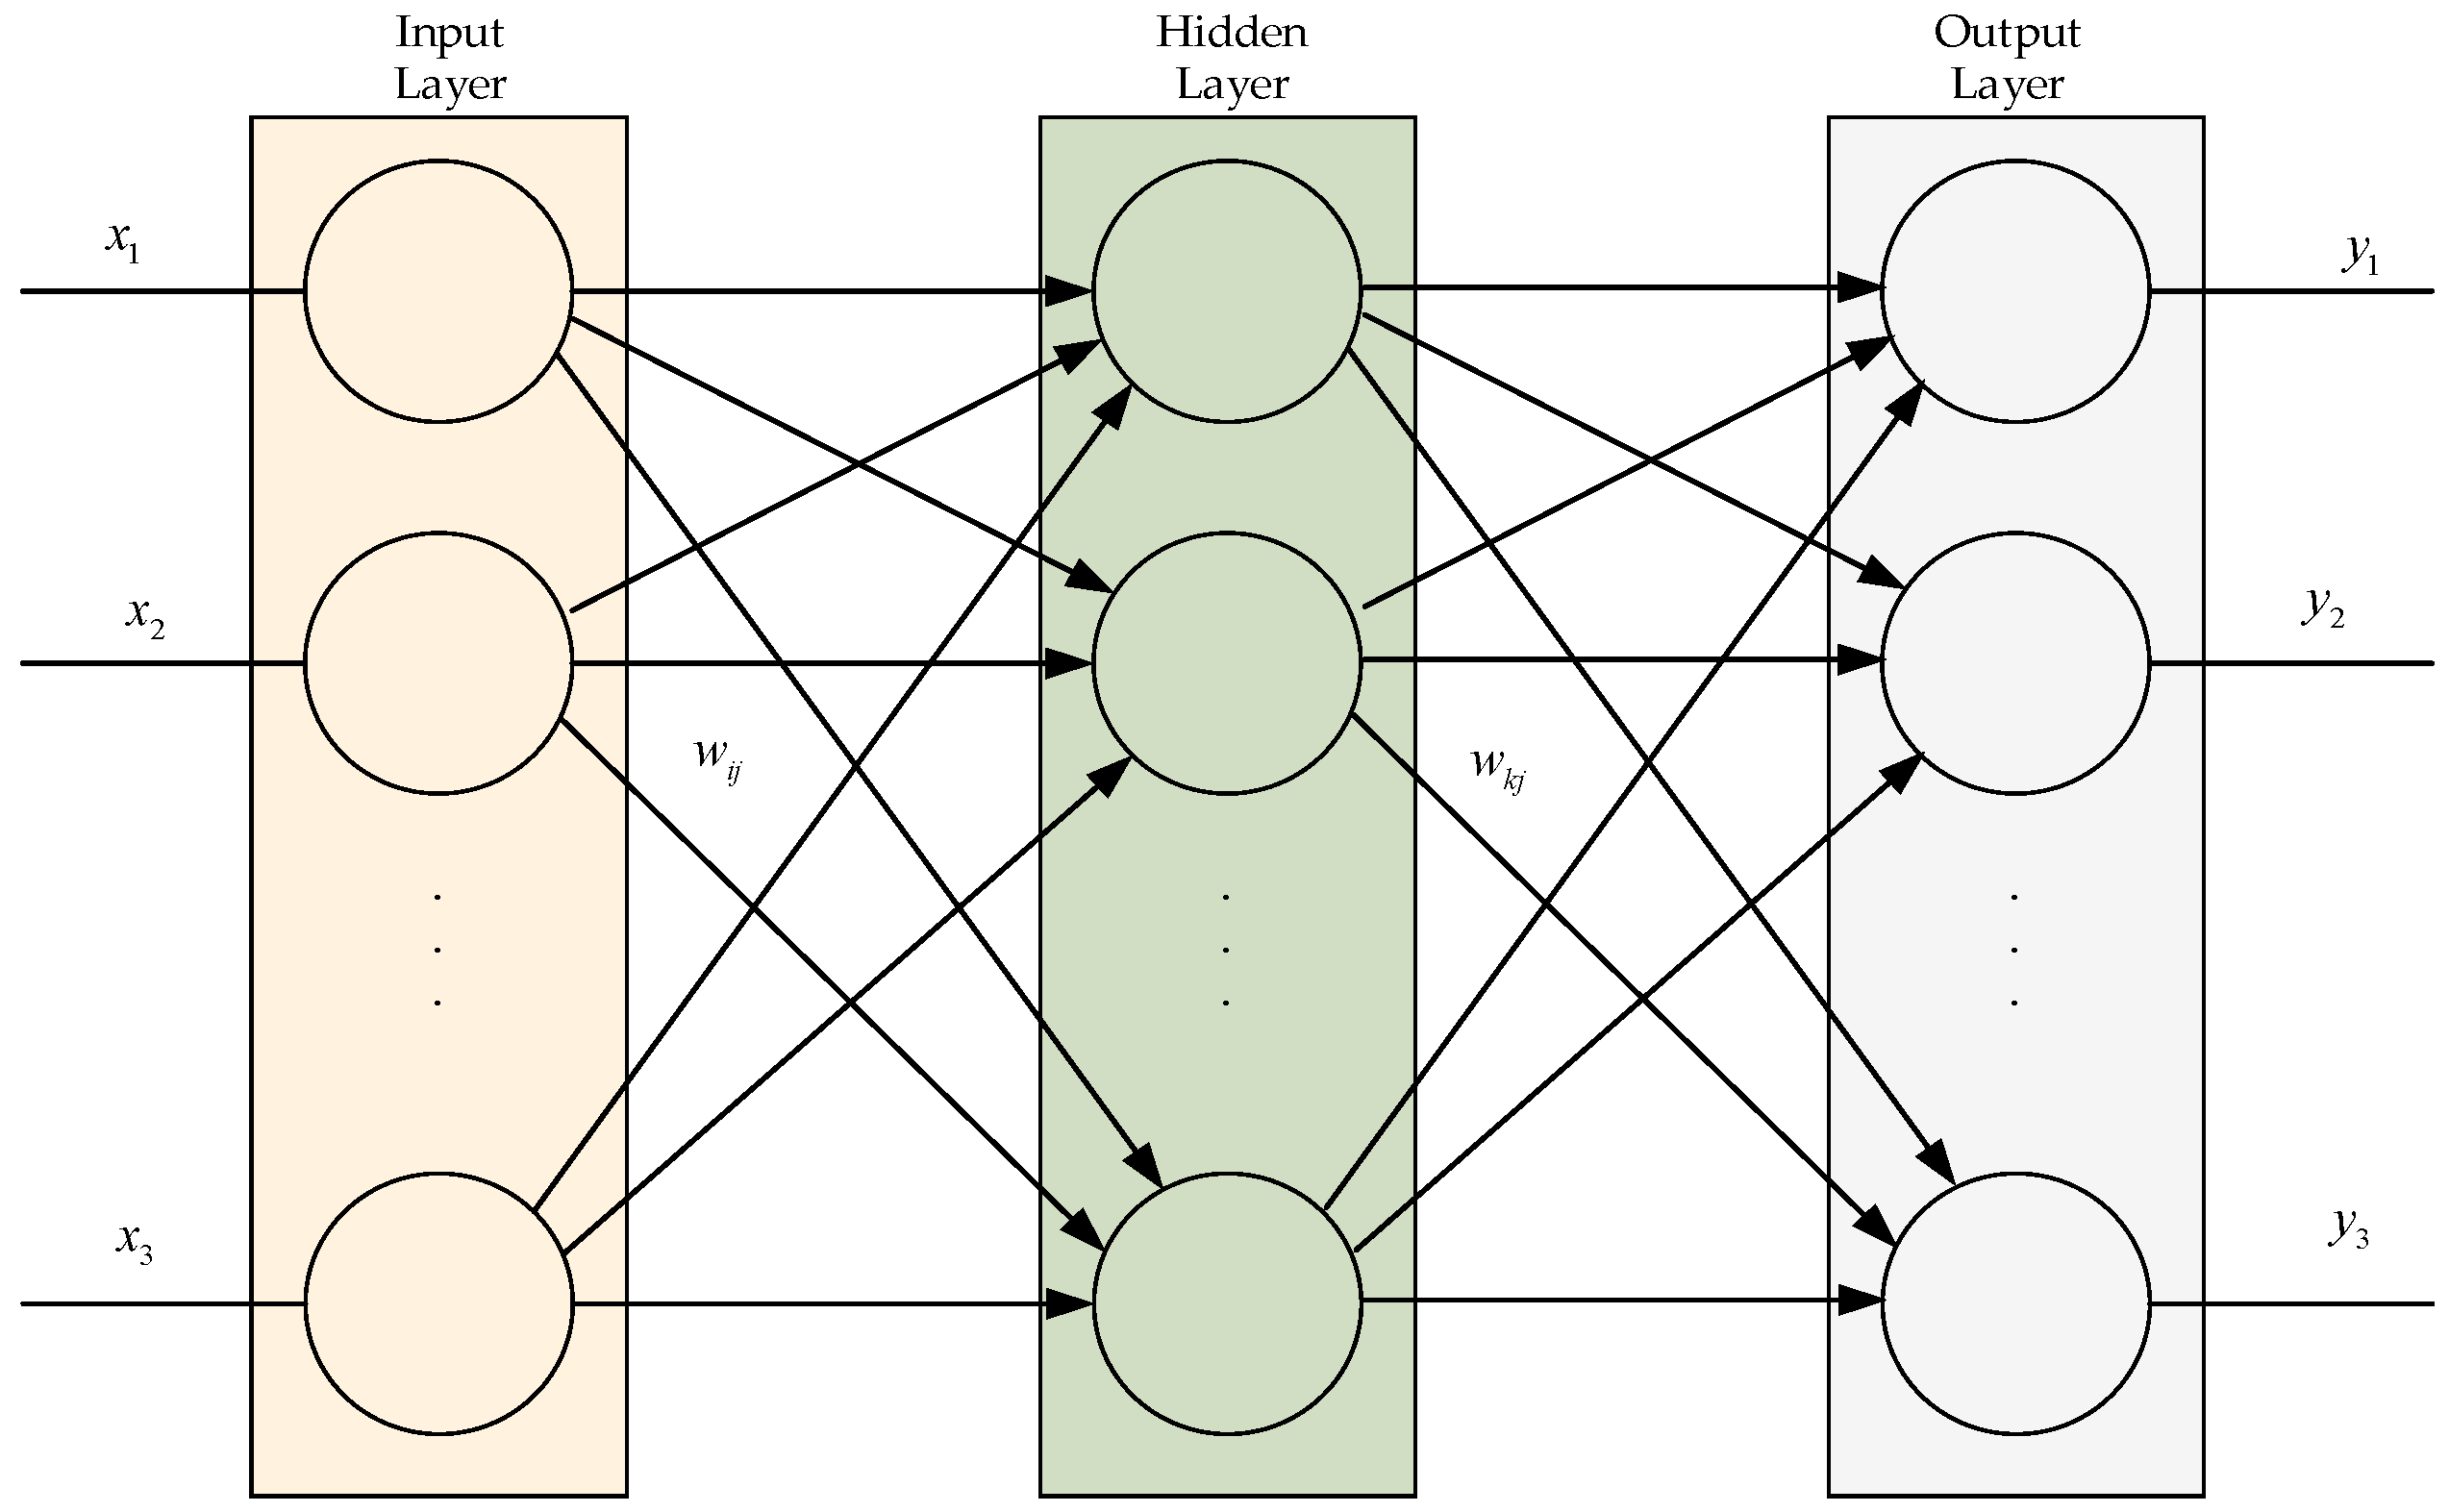
For the torque system, a BP neural network can be employed to construct the model [17]. The BP neural network is a multi-layer feedforward network trained via the error back-propagation algorithm. Possessing robust non-linear mapping capabilities, it is extensively utilized in the modeling and prediction of complex engineering systems. Its topology primarily comprises an input layer, a hidden layer, and an output layer, wherein neurons between layers achieve full connectivity through adjustable weights and biases. The learning mechanism of the BP neural network proceeds as Figure 5:
Figure 5.
BP neural network.
The establishment of the BP neural network encompasses two distinct phases: model training and prediction. Initially, the sampled data points are partitioned into a training set and a prediction set. For the training set, the parameters to be optimized serve as the network inputs, while the optimization objectives function as the outputs; the network’s hyperparameters are adjusted to align the network outputs with the actual values. To evaluate the model’s accuracy on untrained points, the prediction set utilizes the same hyperparameters as the training set to compare the predicted results against the actual values. High accuracy within the prediction set indicates a satisfactory fitting performance.
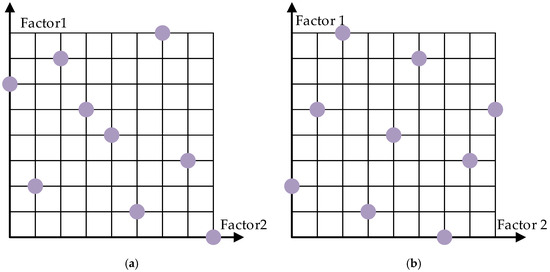
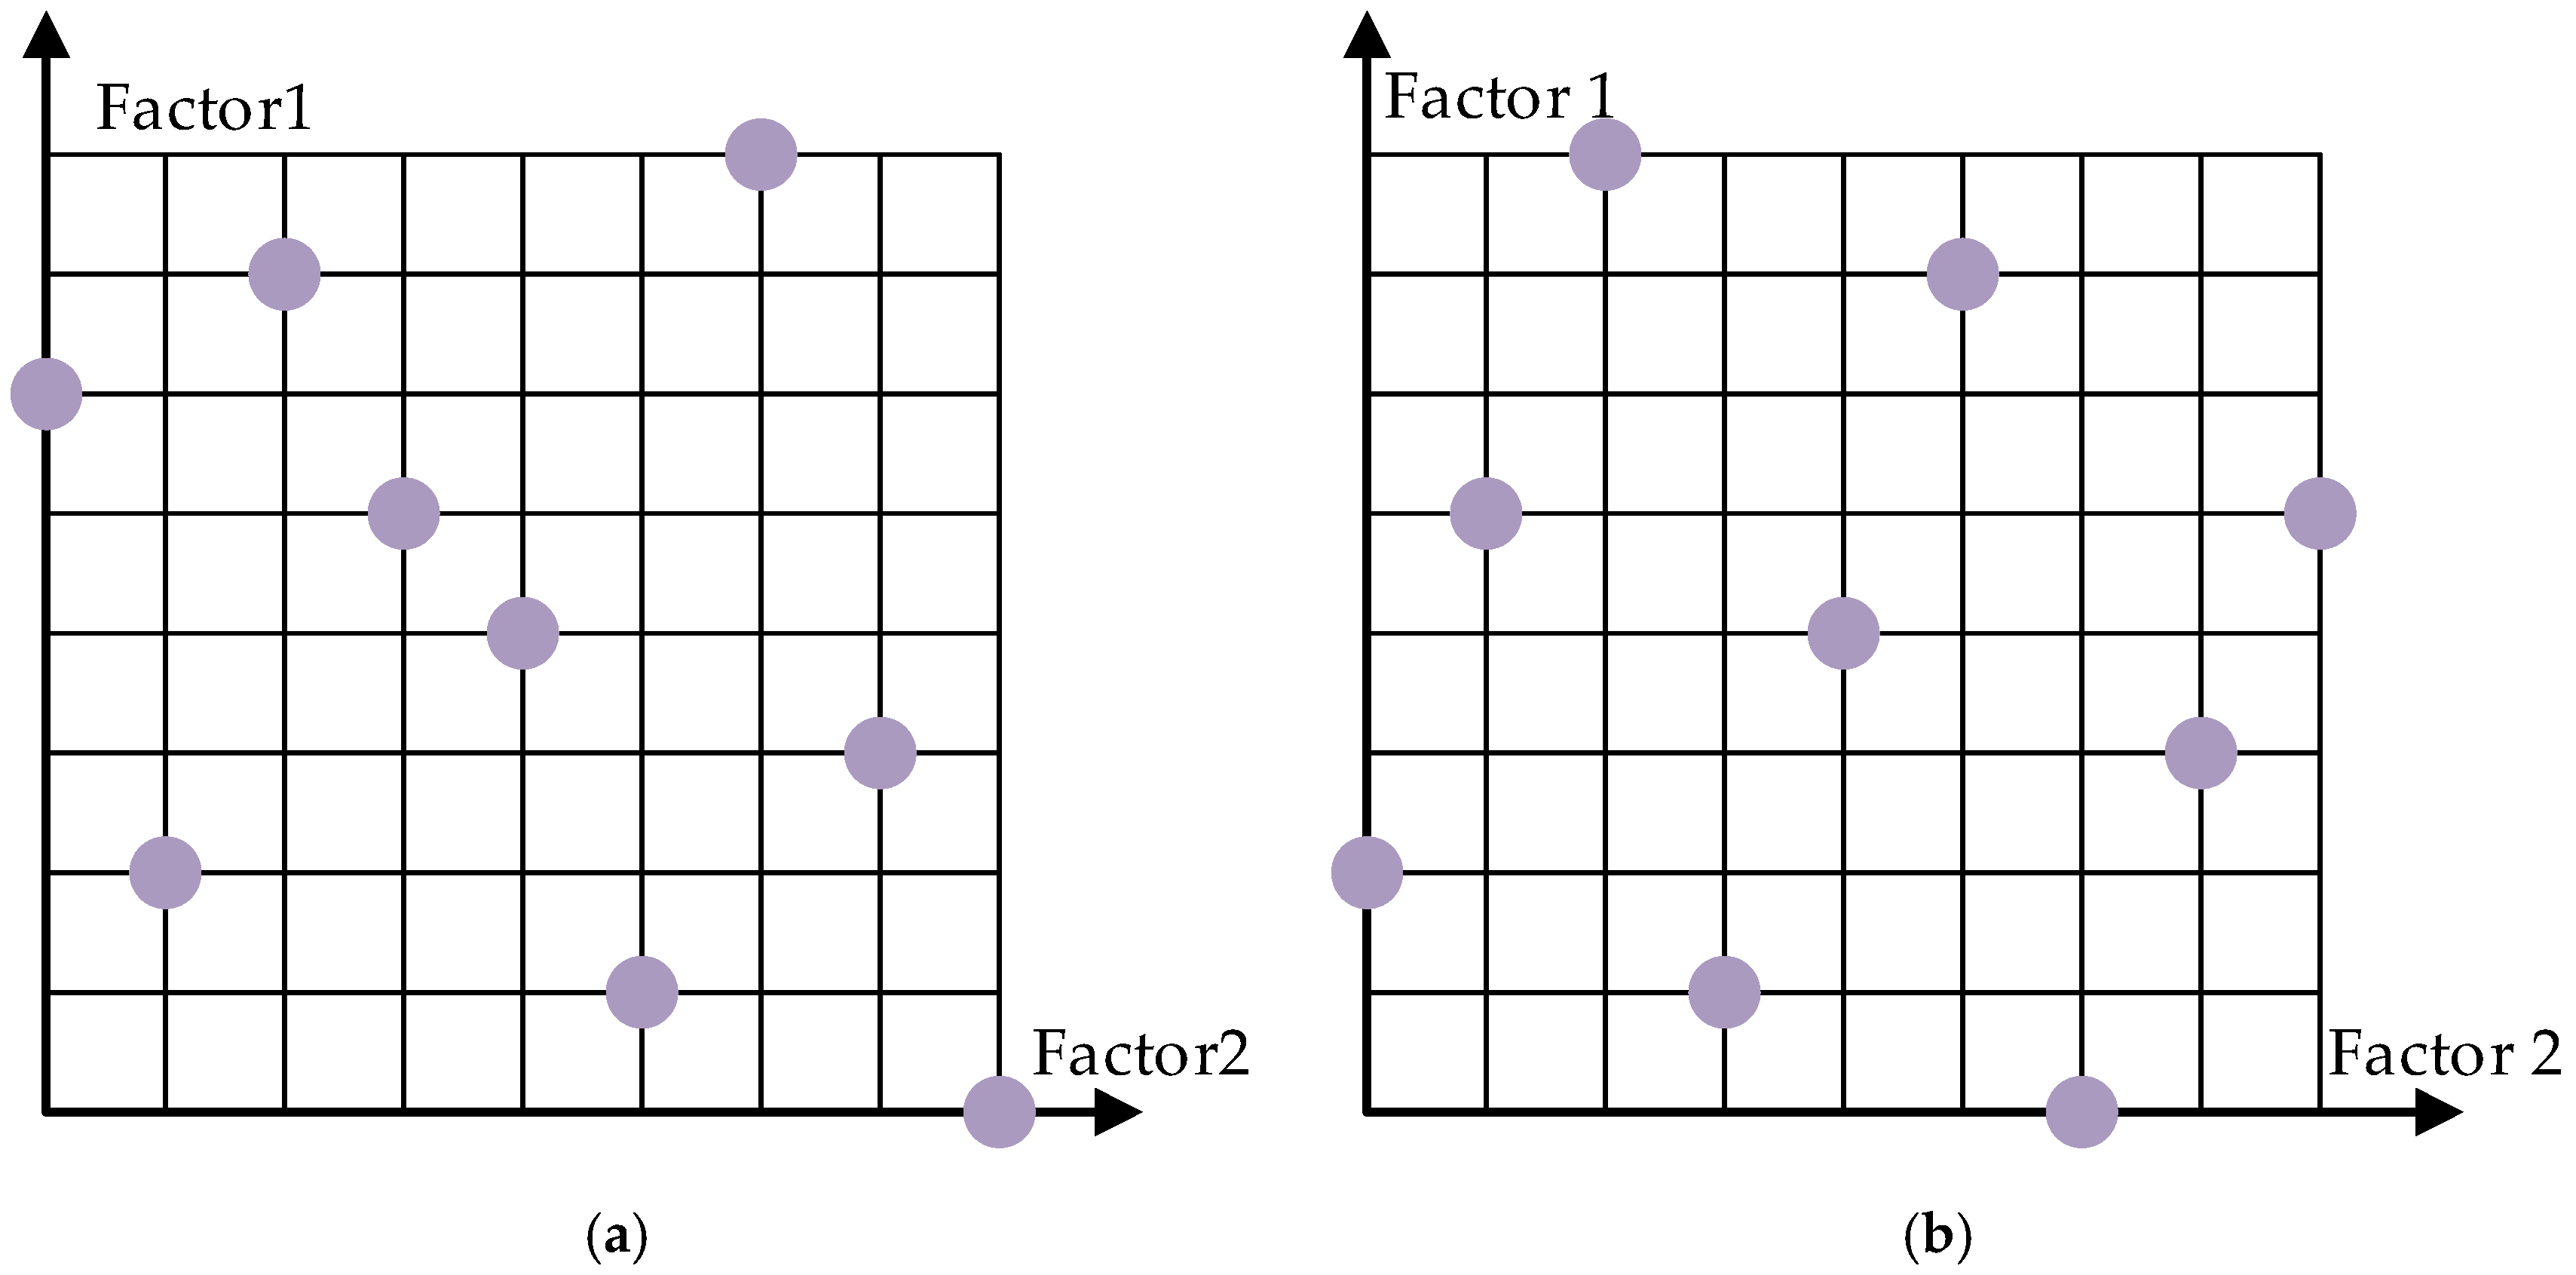
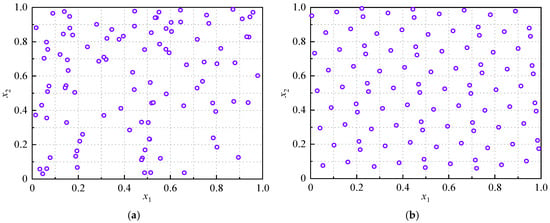
Prior to constructing the surrogate model, it is necessary to select appropriate sampling points. Latin Hypercube Sampling [18] facilitates full-range sampling for each factor, ensuring the randomness and uniformity of the samples. However, as the number of sampling levels increases, random combinations among various factors may lead to the loss of coverage in certain regions of the design space. Optimal Latin Hypercube Sampling retains the characteristic of traditional LHS—ensuring uniform projection across each dimension—while further incorporating optimization algorithms to adjust the distribution of sample points within the multi-dimensional space. By ensuring that sample points are distributed as uniformly and discretely as possible throughout the design domain, Optimal LHS captures richer global information with the same sample size, thereby significantly enhancing the accuracy and efficiency of constructing complex surrogate models. As illustrated, compared to traditional LHS with the same sample size, Optimal LHS utilizes mathematical optimization constraints to achieve more uniform sample coverage while simultaneously reducing algorithmic complexity. As shown in Figure 6. Consequently, this paper adopts the Optimal LHS method for constructing the surrogate model.
Figure 6.
Sampling diagram. (a) Traditional LHS. (b) Optimal LHS.
3.2.3. Multi-Objective Optimization Algorithm
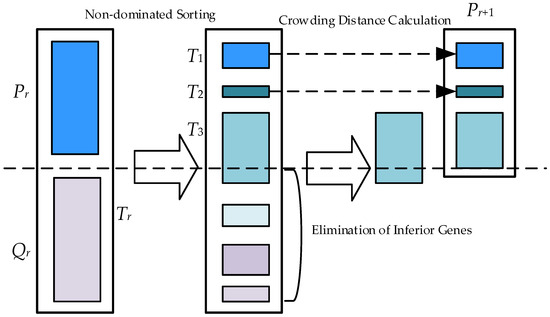
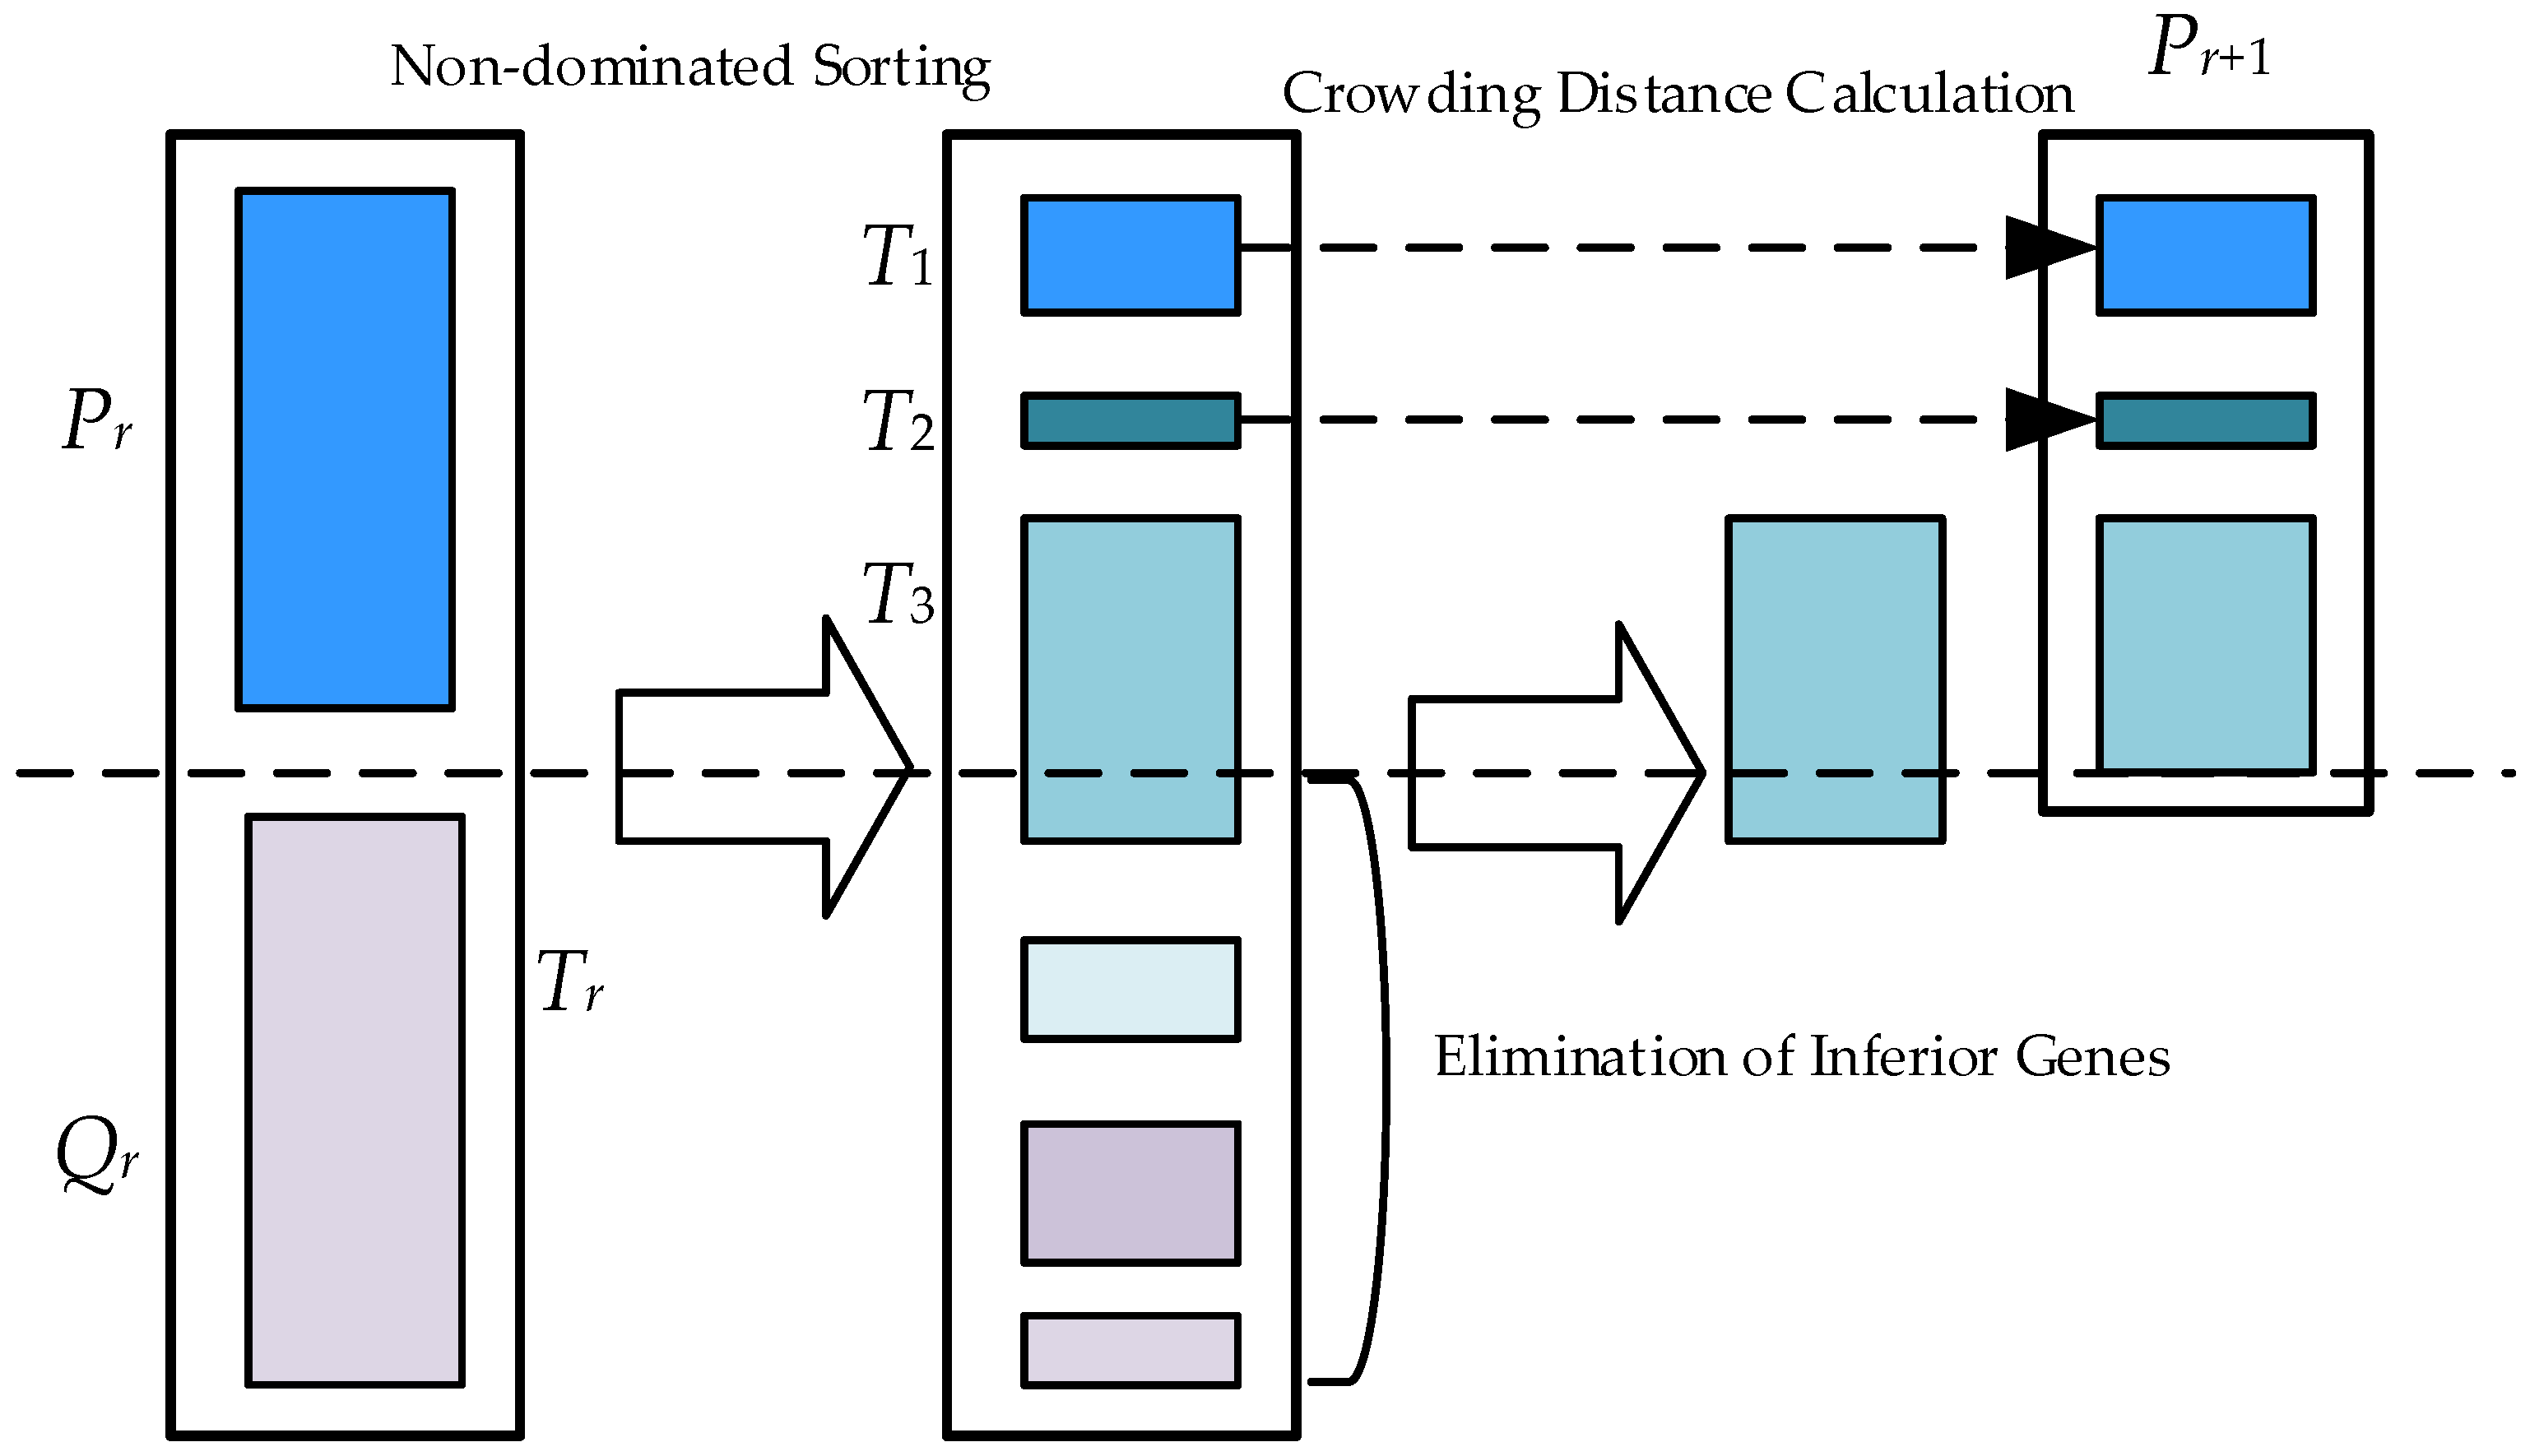
The NSGA-II [19] is recognized as one of the most extensively utilized multi-objective optimization algorithms. The workflow of this algorithm is illustrated in Figure 7.
Figure 7.
Flowchart of NSGA-II.
In the standard NSGA-II [20,21], individuals are randomly generated within the designated range during population initialization. This stochastic approach often results in an uneven spatial distribution of the population, thereby posing a risk of overlooking spatial regions that contain the optimal solution. To address this limitation, the concept of the Good Point Set (GPS) is introduced to generate the initial population [22]. Assuming Gn represents an n-dimensional Euclidean space and x ∈ Gn, the Good Point Set can be defined as:
where Pn(m) represents the Good Point Set; λ denotes the good point, which can be expressed as λi = {2cos (2πi/p)}; p is the smallest prime number satisfying p ≥ 2n + 3; constitutes the feasible region; and dj and hj correspond to the lower and upper bounds of the dimension, respectively.
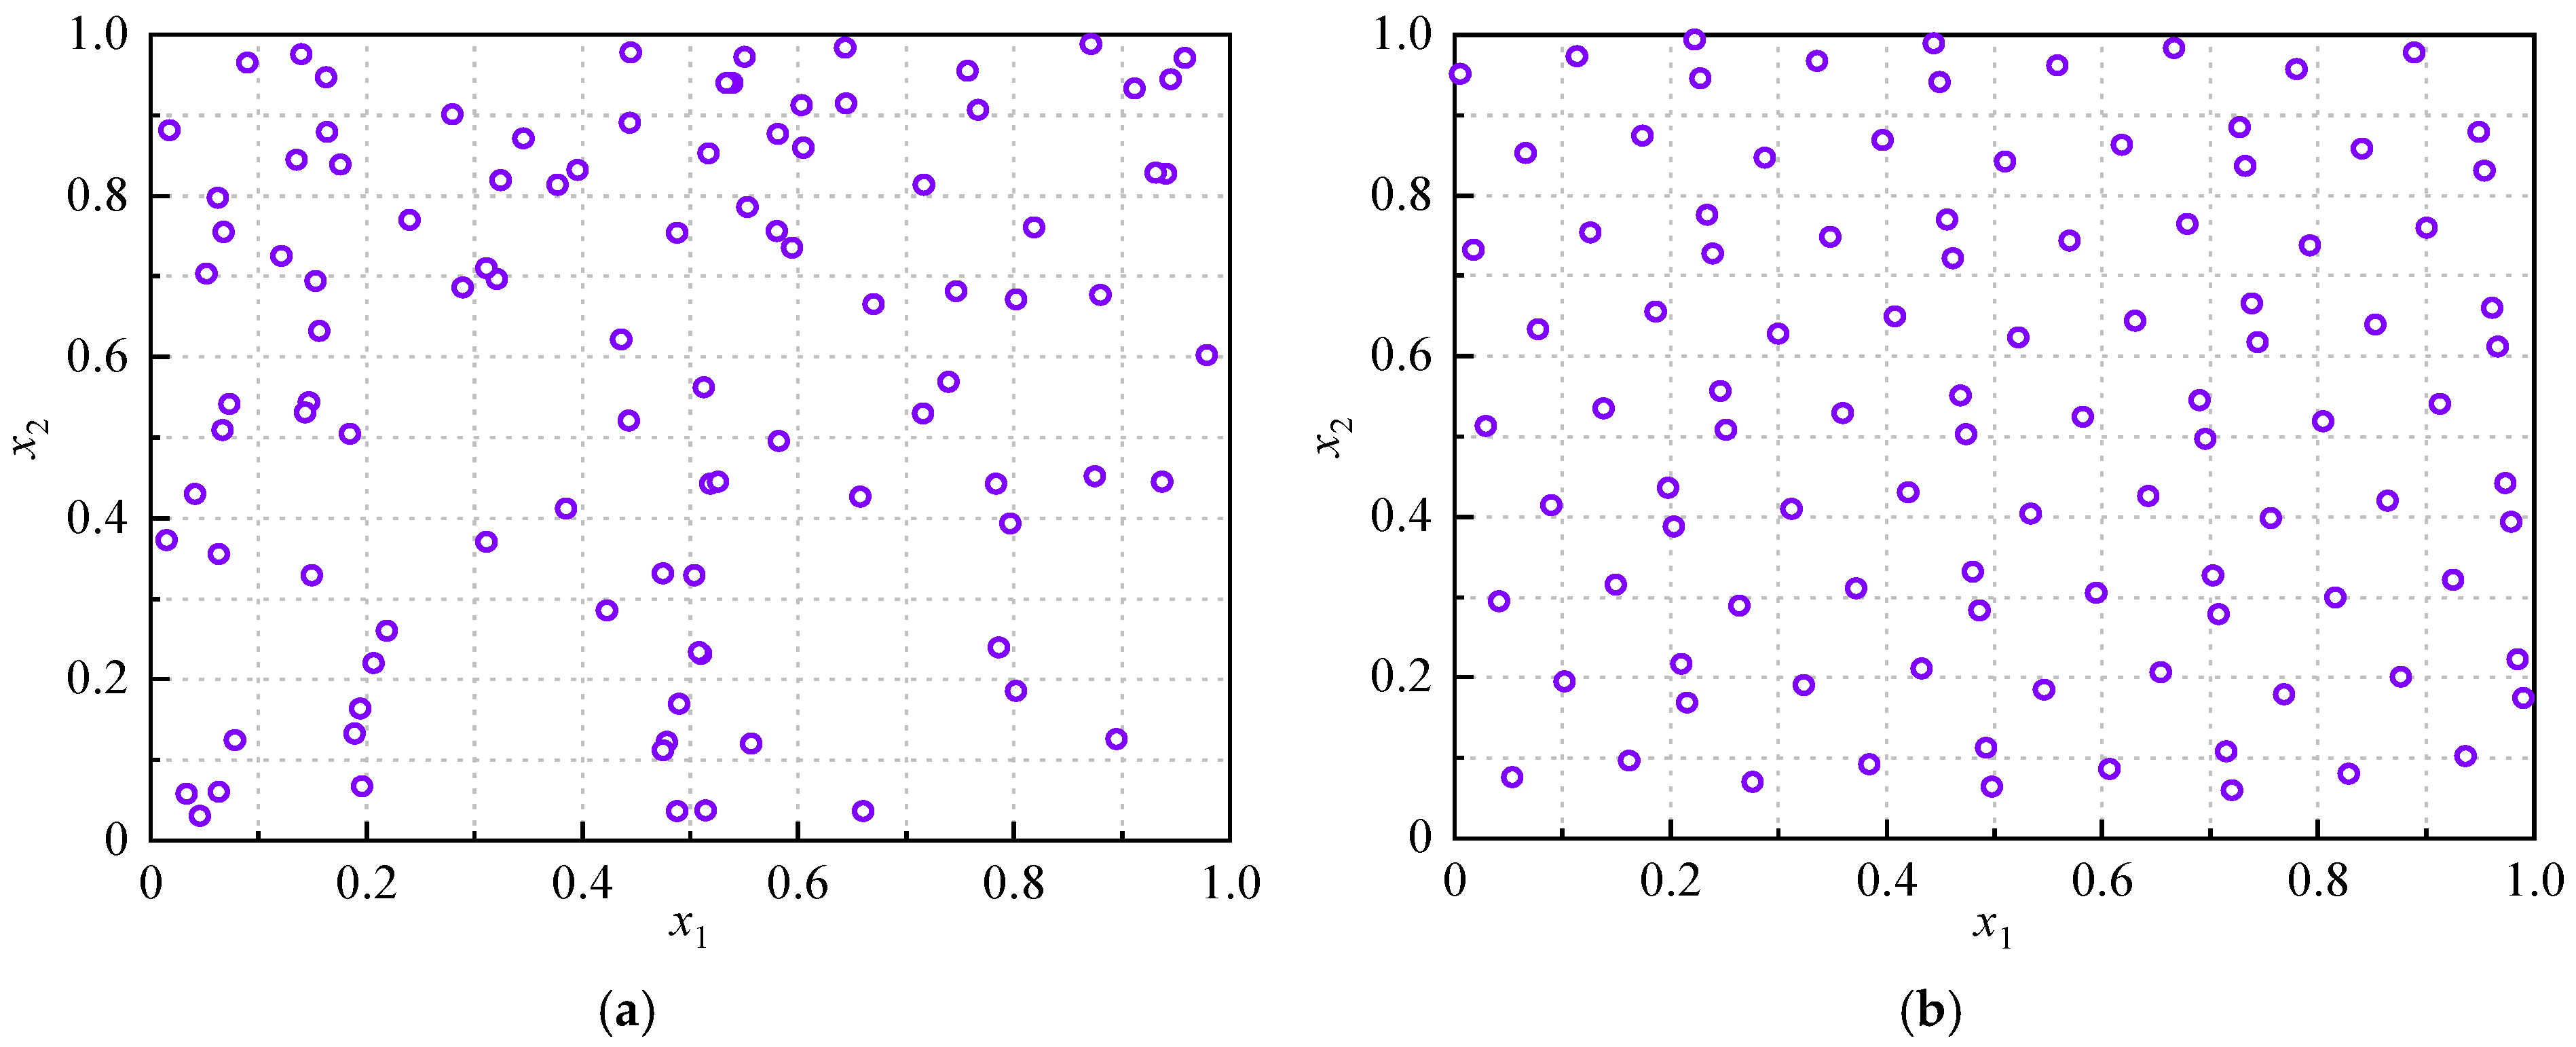
When the initial population size is set to 100, the distribution of the randomly generated population is compared with that generated by the Good Point Set method, as illustrated in Figure 8. It is evident that the random distribution in the two-dimensional space is non-uniform, creating a risk of missing the optimal solution during optimization and hindering the assurance of global search capabilities in the algorithm’s preliminary stages. In contrast, the population derived from the Good Point Set concept exhibits a more uniform distribution within the region. Consequently, population initialization based on this approach yields superior performance, thereby facilitating global optimization during the initial phase of the algorithm.
Figure 8.
Initial populations generated by different methods: (a) Random generation; (b) Good Point Set generation.
Furthermore, traditional genetic algorithms typically employ polynomial mutation algorithms, in which the value of the mutation operator remains independent of the iteration number t. To facilitate global exploration during the preliminary stages of the algorithm while enhancing local exploitation in the subsequent stages, a non-uniform mutation operator may be adopted.
Assuming the individual subject to non-uniform mutation is denoted as b = (b1, b2,⋯, bn), and bj represents the j-th component undergoing mutation, the new individual bji generated via mutation can be expressed as:
where Uh and Ul denote the upper and lower bounds of the individual’s value, respectively; s represents a random value selected from the range 0~1, the magnitude of which determines the direction of mutation; and ∆(t, u) can be expressed as:
where r represents a random variable within the range [0, 1]; T denotes the maximum number of iterations; and f is a system parameter governing the degree of non-uniformity, typically selected within the range of 1 to 5. When this value is appropriately chosen, the algorithm effectively balances global exploration during the early stages with local exploitation in the later stages.
4. Verification of Optimization Strategy
4.1. Verification of Key Technologies
4.1.1. Results of Global Sensitivity Analysis
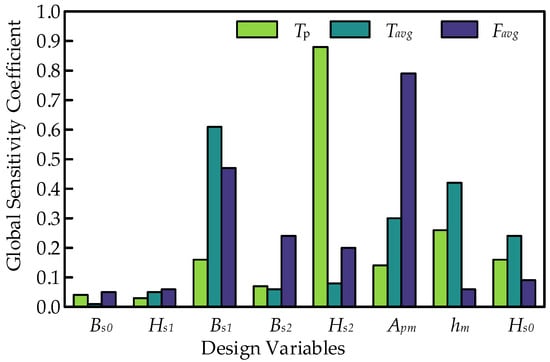
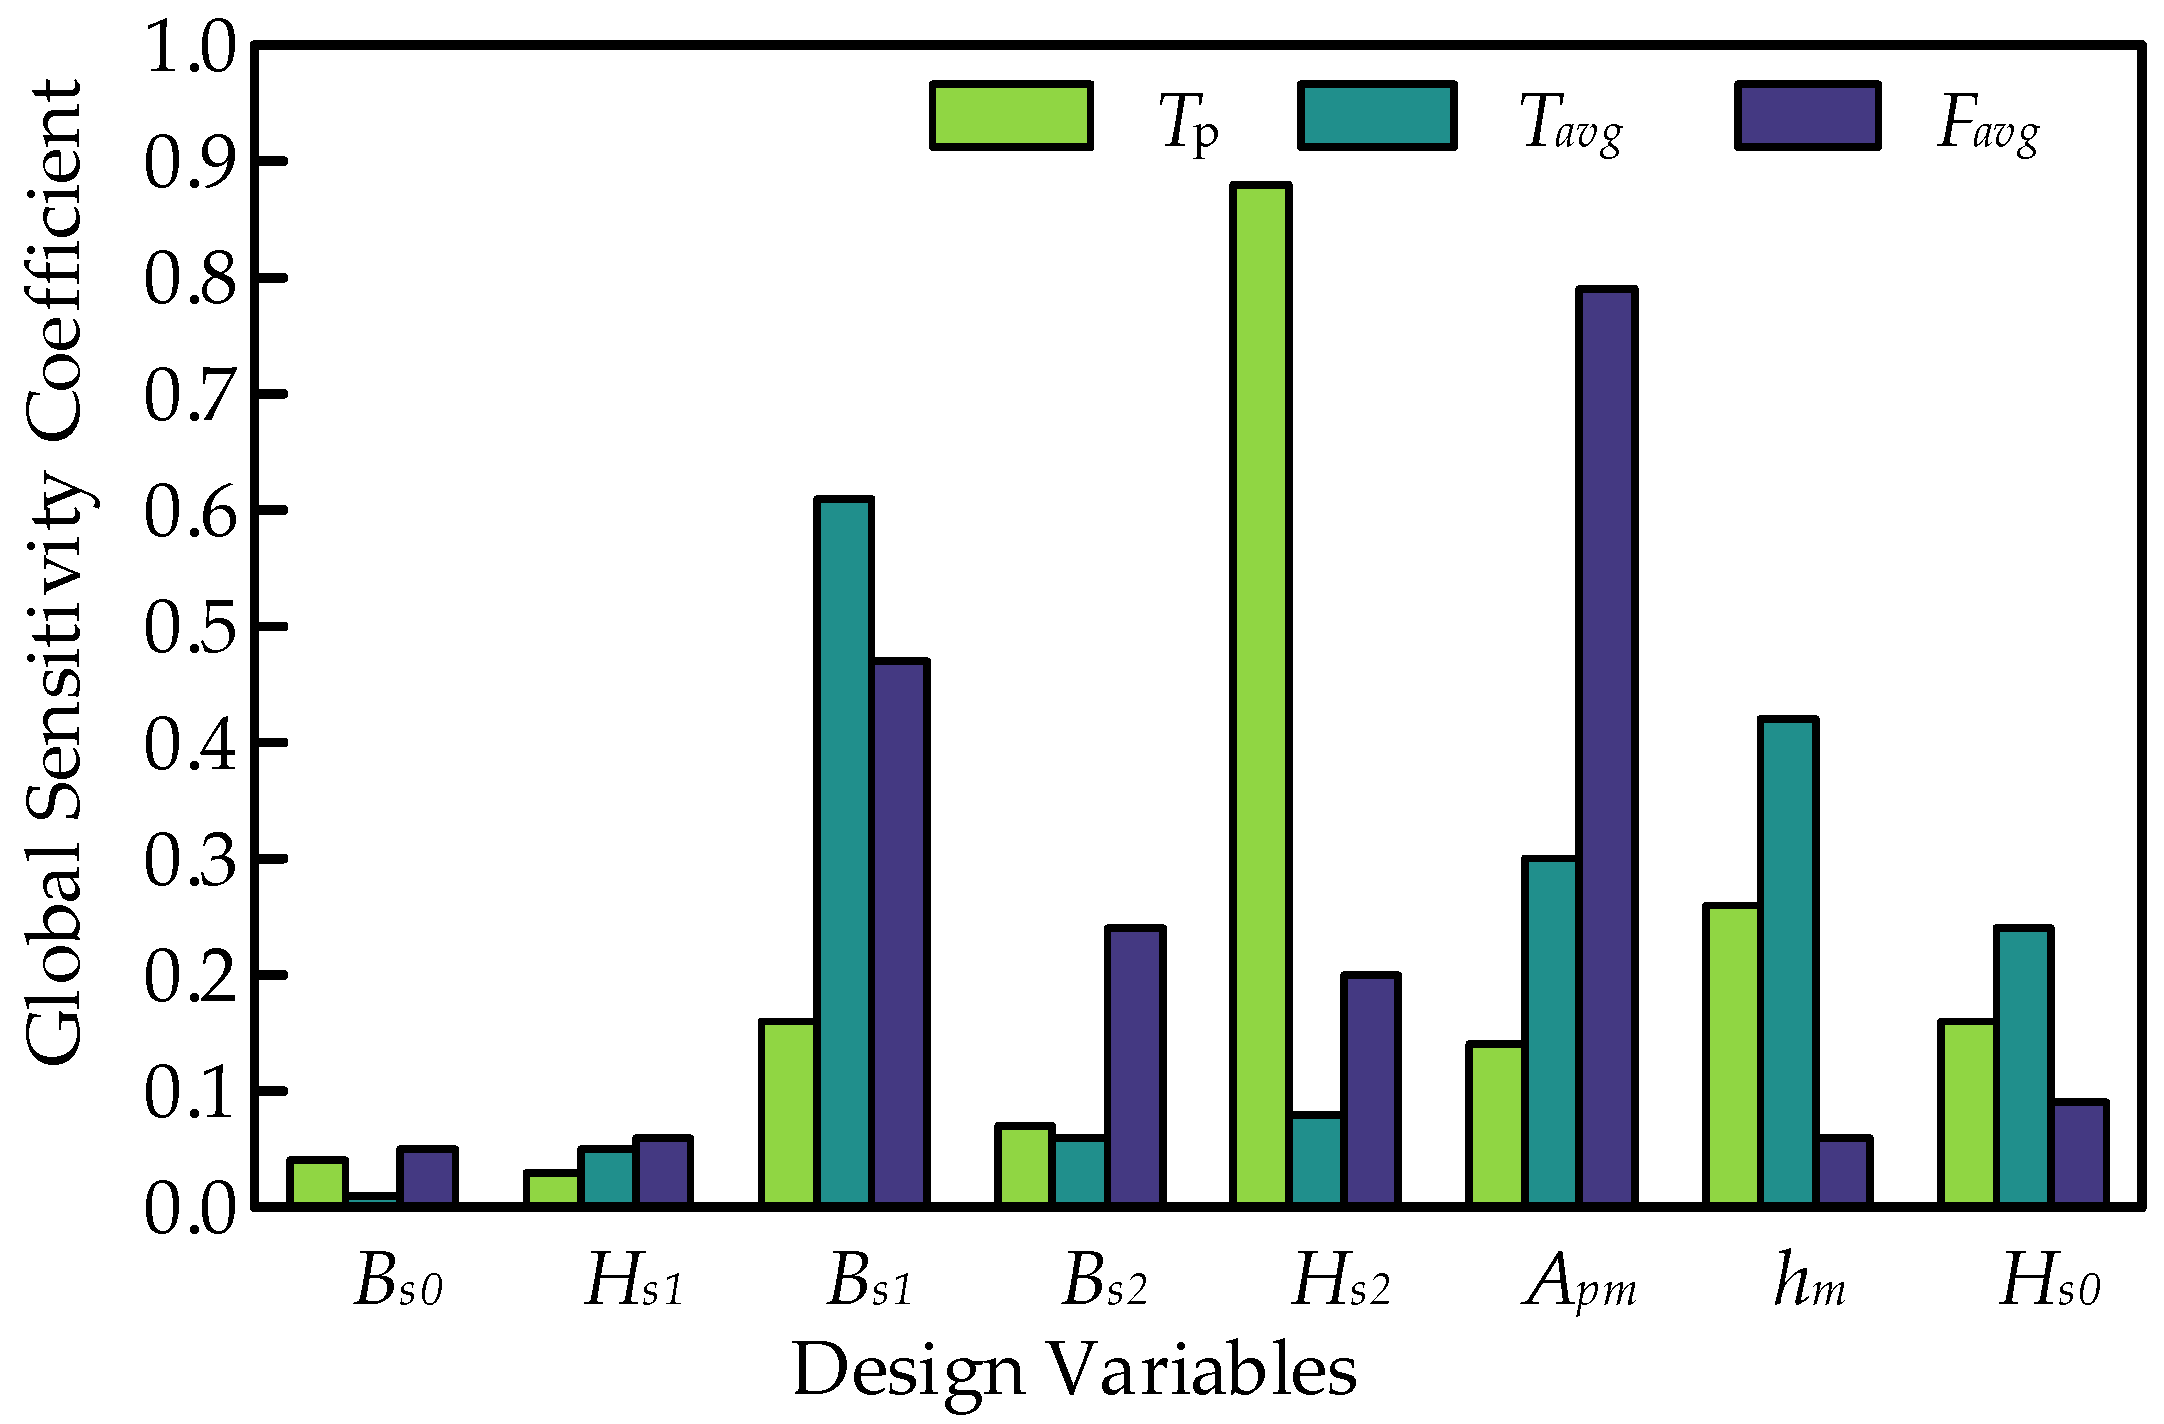
Based on the design parameters listed in Table 1, sequential sampling was conducted to derive the total sensitivity indices for each parameter. The total sensitivity indices for both the torque and suspension systems are presented in Figure 9. Global sensitivity variables are defined as those with sensitivity coefficients exceeding the threshold value of 0.1. The detailed classification of the sensitive variables involved in the optimization is outlined in Table 3.
Figure 9.
Sensitivity characteristics of structural parameters.
Table 3.
Sensitivity types of structural parameters.
As observed in Figure 9, Bs1 and Apm exhibit high sensitivity indices across all optimization objectives. Consequently, during the optimization process, these two parameters must be jointly included, taking into account both torque and suspension system performances. Therefore, this group of parameters is categorized as dual-system sensitive parameters. Regarding hm and Hs0, their sensitivity indices are significant specifically for the torque system.
Thus, while they are included in the optimization, only torque performance needs to be considered. Accordingly, these variables are classified as single-torque sensitive parameters. Similarly, Bs2 and Hs2 are categorized as single-suspension sensitive parameters. Conversely, the sensitivity indices of Bs0 and Hs1 with respect to the optimization objectives are negligible. Consequently, they are excluded from the optimization design, and their values are determined via the single-parameter scanning method.
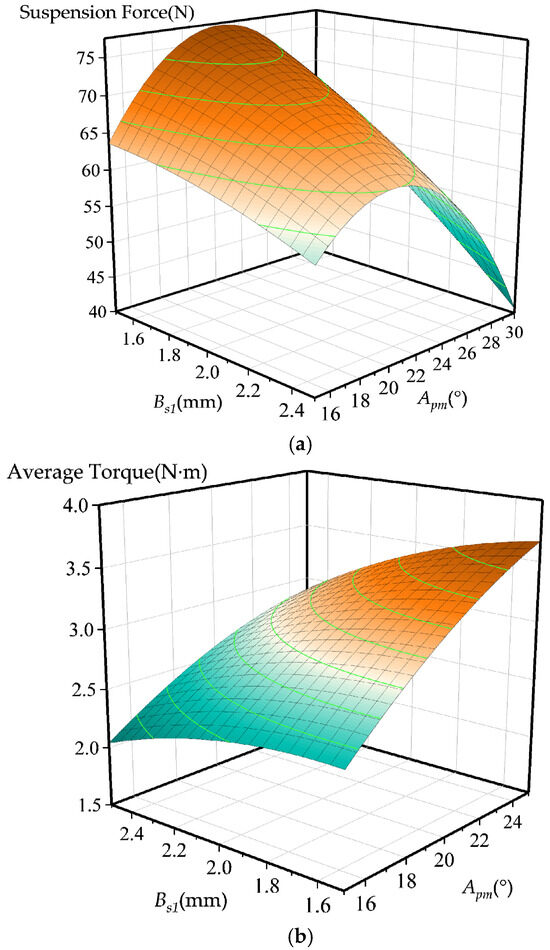
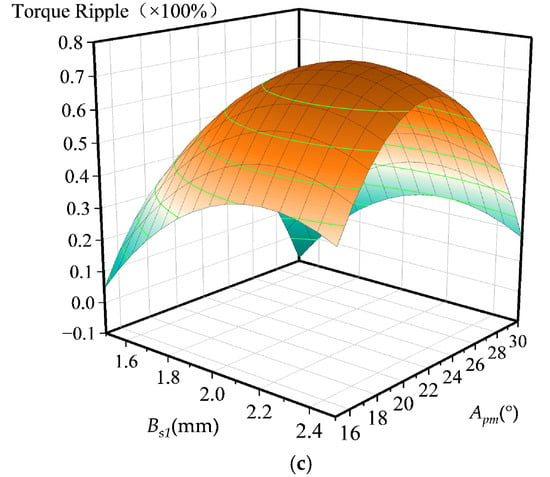
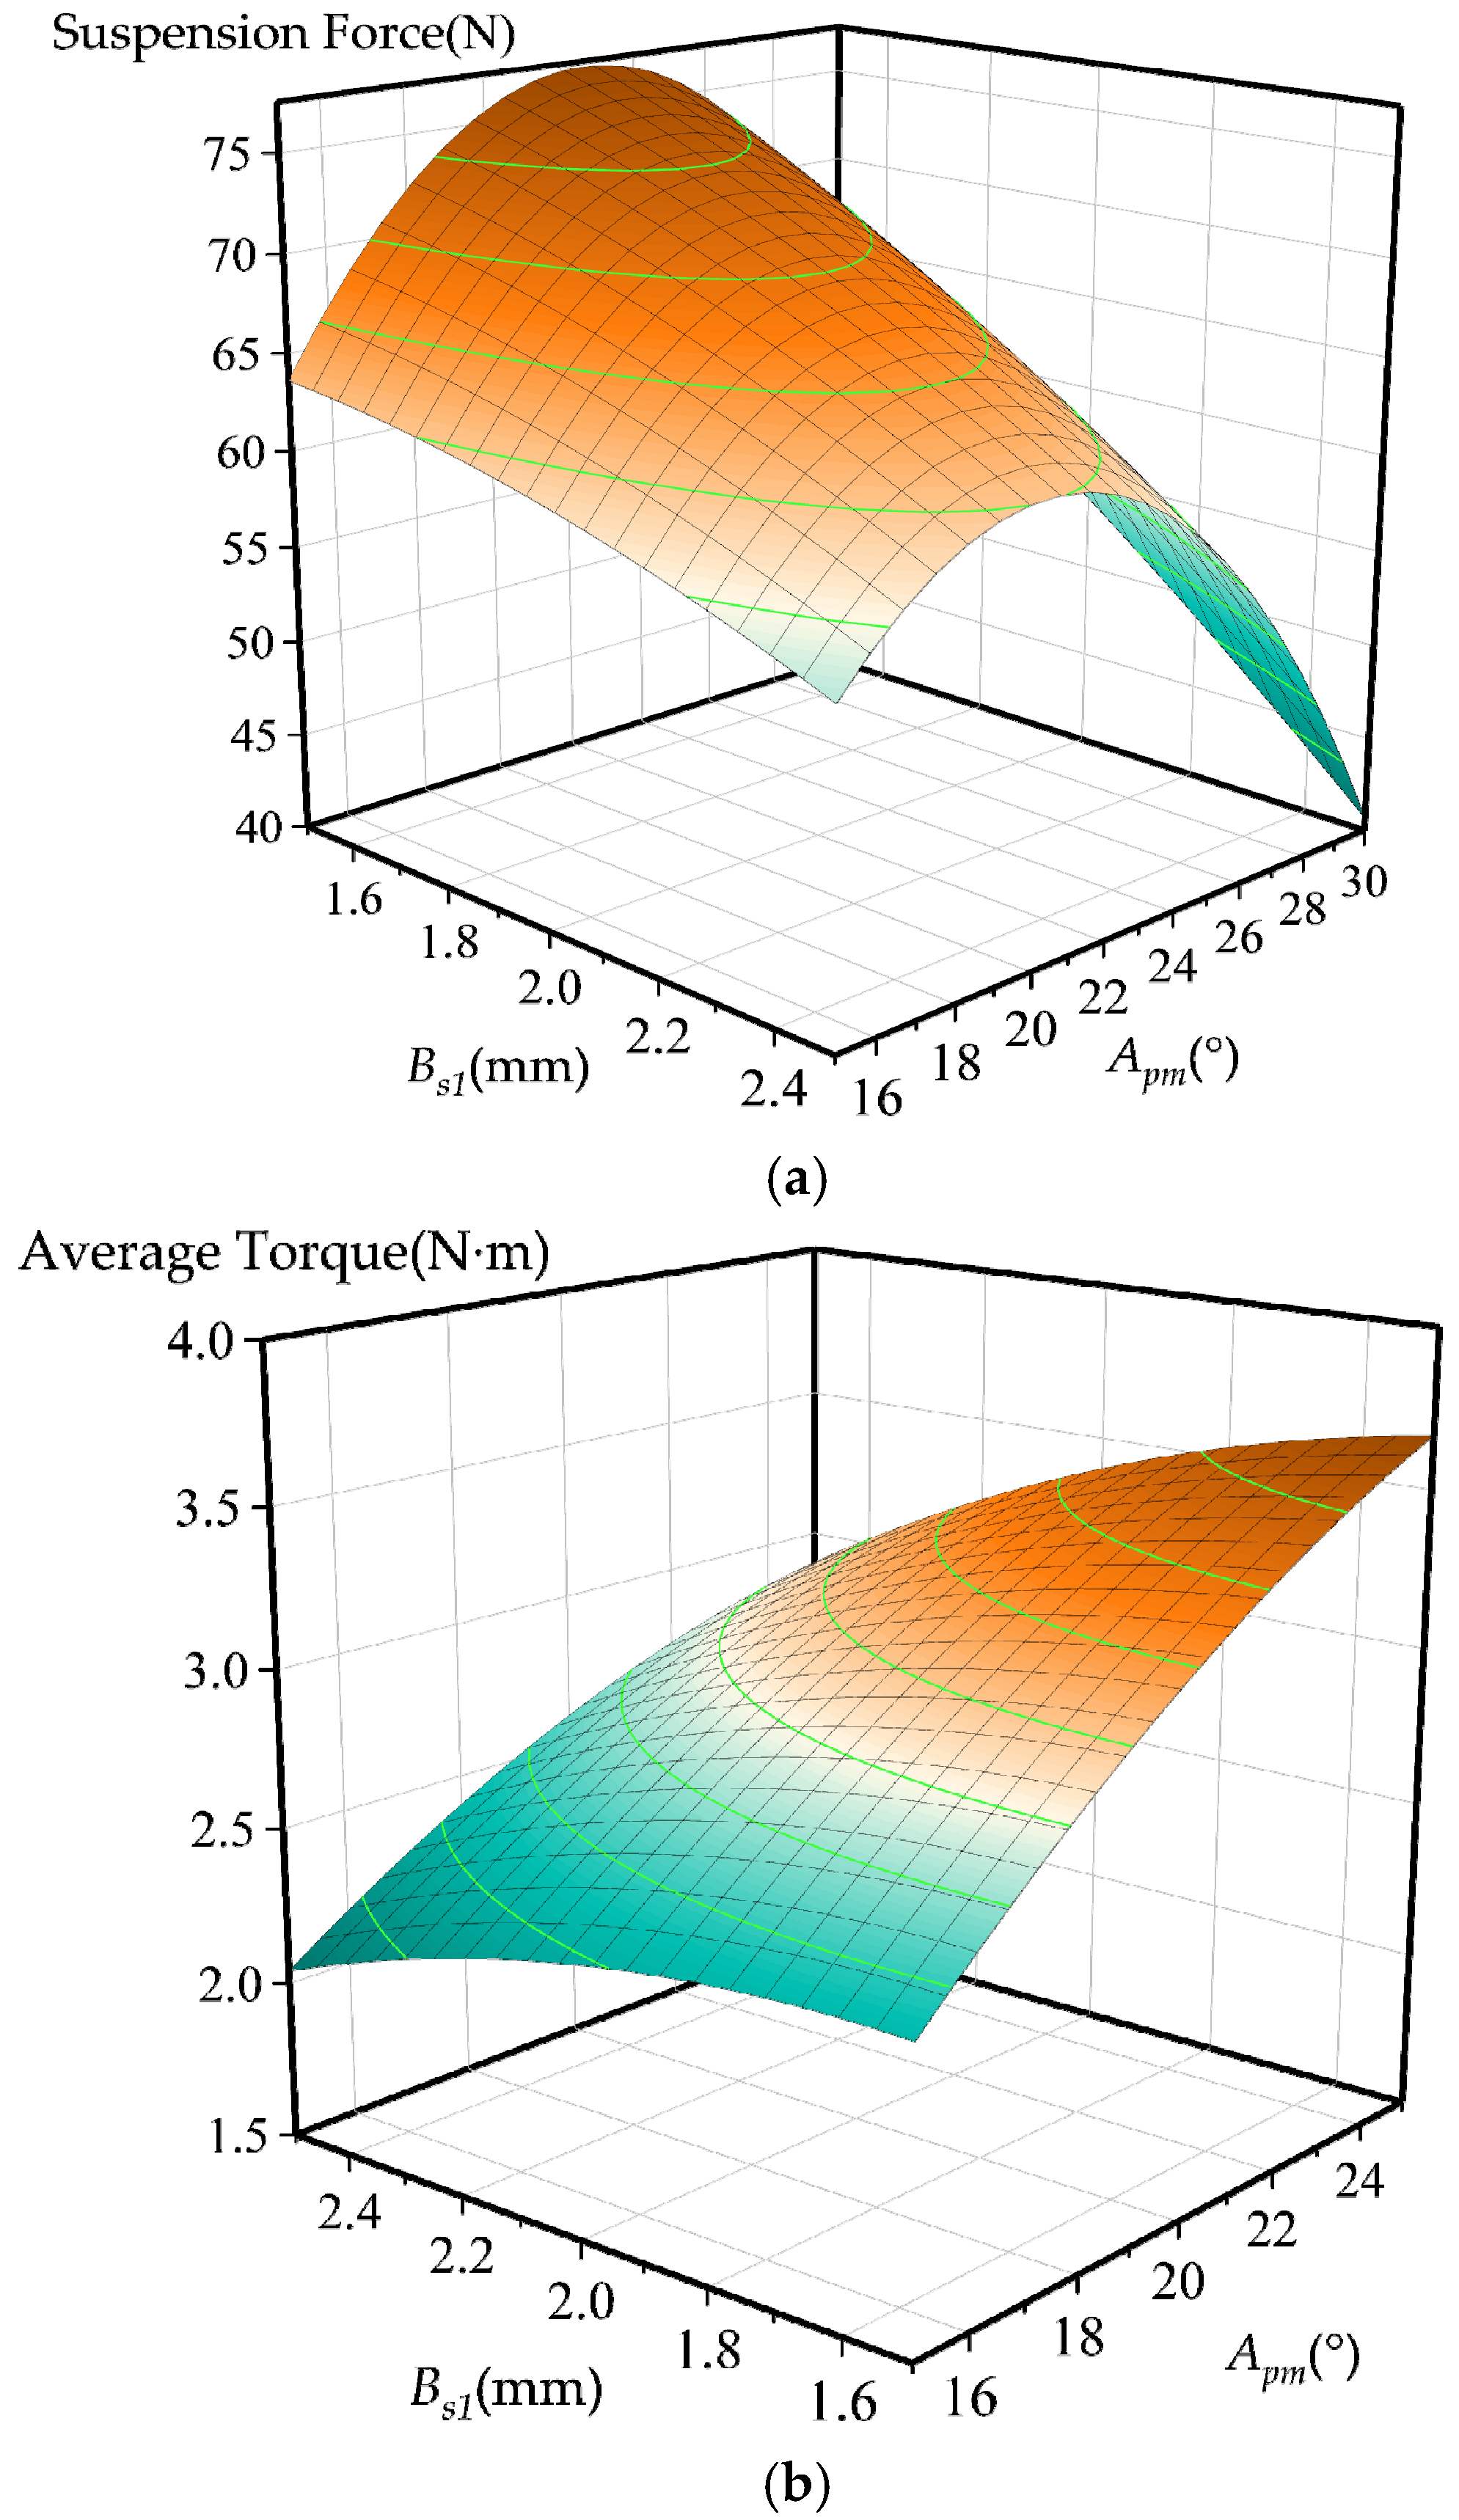
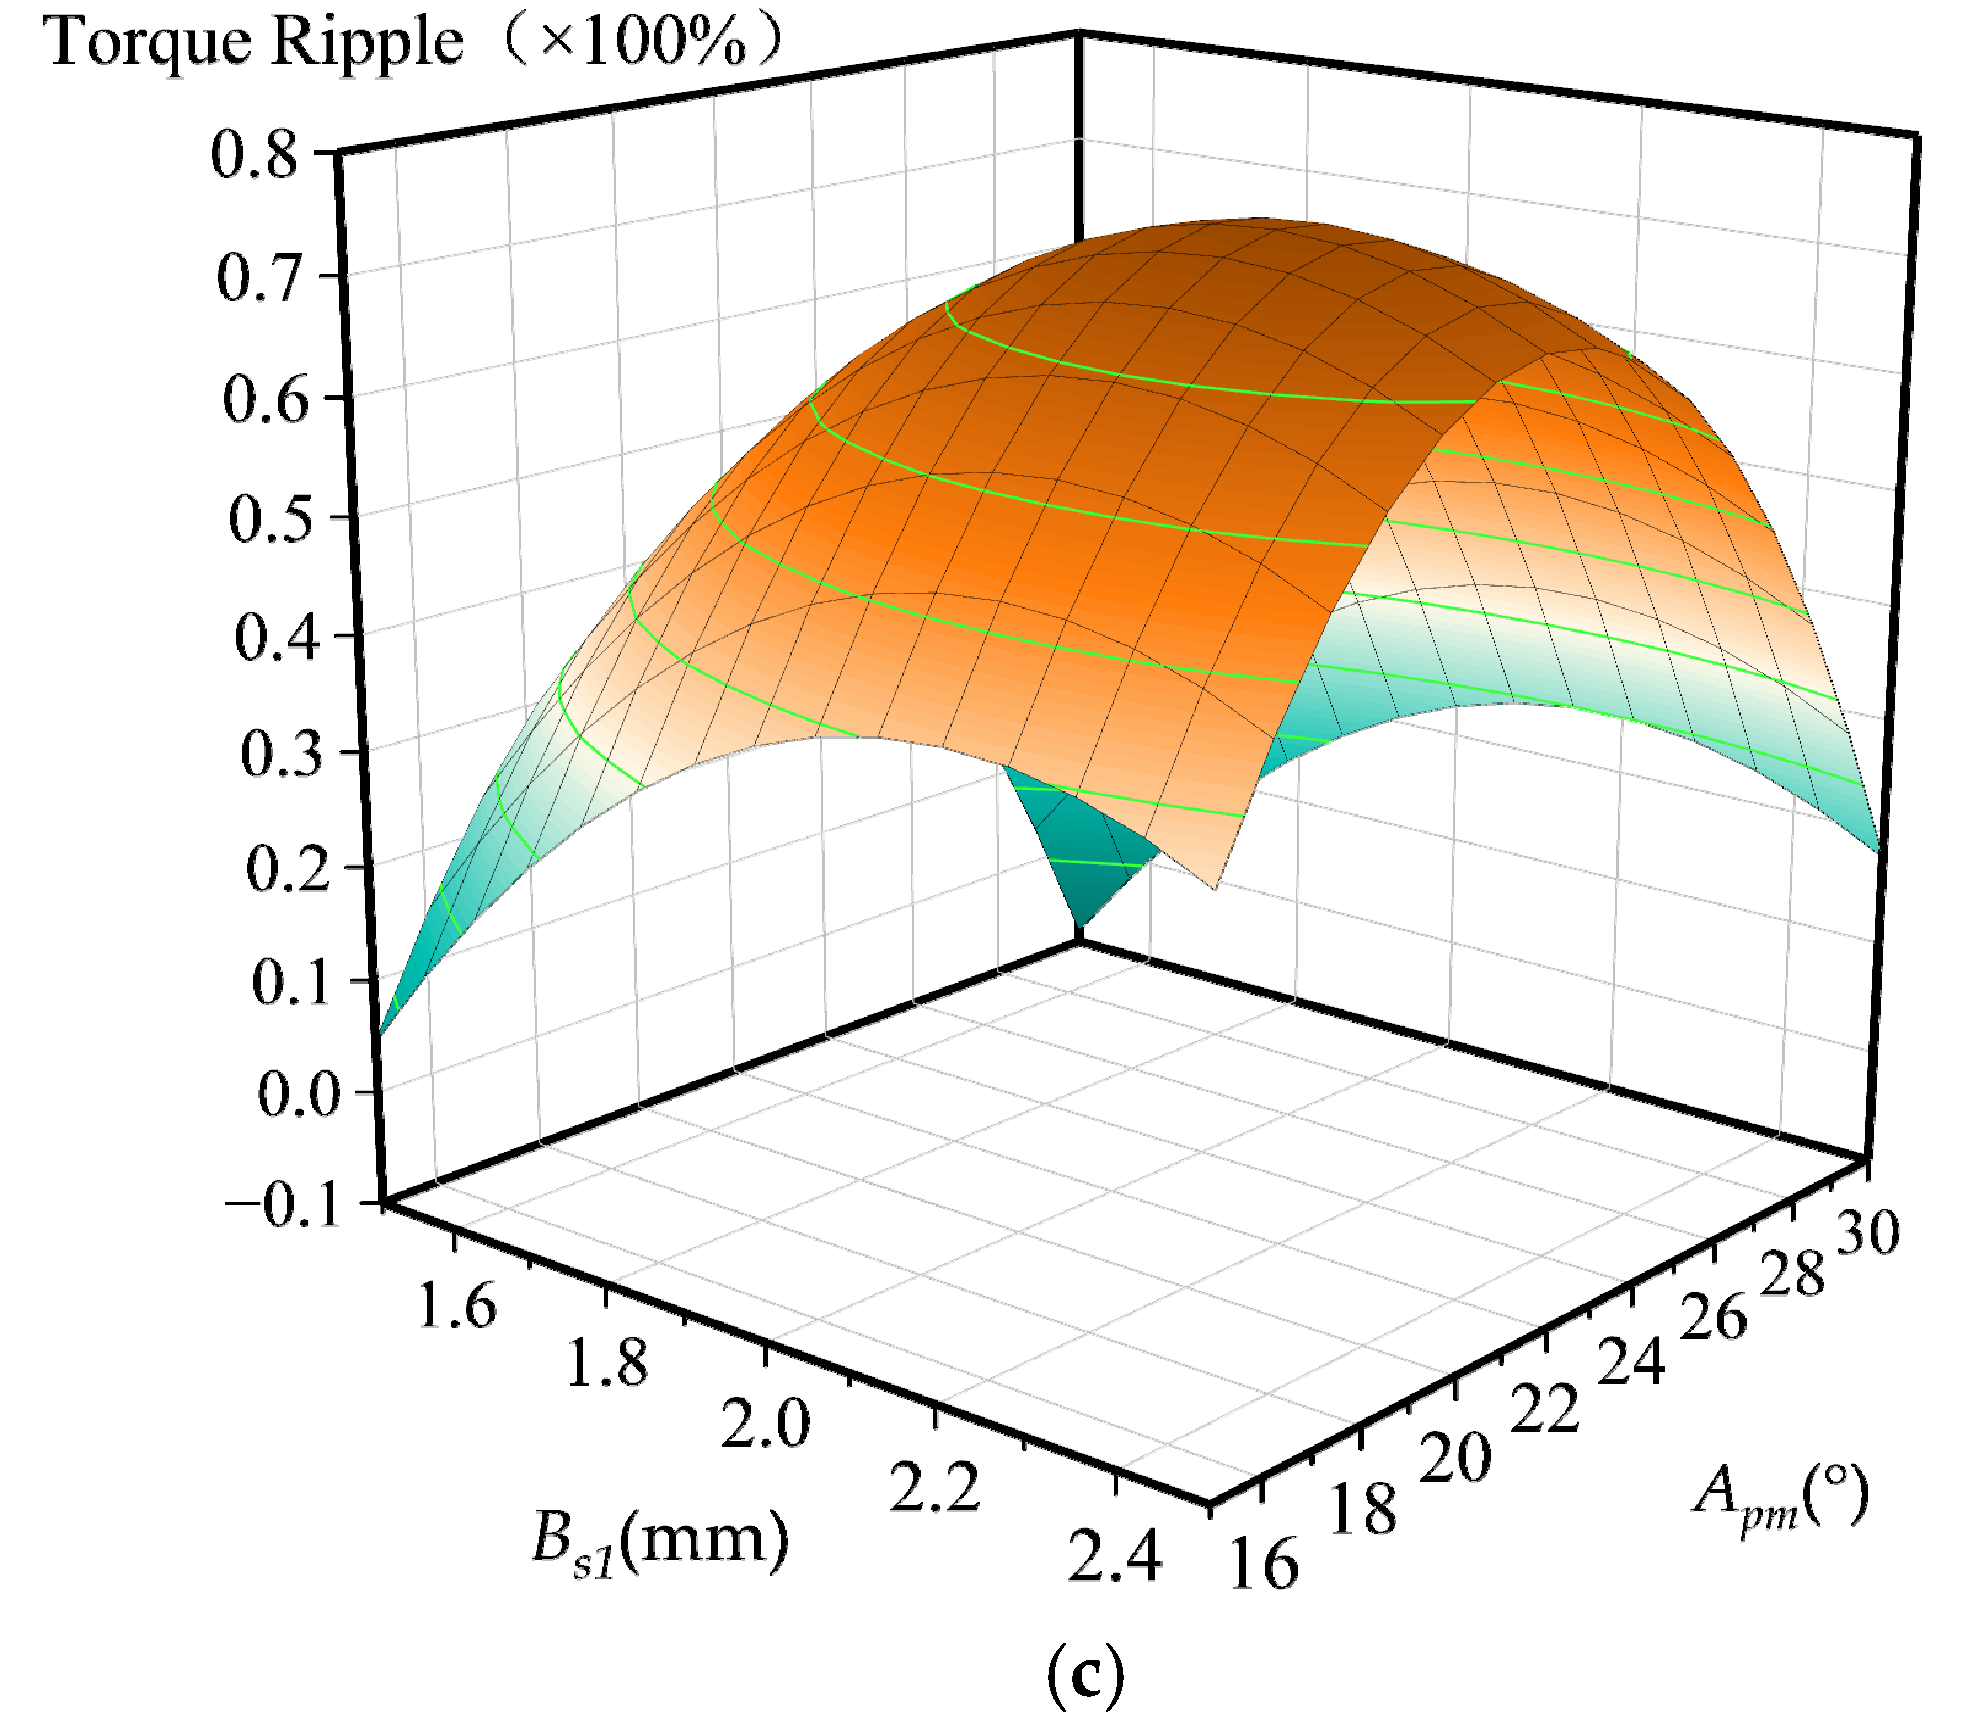
Figure 10 illustrates the relationship curves between the optimization objectives and the coupled sensitive variables. It is evident that as the various design variables vary within their respective value ranges, the optimization objectives exhibit strong non-linearity and complex variations. This complexity renders the unified optimization of the dual systems difficult. Consequently, it is necessary to implement a dual-system interactive optimization strategy to enhance the overall performance of the motor.
Figure 10.
Relationship between optimization objectives and coupled sensitive variables. (a) Favg vs. Bs1, Apm. (b) Tavg vs. Bs1, Apm. (c) TP vs. Bs1, Apm.
4.1.2. Surrogate Model Construction Results
The single-objective optimization of the suspension system targets the enhancement of the average output suspension force, utilizing a quadratic polynomial RSM to construct a surrogate model bridging design variables and response quantities. Initially, design points are sampled via the Optimal LHS method. Subsequently, the response quantities of these sampled points are calculated using finite element simulation software. The resulting fitted expression for the quadratic response surface surrogate model of the suspension system is presented in Equation (14).
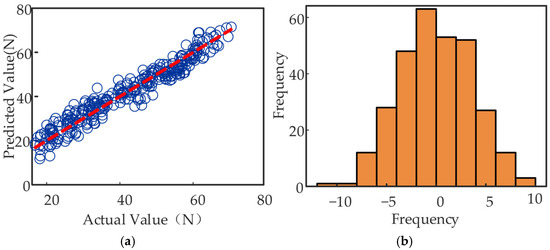
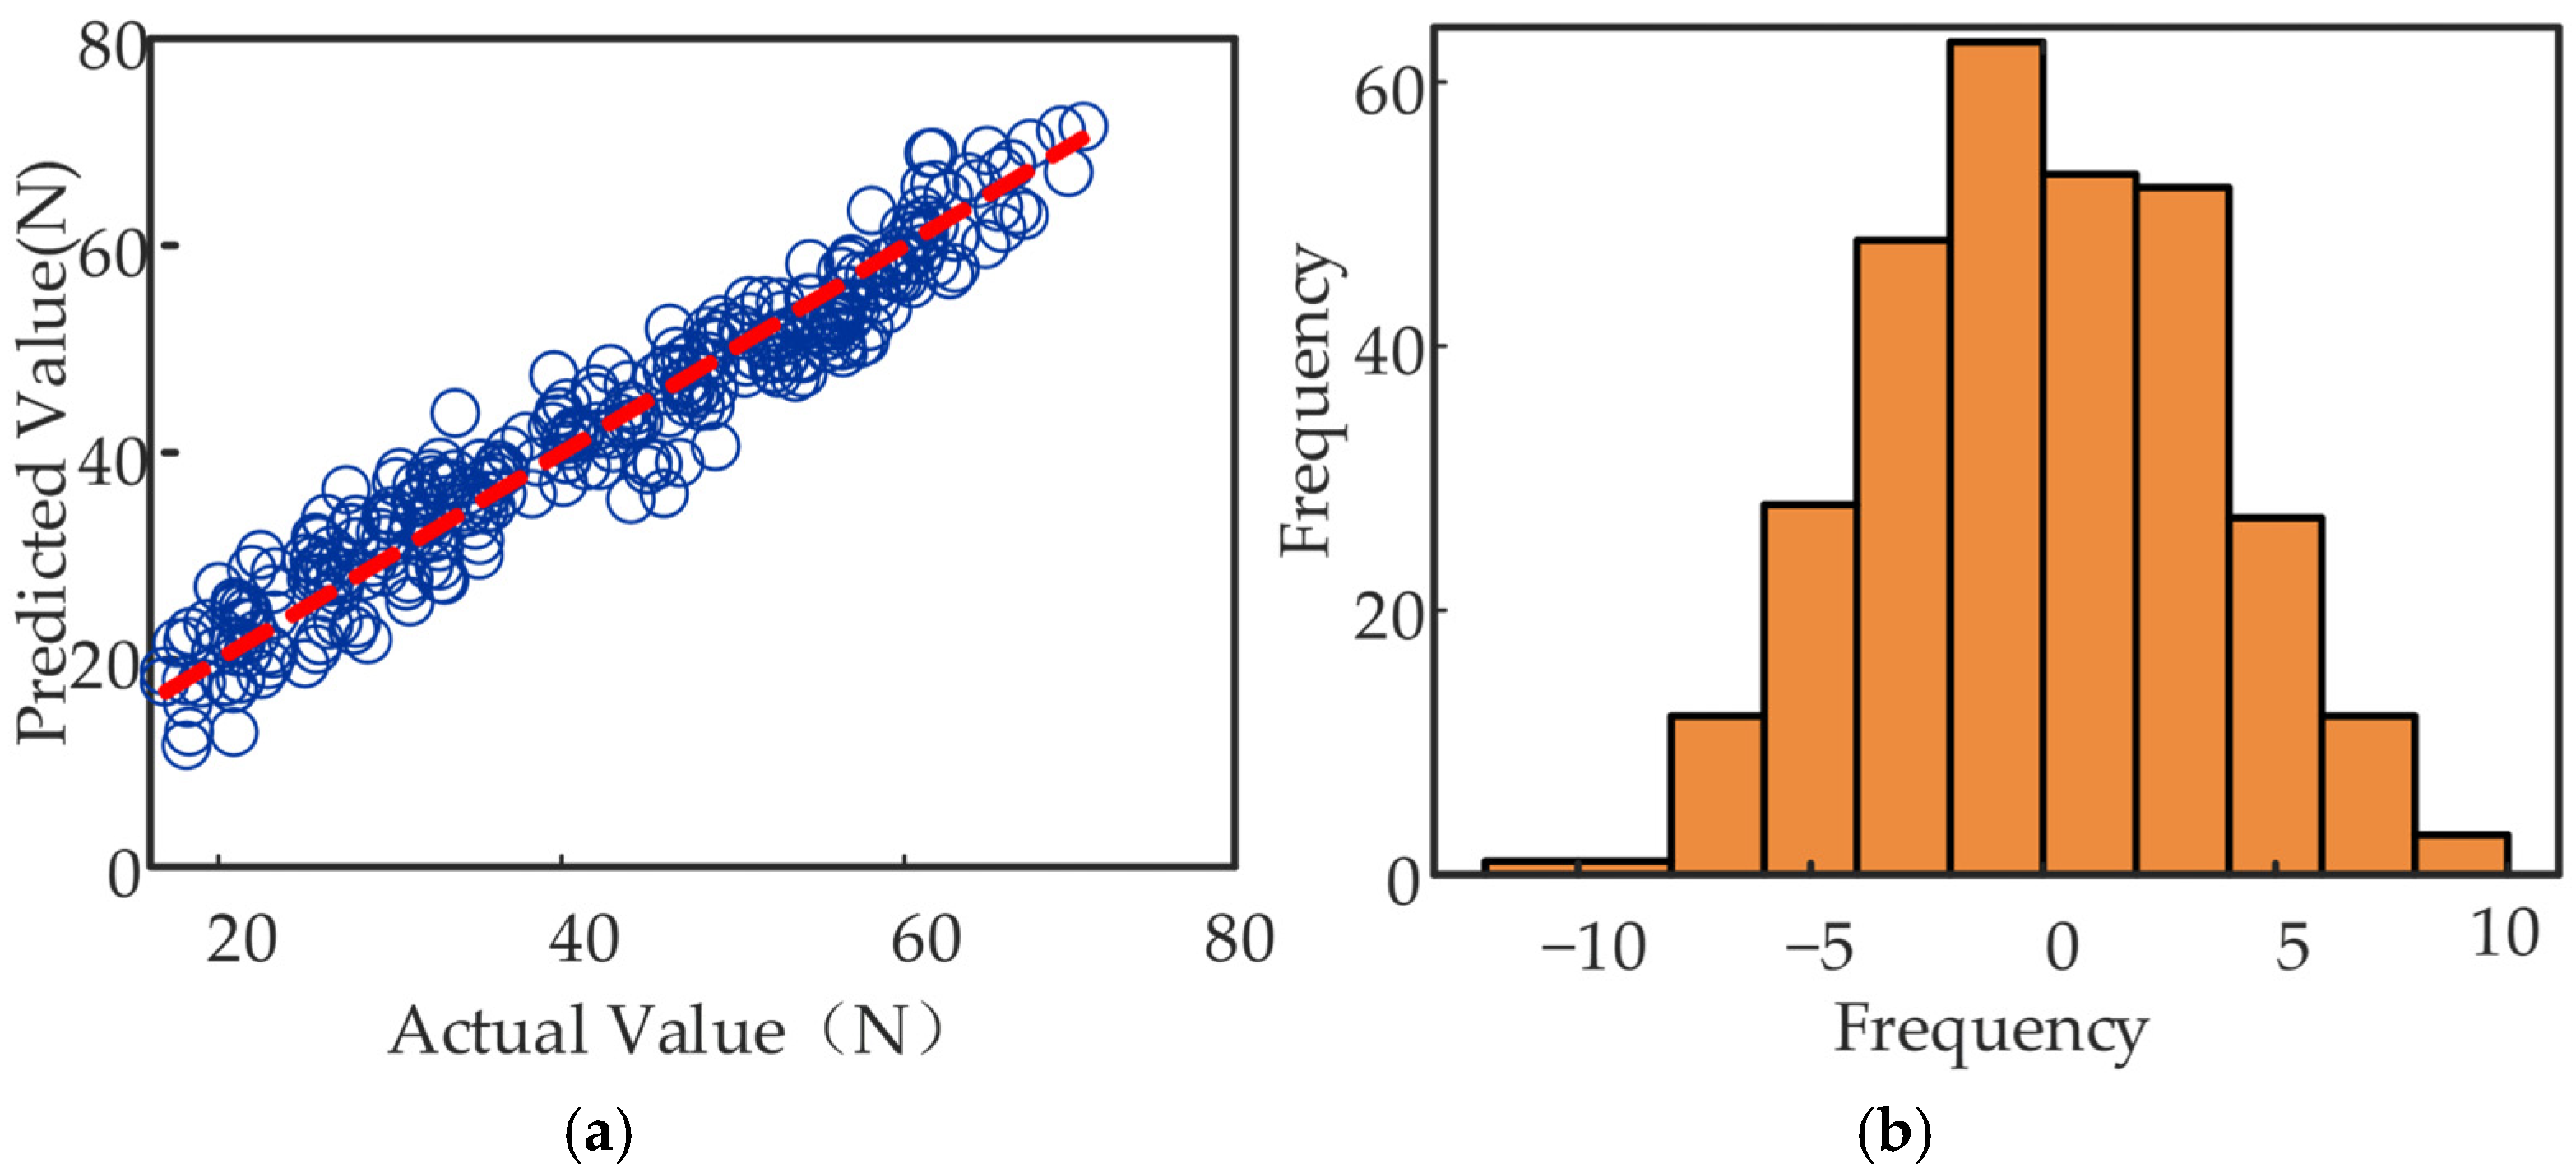
To visually evaluate the accuracy and reliability of the constructed model, a series of accuracy metrics were subjected to visual analysis. Figure 11 displays the relevant visualization results. Figure 11a depicts the relationship between the actual and predicted values; it can be observed that the majority of points are uniformly distributed around the reference line, demonstrating that the model effectively captures the true trend of the data. Figure 11b presents the histogram of residuals, where the residuals exhibit a morphology close to a normal distribution and are primarily concentrated near zero. The frequency distribution across intervals is relatively uniform without significant skewness, indicating that the model’s predictive results are stable overall.
Figure 11.
Visualization of the suspension system surrogate model accuracy. (a) Actual and predicted values. (b) Histogram of residuals.
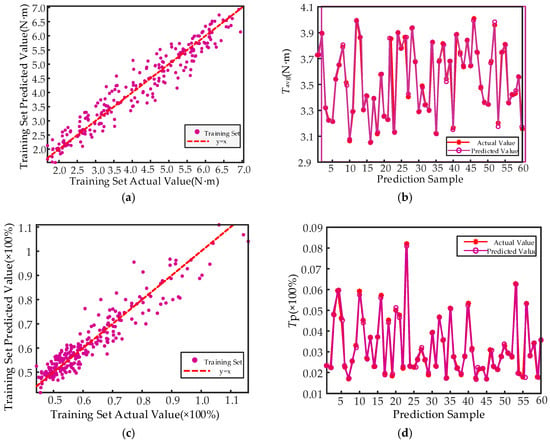
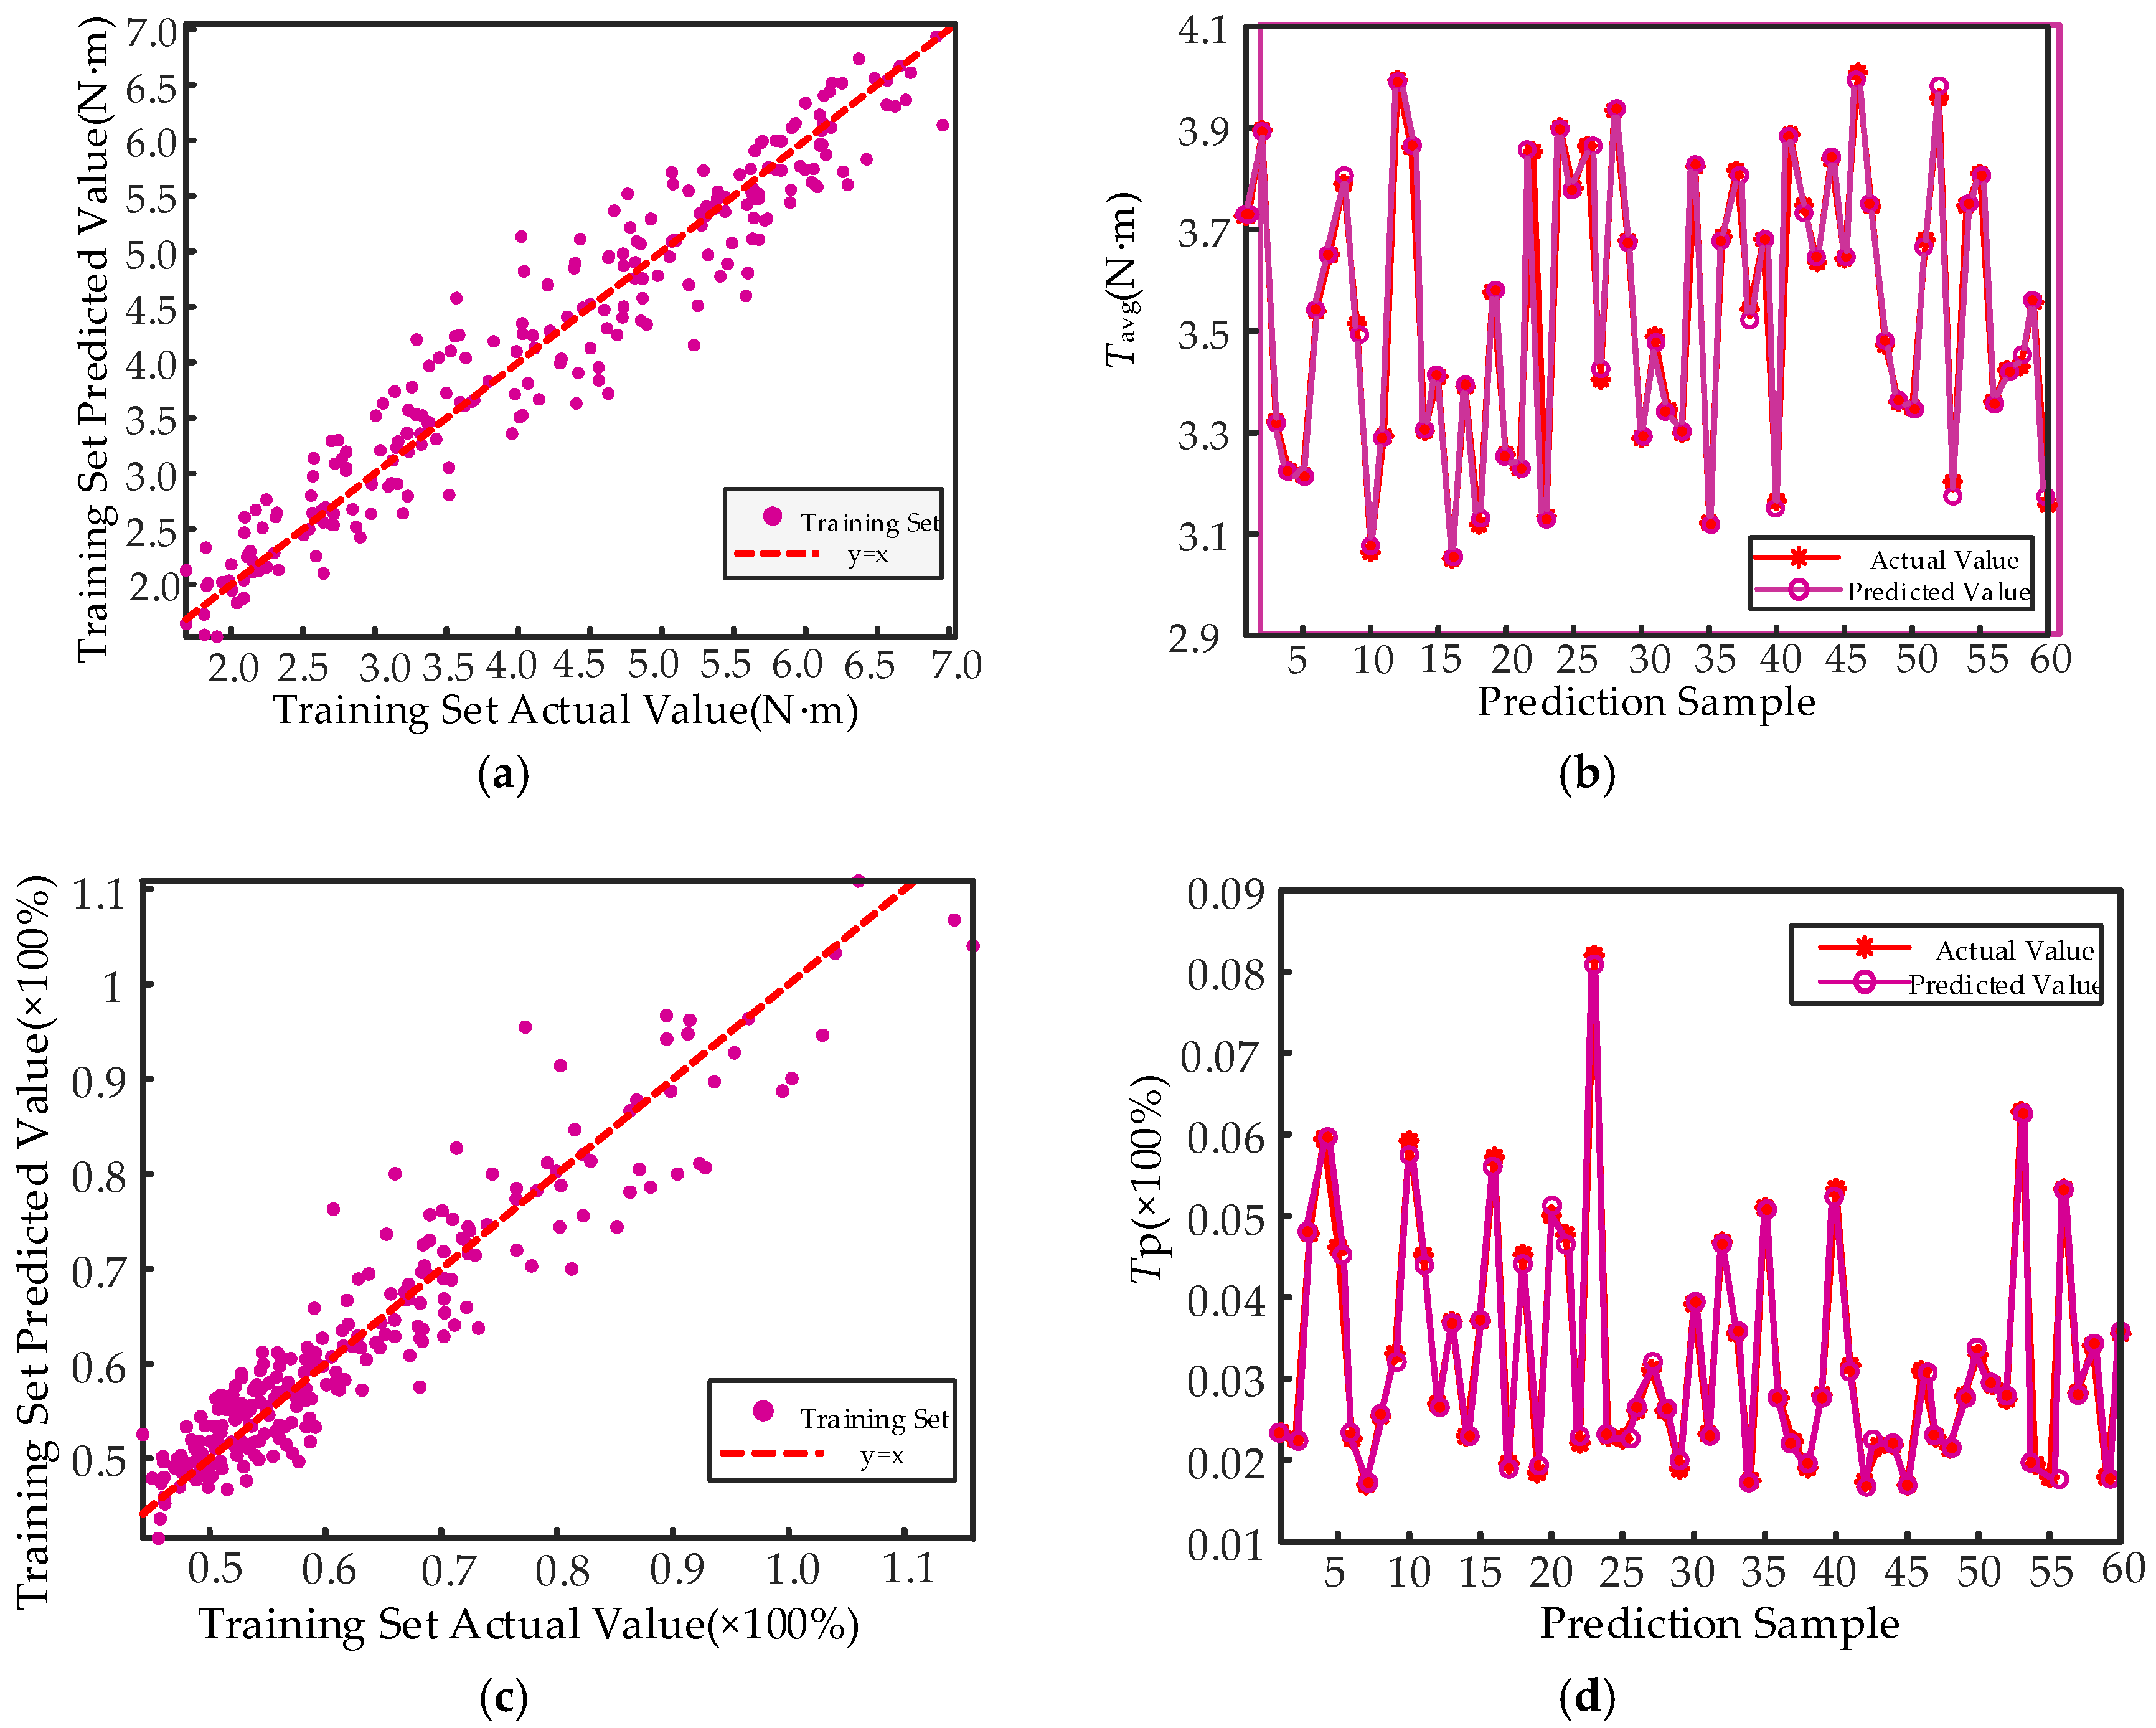
During the construction of the surrogate model for the torque system, training with input-output data enables the BP neural network surrogate model to effectively capture the system’s dynamic characteristics, thereby achieving accurate predictions of the output torque. The comparison between the BP neural network surrogate model and the actual test results is illustrated in the figure.
Figure 12a depicts the scatter plot representing the predictive performance for the average output torque, Tavg. The relationship between the predicted and actual values exhibits a strong linear correlation, indicating effective data learning by the model during the training process. Figure 12b compares the predicted results against the actual values for the test set samples. The red line represents the actual values, while the pink line denotes the predicted values generated by the BP neural network model. Across each test set sample, the model successfully tracks the trend of the actual torque output, demonstrating its robust generalization capability regarding unseen data. Similarly, Figure 12c,d display the predictive performance for the output torque ripple, Tp. The structure of these scatter plots resembles that of Tavg, further verifying the reliability of the BP neural network model in torque prediction. The comparison plots between predicted results and actual values demonstrate consistency and stability across different samples.
Figure 12.
Visualization of torque surrogate model accuracy. (a) Tavg Fitting Performance on Training Set. (b) Tavg Fitting Performance on Test Set. (c) Tp Fitting Performance on Training Set. (d) Tp Fitting Performance on Test Set.
4.1.3. Optimization Strategy Results
For the preliminary optimization of the suspension system, Design-Expert 13.0 software was utilized to conduct a response surface analysis on the torque density. Subsequently, a 2FI model was employed to fit the surrogate model for torque density, as presented in Equation (14). Based on the analysis results of the response surface methodology, the values for the single-suspension system sensitive variables were determined, as listed in Table 4.
Table 4.
Single Suspension System Sensitivity Variable Coarse Optimization Value.
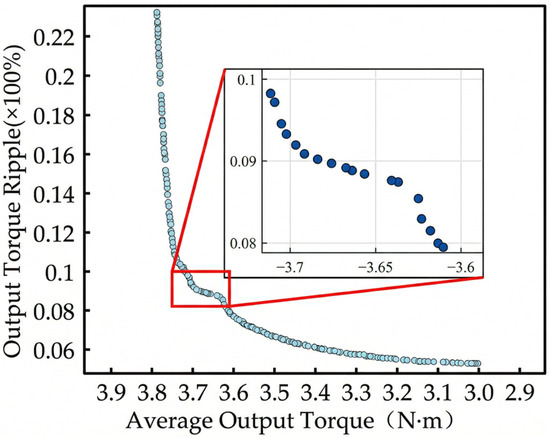
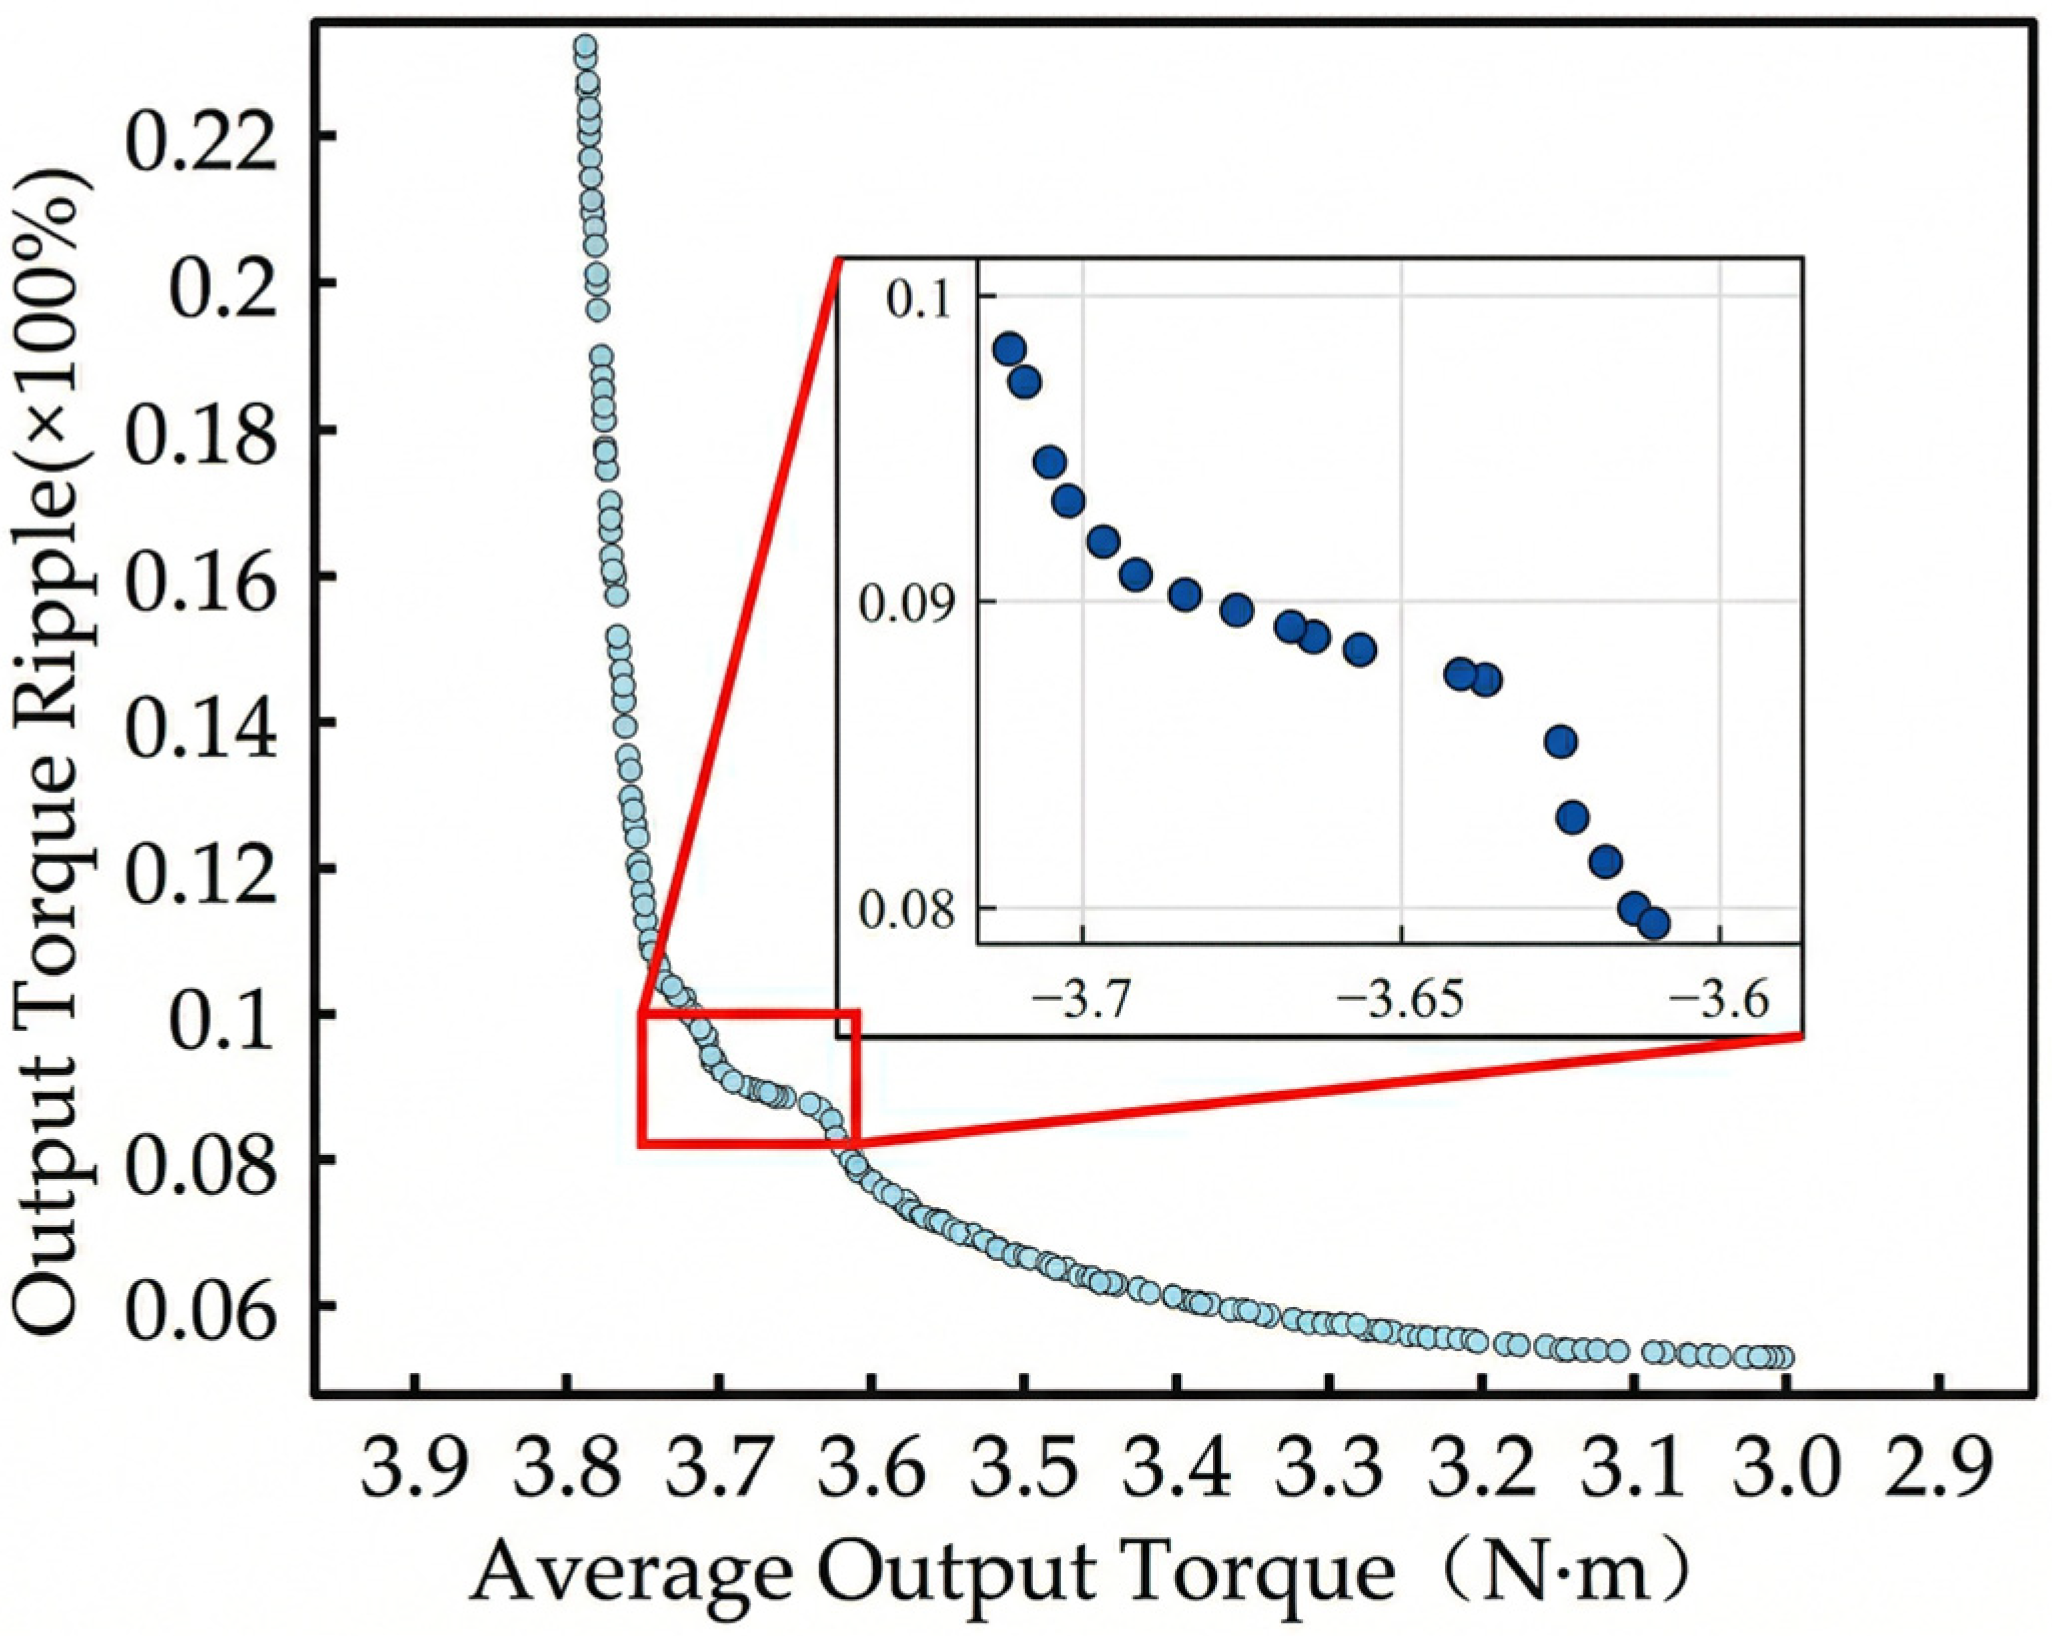
Furthermore, the NSGA-II algorithm is utilized to identify the optimal solutions for the torque system. To ensure that the Pareto front is not merely a locally optimal solution identified by chance, the average result obtained from multiple algorithmic runs was employed. Accordingly, the number of experiments was set to 30. The Pareto front distribution resulting from the multi-objective optimization of the torque system is illustrated in Figure 13.
Figure 13.
Pareto Solution Set of the Torque System.
It is evident from the Pareto front distribution graph that the average output torque and the output torque ripple of the torque system constitute a pair of asymmetric, conflicting optimization objectives. Specifically, as the average output torque increases, the output torque ripple concurrently intensifies.
Since the multi-objective optimization results—manifested as the Pareto front—yield multiple sets of optimal design parameters, the final selection of specific parameters requires further screening based on the performance of the suspension system. Consequently, it is necessary to implement a suspension-torque dual-system interactive collaborative optimization strategy.
Initially, a torque optimization index is defined as follows to accomplish the preliminary screening of the torque solution set:
where Tavg and Tp represent the average torque and torque ripple prior to optimization, respectively; and and denote the average torque and torque ripple subsequent to optimization. It is required that , which indicates that the overall optimization of the motor yields a positive effect, resulting in an enhancement of the torque system’s comprehensive performance. Conversely, if , it implies that the overall optimization exerts a negative effect.
Subsequently, utilizing the screened solution set, the values of the dual-system coupling variables are sequentially substituted into the response surface surrogate model of the suspension system. In conjunction with the previously determined single-suspension system variables, a secondary screening is conducted—with the objective of maximizing the suspension force—to determine the definitive optimal parameter combination for the suspension system. The resulting final parameters are presented in Table 5.
Table 5.
Comparison of Initial and Optimized Parameters.
4.2. Verification of Optimization Results
Finite Element Verification
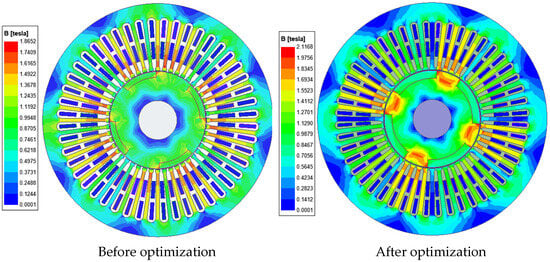
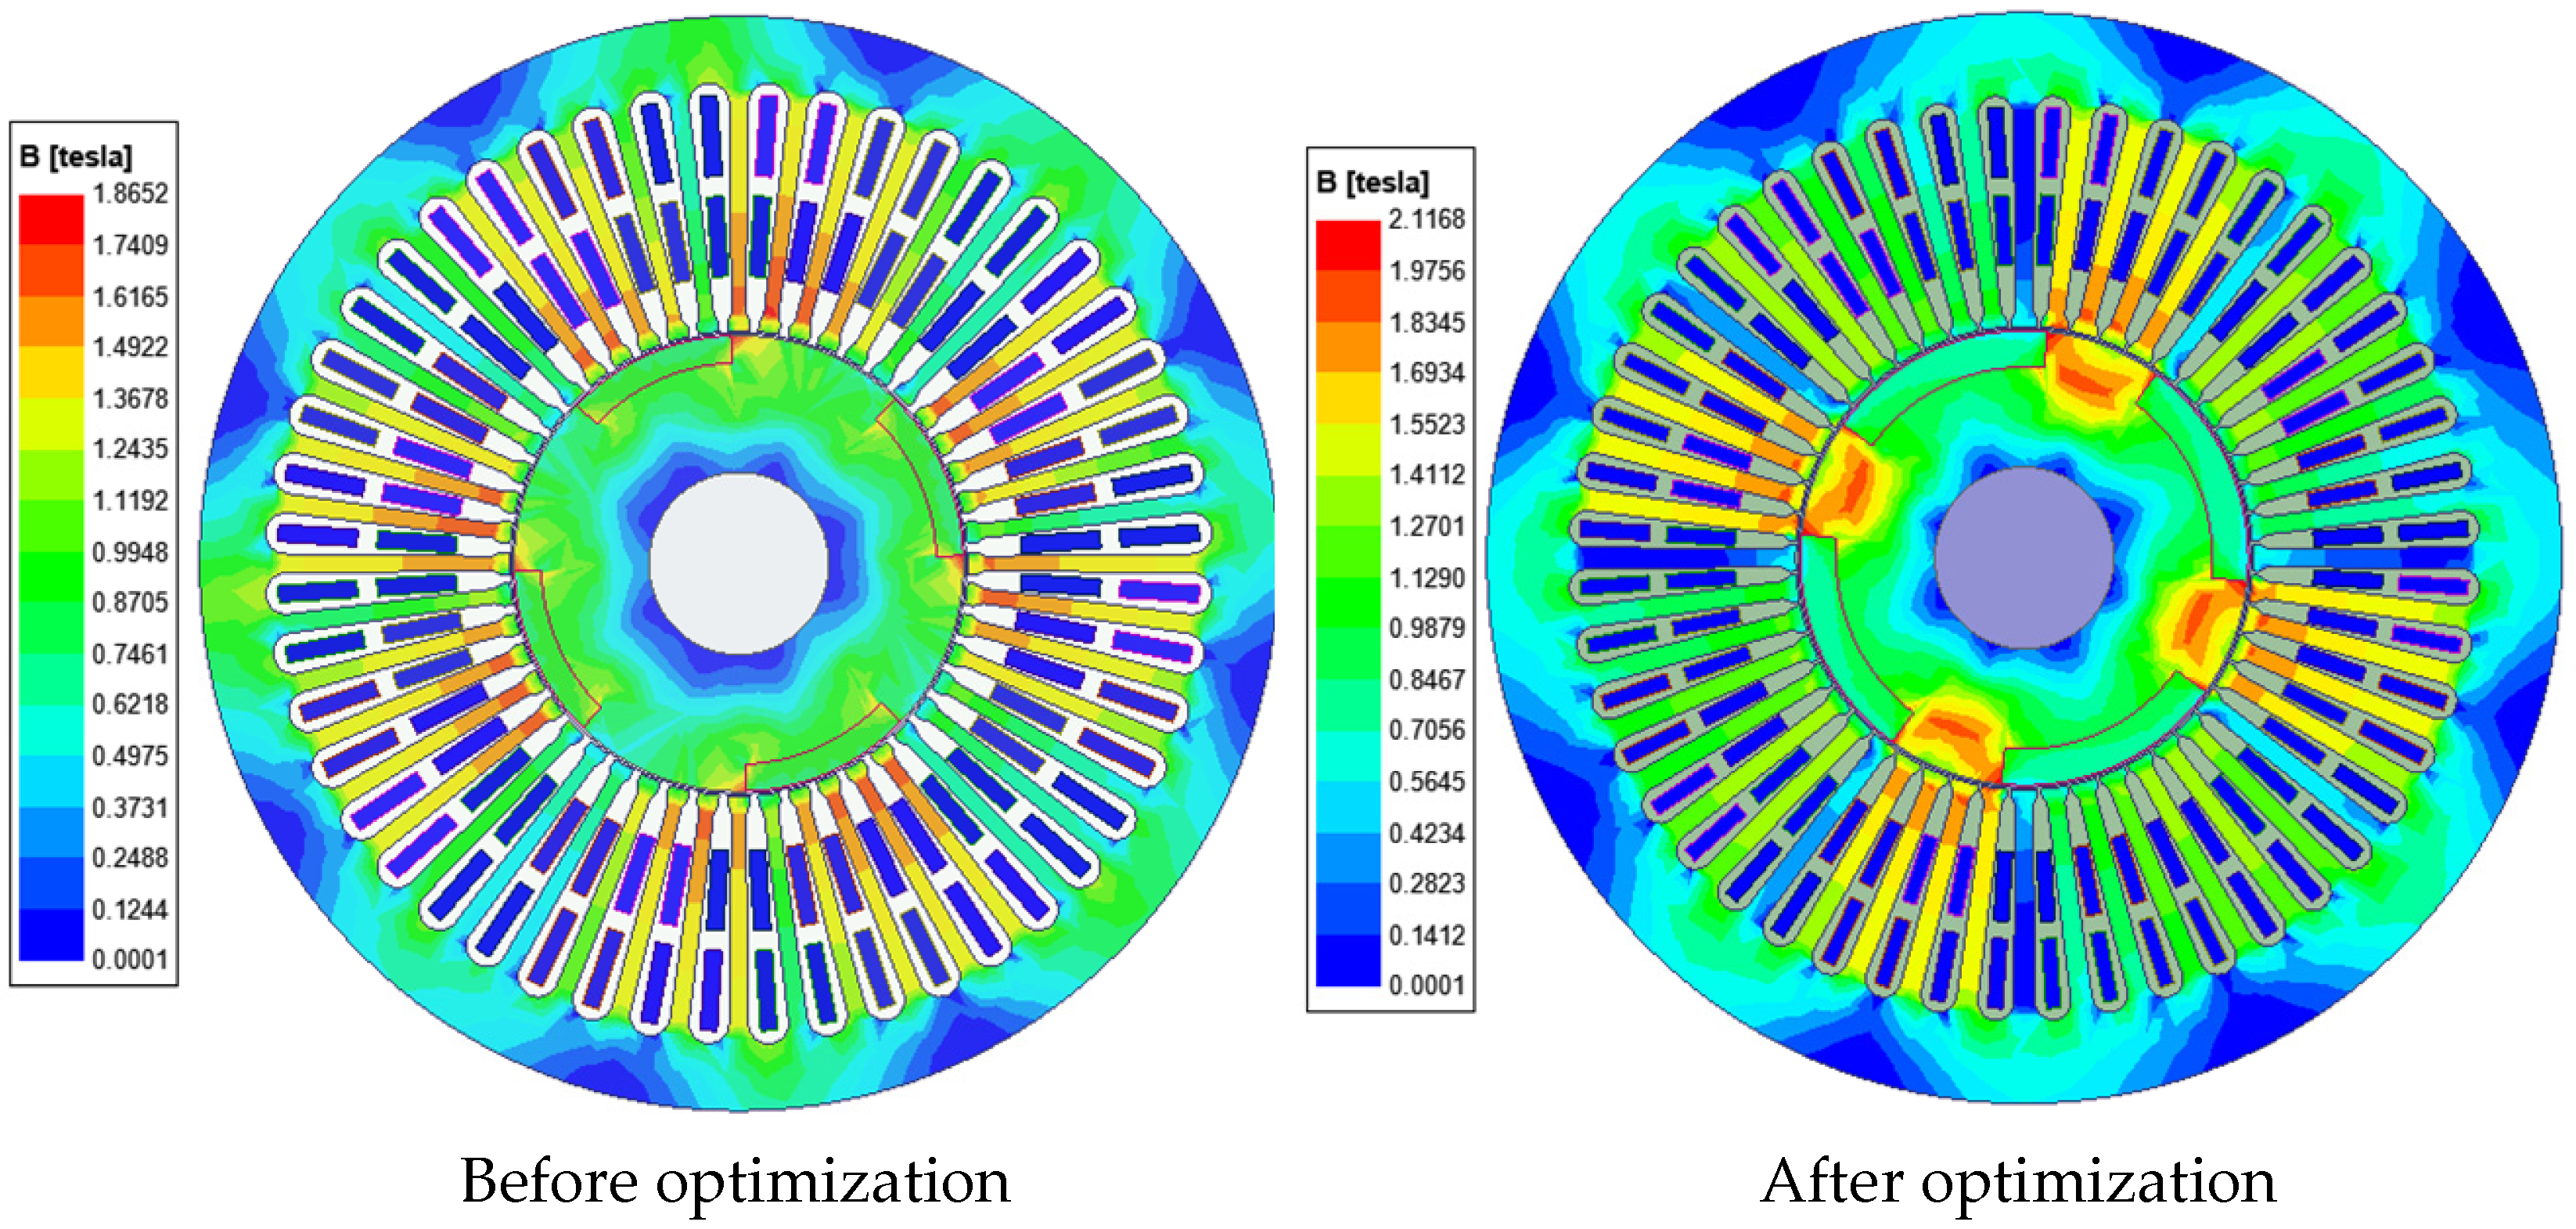
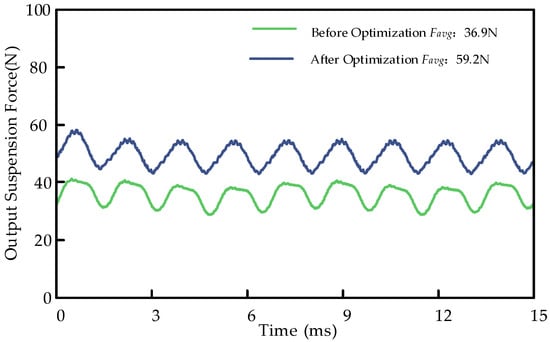
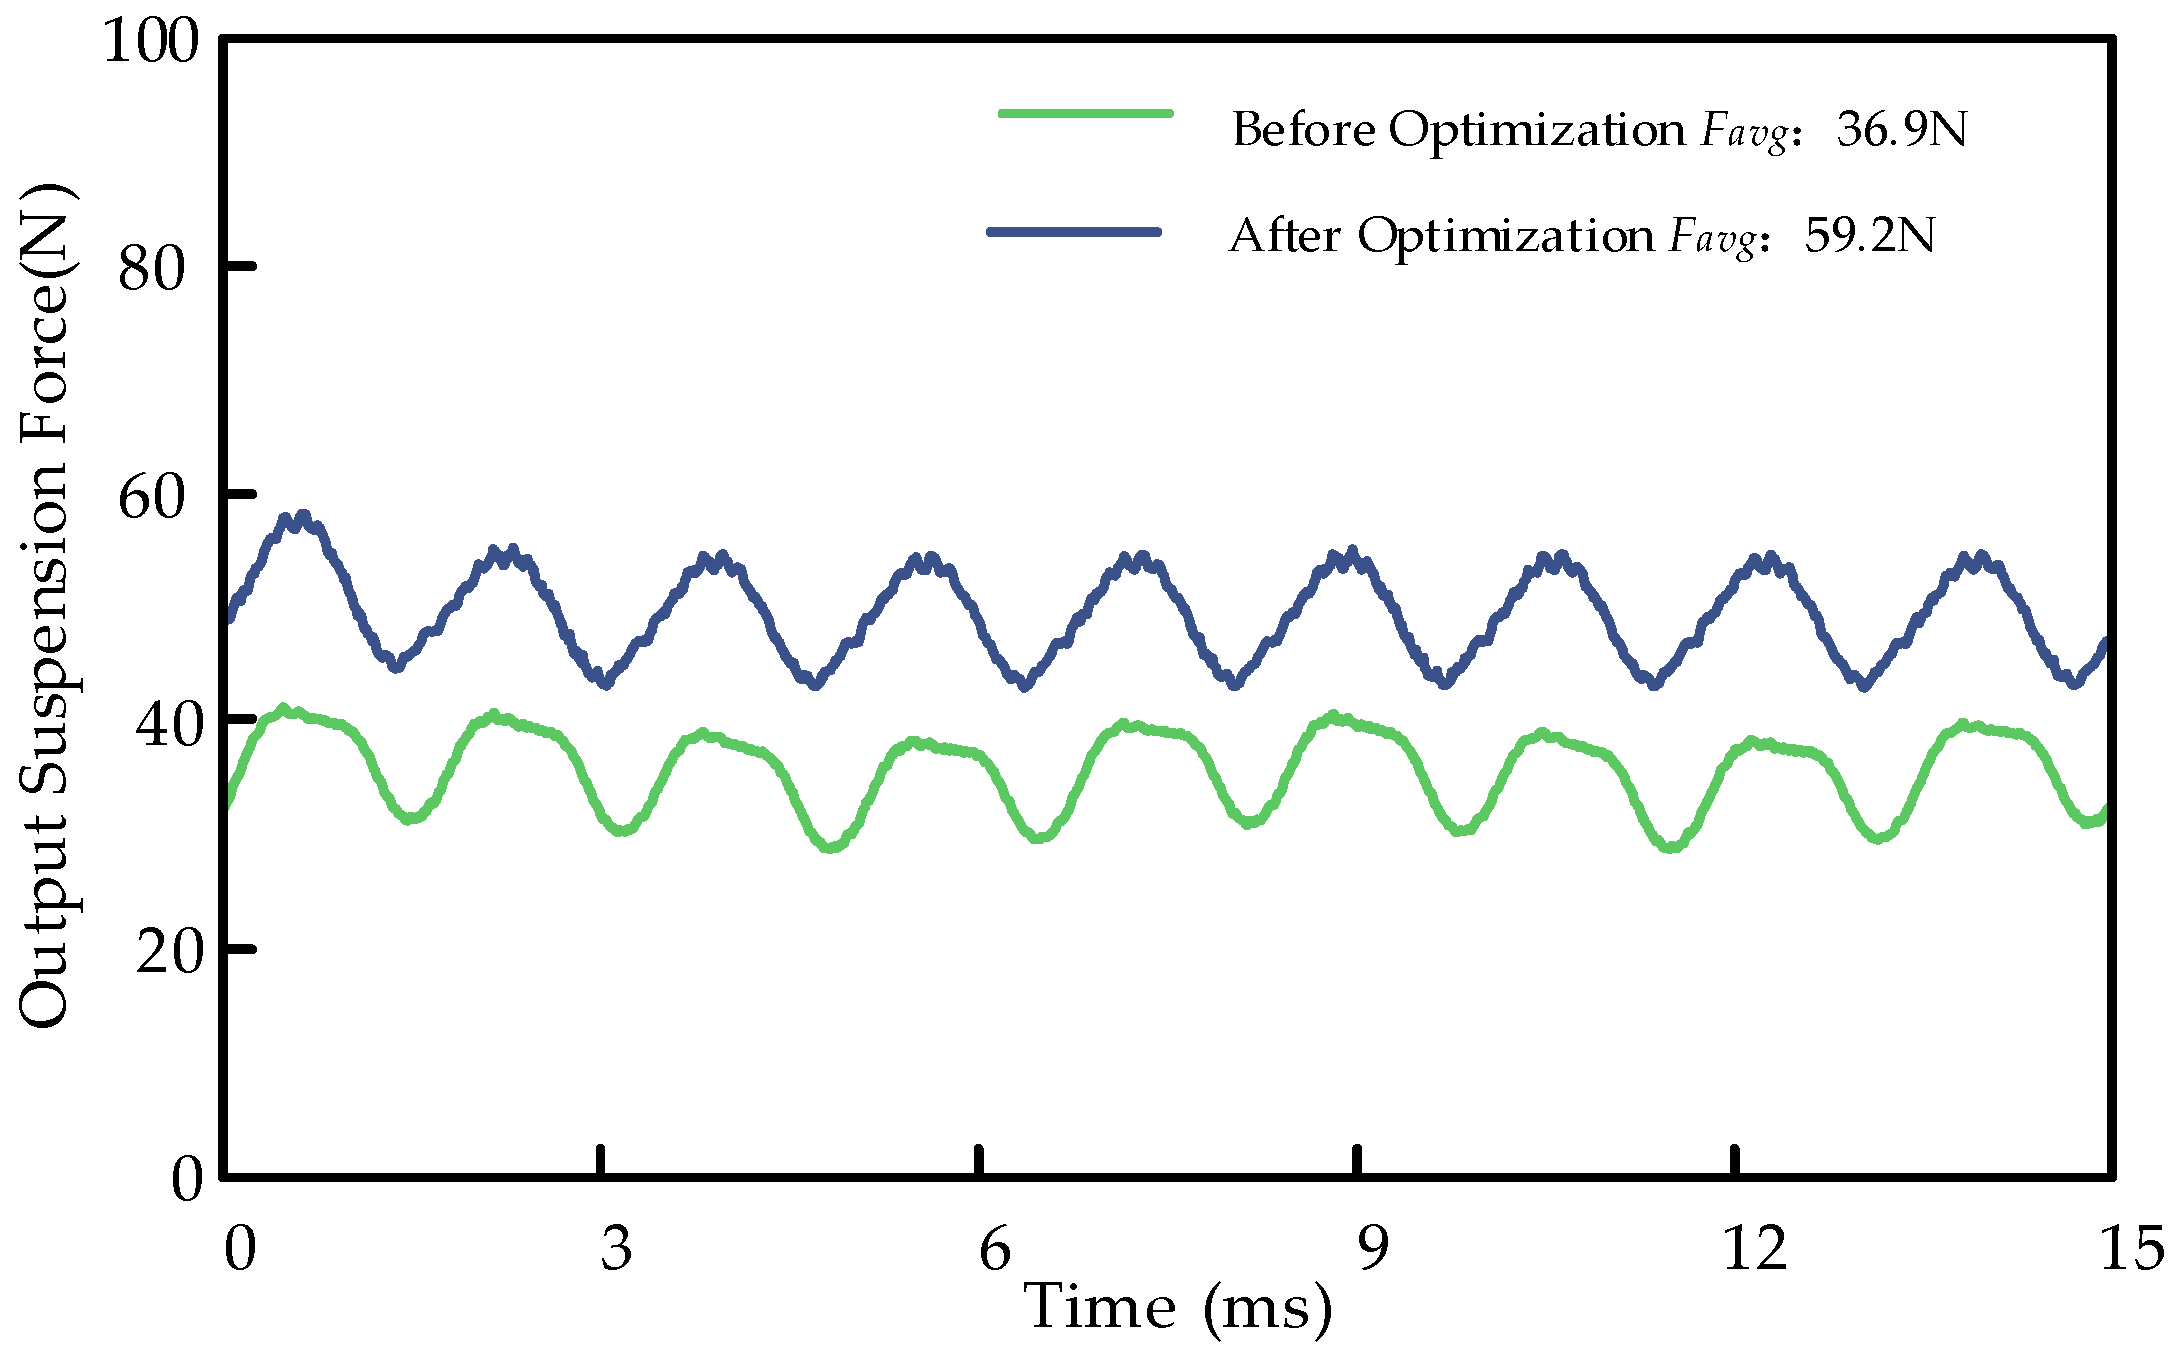
Based on finite element simulation, a comparison of torque performance and suspension performance before and after optimization is conducted. Finite element simulations are performed using the optimized parameters to compare performance against the output torque and output suspension force prior to optimization. The comparative results are illustrated in Figure 14, Figure 15 and Figure 16.
Figure 14.
Comparison of magnetic flux density distribution before and after optimization.
Figure 15.
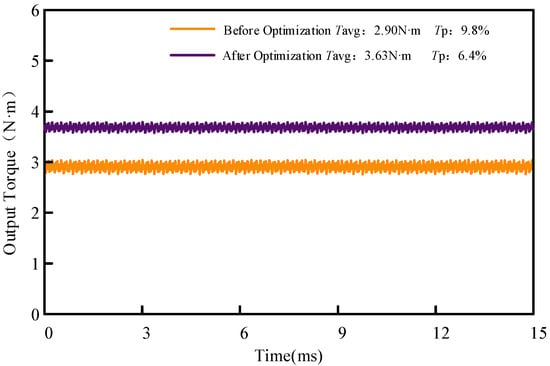
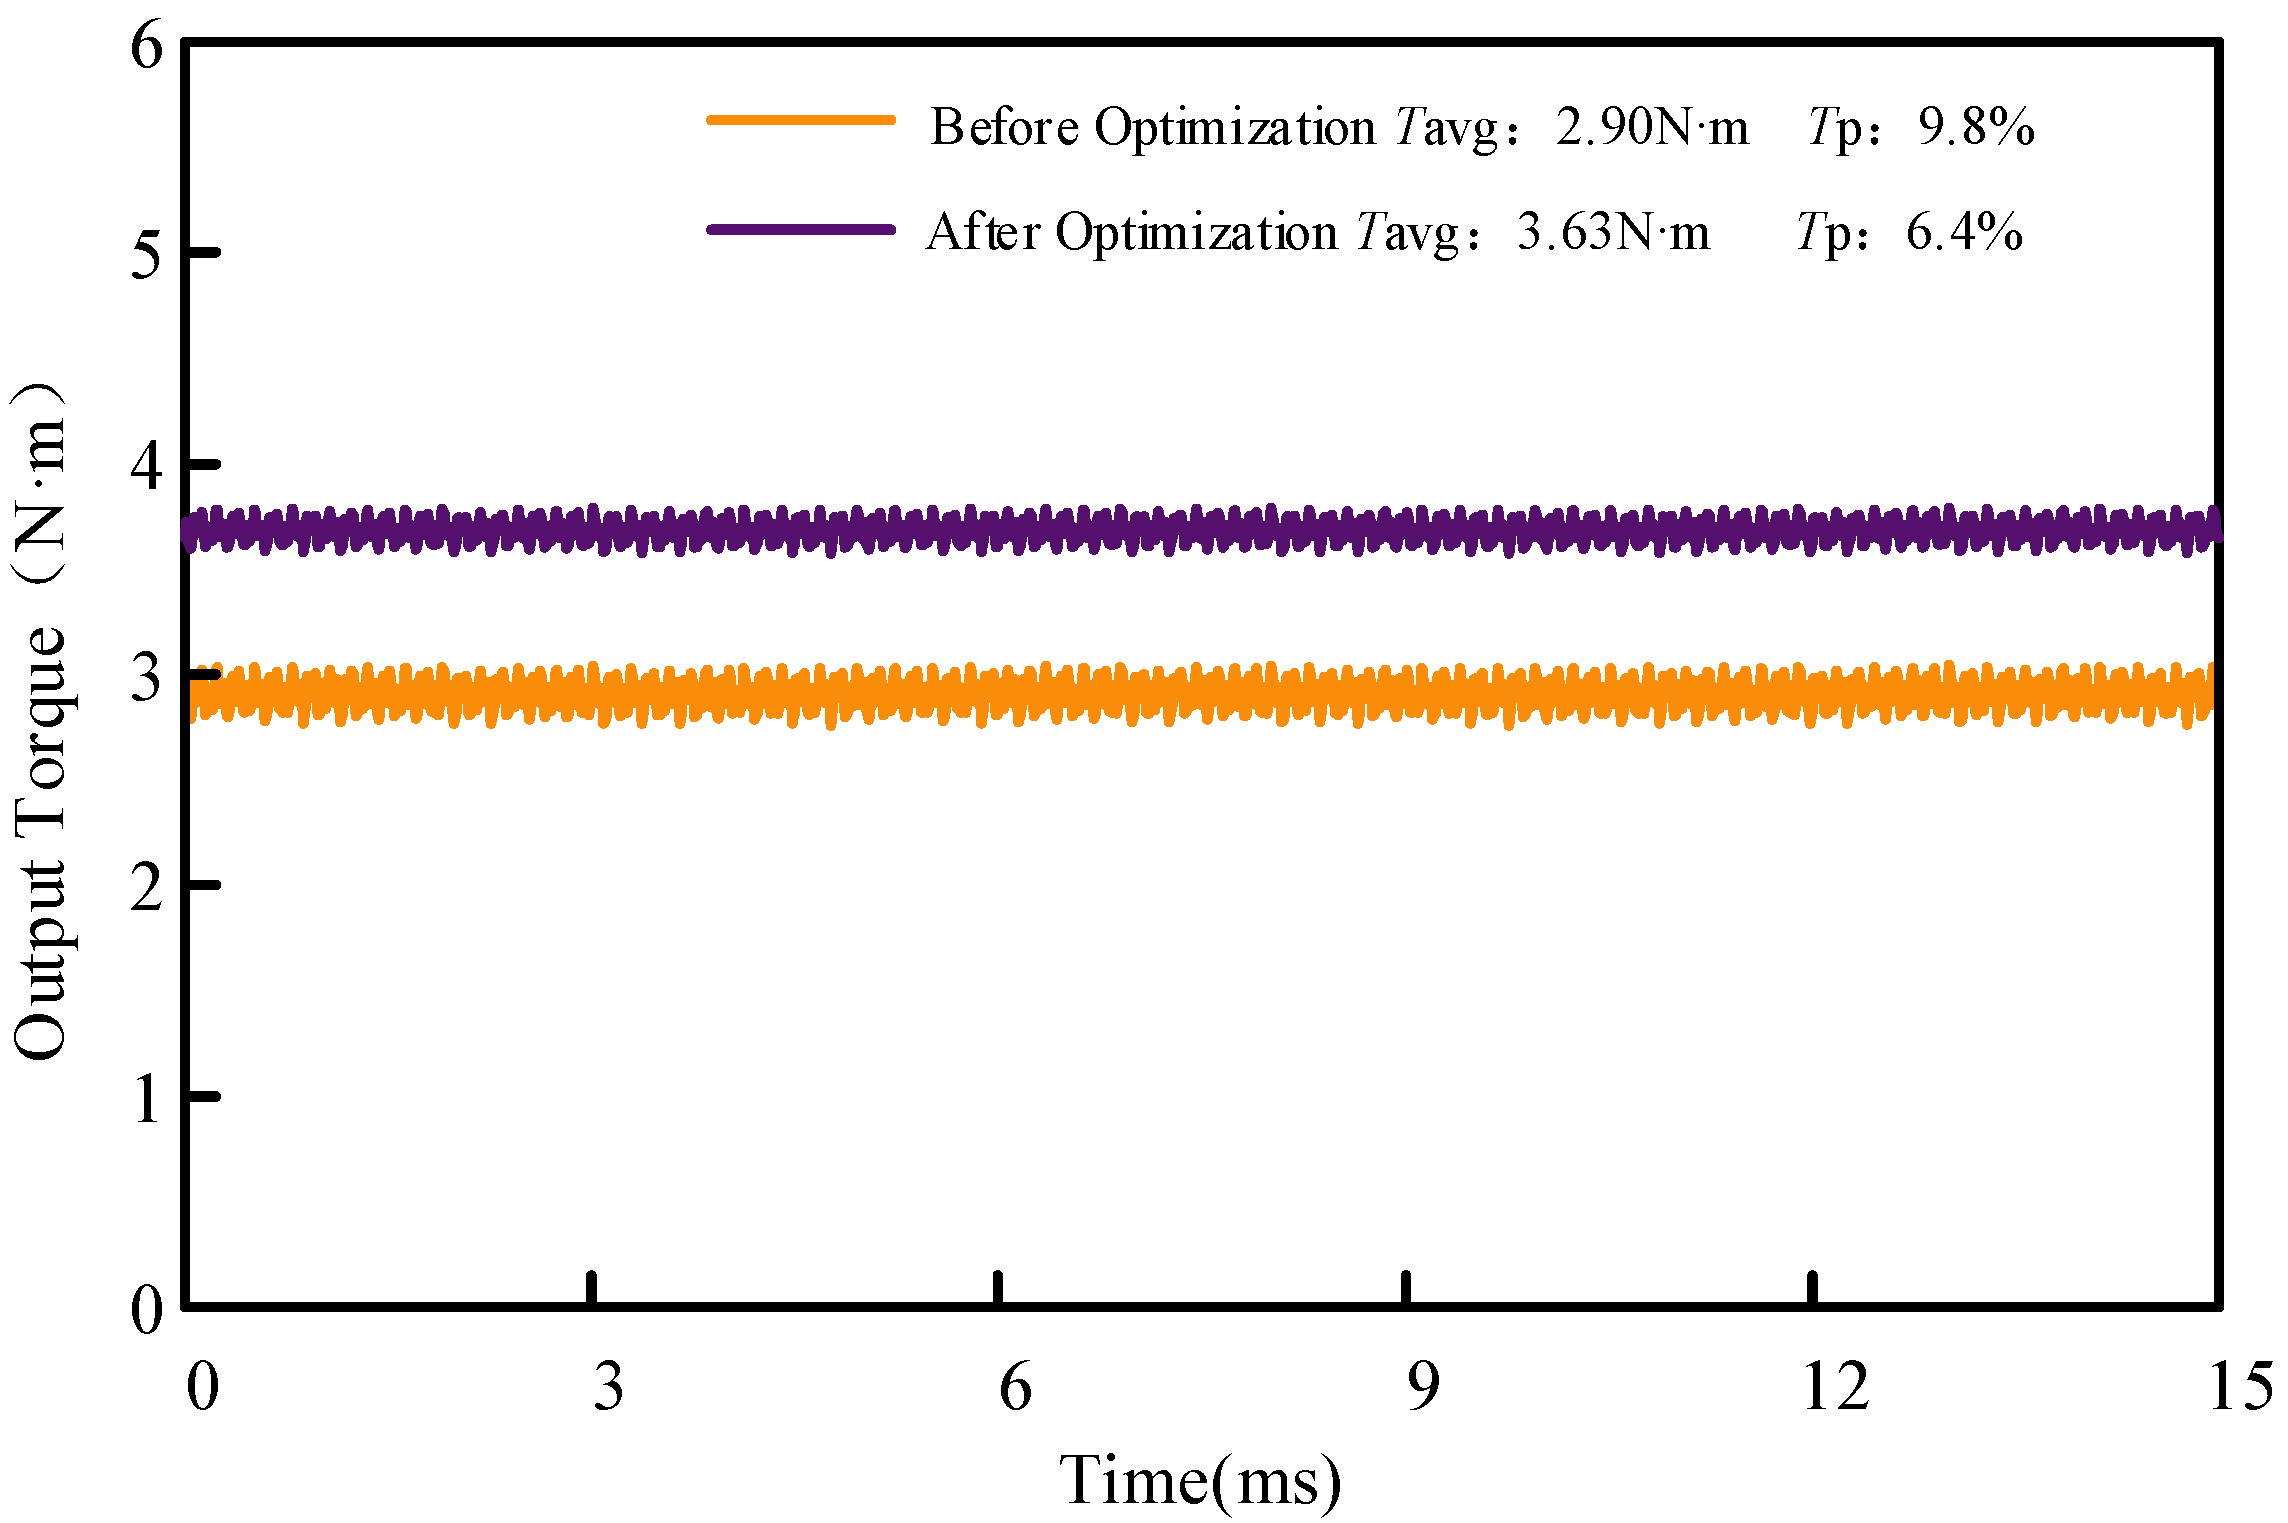
Comparison of output torque before and after optimization.
Figure 16.
Comparison of output suspension force before and after optimization.
Comparative analysis demonstrates that the optimization significantly enhances the main air-gap flux and the utilization of core materials. Consequently, the increased magnetic flux density leads to an effective improvement in both levitation force and average torque.
Figure 15 illustrates the variations in the motor’s output torque before and after optimization. Prior to optimization, the motor exhibited an average output torque of 2.90 N·m and a torque ripple of 9.8%. Following optimization, the average output torque increased to 3.63 N·m, while the output torque ripple decreased to 6.4%. This represents a 25.17% enhancement in average output torque and a 34.69% reduction in torque ripple. These significant improvements demonstrate that the optimization measures effectively enhanced the motor’s torque output capability and suppressed torque fluctuations, thereby enabling smoother power delivery during operation.
Figure 16 illustrates the variations in the output suspension force of the single-winding consequent-pole bearingless permanent magnet synchronous motor (BPMSM) before and after optimization. Prior to optimization, the average output suspension force of the motor was 36.9 N; following optimization, it surged to 59.2 N, representing a 60.43% increase in average output suspension force. This significant improvement demonstrates the effectiveness of the optimization in enhancing the motor’s suspension force generation capability.
Based on the comparative analysis above, it is evident that the dual-system interactive optimization strategy has achieved remarkable results in enhancing both the output torque and output suspension force of the four-pole-pair single-winding consequent-pole BPMSM. The optimized motor exhibits superior stability and performance, laying a solid foundation for subsequent control implementation.
5. Conclusions
This paper designs a single-winding consequent-pole Bearingless Permanent Magnet Synchronous Motor (BPMSM). Addressing characteristics such as the strong coupling and interaction among the motor parameters, a dual-system interactive optimization strategy based on sensitive variable classification is proposed. The relevant finite element analysis and experimental results of this strategy indicate the following:
- By processing parameters of different sensitivity types separately, the proposed strategy effectively reduces the number of sampling iterations and optimization time while maintaining the accuracy of the surrogate model. This achieves a comprehensive optimization of the key performances for both the torque and suspension systems.
- The surrogate models and optimization algorithms adopted in this paper can be replaced with models possessing higher fitting accuracy and more advanced algorithms according to practical requirements, thereby improving optimization efficiency and shortening the optimization cycle.
- Although the current study primarily validates the proposed strategy through high-fidelity finite element analysis, the significant improvements in average torque and the simultaneous reduction in torque ripple demonstrate substantial theoretical potential. As a subsequent phase of this research, experimental prototypes will be developed for empirical validation, alongside a comprehensive investigation into advanced control system architectures to further evaluate the drive’s dynamic performance.
- The strategy proposed in this paper can be further extended to other electromechanical energy conversion devices featuring multi-functional or system-integrated applications.
Author Contributions
All authors contributed extensively to the work presented in this paper. Conceptualization, Y.Y.; methodology, F.Y.; software, Y.Z.; validation, Q.S.; writing—original draft preparation, J.Z.; writing—review and editing, Y.H. and Y.L.; software validation, J.Z. and Y.Z.; supervision, Y.Y. and F.Y. All authors have read and agreed to the published version of the manuscript.
Funding
This research was funded by China Postdoctoral Science Foundation Project, grant number 2021M702413 and The Natural Science Foundation of the Jiangsu Higher Education Institutions, grant number 24KJB470004.
Data Availability Statement
The original contributions presented in this study are included in the article. Further inquiries can be directed to the corresponding author(s).
Conflicts of Interest
The authors declare no conflicts of interest.
Abbreviations
The following abbreviations are used in this manuscript:
| SW-CP-BPMSM | single-winding consequent-pole bearingless permanent magnet synchronous motor |
| RSM | Response Surface Methodology |
| BP | Back Propagation |
| FEA | Finite Element Analysis |
| BIPMSM | Bearingless Interior Permanent Magnet Synchronous Motor |
| MOWOA | Multi-Objective Whale Optimization Algorithm |
| PMs | permanent magnets |
| MOPSO | Multi-Objective Particle Swarm Optimization |
| LHS | Latin Hypercube Sampling |
References
- Vlachou, V.I.; Sakkas, G.K.; Xintaropoulos, F.P.; Pechlivanidou, M.S.C.; Kefalas, T.D.; Tsili, M.A.; Kladas, A.G. Overview on Permanent Magnet Motor Trends and Developments. Energies 2024, 17, 538. [Google Scholar] [CrossRef] [Scilit]
- Chiba, A. A Review of Researches and Developments of Bearingless Motors. IEEE J. Emerg. Sel. Top. Power Electron. 2025, 13, 1. [Google Scholar] [CrossRef] [Scilit]
- Xu, J.; Sun, Y.; Ye, Y.; Huang, Y. A new type of sinusoidal suspension winding Consequent-pole Bearingless Permanent Magnet Synchronous Motor. Energy Rep. 2020, 6, 914–920. [Google Scholar] [CrossRef] [Scilit]
- TNoguchi, T.; Sugimoto, H.; Fujii, Y.; Chiba, A. A Novel Combined Winding and Test Result of a 20-Pole/24-Slot Consequent-Pole Bearingless Motor with Parallel Motor Winding. IEEE Trans. Ind. Appl. 2021, 57, 6880–6891. [Google Scholar] [CrossRef] [Scilit]
- Xiang, Z.; Miao, Y.; Zhou, Y.; Li, F. Design and Optimization of a High-Efficiency Lightweight Permanent Magnet In-Wheel Motor with Torque Performance Improvement. Energies 2025, 18, 4509. [Google Scholar] [CrossRef] [Scilit]
- Wang, H.; Bai, H.; Guo, L.Y. Design of Single-Winding Arrangement for Arbitrary Multiphase Bearingless Permanent Magnet Synchronous Motor. J. Electr. Eng. Technol. 2025, 20, 1417–1427. [Google Scholar] [CrossRef] [Scilit]
- Li, F.; Shi, L.; Xiao, D.; Gao, S.; Wang, J.; Han, Z. Electromagnetic Characteristic Analysis and Optimization of Hybrid Magnetic Pole Asymmetric Magnetic Barrier Permanent Magnet Synchronous Motor. Proc. CSEE 2026, 1–13. (In Chinese) [Google Scholar] [CrossRef]
- Wang, H.; Lu, Y.; Wu, S.; Guo, L. Optimization design of unequal amplitude modulated poles for the bearingless PMSM. Energies 2022, 15, 3097. [Google Scholar] [CrossRef] [Scilit]
- Zhu, H.; Shen, S.; Wang, X. Multiobjective optimization design of outer rotor coreless bearingless permanent magnet synchronous motor. IEEE J. Emerg. Sel. Top. Power Electron. 2021, 9, 5489–5498. [Google Scholar] [CrossRef] [Scilit]
- Gong, Y.; Gneiting, A.; Weigel, S.; Parspour, N.; An, Z. Surrogate Model-Based Drive Cycle Modeling and Optimization of Synchronous Reluctance Machines for Electric Vehicles. IEEE Trans. Magn. 2025, 61, 810190. [Google Scholar] [CrossRef] [Scilit]
- Kovalovs, A. Modelling, Parametric Study, and Optimisation of 3D Model-Scale Helicopter’s Rotor Blade with Piezoelectric Actuators. Appl. Sci. 2026, 16, 1319. [Google Scholar] [CrossRef] [Scilit]
- Hua, Y.; Zhu, H.; Xu, Y. Multi-objective optimization design of bearingless permanent magnet synchronous generator. IEEE Trans. Appl. Supercond. 2020, 30, 5201205. [Google Scholar] [CrossRef] [Scilit]
- Zhu, H.; Shen, L. Decoupling control of outer rotor coreless bearingless permanent magnet synchronous generator using improved genetic algorithm optimized LS-SVM inverse system. Proc. CSEE 2024, 44, 2037–2047. (In Chinese) [Google Scholar]
- Wang, J.; Hua, Y.; Xu, B.; Zhu, Y. Multi-objective optimization design of bearingless interior permanent magnet synchronous motor based on MOWOA. Electronics 2025, 14, 3080. [Google Scholar] [CrossRef] [Scilit]
- Wan, Z. Global sensitivity evolution equation of the Fréchet-derivative-based global sensitivity analysis. Struct. Saf. 2024, 106, 102413. [Google Scholar] [CrossRef] [Scilit]
- Vu, T.-H.; Hsu, C.-H. Experimental Investigation and Predictive Modeling of Surface Roughness in Dry Turning of AISI 1045 Steel Using Power-Law and Response Surface Approaches. Appl. Sci. 2026, 16, 1392. [Google Scholar] [CrossRef] [Scilit]
- Dong, Z. Multi-Objective Optimization of Structural Parameters for Dual-Oscillator Ultrasonic Motors. Electronics 2025, 14, 4817. [Google Scholar] [CrossRef] [Scilit]
- Jain, S.; Dubey, K.K. Employing the Latin hypercube sampling to improve the NSGA III performance in multiple-objective optimization. Asian J. Civ. Eng. 2023, 24, 3319–3330. [Google Scholar] [CrossRef] [Scilit]
- Wang, Y.; Fan, R.; Cheng, L.; Gong, B.; Liu, J. An Improved Adaptive NSGA-II with Multiple Filtering for High-Dimensional Feature Selection. Electronics 2026, 15, 236. [Google Scholar] [CrossRef] [Scilit]
- Li, R.; Zhou, G.; Li, J. Multi-objective optimization design of flexspline structure based on NSGA II for harmonic drive. Precis. Eng. 2026, 97, 1–15. [Google Scholar] [CrossRef] [Scilit]
- Hao, J.; Yang, X.; Wang, C.; Tu, R.; Zhang, T. An Improved NSGA-II Algorithm Based on Adaptive Weighting and Searching Strategy. Appl. Sci. 2022, 12, 11573. [Google Scholar] [CrossRef] [Scilit]
- Wu, P.; Chen, Y. Establishing a Novel Algorithm for Highly Responsive Storage Space Allocation Based on NAR and Improved NSGA-III. Complexity 2022, 1, 112. [Google Scholar] [CrossRef] [Scilit]

Disclaimer/Publisher’s Note: The statements, opinions and data contained in all publications are solely those of the individual author(s) and contributor(s) and not of MDPI and/or the editor(s). MDPI and/or the editor(s) disclaim responsibility for any injury to people or property resulting from any ideas, methods, instructions or products referred to in the content. |
© 2026 by the authors. Licensee MDPI, Basel, Switzerland. This article is an open access article distributed under the terms and conditions of the Creative Commons Attribution (CC BY) license.