


Abstract
Currently, the installation of distributed energy sources is growing rapidly, especially renewable sources, for which the goal is to increase energy self-sufficiency across certain parts of the distribution network. The optimization of electricity production and distribution is key to achieving this goal. To optimize the energy distribution system, filters are increasingly being installed to compensate for reactive power, mitigate voltage unbalance, and reduce higher harmonics in small parts of the electrical system and even for single loads. This article verifies the filtration efficiency of a group of single-tuned passive harmonic filters. Two groups are investigated: a group of real filters and a designed optimal filter. This investigation was performed in three important parts: Firstly, measurements of the power quality parameters were taken in a real system (laboratory measurements). Secondly, the configuration of the optimal filter group was calculated, assuming the same reactive power and tuning frequencies as in a real system. In the group structure of such filters, the biggest problem is properly sharing the total reactive power between the filter branches. Thirdly, both filter structures (real and optimal) are compared based on harmonic reduction indexes and the filter efficiency index.
1. Introduction
With the increasing number of nonlinear loads, distributed energy sources, and other devices responsible for power quality (PQ) disturbances, the optimization of PQ has become a key goal. Good PQ is an indicator of the stability and reliability of the power grid. The definition of the term PQ differs in the literature [1]. For instance, in [2], PQ is defined as a combination of voltage quality and current quality. PQ disturbances (e.g., harmonics, voltage sag, voltage swell, voltage unbalance, voltage interruption, voltage fluctuation, electrical interference, lack of grounding, power factor, and transient) are well-defined in the literature [3,4]. In the power grid, harmonic disturbances are due, in most cases, to the presence of power electronic devices, which are becoming increasingly abundant. There are multiple undesirable effects of harmonics in an electrical system: They are the source of technical and economic problems such as power factor (PF) variation, additional losses, overloading and overheating of power grid elements, additional voltage drops, and resonance phenomenon [5,6]. Voltage swell and sag can cause serious problems in the power grid, such as damage to sensitive electronic equipment, overheating, insulation breakdown, or device malfunctioning [7,8]. For some time now, significant efforts have been made to enable islanding by dividing the existing grid into smaller sections for safety reasons. This is made possible by the increasing number of renewable energy sources. However, this requires greater emphasis on reducing reactive power and higher harmonics in these smaller sections of the supply network. Many solutions have been proposed in an attempt to achieve better PQ optimization [9], such as passive harmonic filters (PHFs) [10,11,12,13,14,15], hybrid passive harmonic filters (HPHFs) [16,17], shunt and series active power filters (APFs) [18,19,20,21], and hybrid active power filters [22,23,24,25,26,27,28]. Each of these solutions present both advantages and disadvantages. The main advantage of PHFs in comparison with APFs is their low cost, and the main advantages of APFs in comparison with PHFs are their flexibility and high efficiency in terms of PQ improvement [29,30,31]. Despite their disadvantages, PHFs are very often used in electrical installations to improve PQ via mitigating harmonics and compensating for reactive power. Because of the diversity of shunt PHF structures, the filter type and number in the group should be chosen carefully. In [32], the filter topology selection issue is investigated, and an algorithm of filter selection is proposed. In practice, the most common situation is a maximum of three filters in a group, but in some situations, there may be more [33]. The filter group can be made up of different types of PHFs; the number of filters in the group depends on the number of harmonics to be mitigated. One of the issues faced when designing the filter group is how to share the total reactive power between the filter branches. The optimal sharing of the total reactive power in a group of filters has an influence on the filtration efficiency of each filter. Many methods for sharing the total reactive power in a filter group are proposed and compared in the literature; many of them are limited in terms of mathematical expressions and simulations [34]. In [35], the author investigated five methods of sharing reactive power, considering filter resistance, the detuning effect, and short-circuit power. One of the study’s conclusions is that the best method cannot be chosen because the efficiency of the filter filtration is strongly related to the short-circuit power of the power grid. In [36], eight methods are studied, and one of the comparison criteria is the cost of the filters (economic aspect). In [37], the authors compare nine methods of sharing the total reactive power between filter branches and found that all the methods presented different degrees of effectiveness. In [38], a group of single-tuned filters is investigated, where the author takes into account the power grid equivalent impedance and detuning effect, and concepts such as the filtration efficiency index and the harmonic reduction index are investigated. Researchers have attempted to design a group of simple filters for around 70 years. Due to the lack of analytical solutions, simplifying assumptions are used regarding the division of reactive power between filter branches. For years, designers have chosen one of the simplifying assumptions and performed calculations. However, none of these assumptions have led to the creation of an optimal filter group design. Moreover, depending on the network’s short-circuit power, another method yields results closer to the optimal solution [35].
Only in [38] have analytical formulas been presented that allow for the optimal filter group to be determined in terms of the maximum reduction in the sum of harmonic reduction indexes. The resulting formulas take into account the equivalent impedance of the supply network and the detuning from the reduced harmonics, as the degree of harmonic reduction depends on them.
In earlier works, authors simplified the filter design by omitting the network’s short-circuit power or the detuning from the reduced harmonics. If these parameters were considered, they were only taken into account through numerical optimization methods, including the use of artificial intelligence. These methods are approximate and require multiple calculations of the system, which makes the computational process time-consuming. This study presents an investigation of the verification of the filtration efficiency of the group of two single-tuned filters in the laboratory. That verification is performed in three stages: In the first stage, power quality measurements are taken in the laboratory setup. In the second stage, an optimal filter group is designed based on the laboratory data. In the third stage, based on various criteria (e.g., filtration efficiency index, harmonic reduction index, and sharing of total reactive power between filters), the real filter group is compared with the designed optimal filter group. The optimal filter group calculations were performed assuming the same filter detuning frequencies and reactive power as the real filter. However, the significantly larger detuning of the seventh harmonic filter resulted in the design of a second filter group with an improved detuning value. The second optimal filter was again compared to the real filter group.
The paper uses analytical formulas for filter group design from [38], which enable a quick and accurate solution, unlike complex numerical methods. A sensitivity study to the parameters’ value changes was also conducted in [38], which confirms the validity of these formulas.
The investigated electrical system is assumed to be symmetrical. Measurements are taken using three power quality analyzers (e.g., PQBox300) [39], and the recorded waveforms of instantaneous voltage and current are analyzed in the MATLAB 2025a environment [40].
2. Electrical System Under Investigation
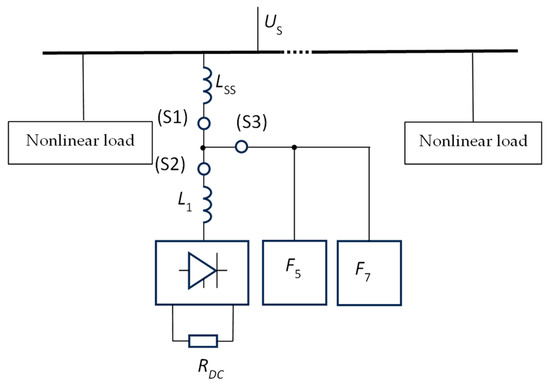
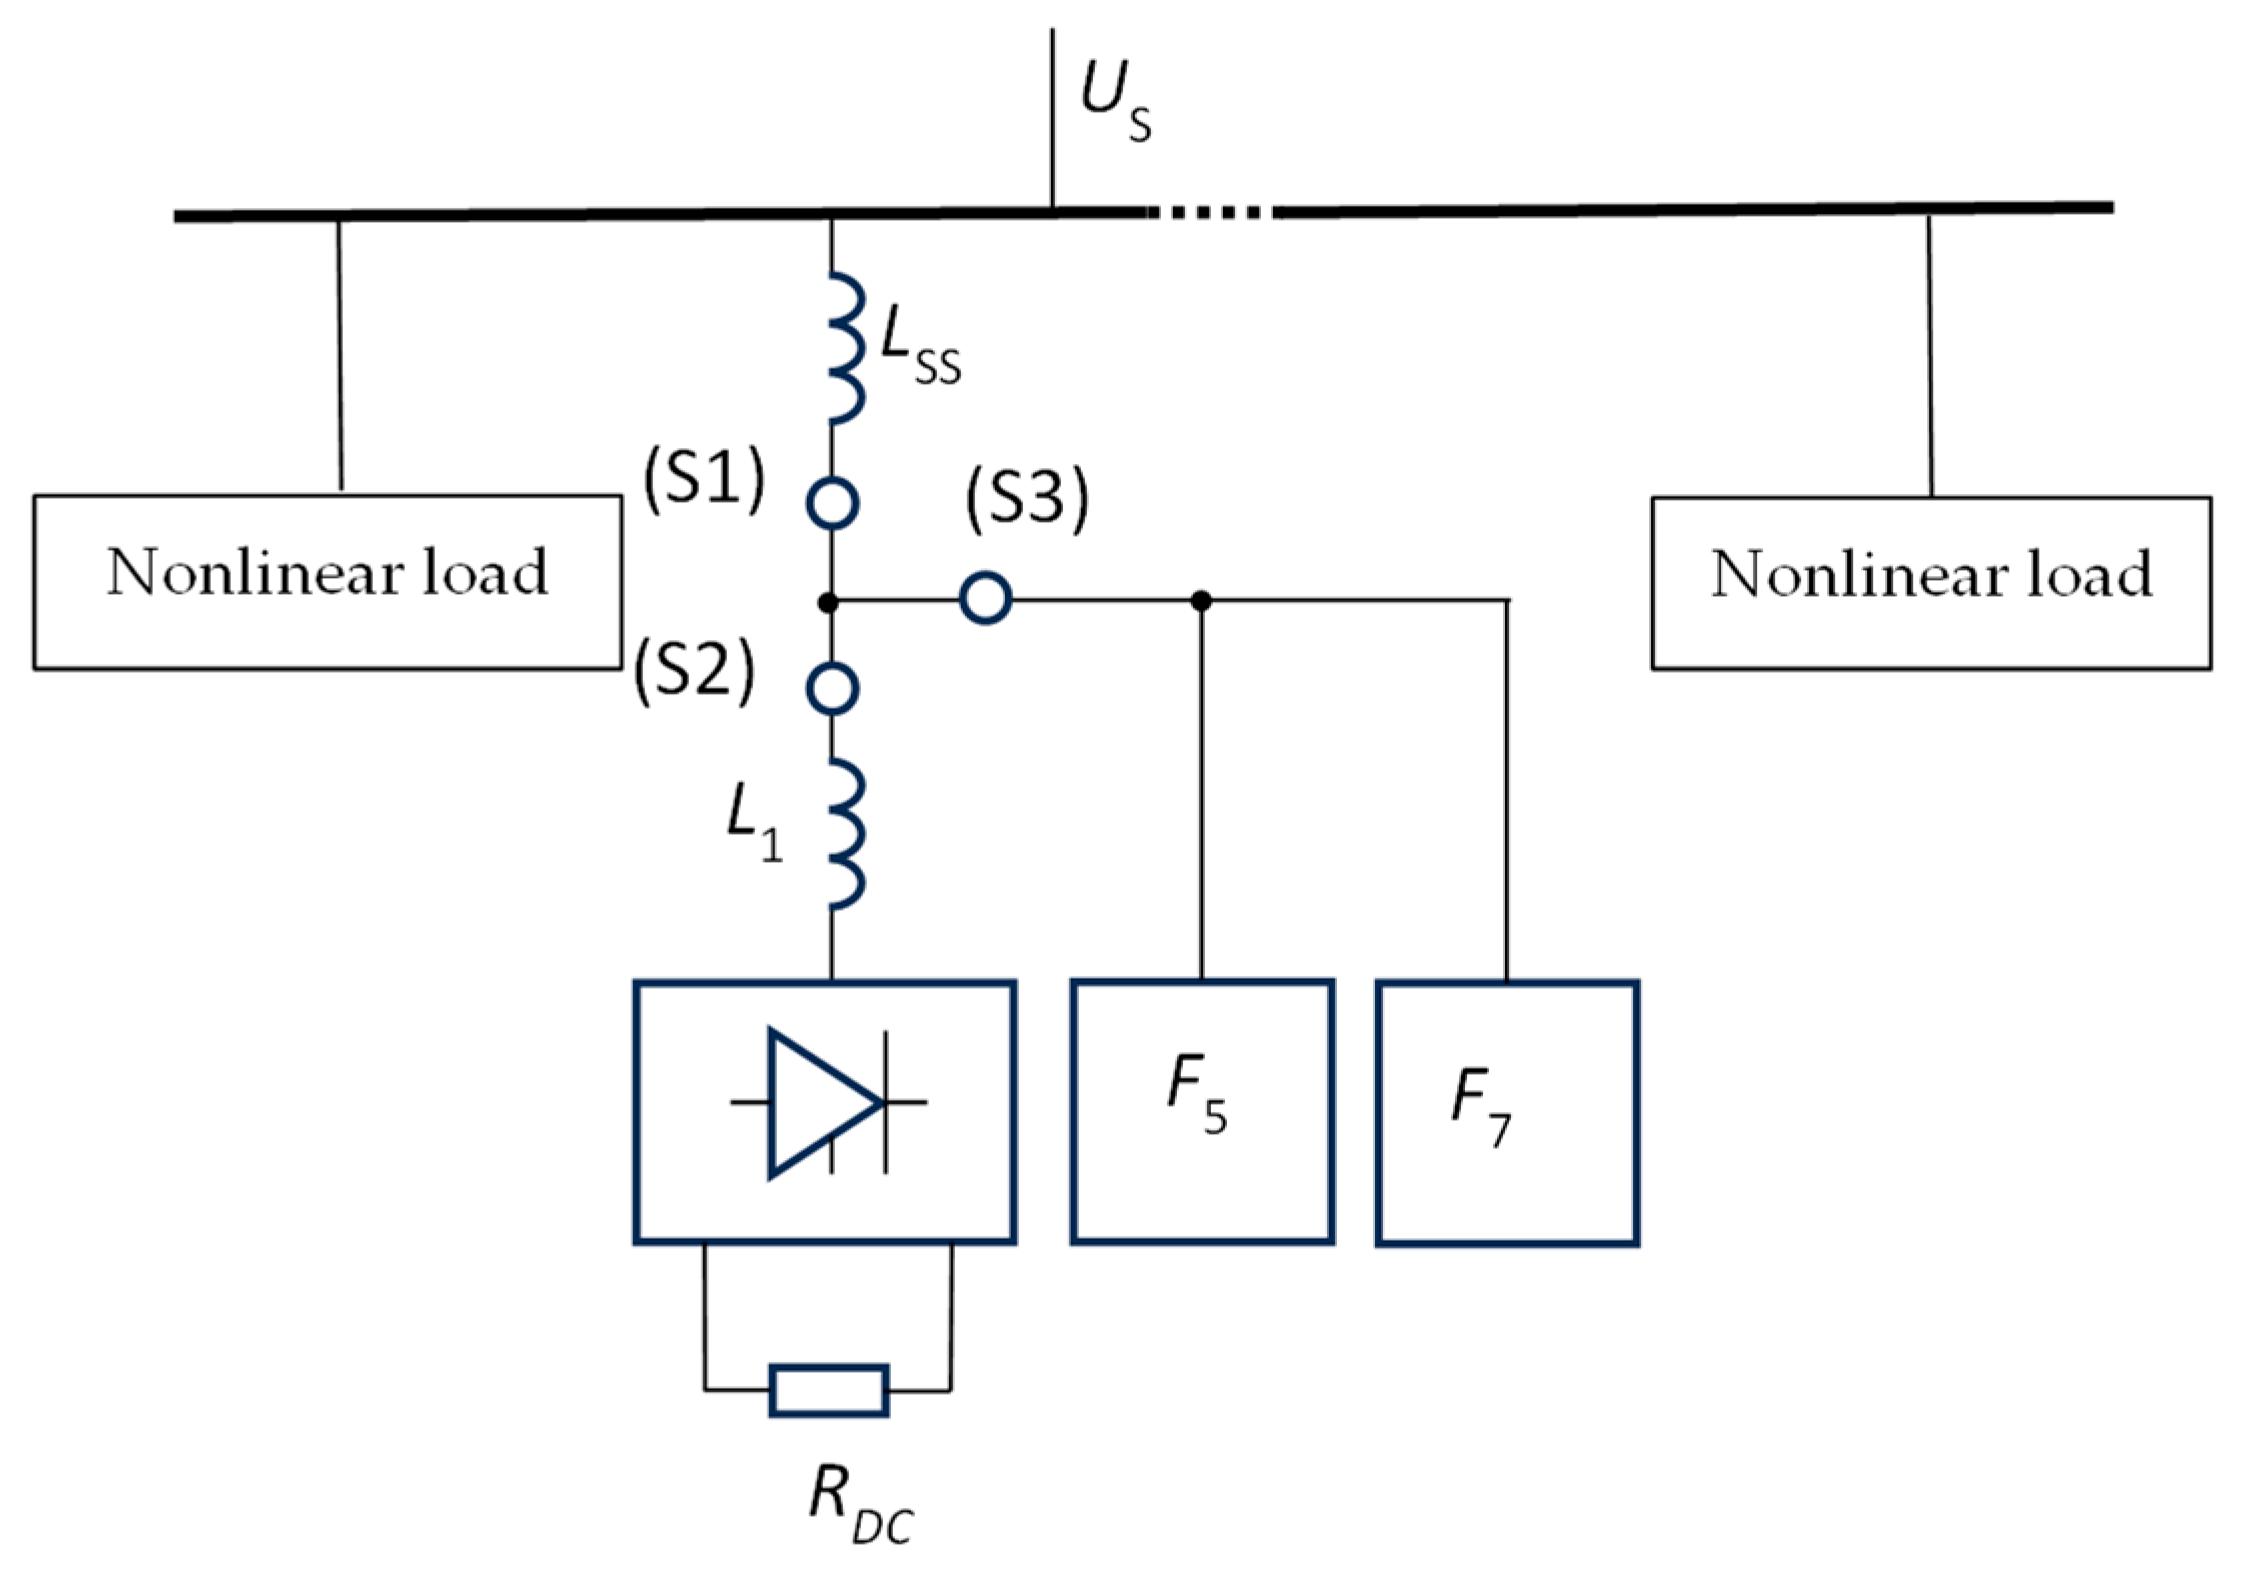
The equivalent circuit of the electrical system under investigation is presented in Figure 1. The six-pulse thyristor bridge and the group of two single-branch filters (F5 and F7) are considered (see Figure 1). The electrical system parameters are described in Table 1, and the observed values are from the laboratory setup.
Figure 1.
Equivalent circuit of the electrical system under investigation. (S1), (S2), and (S3) represent the grid side, load side, and filter group side, respectively.
Table 1.
Parameters of the investigated electrical system (from the laboratory setup).
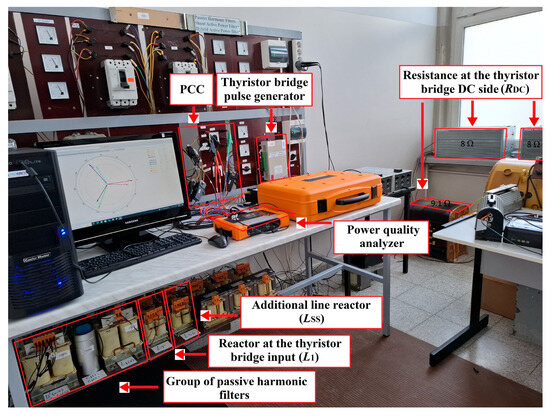
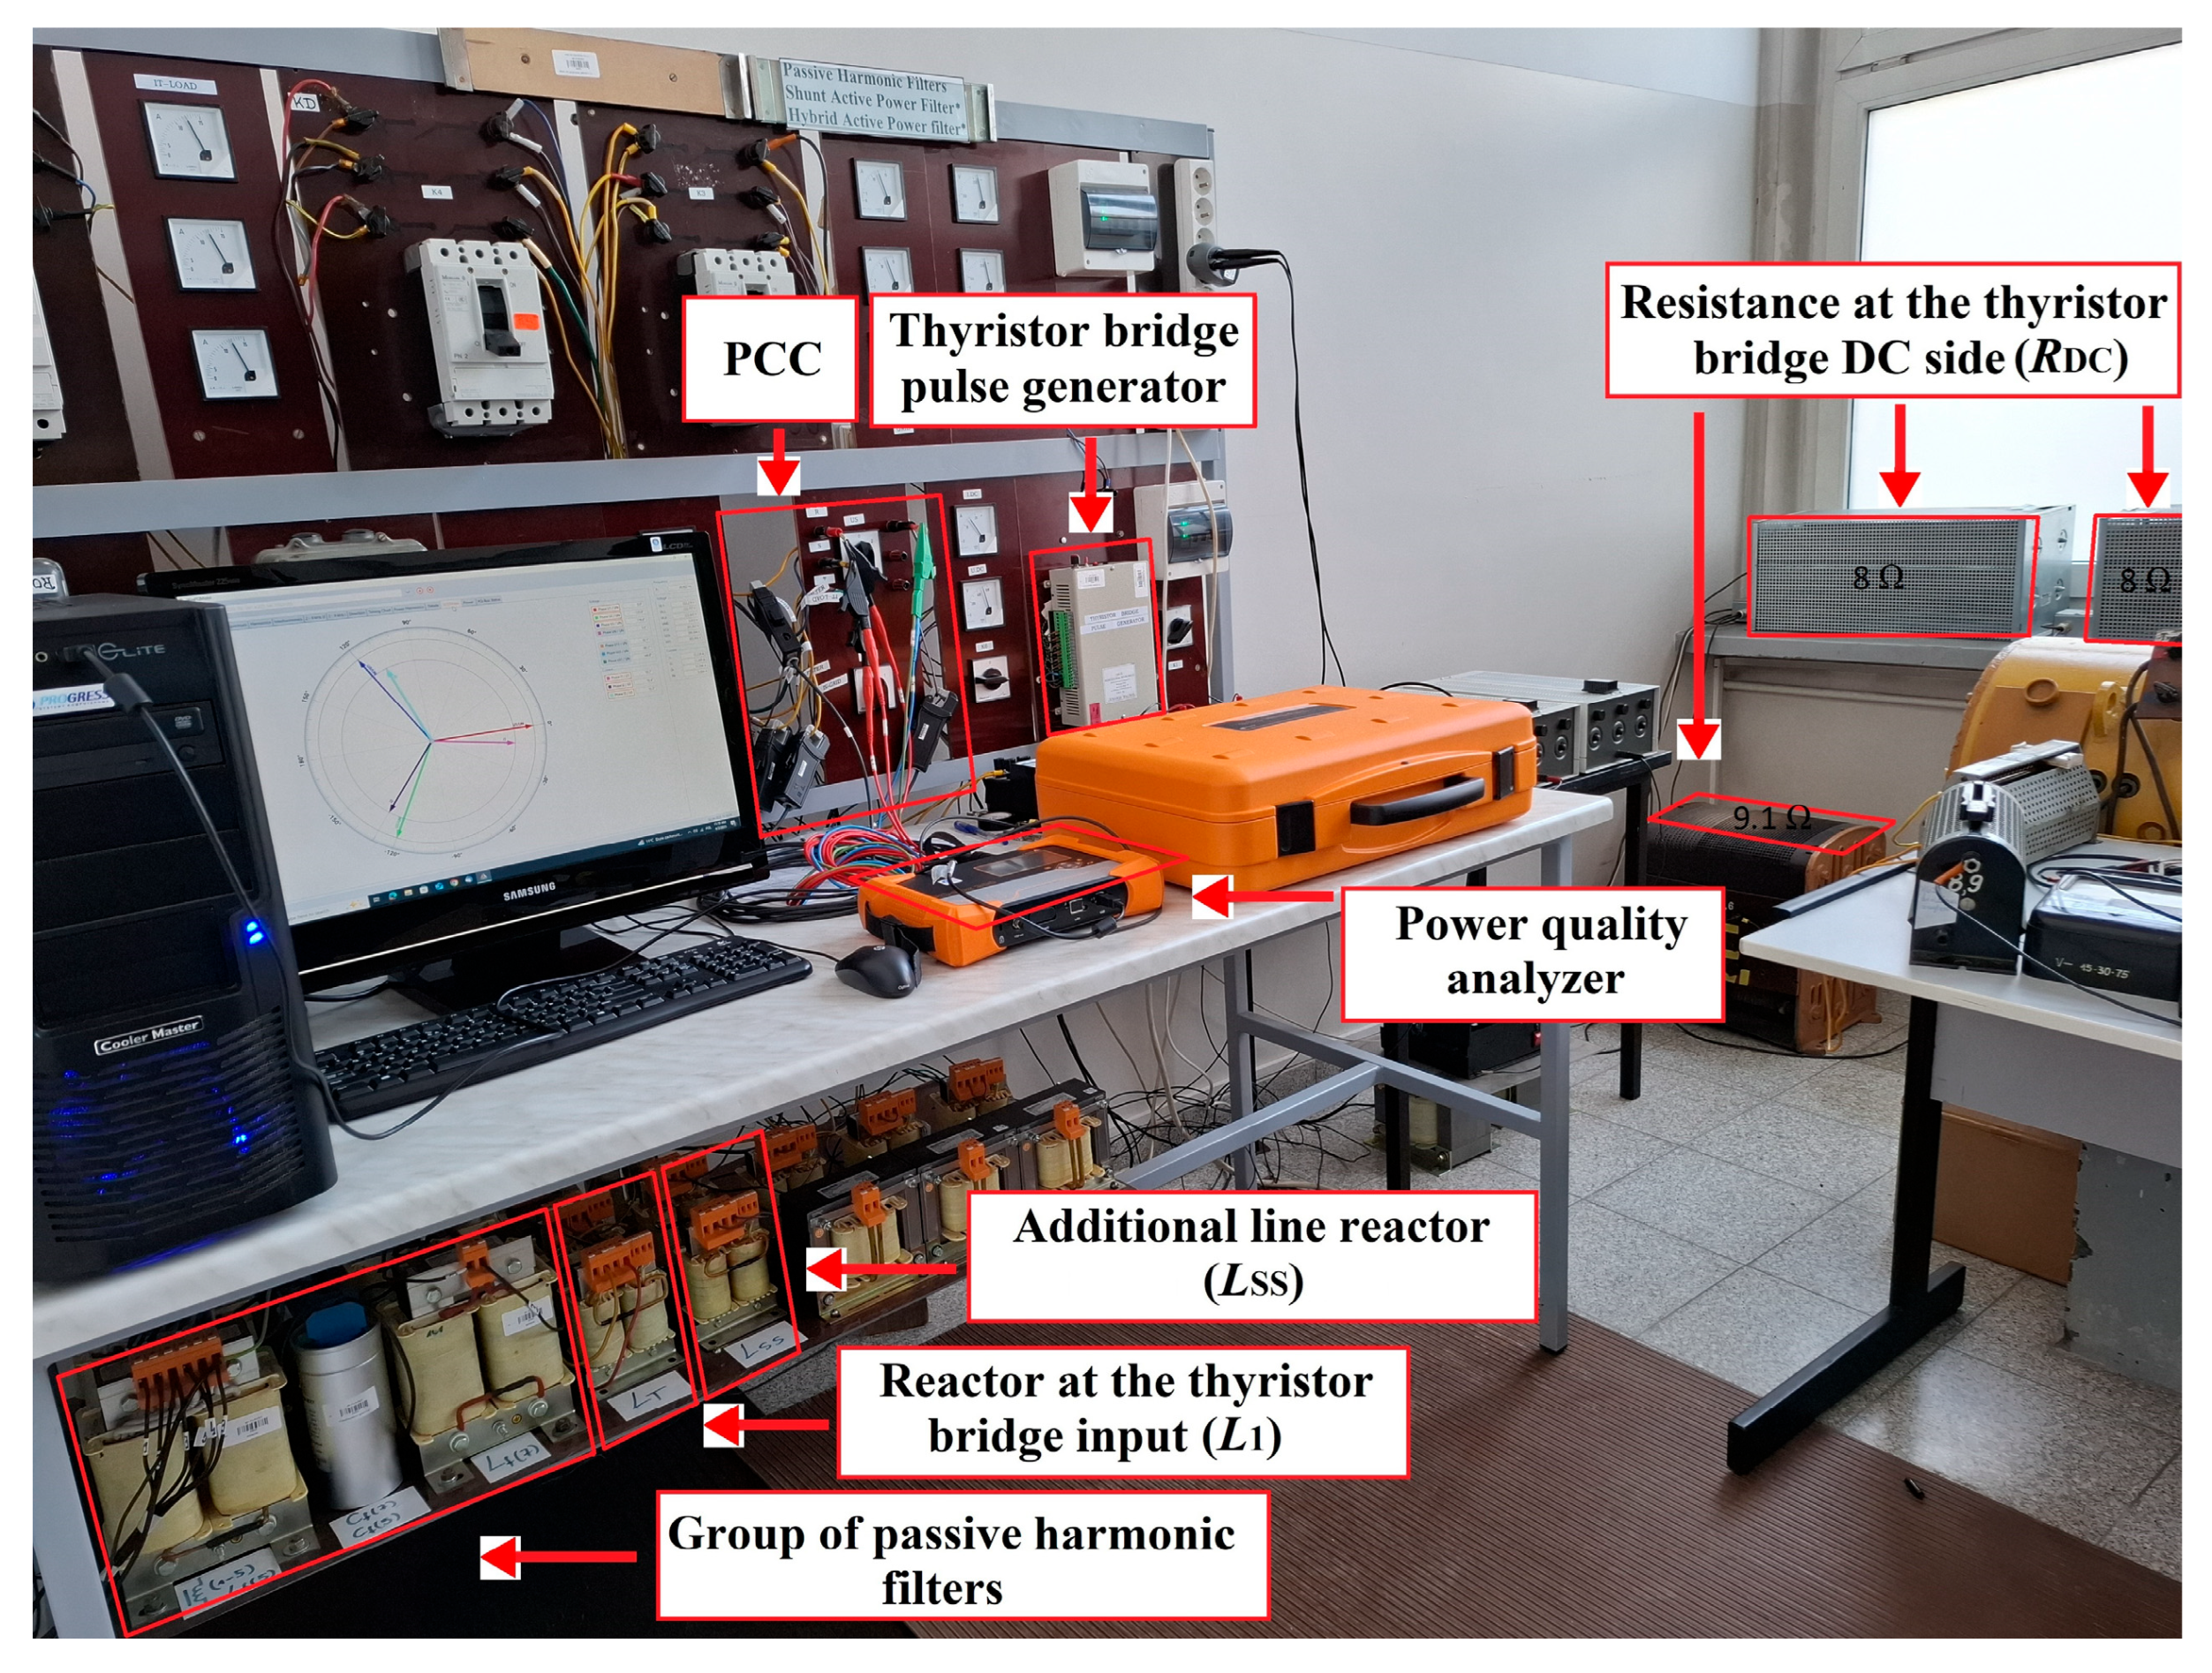
The laboratory setup is presented in Figure 2. The setup comprises the filter group, a six-pulse thyristor bridge with an input reactor (L1) at its AC side and resistance (RDC = 8 Ω + 8 Ω + 9.1 Ω) at its DC side, an additional line reactor (LSS), and a power quality analyzer [39]. The three-phase thyristor bridge pulse generator can also be seen in Figure 2. The measurements were performed at the PCC using three PQ analyzers: one connected at the grid side, and two others connected at the load and filter group sides. After connecting the analyzers, short recordings were made to obtain basic information about the electrical parameters in the system. Additionally, the recorded voltage and current time waveforms were used to calculate the harmonic values in the MATLAB environment.
Figure 2.
Laboratory stand with the tested system.
In order to know the exact operating condition of the investigated electrical system (Figure 2), the laboratory measurements (voltage and current) were taken in three work conditions:
- (a)
- Without the thyristor bridge and filter group connected (voltage measurement only);
- (b)
- With the thyristor bridge connected (firing angle (α) of ) and without the filter group (F5, F7);
- (c)
- With the thyristor bridge (α = ) and filter group connected (F5, F7).
The parameters measured using the electrical system from the three work conditions are presented in Table 2. The measurements are more focused on voltage and current harmonics because the goal is to verify the efficiency of the filter group. The PQ analyzers (e.g., PQBox300) could only show the rms values of individual harmonics; for more information (e.g., angle values), the recorded voltage and current waveforms were submitted to the Fast Fourier Transform algorithm in the MATLAB environment.
Table 2.
Parameters of the investigated electrical system under the three work conditions (measured).
The parameters of the system elements, such as resistances, reactors, and capacitors, can be obtained by reading their specifications (technical data) or by performing measurements, but it is difficult to obtain the electrical grid parameters. Therefore, the biggest challenge was to estimate the equivalent impedance of the electrical grid. In this case, the electrical grid short-circuit power (LSC = 2.24 μH) was used, as well as the transformer equivalent parameters computed based on the nominal parameters (LTr = 29.6 μH) to compute the electrical grid equivalent (LS = LSC + LTr = 31.84 μH).
Considering the additional line reactor inductance LSS (see Figure 1), the electrical grid equivalent reactor can be estimated to be LGrid = 1.53184 mH. Although the transformer nominal parameters are reliable, the grid short-circuit power is less accurate and often unavailable, even though, in this case, it has a significantly small value in comparison with other inductances; therefore, it has a small impact on the total value of the equivalent impedance. The grid equivalent inductance can also be computed based on the measured short-circuit impedance.
The grid equivalent impedance has a direct influence on the harmonic mitigation by PHFs. It is one of the factors that determines the harmonic reduction level by PHFs in the electrical system [31].
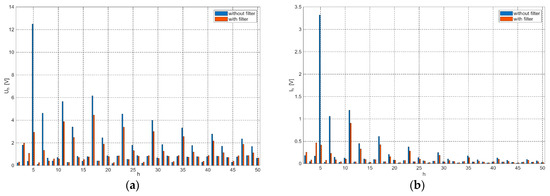
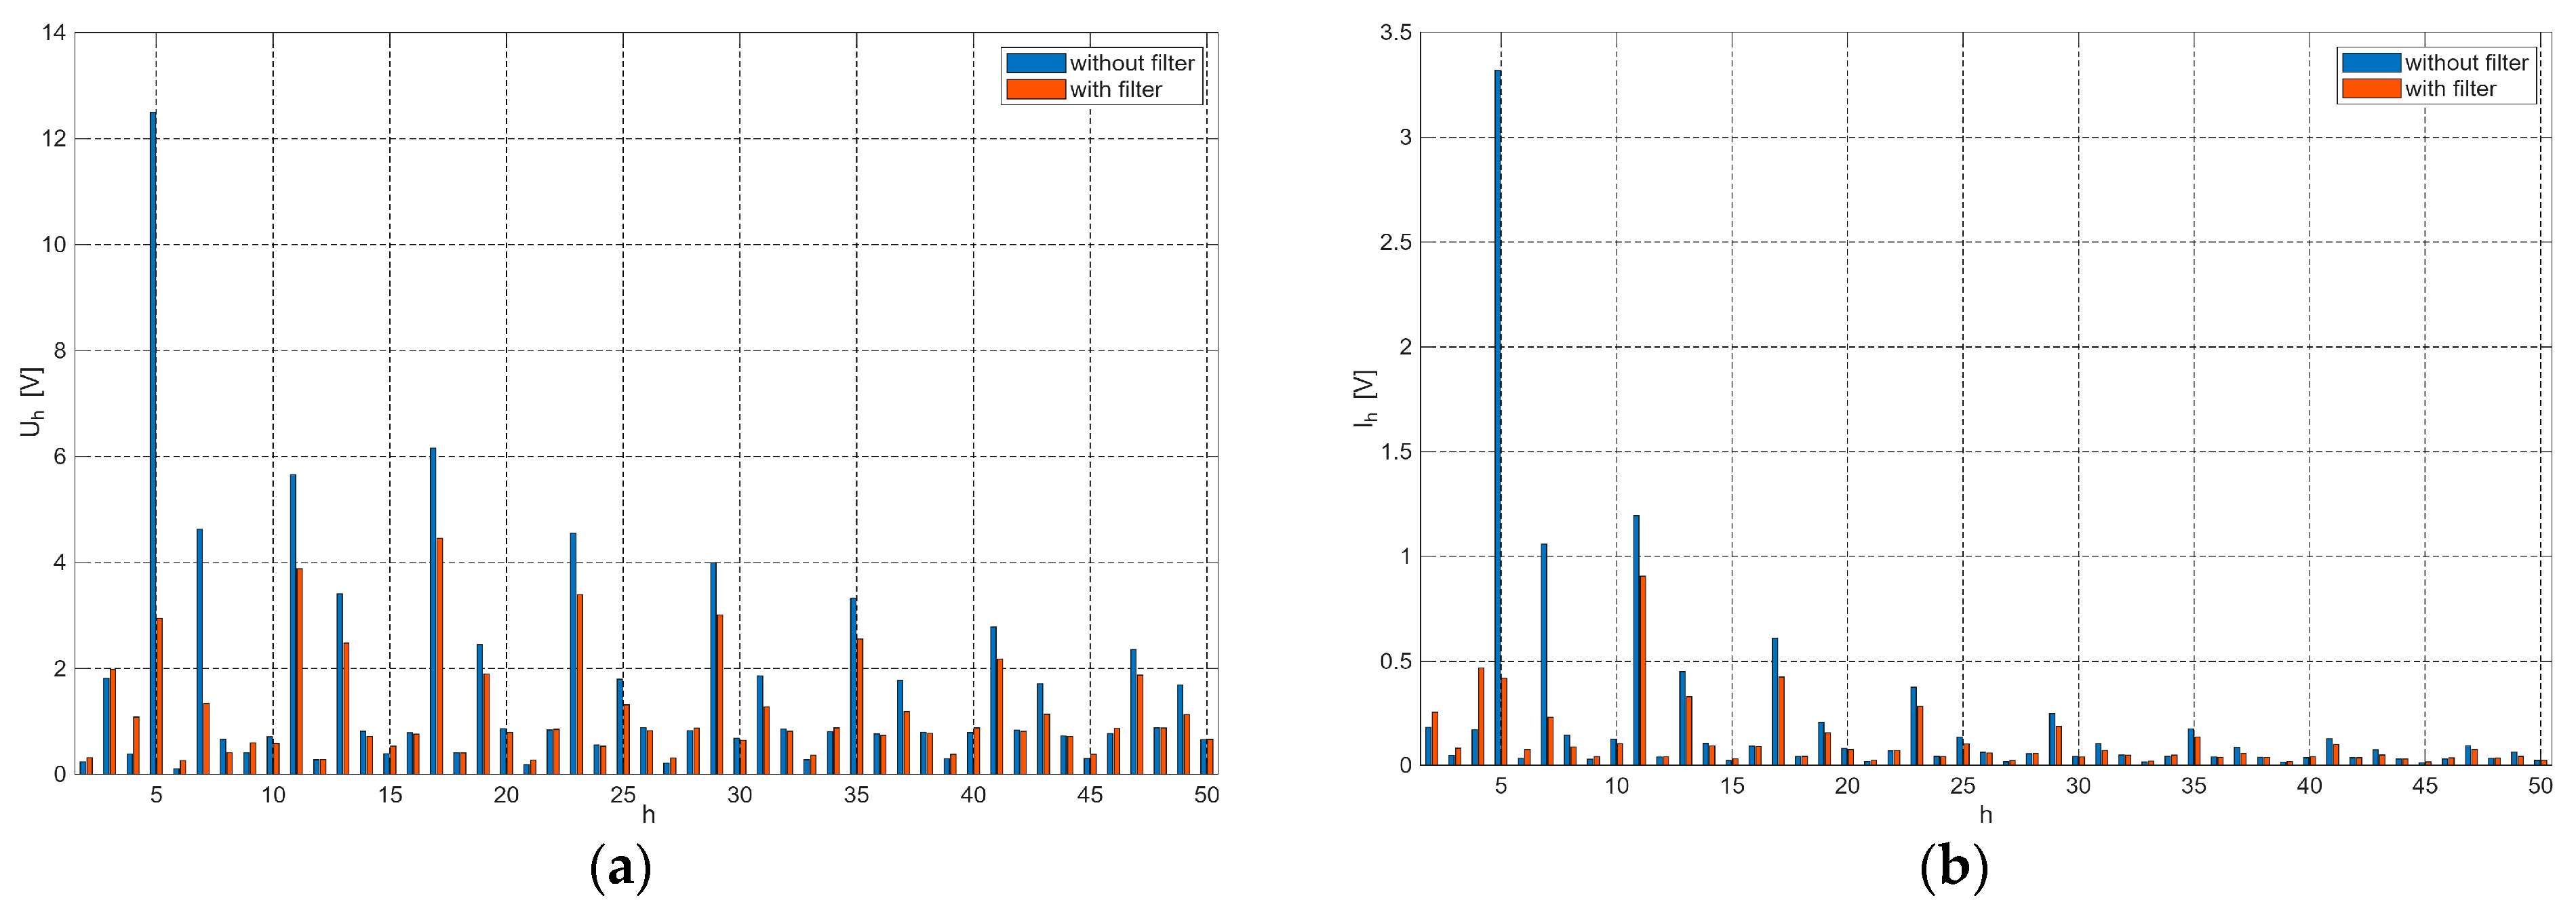
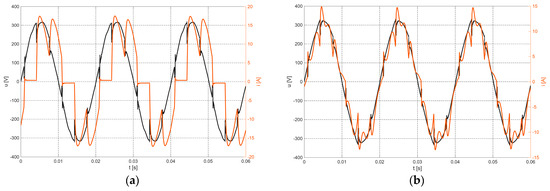
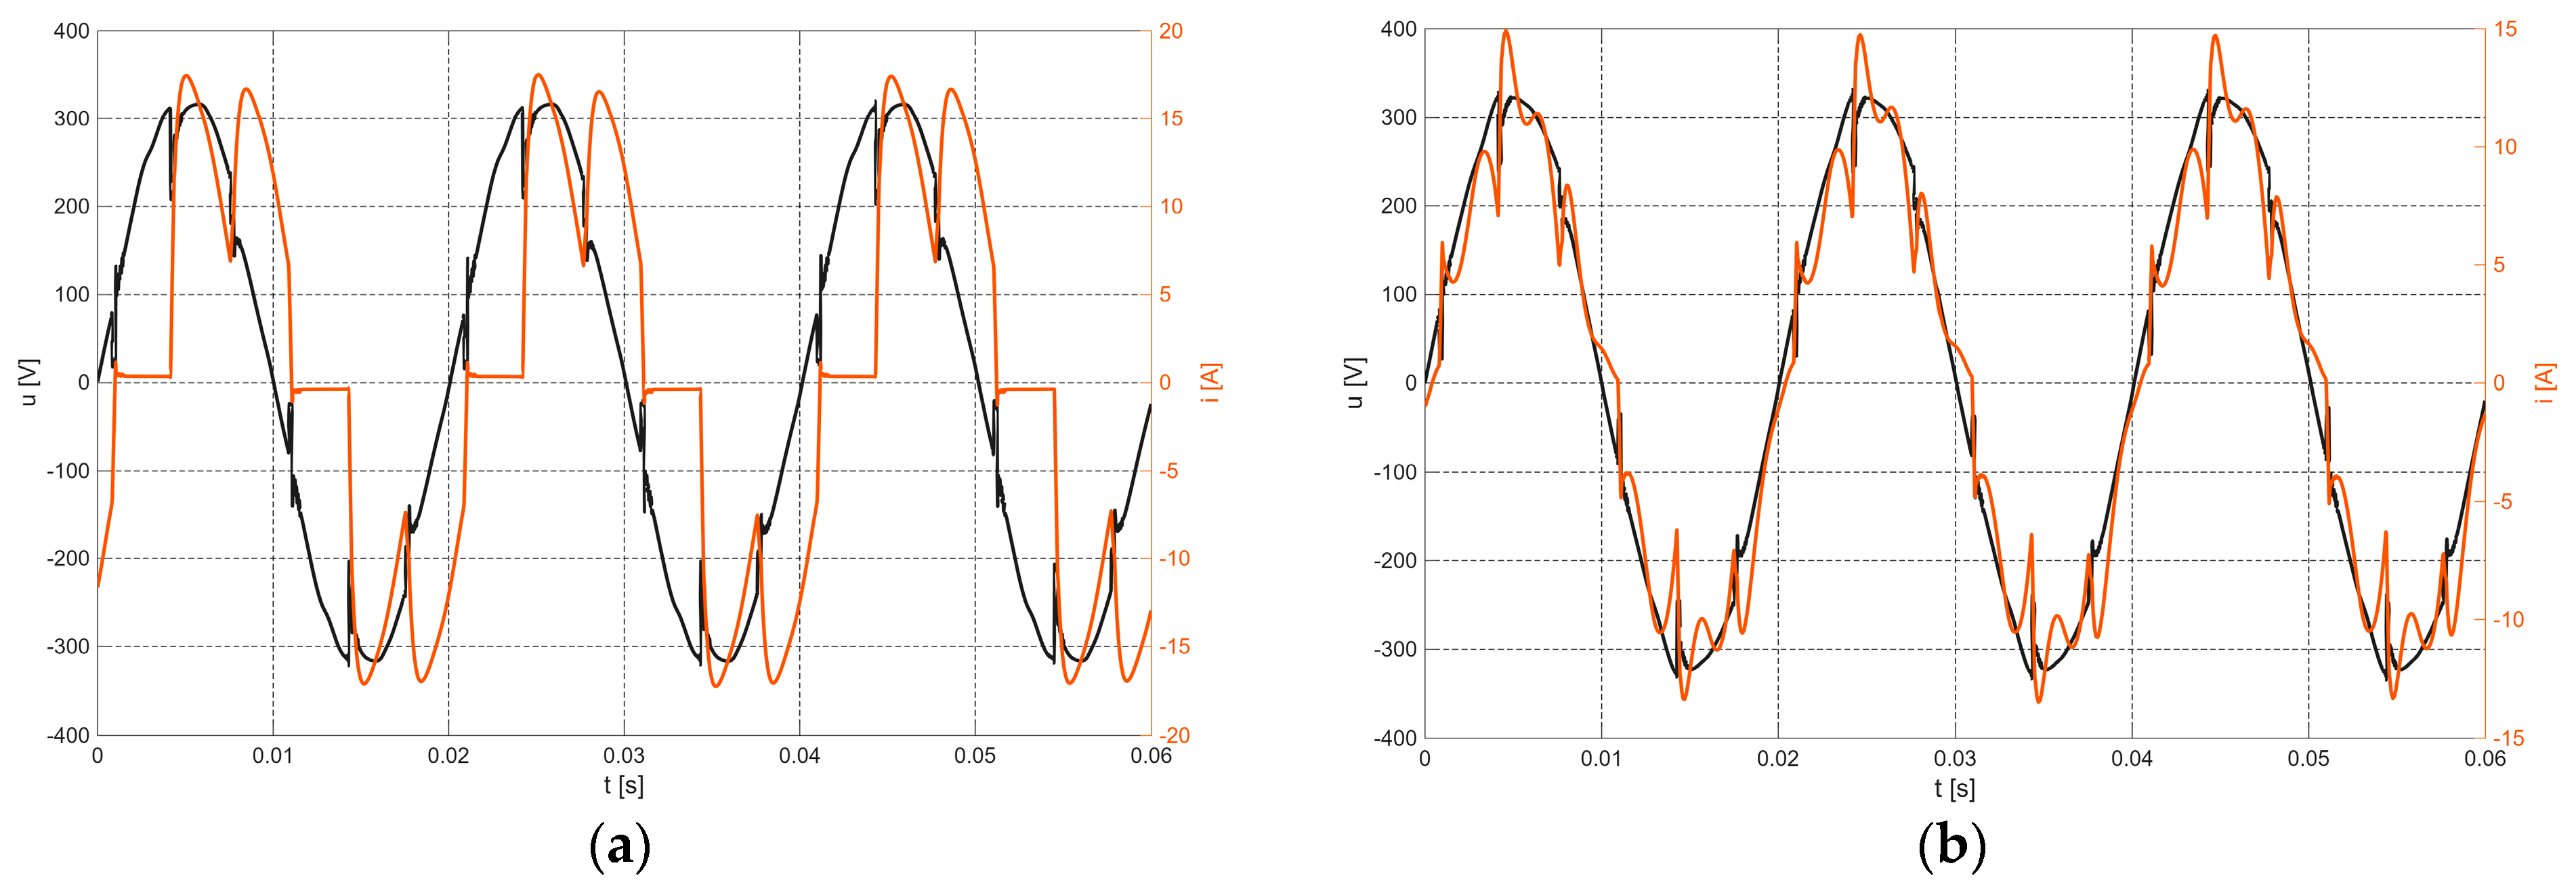
Figure 3 shows the voltage and current spectra in the system without and with the filter, and Figure 4 shows their waveforms.
Figure 3.
Spectra of the recorded voltages (a) and currents (b) in the system without and with the filter.
Figure 4.
Voltage (black) and current (red) waveforms of the system without the filter (a) and with the filter (b).
With all the parameters of the electrical system, it is possible to calculate the filter group parameters such as the harmonic reduction indexes (E5, E7, see Equation (1)) of the fifth- and seventh-order harmonics, respectively, as well as the index (ε) of the filtration efficiency, which is the sum of E5 and E7 [38]. When comparing the current fifth harmonic values before and after the filter group connection (see Table 2), it can be noticed that after the filter group connection, the fifth harmonic value (3.88 A/60.63%) flowing through the filter group (mostly through F5) is higher than the one generated by the nonlinear load (3.32 A/31.80%). This means that the F5 filter has absorbed the fifth harmonic not only from the load but also from the other systems around it. Therefore, it is difficult to determine the flow of the harmonic between the filter (S3) and the supply network (S1).
Assuming that the electrical grid is designed as a voltage source of the fundamental harmonic with equivalent reactance and neglected equivalent resistance (the resistance has a small influence on the harmonic reduction level [35,38]), the following formulas can be written (harmonic reduction index):
where the following values apply:
| — | filter group harmonic reduction index of h-order harmonic | |
| — | voltage of h-order harmonic after the filter group connection | |
| — | voltage of h-order harmonic before the filter group connection | |
| — | current of h-order harmonic at the grid side (S1), after the filter connection | |
| — | current of h-order harmonic at the grid side (S1), before the filter connection | |
| — | Complex impedance of the filter group for the h-order harmonic | |
| — | Complex impedance of the supply network for the h-order harmonic |
Based on the filter group harmonic reduction index () defined in Equation (1), E5 and E7 were computed to have values of 0.2345 and 0.2827, respectively (using harmonics voltage). Therefore, the filtration efficiency index ε, which is the sum of E5 and E7 (Equation (2)), was equal to 0.5172 [38].
3. Design of an Optimal Group of Two Single-Branch Filters
In order to evaluate the above information, an optimal group of two single-branch filters was designed according to [38]. In the quoted study, the filtration efficiency index ε, which is the sum of the harmonic reduction indexes E5 and E7, was minimized. The advantage of the presented method is its optimization based on the interaction of the filter group with the supply network. The calculated harmonic reduction index value indicates that this harmonic component will continue to flow into the network after the filter is connected. We have precise information about how much of this harmonic component will remain. If the degree of harmonic reduction is insufficient, formulas for calculating a group of filters with a given degree of harmonic reduction are presented in [38].
In order to compare the parameters of the investigated system (the real filter from the laboratory) and the designed filter (the optimal filter), the same designed parameters needed to be used (see Table 3). The optimal filter group was designed based on the parameters of the real filter group presented in Table 3.
Table 3.
Parameters (from the laboratory) used to design the optimal filter group.
Substituting the impedance relations into Equation (2), we obtain Equation (3):
The sum of the Mi indexes must be 1, so M7 = 1 − M5, which gives Equation (4) after substituting it into Equation (3):
After substituting (4) for h = 5 and h = 7 into Equation (2) and determining the derivative dε/(dM5), one can construct a system of two equations in matrix form (5) [38]:
where the following values apply:
| — | capacitive reactive power attributed to filter F5 | ||
| — | capacitive reactive power attributed to filter F7 | ||
Based on Equations (5)–(9), the sharing of the reactive power was obtained: M5 = 0.6008 and M7 = 0.3992 (the coefficients , , , and are well defined in [38]). This means that the fifth and seventh harmonic filters have reactive powers of Q5 = −878.895 Var and Q7 = −584.105 Var, respectively. Based on that, the filter group parameters are as follows: C5 = 52.405 µF, C7 = 35.552 µF, L5 = 8.1627 mH, and L7 = 6.3547 mH.
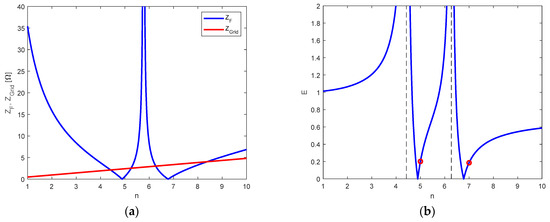
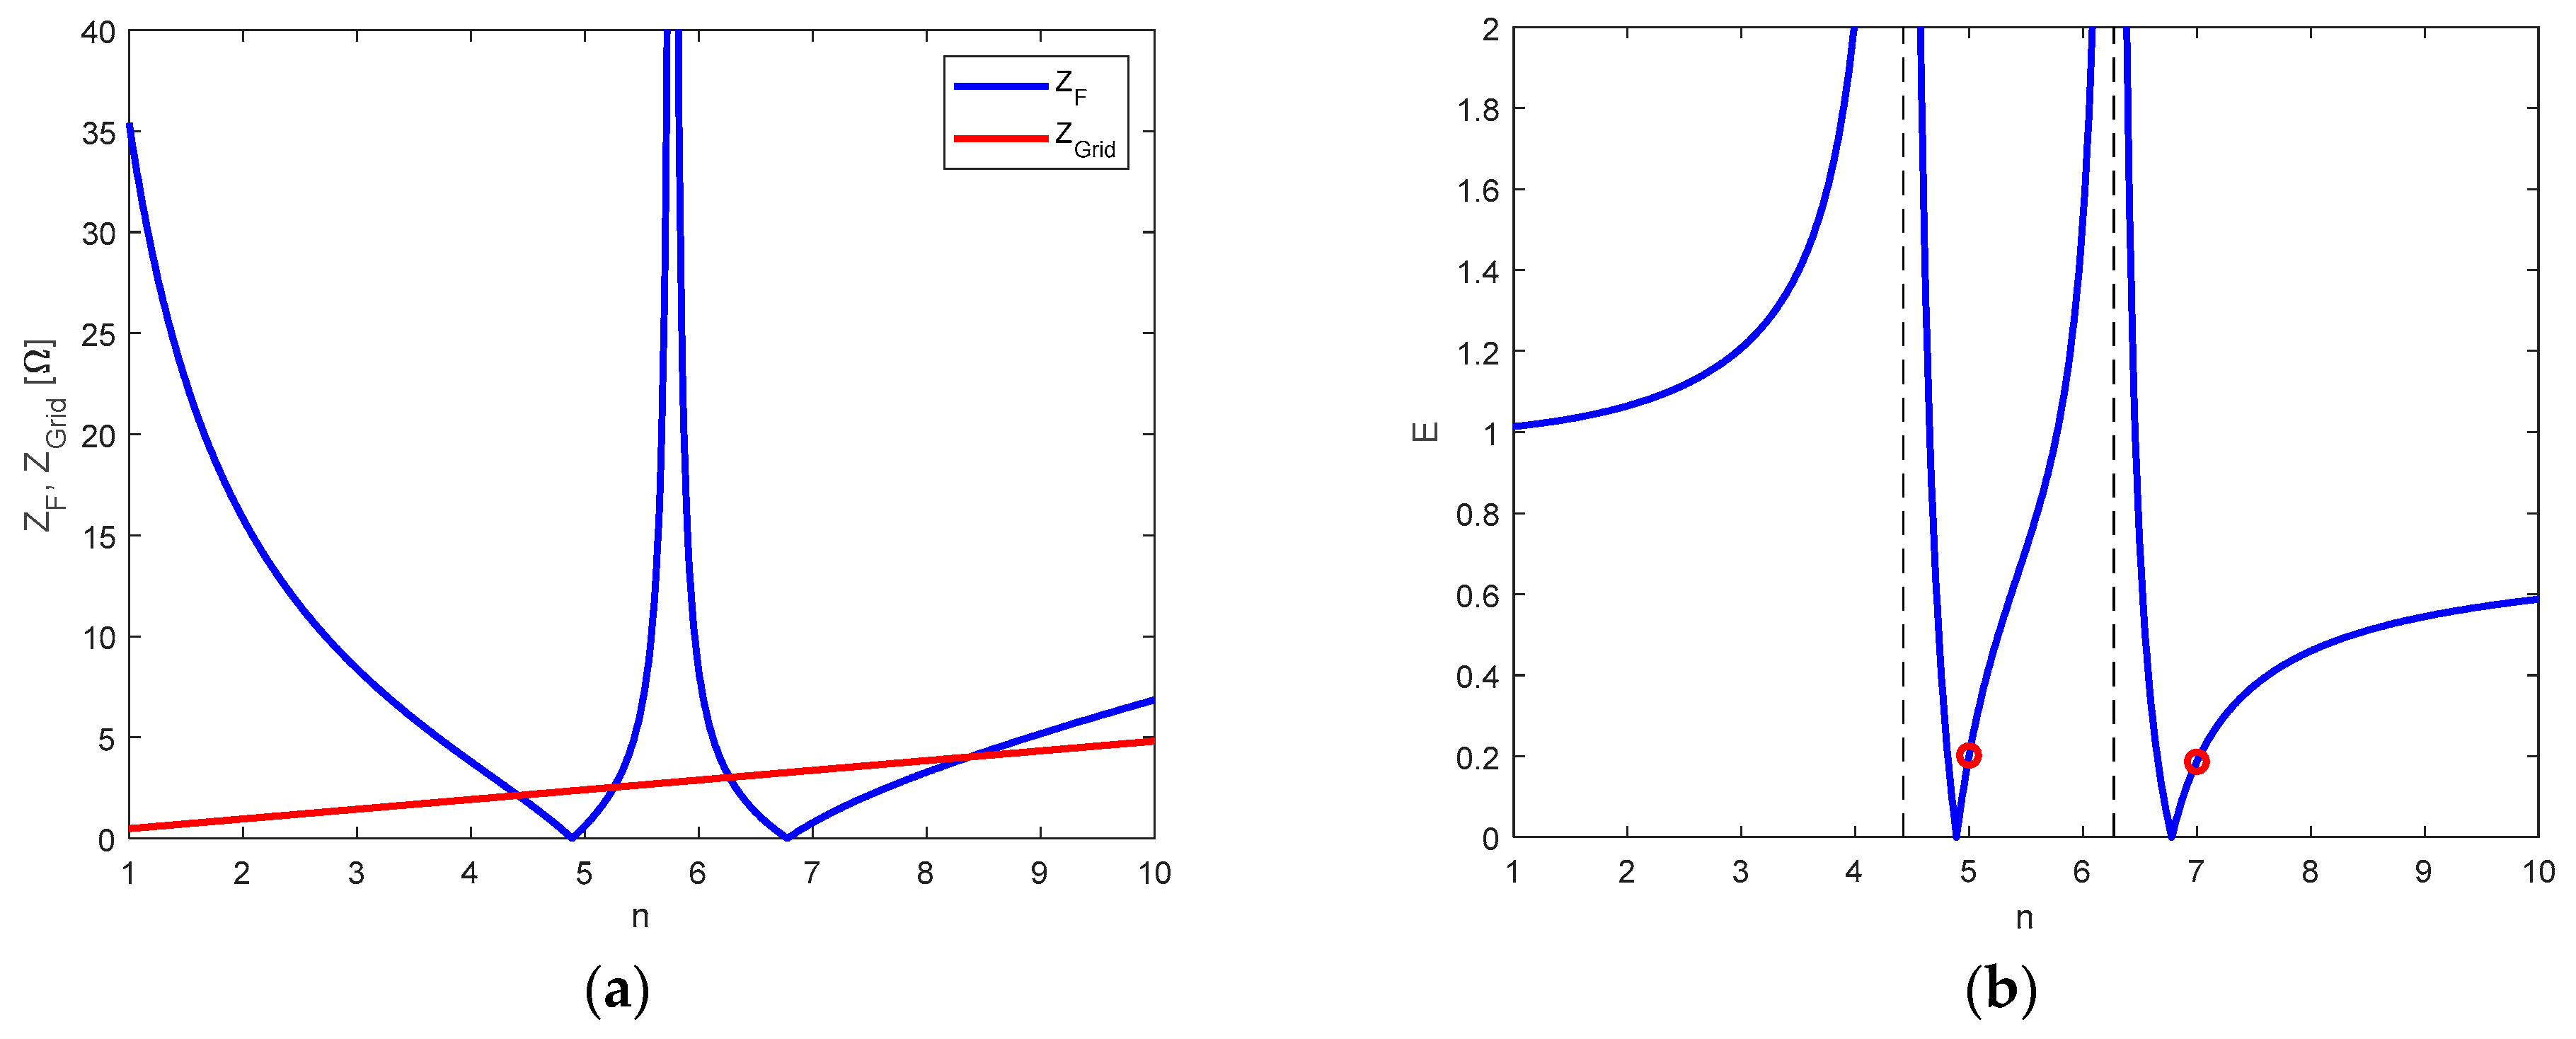
Figure 5a presents the characteristics of the filter group impedance (ZF) and those of the electrical grid equivalent impedance (ZGrid) versus the harmonic order, whereas Figure 5b shows the characteristic of the harmonic reduction index E versus harmonic order n. In Figure 5b, it is important to notice that the values above one indicate harmonic amplification. The harmonic reduction index values of the fifth and seventh harmonics (E5 = 0.2344, E7 = 0.2377) can be seen in Figure 5b. The filtration efficiency index ε is equal to 0.4721. The obtained value shows that the designed optimal filter group is more efficient than the investigated one in the real system (ε = 0.5172). The optimal filter group was designed using the same total reactive power and tuning frequency as the real filter group. The difference lies in the sharing of the total reactive power between filters, which can explain the difference in the filter capacitor capacities.
Figure 5.
Designed optimal filter group characteristics: (a) impedance and (b) harmonic reduction efficiency versus harmonic order with marked values for the 5th and 7th harmonics (red circles).
Observing the filter group impedance characteristic in Figure 5a, it can be noticed that the parallel resonance occurred at the frequency of the harmonic order r = 5.87. Figure 5b presents two parallel resonance frequencies: one between the filter group and the electrical grid (m1 = 4.36), and the other between filter group branches (m2 = 6.29). Both of them are multiples of the fundamental harmonic.
4. Comparison Between the Designed Optimal and Real Filter Groups
As previously mentioned, there is a difference in the sharing of the total reactive power between the filters in the group. This sharing has an influence on the position (r) of the parallel resonance occurring between filters, meaning that it also has an influence on the characteristic shape change in the filter group impedance versus frequency order. The value r represents the position of the maximum of that characteristic (see Figure 4a). With the increase in r, the peak of that characteristic is shifted towards high frequencies. In the filter group, this causes the reduction in the fifth harmonic impedance and the increase in the seventh harmonic impedance. The change in the filter group impedance for the selected harmonics means that the reduction level of those harmonics is changed. Consequently, it can be stated that it is possible to consciously influence the harmonic reduction level of the filter group (this was the assumption considered in [38]).
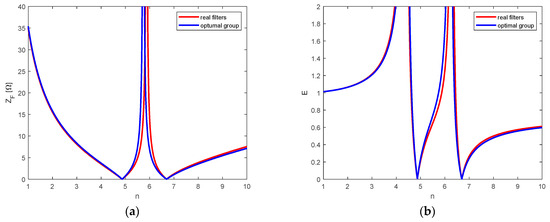
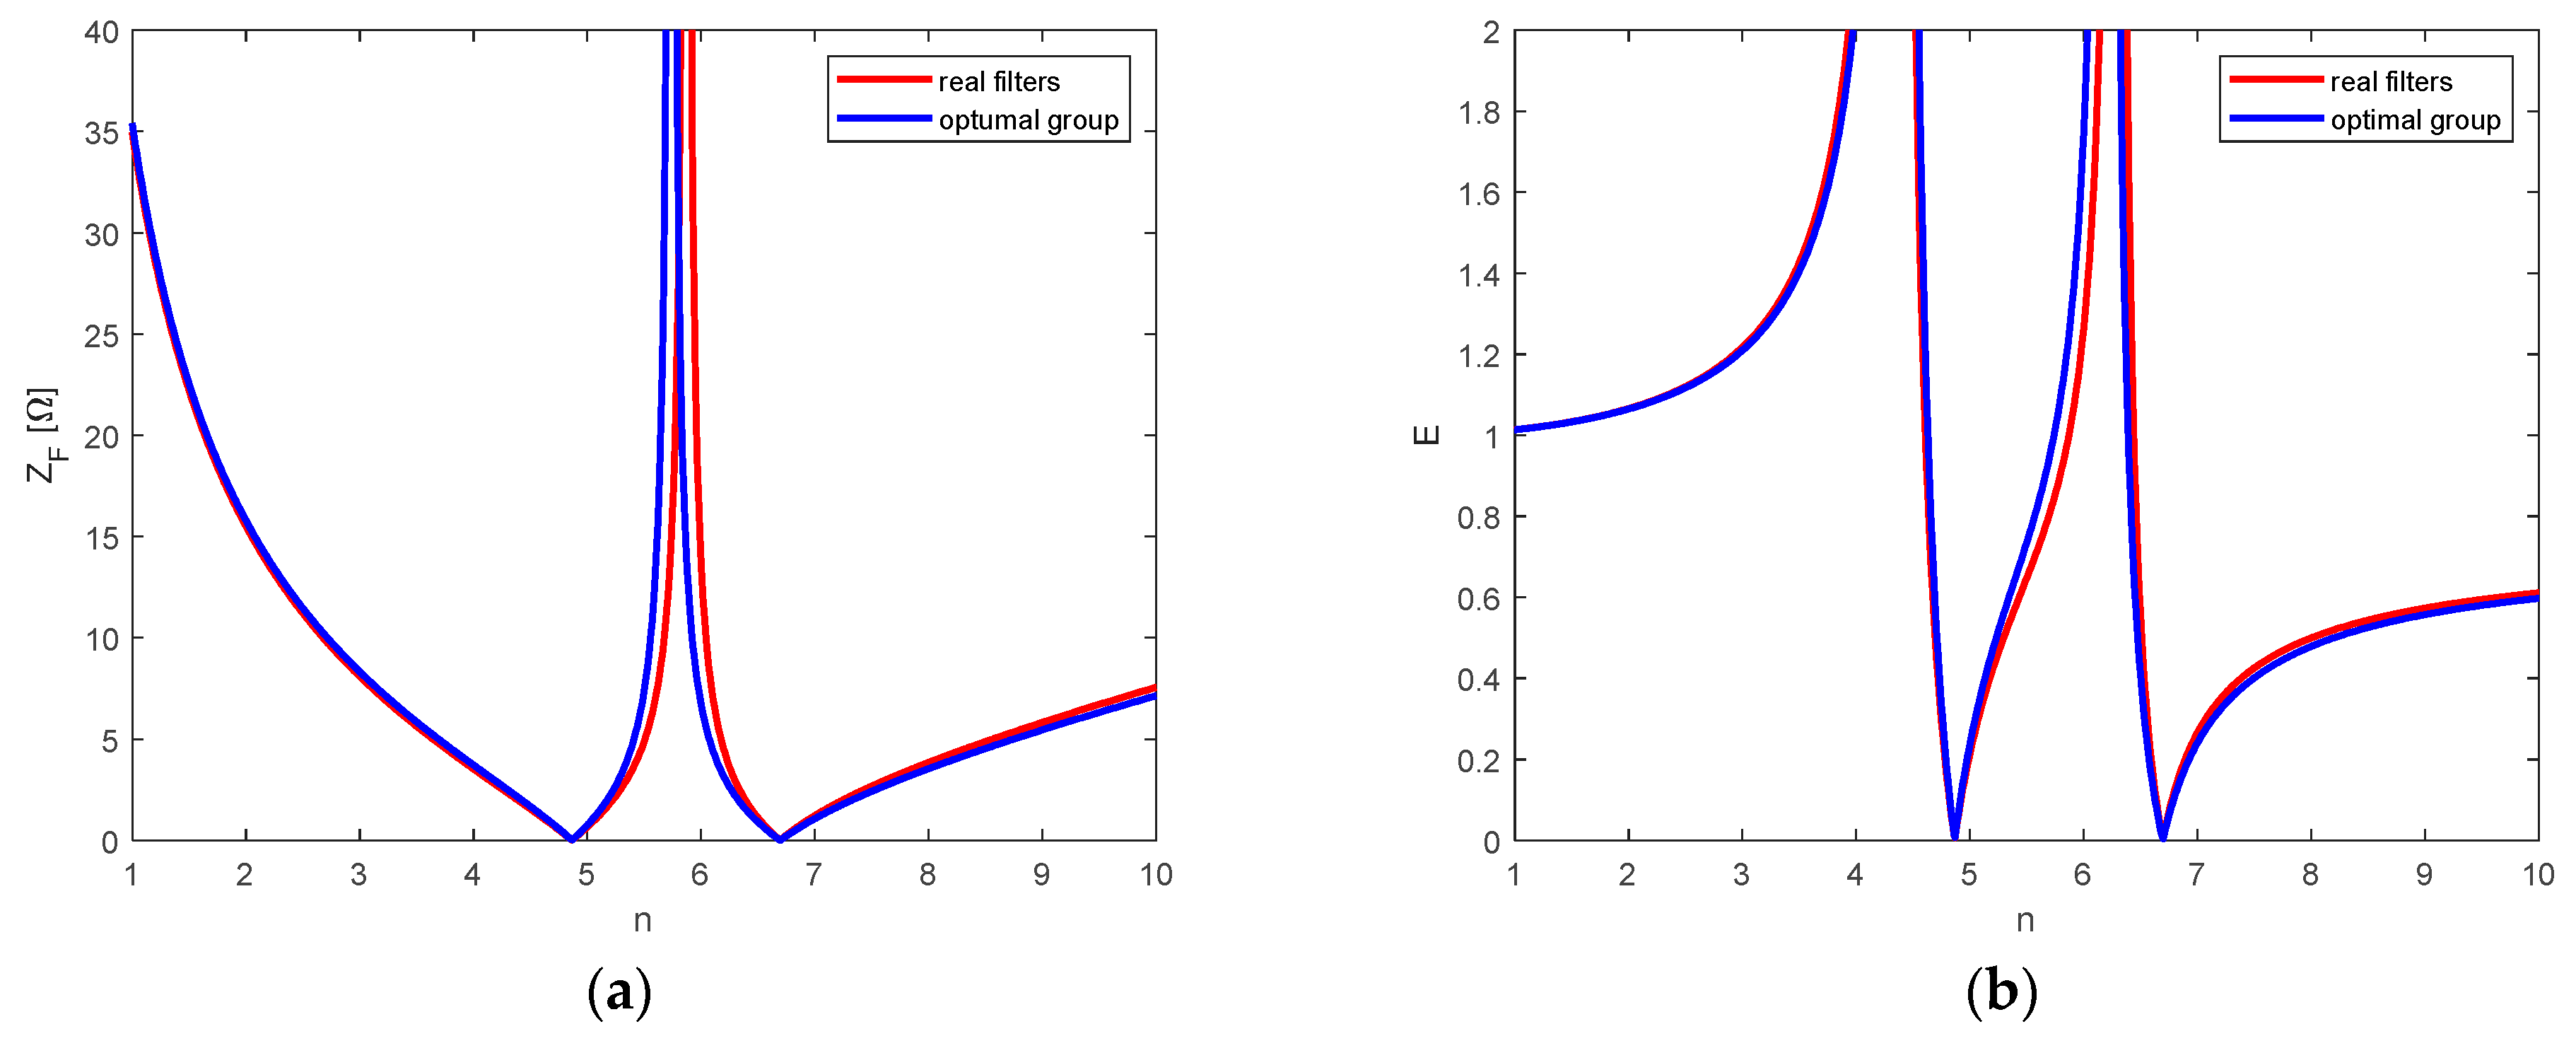
Figure 6 compares the impedance characteristics of the designed optimal filter group to those of the real filter group. It also compares the characteristics of the harmonic reduction function for both cases (Figure 6b).
Figure 6.
Comparison characteristics between the designed optimal filter and real filter groups: (a) impedance versus frequency; (b) harmonics reduction efficiency function versus frequency.
In Table 4, the parameters that characterized the designed optimal system and the real system are presented. In the case of the real system, the parameters were computed using the assumed values of L, C, and LGrid (there is a visible difference in the sharing of total reactive power between filters (M1, M2)—column (2)). In the case of the designed optimal filter (compared with the real system), less reactive power was allocated to the fifth harmonic filter and more was allocated to the seventh harmonic filter (column (3)). Consequently, the filter impedances of the fifth and seventh harmonics changed accordingly. This in turn has caused the maximum of the impedance characteristic (Figure 5a) to shift towards lower frequencies (r). As could have been predicted, the fifth harmonic reduction index (E5 = 0.2344) increased (a smaller value means greater harmonic reduction) and that of the seventh harmonic (E7 = 0.2377) decreased (comparing the values of the real system to those of the designed optimal system in Table 2). The filtration efficiency index (ε) also reduced from 0.4773 (real system) to 0.4721 (optimal system). The location of the characteristic maxima (m1, m2) changed as well. Column (4) in Table 4 shows the calculated harmonic reduction index and filtration efficiency index based on the measured harmonic values in the system.
Table 4.
Comparison between computed parameters of the designed optimal filter group and real filter group.
The coefficients for the theoretical optimal system (Table 4) are E5 = 0.2344, E7 = 2377. However, for the actual system, the coefficients based on measurements are E5 = 0.2345, E7 = 0.2827. This means that the degree of harmonic reduction for the fifth harmonic remains virtually unchanged, while the degree of harmonic reduction for the seventh harmonic increases by almost 5% (a lower value of the coefficient indicates fewer harmonics in the network).
To achieve an optimal filter, the reactive power distribution between the filters would need to be changed. Instead of a two-thirds power division for the fifth harmonic filter and a one-third power division for the seventh harmonic filter, the reactive power distribution would need to be divided into 60% for the fifth harmonic filter and 40% for the seventh harmonic filter. This would result in a change in the filter capacitance: reducing C5 by 10% and increasing C7 by 20% (assuming other parameters such as U, Q, n5, and n7 remain unchanged).
Changing both capacitances is undoubtedly expensive. Looking at the filter tuning, the detuning of the seventh harmonic filter is much greater than that of the fifth harmonic filter. If the tuning frequency of the seventh harmonic filter is increased to n7 = 6.8668 by reducing the filter’s inductance by 5%, the same effect will be achieved, i.e., the seventh harmonic flowing into the grid will be reduced by 10%.
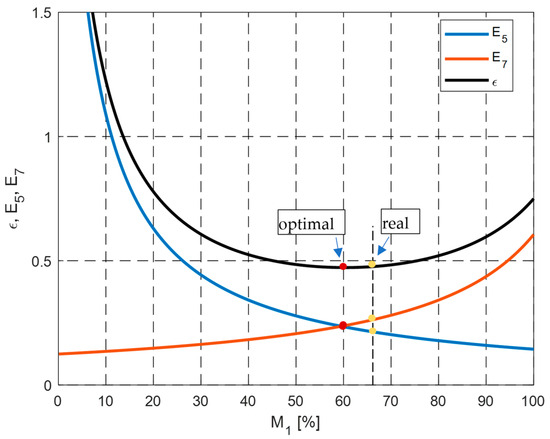
Figure 7 presents the characteristics of the fifth and seventh harmonic reduction indexes (E5, E7) and the filter group filtration efficiency index (ε) versus the reactive power share of the fifth harmonic filter M1. With the increase in M1, the harmonic reduction index of the seventh harmonic (E7) increases, whereas that of the fifth harmonic (E5) reduces. The characteristic of the filtration efficiency index (ε) presents a visible minimum, which indicates that the system is optimal. On that characteristic (ε), the real system is on the right side of the designed optimal system.
Figure 7.
Characteristics of harmonic reduction indexes (E5, E7) and filtration efficiency index (ε) versus the reactive power share of the 5th harmonic filter (M1).
It is worth paying attention to the fact that in a certain interval of the M1 (small values), the coefficient of the fifth harmonic reduction index (E5) is higher than one; this indicates the fifth harmonic amplification.
The dynamic of the change in the filtration efficiency index (ε) values in the interval of M1 from 50% to 70% is small, but the variation in the harmonic reduction indexes is considerable. It is possible to design the filter group by assuming the value of one of the harmonic reduction indexes (E), as indicated in [38].
When comparing the values of the harmonic reduction indexes (E5, E7) for the real filter, in the case of values computed based on parameters L, C, and LGrid and on the basis of the measured data (first and third column in Table 2), a difference is visible. That difference results from the overestimated value of the grid equivalent inductance LGrid. It is one of the most difficult values to estimate. Frequent changes in the power grid (switching and modernization) cause a short-circuit power change. Therefore, the short-circuit power value given in the technical documentation should be considered an approximative value. It is important to verify that value.
The change in design conditions, i.e., the change in the value of n7 from 6.69 to 6.86, necessitates the determination of a new optimal reactive power distribution between filters. Based on Formulas (5)–(9), a new group of optimal filters was determined: Q5 = −958.836 Var and Q7 = −504.164 Var, C5 = 57.17 µF, C7 = 30.72 µF, L5 = 7.48 mH, and L7 = 6.99 mH. The summary of the calculated parameters of both the optimal groups and the real filter group is shown in Table 5.
Table 5.
Comparison between computed parameters of both the designed optimal filter groups and the real filter group.
The reactive power distribution between the filter branches for the real filters and the second optimal group design is similar, as confirmed by the similar values of capacitances C5 and C7. The fifth harmonic reduction index remained almost unchanged. The seventh harmonic reduction index changed significantly, which was to be expected with an increase in the n7 value. The filter efficiency factor ε also reduced.
It seems that the designer of the filter group correctly selected the filter capacities (in terms of the division of reactive power between the filters M1 = 2/3, M2 = 1/3) and the inductance L5, but for unknown reasons implemented too high a value of L7.
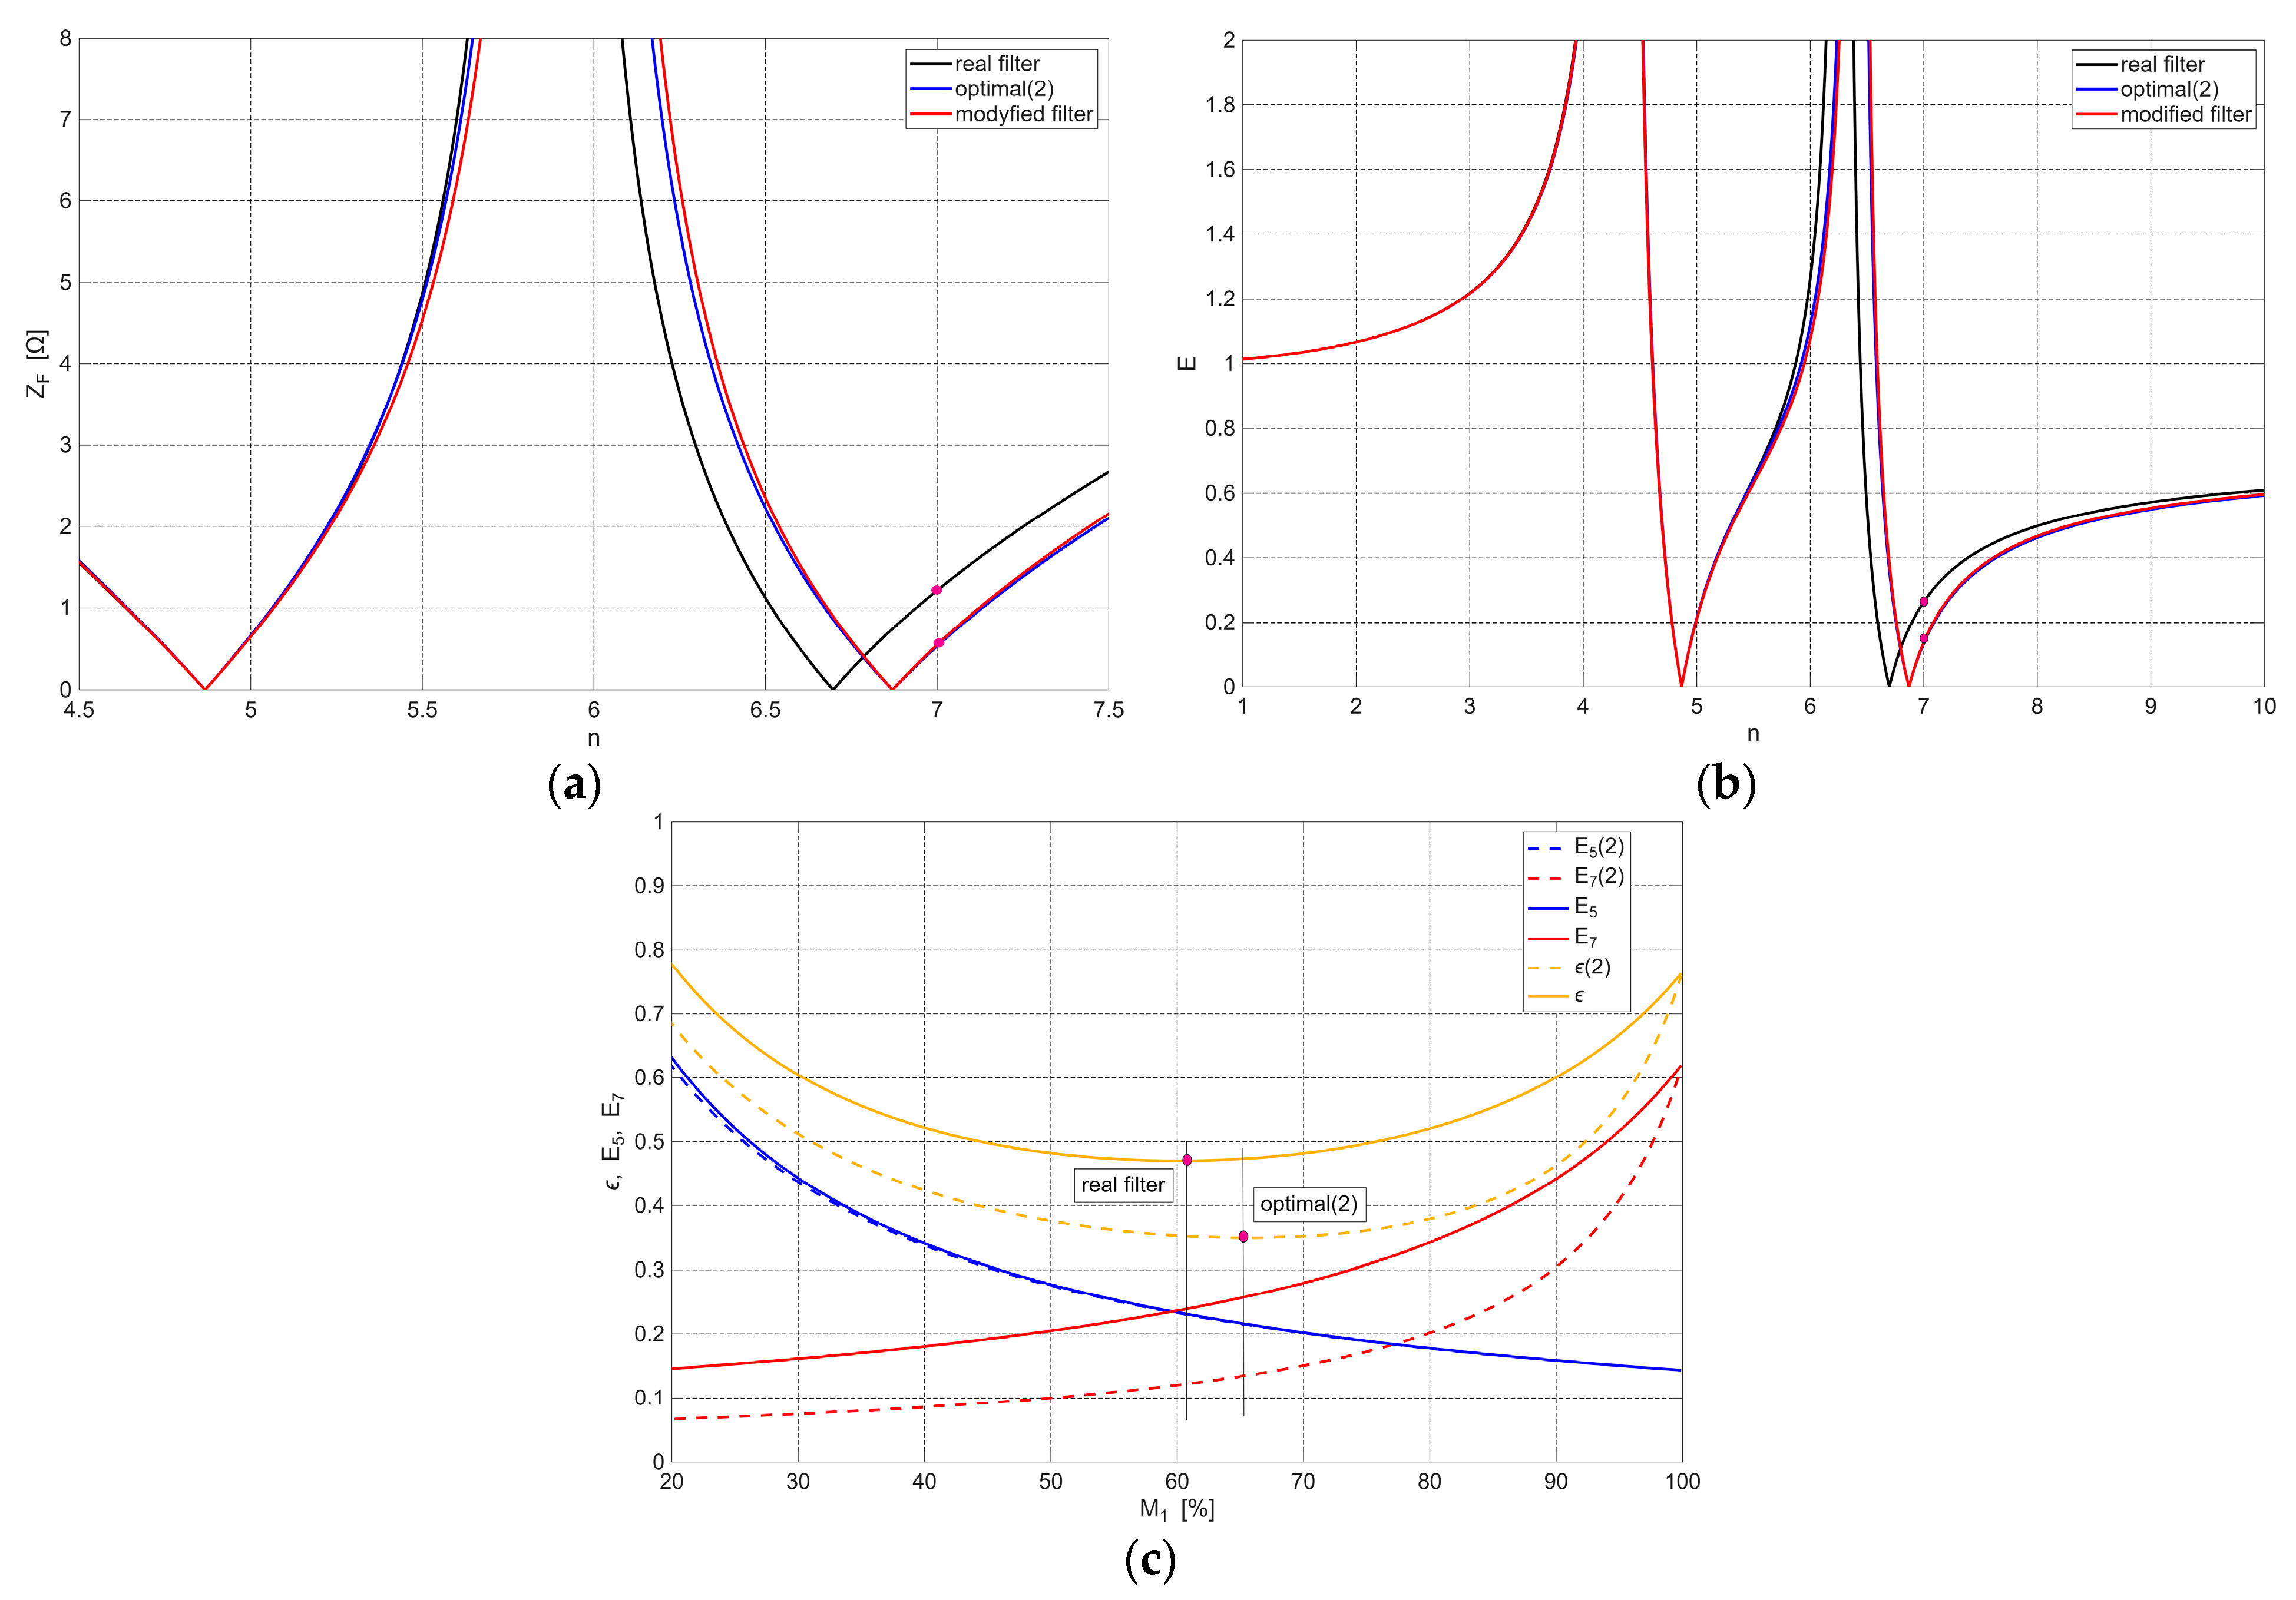
Figure 8a shows the impedance characteristics of the real filters, the optimal second filter group, and the group with modified L7 inductance. Figure 8b shows a graph of the harmonic reduction function for the same cases. Both graphs show a reduction in filter impedance and, consequently, a reduction in the harmonic reduction index for the seventh harmonic.
Figure 8.
Comparison characteristics between the designed optimal (2), the modified filter with reduced L7 value, and the real filter group: (a) impedance versus frequency; (b) harmonics reduction function versus frequency; (c) characteristics of harmonic reduction indexes (E5, E7) and filtration efficiency index (ε) versus the reactive power share of the fifth harmonic filter (M1).
The graph of the reduction indexes of the fifth and seventh harmonics and the filter efficiency index as a function of the reactive power share of the fifth harmonic filter (M1) for two cases (the real filter—continuous line, and the second optimal group—dashed line) are shown in Figure 8c. The fifth harmonic filter does not change much, so the harmonic reduction index E5 for both cases is almost the same, but there is a significant difference in the reduction of the seventh harmonic. This results in significant changes in the filter efficiency index ε.
The conclusion is that it is desirable to reduce the inductance of L7, which will bring the filter tuning frequency closer to the reduced harmonic, reduce the filter impedance for this harmonic, increase the reduction of the seventh harmonic, and bring the reactive power division between the filters closer to the optimal division (Project 2).
5. Conclusions
Distributed energy sources are being installed increasingly frequently, simultaneously enabling the island operation of isolated areas. This means that the power quality parameters of isolated networks need to be ensured, and energy distribution needs to be optimized. For this reason, passive power filters are increasingly being installed for selected, larger loads. Active filters are becoming increasingly cheaper and offer many advantages, but passive filters are technologically simpler, less prone to failure, and much less expensive. For this reason, passive filters are and will remain the first choice for a long time to come.
When designing a group of simple filters, the most important decision a designer must make is how to allocate reactive power between the filter branches. There are several methods that can be used to allocate reactive power, but none of them are optimal [35]. The author of [38] demonstrated how to use the optimal method to allocate reactive power between filter branches (maximizing the sum of the harmonic reduction indexes). He also demonstrate how to design a group of simple filters with the assumed value of the harmonic reduction index in one of the selected harmonics. The presented filter design method considers filter detuning for selected harmonics and the short-circuit power of the supply network, as these parameters determine the filtration efficiency. These are the most important parameters affecting filtration efficiency. The equivalent network impedance should be obtained by measurement whenever possible, as power systems change as a result of various processes, such as aging, and are also subject to modernization. The presented method indicates the minimum characteristic of the filtration efficiency index ε, which is valuable to engineers. Knowing the reductions that can be achieved for individual harmonics allows for adjustments to be made based on other system parameters and economic considerations. However, the starting point should be the optimal reactive power allocation.
This study verifies the filtration efficiency of a real two-harmonic filter with an optimally designed filter while maintaining the same total passive power and the same filter tuning frequencies.
The presented comparison shows that the real filter is not optimally designed. The designer, either consciously or not, increased the degree of reduction in the fifth harmonic at the expense of the degree of reduction in the seventh harmonic. A small improvement in the fifth harmonic reduction results in a significant deterioration in the degree of the seventh harmonic reduction. Another reason for the suboptimality of the real filter is the availability of capacitors with calculated capacitances. Capacitors can be combined through series–parallel connections, but this always increases the design cost. The division of capacitance determines the division of reactive power. Chokes can be adapted to most design requirements. Choke taps can be used in inductance increments of 0.5%. In the case of the analyzed filter, significant detuning of the seventh harmonic filter is visible. This can be improved by reducing the inductance of the seventh harmonic filter (changing the tap or unwinding the choke) because changing the capacitance would involve replacing the capacitor, which would lead to increased costs and reduce the filter’s ability to reduce reactive power.
The article also presents a second optimal filter design for modified design assumptions. The tuning frequency of the seventh harmonic filter was increased. In this case, it turned out that the real filter capacitances could have been correctly selected, as they are almost identical to the optimal calculations in the second design. This may indicate a second possibility: the designer’s reactive power division was correct, but the choke was incorrectly designed, assuming an excessively high inductance. In this case, reducing the inductance is possible at a relatively low cost.
These two projects demonstrate the importance of selecting initial design parameters. The method used enables the rapid analytical determination of parameters for a group of simple filters, for which the minimum sum of harmonic reduction indexes is achieved. Nothing better can be achieved with the assumed design parameters. Only in the next step can compliance with other parameters be verified: power quality, voltage drops, power losses, and economic parameters, which are obviously important.
Author Contributions
Conceptualization, R.K. and C.S.A.M.; Methodology, R.K.; Formal analysis, R.K. and C.S.A.M.; Writing—original draft, R.K. and C.S.A.M. All authors have read and agreed to the published version of the manuscript.
Funding
Research project partly supported by program “Excellence initiative—research university” for AGH University of Krakow.
Data Availability Statement
The original contributions presented in the study are included in the article, further inquiries can be directed to the corresponding authors.
Conflicts of Interest
The authors declare no conflict of interest.
References
- Math, H.J.B.; Irene, Y.H.G. Signal Processing of Power Quality Disturbances; El-Hawary, M.E., Ed.; IEEE Press Series on Power Engineering; John Wiley and Sons, Inc.: Toronto, ON, Canada, 2006. [Google Scholar]
- Bollen, M.H.J. What is power quality? Electr. Power Syst. Res. 2003, 66, 5–14. [Google Scholar] [CrossRef] [Scilit]
- Thaktur, P.K.G.; Neelbrata, R. Power Systems: Principles, Practices, and Innovation, 1st ed.; Academic Guru Publishing House: Bhopal, India, 2024. [Google Scholar]
- Muhyaddin, R.; Ziad, M.A.; Shady, H.E.A.A. Power Quality and Hosting Capacity. In Power Quality Harmonics Management in Modern Power Systems, 1st ed.; Muhyaddin, R., Ziad, M.A., Shady, H.E.A.A., Eds.; IntechOpen: London, UK, 2024; pp. 3–23. [Google Scholar]
- Hasan, E.; Erdem, C.; Pinar, M.C.; Fatih, G.; Abdulkerim, I. Harmonic problems in renewable and sustainable energy systems: A comprehensive review. Sustain. Energy Technol. Assess. 2021, 48, 101566. [Google Scholar] [CrossRef] [Scilit]
- Sajid, H.Q.; Mohd, W.M. Review on active filters and its performance with grid connected fixed and variable speed wind turbine generator. Renew. Sustain. Energy Rev. 2016, 57, 420–438. [Google Scholar] [CrossRef] [Scilit]
- Reza, S.; Navid, M.A.; Yaser, N.; Ahmad, R.; Ali, R.T.; Navid, J.; Ali, H.; Hossein, S. A survey of voltage sags and voltage swells phenomena in power quality problems. Int. J. Sci. Res. Manag. (IJSRM) 2013, 9, 458–462. Available online: https://www.ijsrm.net/index.php/ijsrm/article/view/195 (accessed on 1 March 2020).
- Manisha, T.; Khan, M.I.; Sandeep, G. A comprehensive study of voltage swell and sag in power distribution systems: Characteristics, causes, effects, and mitigation strategies. J. Electr. Syst. (JES) 2024, 20, 960–972. [Google Scholar] [CrossRef] [Scilit]
- Bhim, S.; Ambrish, C.; Kamal, A.-H. Power Quality: Problems and Mitigation Techniques; John Wiley & Sons Ltd.: Chichester, UK, 2015. [Google Scholar]
- Klempka, R. Optimal Double-Tuned Filter Efficiency analysis. IEEE Trans. Power Deliv. 2020, 36, 1079–1088. [Google Scholar] [CrossRef] [Scilit]
- Jinhao, W.; Min, Z.; Shengwen, L.; Tingdong, Z.; Huijie, D. Passive filter design with considering characteristic harmonics and hamonic resonance of electrified railway. In Proceedings of the IEEE International Conference on Mechanical and Intelligent Manufacturing Technologies, ICMIMT, Cape Town, South Africa, 3–6 February 2017. [Google Scholar]
- Sina, S.; Saeid, E.; Mohammad, H.R.K. Passive harmonic filter design considering voltage sag performance—Applicable to large industries. IEEE Trans. Power Deliv. 2022, 37, 1714–1722. [Google Scholar] [CrossRef] [Scilit]
- Zobaa, A.M.; Abdel Aleem, S.H.E.; Youssef, H.K.M. Comparative analysis of double-tuned harmonic passive filter design methodologies using slime mould optimization algorithm. In Proceeding of the IEEE Conference on Texas Power and Energy, TPEC, College Station, TX, USA, 2–5 February 2021. [Google Scholar]
- Klempka, R. An arc furnace as a source of voltage disturbances-A statistical evaluation of propagation in the supply network. Energies 2021, 14, 1076. [Google Scholar] [CrossRef] [Scilit]
- Azebaze, M.C.S.; Hanzelka, Z. Passive Harmonic Filters. In Power Quality in Future Electrical Power Systems, 1st ed.; Zobaa, A.F., Shady, H.E.A.A., Eds.; IET the Institution of Engineering and Technology: London, UK, 2017; pp. 77–127. [Google Scholar]
- Bhim, S.; Vishal, V.; Vipin, G. Passive hybrid filter for varying rectifier loads. In Proceedings of the IEEE International Conference on Power Electronics and Drives Systems, PEDS, Kuala Lumpur, Malaysia, 28 November–1 December 2005. [Google Scholar]
- Abdelhamid, H.; Salem, R.; Kamal, A.-H. A Hybrid passive filter configuration for VAR control and harmonic compensation. IEEE Trans. Ind. Electron. 2010, 57, 2419–2434. [Google Scholar] [CrossRef] [Scilit]
- Yap, H.; Mohd, A.M.R.; Muhammad, A.A.M.Z.; Mohamad, A.M.Z. Shunt active power filter: A review on phase synchronization control techniques. Elecronics 2023, 8, 791. [Google Scholar] [CrossRef] [Scilit]
- Marian, G.; Silviu, E.; Razvan, C.S.; Razvan, B. Power quality improvement with three-phase shunt active power filter prototype based on harmonic component separation method with low-pass filter. Energies 2025, 18, 556. [Google Scholar] [CrossRef] [Scilit]
- Chaudhari, M.A.; Chandraprakash. Three-phase series active power filter as power quality conditioner. In Proceedings of the IEEE International Conference on Power Electronics, Drives and Energy Systems (PEDES), Bengaluru, India, 16–19 December 2012. [Google Scholar]
- Azebaze, M.C.S.; Hanzelka, Z. Analysis of the influence of the 6-pulse thyristor-bridge input reactor size on the shunt active power filter work efficiency: A case study. Energies 2024, 17, 80. [Google Scholar] [CrossRef] [Scilit]
- Balasubramanian, R.; Parkavikathirvelu, K.; Sankaran, R.; Rengarajan, A. Design, simulation and hardware implementation of shunt hybrid compensator using synchronous rotating reference frame (SRRF)-based control technique. Electronics 2019, 8, 42. [Google Scholar] [CrossRef] [Scilit]
- Xianshun, S.; Jun, T.; Yanan, W.; Tianbai, D.; Qianlong, Z.; Feixiang, P. Improved performance of low-frequency harmonic current suppression based on hybrid active power filter. Energies 2024, 17, 3740. [Google Scholar] [CrossRef] [Scilit]
- Leopold, H.; Klemen, K.; Boštjan, B. Design and performance evaluation of a hybrid active power filter controller. Energies 2024, 17, 2492. [Google Scholar] [CrossRef] [Scilit]
- Soham, C.; Susovan, M.; Sujit, K.B. A hybrid compensator for mitigation of power quality issues in distribution systems. In Proceedings of the IEEE International Conference on Power Electronics, Smart Grid, and Renewable Energy, PESGRE, Trivandrum, India, 2–5 January 2022. [Google Scholar]
- Pazhanimuthu, G.; Baranilingesan, I.; Karthick, A. An improved control algorithm for hybrid active power filter based on SOGI-PLL under dynamic load conditions. Solid State Commun. 2021, 333, 114357. [Google Scholar] [CrossRef] [Scilit]
- Jingrong, Y.; Shiqi, D.; Yijun, W.; Weibiao, W.; Mi, D. The engineering design and optimization of main circuit for hybrid active power filter. Electr. Power Energy Syst. 2013, 46, 40–48. [Google Scholar] [CrossRef] [Scilit]
- Azebaze, M.C.S.; Hanzelka, Z. Investigation on the performance efficiency of the shunt hybrid active power filter. In Power Quality and Harmonic Management in Modern Power System, 1st ed.; Muhyaddin, R., Ziad, M.A., Shady, H.E.A.A., Eds.; IntechOpen: London, UK, 2024; pp. 119–121. [Google Scholar]
- Sut-Ian, H.; Chi-Seng, L.; Man-Chung, W. Comparison among PPF, APF, HAPF and a combined system of a shunt HAPF and a shunt Thyristor controlled LC. In Proceedings of the IEEE Region 10 Conference TENCON, Macao, China, 1–4 November 2015. [Google Scholar]
- Das, J.C. Passive filters-potentialities and limitations. IEEE Trans. Ind. Appl. 2004, 40, 232–241. [Google Scholar] [CrossRef] [Scilit]
- Azebaze, M.C.S.; Hanzelka, Z.; Firlit, A. Analysis of the factor having an influence on the LC passive harmonic filter work efficiency. Energies 2022, 15, 1894. [Google Scholar] [CrossRef] [Scilit]
- Alexandre, B.N.; Wilsun, X.; Walmir, F. An investigation on the selection of filter topologies for passive filter applications. IEEE Trans. Power Deliv. 2009, 24, 1710–1718. [Google Scholar] [CrossRef] [Scilit]
- Anthoula, M.; Thomas, Z.; Milias-Argitis, J. Optimal sizing and limitations of passive filters in the presence of background harmonic distortion. Electr. Eng. 2009, 91, 89–100. [Google Scholar] [CrossRef] [Scilit]
- Czarnecki, L.S.; Ginn, H.L. The effect of the design method on efficiency of resonant harmonic filters. IEEE Trans. Power Deliv. 2005, 20, 286–291. [Google Scholar] [CrossRef]
- Klempka, R. Design and Optimization of a Simple Filter Group for Reactive Power Distribution; Hindawi Publishing Corporation: London, UK, 2016. [Google Scholar]
- Sameh, S.K.; Shady, H.E.A.A.; Ahmed, M.I. Mulple-arm passive filters design based on different reactive power sharing approaches. In Proceedings of the IEEE Eighteenth International Middle East Power Systems Conference (MEPCON), Cairo, Egypt, 27–29 December 2016. [Google Scholar]
- Ziad, M.A.; Faisal, Q.A.; Sameh, S.K.; Shady, H.E.A.A. Practical considerations for reactive power sharing approaches among multiple-arm passive filters in non-sinusoidal power systems. Int. J. Electr. Power Energy Syst. 2018, 103, 660–675. [Google Scholar] [CrossRef] [Scilit]
- Klempka, R. Analytical optimization of the filtration effiency of a group of single branch filtres. Electr. Power Syst. Res. 2022, 202, 107603. [Google Scholar] [CrossRef] [Scilit]
- The Power Data Logger High Frequency Ranges—PQ-Box 300. Available online: https://www.a-eberle.de/en/products/mobile-power-quality-analyzer-pq-box-300/ (accessed on 25 May 2025).
- Abu-Rubu, H.; Iqbal, A.; Guzinski, J. High Performance Control of AC Drives with Matlab/Simulink Models; John Wiley & Sons: Chichester, UK, 2012. [Google Scholar] [CrossRef] [Scilit]

Disclaimer/Publisher’s Note: The statements, opinions and data contained in all publications are solely those of the individual author(s) and contributor(s) and not of MDPI and/or the editor(s). MDPI and/or the editor(s) disclaim responsibility for any injury to people or property resulting from any ideas, methods, instructions or products referred to in the content. |
© 2026 by the authors. Licensee MDPI, Basel, Switzerland. This article is an open access article distributed under the terms and conditions of the Creative Commons Attribution (CC BY) license.