


Abstract
Australia is committed to achieving net-zero emissions by 2050, a goal that may require a major transformation of the household energy sector. Hydrogen can, however, be deployed as a complementary energy source to electricity by displacing natural gas. But the potential for hydrogen to make this transition is dependent on building a credible Australian household hydrogen supply chain (HHSC), which includes national distribution centres (NDCs), regional distribution centres (RDCs) and local distribution centres (LDCs). The HHSC is particularly vulnerable to operational disruptions under rapid adoption pathways and in perfect-competition market conditions, where infrastructure, supply, and pricing decisions are decentralised. Hydrogen flows may be disrupted at the NDCs and RDCs, leading to failure to meet demand and monetary losses across the HHSC. While many studies have assessed vulnerabilities within hydrogen supply chains, there is little attention paid to the consequences of distribution-level failures. This research aims to quantify the impacts associated with distribution centre (DC) disruptions in the HHSC using a multi-period network optimisation model to assess three operational situations: ideal situations, disrupted-DC situations without mitigation strategies, and disrupted-DC situations with suitable mitigation strategies. The results indicate that without mitigation strategies, demand fulfilment could potentially drop to zero, penalty costs could increase drastically, and profitability could decrease due to not meeting demand. In contrast, the implications of suitable mitigation strategies, including rerouting hydrogen through alternate, unaffected NDCs or RDCs, using spare capacity by increasing operating hours, and maintaining safety stock at RDCs, significantly increase HHSC performance. In these situations, demand fulfilment increases to up to 95%, and profitability improves substantially. This study contributes to the hydrogen supply chain literature by demonstrating how HHSCs can be planned and replanned to manage disruptions in DCs. The study also provides practical insights for policymakers and managers for a sustainable HHSC.
1. Introduction
Australia’s pathway to net-zero emissions by 2050 is heavily contingent on successfully decarbonising from fossil fuels to renewable sources across all sectors of energy consumption, including the household sector. Electricity and clean hydrogen are considered to be the two driving sources of Australia’s renewable energy transition. Hydrogen may potentially substitute for natural gas (NG) usage in households. Projections show that clean hydrogen will be expensive into the 2030s at the very least. The growth of the household hydrogen supply chain (HHSC), consisting of national distribution centres (NDCs), regional distribution centres (RDCs) and local distribution centres (LDCs), will rely on future household demand for hydrogen [1]. However, under perfect competition, where supply, pricing, and infrastructure decisions are decentralised and driven by market efficiency, the HHSC is vulnerable to operational risks [2,3]. In this environment, disruptions at distribution centres (DCs), such as NDCs and RDCs, due to technical failures, maintenance delays, or logistical issues can significantly affect reliability by reducing demand fulfilment and HHSC profitability.
These disruptions can lead to situations where demand from households cannot be met, delayed timelines to reach energy transition targets, and increased total HHSC costs, such as production, transportation, and penalty costs [4,5]. As Australia moves toward a decentralised, competitive energy market, the operational stability of the HHSC becomes increasingly critical. While research has largely focused on hydrogen production and end-use technologies, limited attention has been paid to disruptions of DCs under market-driven conditions [6,7]. In the absence of centralised coordination, disruptions in DCs, such as NDCs and RDCs, may lead to cascading failures, reducing demand fulfilment and causing significant impact on financial implications. These disruptions are amplified in rapid adoption pathways and perfect-competition market conditions, where firms operate independently, making system-wide recovery challenging. Given hydrogen’s integral role in the energy transition, ensuring an uninterrupted supply through a resilient distribution network is vital [8]. This study is therefore motivated by the pressing need to evaluate the impacts of DC disruptions and evaluate the HHSC plans with and without mitigation strategies, in a competitive and decentralised context.
Mitigation strategies that can be taken to address DC disruptions include rerouting hydrogen to other unaffected NDCs or RDCs, utilising spare capacities of NDCs and RDCs by extending operating hours, and maintaining safety stock that can reduce the consequences of DC disruptions [9,10,11].
These strategies support the sustained serviceability of hydrogen demand, material flow stabilisation, and improved financial outcomes should disruptions occur. However, to date, this topic has been given minimal consideration throughout the current hydrogen supply chain (HSC) literature, especially under rapid adoption pathways and perfect-competition market conditions. Policy targets, technological inevitability, and international market competitiveness all indicate Australia will rapidly roll out clean hydrogen to sectors such as households [12,13]. Simultaneously, the liberalisation of Australia’s energy markets favours decentralised, competitive dynamics where individual firms operate with minimal coordination [14,15]. The current literature has primarily focused on technical feasibility studies, techno-economic optimisation, or infrastructure design problems, with limited attention to DC disruptions. This research defines resilience as being shaped by decentralised decision-making within a perfectly competitive market. This is achieved by modelling disruptions to DCs under conditions of perfect competition. By explicitly representing DC disruptions, the study examines how limited coordination under such market conditions constrains recovery options and alters the effectiveness of mitigation strategies. This study aims to address this gap through the following research questions (RQs):
- RQ1: How do DC disruptions affect demand fulfilment, material flows, and financial implications across the HHSC?
- RQ2: What mitigation strategies can be employed to minimise the negative impacts of DC disruptions?
To investigate these questions, the study establishes the following research objectives (ROs):
- RO1: To simulate and assess the impact of DC disruptions on demand fulfilment and financial implications in HHSC.
- RO2: To develop plans to mitigate disruptions by utilising three strategies: rerouting hydrogen through unaffected NDCs or RDCs, utilising additional capacity through extended operational hours, and safety stock at RDCs.
By analysing disrupted situations and testing mitigation strategies in the HHSC, this study contributes to the energy transition literature. The results should provide recommendations for decision-makers, infrastructure planners and energy suppliers to provide a reliable and optimised hydrogen supply chain together with electricity in a decentralised market environment.
2. Literature Review
This section reviews the evolution of the HSC for household energy, the impacts of market conditions on supply resilience, and existing research gaps.
2.1. Evolution of HSC in the Household Energy Sector
The HSC had come to be understood as playing an important role in enabling the household energy transition, especially for decarbonising energy end-uses in homes across economies. While initial research had been focused on production technologies and integration to the grid, it expanded to include planning and optimisation of distribution infrastructure specific to household demand profiles [16]. Hydrogen was even being framed as competing with electricity as a solution vector in some instances for cleanly supplying energy to homes for heating, cooking, and energy storage [17]. Researchers increasingly employed integrated simulation frameworks to assess how spatially distributed supply nodes, such as national and regional distribution centres, interacted under various adoption pathways [5]. The inclusion of resilience metrics, risk assessments, and market-based behaviours further increased the sophistication of supply chain models under conditions of perfect competition [18,19]. On the one hand, this increased complexity made collaboration between stakeholders more challenging than before. On the other hand, it allowed for more realistic evaluations of how supply systems performed when operations were disrupted. Furthermore, these modelling improvements allowed for the development of opportunities to identify flexible and cost-efficient infrastructure designs that provided both efficiency and resilience. The decentralised approach to planning in the HSC especially offered opportunities to design networks that could cater to disruptions more easily [20,21].
2.2. Impact of Market Conditions and Disruptions on Energy Supply Chains
The relationship between market conditions and disruption events played a pivotal role in determining the past performance of energy supply chains. The literature indicated that decentralised and competitive markets, i.e., perfect-competition frameworks, fuelled efficiency but sacrificed resilience through coordination mechanisms [22]. There were multiple articles indicating that supply chains under stressed conditions, especially periods of high demand and low flexibility, were more susceptible to failure if a centralised coordinator was not present [23]. Such disruptions, which have included a lack of inputs due to load shedding or transport delays, often translate to major delays and cost overruns downstream [24]. Coupled with lean strategies to maximise profit in competitive markets, exhibited by limited buffer capacity and minimised inventories, the capacity for disturbances to propagate through HSC was heightened [25]. Energy supply chains, including nascent HSCs discussed in this study, are subject to numerous operational risks that can interrupt production, transportation, and demand fulfilment throughout the chain. Furthermore, as energy systems become increasingly digitised, cyber-physical risks become relevant. Disruptions to data or control centre inputs can cause widespread supply repercussions [26]. Though largely dependent on the unique supply chain configuration, these types of risks were especially relevant to hydrogen due to the combustibility of the gas and storage requirements, as well as limited safety data and underdeveloped regulations for emerging hydrogen markets [27,28].
While awareness of energy supply disruption risks has increased, there have been few studies on how rapid deployment pathways and perfect competition affect the value of coordinated responses to disruptions. NDCs and RDCs optimise their operations independently of each other in decentralised markets, limiting their ability to respond collectively when disruptions occur [29,30]. This lack of coordination can limit the prompt execution of mitigation strategies such as rerouting, utilisation of excess capacity from these facilities by increasing operating hours and holding safety inventory at RDCs. This will lead to disruptions snowballing at a faster rate, causing lower availability of hydrogen and higher operational and financial losses. Integrated and coordinated mitigation plans are missing in such market environments, which is one of the major research gaps in the hydrogen supply chain literature.
Additionally, with increasing renewable penetration, there was another complication added to the problem. Studies found that the uncertainty from renewables and the decentralised nature of the market increased difficulties in keeping supply–demand parity during disruptions [31]. As a response, recent work began to explore risk-based planning and mitigation strategies, such as redundancy, diversification, and digital forecasting, to enhance adaptive capacity [32]. Another recent research has shown that high levels of EV integration can provide significant system flexibility when supported by appropriate electricity and carbon market designs, but may also introduce challenges related to market volatility, grid congestion, and equity [33]. These findings highlight the need for continued research on coordinated market mechanisms and bidding strategies that align EV participation with decarbonisation and energy security objectives
Efficiency and the lowest possible costs are rewarded. Without regulation or coordinated market intervention, every player has an incentive to underinvest in mitigation, increasing systemic vulnerability [22]. This contrasts with most regulated or monopolistic electric systems, where central planning exists and resilience justifications can be built into regulatory structures.
2.3. Research Gaps
Although there has been increasing attention paid to hydrogen and its role in decarbonising future household energy systems, the literature studying the distribution system that underpins hydrogen delivery to consumers, at scale, is limited. In particular, most of the literature focuses on hydrogen produced for industrial/export applications rather than its residential use. Furthermore, the shape of the HSC infrastructure is rarely studied in detail. Consideration has not been given to its structure and potential weak points, in particular, the centrality of DCs [18,19,20].
Moreover, there is little research that models the impacts of disruption under conditions of perfect competition in markets. Existing studies look at centralised or coordinated systems, failing to consider the market pressures of perfect competition and how this affects susceptibility to DCs [11,21,34].
There is an opportunity gap in assessing these strategies’ effectiveness within hydrogen networks through scenarios [31,32] that account for differing adoption pathways and market conditions that uniquely impact supply reliability in perfect-competition models. Thus, capturing the nuances and challenges of hydrogen supply chains in terms of structure, operations and market mechanics at the household level warrants research prioritisation, specifically through scenario-based modelling of disruptions at DCs and evaluation of mitigation strategies to best supply households during rapid adoption under perfect-competition scenarios.
This study contributes to the literature in three key ways. Firstly, the scope of this research centres on household-level hydrogen distribution networks as opposed to industrial or export frameworks. Secondly, disruptions at DCs are investigated despite previous literature focusing primarily on production or demand uncertainty. Finally, suitable mitigation strategies are evaluated to mitigate disruptions in DCs.
3. Problem Statement
In Australia’s transition to net-zero emissions, the HHSC, comprising NDCs, RDCs, and LDCs, is critical for meeting household hydrogen demand [1]. If the HHSC is modelled under rapid adoption pathways (10–15%) and perfect-competition market conditions (45–55%), the decentralised design of the HHSC can be exposed to adverse consequences if DCs become disrupted, limiting demand fulfilment and causing undesirable financial repercussions.
DC disruptions can occur at NDCs or RDCs and are typically triggered by technical issues, maintenance delays, or logistical breakdowns that inhibit the flow of hydrogen downstream to LDCs. Quantifying the impact of DC disruptions at the distribution level and exploring potential mitigation strategies are vital for managing risk within the HHSC.
To address this research gap, this paper develops a multi-period network optimisation problem that assesses the performance of the HHSC when subject to DC disruptions. The optimisation model calculates hydrogen production, transport flows, and deliveries across the HHSC with a long-term planning horizon. The model measures HHSC performance by evaluating demand fulfilment and financial repercussions under three operational situations: (i) ideal situations, (ii) disrupted-DC situations without mitigation strategies, and (iii) disrupted-DC situations with suitable mitigation strategies. However, disrupted-DC situations comprise two scenarios: NDC disruption scenarios and RDC disruption scenarios, each applied under conditions without mitigation strategies and with suitable mitigation strategies.
4. Methodology
The approach utilises demand estimation and network optimisation modelling. The methodology follows a similar approach to our previously published works for modelling the flow of hydrogen from production to transport [1,9]. The model uniquely considers disruptions in DCs and incorporates mitigation strategies, such as rerouting, utilising spare capacity by increasing hours of operation and safety stock at RDCs, in the context of the Australian HHSC.
4.1. Estimating the Household Hydrogen Demand
A five-step demand estimation methodology is used to enable the dynamics associated with switching from NG to renewable supply. However, the first step follows Equation (1), which defines the remaining demand in year T as the maximum of zero or the reduced level from the previous year, based on the annual phase-out rate. The second step is based on renewable adoption, which is calculated as the reduction in NG consumption relative to the previous year (refer to Equation (2)). Moreover, the third step introduces situation development, in which adoption pathways (slow, gradual, rapid) and market conditions (monopoly, moderate competition, perfect competition) are incorporated to define the analysis environment. In step four, renewable adoption is allocated between hydrogen and electricity, with Equations (3) and (4) determining the respective shares according to market conditions. To ensure robustness, Equations (5)–(8) impose constraints that guarantee feasibility and non-negativity under varying adoption pathways and market conditions. Lastly, the fifth step denotes that hydrogen demand is spatially disaggregated across regions and cities. Hydrogen demand is allocated based on population shares in Equation (9). The outputs from this step serve as critical inputs for multi-period network optimisation to identify the locations of NDCs, RDCs, and LDCs. For clarity and reproducibility, all parameters and variables used in the formulation are defined in Appendix A Table A1, Table A2 and Table A3.
4.1.1. Determining Household Hydrogen Demand Dynamics in the NG–Renewable Transition
The model comprises a set of equations that capture the dynamics of transitioning from NG to renewable energy, specifically hydrogen and electricity. Equation (1) defines the remaining NG demand in year , calculated as the maximum of zero or the reduced demand from the previous year, based on the annual phase-out rate . Equation (2) assigns the share of renewable energy adoption allocated to hydrogen (), which varies according to the market conditions, monopoly, moderate competition, or perfect competition. Equation (3) determines the remaining share () allocated to electricity, computed as the complement of hydrogen’s share. Equation (4) calculates the volume of renewable energy adopted in year by measuring the reduction in NG usage compared to the previous year.
4.1.2. Constraints on Household Hydrogen Demand Dynamics
Equations (5)–(8) impose the restriction that all hydrogen demand values must be greater than or equal to zero. Together, these equations provide a robust structure for determining household hydrogen demand and evaluating the impacts of various adoption pathways and market conditions on the HHSC.
4.1.3. Regional Demand Allocation
The hydrogen demand for city c in year t, denoted as in Equation (9), disaggregates hydrogen demand across cities or regions. This spatial allocation is critical for informing network-level infrastructure decisions, such as locating NDCs, RDCs, and LDCs and optimising transport flows in subsequent stages of the supply chain model.
4.2. Situation Analysis
The situation analysis evaluates both ideal and disrupted situations for the HHSC. The ideal situation optimises DC locations and maximises profit, while disrupted situations assess the impact of unmet demand without mitigation and with suitable mitigation strategies. Mitigation strategies such as rerouting hydrogen through unaffected NDCs or RDCs, utilising spare capacity through extended operational hours and maintaining safety stock at RDCs are employed. AnyLogistix (Version 3.2.0) software is used to model and compare financial implications, evaluating total profit, penalty costs, and demand fulfilment rates. Transport distances between facilities are computed automatically based on their geographic coordinates within the AnyLogistix environment. The optimisation model then identifies cost-minimising transport flows and routing decisions subject to capacity, demand, and disruption constraints.
4.2.1. Mathematical Model for Situation Analysis
The simplified function for disrupted situations without mitigation strategies, presented in Equation (10), can be expressed as follows: profit equals total revenue minus production costs, transportation costs, and penalty costs. This structure is similar to the ideal model presented in Equation (5) in our recent research, with the key difference being the inclusion of the penalty component to account for unmet demand [1]. In disrupted situations, the demand from the LDC may or may not be fulfilled. For any unmet demand, a penalty cost is applied to account for the shortfall. The disrupted situations with suitable mitigation strategies presented in Equation (11) reflect changes in costs due to the implementation of suitable mitigation strategies. The mathematical model is presented as follows.
4.2.2. Constraints
Equation (12) represents that the quantity of hydrogen produced at NDC i must be less than or equal to the capacity of NDC i. Equation (13) represents that the quantity of hydrogen received by RDC j must equal the quantity of hydrogen transported from NDC i to RDC j. Similarly, Equation (14) represents that the quantity of hydrogen received by LDC k must equal the quantity of hydrogen transported from RDC j to LDC k. Equation (15) represents that the quantity of hydrogen received at LDC k may or may not be equal to the demand of LDC k. Equation (16) represents that the production at NDC i must be greater than or equal to the quantity of hydrogen getting transported from NDC i to RDC j. Equation (17) represents that production at NDC i, the quantity of hydrogen getting transported from NDC i to RDC j and the quantity of hydrogen getting transported from RDC j to LDC k must be greater than or equal to 0. The additional constraint presented in Equation (18) represents that if the quantity of hydrogen received at RDC j is less than the demand of LDC k, it will incur an additional penalty cost for the unmet demand. Equation (19) states that the proportion of safety stock that needs to be stored will be a positive value. Similarly, Equation (20) represents that the quantity of hydrogen received at RDC j must be greater than or equal to the quantity of hydrogen transported from NDC i to RDC j. The objective functions are subjected to the following constraints.
5. Results and Discussions
This section focuses on assessing the impacts of DC disruptions on the HHSC across three distinct operational situations: ideal situations, disrupted situations without mitigation strategies, and disrupted situations with suitable mitigation strategies.
5.1. Shift from NG Consumption to Renewable Uptake
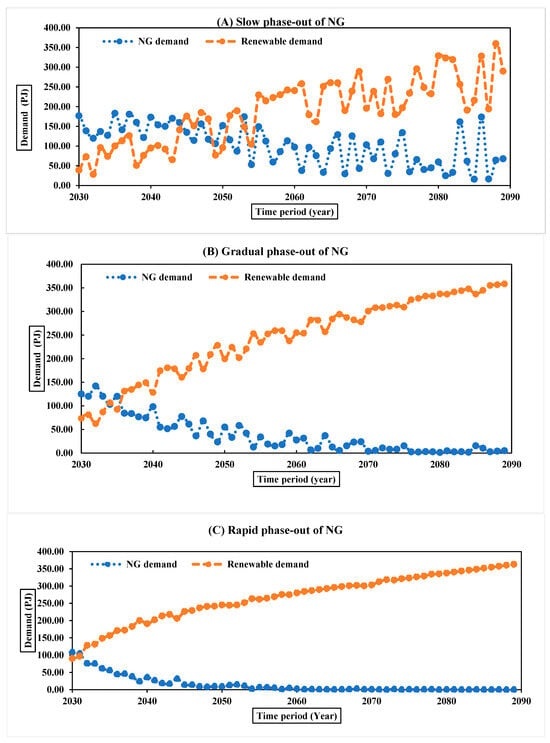
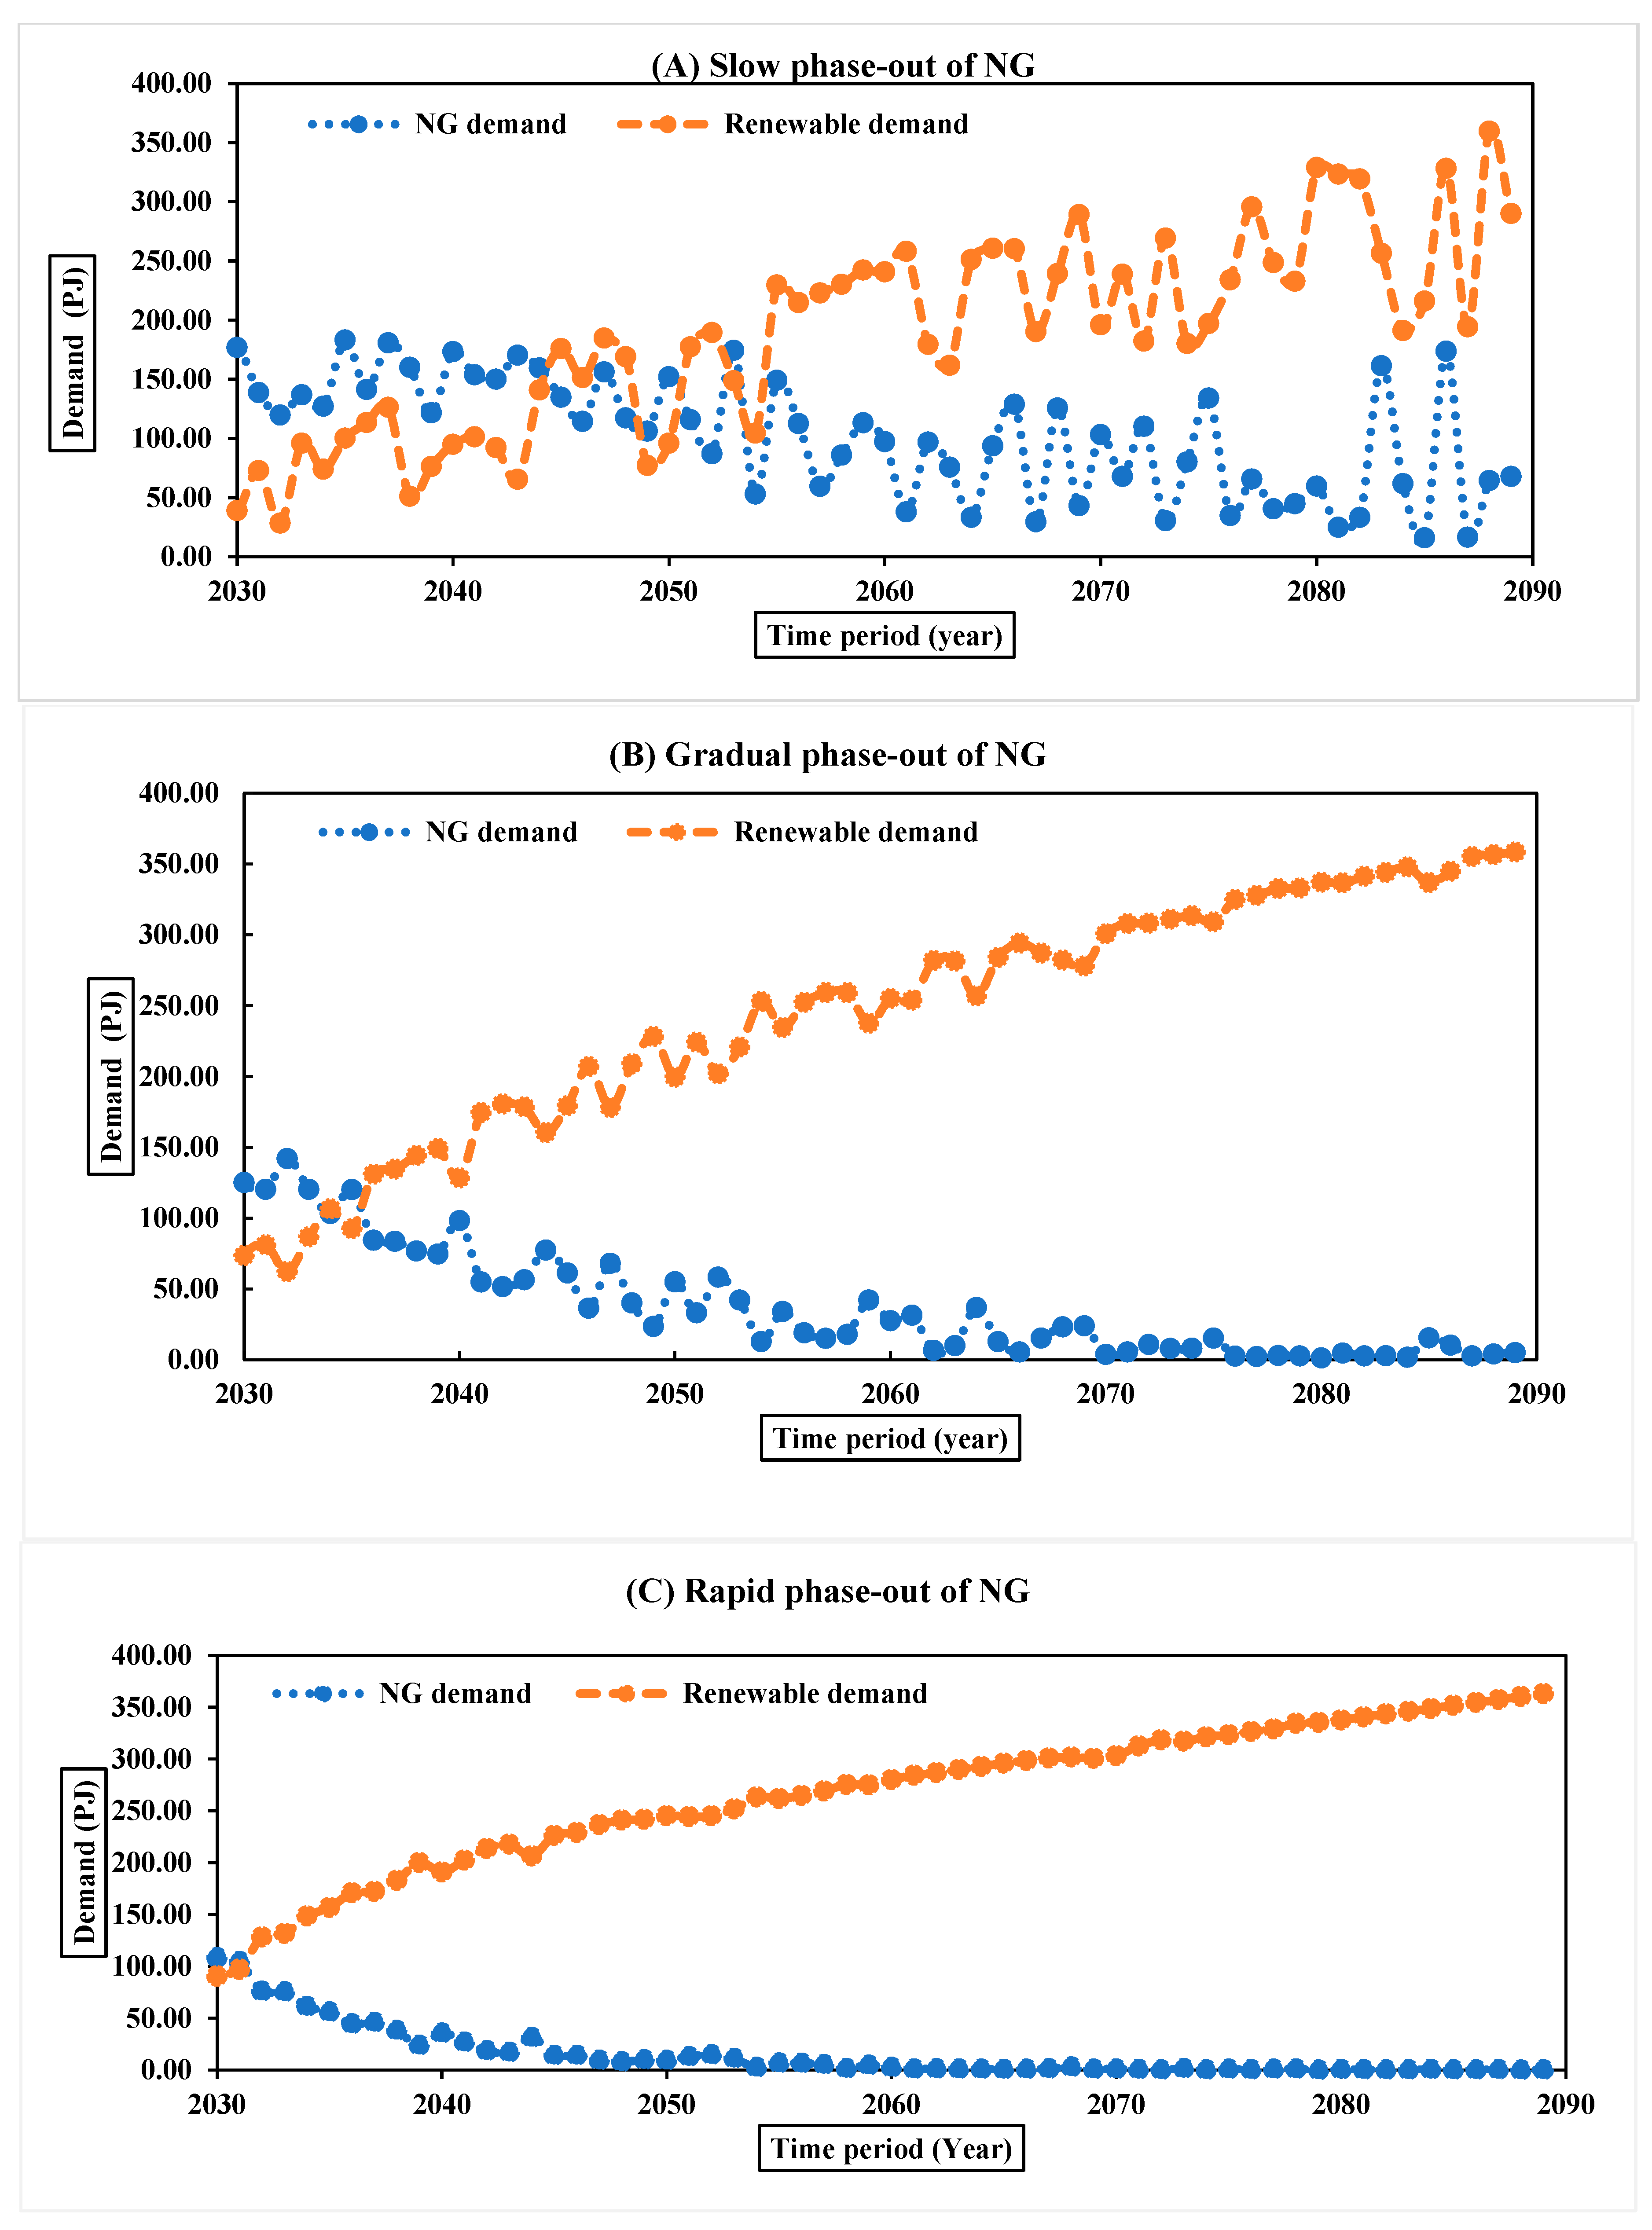
The forecasts made above on the NG phase-out and renewable energy adoption are analysed below over time within the three adoption pathways. The slow adoption of renewable energy technologies, plotted in Figure 1A, indicates that NG demand steadily decreases throughout the period starting in 2026. Although this drop accelerates post-2040, NG remains part of the household energy supply mix for many decades. However, renewable energy demand steadily increases, eventually surpassing NG consumption around mid-century and remaining the main source of household energy demand by 2090. The year-to-year fluctuations observed under the slow-adoption pathway reflect the assumed variability in annual adoption rates rather than non-monotonic behaviour in the demand estimation equations. The gradual-adoption pathways, plotted in Figure 1B, show that NG demand steadily decreases starting in the late 2020s, falling below 100 PJ by the early 2040s.
Figure 1.
NG phase-out and renewable energy demand under different adoption pathways: (A) Slow-adoption pathway, (B) gradual-adoption pathway, (C) rapid-adoption pathway.
NG demand approaches zero by 2080, while renewable energy demand continues to rise, exceeding NG consumption by the early 2040s. Renewables remain well above NG consumption levels for the remainder of the century, reaching over 350 PJ by 2090.
Under the rapid adoption pathway, shown in Figure 1C, NG demand falls below 100 PJ by 2032 and is effectively phased out by 2040. Renewable energy demand begins to overtake NG consumption around 2030 and becomes the dominant source of household energy by mid-century, exceeding 360 PJ by 2090.
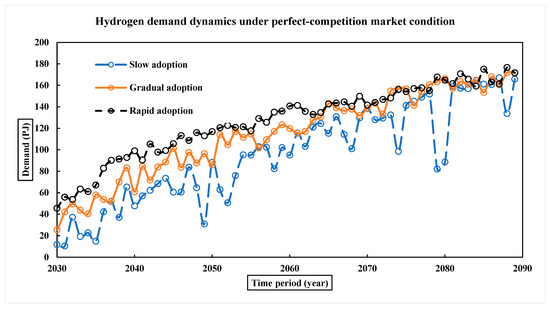
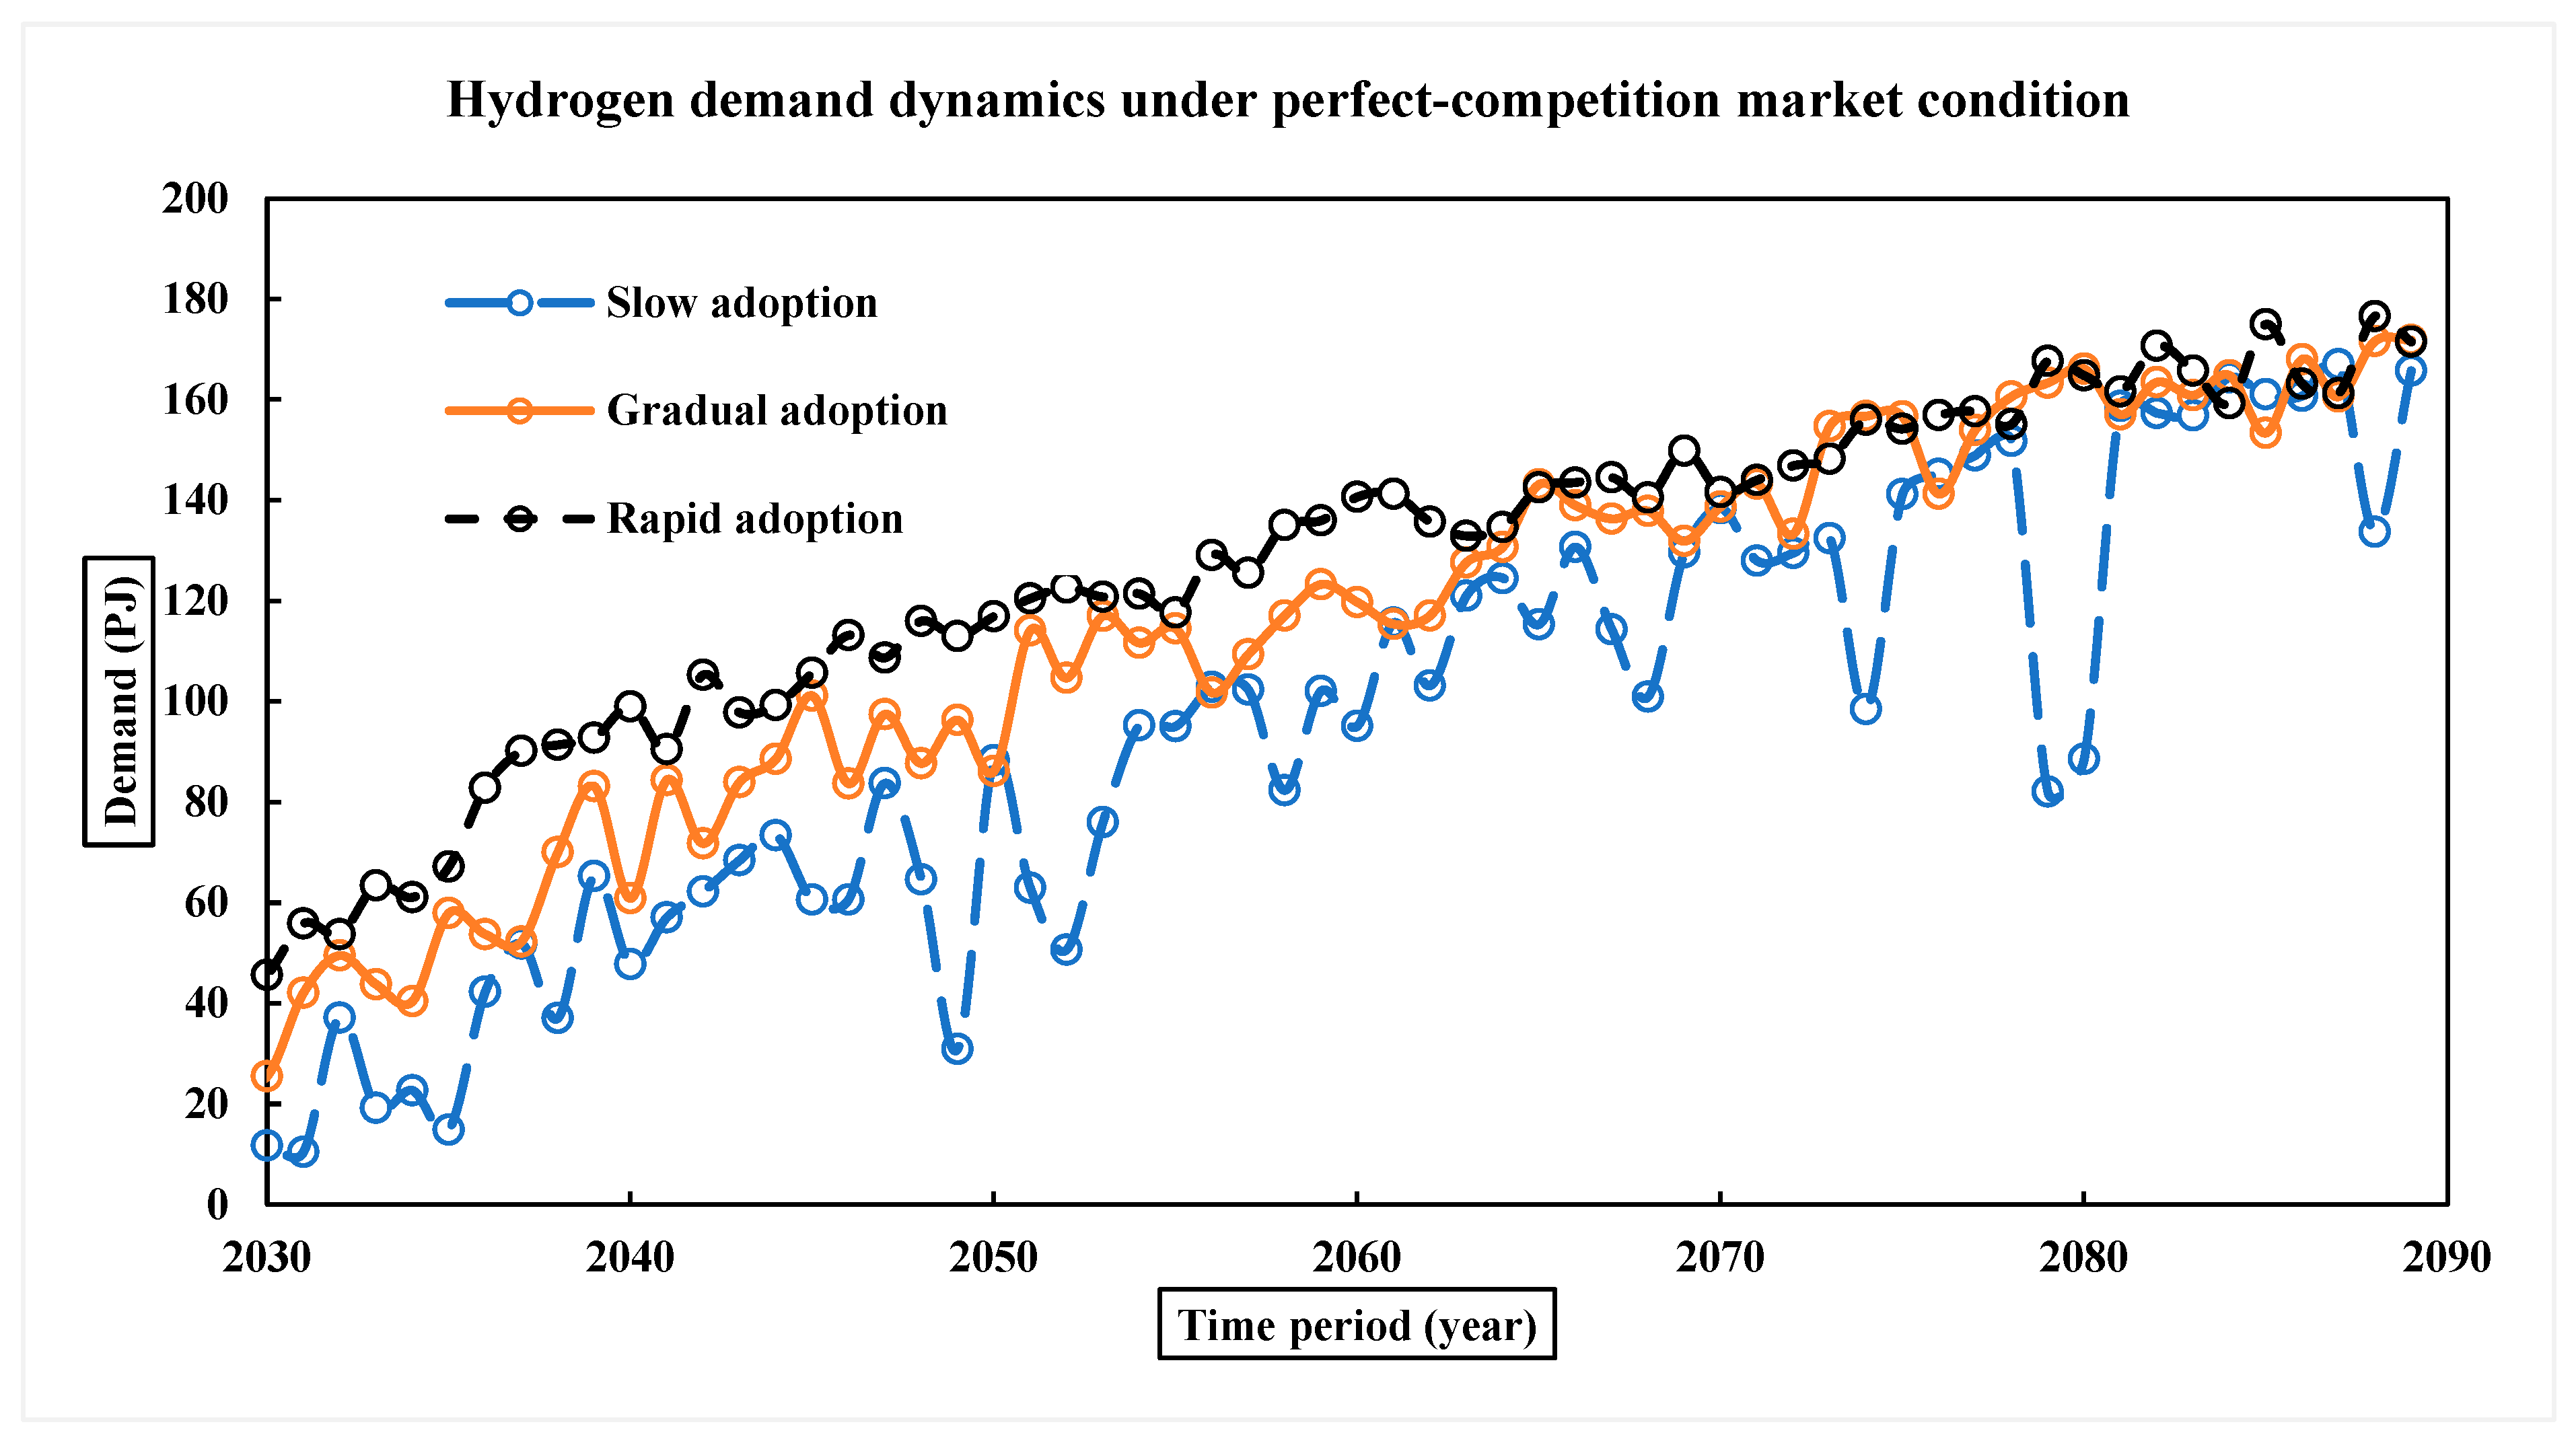
In contrast, Figure 2 illustrates the cumulative hydrogen demand from households assuming perfect-competition market drivers across slow-, gradual- and rapid-hydrogen-adoption pathways between 2026 and 2090. Slow adoption results in an initially gradual increase with high variance, resulting in approximately 150 PJ by 2090. However, hydrogen demand across all years is less than that under gradual and rapid adoption. Gradual adoption presents the most linear increase, with cumulative demand exceeding 100 PJ by 2050 and continuing to rise at a relatively consistent rate to roughly 170 PJ by 2090. Rapid adoption outpaces both gradual and slow adoption by 2030 and maintains higher demand throughout much of the transition.
Figure 2.
Hydrogen demand dynamics under various adoption pathways and perfect-competition market conditions.
5.2. Ideal Situations
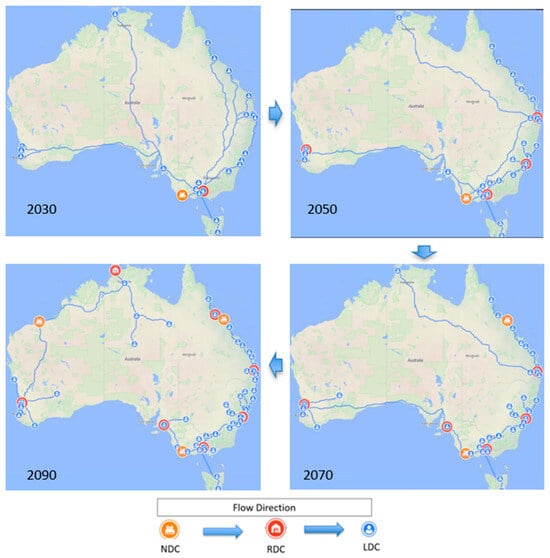
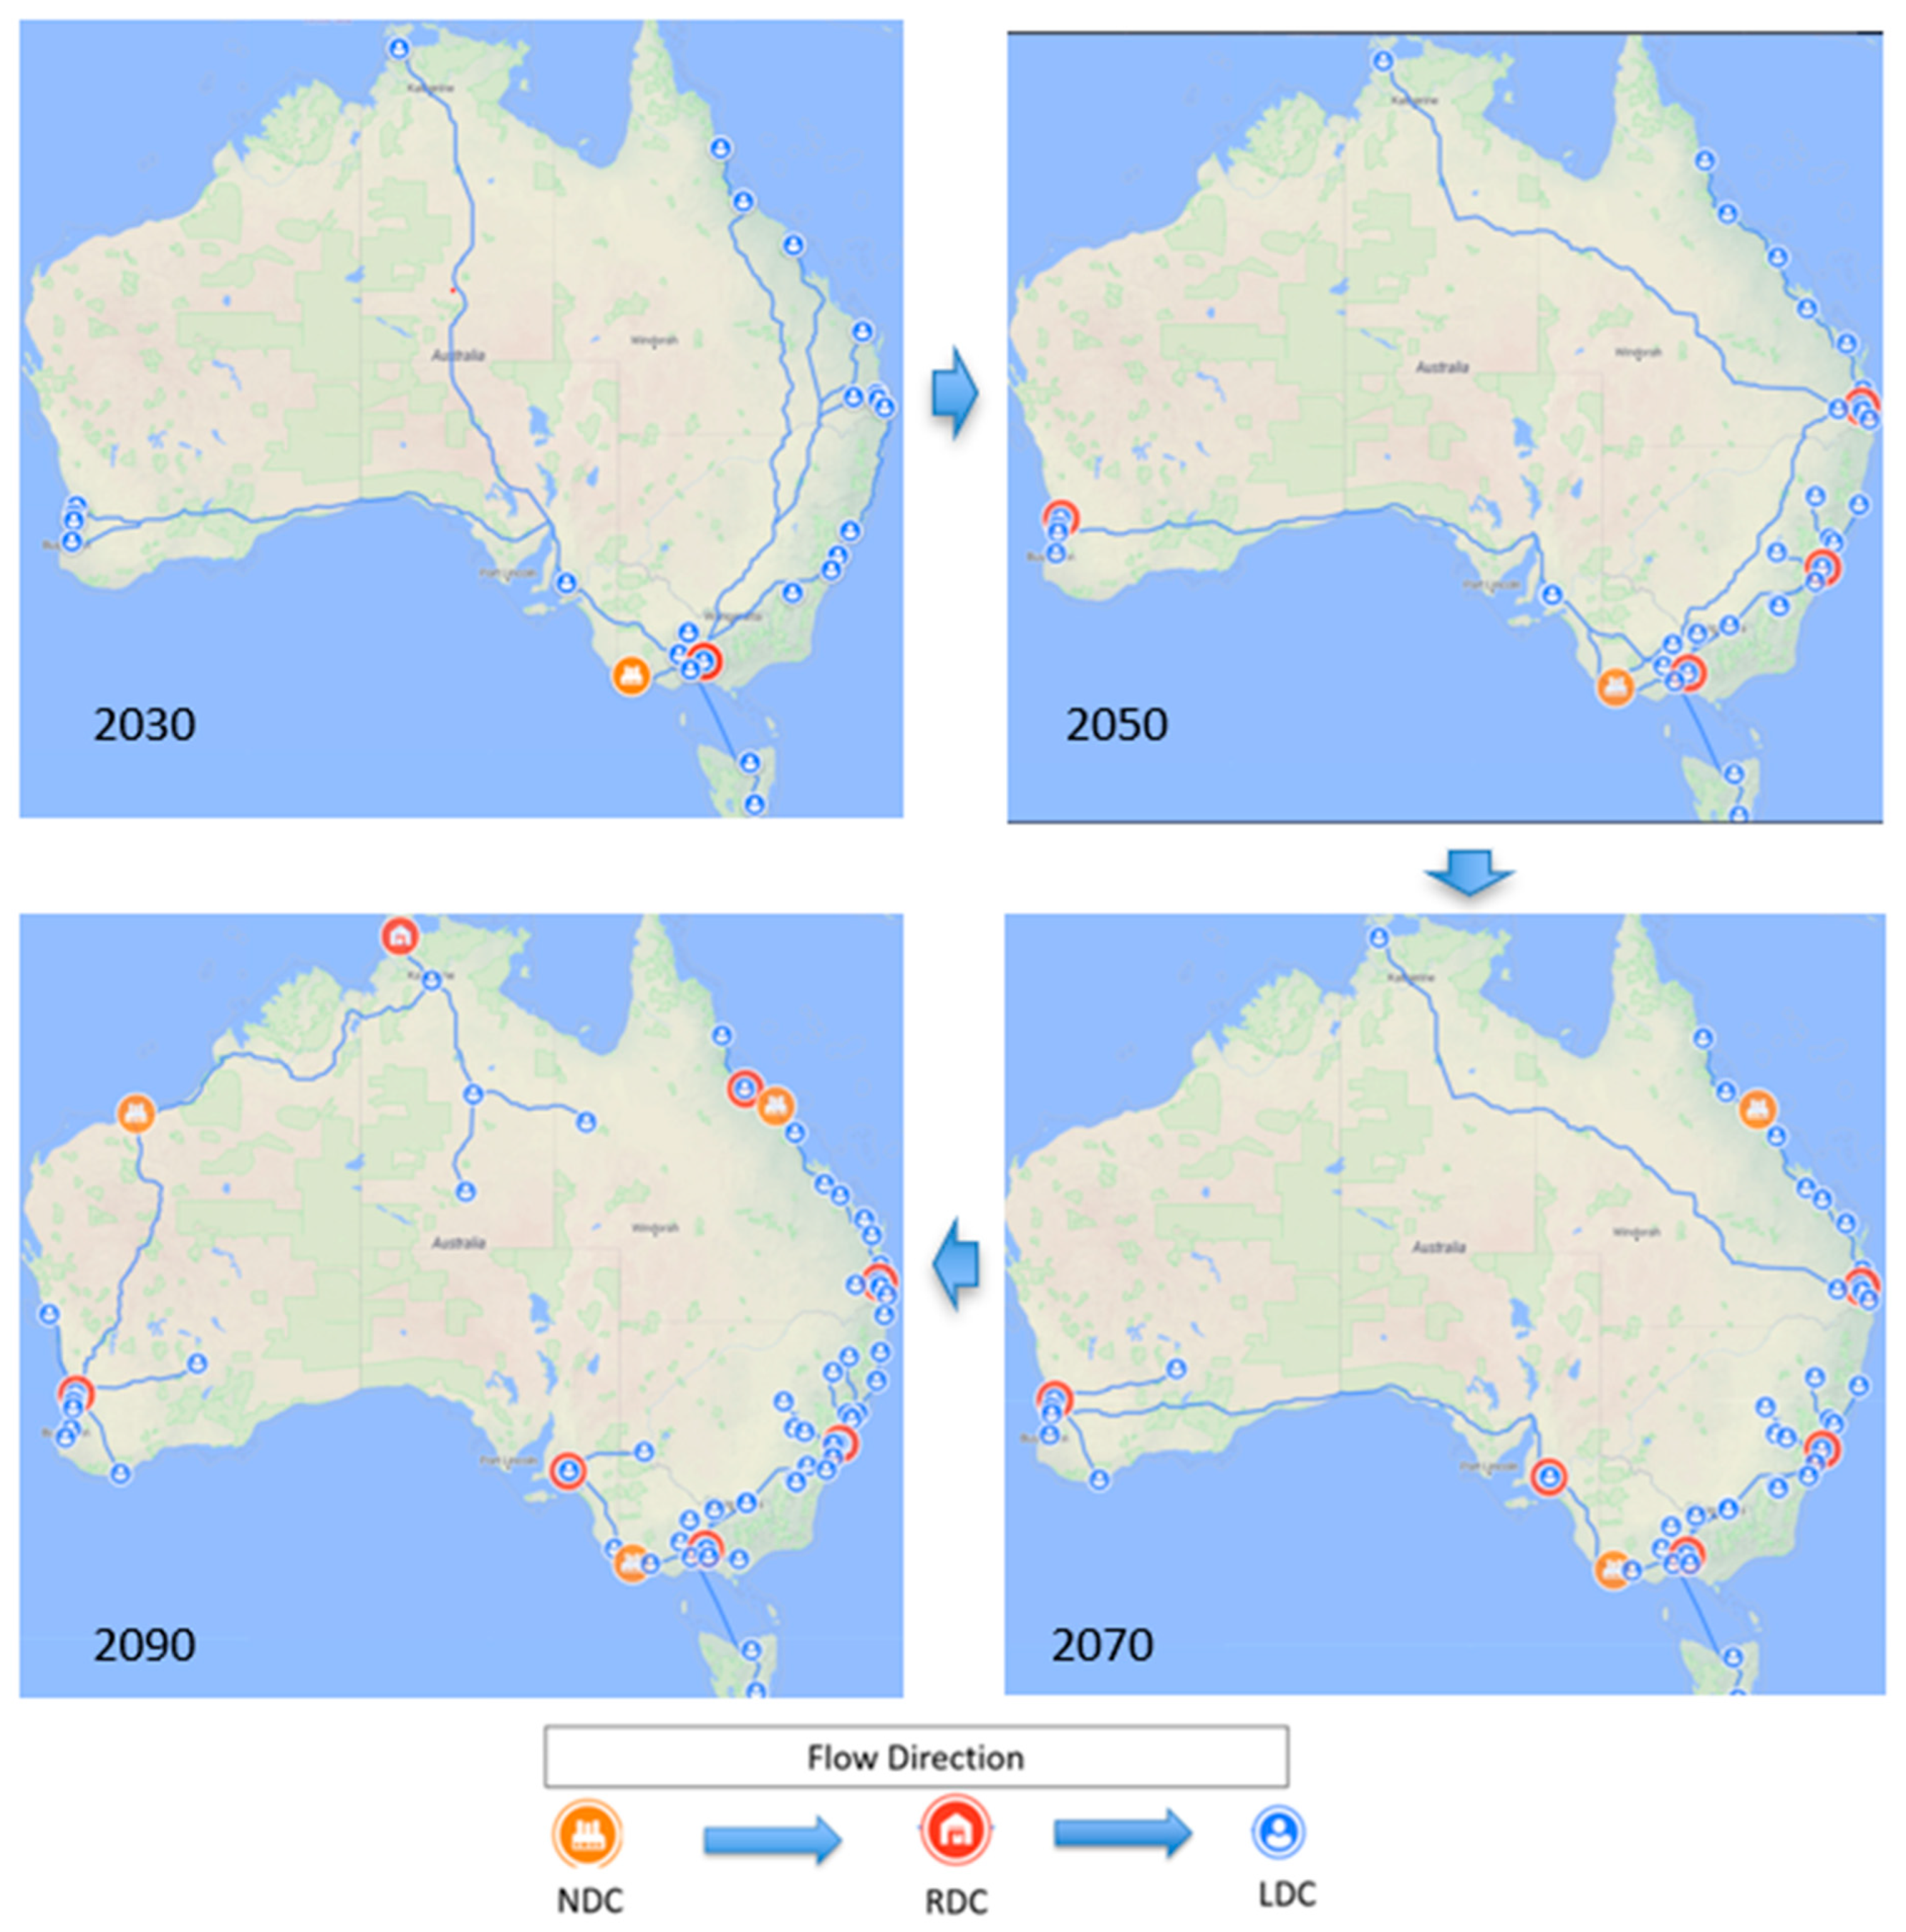
The HHSC in Australia develops progressively from a centralised structure in 2030 to a decentralised network by 2090, as presented in Figure 3. Commencing with one NDC in Portland (VIC) in 2030, hydrogen is distributed via one RDC located in Melbourne to service 24 surrounding LDCs supplying local suburban areas. In 2040, two additional RDCs are added in Perth and Sydney, with the NDC remaining in Portland, servicing a total of 30 LDCs. By 2050, another RDC is added, operating out of Brisbane and supplying 34 surrounding LDCs.
Figure 3.
Structure of the HHSC under ideal situations.
Moving forward to 2060, an additional NDC is established in Bowen (QLD), initiating the transition to a dual-hub network serving both southern and northern Australia. Another RDC is added in Adelaide (SA), bringing the total number of RDCs to five. Operating from these RDCs are 40 LDCs distributed across major population areas. The network continues to decentralise between 2070 and 2080 with the addition of two more RDCs in Townsville and Darwin, increasing the total to seven RDCs and 53 LDCs. By 2090, the HHSC reaches its final configuration, as shown in Figure 3 consisting of two NDCs, seven RDCs, and 65 LDCs.
5.3. Financial Implications Under Ideal Situations
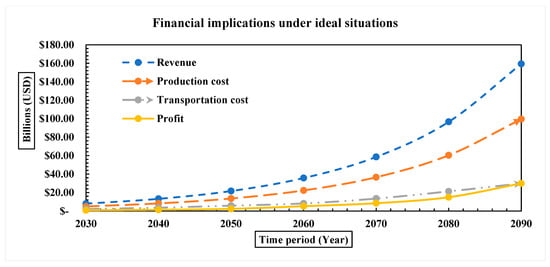
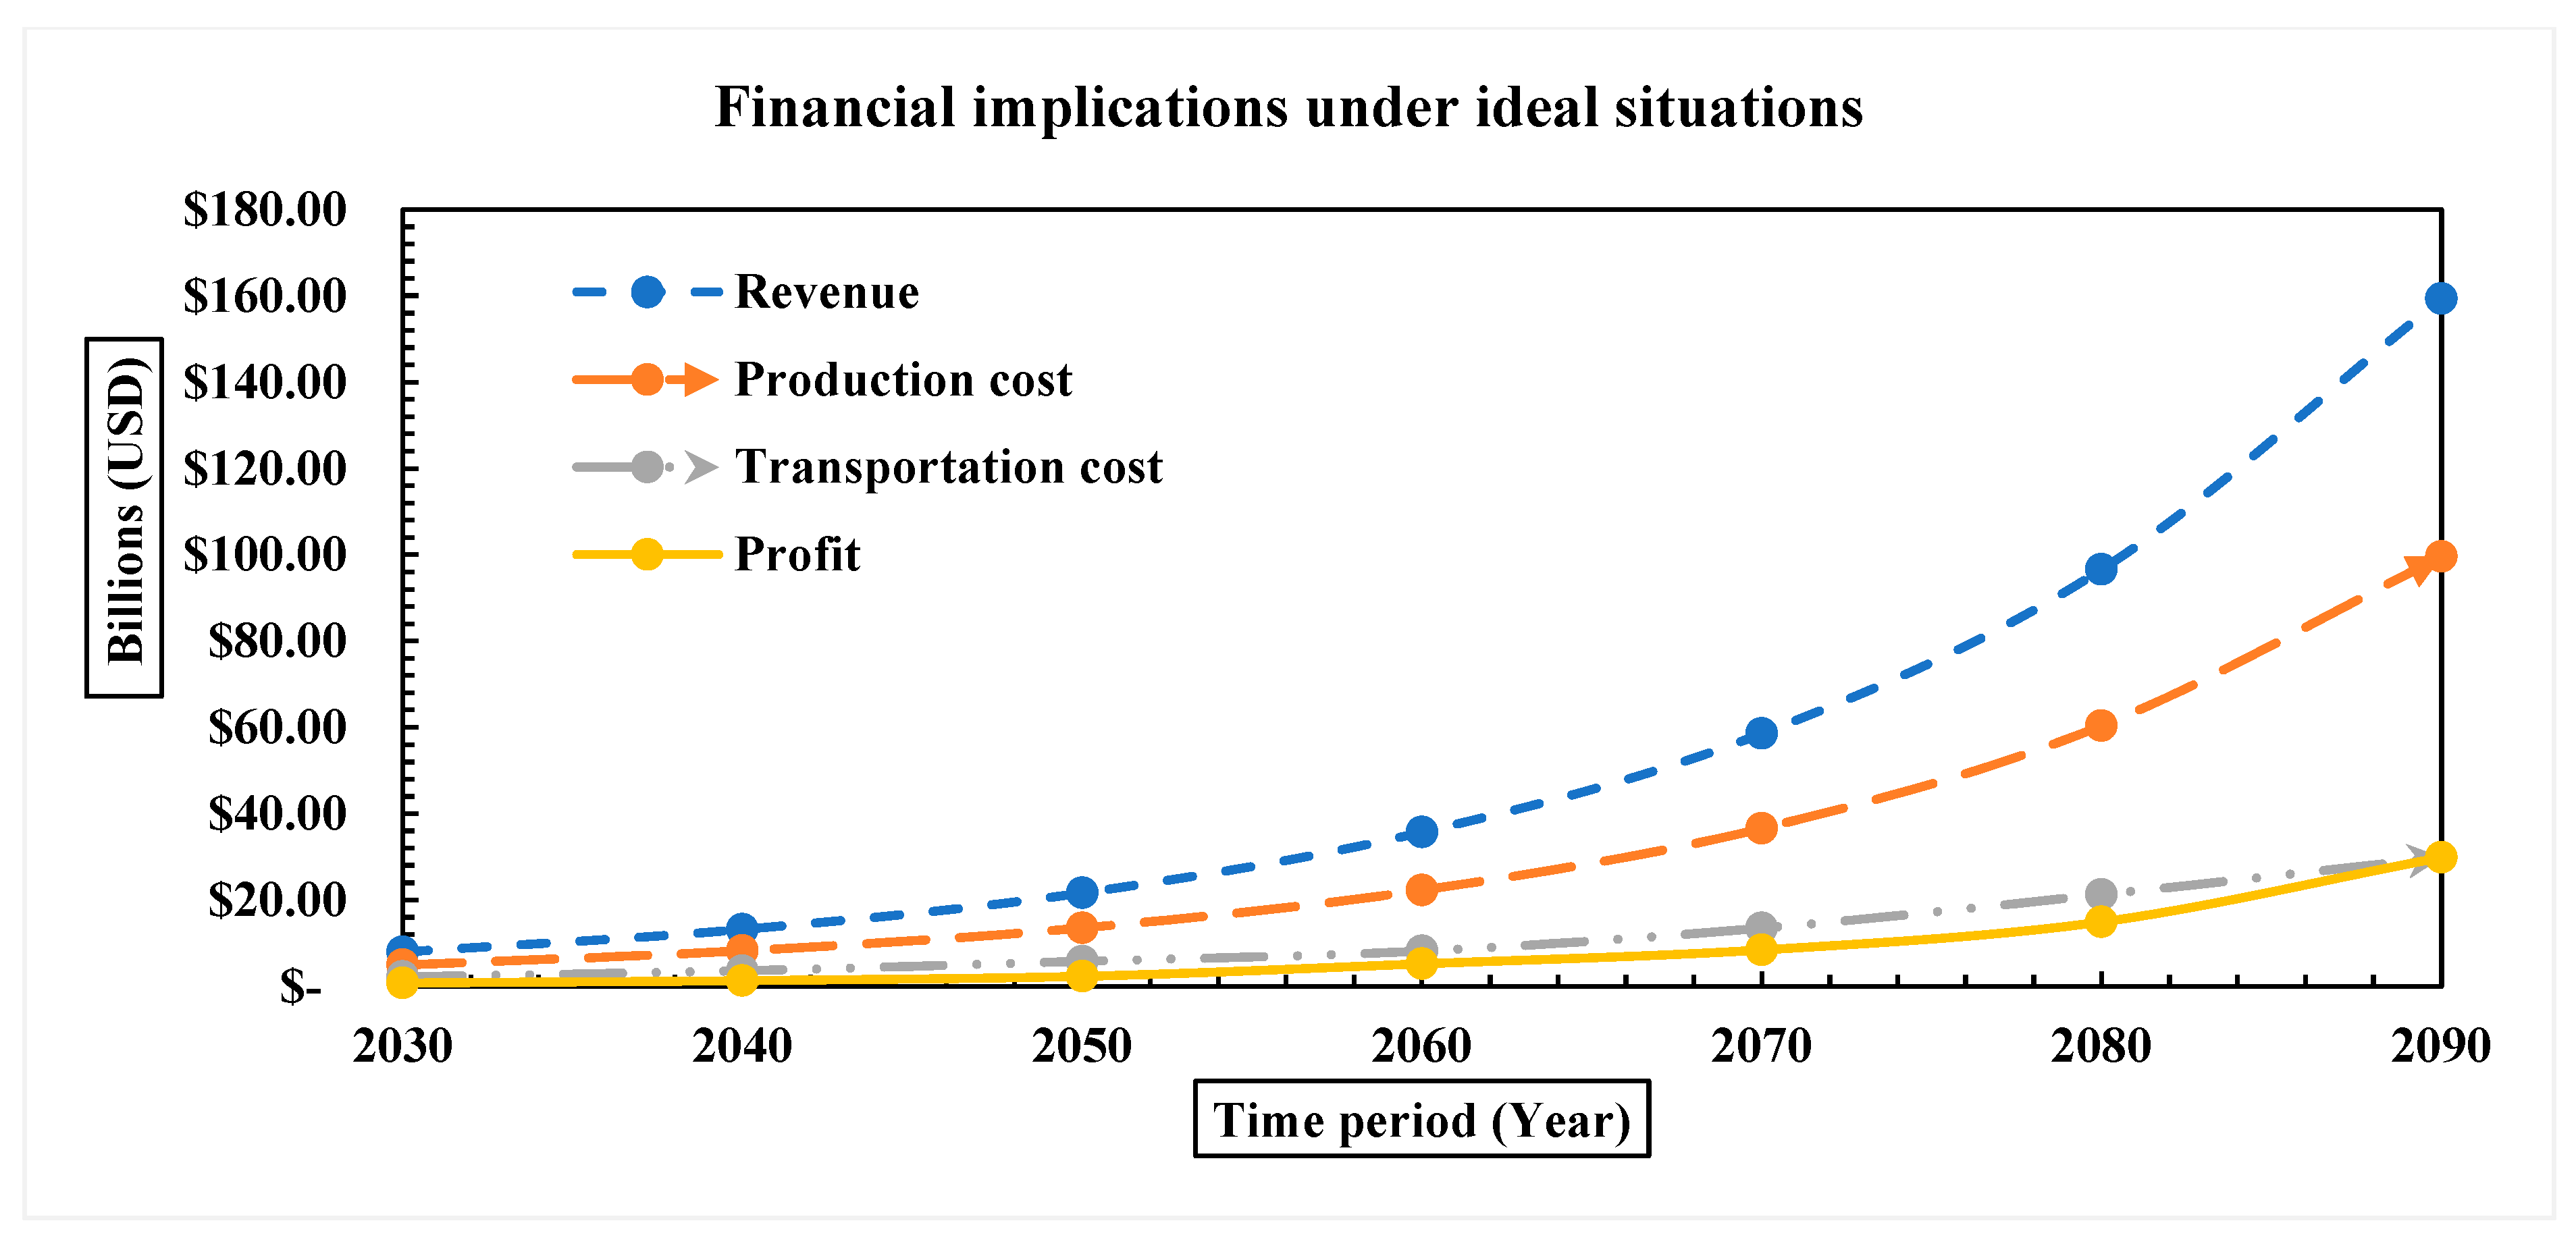
As illustrated in Figure 4, the results show positive year-on-year growth from 2030 to 2090. In 2030, with one NDC located in Portland and one RDC in Melbourne operating alongside 24 LDCs serving the surrounding areas, total revenue reaches USD 7.96 billion. Production and transportation costs amount to USD 4.97 billion and USD 2.21 billion, respectively, resulting in a profit of approximately USD 0.77 billion.
Figure 4.
Financial implications under ideal situations.
With additional RDCs established in Perth, Sydney, and Brisbane by 2040 and 2050, revenue increases due to enhanced operational capacity. By 2050, revenue reaches USD 21.67 billion, with profits of USD 2.31 billion. The addition of a second NDC in Bowen and further RDCs in Adelaide and Perth between 2060 and 2070 strengthens domestic connectivity and production capacity. Although both production and transportation costs increase during this period, profits continue to rise, reaching USD 8.47 billion by 2070.
In the mature stage of network development (2080–2090), the HHSC reaches full operational scale, with two NDCs, seven RDCs, and 65 LDCs distributed across all major regions. Revenue increases from USD 96.65 billion in 2080 to USD 159.36 billion in 2090, while profit rises from USD 14.96 billion to USD 29.9 billion.
The sensitivity analysis examines the impact of variations in production and transportation costs on HHSC profitability under ideal situations. Two sets of cost variations are analysed to assess how changes of ±5%, ±10%, ±15%, and ±20% in these cost components influence overall financial performance between 2030 and 2090. The sensitivity of profit to changes in production cost and transportation cost is evaluated to determine which factor has a greater influence over the system’s lifetime.
Production cost is inversely related to profit throughout the analysis period (refer to Figure A1). As production costs increase, profits decline in each year, with the lowest profit observed at a 20% increase. Conversely, reductions in production cost lead to a gradual increase in profit, with the highest profit occurring at a 20% decrease. The gap between these outcomes widens after 2070, when production volumes rise significantly to meet increasing hydrogen flows from NDCs to RDCs and LDCs. This highlights the importance of network optimisation, route efficiency, and cost-effective transportation modes in maintaining profitability as the HHSC expands nationally.
5.4. Disrupted-DC Situations Without Mitigation Strategies
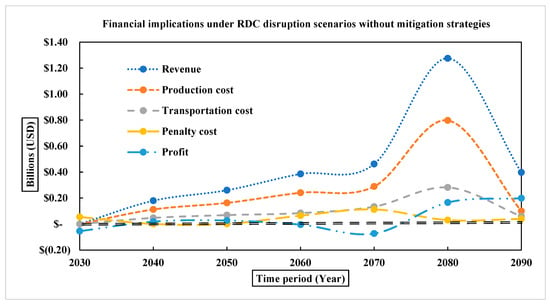
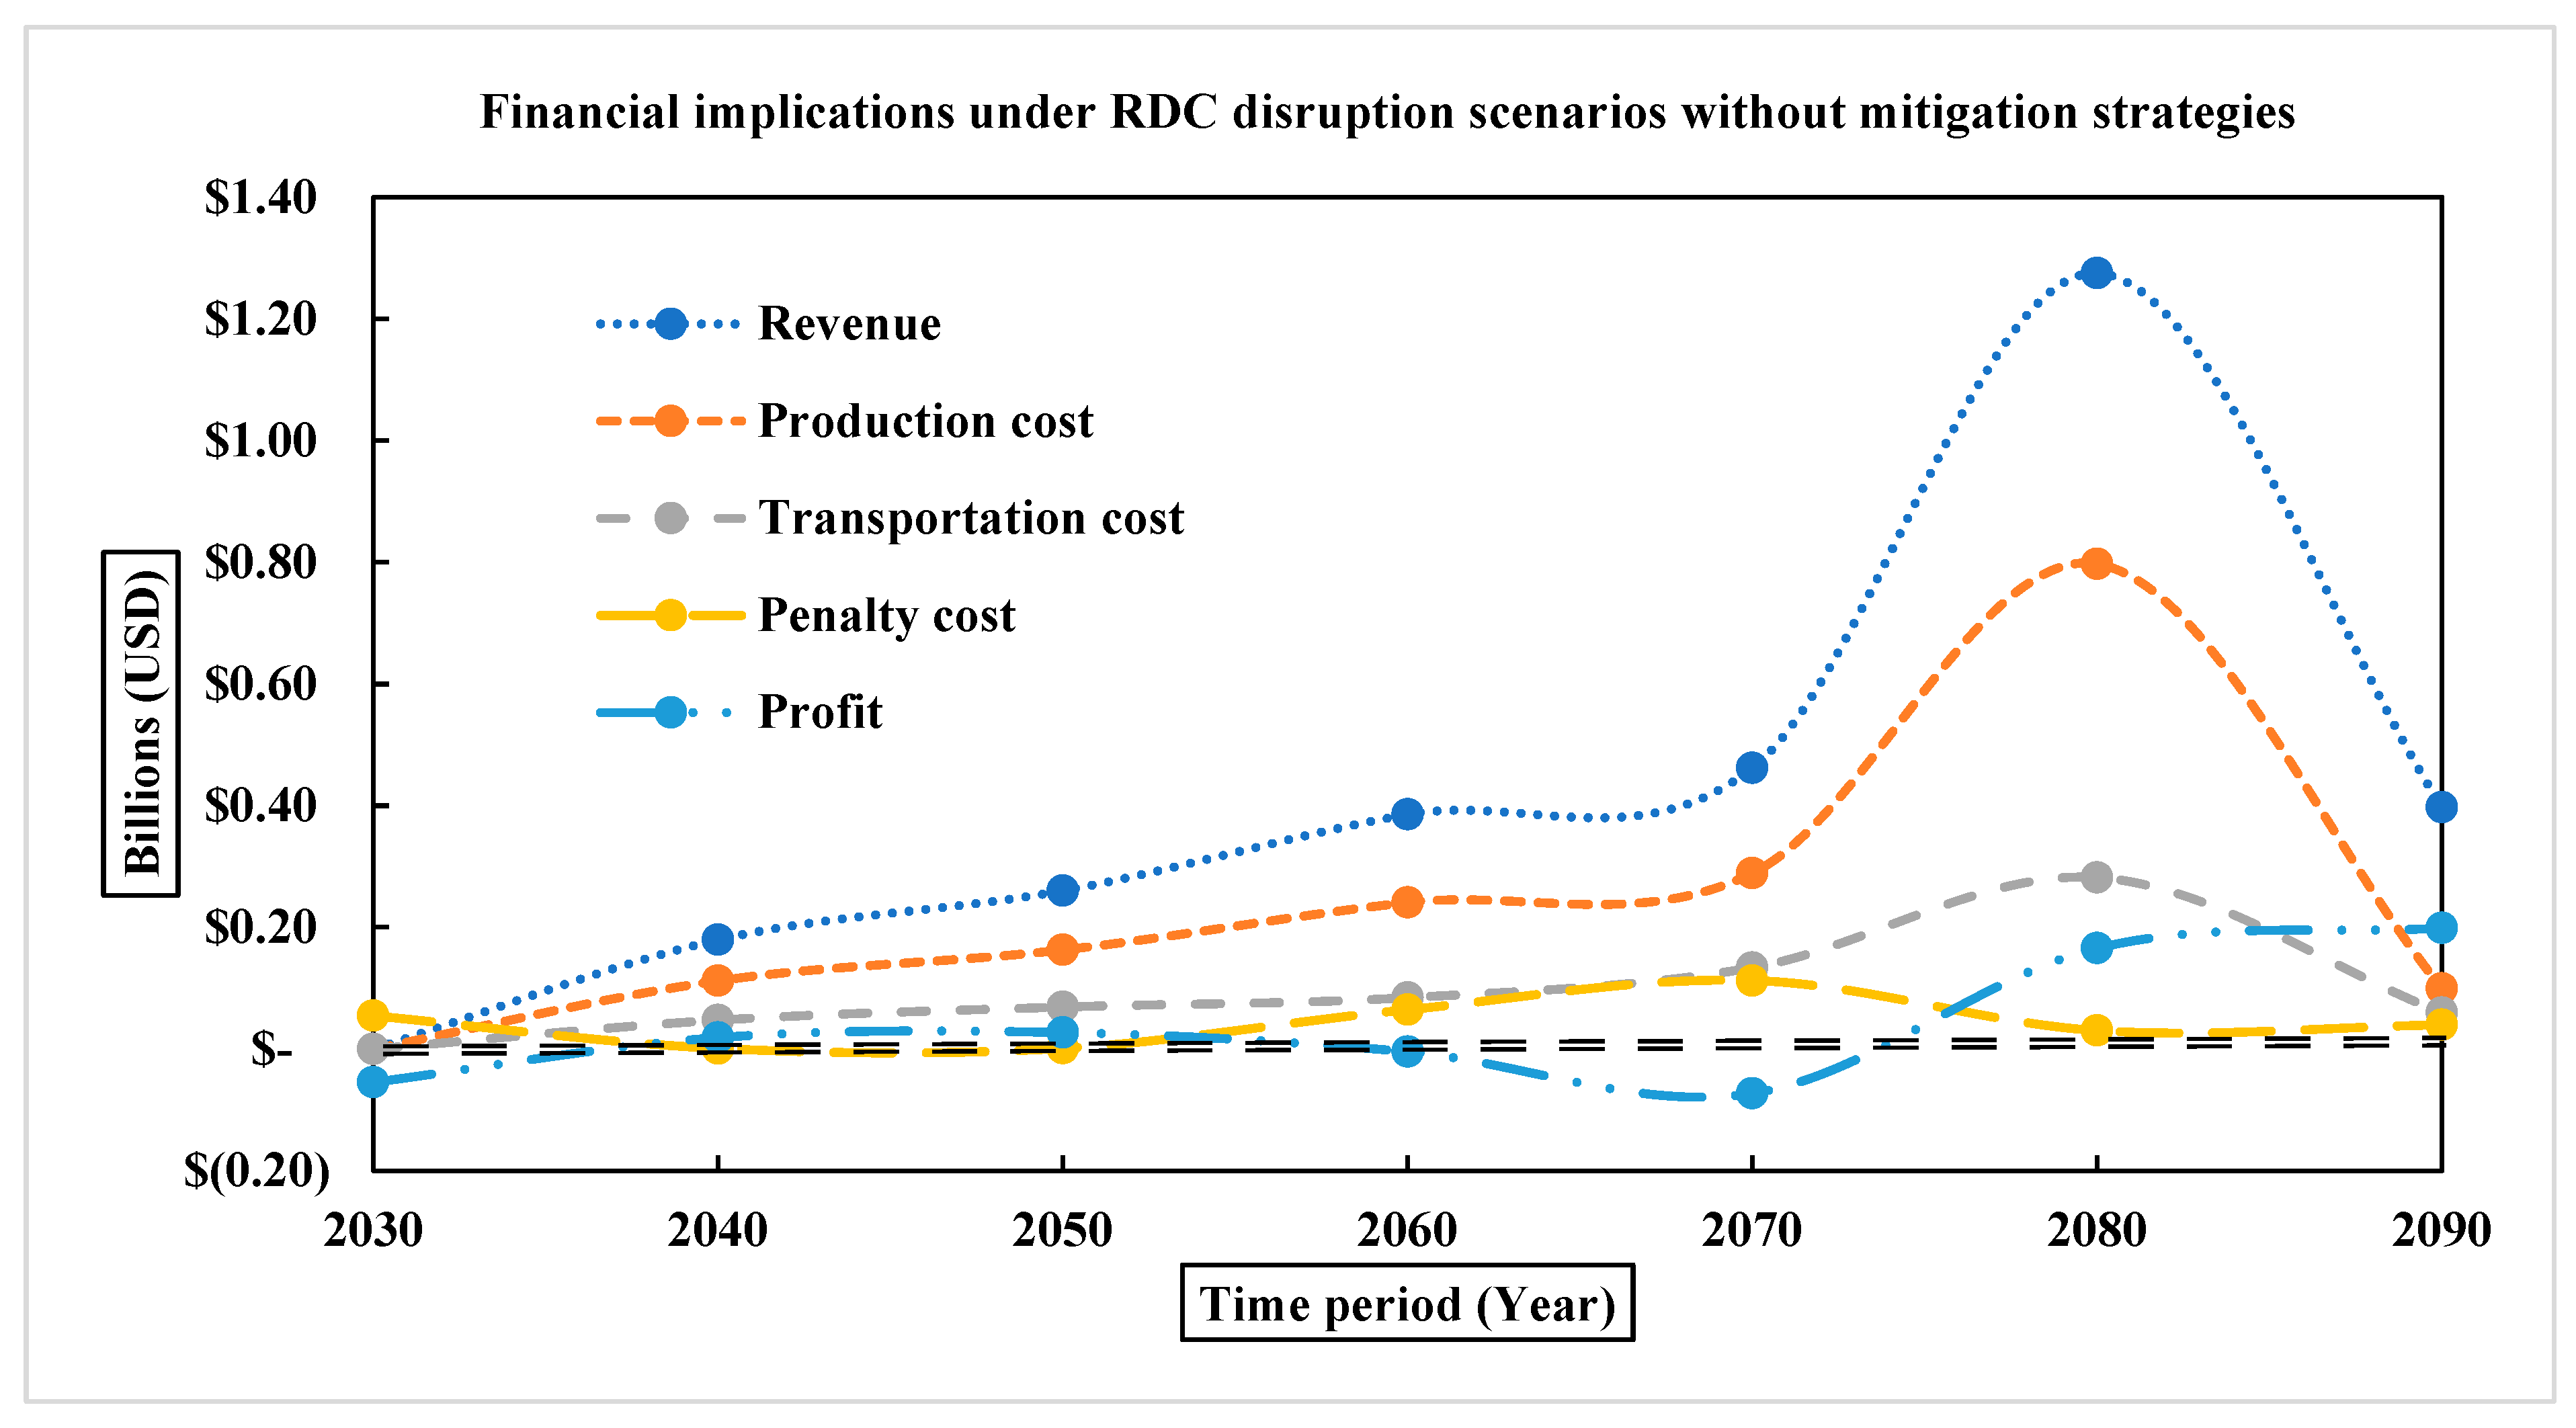
The financial implications and demand fulfilment rate of the HHSC under RDC disruption scenarios without mitigation strategies demonstrate pronounced instability throughout the period 2030–2090, reflecting the HHSC’s vulnerability to prolonged disruption. In 2030, the HHSC experiences severe financial impacts, generating no revenue and incurring penalty costs of USD 54.5 million, resulting in a total loss of the same amount and 0% demand fulfilment rate (refer to Figure A3). Between 2040 and 2050, financial implications improve as revenue rises from USD 179.5 million to USD 260.3 million, yielding a profit of USD 27.2 million, while the demand fulfilment rate increases from 52% to 61%, indicating partial operational recovery (refer to Figure 5). However, during 2060–2070, financial implications deteriorate sharply due to escalating production, transportation, and penalty costs exceeding USD 112 million, resulting in negative profits of USD 4.6 million and USD 73.1 million, respectively. Correspondingly, the demand fulfilment rate declines to 51–56%, reflecting significant operational inefficiencies and reduced HHSC reliability. This financial volatility is further reinforced by the sensitivity analysis of the HHSC under the same disruption scenarios, which reveals that profitability is highly influenced by cost variations. As illustrated in Figure A5, increases in production cost by 5–20% substantially reduce profits, particularly during the disruption-heavy years of 2060–2070, where losses can reach up to USD 119 million. Conversely, reductions in production cost by 5–20% enhance profitability considerably, achieving peak profit levels of approximately USD 370 million by 2090. A similar pattern is observed in Figure A6, where variations in transportation cost produce comparable impacts: rising transportation costs intensify losses during disruption periods, while cost reductions significantly accelerate financial recovery and ensure long-term stability.
Figure 5.
Financial implications under RDC disruption scenarios without mitigation strategies.
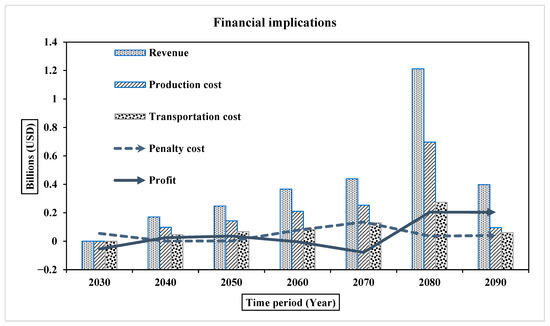
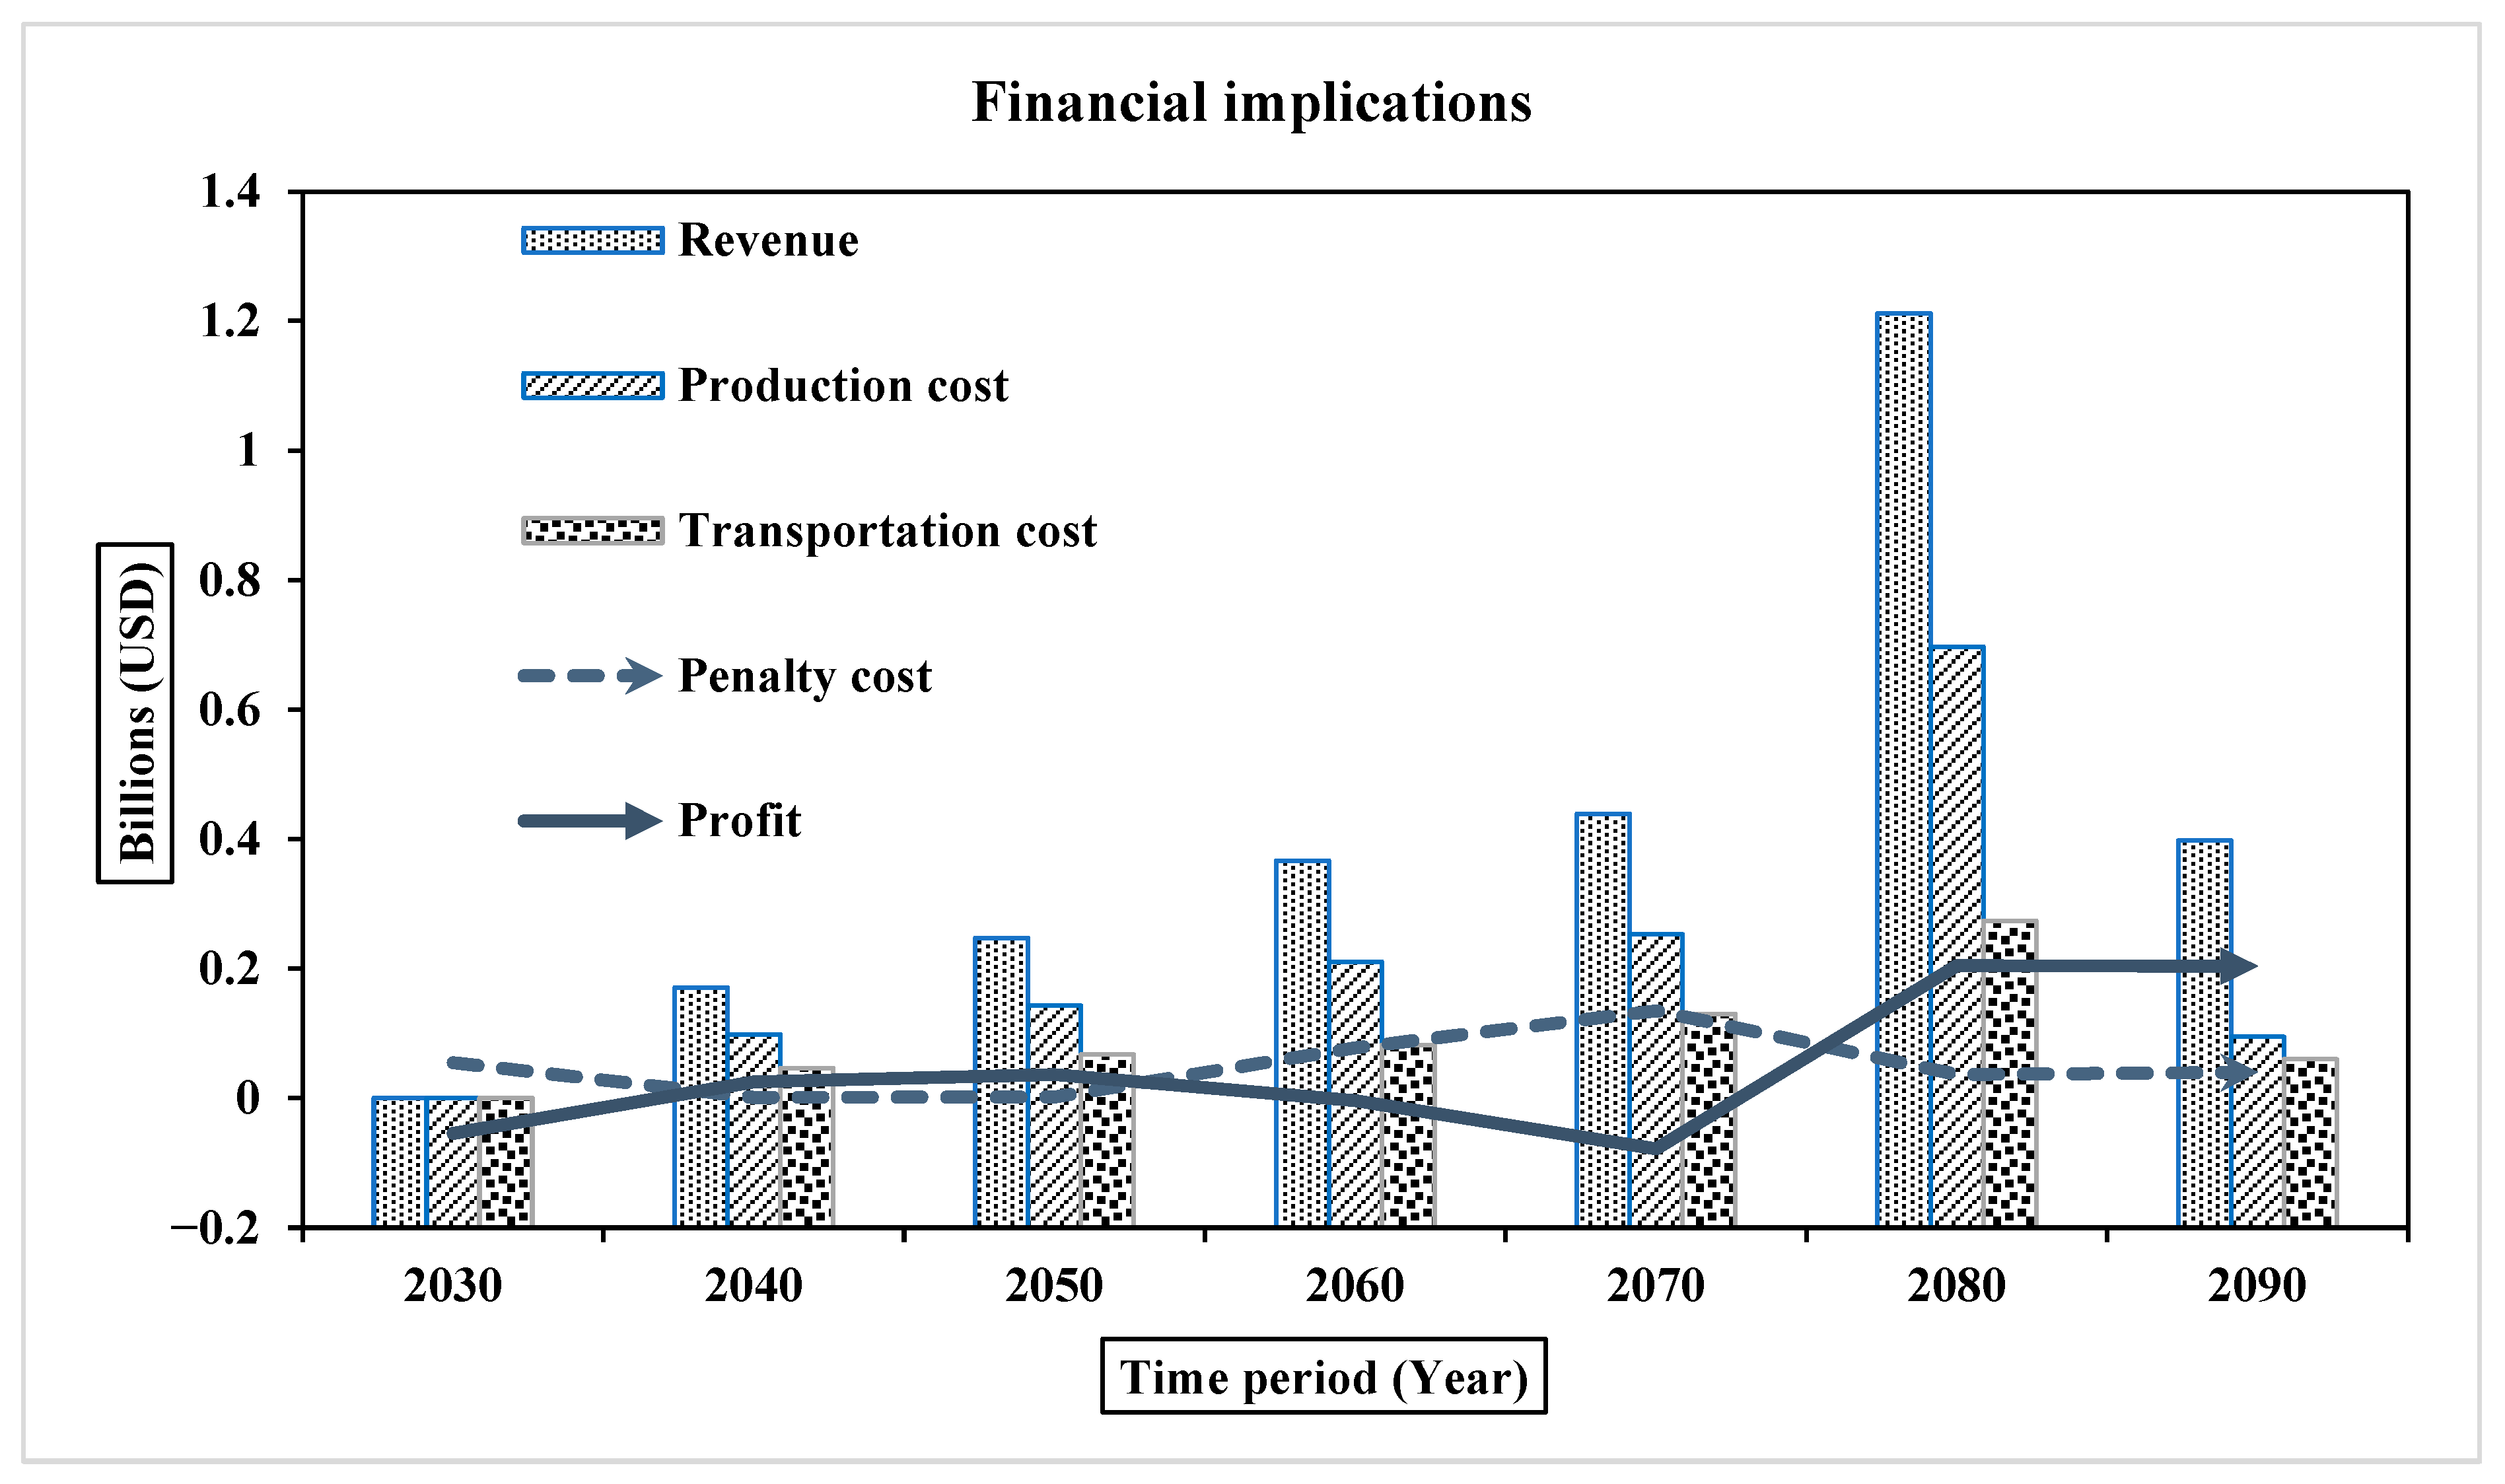
On the other hand, the financial impact and demand fulfilment rate of NDC disruption scenarios at HHSC without any mitigation strategies plotted over time from 2030 to 2090 demonstrates significant performance fluctuations, revealing the disruption timeline’s effect. By 2030, all operations at HHSC are entirely shut down, losing USD 0 in revenue and incurring USD 54.5 million in penalty costs. This scenario results in USD 54.5 million in losses with a 0% demand fulfilment rate (see Figure A4). From 2040 to 2050, there is a moderate financial recovery with increases in revenue from USD 170.5 million to USD 247.2 million and profits of USD 25.2 and USD 36.5 million, respectively. During this time, demand fulfilment also rises to between 51 and 62%. The financial impacts of prolonged disruption become more severe from 2060 to 2070 on HHSC due to heightened production costs, transportation costs, and penalty costs. Losses are between USD 3.97 million and USD 78.3 million, and demand fulfilment decreases to between 49 and 53% (refer to Figure 6). In 2080, a significant recovery can be seen as revenue jumps to USD 1.21 billion, profits rise to USD 204.7 million, and demand fulfilment rises to 64%. Profits remain positive in 2090 at USD 203.6 million with a 68% demand fulfilment rate.
Figure 6.
Financial implications under NDC disruption scenarios without mitigation strategies.
Additionally, the sensitivity analysis performed on HHSC, considering the same disruption scenarios, showed that the change in production and transportation costs has a strong influence on profitability. As illustrated in Figure A7, profit declines significantly as production cost increases by 5–20%, leading to losses of up to USD 133 million between 2060 and 2070. On the other hand, profit increases to USD 304 million in 2090 as production cost decreases by 5–20%. Figure A8 demonstrates that transportation cost increases and decreases have similar effects on profit-loss, implying that profit-loss further declines in the mid-term with cost increase, while HHSC returns to profitability after 2080 with cost decrease. In general, these observations suggest that the higher the increase in production and transportation costs, the lower the profitability of HHSC. Thus, proper cost optimisation and resilient HHSC planning can help reduce the negative impacts.
5.5. Disrupted-DC Situations with Suitable Mitigation Strategies
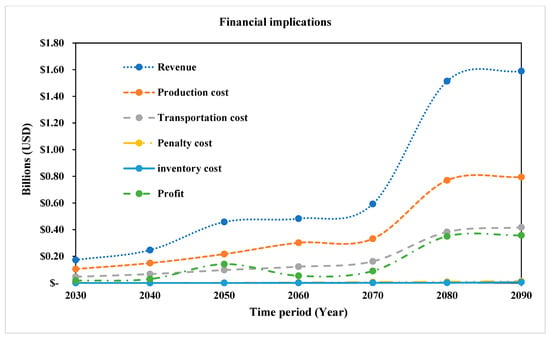
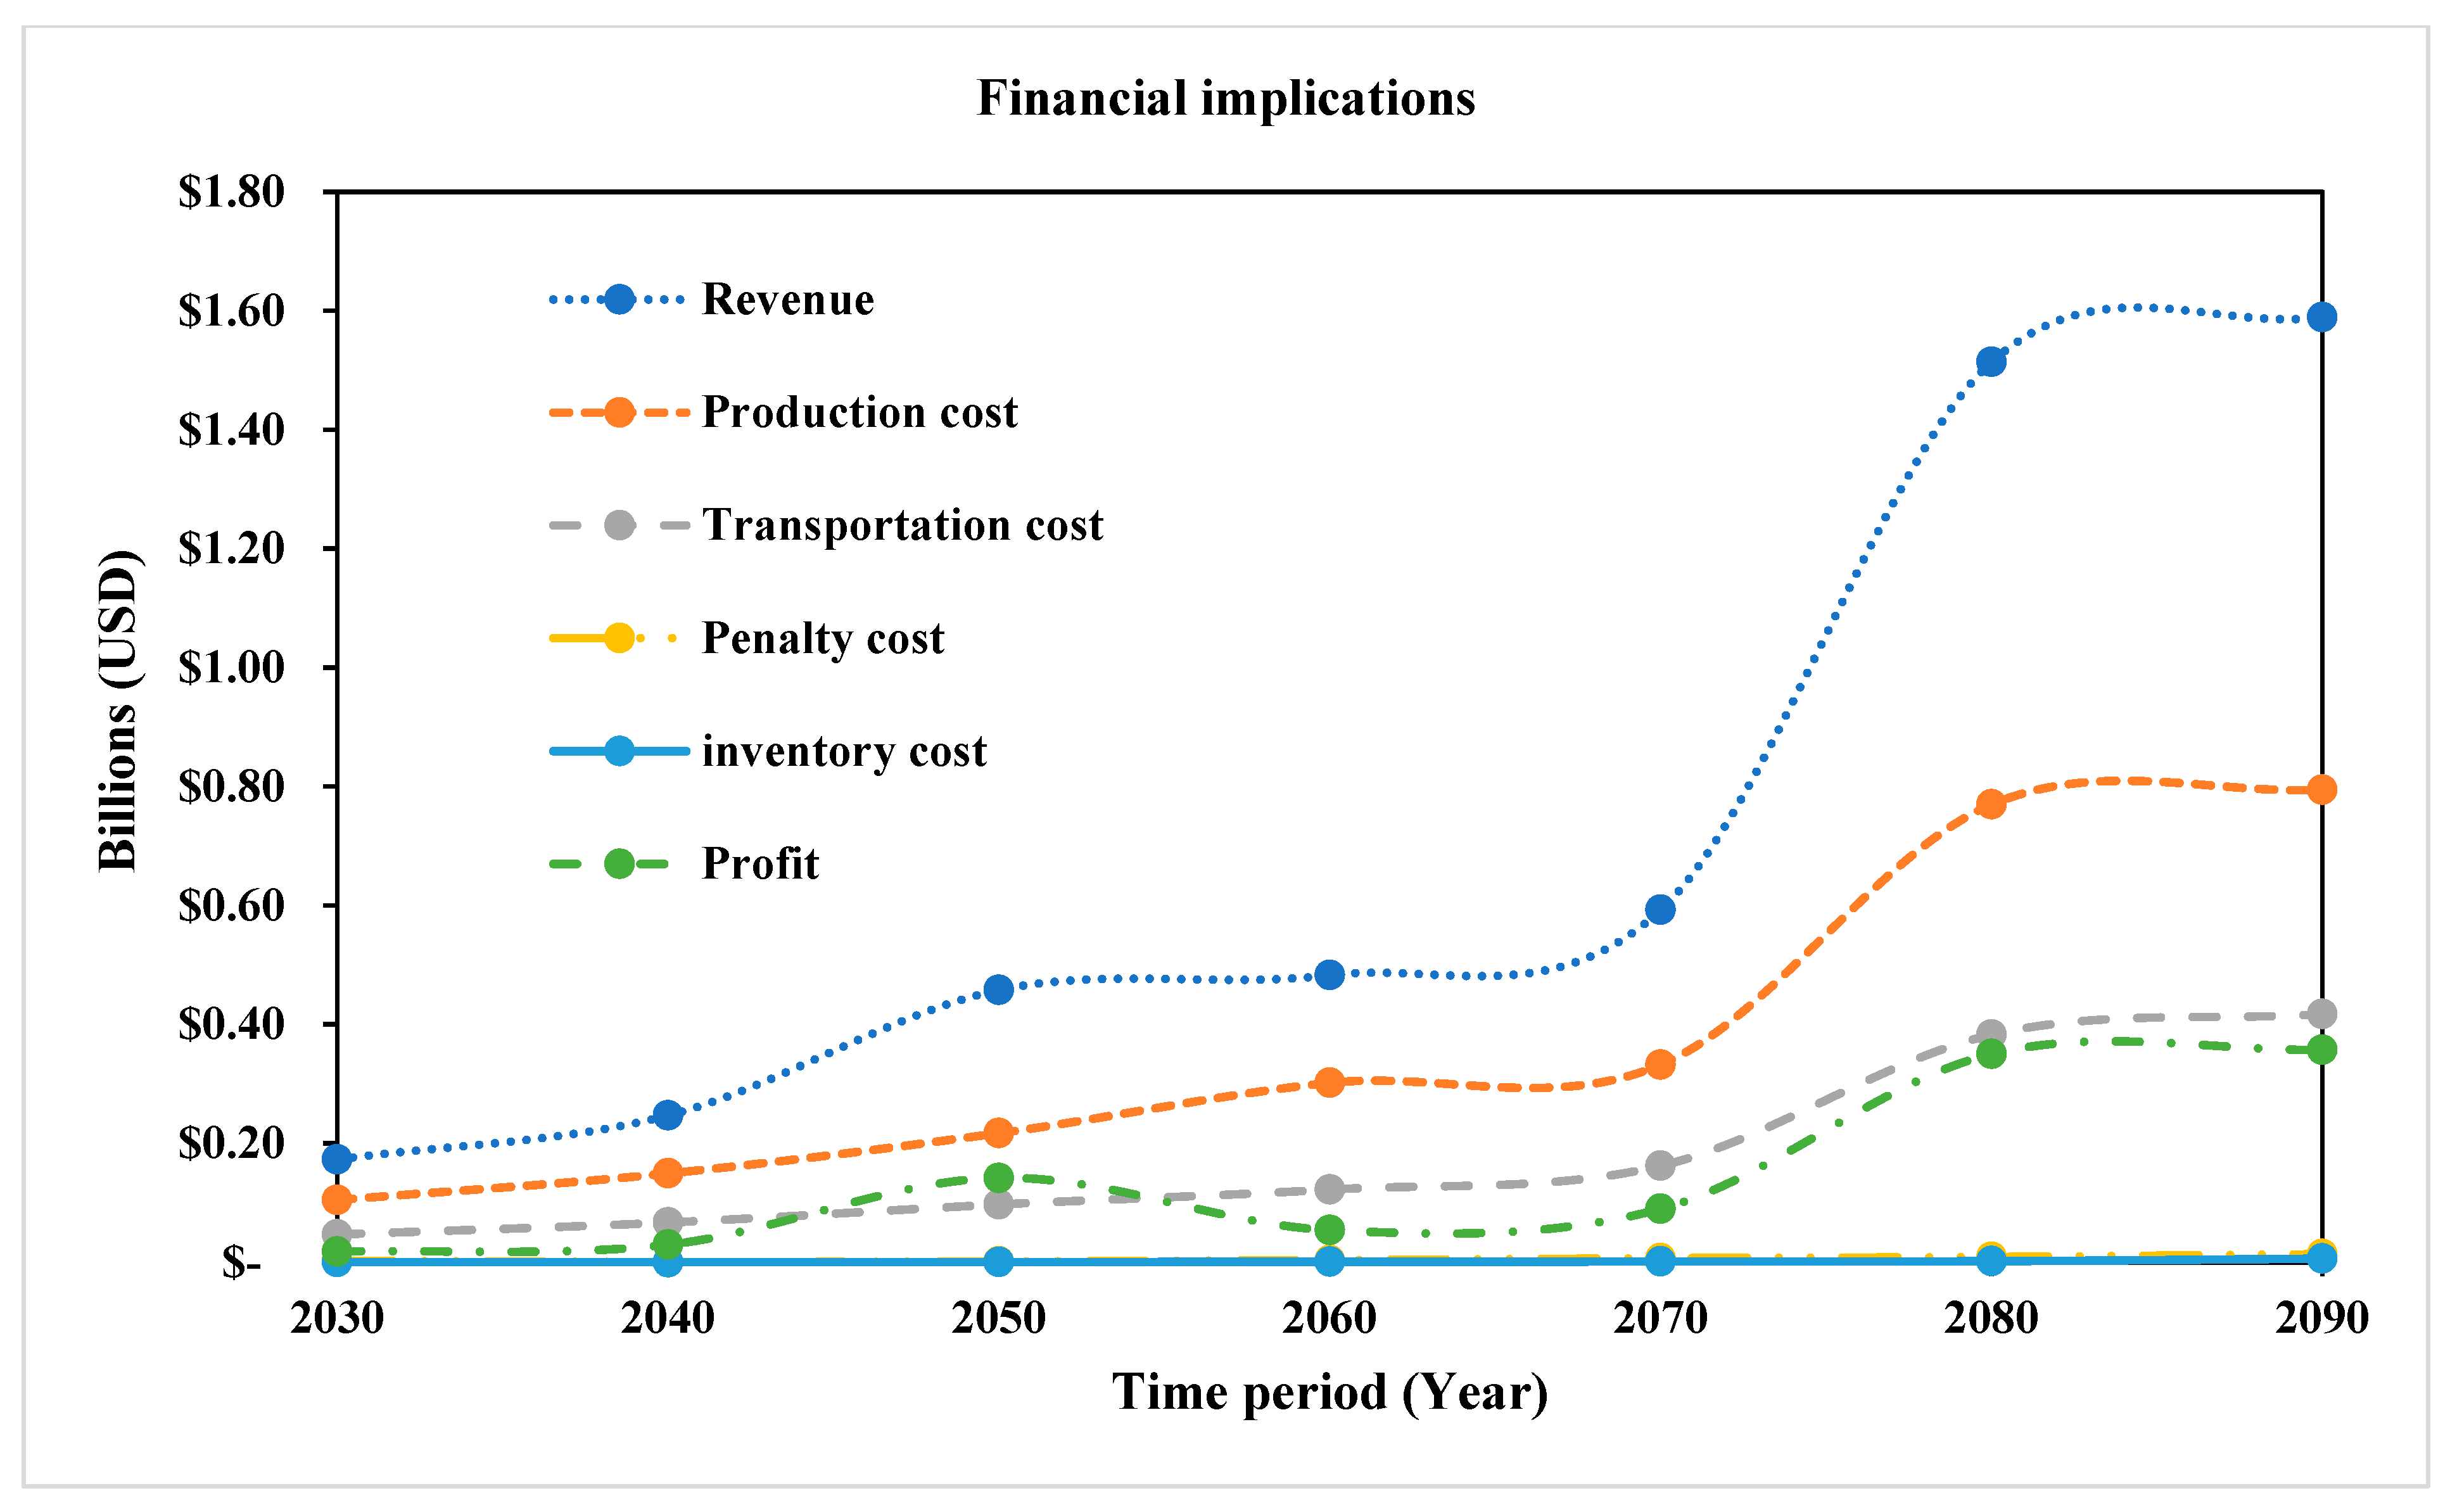
Figure 7 displays the predicted change in revenues, costs, and profits when enacting mitigation strategies under RDC disruption scenarios from 2030 to 2090. When examining the overall graph, it is observed that revenue increases throughout the years, reaching approximately USD 1.5 billion in 2090. Conversely, there are also substantial increases in production and transportation costs, which together constitute most expenses by 2090. However, a significant increase can be observed in production costs, rising from USD 104.79 million in 2030 to over USD 794.69 million in 2090, while transportation costs escalate from USD 46.91 million to USD 417.21 million over the same period. These increases are indicative of the implementation of suitable mitigation strategies. Even with these increased costs, profit continues to increase substantially. Profits in 2090 reach USD 357.31 million. This indicates that the costs of these mitigation strategies yield positive returns. Penalty and safety stock costs also increase, though to a lesser extent. The demand fulfilment rate supports this finding. In 2030, HHSC has a fulfilment rate of 60% that increases steadily to 95% by the year 2090.
Figure 7.
Financial implications under RDC disruption scenarios with suitable mitigation strategies.
In contrast, the profits associated with NDC disruption scenarios with suitable mitigation strategies are highly sensitive to changes in production costs and transportation costs. For instance, profits decline sharply when production costs increase by 20%, particularly toward the end of the century, where profits fall below USD 250 million, compared with a baseline profit of over USD 350 million in 2090 (refer to Figure A9). Profits also increase substantially when production costs decrease by 20%, exceeding USD 500 million by 2090. The years 2050 and 2080 are also highly sensitive to production cost variations, where small percentage changes in production costs result in tens of millions of dollars in profit differences.
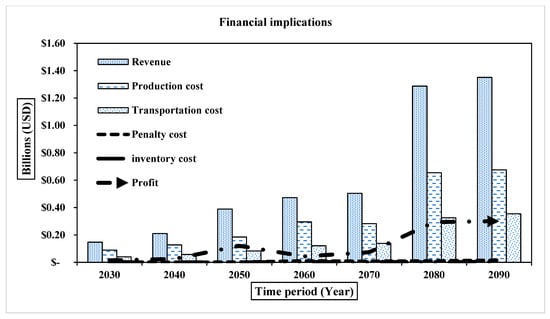
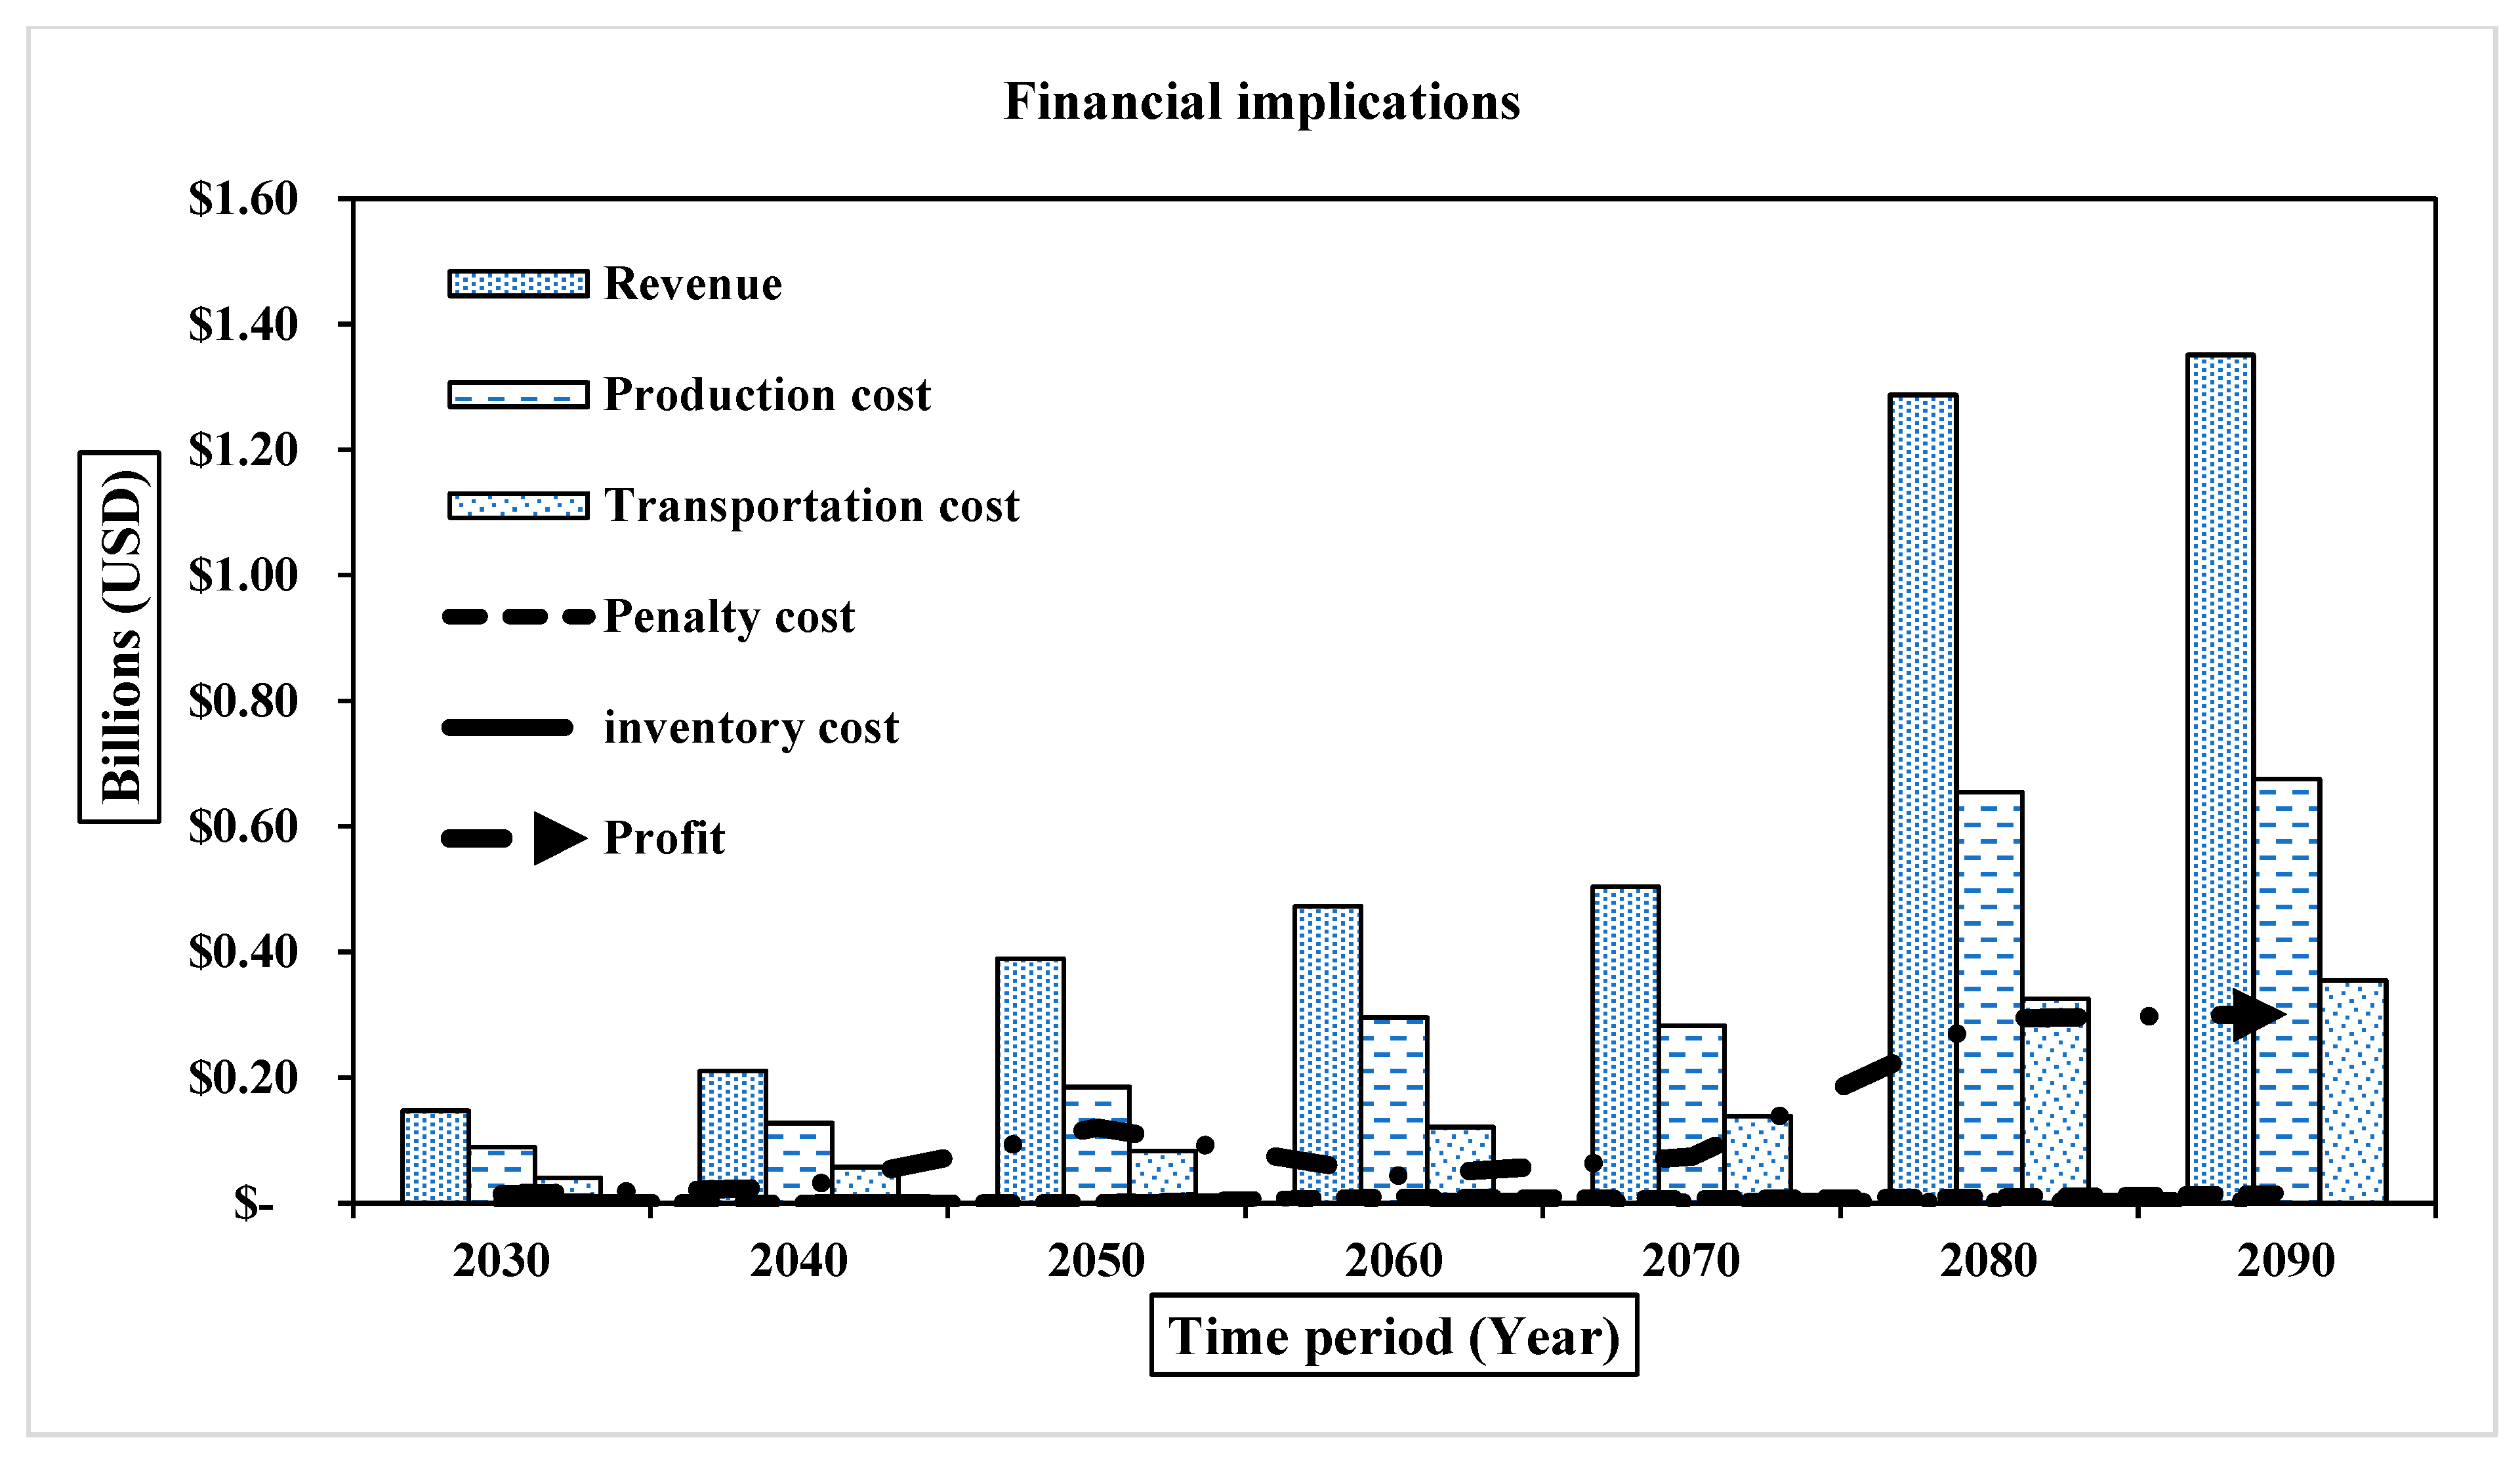
Another major variable with a strong impact, though slightly less pronounced, is changes in transportation costs. With a 20% increase in transportation costs, profits decrease by more than USD 65 million by 2090, while a 20% reduction in transportation costs increases profits by close to USD 80 million in 2090 (refer to Figure A10). This effect is amplified by scale and is most prevalent in years where operational scales are at their highest, such as 2080 and 2090. Taken together, these figures illustrate how critical cost management is for both production and transportation. Without a continuous commitment to cost efficiency, even in high-demand years, profits may not remain positive, and climate disruption mitigation efforts may fail. On the contrary, the financial implications from 2030 to 2090 depict both the cost burden of adaptation and gradual operational stabilisation. However, a sharp rise in revenue is observed over the period, increasing from under USD 150 million in 2030 to more than USD 1.3 billion by 2090 (refer to Figure 8). On the other hand, production and transportation costs increase in parallel, with production costs rising from below USD 100 million to nearly USD 700 million, and transportation costs rising from around USD 40 million to over USD 350 million.
Figure 8.
Financial implications under NDC disruption scenarios with suitable mitigation strategies.
Moreover, penalty costs, associated with unmet demand, illustrate an upward shift, peaking at nearly USD 16 million by 2090. Safety stock maintenance costs, though relatively small in proportion, also rise consistently from below USD 1 million to nearly USD 4 million.
Profit demonstrates variability but improves significantly after mid-century, exceeding USD 300 million by 2090. The percentage of demand met increases from around 52% to beyond 80%.
The sensitivity analysis shows that profit varies due to changes in transportation and production costs under NDC disruption scenarios with suitable mitigation strategies. If there is a 20% increase in production costs, that results in substantial downward shifting in profitability throughout the periods, where profits become negative by 2060, even when mitigation strategies are applied (see Figure A11). In contrast, when production costs decrease by 20%, profits rise sharply to just over USD 420 million by 2090.
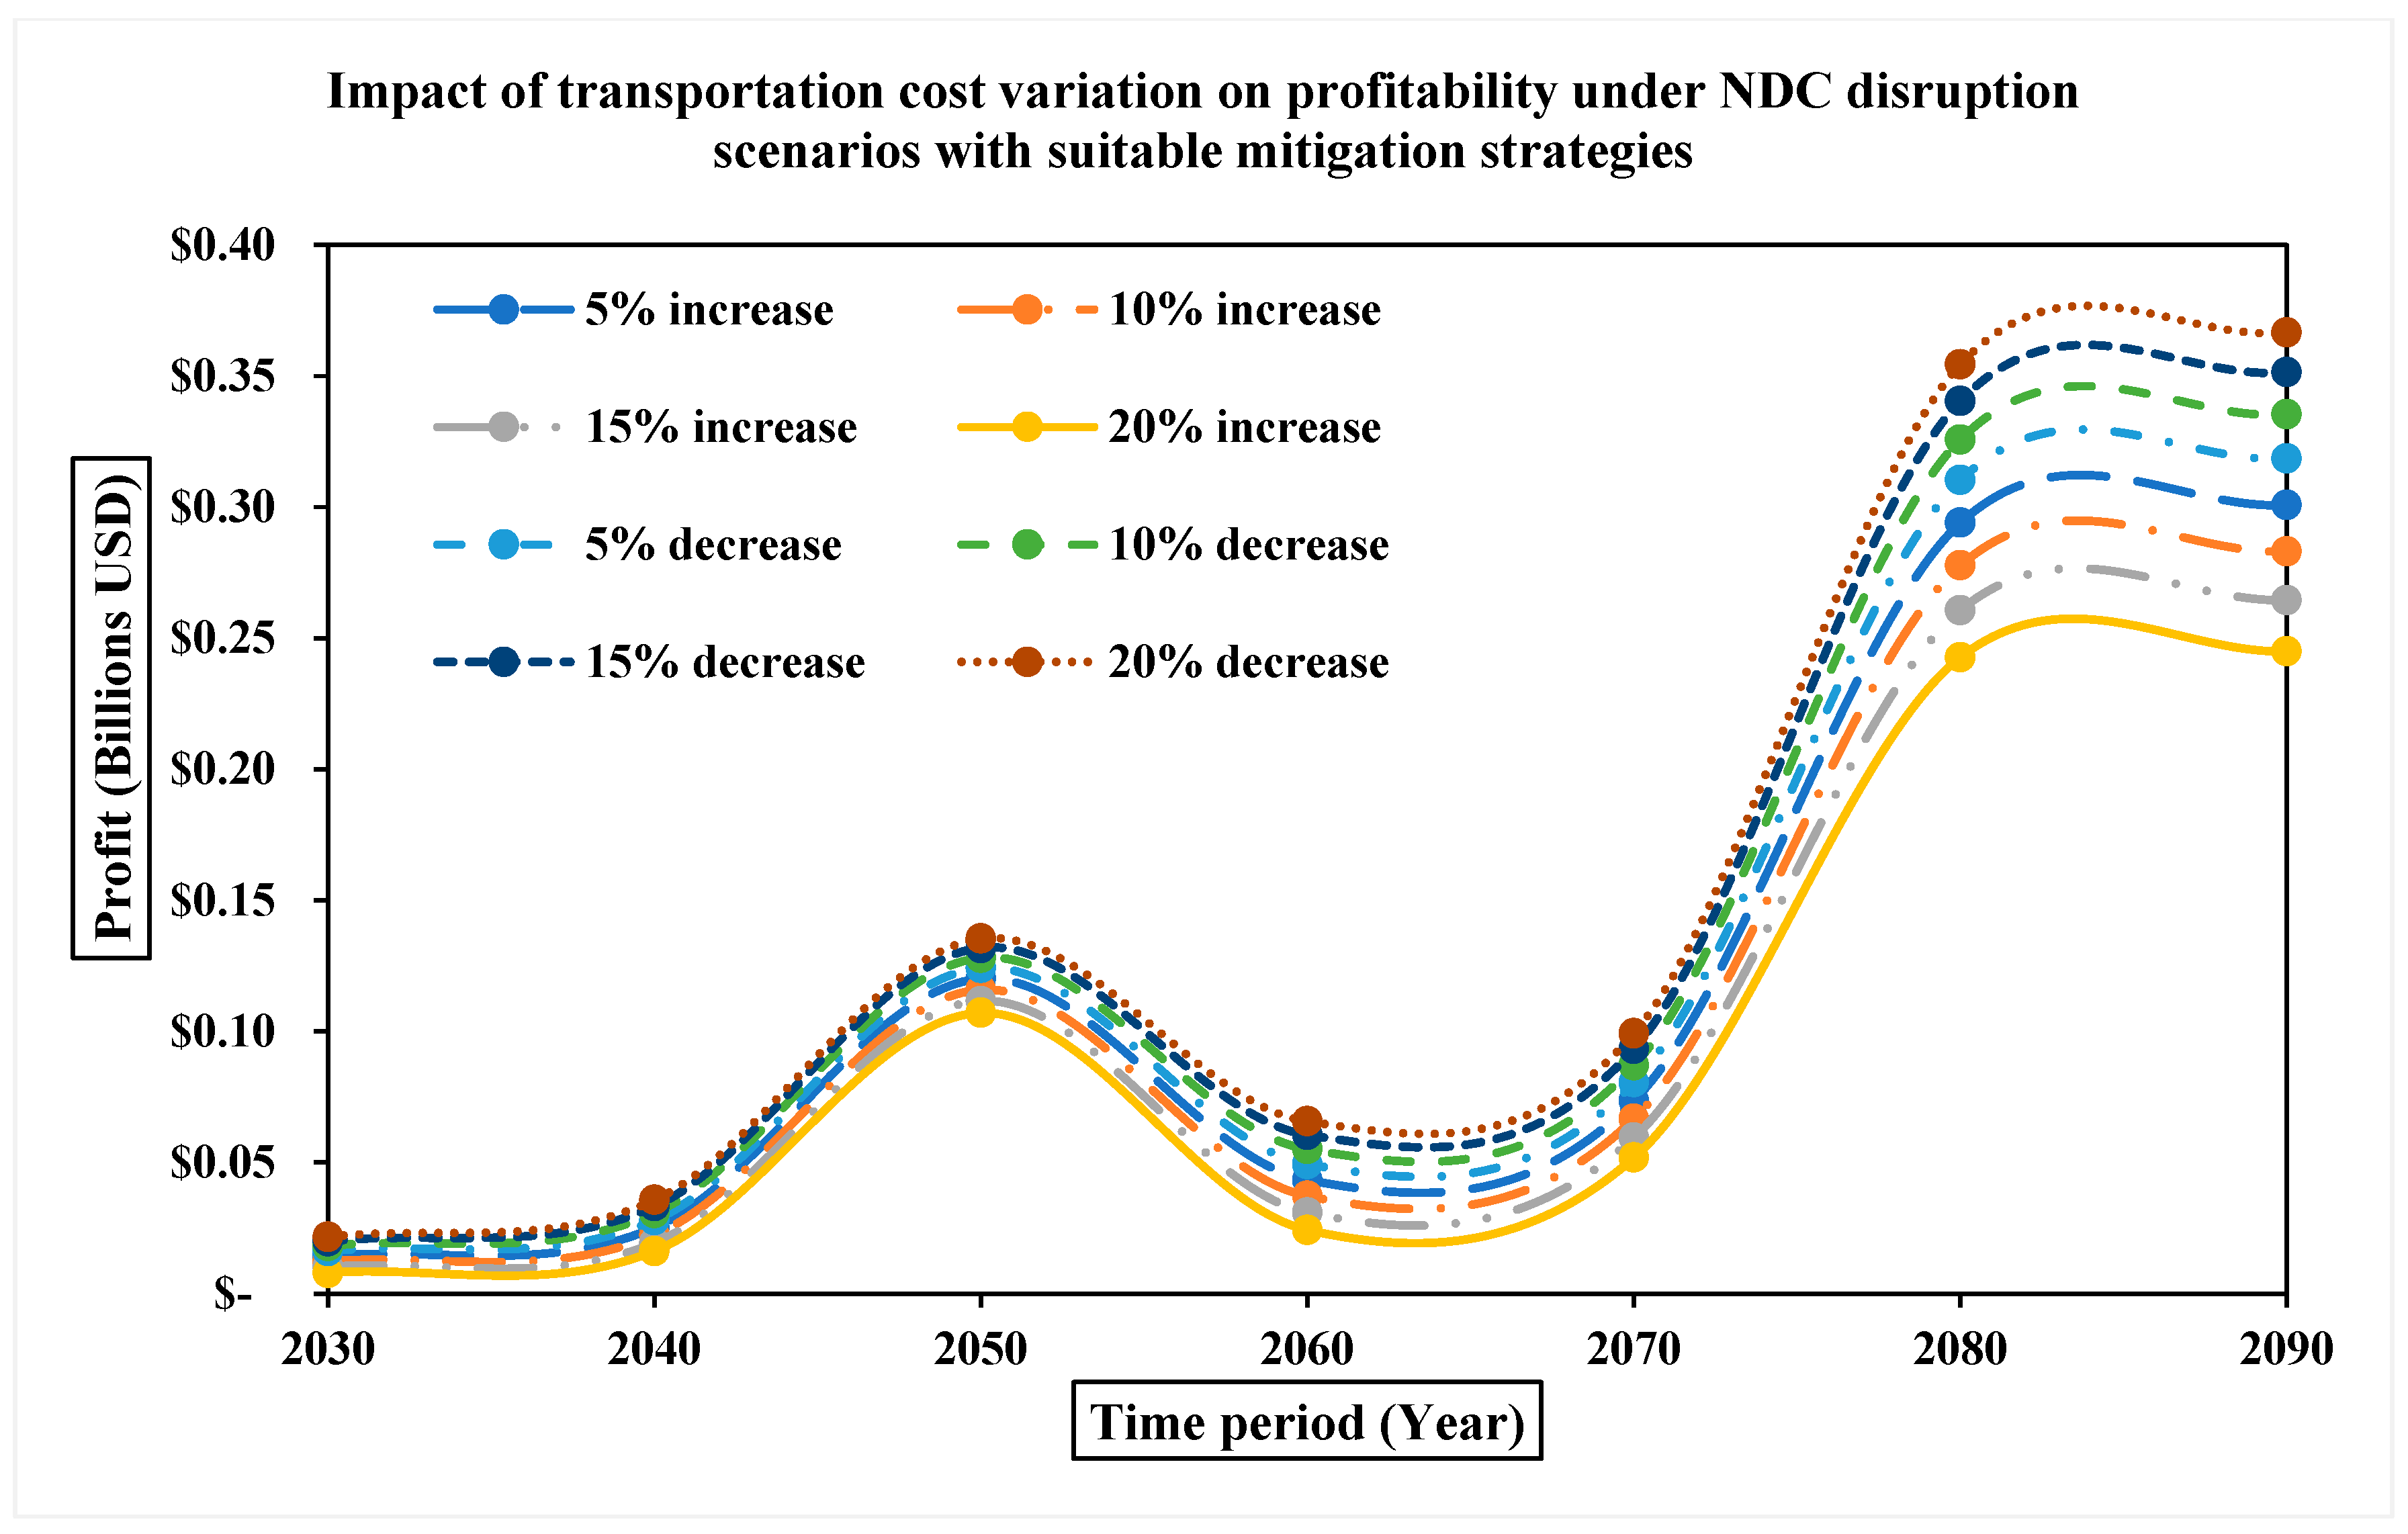
On the other hand, profitability is sensitive to changes in transportation cost, though to a lesser extent. If transportation costs increase by 20%, profit margins decline, with expected profits falling to around USD 245 million by 2090 (refer to Figure A12). Conversely, when transportation costs decrease by 20%, profitability increases, pushing profits to just over USD 366 million by 2090. This impact grows over time, correlating with the HHSC network becoming larger and more logistically complex.
5.6. Comparison Between the Disrupted Operations with and Without Mitigation Strategies
The comparison between RDC disruption scenarios with and without mitigation strategies highlights the central role of demand fulfilment in determining profitability. In scenarios without mitigation, demand fulfilment remains low across several years, dropping to 0% in 2030 and reaching only 69% by 2090 (see Table 1). These low fulfilment levels are accompanied by high penalty costs, which peak at approximately USD 7 billion in 2090 and substantially offset revenue gains. As a result, profits become negative in 2060 and 2070 despite rising revenues, driven primarily by penalty costs associated with unmet demand.
Table 1.
Comparison between the RDC disruption scenarios with and without mitigation strategies.
In contrast, the implementation of mitigation strategies leads to significantly higher demand fulfilment, increasing to 95% by 2090. This improvement is associated with consistently lower penalty costs and sustained profitability, with profits exceeding USD 350 million in the final years. Overall, the results show that higher demand fulfilment directly reduces penalty costs and enables a larger share of revenue to be converted into profit. Consequently, improving demand fulfilment is critical for limiting financial losses and achieving stable profit growth under disruption scenarios.
Moreover, the comparison between NDC disruption scenarios with and without mitigation strategies highlights the critical influence of demand fulfilment, which has a direct impact on profitability. Without mitigation strategies, demand fulfilment remains low across all years, beginning at 0.00% in 2030 and only reaching 68.00% by 2090 (refer to Table 2). However, this low fulfilment is directly associated with high penalty costs, which substantially reduce profitability. For example, in 2070, revenue exceeds USD 430 million, yet penalty costs rise to USD 135 million, resulting in a net loss of over USD 91 million. Similarly, in 2060, low demand fulfilment of 49.00% leads to a penalty cost of USD 77.8 million and negative profit. In contrast, implementation of mitigation strategies improves demand fulfilment, which rises to 80.75% by 2090. These improvements are accompanied by significantly lower penalty costs and stronger profitability. For instance, in 2050, demand fulfilment increases from 62.00% to 79.05%, and profit rises from $29 million to $120 million. In later years, profits exceed $300 million, supported by reduced penalties and higher effective revenue.
Table 2.
Comparison between the NDC disruption scenarios with and without mitigation strategies.
6. Discussion, Policy and Managerial Implications
The findings of this study provide important practical implications for both policymakers and supply chain managers working to strengthen the HHSC. From a policymaker’s perspective, the results demonstrate that mitigation strategies can improve demand fulfilment and profitability, supporting the case for regulatory incentives or mandates. Policy regulations may include minimum-resilience criteria that RDCs and NDCs must satisfy, such as having flexible operating time windows and maintaining a certain amount of safety stocks. In similar decentralised energy systems, such as LPG distribution networks, regulatory mandates for buffer safety stock and alternative routing options have proven effective in avoiding service discontinuity during disrupted situations [35,36]. Finally, subsidies or incentive programmes could directly motivate supply chain actors to take measures that increase mitigation potential while remaining economically sound. Such approaches could help align private operating decisions with objectives to enhance HHSC resilience. These measures are particularly important under faster adoption timelines, where hydrogen demand grows rapidly before supporting infrastructure can fully mature [33,37].
On the managerial side, operators of NDCs and RDCs must integrate disruption response mechanisms into their standard planning frameworks. As demonstrated by the comparative analysis in this study, rerouting hydrogen through unaffected NDCs or RDCs and utilising spare capacities at RDCs can significantly improve both demand fulfilment and financial implications. These strategies should be supported by dynamic decision-support tools capable of real-time monitoring of facility status, tanker and truck availability, and safety stock levels across the HHSC [9]. In decentralised systems, where decision-making is fragmented, such tools can provide the coordination otherwise absent from the market structure. Additionally, safety stock policies must be re-evaluated to reflect the asymmetric impact of disruptions at different stages of the HHSC. For example, disruptions at NDCs affected upstream material availability, while disruptions at RDCs led to downstream shortages closer to LDCs. From a managerial and policy perspective, the results indicate that investments aimed at strengthening supply chain robustness increase upfront costs but significantly reduce the risk of large financial losses caused by unmet demand. Under disrupted situations, unmet demand is the primary driver of penalty costs and lost revenue, particularly in competitive markets where coordination and recovery options are limited. The findings show that beyond moderate levels of disruption, avoided penalties and recovered revenue outweigh additional investment costs, supporting these measures as economically justified risk-mitigation decisions rather than operational inefficiencies. Managers should adopt differentiated safety stock planning approaches, ensuring that RDCs maintain higher safety stock thresholds to cushion against RDC failures. This is supported by research in analogous supply chains, where location-specific safety stock buffers reduced service failure rates and improved recovery times [6]. Consequently, such measures should be viewed as economically justified risk-mitigation decisions rather than operational inefficiencies. Overall, this study presents evidence that a coordinated yet decentralised approach to resilience is necessary in the HHSC. By implementing enabling policies, investing in flexible operations, and using optimisation for data-driven contingency planning, public- and private-sector actors can work to ensure HHSC performs well. Achieving this goal is necessary to ensure hydrogen is reliably delivered to Australian households, as well as to satisfy its net-zero objectives.
7. Conclusions and Future Research Directions
This study focused on the impact of disruptions at DCs, such as NDCs and RDCs, within the HHSC under rapid-adoption pathways and perfect-competition market conditions. Three situations were considered: ideal operations, disruptions without mitigation strategies, and disruptions with suitable mitigation strategies. The findings illustrate that disruptions at NDCs and RDCs can adversely affect demand fulfilment, leading to higher penalty costs and reduced profitability across the HHSC. Conversely, incorporating mitigation strategies improves HHSC resilience as well as material flows and financial outcomes.
This study also has several limitations that indicate promising avenues for further research. Uncertainty in demand, costs, and disruption duration is not considered, as all parameters are deterministic. This limitation could be addressed by employing stochastic or robust optimisation methods. Additionally, perfect-competition market conditions are assumed. Extending the approach to mixed or regulated markets would enable systematic comparison of coordination, investment incentives, and operational outcomes under alternative regulatory regimes.
Future research can build on this work by extending the modelling approach in several targeted and complementary directions. First, stochastic disruption modelling could be incorporated to represent uncertainty in disruption duration and severity, allowing a more realistic assessment of risk and recovery dynamics. Second, agent-based or game-theoretic extensions could be used to capture decentralised decision-making and strategic interactions among competing supply chain actors, which are particularly relevant under competitive-market conditions. Third, incorporating spatially explicit transport modelling, including dynamic routing and congestion effects, would improve the representation of distribution-level operations and operational bottlenecks. Fourth, comparative analysis across different market conditions, including regulated, hybrid, and monopoly settings, would allow systematic evaluation of coordination, investment incentives, and system performance relative to perfect competition. Finally, policy-instrument modelling, such as subsidies or mandatory robustness requirements, could be embedded directly within the optimisation approach to assess the effectiveness of regulatory interventions under disruption situations.
Author Contributions
Conceptualization, S.K.P. and S.C.S.; Methodology, P.C.; Software, P.C.; Validation, P.C.; Formal analysis, P.C.; Investigation, P.C.; Data curation, P.C.; Writing—original draft, P.C.; Writing—review & editing, S.K.P., A.T. and S.C.S.; Supervision, S.K.P., A.T. and S.C.S.; Project administration, S.C.S. All authors have read and agreed to the published version of the manuscript.
Funding
The research is supported by UTS FEIT scholarship.
Data Availability Statement
The original contributions presented in this study are included in the article. Further inquiries can be directed to the corresponding author.
Conflicts of Interest
The authors declare no conflict of interest.
Appendix A
Table A1.
Nomenclature (Parameters and variables for NG phase-out and renewable adoption).
Table A2.
Nomenclature (Parameters, variables and sets for multi-period network optimisation).
Table A3.
Value of the parameters for multi-period network optimisation.
Figure A1.
Impact of production cost variation on profitability under ideal situation.
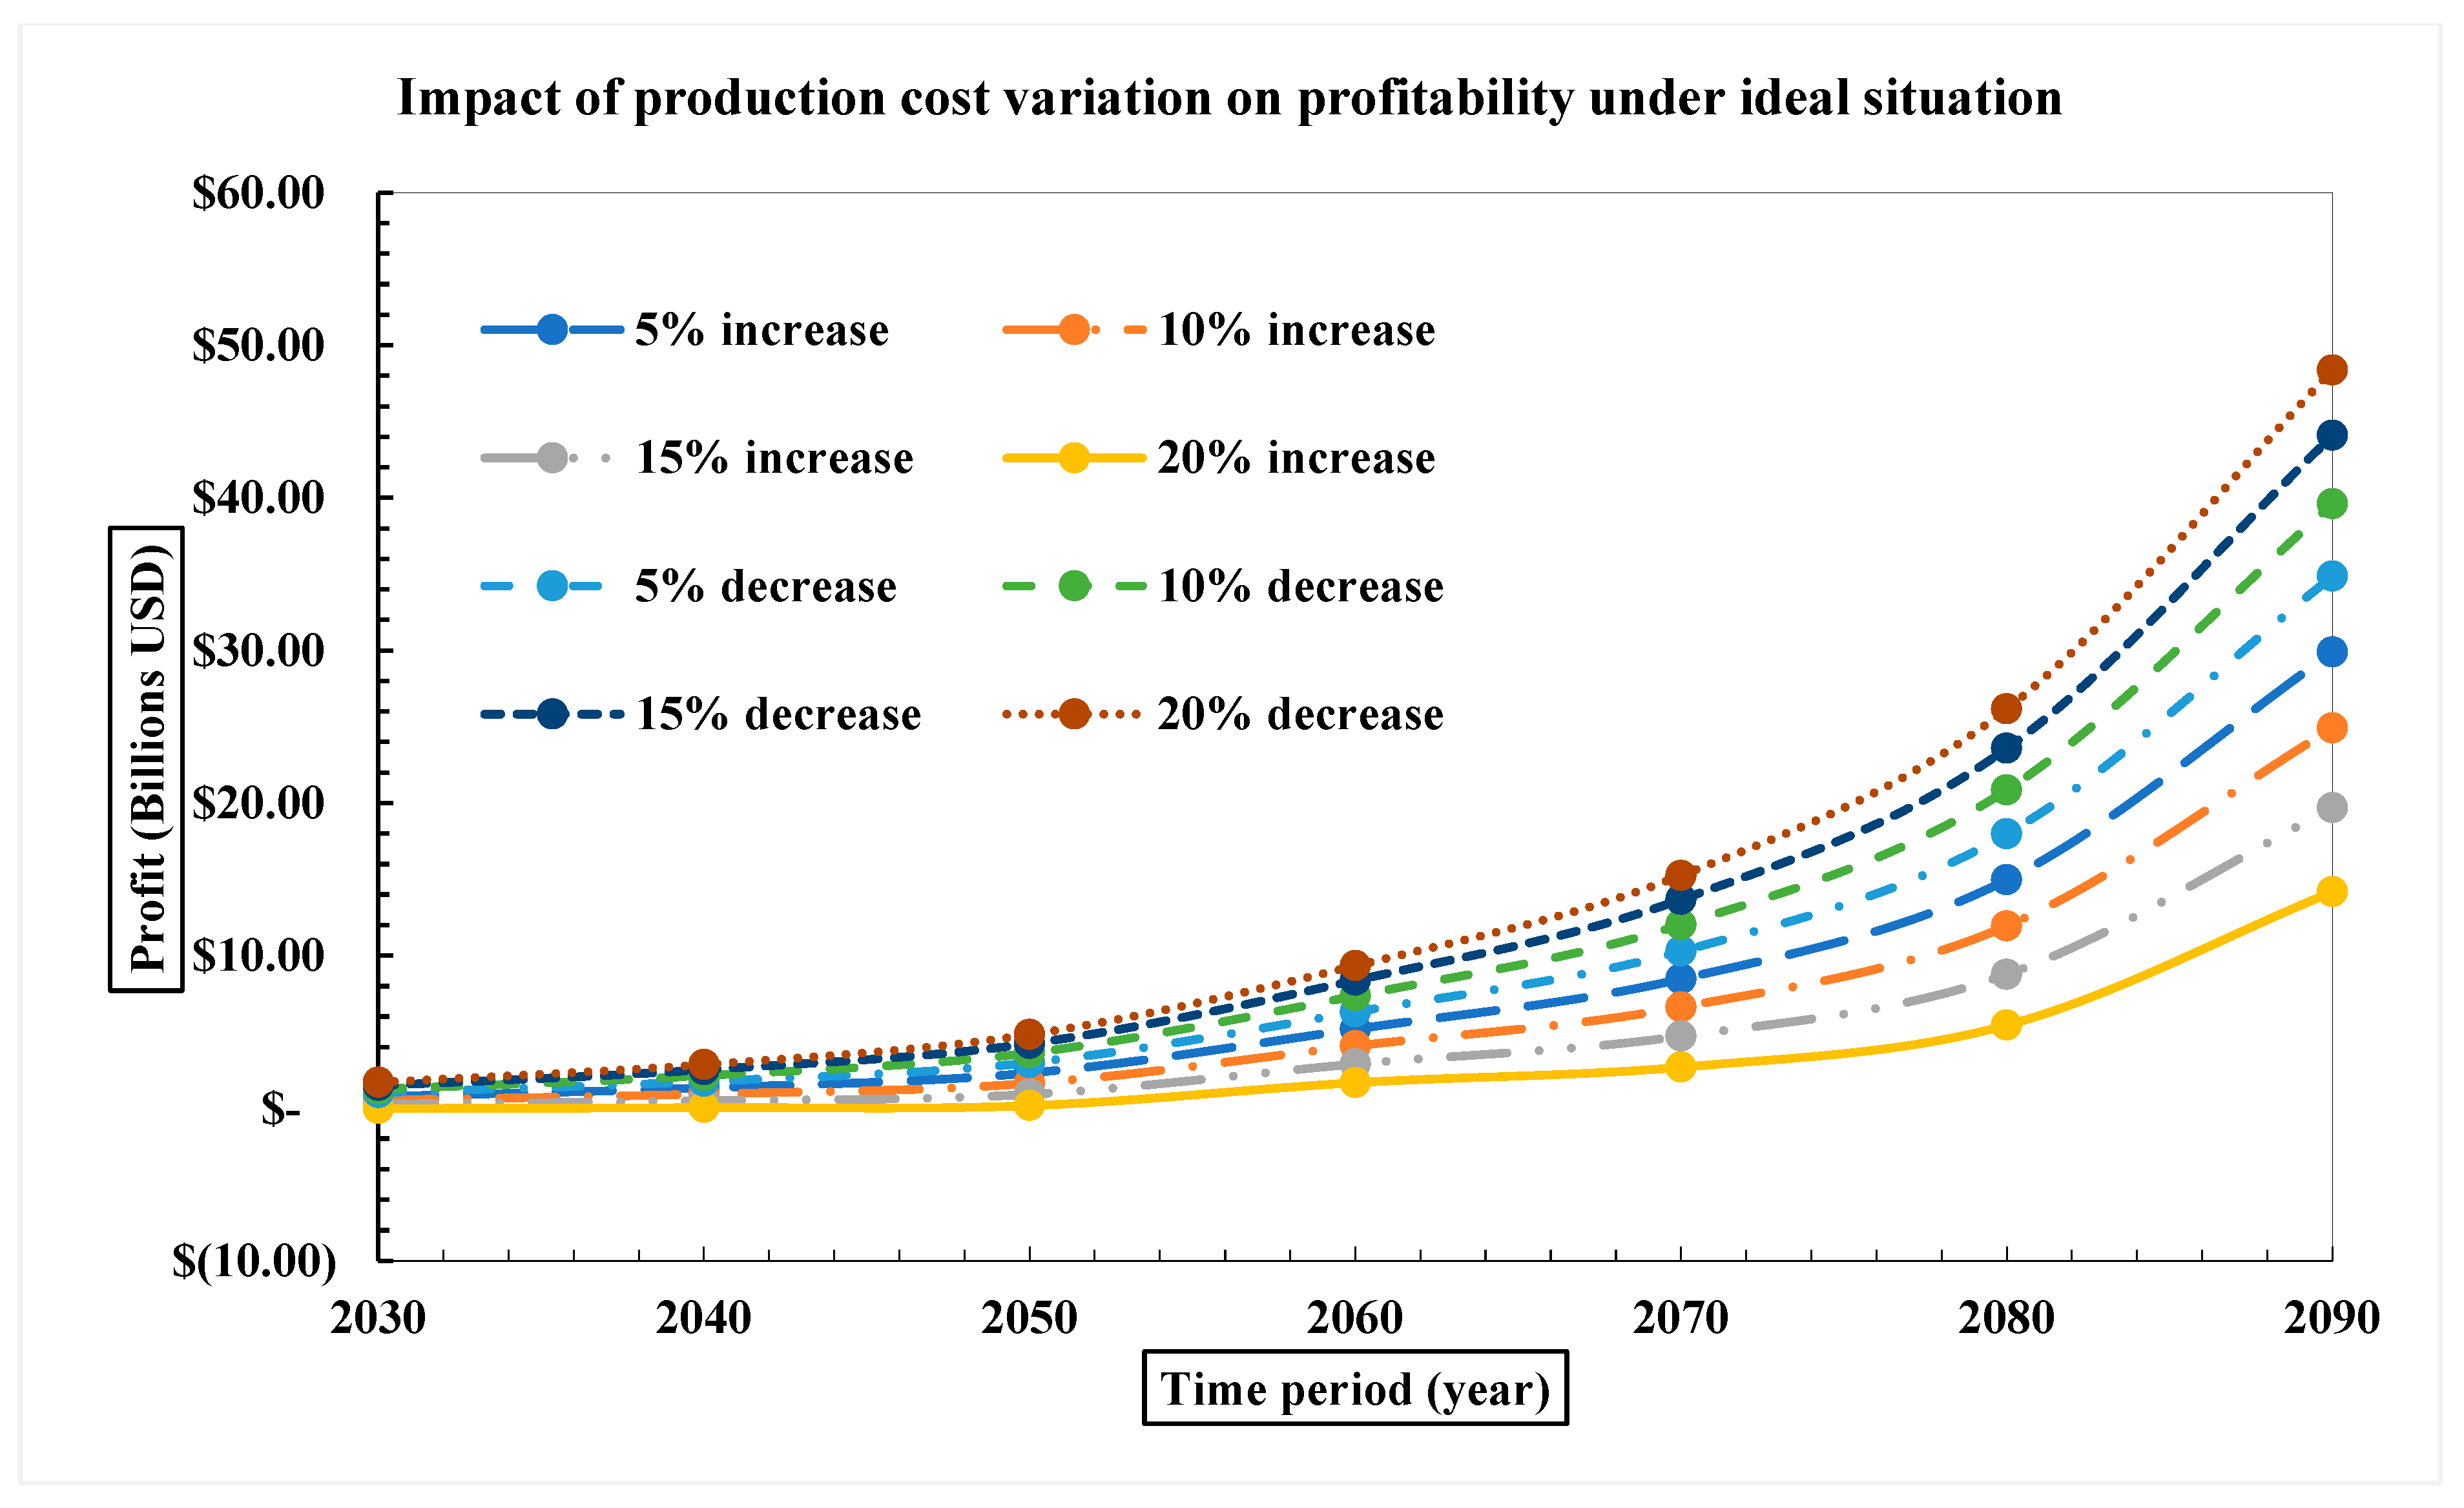
Figure A2.
Impact of transportation cost variation on profitability under ideal situation.
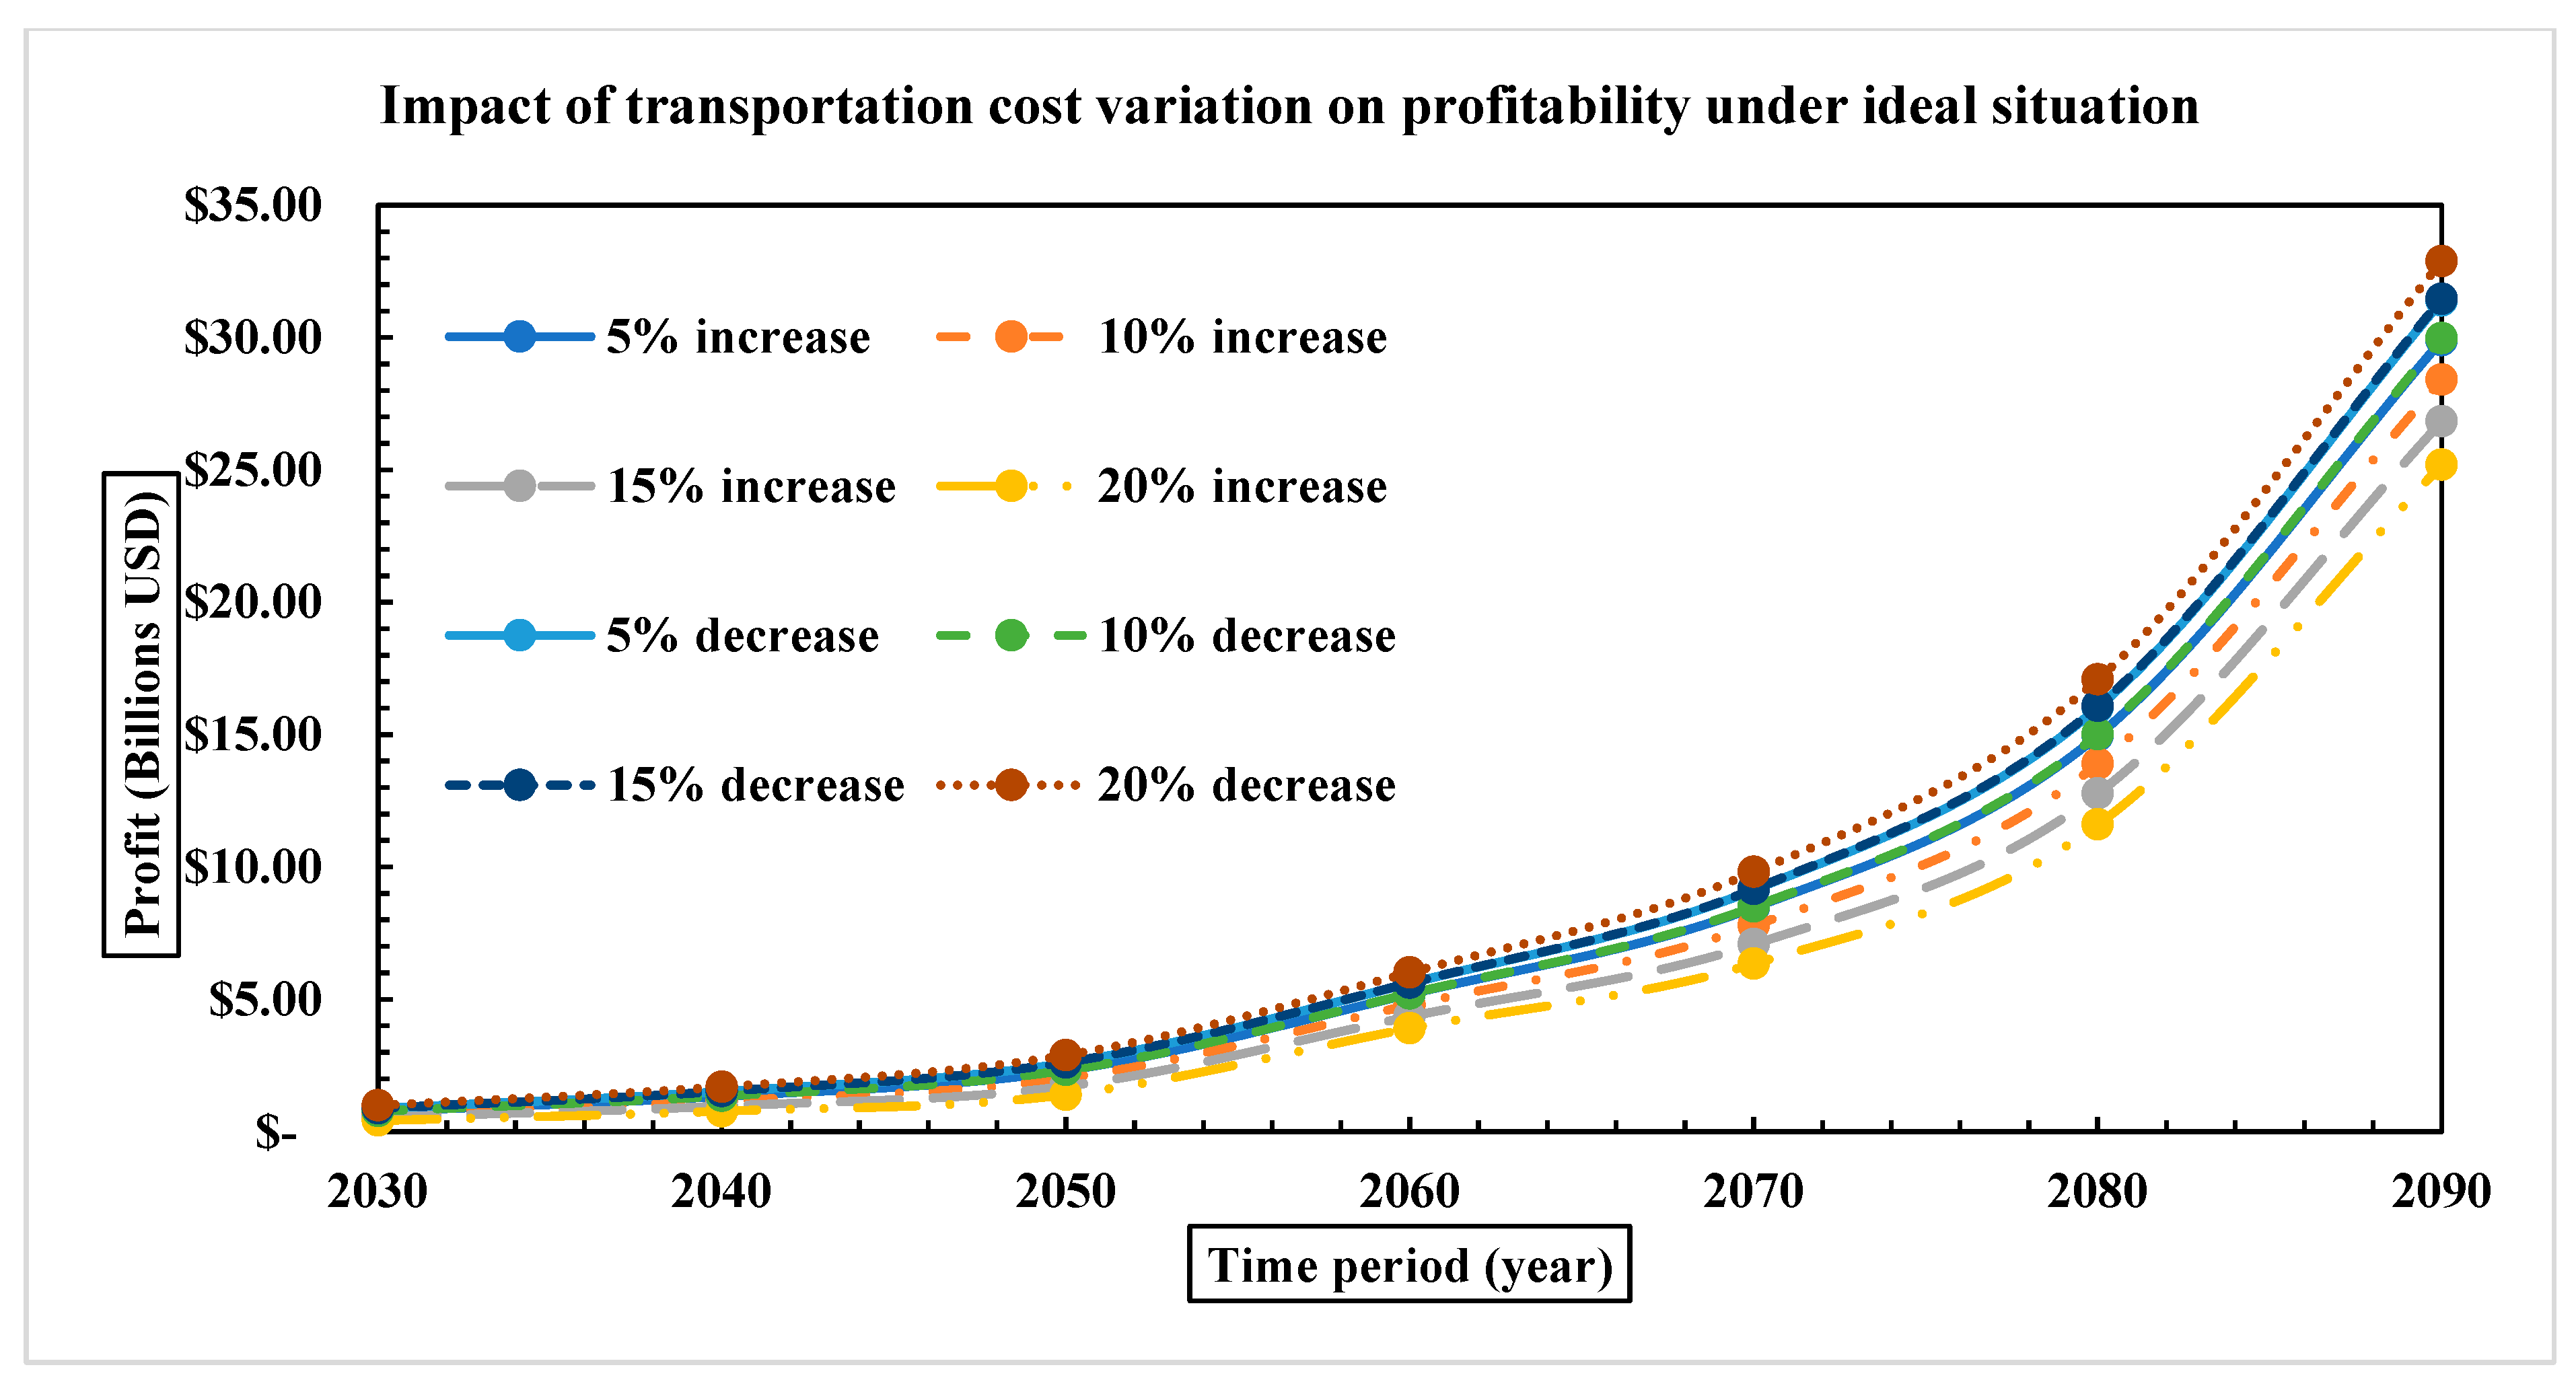
Figure A3.
Demand fulfilment rate under RDC disruption scenarios without mitigation strategies.
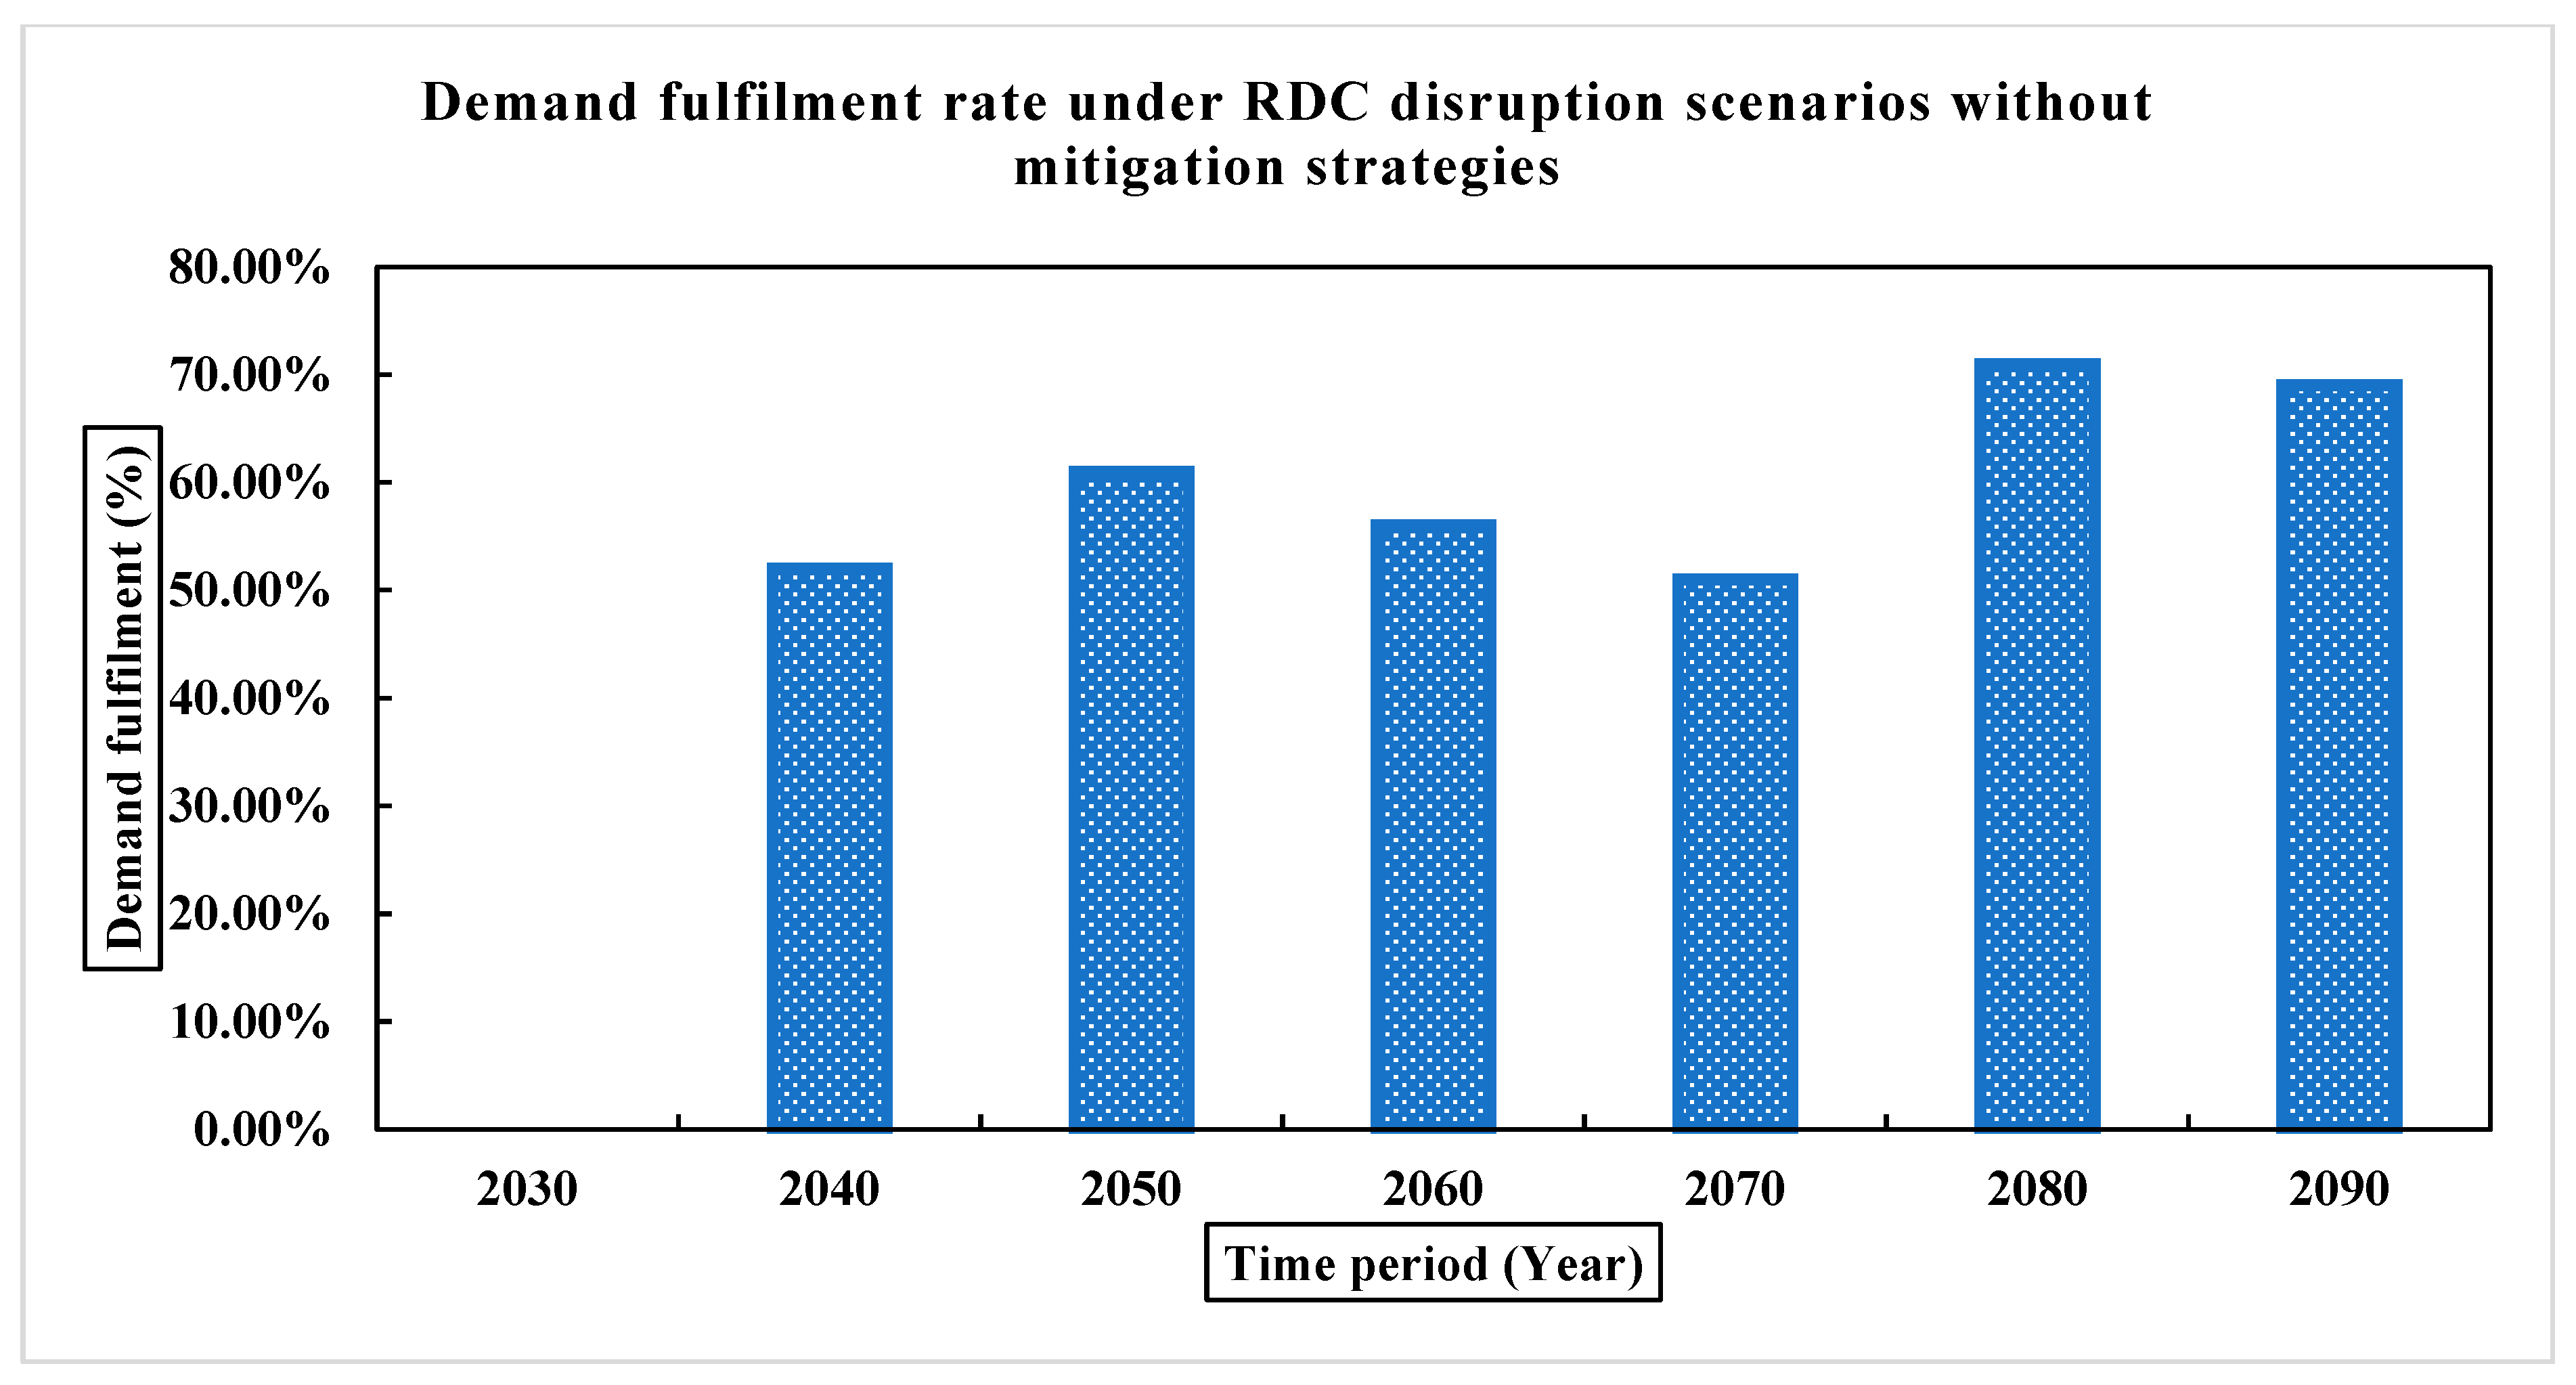
Figure A4.
Demand fulfilment rate under NDC disruption scenarios without mitigation strategies.
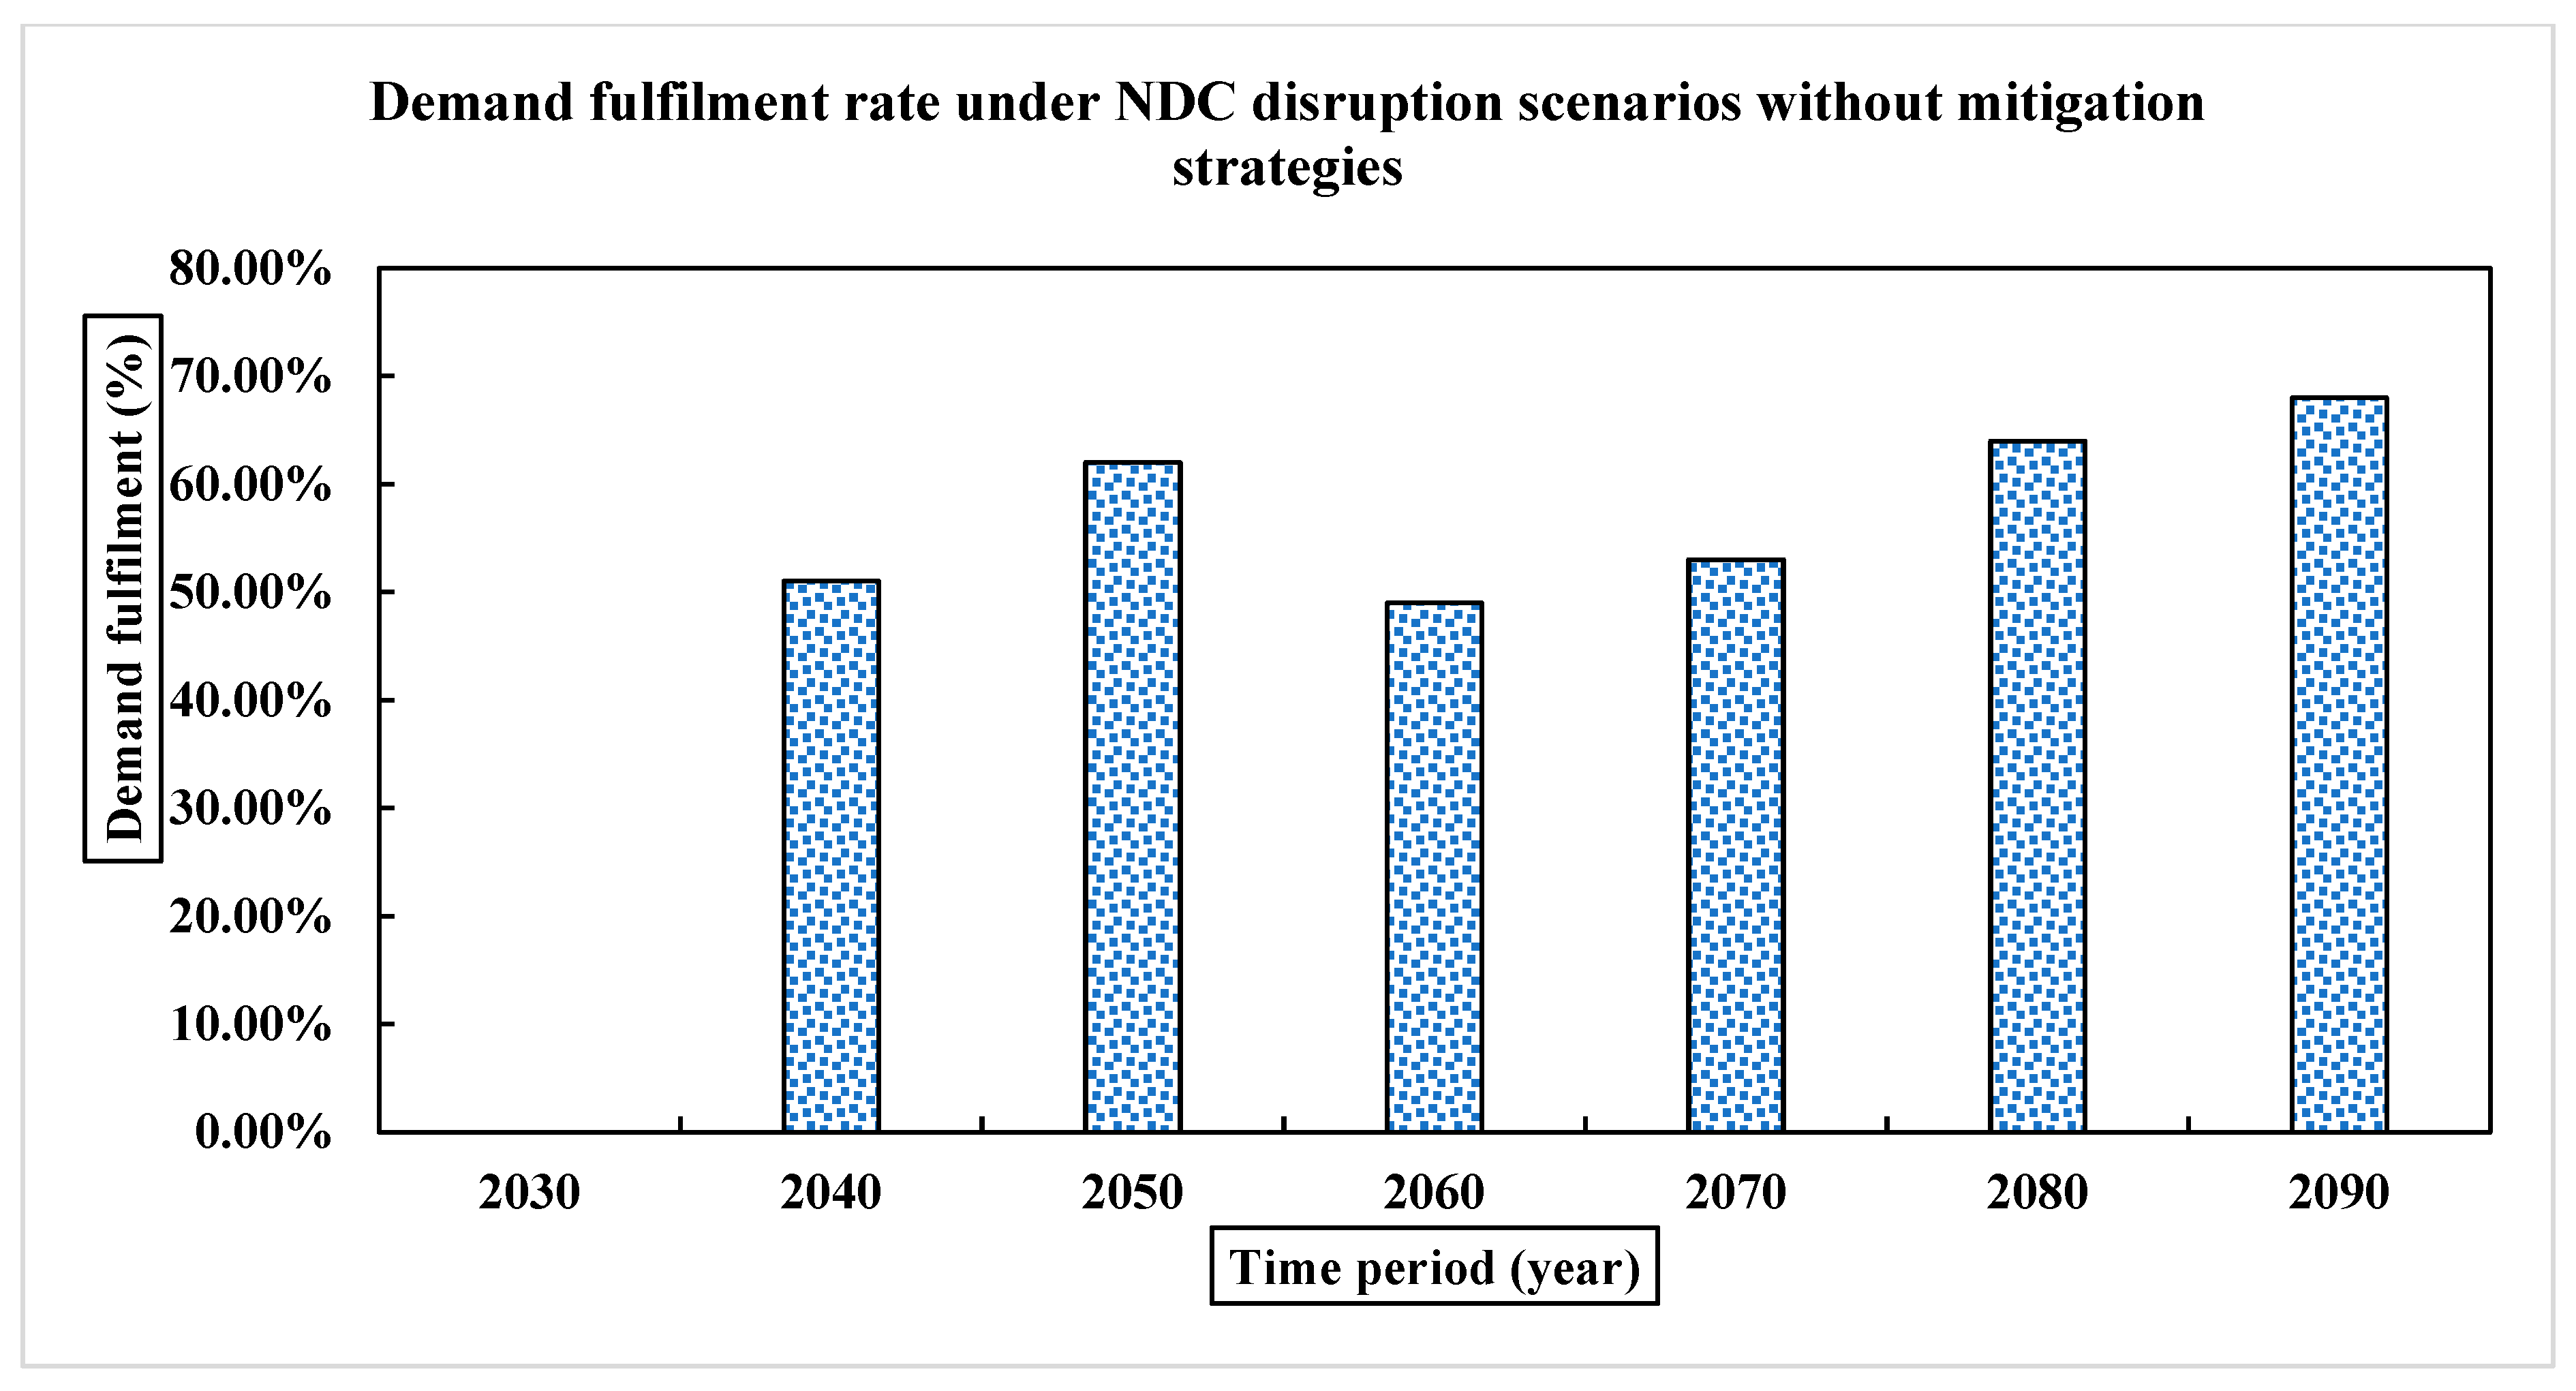
Figure A5.
Impact of production cost variation on profitability under RDC disruption scenarios without mitigation strategies.
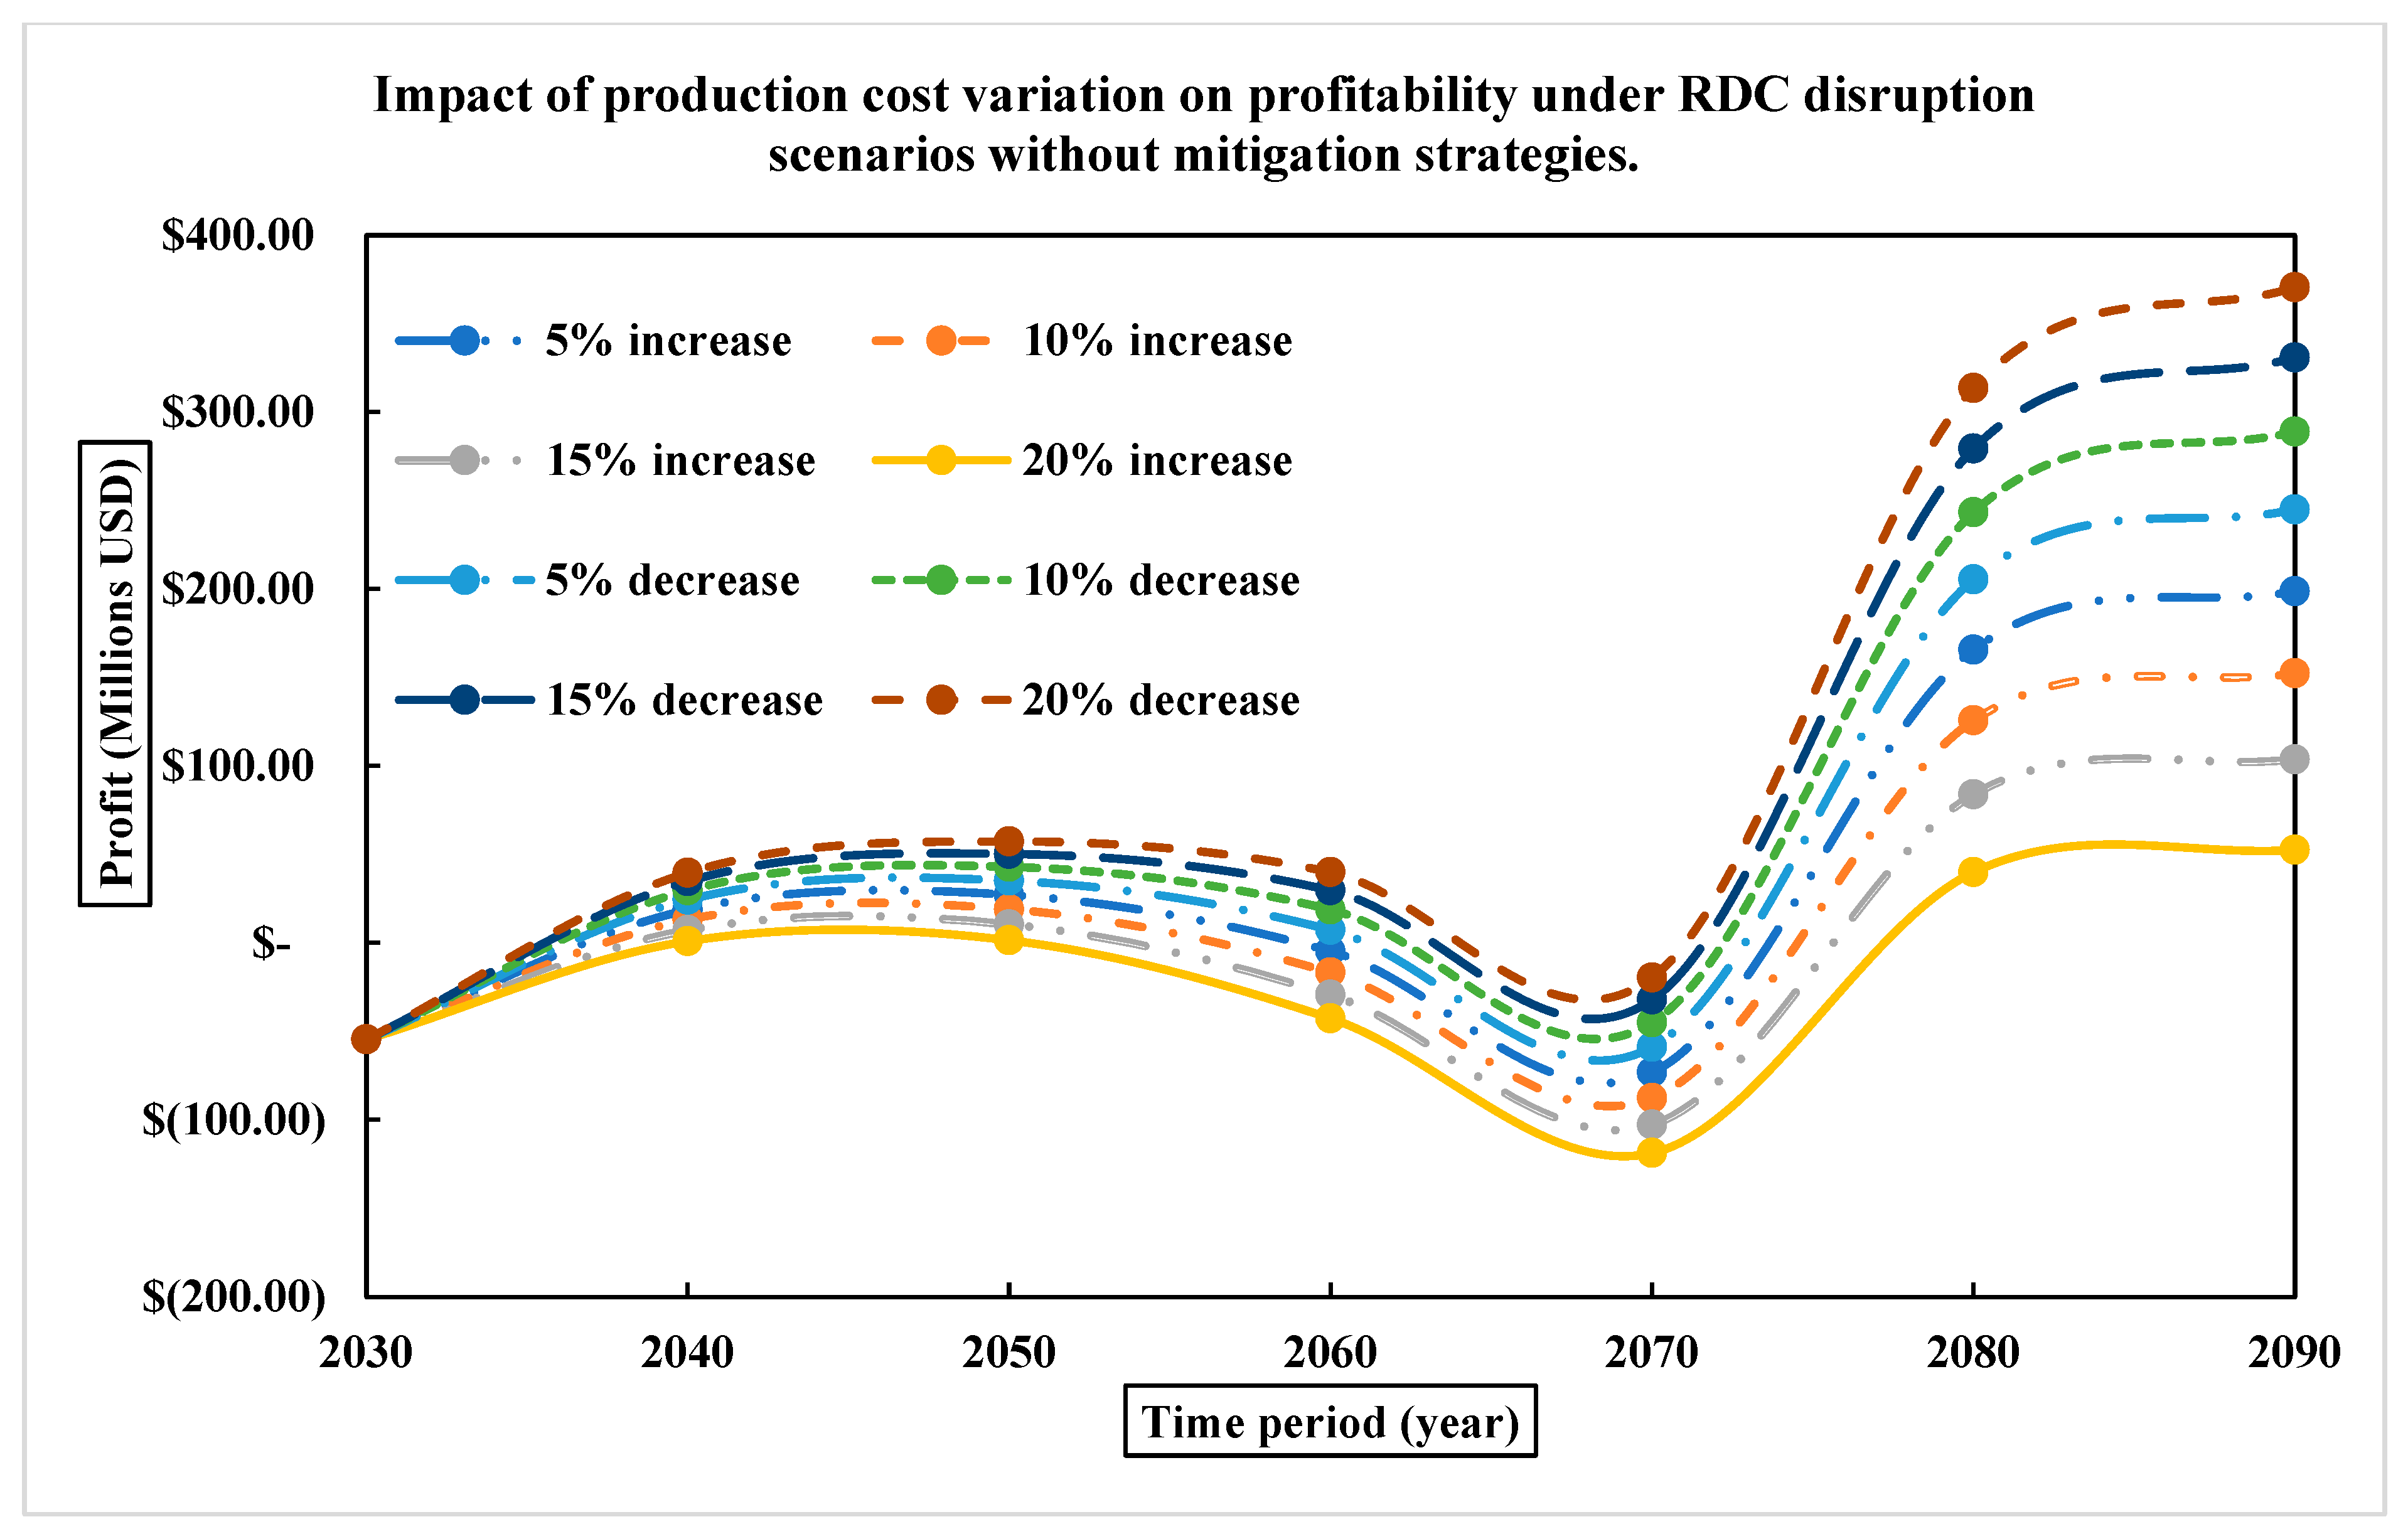
Figure A6.
Impact of transportation cost variation on profitability under RDC disruption scenarios without mitigation strategies.
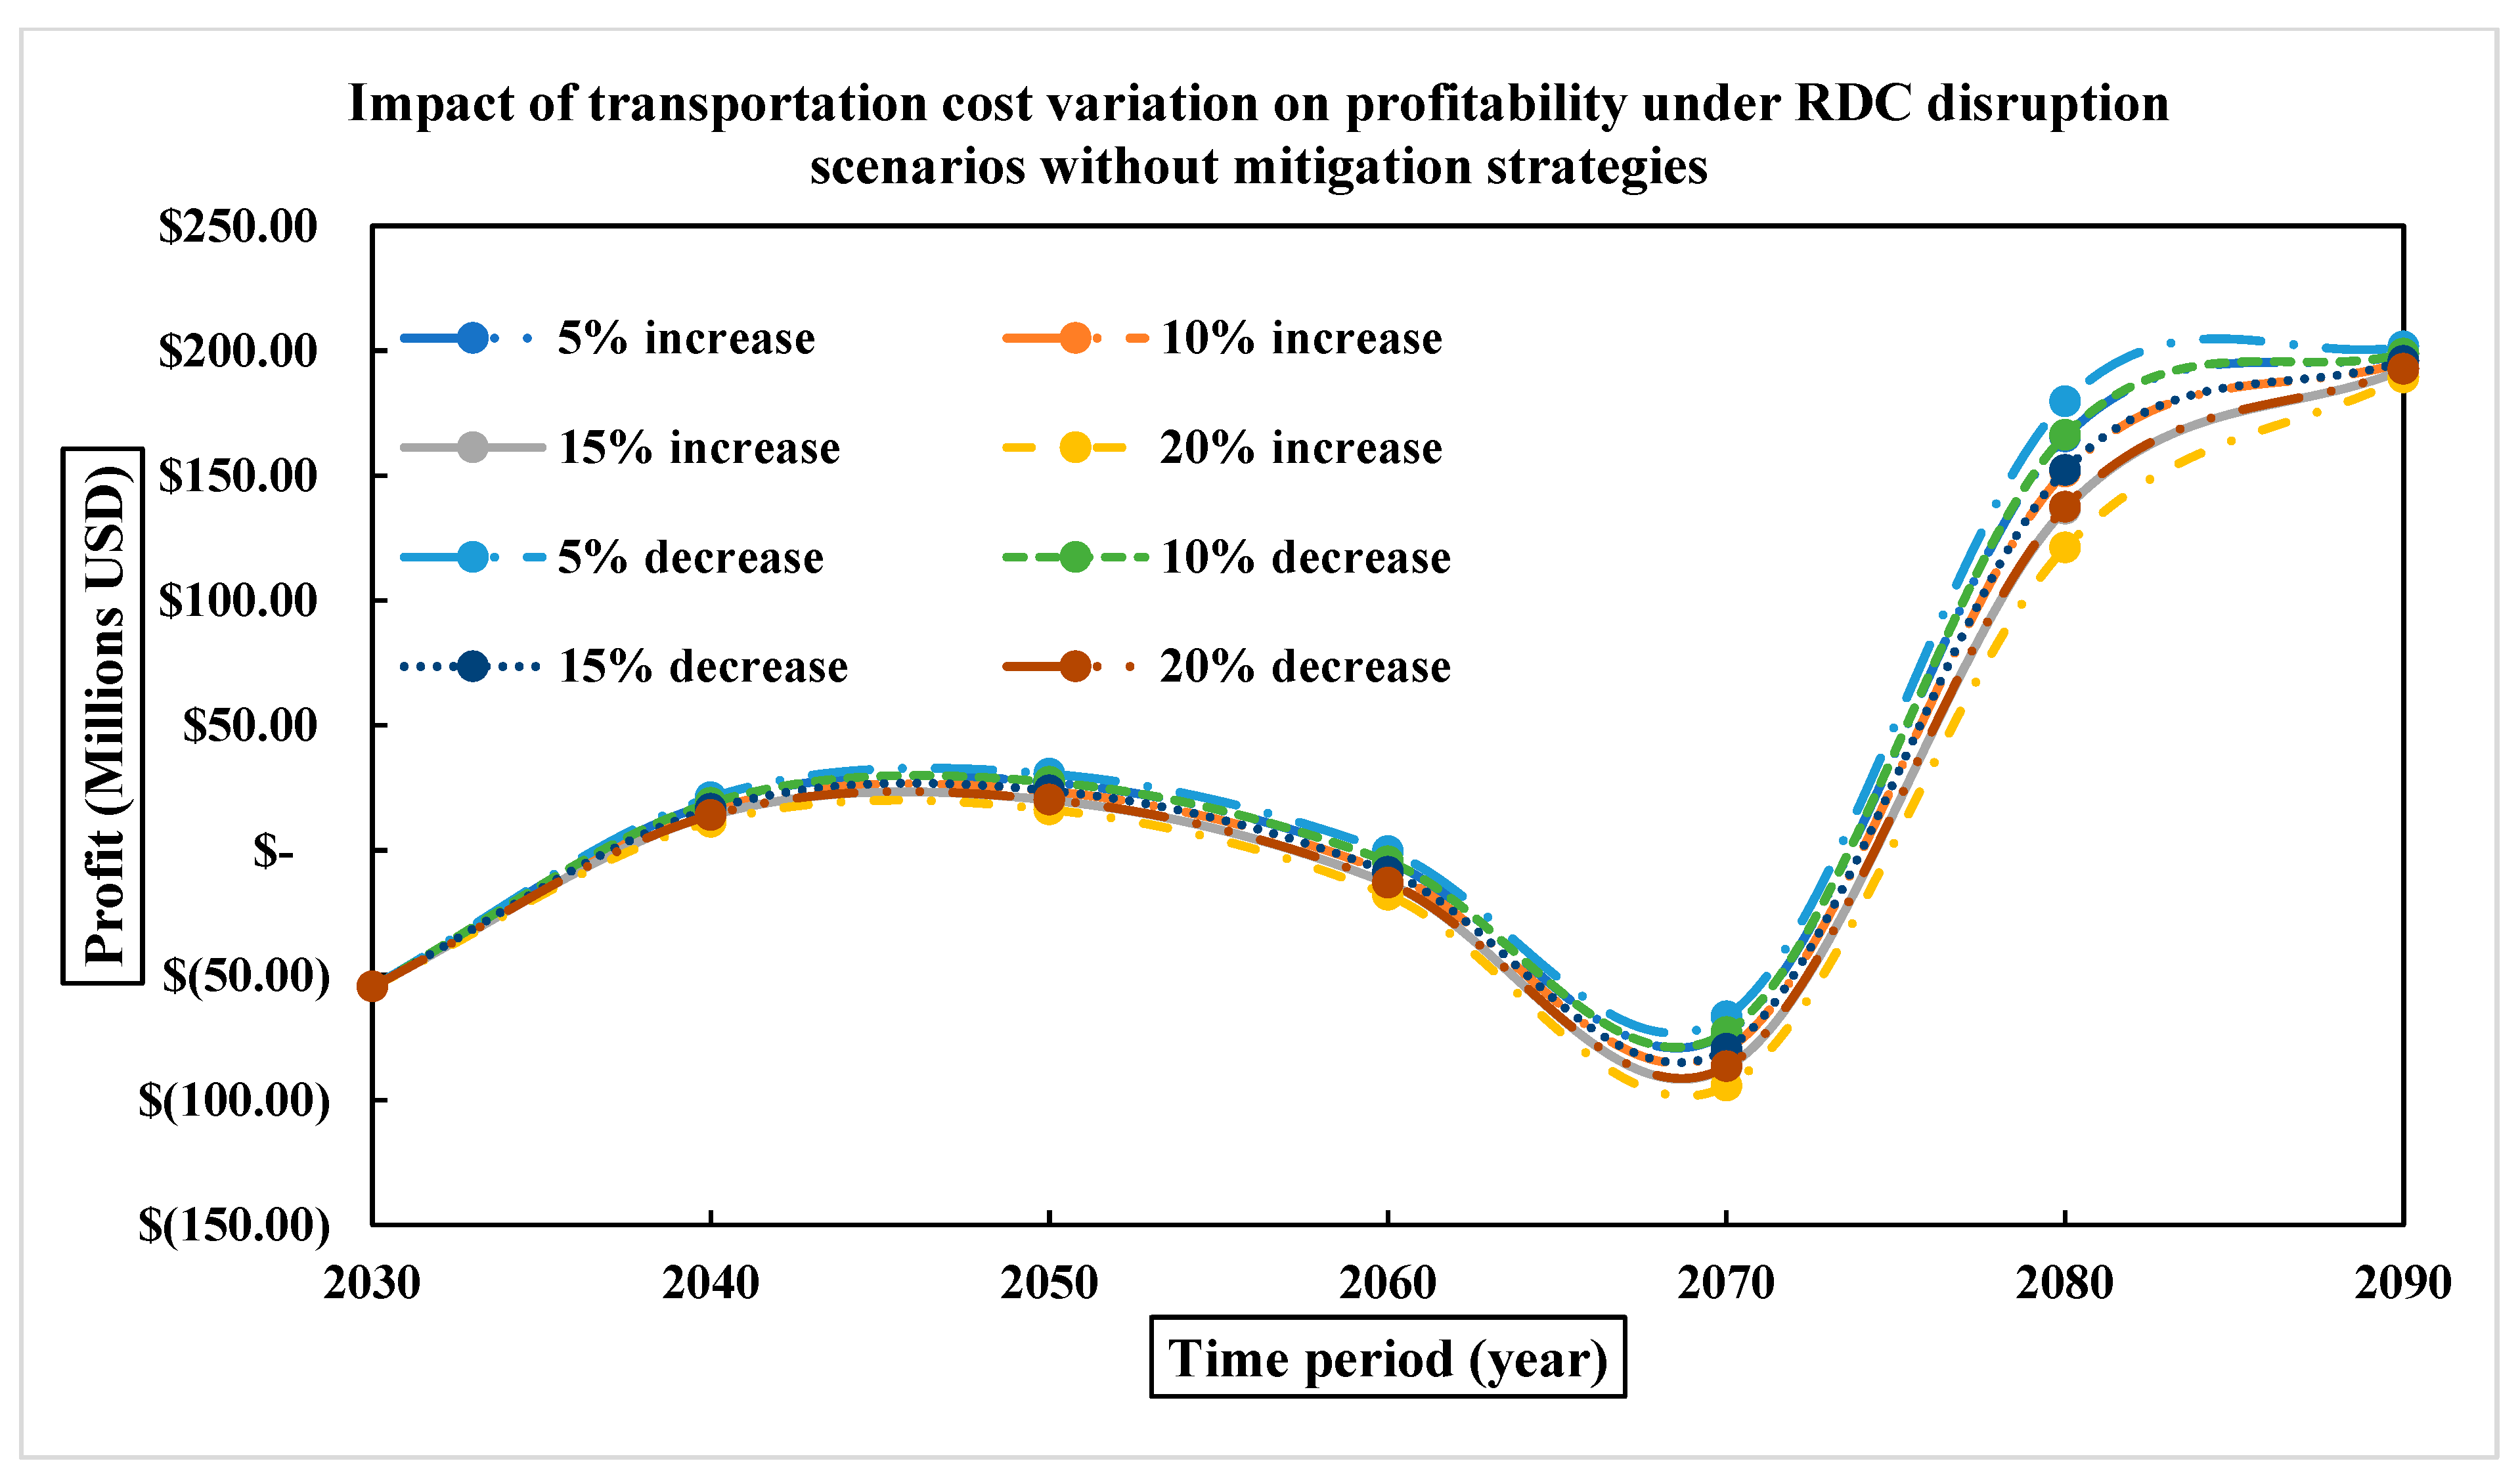
Figure A7.
Impact of production cost variation on profitability under NDC disruption scenarios without mitigation strategies.
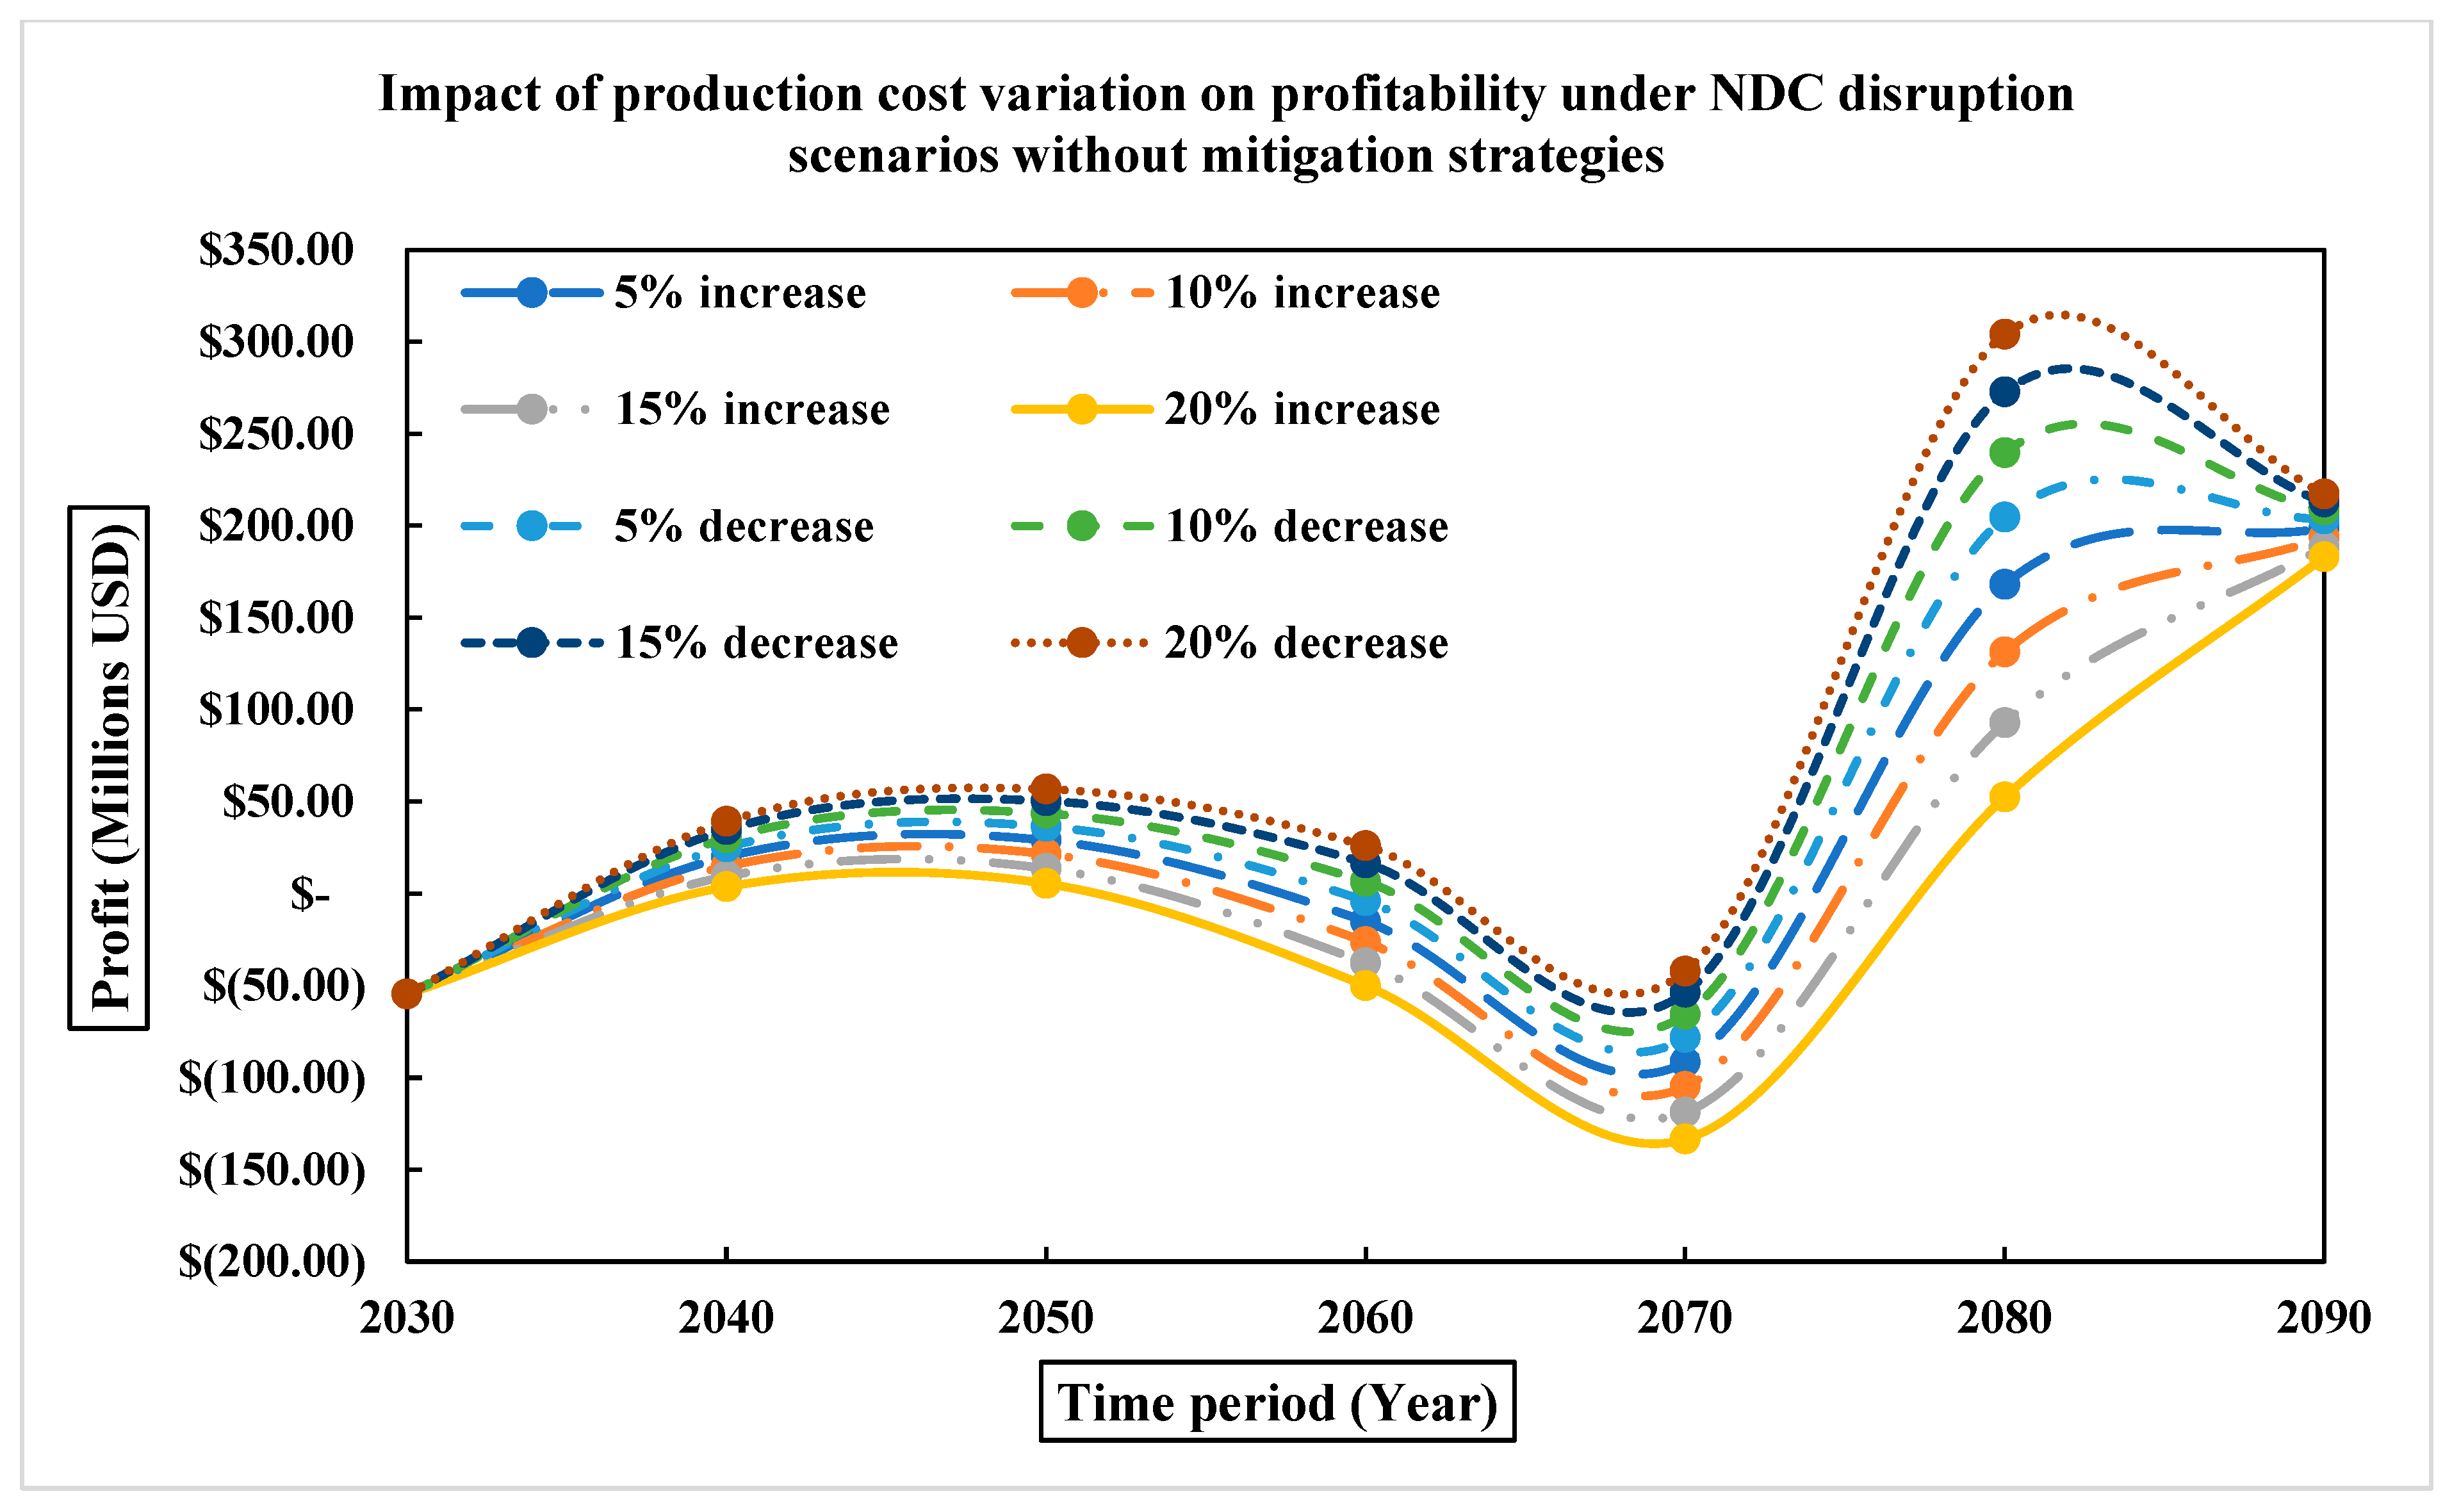
Figure A8.
Impact of transportation cost variation on profitability under NDC disruption scenarios without mitigation strategies.
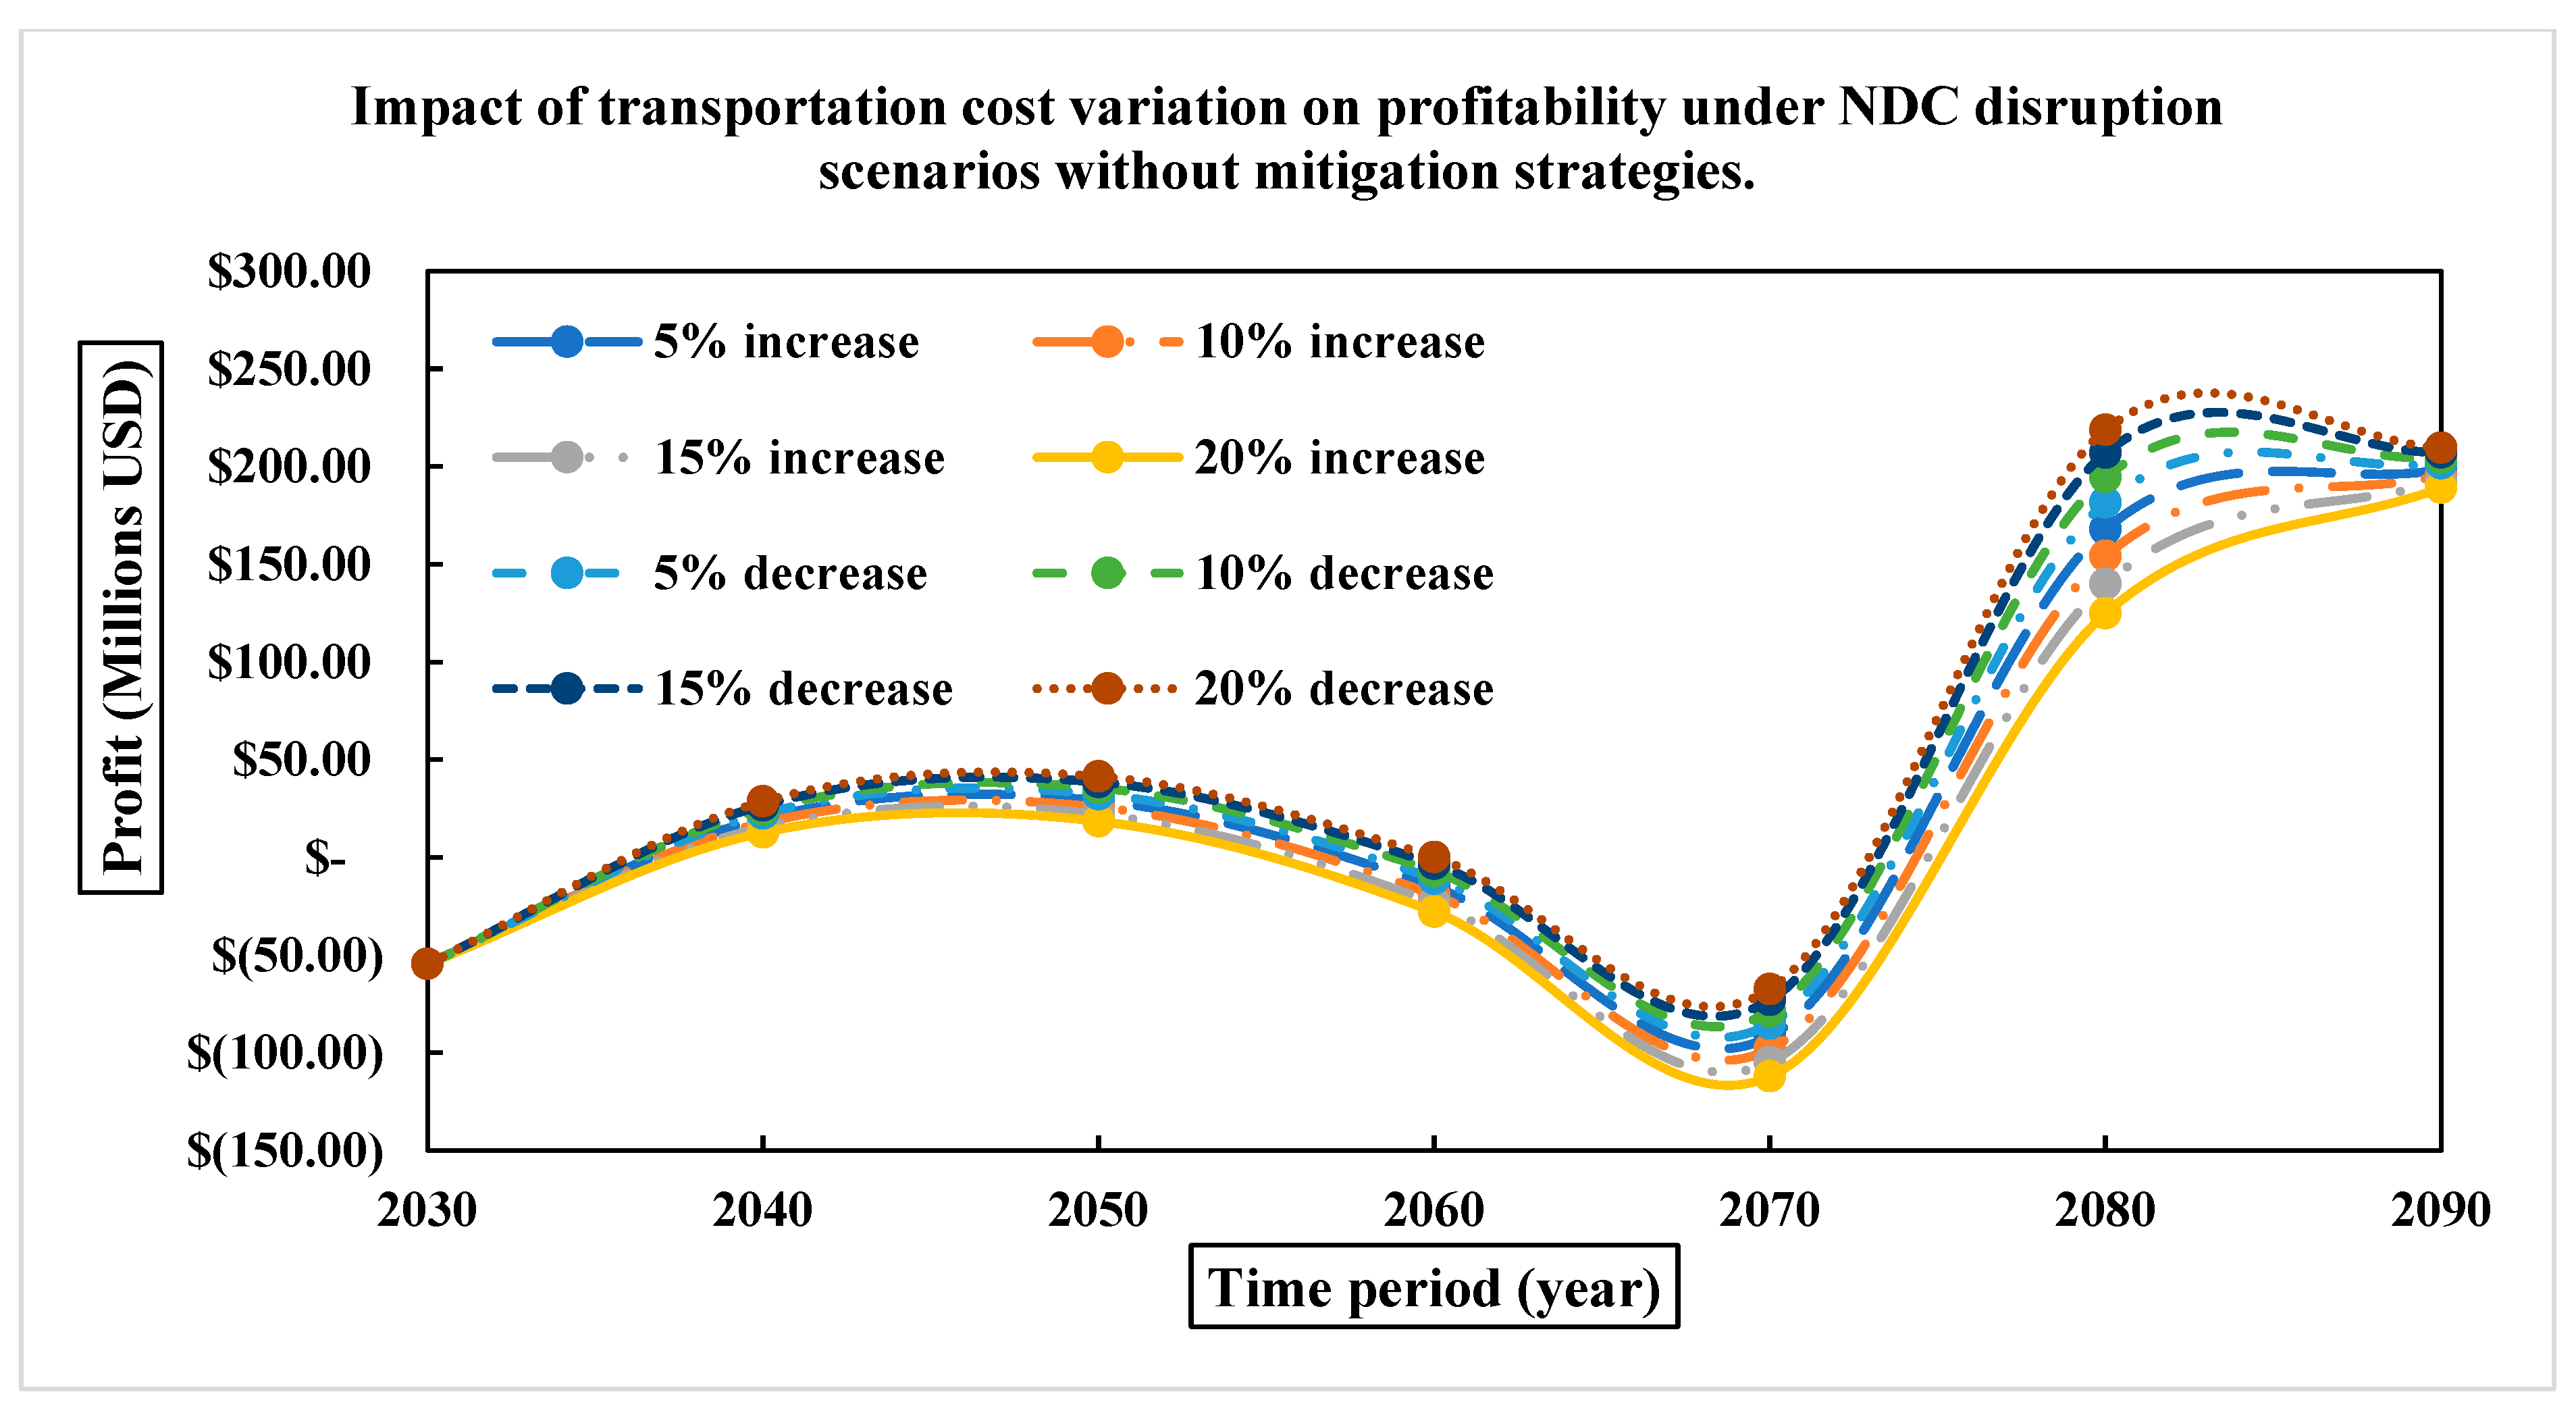
Figure A9.
Impact of production cost variation on profitability under RDC disruption scenarios with suitable mitigation strategies.
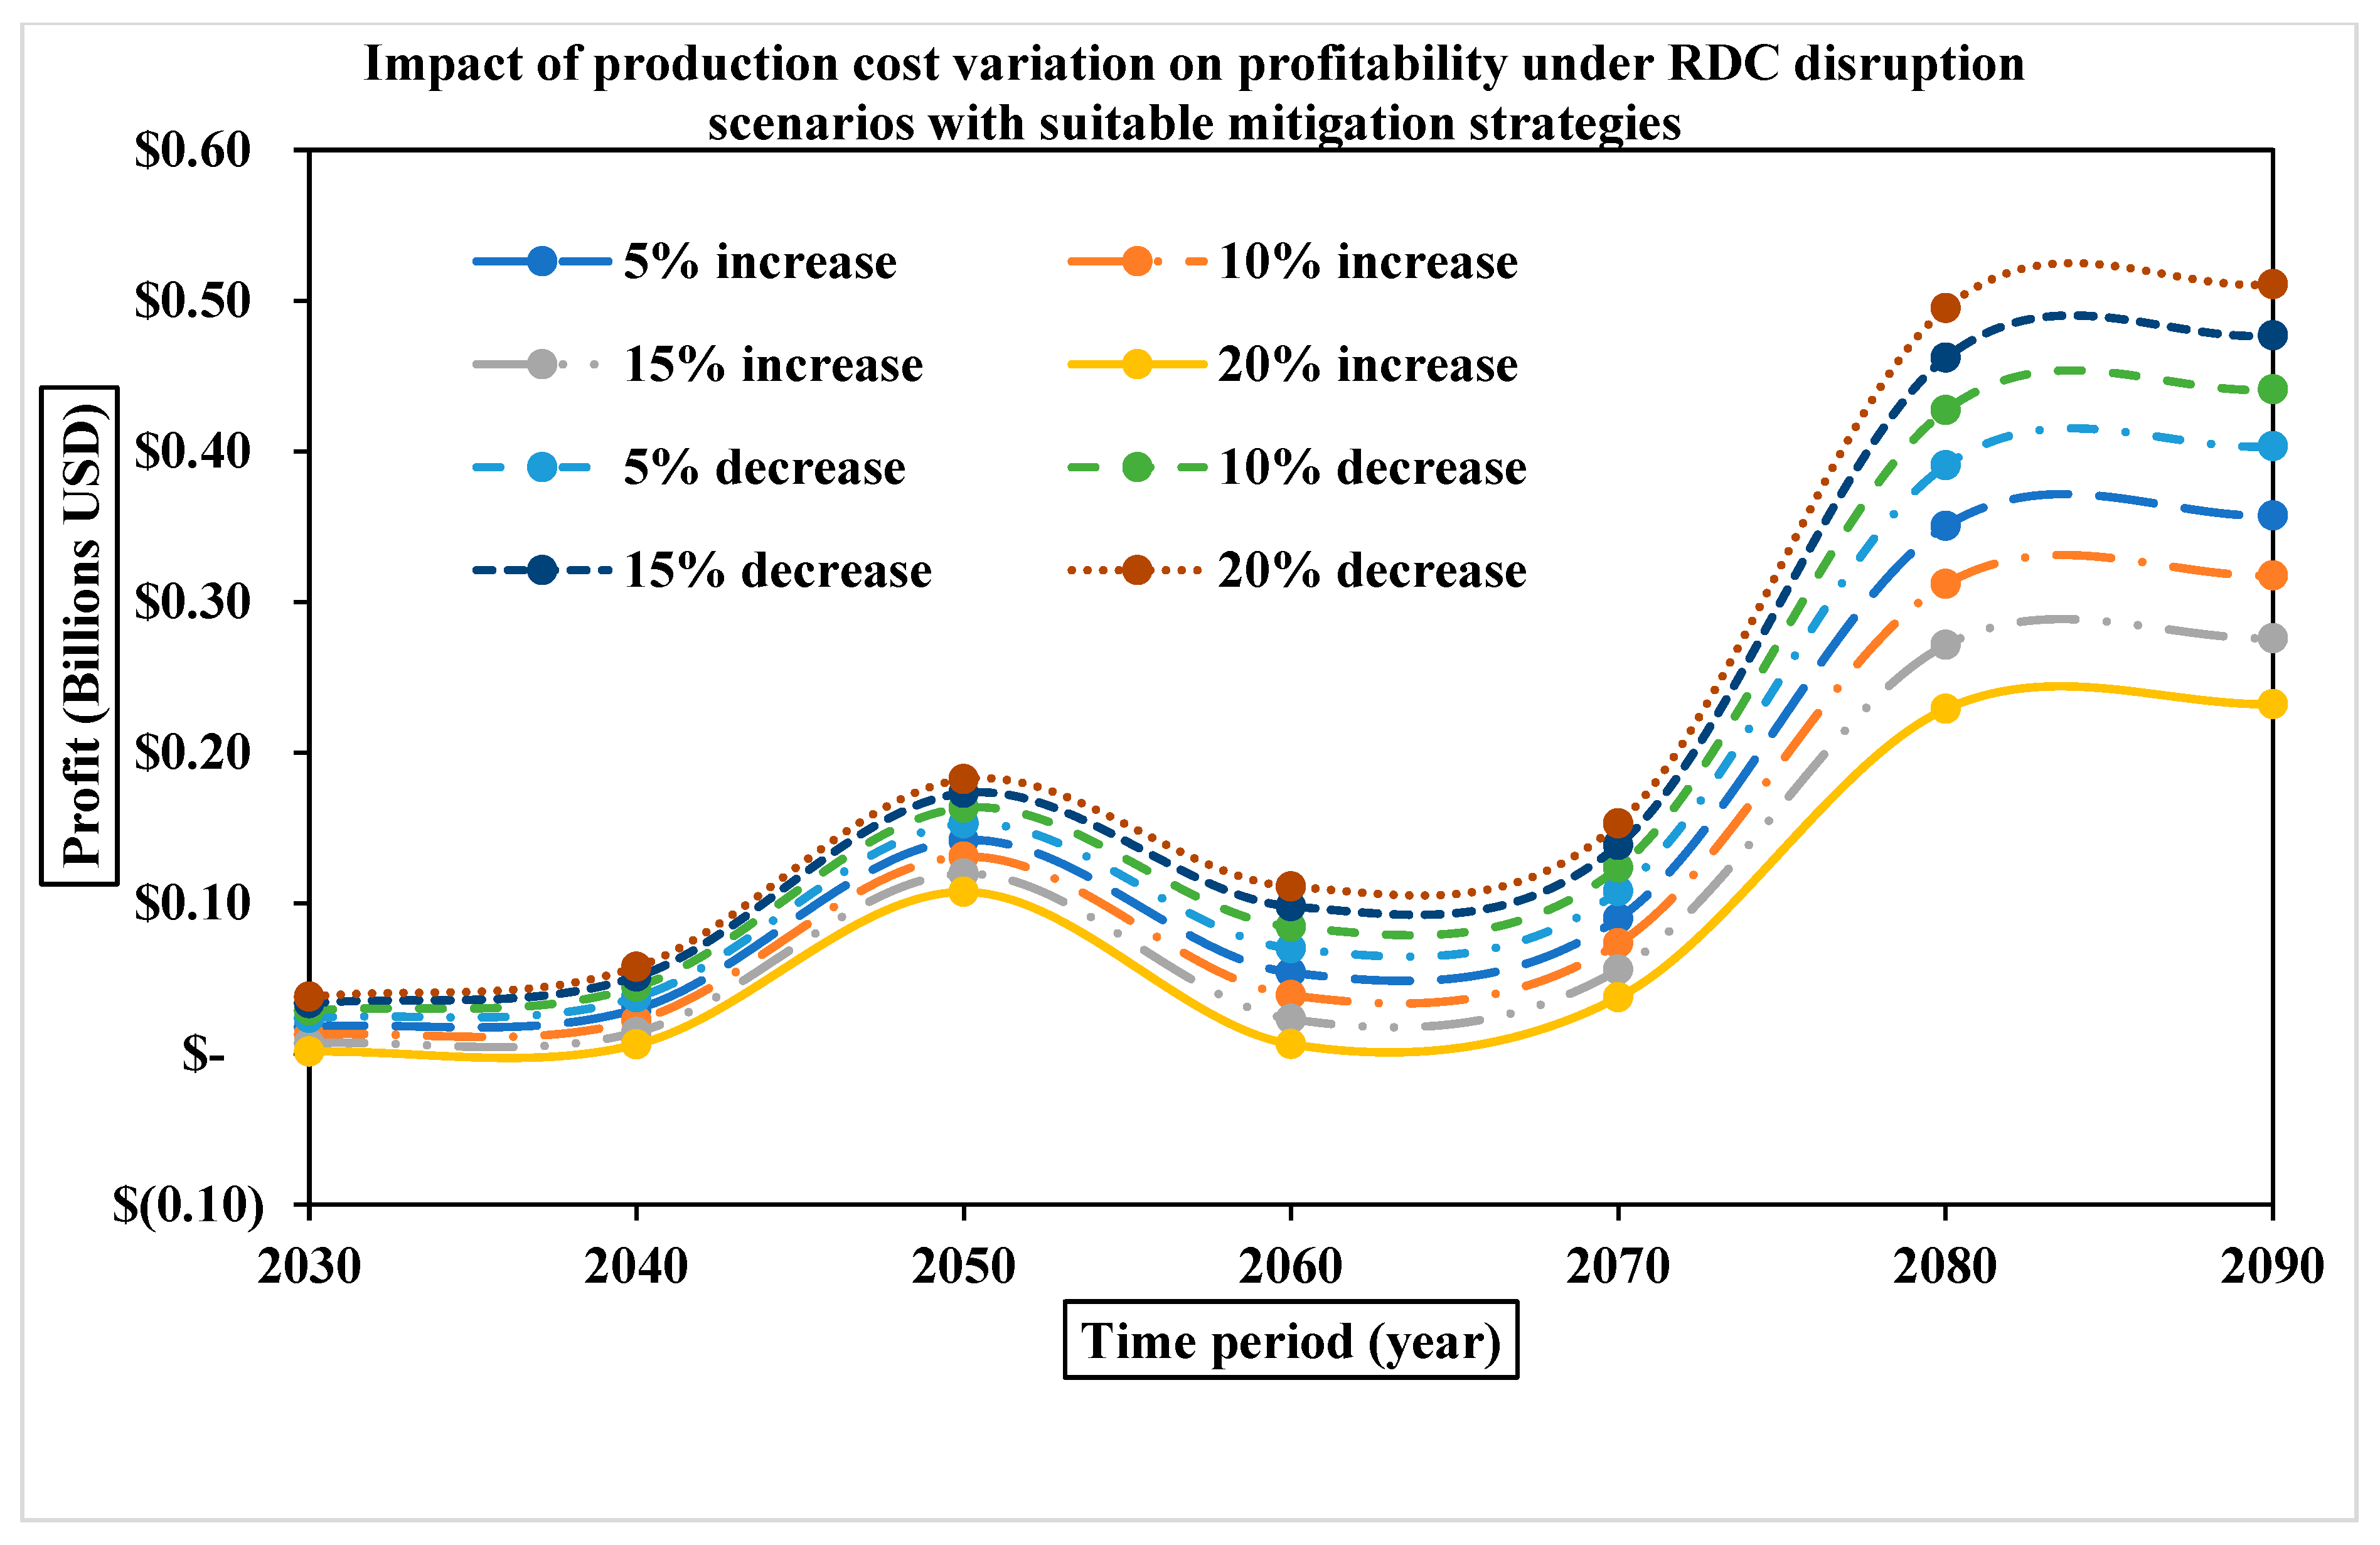
Figure A10.
Impact of transportation cost variation on profitability under RDC disruption scenarios with suitable mitigation strategies.
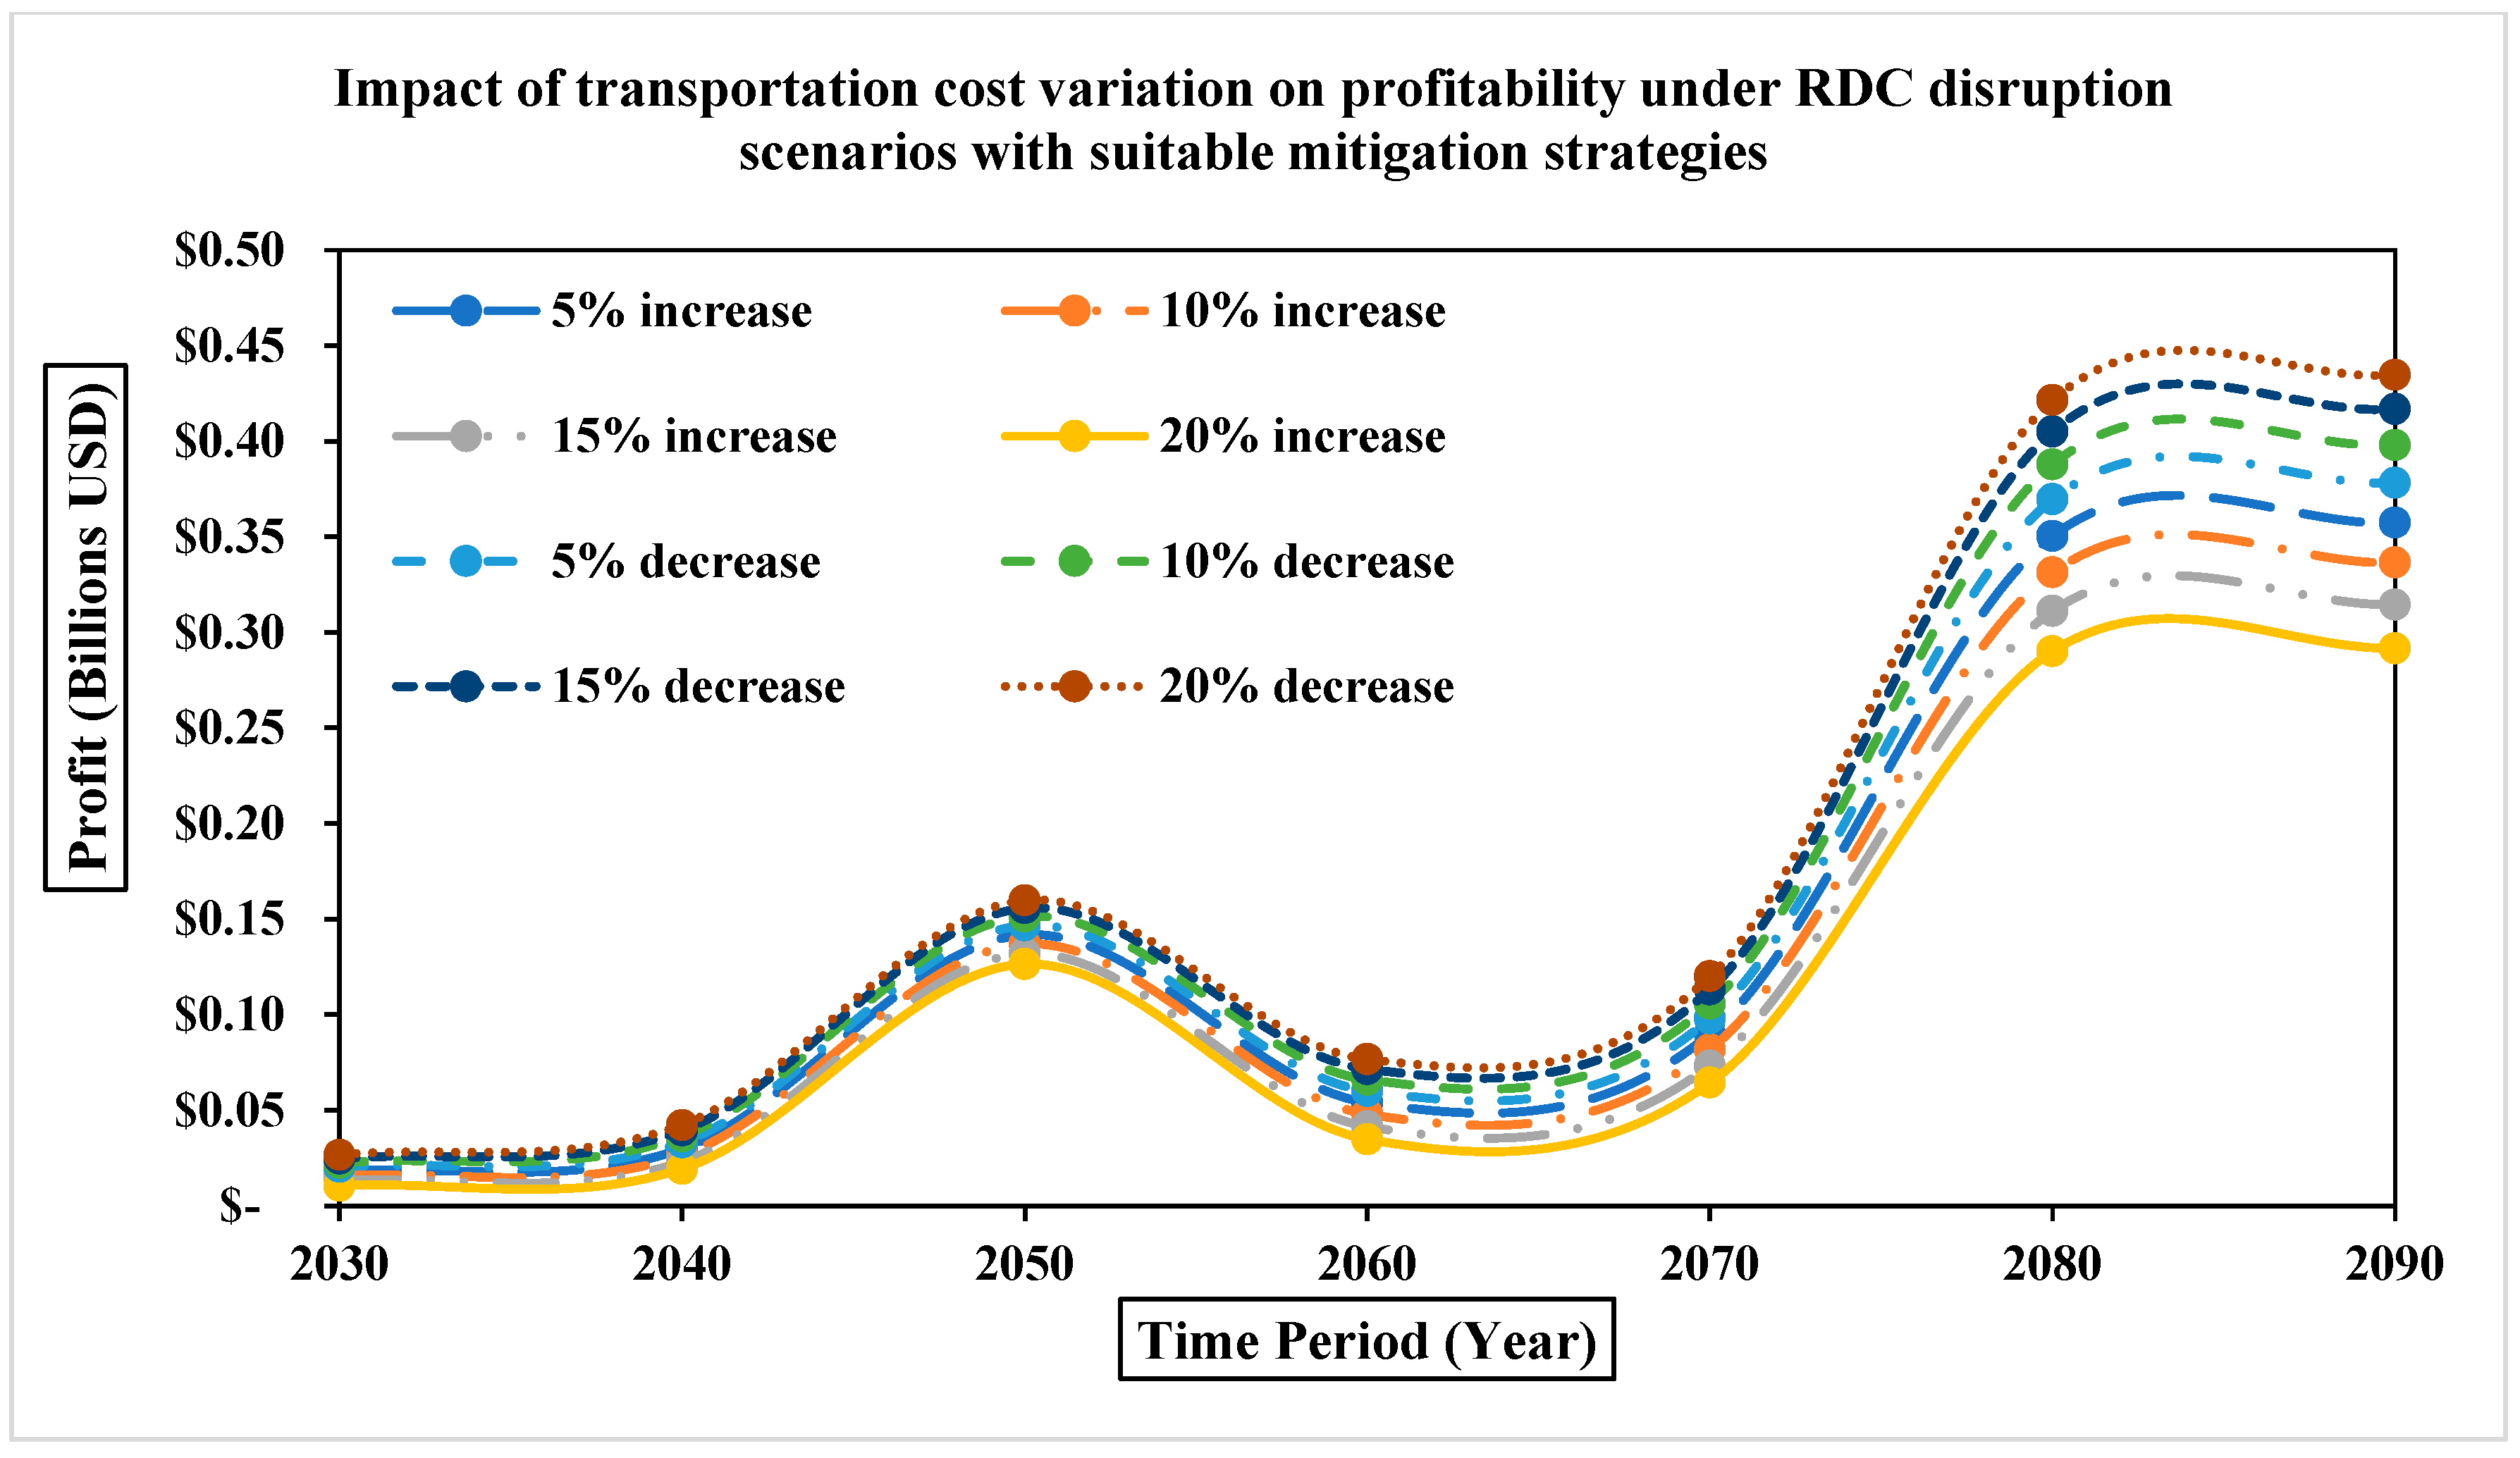
Figure A11.
Impact of production cost variation on profitability under NDC disruption scenarios with suitable mitigation strategies.
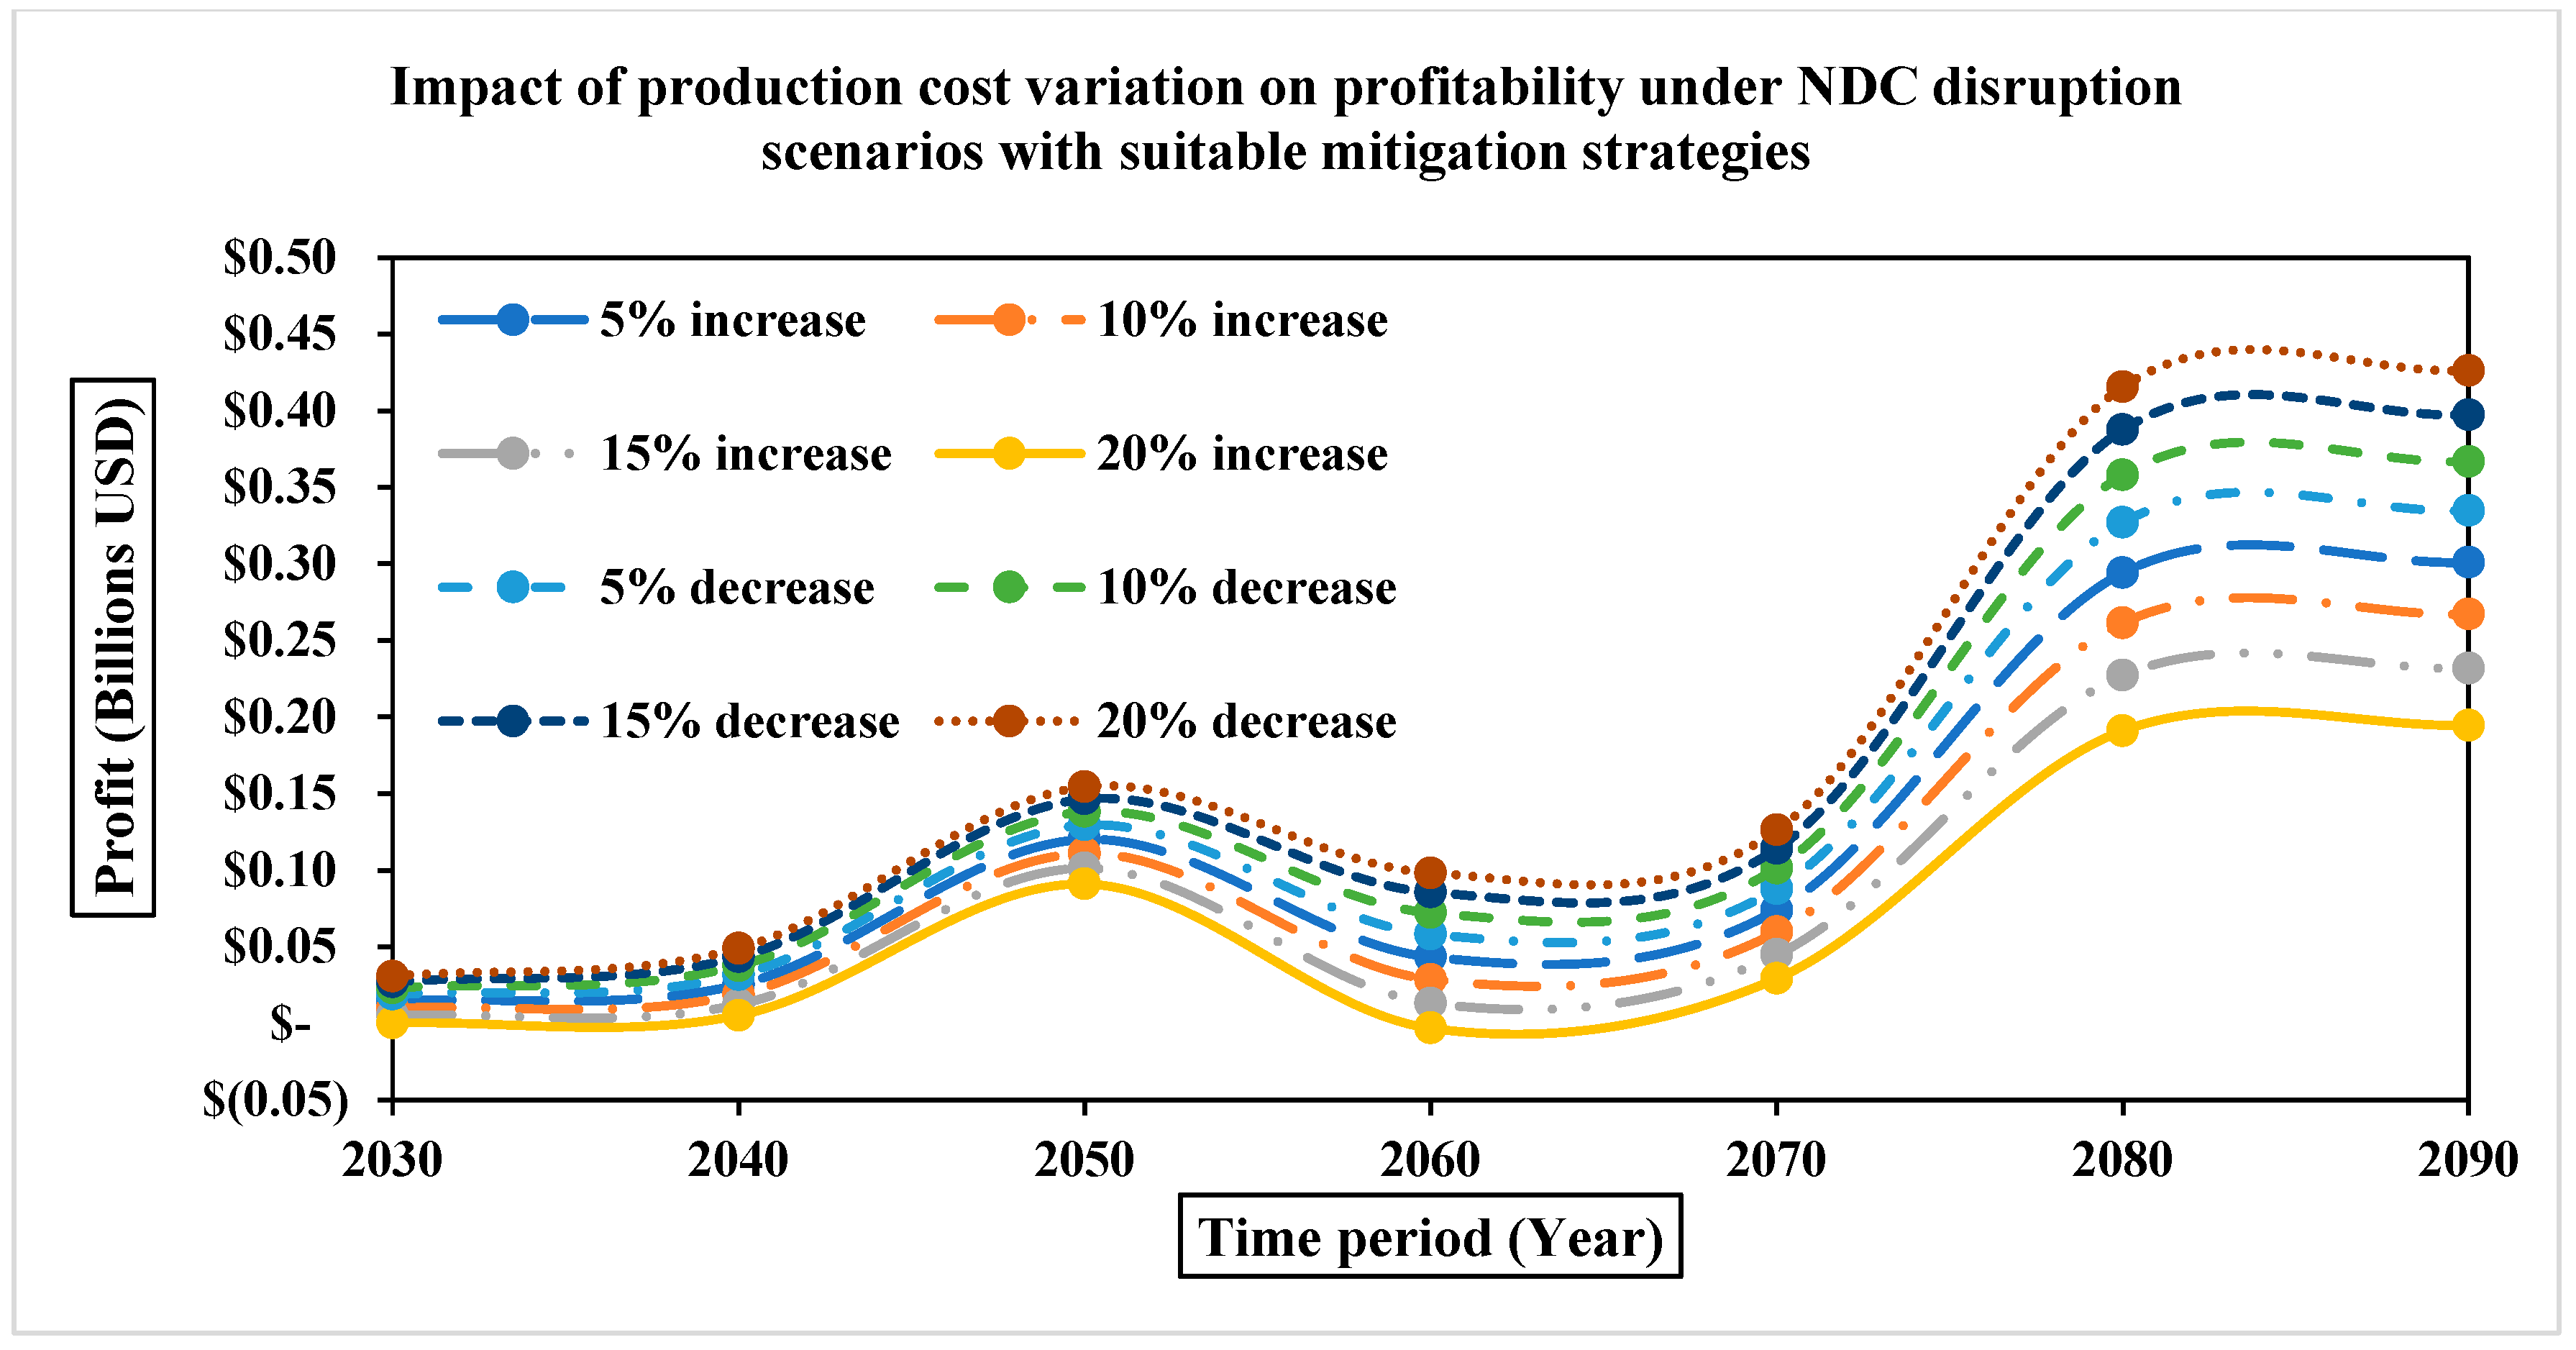
Figure A12.
Impact of transportation cost variation on profitability under NDC disruption scenarios with suitable mitigation strategies.
References
- Chakrabarty, P.; Paul, S.K.; Trianni, A.; Saha, S.C. Designing and long-term planning for household hydrogen supply chain in Australia. Clean. Logist. Supply Chain 2025, 17, 100283. [Google Scholar] [CrossRef] [Scilit]
- Farahani, R.Z.; Asgari, N.; Davarzani, H. Supply Chain and Logistics in National, International and Governmental Environment: Concepts and Models; Springer Science & Business Media: Berlin/Heidelberg, Germany, 2009. [Google Scholar]
- Forsberg, C.W. Future hydrogen markets for large-scale hydrogen production systems. Int. J. Hydrogen Energy 2007, 32, 431–439. [Google Scholar] [CrossRef] [Scilit]
- Jorde, T.M.; Teece, D.J. Competition and cooperation: Striking the right balance. Calif. Manag. Rev. 1989, 31, 25–37. [Google Scholar] [CrossRef] [Scilit]
- Ferguson, M.E.; Toktay, L.B. The effect of competition on recovery strategies. Prod. Oper. Manag. 2006, 15, 351–368. [Google Scholar] [CrossRef] [Scilit]
- Alizadeh, T.; Clements, R.; Legacy, C.; Searle, G.; Kamruzzaman, M. Infrastructure governance in times of crises: A research agenda for Australian cities. Urban Policy Res. 2022, 40, 1–14. [Google Scholar] [CrossRef] [Scilit]
- Dawood, F.; Shafiullah, G.; Anda, M. A hover view over Australia’s Hydrogen Industry in recent history: The necessity for a Hydrogen Industry Knowledge-Sharing Platform. Int. J. Hydrogen Energy 2020, 45, 32916–32939. [Google Scholar] [CrossRef] [Scilit]
- Eskandari, M.; Gilani, H.; Sahebi, H.; Sharifi, S. Design and planning of global sustainable bio-hydrogen supply chain with uncertainty: A transportation-oriented robust model. Chem. Eng. Sci. 2024, 283, 119365. [Google Scholar] [CrossRef] [Scilit]
- Chakrabarty, P.; Paul, S.K.; Trianni, A.; Saha, S.C. Mitigating transportation disruptions in the Australian household hydrogen supply chain. Eng. Manag. 2026, in press. [Google Scholar]
- Robles, J.O.; Azzaro-Pantel, C.; Aguilar-Lasserre, A. Optimization of a hydrogen supply chain network design under demand uncertainty by multi-objective genetic algorithms. Comput. Chem. Eng. 2020, 140, 106853. [Google Scholar] [CrossRef] [Scilit]
- Almansoori, A.; Shah, N. Design and operation of a stochastic hydrogen supply chain network under demand uncertainty. Int. J. Hydrogen Energy 2012, 37, 3965–3977. [Google Scholar] [CrossRef] [Scilit]
- IEA. World Energy Outlook 2022; International Energy Agency: Paris, France, 2022. [Google Scholar]
- Department of Climate Change, Energy, the Environment and Water. Australia’s National Hydrogen Strategy; Department of Climate Change, Energy, the Environment and Water: Parramatta, Australia, 2019. [Google Scholar]
- Maggio, G.; Nicita, A.; Squadrito, G. How the hydrogen production from RES could change energy and fuel markets: A review of recent literature. Int. J. Hydrogen Energy 2019, 44, 11371–11384. [Google Scholar] [CrossRef] [Scilit]
- Steinbach, S.A.; Bunk, N. The future European hydrogen market: Market design and policy recommendations to support market development and commodity trading. Int. J. Hydrogen Energy 2024, 70, 29–38. [Google Scholar] [CrossRef] [Scilit]
- Almaraz, S.D.-L.; Rácz, V.; Azzaro-Pantel, C.; Szántó, Z.O. Multiobjective and social cost-benefit optimisation for a sustainable hydrogen supply chain: Application to Hungary. Appl. Energy 2022, 325, 119882. [Google Scholar] [CrossRef] [Scilit]
- Newborough, M.; Cooley, G. Developments in the global hydrogen market: The spectrum of hydrogen colours. Fuel Cells Bull. 2020, 2020, 16–22. [Google Scholar] [CrossRef] [Scilit]
- Johnson, N.; Ogden, J. A spatially-explicit optimization model for long-term hydrogen pipeline planning. Int. J. Hydrogen Energy 2012, 37, 5421–5433. [Google Scholar] [CrossRef] [Scilit]
- Tlili, O.; Mansilla, C.; Linβen, J.; Reuss, M.; Grube, T.; Robinius, M.; André, J.; Perez, Y.; Le Duigou, A.; Stolten, D. Geospatial modelling of the hydrogen infrastructure in France in order to identify the most suited supply chains. Int. J. Hydrogen Energy 2020, 45, 3053–3072. [Google Scholar] [CrossRef] [Scilit]
- Nunes, P.; Oliveira, F.; Hamacher, S.; Almansoori, A. Design of a hydrogen supply chain with uncertainty. Int. J. Hydrogen Energy 2015, 40, 16408–16418. [Google Scholar] [CrossRef] [Scilit]
- Kim, J.; Lee, Y.; Moon, I. Optimization of a hydrogen supply chain under demand uncertainty. Int. J. Hydrogen Energy 2008, 33, 4715–4729. [Google Scholar] [CrossRef] [Scilit]
- Michalski, J. Investment decisions in imperfect power markets with hydrogen storage and large share of intermittent electricity. Int. J. Hydrogen Energy 2017, 42, 13368–13381. [Google Scholar] [CrossRef] [Scilit]
- Stabler, J. The east coast gas market explained: Analysis of the gas market supply and demand dynamics. APPEA J. 2018, 58, 11–24. [Google Scholar] [CrossRef] [Scilit]
- Zhou, Y.; Li, S. Technology adoption and critical mass: The case of the US electric vehicle market. J. Ind. Econ. 2018, 66, 423–480. [Google Scholar] [CrossRef] [Scilit]
- Tertre, M.G.; Rivas, M.; Saveyn, B.; von Mettenheim, M.; Serre, C.; Martínez, I.; Auger, T.; Babić, A.; Tognoni, M.; Zucker, A. Structural Changes in Energy Markets and Price Implications: Effects of the Recent Energy Crisis and Perspectives of the Green Transition; European Central Bank: Frankfurt, Germany, 2023. [Google Scholar]
- Hwangbo, S.; Lee, I.-B.; Han, J. Mathematical model to optimize design of integrated utility supply network and future global hydrogen supply network under demand uncertainty. Appl. Energy 2017, 195, 257–267. [Google Scholar] [CrossRef] [Scilit]
- Smit, R.; Helmers, E.; Schwingshackl, M.; Opetnik, M.; Kennedy, D. Greenhouse Gas Emissions Performance of Electric, Hydrogen and Fossil-Fuelled Freight Trucks with Uncertainty Estimates Using a Probabilistic Life-Cycle Assessment (pLCA). Sustainability 2024, 16, 762. [Google Scholar] [CrossRef] [Scilit]
- Vijayakumar, V.; Jenn, A.; Ogden, J. Modeling future hydrogen supply chains in the western United States under uncertainties: An optimization-based approach focusing on California as a hydrogen hub. Sustain. Energy Fuels 2023, 7, 1223–1244. [Google Scholar] [CrossRef] [Scilit]
- Sabio, N.; Gadalla, M.; Guillén-Gosálbez, G.; Jiménez, L. Strategic planning with risk control of hydrogen supply chains for vehicle use under uncertainty in operating costs: A case study of Spain. Int. J. Hydrogen Energy 2010, 35, 6836–6852. [Google Scholar] [CrossRef] [Scilit]
- Jang, J.; Lee, H. Effective hydrogen supply chain management framework considering nonlinear multi-stage process uncertainties. Appl. Energy 2024, 367, 123328. [Google Scholar] [CrossRef] [Scilit]
- Vechkinzova, E.; Steblyakova, L.P.; Roslyakova, N.; Omarova, B. Prospects for the development of hydrogen energy: Overview of global trends and the Russian market state. Energies 2022, 15, 8503. [Google Scholar] [CrossRef] [Scilit]
- Zhao, H. Green ammonia supply chain and associated market structure. Fuel 2024, 366, 131216. [Google Scholar] [CrossRef] [Scilit]
- Lei, X.; Zhong, J.; Chen, Y.; Shao, Z.; Jian, L. Grid Integration of Electric Vehicles within Electricity and Carbon Markets: A Comprehensive Overview. eTransportation 2025, 25, 100435. [Google Scholar] [CrossRef] [Scilit]
- Akbari, F.; Valizadeh, J.; Hafezalkotob, A. Robust cooperative planning of relief logistics operations under demand uncertainty: A case study on a possible earthquake in Tehran. Int. J. Syst. Sci. Oper. Logist. 2022, 9, 405–428. [Google Scholar] [CrossRef] [Scilit]
- Taylor, M.; Hunter, T.S. A paradox of plenty: The Australian domestic gas supply regulatory dilemma. J. World Energy Law Bus. 2018, 11, 465–486. [Google Scholar] [CrossRef] [Scilit]
- Yusuf, N.; Al-Ansari, T. Current and Future Role of Natural Gas Supply Chains in the Transition to a Low-Carbon Hydrogen Economy: A Comprehensive Review on Integrated Natural Gas Supply Chain Optimisation Models. Energies 2023, 16, 7672. [Google Scholar] [CrossRef] [Scilit]
- Hancock, L.; Wollersheim, L. EU Carbon Diplomacy: Assessing Hydrogen Security and Policy Impact in Australia and Germany. Energies 2021, 14, 8103. [Google Scholar] [CrossRef] [Scilit]
- Almansoori, A.; Shah, N. Design and operation of a future hydrogen supply chain: Multi-period model. Int. J. Hydrogen Energy 2009, 34, 7883–7897. [Google Scholar] [CrossRef] [Scilit]
- Reuß, M.; Dimos, P.; Léon, A.; Grube, T.; Robinius, M.; Stolten, D. Hydrogen road transport analysis in the energy system: A case study for Germany through 2050. Energies 2021, 14, 3166. [Google Scholar] [CrossRef] [Scilit]
- Longden, T.; Jotzo, F.; Prasad, M.; Andrews, R. Green Hydrogen Production Costs in Australia: Implications of Renewable Energy and Electrolyser Costs; Centre for Climate & Energy Policy: Canberra, Australia, 2020. [Google Scholar]
- Ng, M.T.; Hernandez, A.; Durango-Cohen, P.L.; Mahmassani, H.S. Trading off energy storage and payload–An analytical model for freight train configuration. Transp. Res. Part E Logist. Transp. Rev. 2024, 187, 103601. [Google Scholar] [CrossRef] [Scilit]
- Hassan, M.H.; Kamel, S.; Shaikh, M.S.; Alquthami, T.; Hussien, A.G. Supply-demand optimizer for economic emission dispatch incorporating price penalty factor and variable load demand levels. IET Gener. Transm. Distrib. 2023, 17, 3211–3231. [Google Scholar] [CrossRef] [Scilit]
- Chakrabarty, P.; Alam, K.; Paul, S.K.; Saha, S.C. Hydrogen production by electrolysis: A sustainable pathway. In Hydrogen Energy Conversion and Management; Elsevier: Amsterdam, The Netherlands, 2024; pp. 81–102. [Google Scholar]

Disclaimer/Publisher’s Note: The statements, opinions and data contained in all publications are solely those of the individual author(s) and contributor(s) and not of MDPI and/or the editor(s). MDPI and/or the editor(s) disclaim responsibility for any injury to people or property resulting from any ideas, methods, instructions or products referred to in the content. |
© 2026 by the authors. Licensee MDPI, Basel, Switzerland. This article is an open access article distributed under the terms and conditions of the Creative Commons Attribution (CC BY) license.