


Abstract
To achieve the safe reuse of oil-based drill cuttings, this study employs thermogravimetric analysis and pyrolysis-gas chromatography/mass spectrometry to investigate the formation patterns and kinetic characteristics of pyrolysis products in oil-based drill cuttings. The study included a broad temperature range of 100–980 °C and heating rates of 10, 15, and 20 K/min. Employing the Frazer–Suzuki approach from a multi-step-over-single-step perspective, six pseudo-processes (P1–P6) are isolated for the overall pyrolysis reaction of oil-based drill cuttings. Differences in contributions and activation energies were quantified for each stage. The activation energies for the six pseudo-processes are determined to be 60.81, −59.77, 421.10, 231.64, 225.96, and 349.04 kJ/mol, respectively. With increasing temperature, long-chain aliphatic hydrocarbons in products from oil-based drill cuttings pyrolysis tend to convert into short-chain hydrocarbons and form unsaturated hydrocarbons through dehydrogenation. The oil-based drill cuttings pyrolysis process does not follow a single mechanism but is primarily nucleation-controlled, incorporating multiple reaction mechanisms including geometric contraction, diffusion, and power-law effects.
1. Introduction
The scarcity of traditional energy has significantly hindered global economic development. In response, countries are actively promoting the development and use of unconventional energy sources. Shale gas has gained attention due to its abundant reserves, successful development rates, and prolonged extraction lifespans [1,2,3]. Drilling operations are essential in shale gas exploration and extraction. Oil-based mud is commonly used to ensure drilling safety and wellbore stability, leading to the production of hazardous waste known as oil-based drill cuttings (OBDCs) [4]. OBDCs from a stable complex emulsion, consisting of water, base oil, formation cuttings, clay, and various chemical additives such as weighting agents and lubricants [5,6]. Improper disposal or discharge of OBDCs directly pollutes groundwater, disrupts normal plant growth and development, and poses severe threats to human health [7]. Therefore, addressing the reduction, reutilization, and safe treatment of OBDC is a central focus of current scholarly research.
Common methods for managing OBDCs include solidification [8,9], demulsification [10,11], soil remediation [12,13], and pyrolysis [14,15]. Among these methods, pyrolysis is a highly promising treatment approach. Pyrolysis involves heating OBDC in an oxygen-free or oxygen-limited atmosphere, leading to the production of oil and gas products that can be directly used as fuel or further processed into other industrial products. The residual material from pyrolysis can be used to produce ceramics, cement, and other materials [16,17]. Pyrolysis is characterized by significant reduction in volume and quantity, efficient resource utilization, minimal secondary pollution, and promising economic benefits. Current studies on OBDC pyrolysis technology have investigated the process and product yield but often lack comprehensive descriptions of the pyrolysis process and reaction mechanisms. Analyzing the kinetic characteristics of OBDC pyrolysis is crucial for elucidating and optimizing the process. Moreover, relevant kinetic parameters derived from this analysis can be used to design and operate pyrolysis reactors.
The primary aim of the kinetic analysis is to obtain the kinetic triad, consisting of the pre-exponential factor A, the reaction activation energy , and mechanistic function . Thermogravimetric analysis (TGA) is an effective method for investigating the kinetics of solid-state thermal decomposition. Appropriate models are selected for processing thermogravimetric analysis (TG) data and obtaining the final kinetic parameters. Methods for analyzing thermal decomposition kinetics can be categorized into model-fitting and model-free approaches based on whether a predefined mechanistic function is required. Model-fitting methods significantly simplify the computational process using a predefined kinetic parameter. Ma et al. [18]. and Xia et al. [14] attempted to characterize the kinetics of OBDC pyrolysis using first-order and nth-order mechanistic models alongside various fitting methods such as the Friedman and distributed activation energy model (DAEM). However, these simple and singular mechanistic models cannot comprehensively describe the detailed kinetics. Moreover, while the use of different mechanistic models at specific stages of kinetic analysis may yield satisfactory fitting results, the resulting kinetic parameters, such as activation energy, can vary significantly. This variation indicates a significant level of uncertainty in assuming the mechanism underlying the kinetics of OBDC pyrolysis. Some scholars have also utilized model-free methods [19], which reduces the risk of kinetic misinterpretation owing to improper parameter selection, although these methods are often limited to a narrow temperature range.
To address these issues, this study aims to comprehensively elucidate the multi-step pyrolysis mechanism and kinetics of OBDCs. We employed thermogravimetric analysis (TGA) and pyrolysis gas chromatography/mass spectrometry (Py-GC/MS) to analyze the thermal decomposition process of OBDCs. This included investigating the behavior of chemical bond breaking and product formation at different temperatures. Furthermore, this paper hypothesizes that OBDC pyrolysis is not a single-step reaction but rather a coupled process comprising multiple overlapping sub-reactions across the temperature domain. We innovatively employ the Fraser–Suzuki mathematical deconvolution method to separate the multi-step pyrolysis processes of OBDC. Simultaneously, multiple non-model methods (Flynn-Wall-Ozawa, Kissinger-Akahira-Sunose, and Starink) were employed for kinetic analysis of the pseudo-process, with applicability comparisons against single-step models. Mechanism prediction for the pseudo-process was conducted via principal diagram analysis, thereby establishing a more precise empirical multi-step kinetic framework model.
2. Materials and Methods
The OBDCs used in this study were obtained from Sinopec Chongqing Fuling Shale Gas Company. To eliminate the influence of moisture on the pyrolysis experiment, the samples underwent a 24 h drying process in an 80 °C oven to remove most of the free water. Subsequently, the dried samples were ground using an agate grinding bowl and sieved through a 50-mesh sieve. The processed samples were sealed and stored in a drying chamber.
The contents of C, H, N, O, and S, moisture, ash content, volatile matter, and fixed carbon in the samples were determined using an elemental analyzer (Elementar, Germany) according to the Industrial Analysis Methods for Coal guidelines (GB/T 212-2008 [20]). The oil content was determined using the Soxhlet extraction method. After oil removal and drying, the solid-phase composition was analyzed via X-ray diffraction analysis. Table 1 presents the results of the basic physicochemical property analysis of the materials.
Table 1.
Analysis of physical and chemical compositions of OBDCs.
2.1. X-Ray Diffraction (XRD) Experiment
The mineral phase composition of oil-based drill cuttings and solid waste-based catalysts was characterized using an X’pert3 powder X-ray diffraction (XRD) instrument manufactured by Panalytical of the Netherlands. During the experiment, samples were thoroughly ground before being placed on the sample stage. X-ray scanning was conducted within the 5–90° angle range to acquire diffraction spectrum data.
2.2. Thermogravimetric (TG) Experiment
TG tests were conducted using a comprehensive thermal analyzer STA449F3 (NETZSCH Instruments GmbH, Selb, Germany) with nitrogen (N2) as the inert gas at a flow rate of 100 mL/min. The sample, placed in an alumina crucible, was heated from approximately room temperature to 900 °C with heating rates of 10, 15, and 20 K/min, respectively. To avoid buoyancy effects, blank alumina crucibles were subjected to the same heating and gas conditions for baseline calibration before each test at different heating rates. Approximately 10 mg of the sample (with an error margin not exceeding 0.2 mg) was used for each pyrolysis experiment and uniformly dispersed to minimize heat and mass transfer effects.
2.3. Differential Scanning Calorimeter (DSC) Experiment
Differential scanning calorimetry testing was conducted using a TG-DSC coupler for simultaneous data acquisition. Experiments were performed under a nitrogen protective atmosphere, with gas flow rates consistent with TG testing. Samples were uniformly spread within alumina crucibles to minimize heat and mass transfer effects. The heating program matched that used for TG analysis, ascending from ambient temperature to 900 °C at rates of 10, 15, and 20 K/min. Prior to testing each set of conditions, baseline correction was performed using an empty alumina crucible under identical heating and atmosphere conditions.
2.4. Pyrolysis Gas Chromatography/Mass Spectrometry (Py-GC/MS) Experiments
Rapid pyrolysis tests were conducted using a pyrolyzer (EGA-PY-3030D, Frontier Lab, Fukushima, Japan) coupled with a gas chromatography–mass spectrometer (GCMS-QP2020NX, Shimadzu, Kyoto, Japan). Pyrolysis temperatures were set at 300 °C, 500 °C, and 700 °C, each with a retention time of 12 s each. The GC injection port was set to 300 °C using helium as the carrier gas at a flow rate of 1 mL/min and a split ratio of 40:1. The GC oven was initially set to 40 °C and held for 3 min. The temperature was then increased at 10 K/min to 140 °C, increased further at 20 K/min to 310 °C, and held for 8 min. The electron impact ionization source of the mass spectrometer was set at 200 °C with an electron energy of 70 eV and a scanning range of 29–600 m/z. The composition of pyrolysis products was determined by comparing them with the NIST library.
2.5. Kinetic Analysis Methods
2.5.1. Methods for Single-Step and Multi-Step Reaction Kinetic Models
Generally, the single-step reaction kinetics equation is used to describe the non-isothermal thermal decomposition of solid-state materials, expressed as follows:
where α represents the conversion rate, reflecting the extent to which reactants are transformed into products. The conversion rate is defined as . In this equation, represents the initial reactant mass; denotes the remaining mass after the reaction is complete; and signifies the sample mass at any given time. Additionally, represents the heating rate. The reaction constant , which is closely related to temperature, is described by the Arrhenius equation:
where A denotes the pre-exponential factor (min−1); represents the activation energy of the chemical reaction ; and R indicates the universal gas constant, where .
Due to the simple chemical composition of the material and the fact that its thermal decomposition is governed by a single process, the decomposition reaction can occur in a single step. In this scenario, introducing a single-step reaction kinetic model to calculate the kinetic triplets (i.e., , and ) is effective. However, in a chemical reaction involving multiple independent stages, each stage is significant and cannot be overlooked. Therefore, considering multi-step reactions is vital [21]. Current studies have mainly indicated that the thermal decomposition of OBDCs predominantly occurs in four stages [22,23].
The kinetic equations for the multi-step reaction based on this model are expressed as follows:
where represents the number of reaction steps, and denotes the contribution ratio of a single reaction component to the overall conversion rate. The sum of contribution ratios from individual sub-steps within a complete reaction should equal 1, . The computation method for is discussed further in the following subsection.
The function in pyrolysis kinetics characterizes the relationship between conversion and reaction rate. It describes the characteristics of reaction rates at different reaction stages through conversion changes. It is worth noting that in Equation (4) is independent of the reaction step “i”, because it is introduced to represent a universal relationship between the conversion and rate rather than a step-specific mechanism. Accordingly, processes such as light-oil volatilization, heavy-oil cracking, and mineral decomposition are assumed to follow the same functional form of and therefore need not be distinguished by individual reaction steps.
Although chemical and thermal coupling may exist between parallel steps in OBDC pyrolysis, such coupling is typically manifested experimentally through temperature field gradients and component concentration gradients, which in turn induce local rate gradients . In this work, STA measurements were conducted under an inert N2 atmosphere using −10 mg of a uniformly distributed material in the crucible to minimize heat- and mass-transfer limitations. This design was intended to approximate weakly coupled conditions, under which parallel steps can be treated as independently superimposed. Consequently, and are reduced, allowing each pseudo-process to experience the same programmed temperature profile . Thus, each process evolved independently into its own rate contribution . During stable reactions, changes in reactant concentrations are relatively gradual, and variations in the temperature gradient are uniform. Furthermore, post-deconvolution fitting yields a quality factor > 99% with reproducible shoulder peaks, indicating that independent sub-peak superposition can fully reconstruct the overall rate. Furthermore, the isoconversion method applied to the separated pseudo-processes in this study reveals that remains largely independent of , indicating that each pseudo-process can be described by relatively consistent internal kinetics. This demonstrates that independence at the pseudo-component level is held under the experimental conditions employed.
In particular, represents the relative content of three reactants in OBDCs, with denoting light organic matter, heavy organic matter, and inorganic matter, respectively. These values range between 0 and 1. The rate of change in the content of each component over time is expressed as follows:
The assumption regarding the number of reaction steps in the thermal decomposition of OBDCs was based on the primary reactant composition. In practice, a single reactant may undergo multiple parallel or competitive reactions, along with the occurrence of minor reactions. For example, Bach [24] used a model ranging from a single reaction to seven parallel reactions to predict the pyrolysis behavior of microalgal biomass. The findings revealed that an increase in reaction steps enhanced the fitting quality of the model. Moreover, Vyazovkin [25] indicated that introducing these additional steps into the kinetic model is rational only if it provides useful kinetic information after optimization, such as the ability to predict shoulders or peaks. Hence, obtaining enough kinetic information is crucial to determining the reaction steps.
2.5.2. Multi-Step Reaction Separation Methods
The mathematical deconvolution technique enabled the decomposition of the overall reaction rate curve into several individual peaks. Commonly used peak-fitting functions included Gaussian, Lorentzian, and Frazer–Suzuki functions. However, Gaussian and Lorentzian functions were ineffective in managing asymmetric kinetic curves owing to their inability to handle asymmetry [26,27]. Conversely, the Frazer–Suzuki function was used to fit asymmetric curves and accommodate deviations resulting from non-uniformity in particle size distribution within kinetic curves [28]. Therefore, this study adopted the Frazer–Suzuki function for the deconvolution of multi-step reaction rate peaks. The key premise of Fraser-Suzuki deconvolution is that the overall DTG signal can be represented as the superposition of multiple asymmetric peaks. Through multi-peak fitting, overlapping mass-loss processes can be separated into several pseudo-processes, allowing the extraction of peak parameters such as peak position and relative contribution for each sub-peak. This approach is widely used to interpret multi-stage pyrolysis behavior and has been shown to effectively resolve overlapping peaks in multicomponent systems, with correlation coefficients typically exceeding 0.99 [27,29,30], indicating strong capability in characterizing complex DTG overlaps. Concurrently, the Fraser–Suzuki peak shape incorporates asymmetric characterization capabilities. It includes long tails resulting from slow decomposition into the peak function, thereby absorbing the apparent baseline drift caused by tailing. This reduces interference with peak areas and the interpretation of peak position.
Regarding considerations for pseudo-process parameters, peak overlap leads to inaccurate determination of peak position, resulting in erroneous estimates of the pseudo-processes’ transition temperatures and pyrolysis rates. In this study, the Fraser–Suzuki deconvolution method was used to introduce asymmetric sub-peak shapes and accurately separate overlapping peaks. Multi-step fitting (P1–P6) eliminates interference from peak overlaps in pseudo-processes. By optimizing shape parameters for each sub-peak, this approach effectively mitigates errors arising from peak overlaps. The equation for this function is given as follows:
where denotes the total rate peak curve, and represents the individual step rate curve after deconvolution. The ratio of the area under a single peak compared to the total peak area, denoted as , is referred to as the contribution factor. , , , and denote the amplitude, position, half-width at half-maximum, and shape parameters, respectively.
In this study, was not explicitly defined as a fitting function , but was obtained by defining the contribution rate of the single peak area after Frazer–Suzuki deconvolution. Consequently, its temperature program dependency was primarily manifested through the difference obtained from deconvolution at different heating rates and the phenomenon of peak positions shifting towards higher temperatures with thermal hysteresis. Building upon this, the kinetic parameters were determined for each pseudo-process separated at distinct heating rates using the multi-heating-rate Starink isothermal conversion rate method. The slope values yielded R2 > 0.9 in most cases, indicating that the temperature dependence of the fitted kinetic parameters is generally controllable, except for processes like P2 where strong heating-rate dependence causes apparent anomalies.
In this study, activation energy, , was primarily obtained using the multi-heating-rate model’s free conversion rate method. Following deconvolution, for each pseudo-process was determined by the Starink slope, which exhibited strong linear relationships with R2 > 0.9 in most cases. Consequently, demonstrates relatively low sensitivity to potential compensatory effects between the Arrhenius parameters and , whereas is comparatively more susceptible to fitting errors and exhibits higher sensitivity.
2.5.3. Dynamic Parameter Solution Methods
Solid-state non-isothermal thermal decomposition kinetics analysis mainly involves model-fitting and model-free approaches. In the model-fitting technique, a reaction model function is established based on empirical knowledge. Kinetic parameters are determined by substituting an approximate solution into the model using a one-step linear fit to obtain the kinetic triplets (i.e., , , and , where is assumed before calculation). However, significant errors in parameter determination may occur due to the use of inappropriate models or complex reactions without corresponding matching models.
Conversely, the model-free approach does not assume any specific kinetic parameters. Instead, this approach determines the activation energy and pre-exponential factor using multiple heating rates during specific conversion processes, known as isoconversional methods. These methods are considered highly precise and widely applicable in kinetics [31,32,33,34,35]. In this study, three commonly used model-free methods (FWO, KAS, and Starink) were utilized to determine and compare the kinetic parameters of the thermal decomposition reaction of OBDCs. The formulas for these three methods are provided below.
The FWO method:
The KAS method:
The Starink method:
2.5.4. Response Mechanism Prediction Methods
Upon obtaining the activation energies for various stages of OBDC pyrolysis through the isoconversional method, the reaction mechanism function can be evaluated using the master plot method:
Among the mechanistic functions, and represent the mechanistic function and its integral form at a conversion rate , respectively. A series of theoretical master plots were plotted for mechanistic functions and compared with experimental master plots to identify potential reaction models. Common mechanistic functions are listed in Table 2.
Table 2.
Common solid-phase kinetic reaction mechanisms [36,37,38].
2.5.5. Methods of Modeling Empirical Mechanisms
The use of the master plot method enabled the development of mechanistic models with physical significance. However, a single reaction mechanism may exhibit poor adaptability to the actual kinetic process [39,40]. Sestak and Berggren [41] introduced an empirical model in a combined form:
This equation can be represented through various combinations of m, n, and p, signifying different thermal decomposition mechanisms. Equation (15) was substituted into Equation (1) and then applied to yield a linear transformation as follows:
where ‘n’ represents the number of experimental data points used in the calculations, while and denote the experimental and calculated values obtained from Equation (16), respectively.
3. Results and Discussion
3.1. XRD Analysis
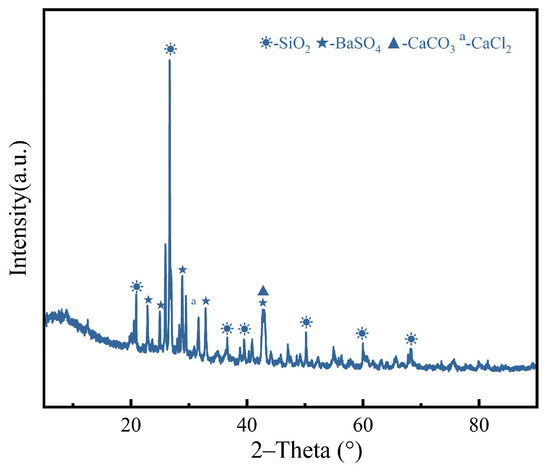
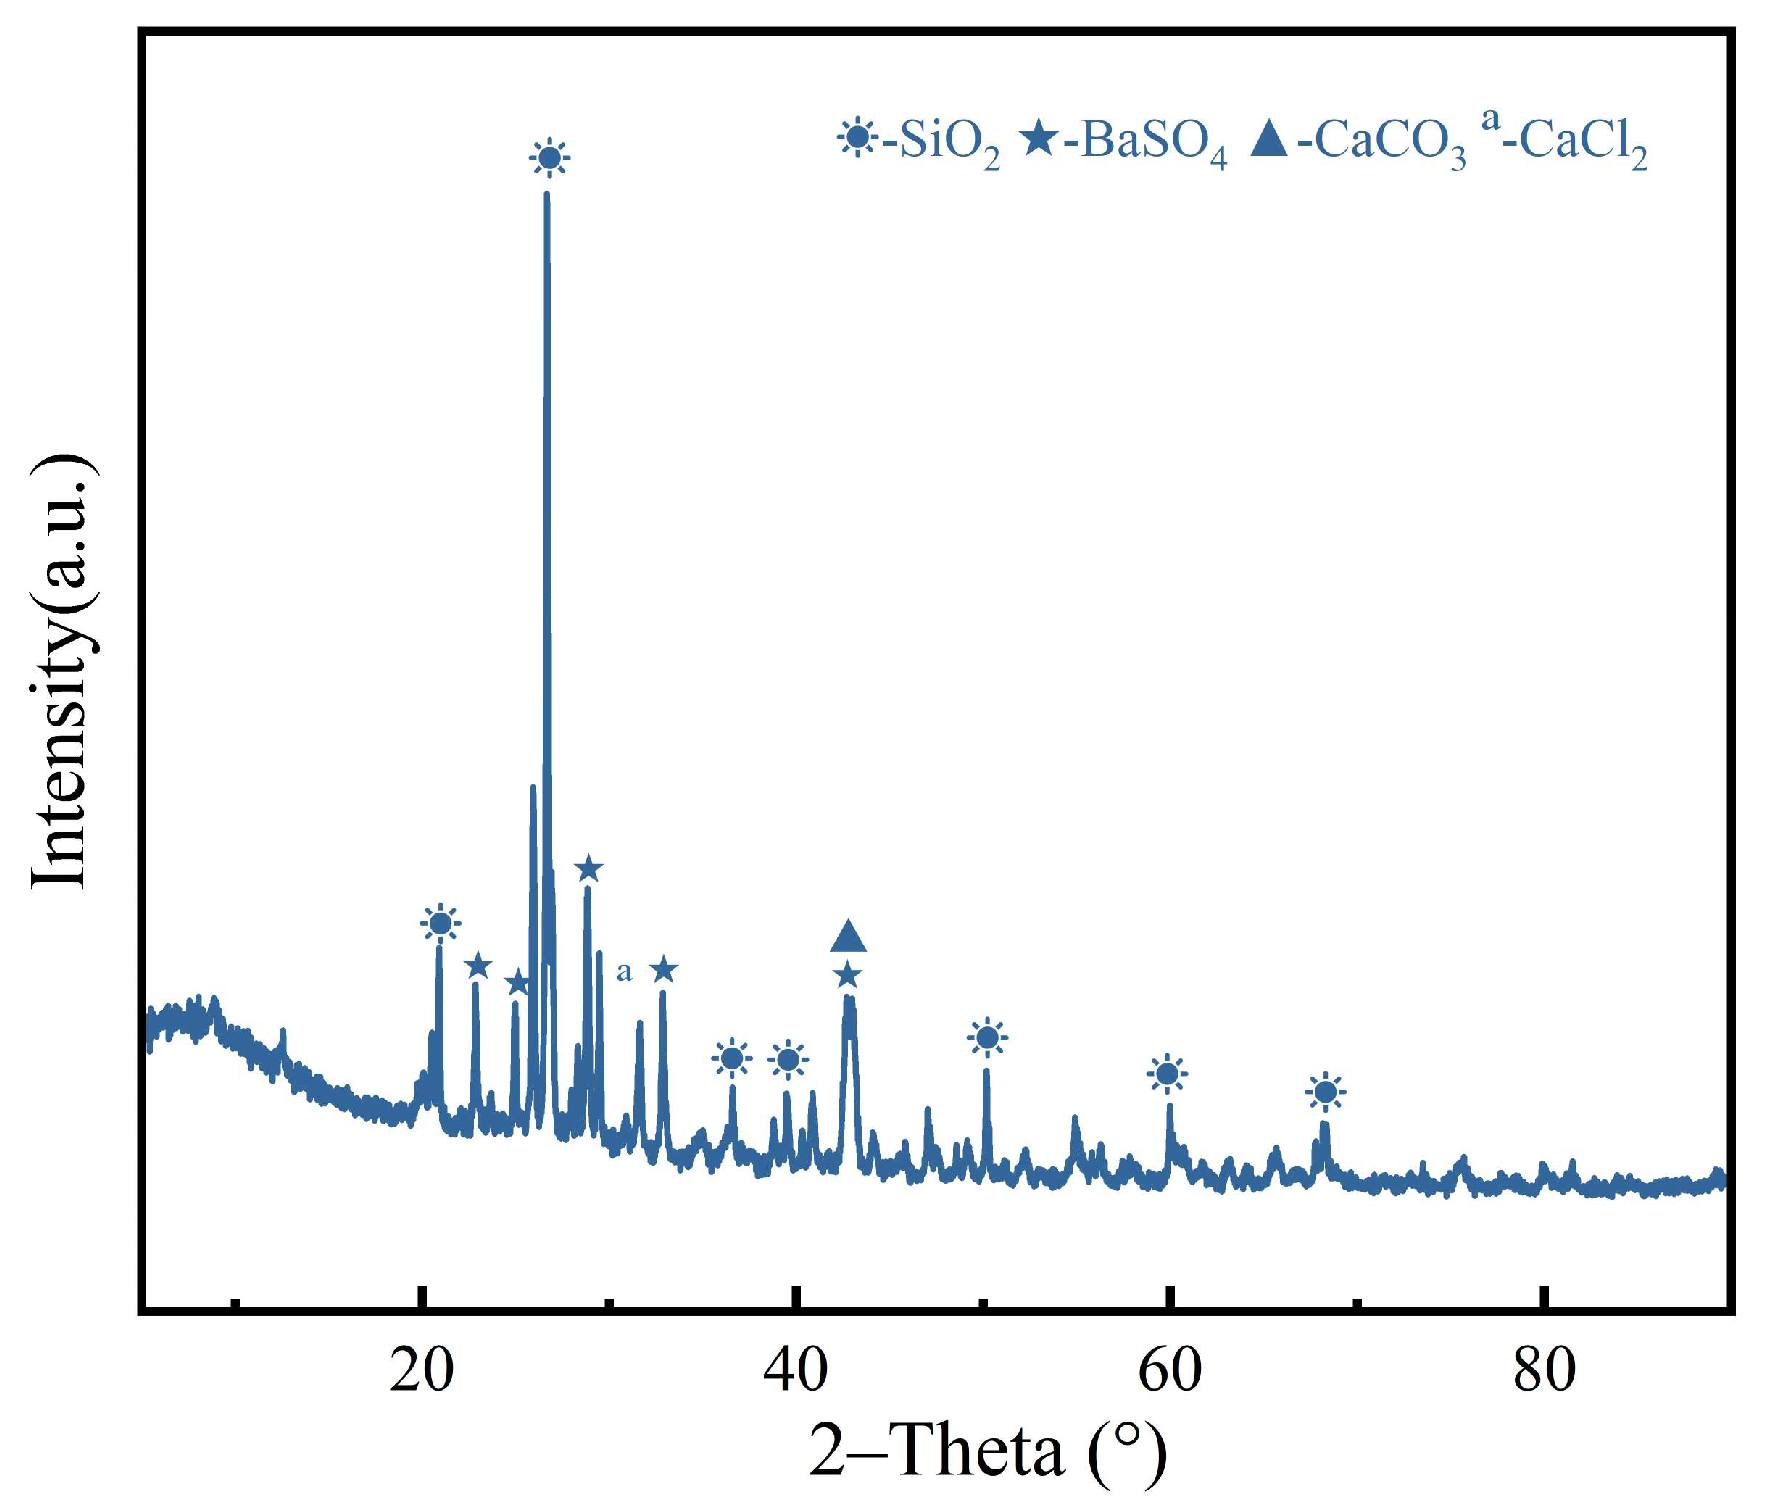
Spectral analysis indicated that the primary crystalline phases in oil-based drill cuttings comprise SiO2, BaSO4, CaCO3 and CaCl2. SiO2 and CaCO3 predominantly originate from formation cuttings entrained during drilling, whilst BaSO4 and CaCl2 are primarily associated with additives in the drilling fluid system, such as weighting agents and emulsifiers. This phase composition aligns with the dominant elements Si, S, Ca, and Ba identified by XRF analysis, while also providing direct crystallographic evidence for the high ash content of the samples. The detection of CaCO3 in XRD provides crucial corroborating evidence for the mechanism of later-stage inorganic mineral decomposition and the release of CO2 during carbonate decomposition. This forms a closed loop in the mineralogical evidence for the origin of weight loss and CO2 generation pathways during the high-temperature stage of the TG process. The X-ray diffraction test results for oil-based drill cuttings samples are shown in Figure 1.
Figure 1.
XRD test results for oil-based drill cuttings sample.
3.2. Thermogravimetric Analysis (TG/DTG)
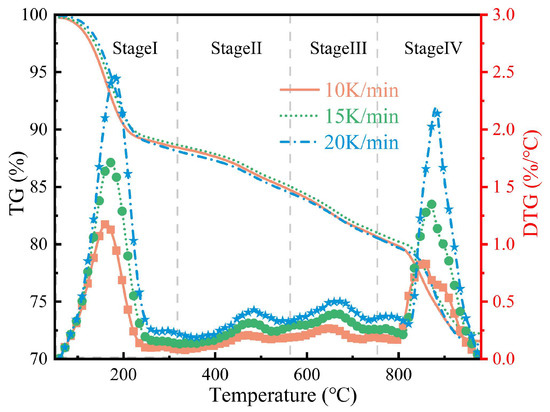
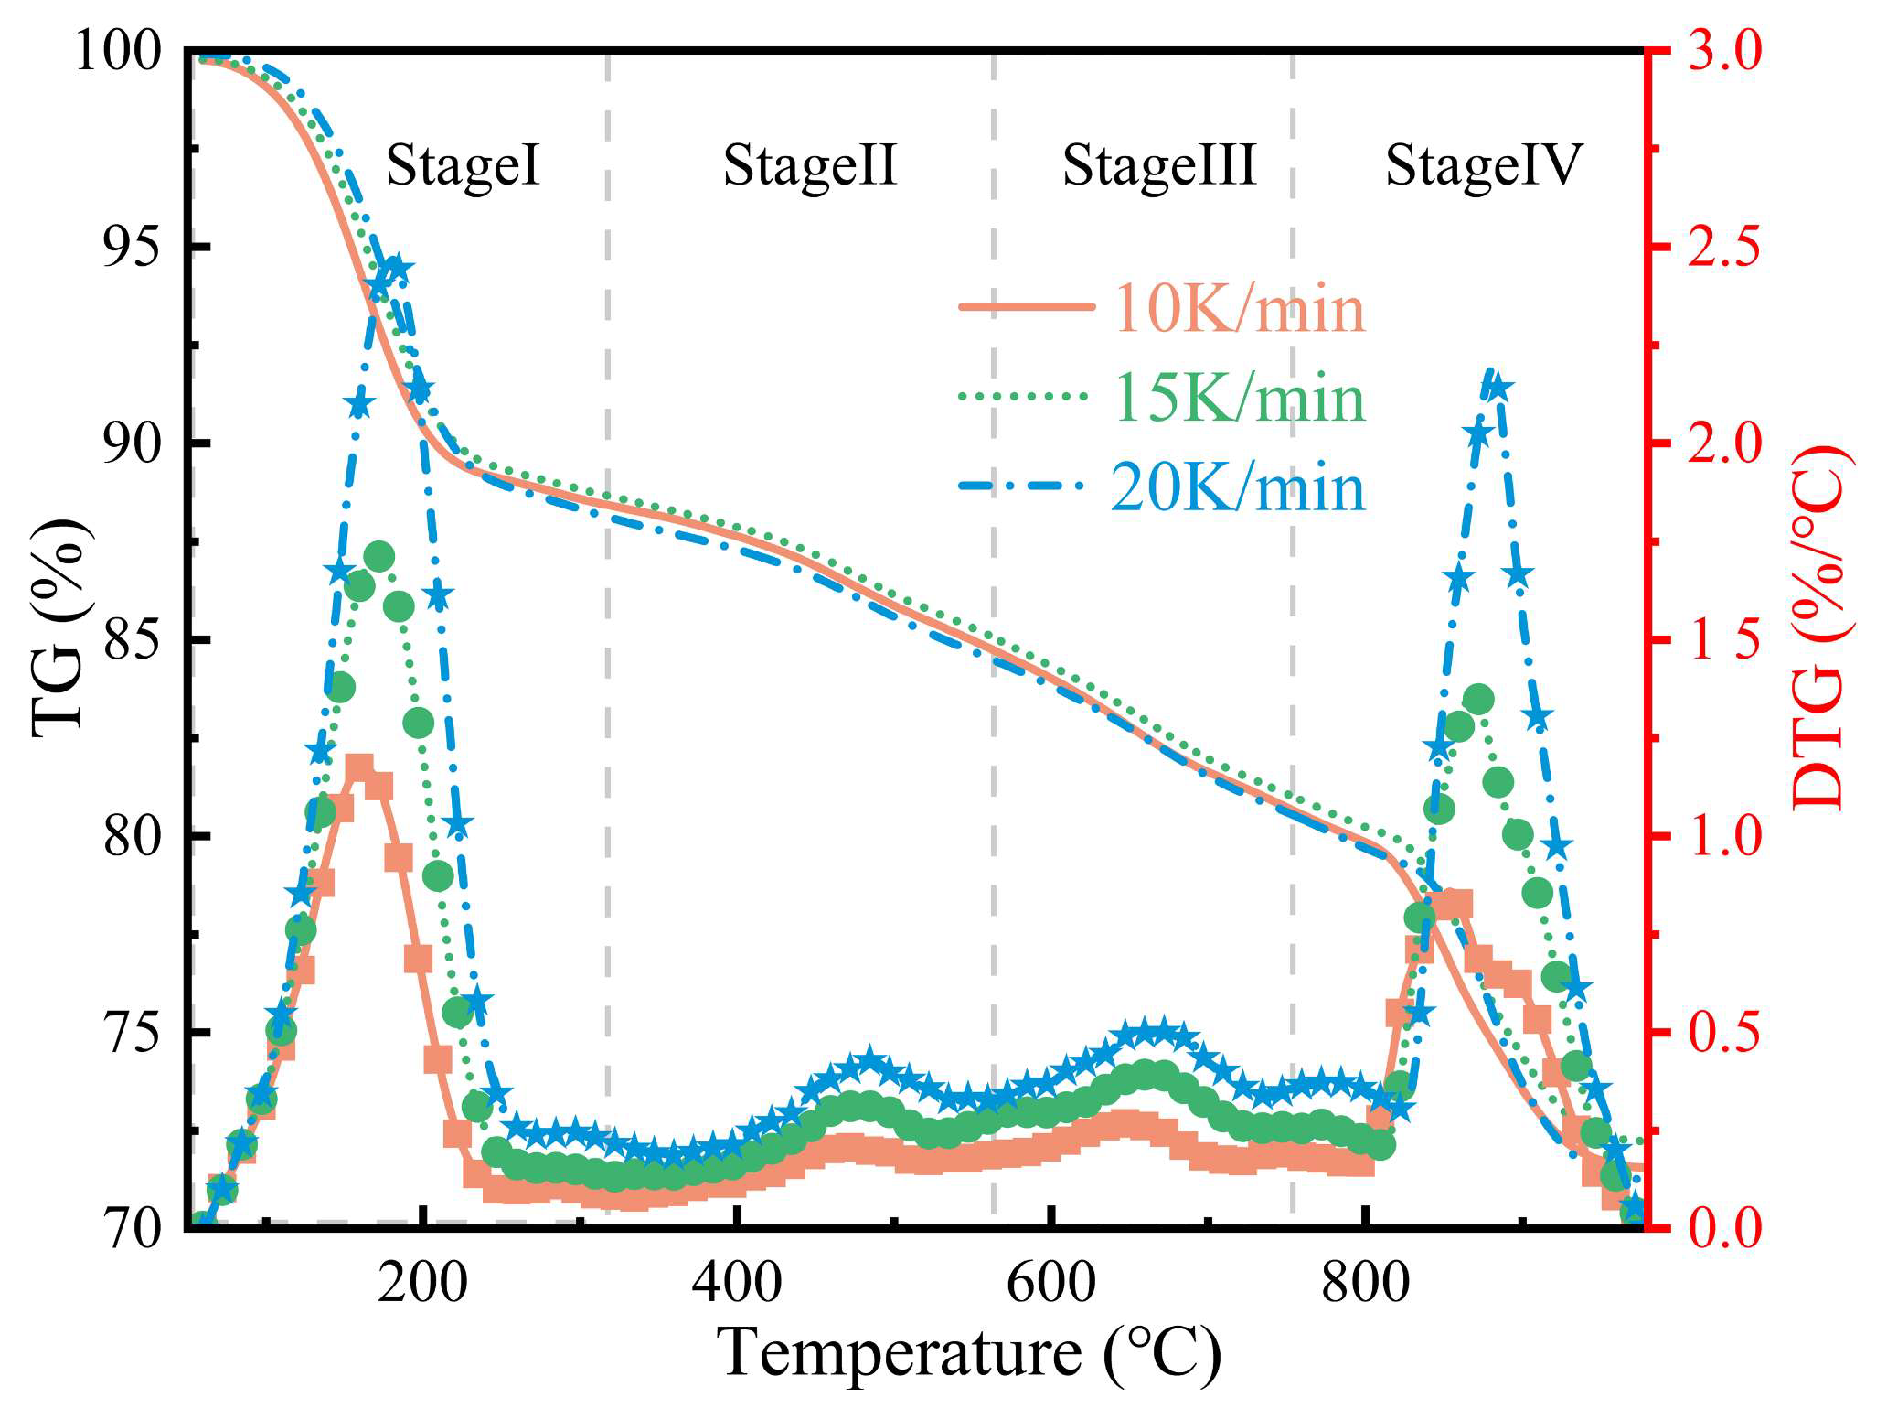
Figure 2 shows the TGA and DTG curves fore OBDCs during heating at rates of 10, 15, and 20 °C/min. The pyrolysis process can be classified into four stages. As the samples underwent pre-drying to remove most of the free water, the first pyrolysis stage (100–330 °C) mainly involved the release of bound water and the thermal decomposition and desorption of light oil fractions. This stage accounted for ~11.4% of the mass loss, representing the most significant weight loss phase. The second (330–580 °C) and third pyrolysis stages (580–770 °C) involved the volatilization and secondary cracking of heavy oil fractions, possibly accompanied by a minimal amount of inorganic mineral decomposition. Although these two stages exhibited broad temperature ranges, they exhibited relatively gradual mass loss rates of ~3.9% and 4.0%. The fourth stage (770–980 °C) exhibited a significantly higher mass loss of ~8.5% owing to the decomposition of calcium carbonate and residual heavy hydrocarbons at high temperatures. Beyond 900 °C, weight loss slowed down, indicating the completion of the pyrolysis reaction. As the heating rate increased, the TG and DTG curves shifted toward higher temperature regions owing to a thermal lag effect caused by temperature gradients within the sample. Similar observations have been reported in other studies [42,43,44].
Figure 2.
The TG and DTG curves of OBDC during the pyrolysis process at heating rates of 10, 15, and 20 K/min.
Despite the significant overlap of DTG peaks in Stages II–III and continuous evolution of heavy oil cracking between 330 and 770 °C, four macroscopic weight loss phases and key control events were identified in this study. Utilizing the Fraser–Suzuki method to integrate decoating processes, P1–P6 were isolated and achieved >99% fitting quality across three heating rates, enabling prediction of shoulder peaks and minor peaks. This demonstrates that overlapping peaks can be stably and interpretably separated at the level of kinetic components. Meanwhile, the values of and in Table 3 indicate that P1 and P5 are predominant, whilst P2–P4 reflect the phenomenon of overlap for cracking of heavy oils across a broad temperature range. PY-GC/MS products at 300 °C, 500 °C, 700 °C exhibit continuous lightening and enhance secondary cracking with increasing temperature, providing chemical evidence for continuous cracking in Stages II–III. This validates that the four-stage classification is effective in distinguishing process types.
Table 3.
Peak positions ( ) and contribution rates () obtained from the deconvolution process.
Given that the TG/DTG curve shifts towards higher temperatures as the heating rate increases, resulting in thermal hysteresis, fixed temperature intervals for segmentation cause phase boundary temperatures to drift under different heating rates. The magnitude of this drift can be estimated from the peak positions in Table 3. Within the 10–20 K/min range, characteristic peaks shift to the right by approximately 10–30 K, with heightened sensitivity occurring in the II–III broad temperature zone where peak overlap is present. To ensure comparability across heating rates, this study utilized Fraser–Suzuki deconvolution at each heating rate, yielding six stable pseudo-processes with fitting quality > 99%. These processes reliably reproduced minor peaks and shoulder peaks. Subsequently, kinetic parameters were obtained using the multi-heating-rate Starink conversion rate method. The results showed that most correlation coefficients exceeded 0.9 while remained fundamentally stable. This approach mitigated the impact of thermal hysteresis on consistency of temperature boundaries at the kinetic level.
3.3. DSC Analysis
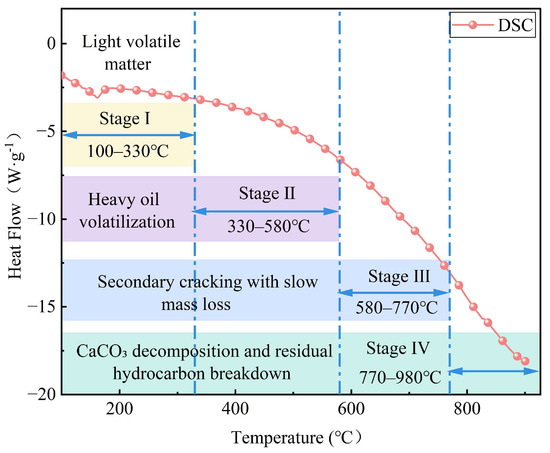
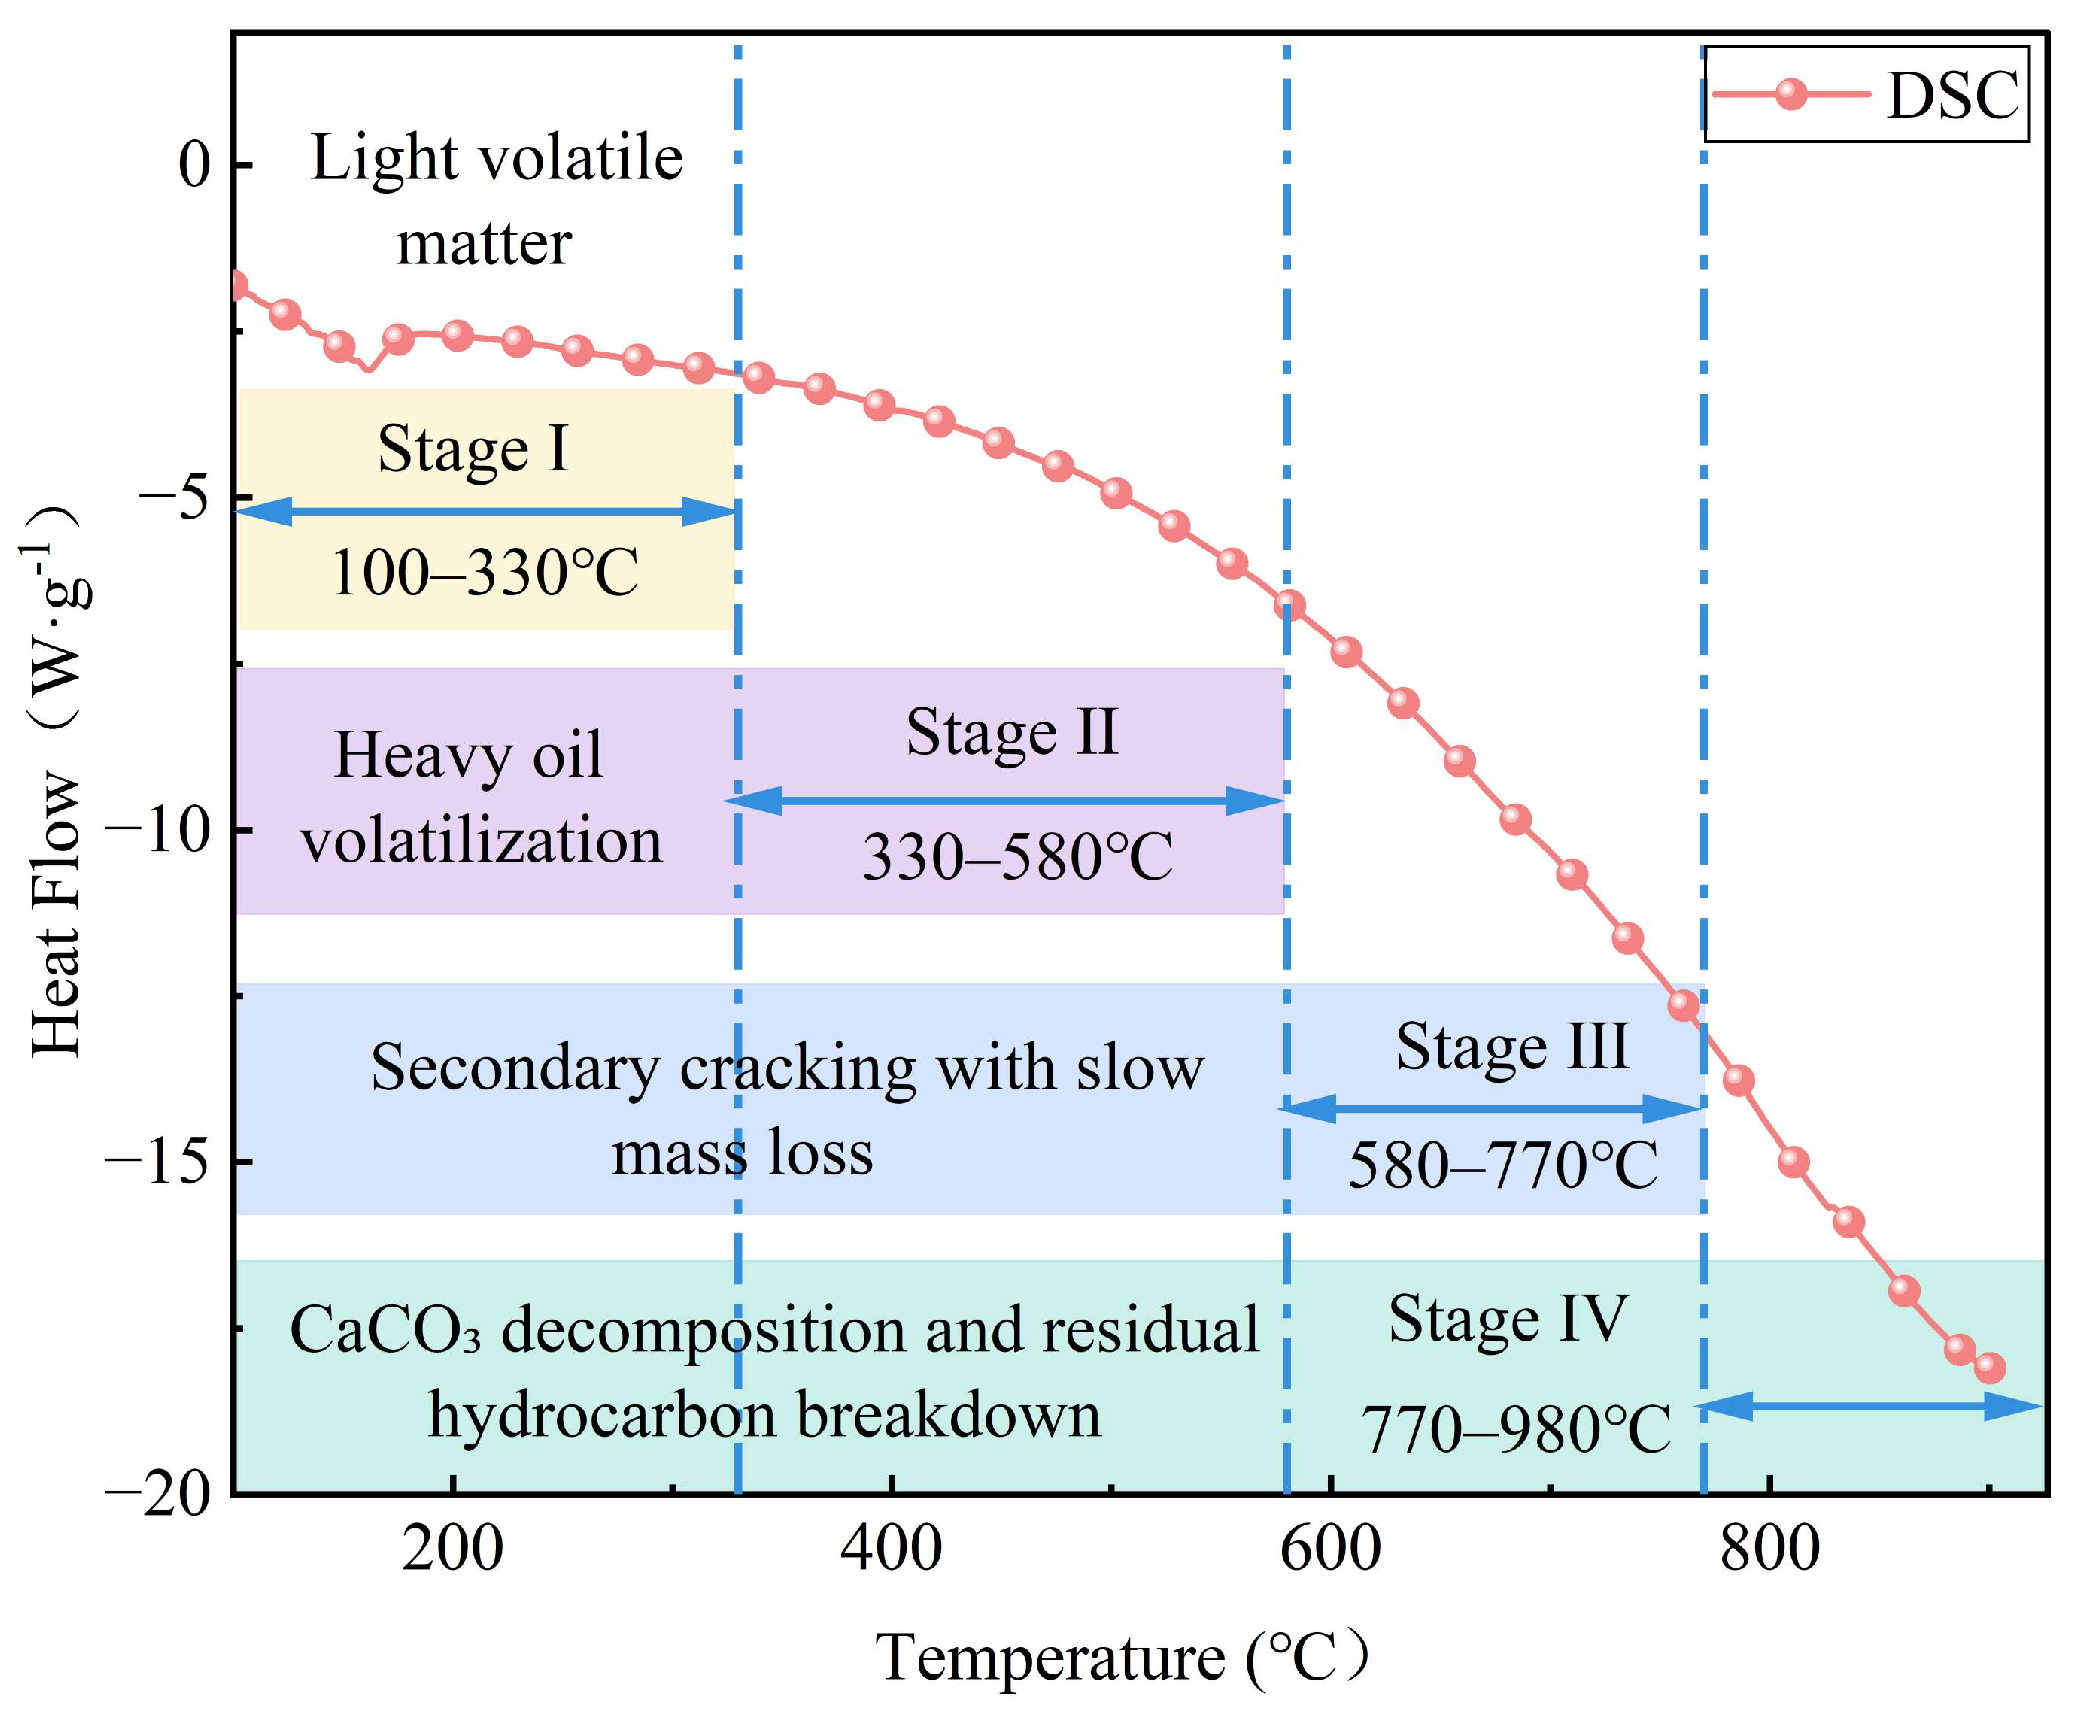
DSC thermal analysis complements the characterization of thermal effects in the OBDC pyrolysis process from an energy perspective. The DSC heat flow curve at is shown in Figure 3. The DSC results indicate that the heat flow signal shifts progressively towards negative values with increasing temperature, exhibiting a continuous increase in absolute magnitude rather than isolated sharp peaks. This pattern aligns with the characteristics of OBDC pyrolysis, which involves multiple concurrent and competing reactions rather than a single-step process. The four-stage classification from TG/DTG analysis was integrated as follows: Stage I features relatively moderate heat flow changes, corresponding to the release of bound water and the thermal decomposition and desorption of light oil components. During Stages II–III, the negative drift of heat flow accelerates, reflecting the sustained progression of heavy oil volatilization and secondary cracking across a broad temperature range. This conclusion aligns with the observation of multiple minor weight loss peaks between 300 and 700 °C. Stage IV exhibits the most pronounced increase in absolute heat flow, corresponding to CaCO3 decomposition and high-temperature cracking of residual heavy hydrocarbons. Simultaneously, deconvolution results indicate that the high-temperature pseudo-process primarily involves decomposition of inorganic salts and residual high-carbon organic matter, thereby establishing a consistent phased evidence chain across both mass conversion and energy response measurements.
Figure 3.
DSC heat flow curve of OBDCs at a heating rate of 10 K/min.
3.4. PY-GC/MS Analysis
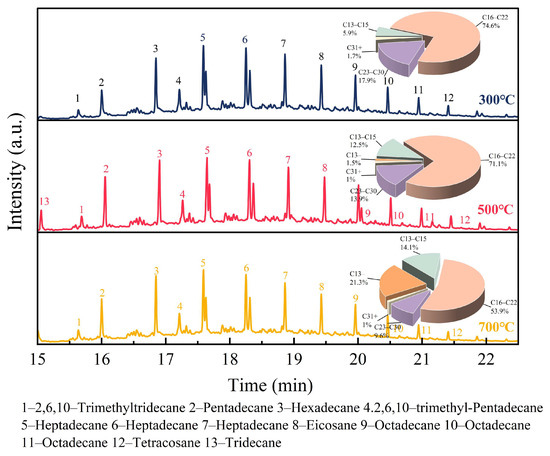
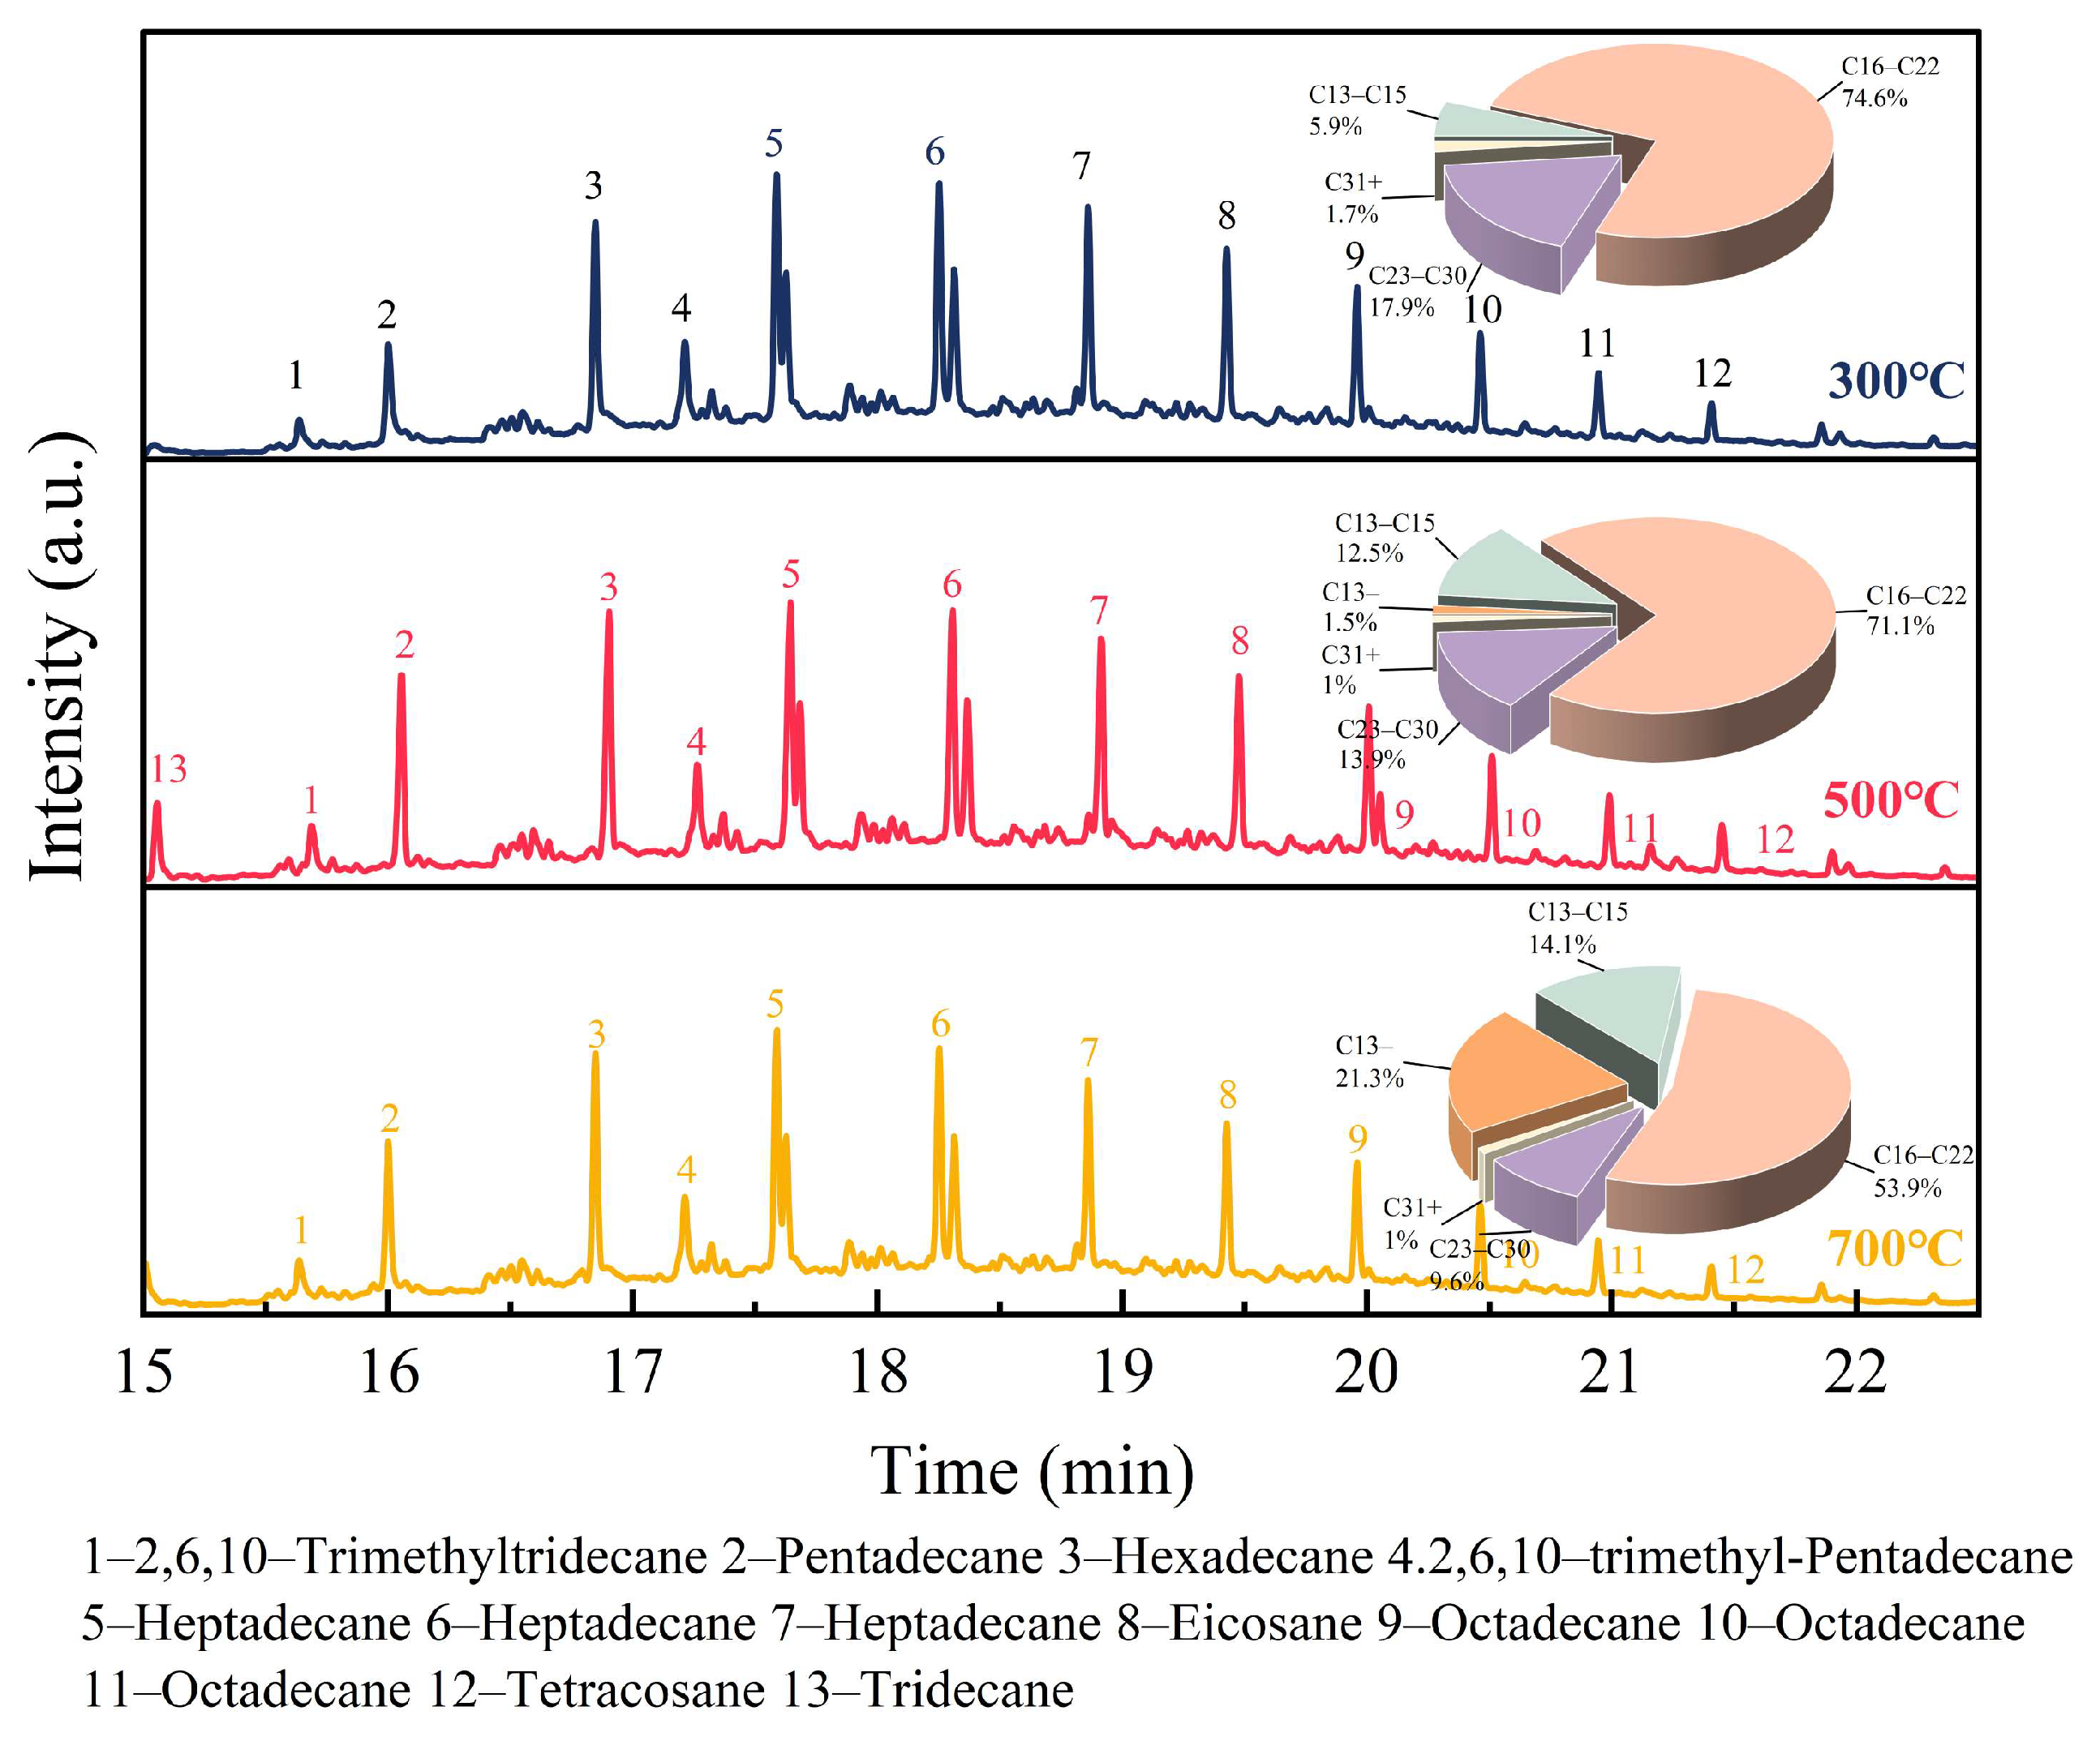
In the temperature range of 300–700 °C, OBDCs exhibited multiple small weight loss peaks, indicating the complexity of the component decomposition process of heavy oil. To comprehensively elucidate the reaction mechanism, we used PY-GC/MS to investigate the product distribution and content of OBDC at decomposition temperatures of 300 °C, 500 °C, and 700 °C. The main volatile components obtained from OBDC decomposition were normal and branched alkanes, which accounted for over 80% of the total composition. Additional components included olefins, halogenated hydrocarbons, alcohols, and esters, with a minimal number of aromatic compounds detected. The distribution of carbon numbers for the compounds is outlined in Figure 4. Most of the volatile components were in the range of C16–C22, corresponding to the composition of middle distillate diesel. With increasing pyrolysis temperature, the proportion of components with carbon numbers exceeding 16 gradually decreased, indicating an increased conversion from long-chain hydrocarbons to short-chain hydrocarbons at higher temperatures.
Figure 4.
Percentage area of OBDC decomposition products.
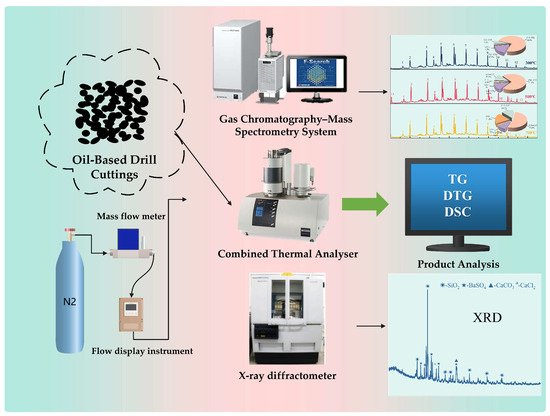
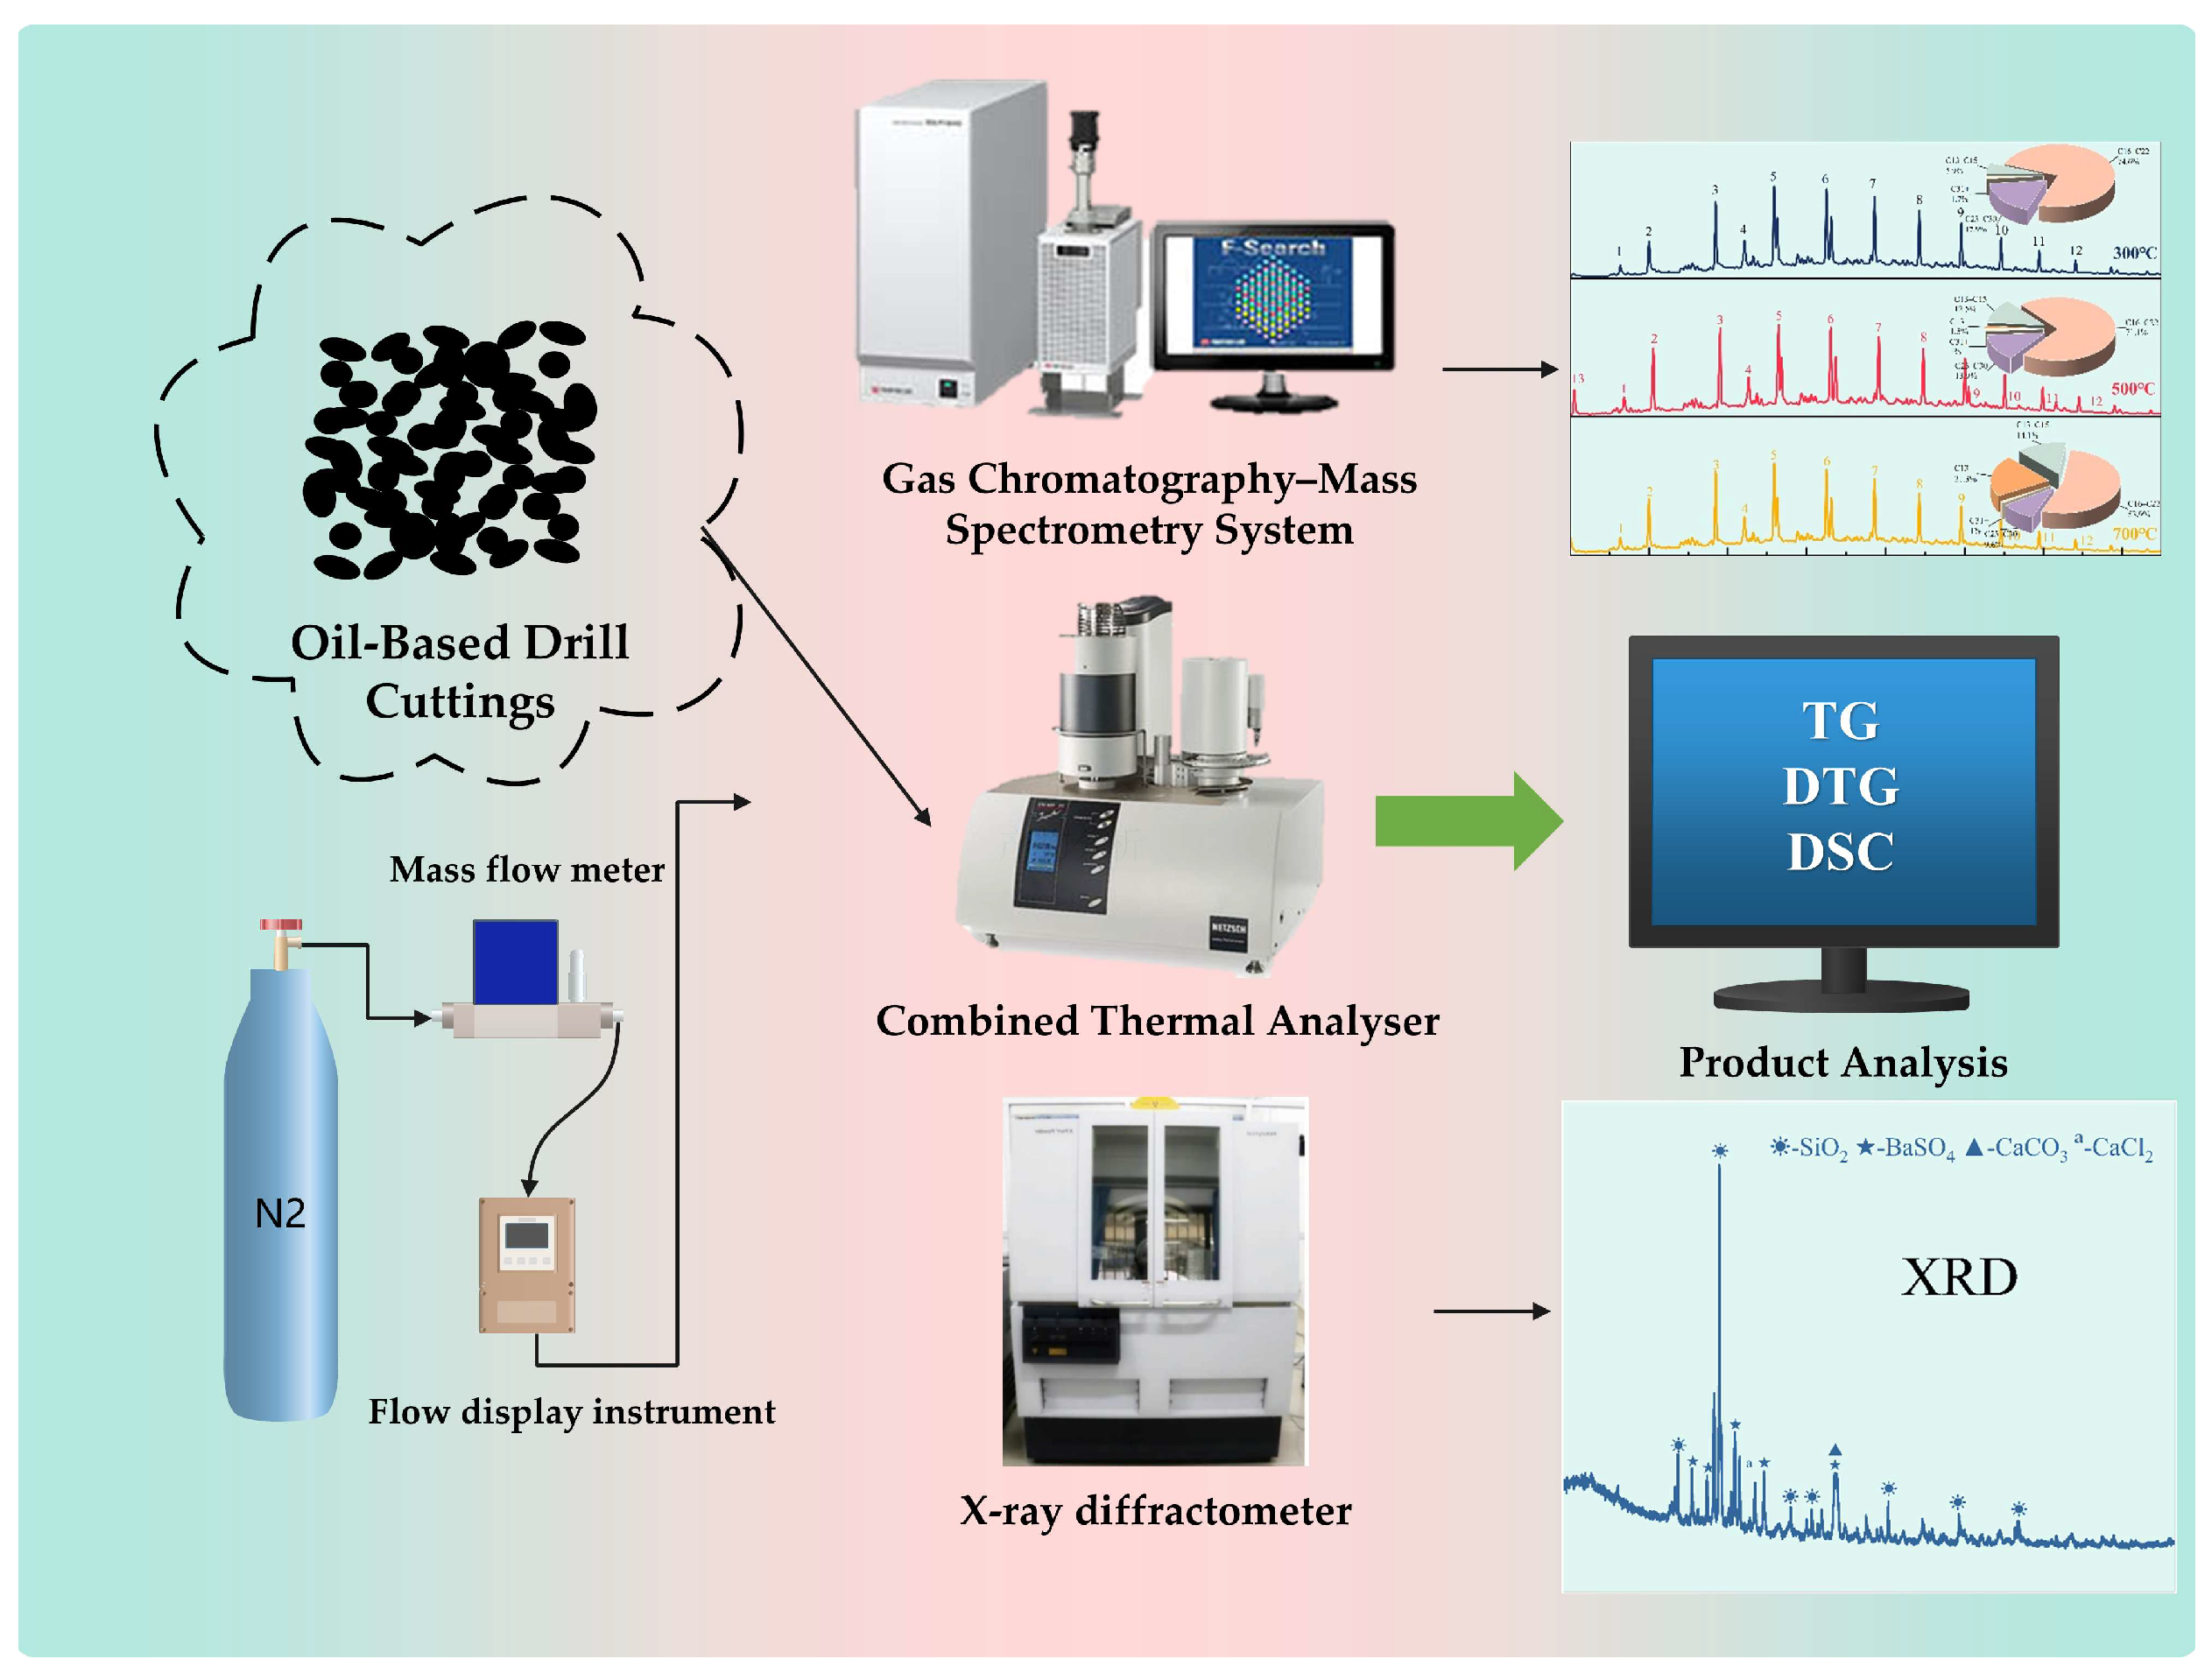
The multi-step pyrolysis mechanism of OBDCs comprised a sequence of free radical reactions [45]. Within 300–500 °C, the first step involved the removal of oxygen-containing groups. This resulted in the generation of small gaseous molecules such as CO and CO2 through free radical reactions due to the relatively low bonding energy of C-O-C and C-O-R bonds. As the temperature increased, the cracking of long-chain hydrocarbons (C23–C30) occurred, mainly initiated by the cleavage of C-C bonds at the middle position of the chain. This resulted in the formation of two hydrocarbons with the same carbon number and alkyl radicals. Subsequently, the long-chain radicals underwent a series of and radical recombinations to produce olefins, alkanes, and small alkyl radicals. At 700 °C, the alkane generated from the primary reactions continued to undergo bond cleavage to produce short-chain alkanes and olefins [46]. Additionally, dehydrogenation condensation and Diels-Alder reactions occurred, leading to a significant increase in the proportion of and cycloalkanes. The configuration of the experimental apparatus is illustrated in Figure 5.
Figure 5.
Schematic diagram of the experimental system.
3.5. Validation of Single-Step Reaction Kinetic Model
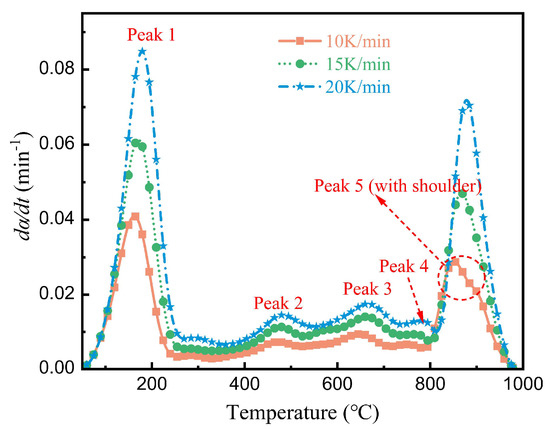
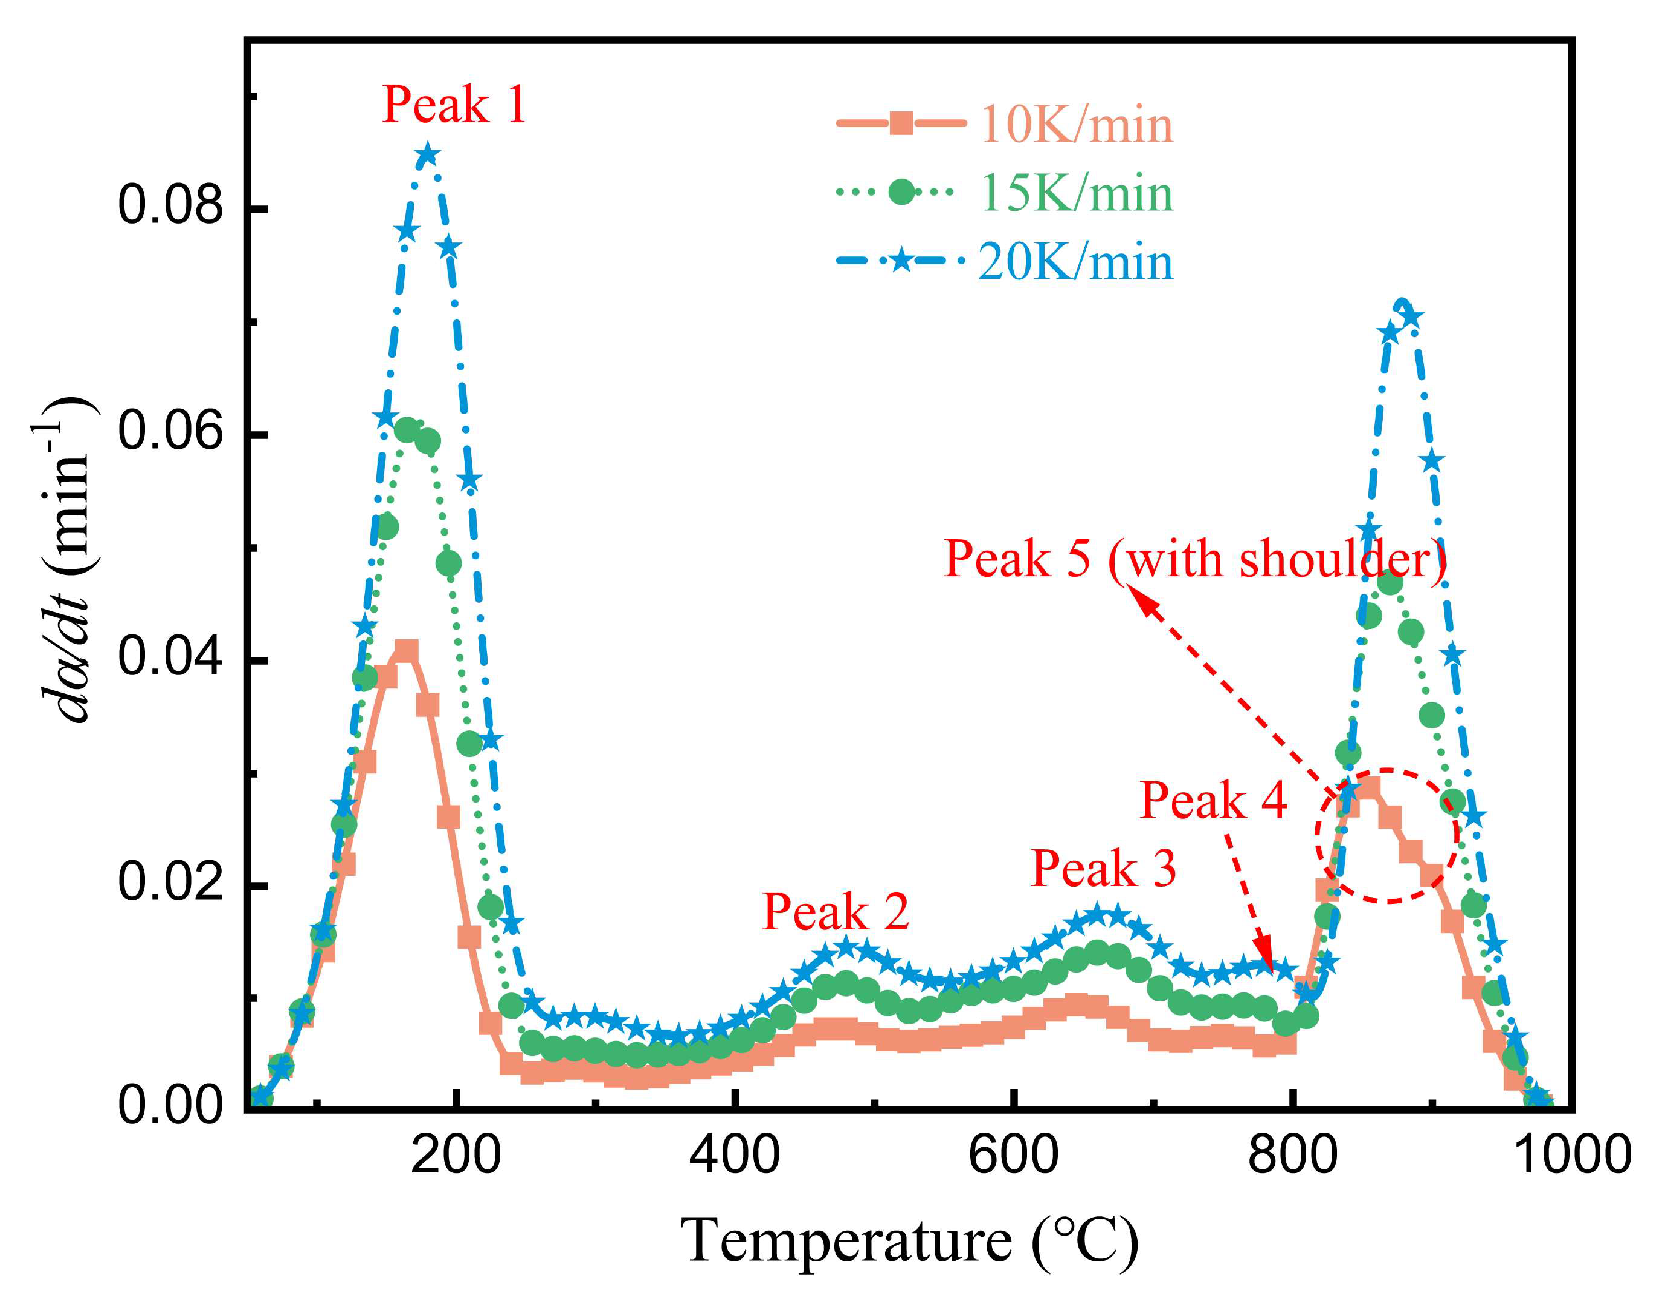
To confirm the suitability of using a single-step reaction kinetic model to elucidate the thermal decomposition process of OBDCs, this study utilized an isoconversional methods to determine the kinetic parameters. The conversion rate curves in Figure 6 correspond to three heating rates and display multiple parallel peaks and shoulders. This indicates that, rather than single reactions, the reaction steps involved multiple parallel and competing reactions over a broad temperature range [25,36,47].
Figure 6.
The conversion rate curves of OBDCs at heating rates of 10, 15, and 20 K/min.
To further support our conclusion, isoconversional methods (FWO method, KAS method, and Starink method) were applied to determine the for the OBDC pyrolysis process. The insignificant variation in with (with the difference between the maximum and minimum values of being less than 20% of the mean value) indicated a single-step reaction [25]. Table 4 presents the values calculated and their correlation coefficients for the three model-free methods.
Table 4.
values for the thermal decomposition process of OBDCs obtained through FWO, KAS, and Starink methods.
The results indicate a close correlation between the values obtained using the three methods to calculate , with consistent trends. The values significantly varied with conversion depth within the range of . During the initial conversion stages , the average values of calculated using the FWO, KAS, and Starink methods were 80.99, 77.49, and 77.43 kJ/mol, respectively. This conversion stage exhibited insignificant variations in values (20–30%), indicating weak single-step characteristics. This observation may be attributed to the presence of a single peak in the conversion rate curve, which occurred within a narrow temperature range at the onset of pyrolysis. This indicates that the overall reaction rate is governed by the cracking rate at which thermal desorption at which the light component. However, in the mid-to-late stages of the reaction , significantly varied, suggesting that relying only on a single-step reaction model for the OBDC pyrolysis process may yield unreliable kinetic results.
3.6. Verification of Multi-Step Reaction Kinetic Model
3.6.1. Deconvolution Analysis
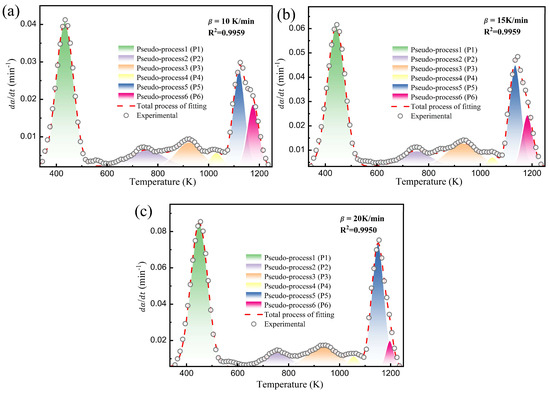
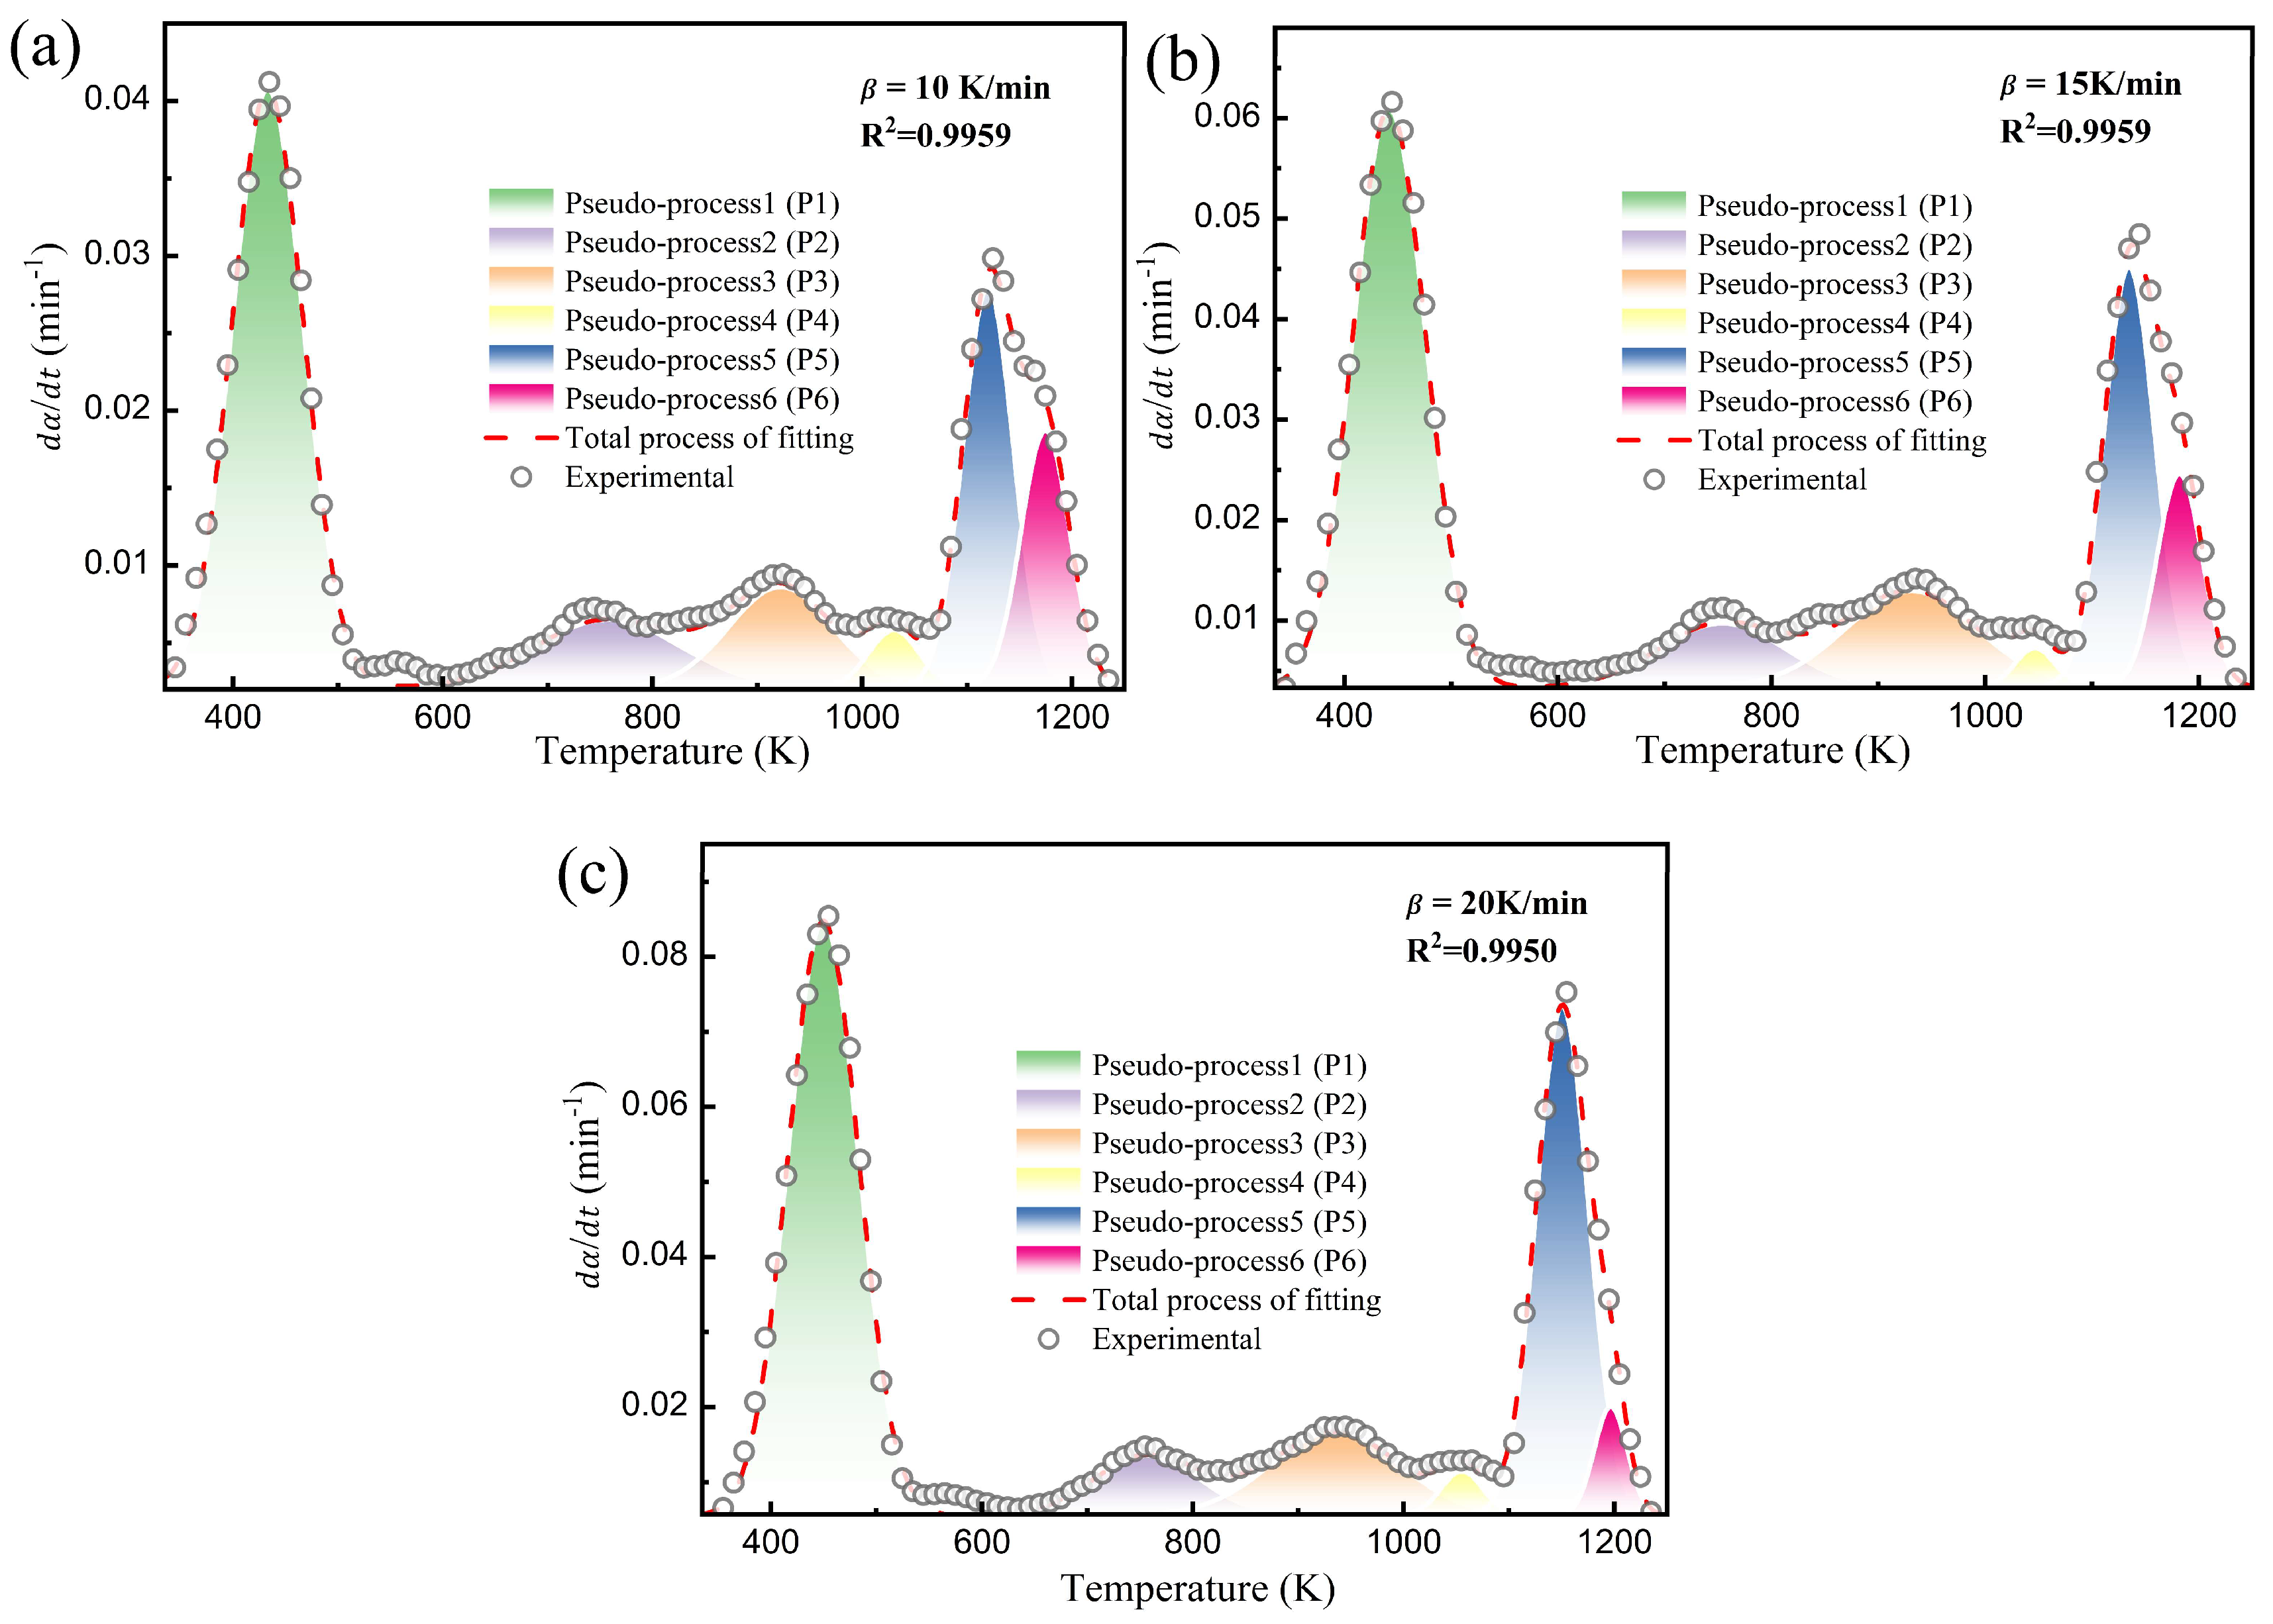
The thermal decomposition of OBDC involved a complex process. To effectively identify the overlapping reactions, the Frazer–Suzuki function was used to deconvolute the overall conversion rate curves at heating rates of 10, 15, and 20 K/min. The deconvolution results revealed six pseudo-processes (Figure 7). Among these processes, pseudo-process1 (P1) was closely associated with the volatilization of light components, and P2–P4 exhibited wide temperature ranges with small peak areas, indicating the complex overlapping reactions of heavy organic compounds. P5–P6 mainly involved the decomposition of inorganic salts and residual high-carbon organic materials at high temperatures. The fitted curves from the deconvolution analysis were consistent with the experimental data, indicating a fitting quality exceeding 99% for all three datasets. Moreover, the fitted curves were used to accurately predict the small peaks at 1030–1055 K and the complex overlapping “shoulder” peaks. Table 4 provides the peak positions () and contribution rates () corresponding to each pseudo process. Notably, P1 and P5 significantly contributed to the overall conversion rates, accounting for 44.42% and 23.95%, respectively. P2, P3, and P6 exhibited average contribution rates of ~10%, while P4 had an average contribution rate of only 2.22%. This indicates that secondary cracking was mostly complete, carbonate decomposition had not yet commenced, and only a small amount of asphalt was undergoing thermal decomposition at this point. Additionally, the trend observed where the reaction shifted toward higher temperatures with increasing heating rates is consistent with previous conclusions.
Figure 7.
Comparison of different conversion rate curves obtained from deconvolution analysis with experimental values at various heating rates: (a) 10 K/min; (b) 15 K/min; (c) 20 K/min.
The validation of the Frazer–Suzuki deconvolution should not be based solely on the >99% R2 fit. Our results demonstrate that deconvolution consistently involves six pseudo-processes across heating rates of 10, 15, and 20 K/min. The peak sequence structure remained stable, with a consistent rightward shift in peak temperatures as the heating rate increased. Additionally, the deconvolution captured minor and shoulder peaks (1030–1055 K), indicating that it predicts both major and minor features with more than just a numerical fit.
3.6.2. Activation Energy Estimation
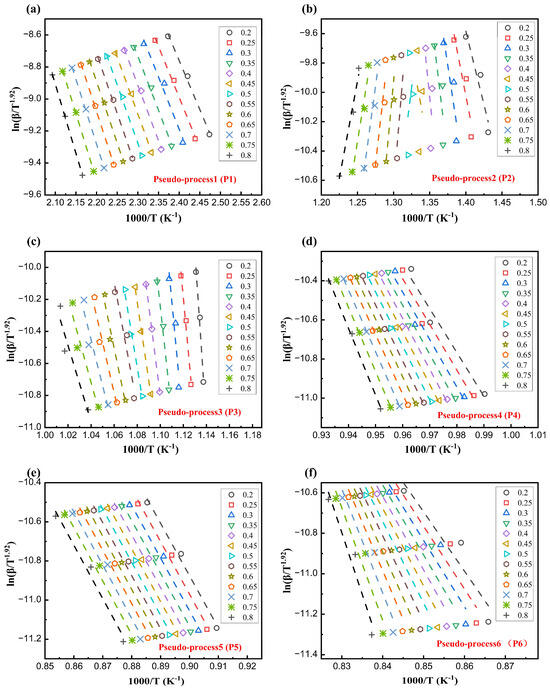
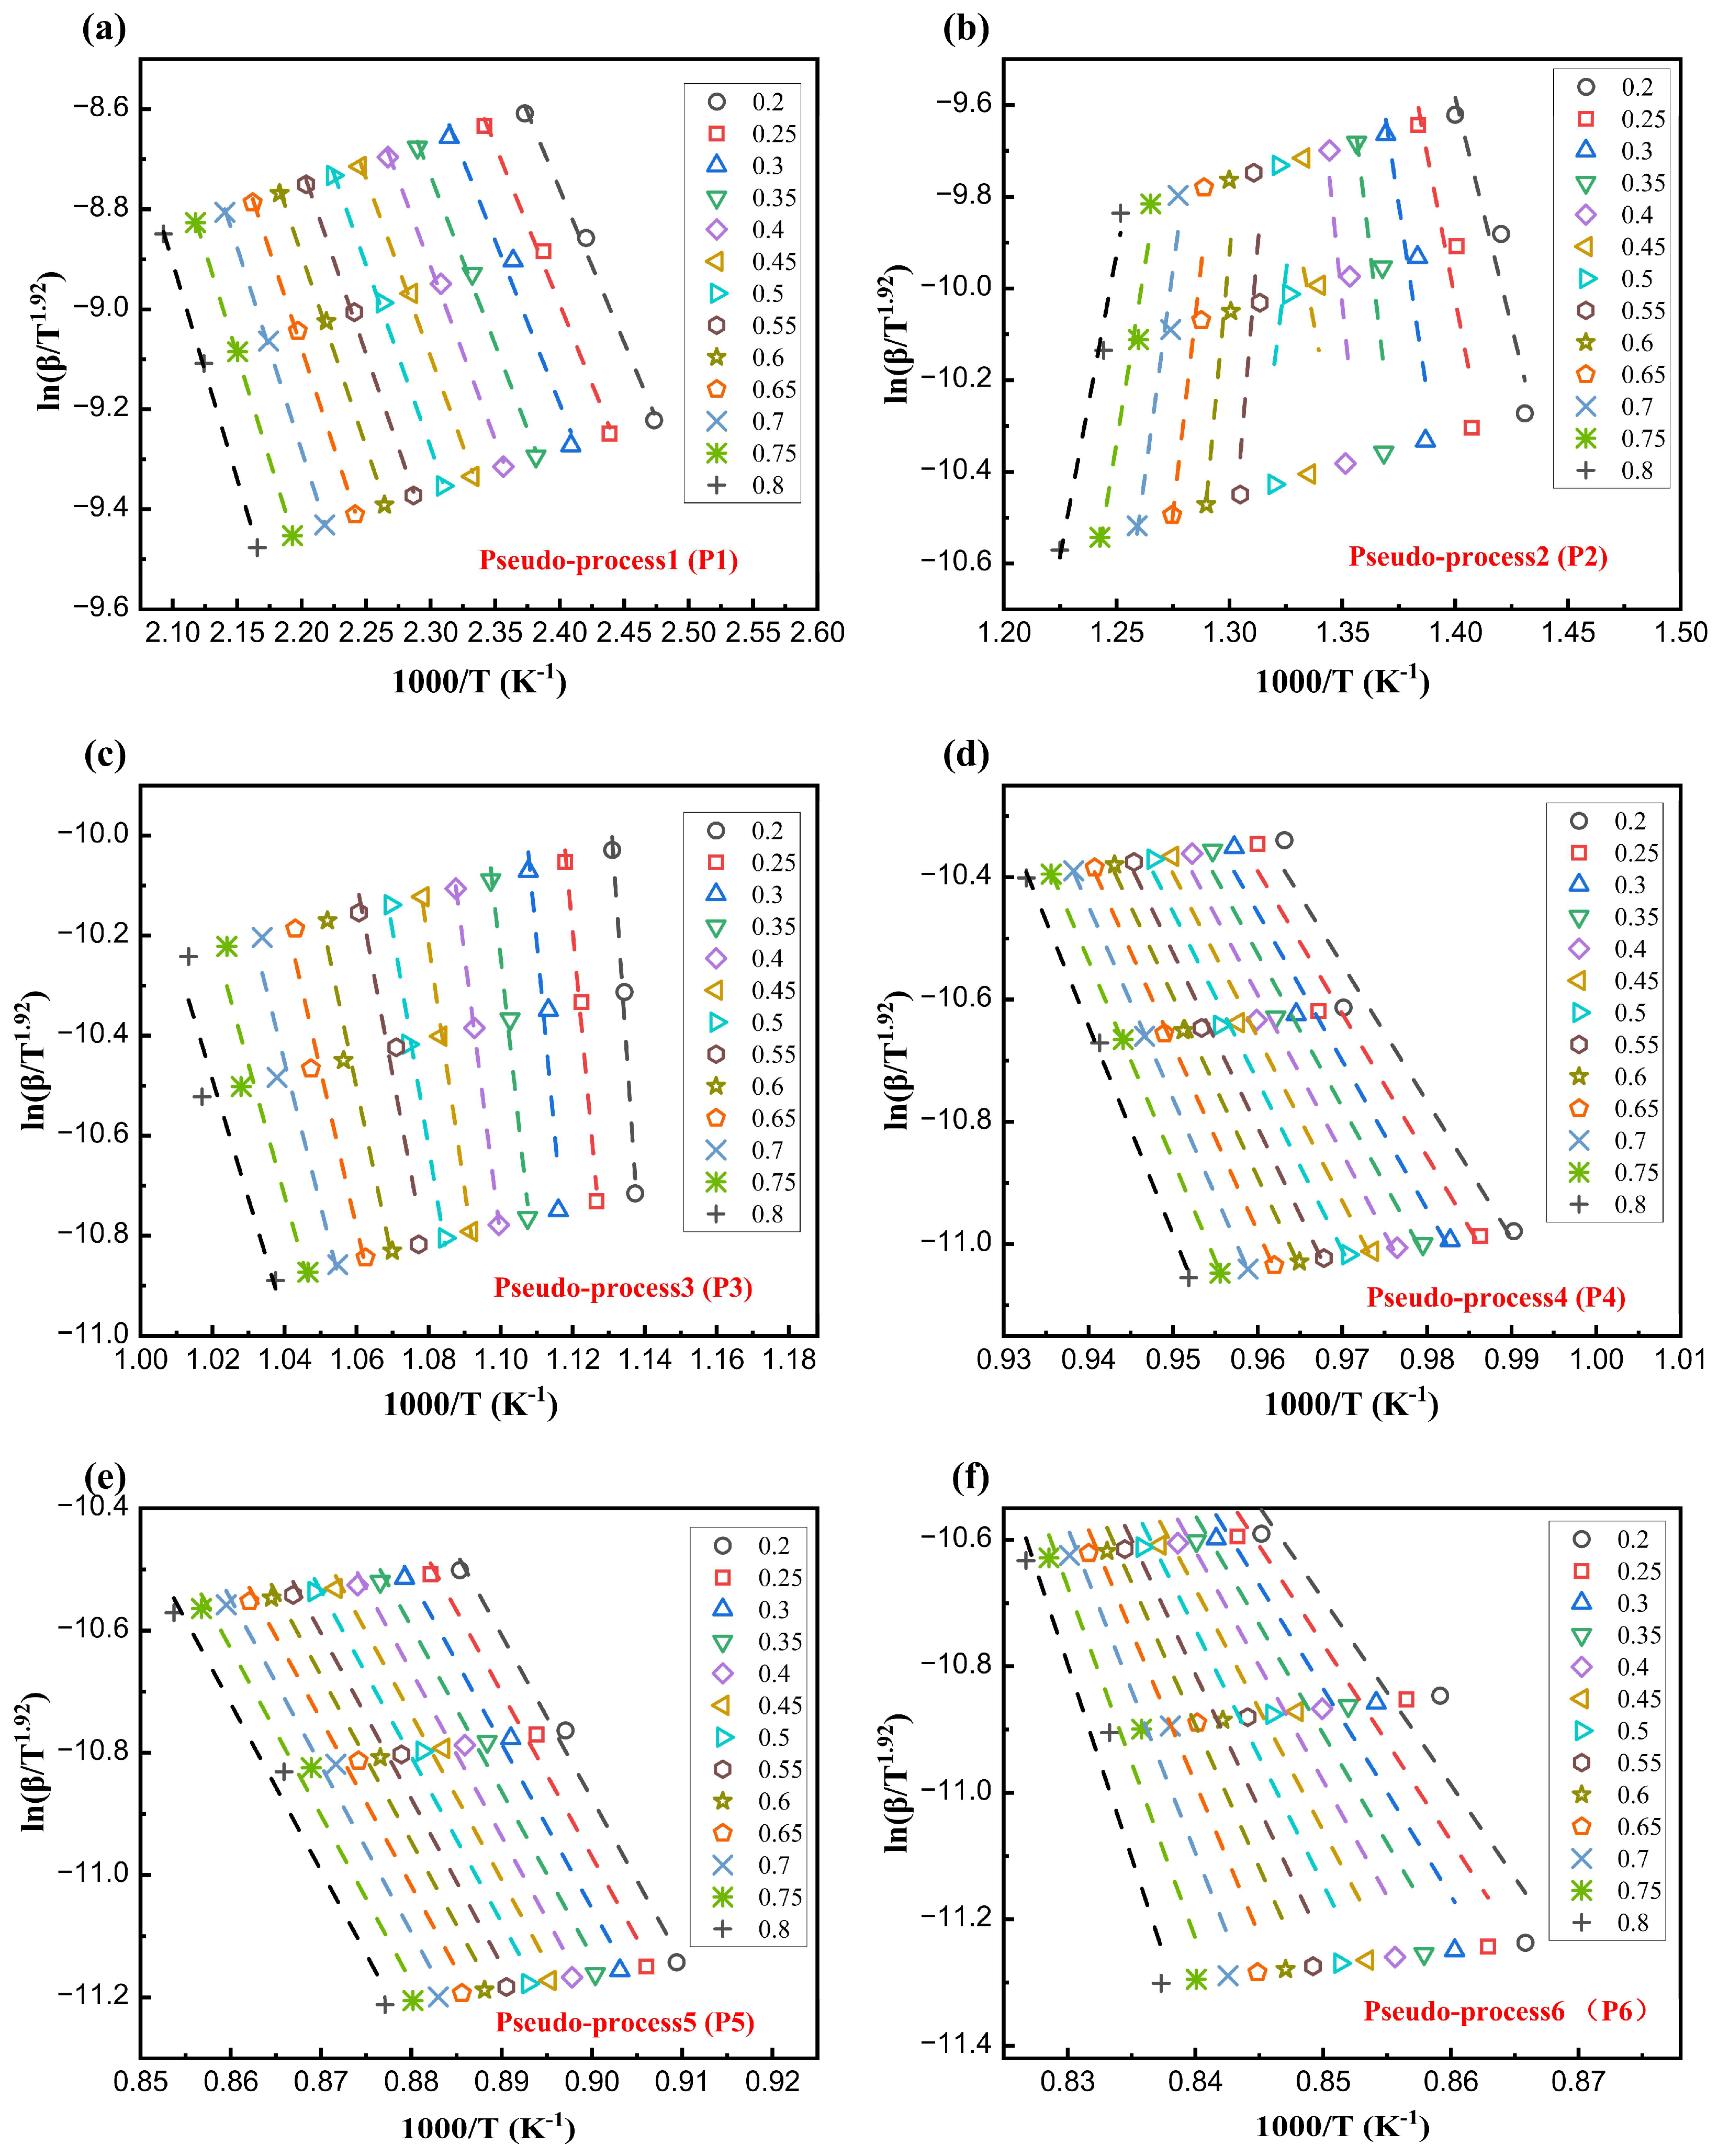
After deconvolution, the Starink method was applied to each pseudo-process separately (Figure 8). The calculations were performed within the range of and a step size of 0.05. The change in was estimated using the conversion rate based on the slope of the line. Strong linear relationships existed between stages; most correlation coefficients were above 0.9, indicating that the results obtained through the Starink method were relatively accurate.
Figure 8.
Pseudo-processes at different conversion rates: (a) P1; (b) P2; (c) P3; (d) P4; (e) P5; (f) P6.
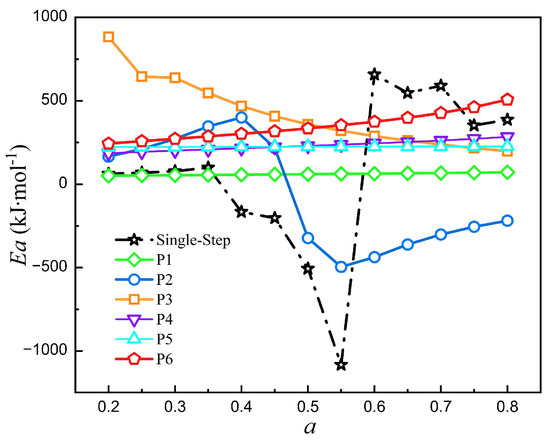
The six pseudo-processes exhibited an average of 60.81, −59.77, 421.10, 231.64, 225.96, and 349.04 kJ/mol. The lowest activation energy and reaction temperature observed for P1 indicated the poor thermal stability of light petroleum hydrocarbons, suggesting their easy decomposition and volatilization at 100–300 °C, which is consistent with previous research findings [48]. Notably, P2 exhibited a transition in from negative to positive, as highlighted by Vyazovkin. The negative required further investigation during kinetic analysis [25]. For instance, negative could be associated with exothermic reactions, where an increase in temperature reduces collisions between reactant molecules, which is required to produce the final product, thereby reducing the reaction rate. In these reaction environments, the activated complex may exhibit higher stability than the reactants [49]. Additionally, negative apparent could be attributed to non-chemical processes such as melting and crystallization [50].
The negative activation energy observed in this study should be interpreted as an apparent manifestation of the temperature dependence of the effective activation energy, rather than evidence of an inherently negative fundamental chemical potential barrier. Microscopic kinetic analysis indicates that when the reaction system approaches equilibrium, the macroscopic rate is jointly governed by kinetic factors and thermodynamic driving forces. At this stage, elevated temperatures weaken the driving force, thereby reducing the overall rate. When described using a simplified Arrhenius-type relationship, this results in a negative apparent activation energy.
Negative apparent activation energy may also originate from a decreasing pre-exponential factor with temperature. This phenomenon correlates with the temperature dependence of the ratio of partition functions between reactants and transition states, leading to anomalous temperature responses in apparent rate constants. For reaction pathways involving chemically bound complexes, prior kinetic studies indicate that within specific temperature ranges [49,51,52], the overall constant rate may decrease with increasing temperature. This occurs because the Gibbs free energy difference between the complex and reactants increases with temperature, altering the relative contribution of complex-related steps to the overall rate. Concurrently, non-chemical phenomena such as phase transitions and transport limitations may also modify apparent rate behavior and the resulting apparent activation energy.
During the phase where shifted from negative to positive, the significant dependence of the conversion rate on the heating rate led to poor fitting performance within the conversion range of . P3 exhibited the highest , indicating that the secondary cracking process required more energy to break C-C and C-H bonds and perform the subsequent polymerization reactions.
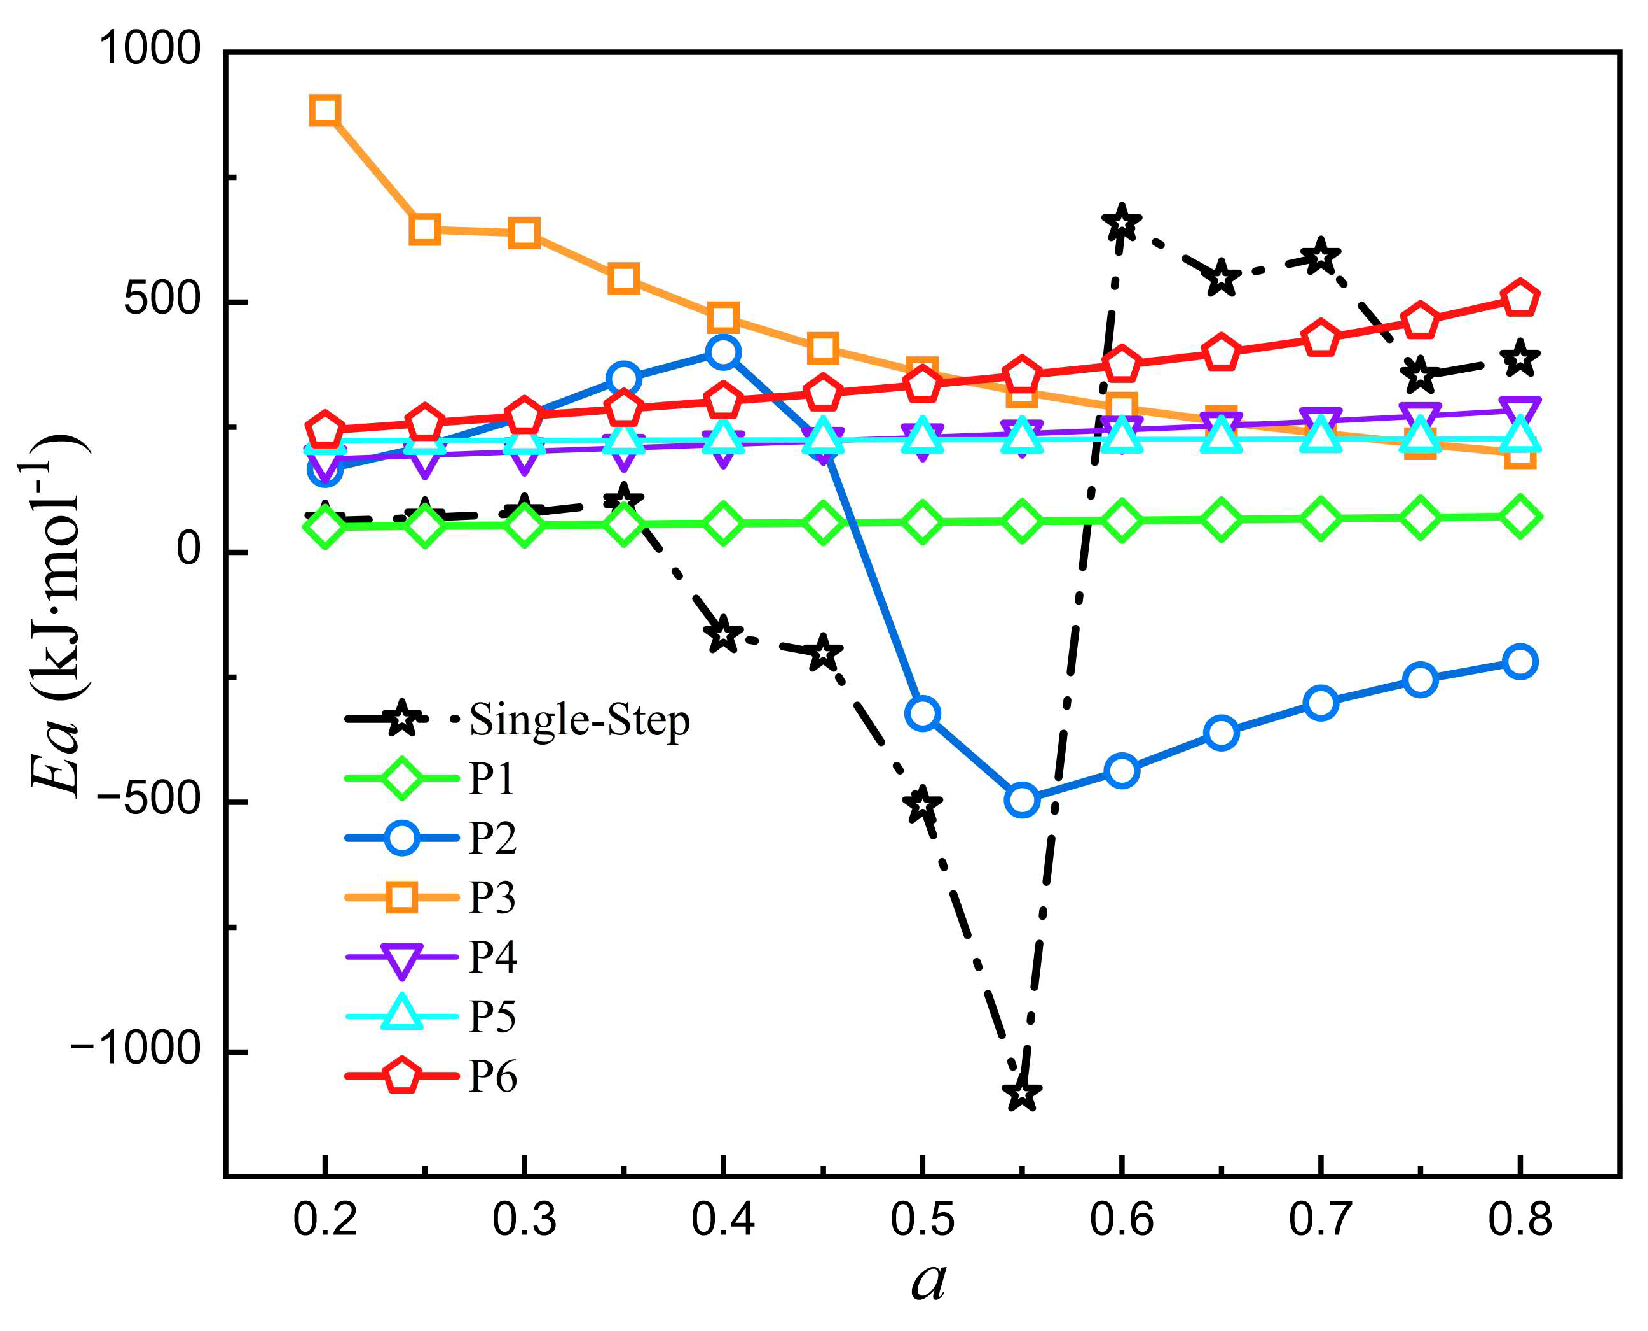
Compared to the single-step model, the multi-step model based on pseudo-phases exhibited beneficial effects, revealing significant differences in values between different reaction stages (Figure 9). However, individually obtained did not significantly vary with the conversion rate (except for the negative of P2). This indicates that applying a six-pseudo-process model to analyze the thermal decomposition behavior of OBDCs is highly suitable.
Figure 9.
Comparison of activation energy values between single-step global model and pseudo-processes model.
3.6.3. Prediction and Reconstruction of Pseudo-Process Reaction Models
Given the strong coupling of pyrolytic overlapping reactions, this study employed the Frazer–Suzuki asymmetric peak function combined with peak area conservation constraints for deconvolution, yielding six stable pseudo-processes at heating rates of 10, 15, and 20 K/min. Subsequently, the conversion rate method derived from Starink et al. demonstrated that the activation energy remains fundamentally stable despite variations in conversion rate. Combining principal curve analysis with Sestak–Berggren reconstruction and applying ICTAC parameter range constraints to suppress multiple solutions ensured that the pseudo-processes possessed reproducible physical uniqueness.
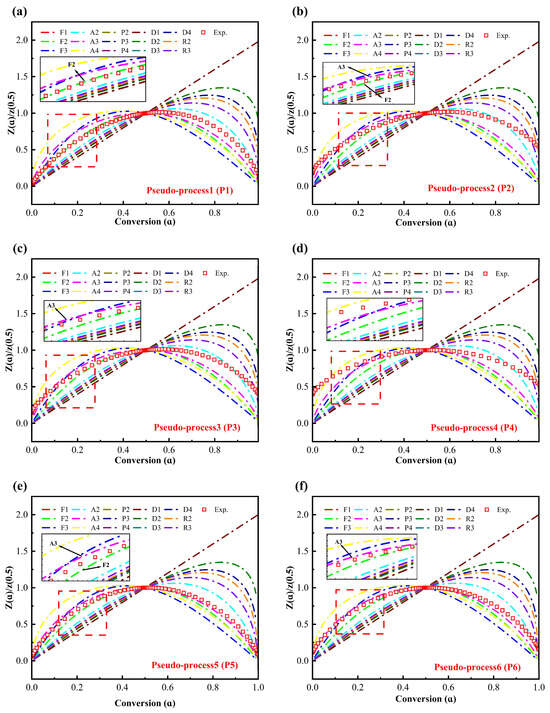
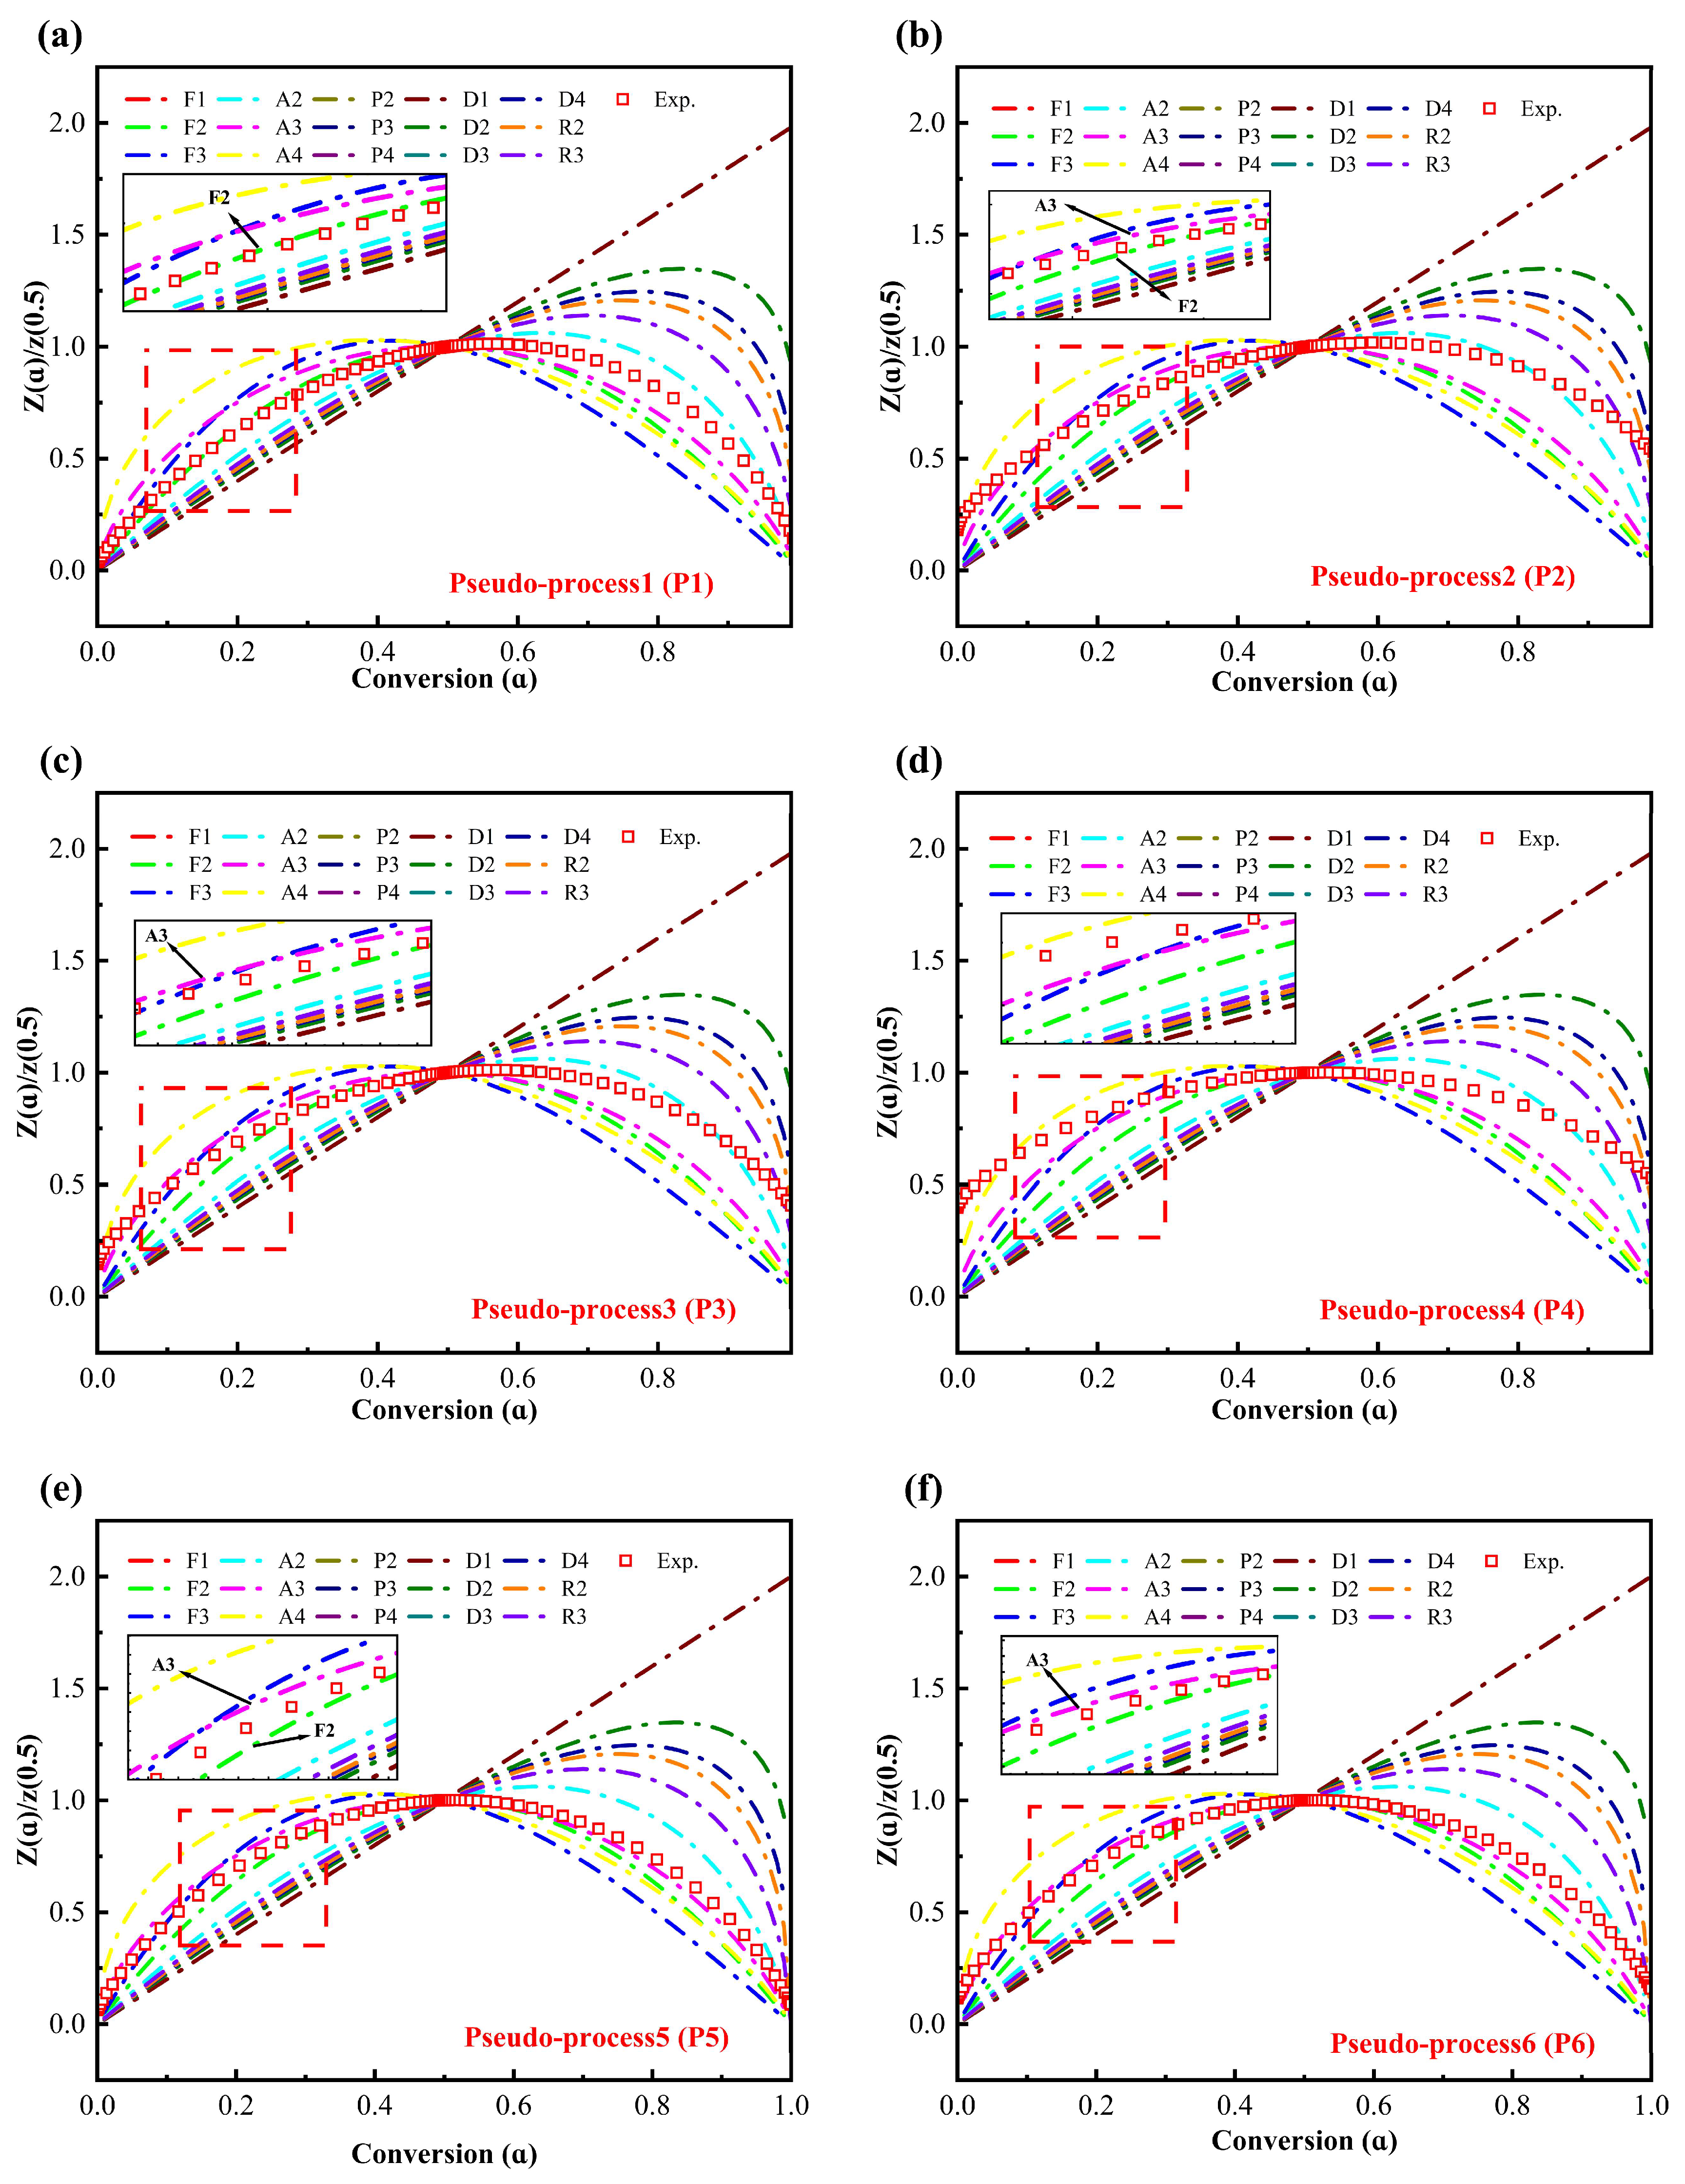
Figure 10 illustrates the experimental and theoretical master plots for the six pseudo-processes across the entire conversion range with a heating rate of 15 K/min. Through the comparison of the shape and position of the curves, preliminary predictions for the thermal decomposition mechanism of OBDCs could be deduced. P1 fitted well with the second-order model (F2) within the low conversion range . P2 and P3 adhered to the random nucleation mechanism (A3) within the low conversion range . However, P4 does not exhibit a precisely matched reaction mechanism, representing a transient weak peak occurring between the near-complete secondary cracking and the decomposition of carbonates. Both P5 and P6 conformed to the random nucleation mechanism (A3) across the entire conversion range, indicating that the decomposition model for calcite in OBDCs follows a nucleation and growth mechanism. Therefore, P5–P6 in this study can be reliably assigned to A3, whereas P1–P4 in the range can only indicate a dominant trend without establishing a uniquely definitive mechanism.
Figure 10.
(a–f) Experimental and theoretical master plots for pseudo-processes P1–P6.
The results from the master plots suggest that the thermal decomposition behavior of OBDCs is mainly governed by nucleation control, geometrical contraction, diffusion, and power-law kinetics. Although the deconvolution process significantly simplified the reaction model, some discrepancies from the ideal kinetic mechanisms remained, highlighting the need to optimize the parameters of the mechanism function.
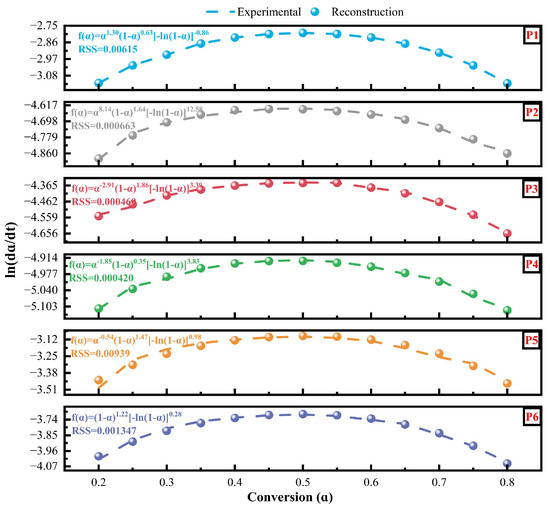
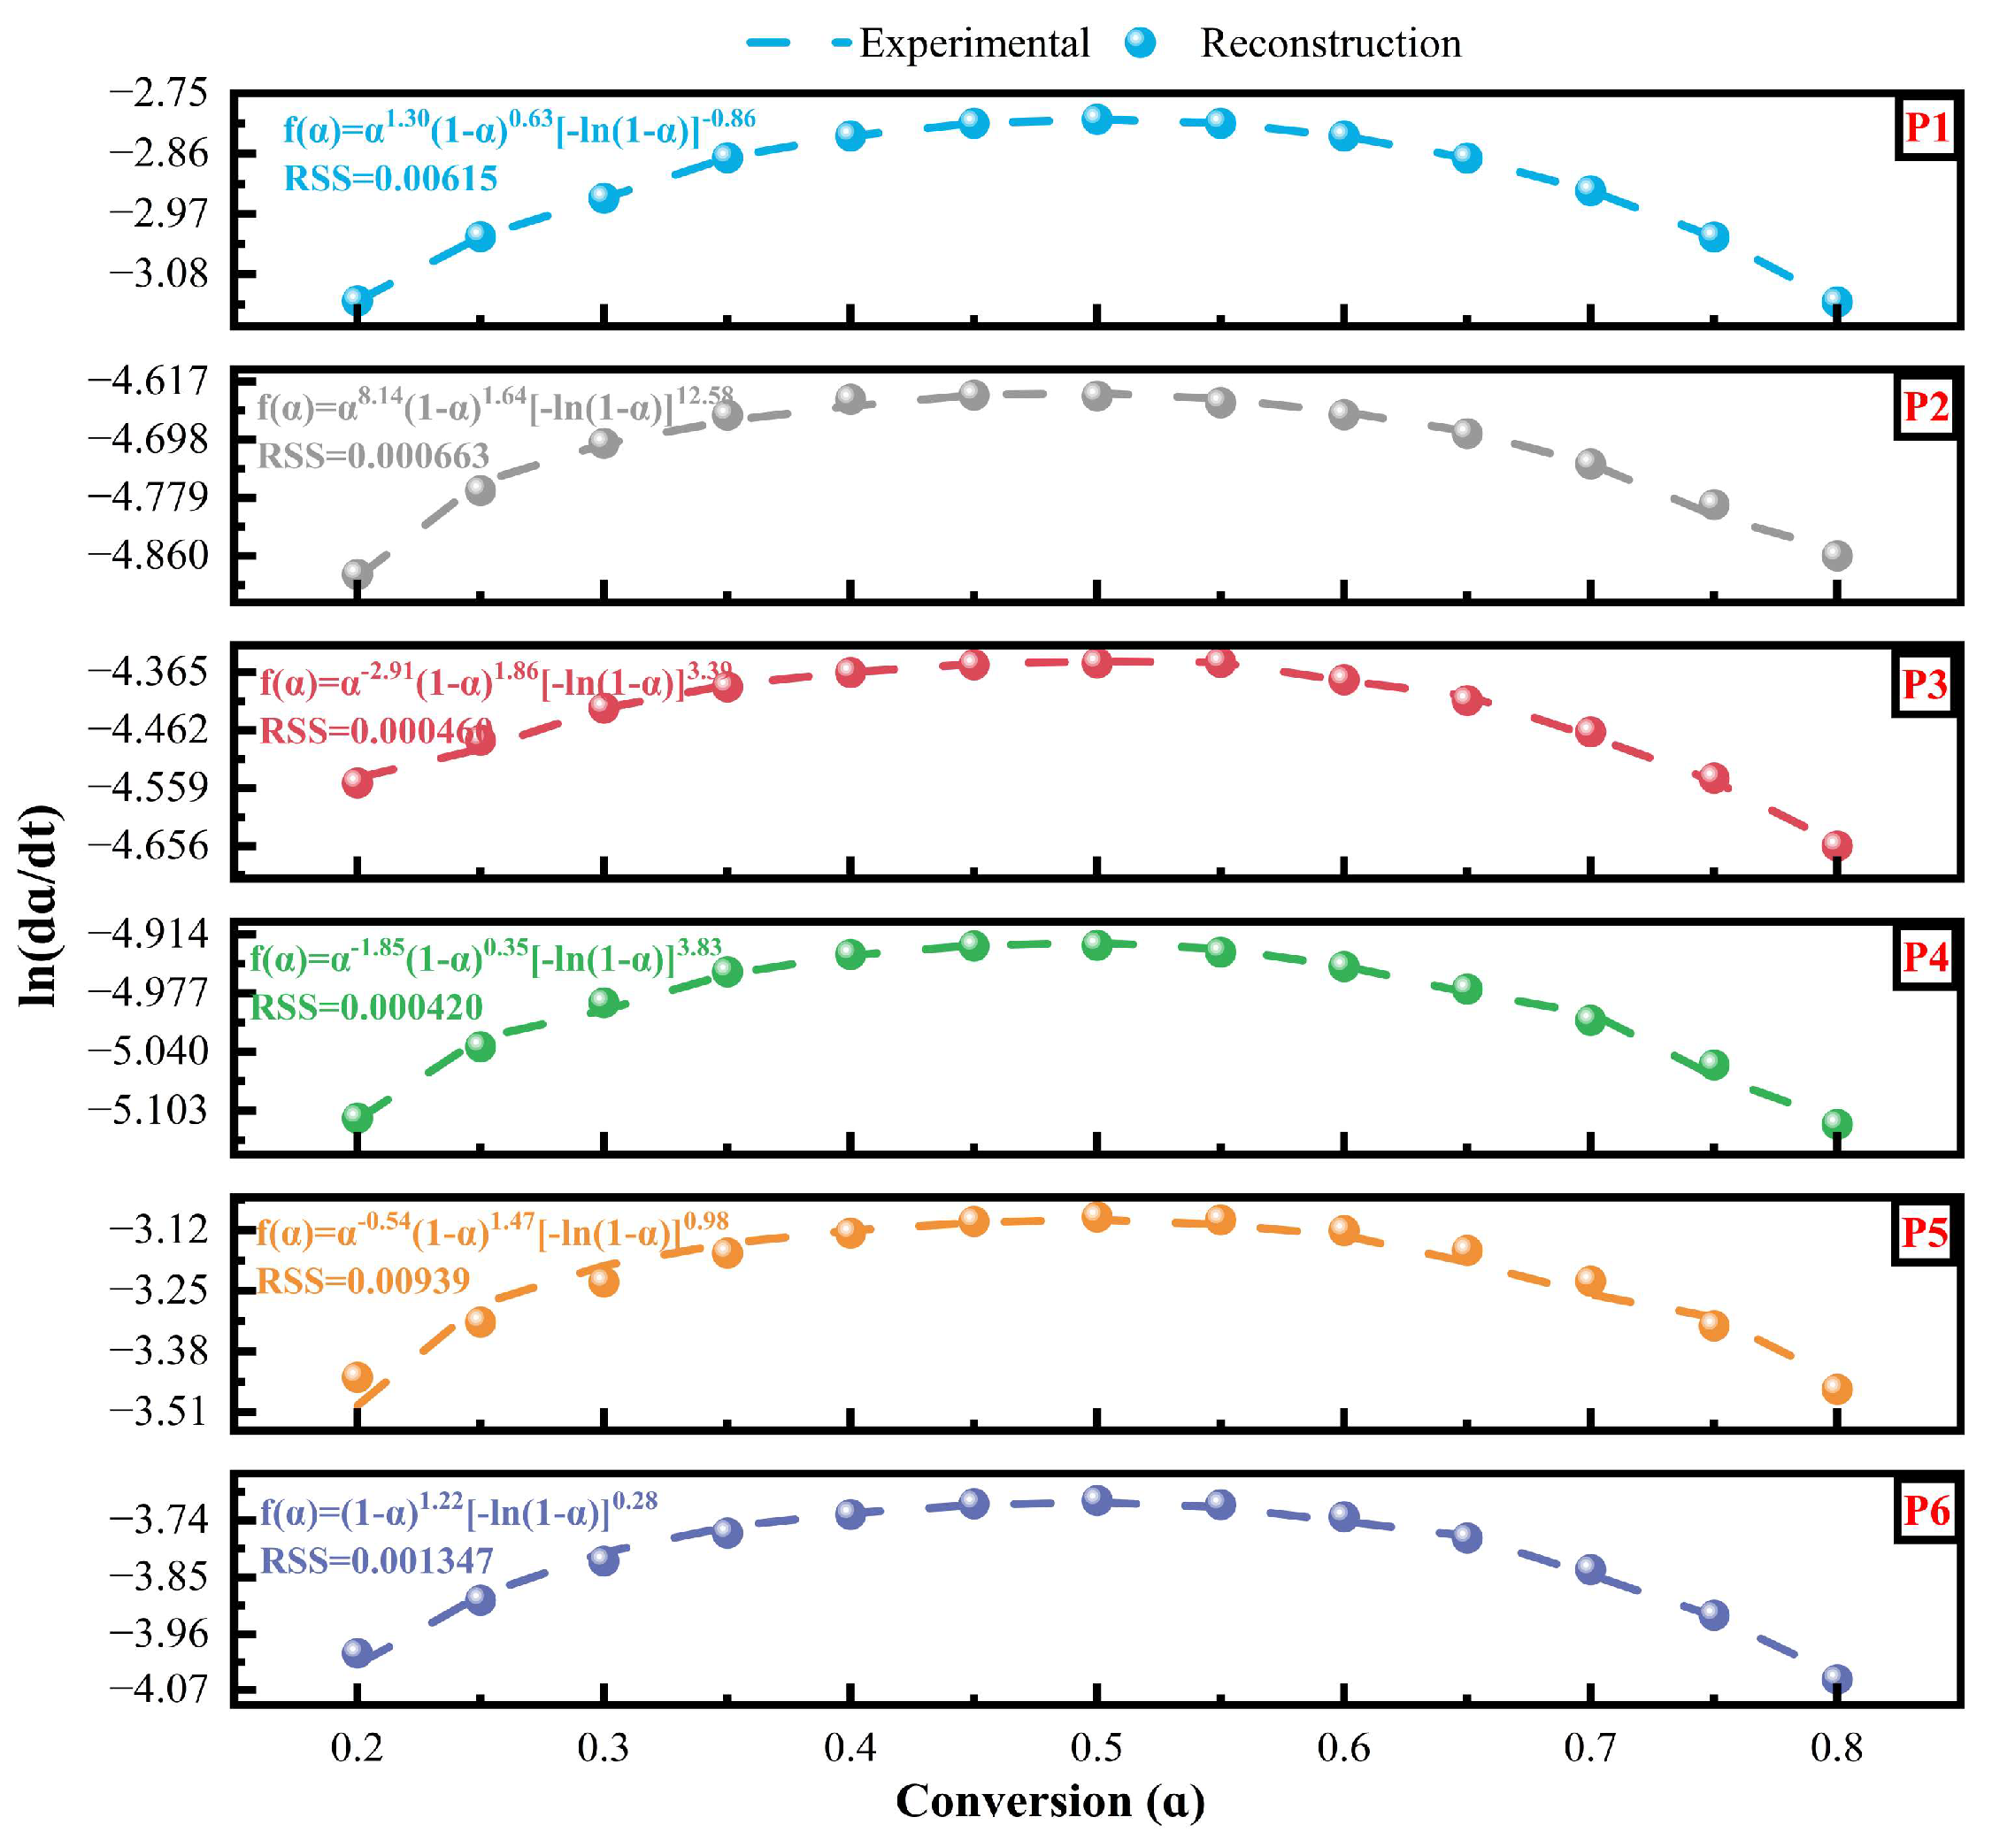
All pseudo-processes were reconstructed using the Sestak and Berggren model. Parameters were estimated using a nonlinear programming solver within the Excel software. This calculation range was set to , with a step size of 0.05, to obtain the minimum value of RSS. To prevent the occurrence of local minima and potential erroneous results during the reconstruction process, initial parameter estimation was conducted. According to ICTAC recommendations, the reaction order n is typically limited to three, while the Avrami exponent p generally does not exceed four [25]. Initial values were determined based on the results from the main plots. The results of the optimized parameters are presented in Figure 11, indicating an excellent fit for all pseudo-processes, with RSS values below 0.01. Notably, the P2 optimal model exhibited an Avrami coefficient of 12.58, which exceeded the estimated value, further indicating a potential non-chemical stage. The fitted parameters of other models remained within reasonable ranges.
Figure 11.
Results of reconstructing the pseudo-process P1–P6 mechanism model using the Sestak and Berggren model.
4. Conclusions
This study conducts TG and Py-GC/MS analysis to investigate the pyrolysis behavior and kinetics of OBDCs at various heating rates. The following conclusions were obtained:
- (1)
- The pyrolysis of OBDCs involves the release of light components, heavy oil cracking, secondary cracking, and inorganic mineral decomposition. Notably, the heavy oil cracking phase includes a wide temperature range, resulting in complex reactions.
- (2)
- At 300 °C, 500 °C, and 700 °C, rapid pyrolysis of OBDC mainly produces saturated alkanes. As the temperature increased, long-chain aliphatic hydrocarbons were converted into short-chain hydrocarbons. Moreover, at high temperatures, secondary cracking reactions intensify, resulting in a significant increase in the proportion of olefin () and cycloalkanes among the volatile products.
- (3)
- The activation energy for single-step and multi-step reactions in OBDC pyrolysis was calculated using a model-free approach. The single-step method exhibited a significant variation in , indicating an inadequate representation of the kinetic properties. Conversely, the for various pseudo-processes in the multi-step reaction model based on deconvolution, did not exhibit dependence on .
- (4)
- The master plot results of pseudo-processes indicate that the thermal decomposition of OBDC does not follow a singular mechanism. Instead, the thermal decomposition of OBDC was mainly influenced by nucleation control, but also geometric contraction, diffusion, power-law kinetics, and other synergistic effects.
Author Contributions
Conceptualization, N.S. and Q.C.; methodology, N.S.; validation, Z.H.; formal analysis, N.S.; investigation, N.S., Z.H. and Q.C.; data curation, N.S.; writing—original draft preparation, N.S.; writing—review and editing, N.S., Z.H., Q.C. and Z.L.; supervision, Q.C.; funding acquisition, Z.L. All authors have read and agreed to the published version of the manuscript.
Funding
This work is financially supported by the Key Programs of the National Natural Foundation of China (No. 42030807).
Data Availability Statement
The original contributions presented in this study are included in the article. Further inquiries can be directed to the corresponding author.
Conflicts of Interest
The authors declare no conflicts of interest.
Glossary
The following abbreviations are used in this manuscript:
| Abbreviations | ||
| OBDCs | Oil-based drill cuttings | |
| FWO | Flynn-Wall-Ozawa method | |
| KAS | Kissinger—Akahira-Sunose method | |
| P | Pseudo-process | |
| ICTAC | International Confederation for Thermal Analysis Calorimetry | |
| wt% | Weight percentage | |
| Activation energy (kJ/mol) | ||
| A | Pre-exponential factor (s-1) | |
| Reaction model | ||
| Universal gas constant | ||
| Absolute temperature (K) | ||
| Peak temperature (°C) | ||
| Reaction order | ||
| Growth parameter | ||
| Avrami exponent | ||
| Greek Symbols | ||
| Conversion ratio | ||
| Heating rate (K/min) | ||
| Contribution facto | ||
References
- Bilgen, S.; Sarıkaya, İ. New horizon in energy: Shale gas. J. Nat. Gas Sci. Eng. 2016, 35, 637–645. [Google Scholar] [CrossRef] [Scilit]
- Yang, Y.; Wang, L.; Fang, Y.; Mou, C. Integrated value of shale gas development: A comparative analysis in the United States and China. Renew. Sustain. Energy Rev. 2017, 76, 1465–1478. [Google Scholar] [CrossRef] [Scilit]
- Jiang, Y.; Tao, M. Analysis of environmental legal system of shale gas fracturing in China. Energy Rep. 2023, 10, 2166–2173. [Google Scholar] [CrossRef] [Scilit]
- Jiang, G.; Yu, J.; Jiang, H.; Xu, B.; Tang, P.; Zhao, L.; Li, H.; Xiang, Q.; Hu, J. Physicochemical characteristics of oil-based cuttings from pretreatment in shale gas well sites. J. Environ. Sci. Health A Tox Hazard Subst. Environ. Eng. 2020, 55, 1041–1049. [Google Scholar] [CrossRef] [Scilit]
- Huang, Z.; Xu, Z.; Quan, Y.; Jia, H.; Li, J.; Li, Q.; Chen, Z.; Pu, K. A review of treatment methods for oil-based drill cuttings. IOP Conf. Ser. Earth Environ. Sci. 2018, 170, 022074. [Google Scholar] [CrossRef] [Scilit]
- Yang, H.; Diao, H.; Zhang, Y.; Xia, S. Treatment and novel resource-utilization methods for shale gas oil based drill cuttings—A review. J. Environ. Manag. 2022, 317, 115462. [Google Scholar] [CrossRef] [Scilit]
- Chen, X.; Yang, Y.; Lu, Z.; Chen, K.; Li, Y.; Huang, X.; Wang, X. Oil-based drilling cuttings pyrolysis residues at a typical shale gas drilling field in Chongqing: Pollution characteristics and environmental risk assessment. Environ. Geochem. Health 2023, 45, 2949–2962. [Google Scholar] [CrossRef] [Scilit]
- Boutammine, H.; Salem, Z.; Khodja, M. Petroleum drill cuttings treatment using stabilization/solidification and biological process combination. Soil Sedim. Contam. Int. J. 2020, 29, 369–383. [Google Scholar] [CrossRef] [Scilit]
- Lai, H.; Lv, S.; Lai, Z.; Liu, L.; Lu, Z. Utilization of oil-based mud drilling cuttings wastes from shale gas extraction for cement clinker production. Environ. Sci. Pollut. Res. Int. 2020, 27, 33075–33084. [Google Scholar] [CrossRef] [Scilit]
- Wang, S.; Liu, D.; Zhao, J.; Li, X.; Xu, D.; Gu, Y.; Lu, H. Use CO2-Triggered switchable water additive to reversibly emulsify and demulsify diesel. J. CO2 Util. 2018, 26, 239–245. [Google Scholar] [CrossRef] [Scilit]
- Yang, H.; Cai, J.; Sun, J.; Zhou, Z.; Zhang, Y.; Xia, S. Treatment of oil-based drilling cuttings using the demulsification separation-Fenton oxidation method. Environ. Sci. Pollut. Res. Int. 2021, 28, 64307–64321. [Google Scholar] [CrossRef] [Scilit]
- Yang, H.; Huang, S.; Zhang, Y.; Zhou, B.; Ahmed, S.M.; Liu, H.; Liu, Y.; He, Y.; Xia, S. Remediation effect of Cr (VI)-contaminated soil by secondary pyrolysis oil-based drilling cuttings ash. Chem. Eng. J. 2020, 398, 125473. [Google Scholar] [CrossRef] [Scilit]
- Liu, H.; Li, J.; Zhao, M.; Li, Y.; Chen, Y. Remediation of oil-based drill cuttings using low-temperature thermal desorption: Performance and kinetics modeling. Chemosphere 2019, 235, 1081–1088. [Google Scholar] [CrossRef] [Scilit] [PubMed]
- Xia, Z.; Yang, H.; Sun, J.; Zhou, Z.; Wang, J.; Zhang, Y. Co-pyrolysis of waste polyvinyl chloride and oil-based drilling cuttings: Pyrolysis process and product characteristics analysis. J. Clean. Prod. 2021, 318, 128521. [Google Scholar] [CrossRef] [Scilit]
- Hou, Y.; Qi, S.; You, H.; Huang, Z.; Niu, Q. The study on pyrolysis of oil-based drilling cuttings by microwave and electric heating. J. Environ. Manag. 2018, 228, 312–318. [Google Scholar] [CrossRef] [Scilit] [PubMed]
- Wang, H.; Li, J.; Lin, D.; Jiang, G.; Zhao, L.; Yu, J.; Meng, T.; Huang, X.; Liu, H.; Yang, Y. Preparation and properties of lightweight and high-strength building ceramsites with oil-based drilling cuttings pyrolysis residues. Front. Mater. 2023, 10, 1245121. [Google Scholar] [CrossRef] [Scilit]
- Wang, C.Q.; Jin, J.Z.; Lin, X.Y.; Xiong, D.M.; Mei, X.D. A study on the oil-based drilling cutting pyrolysis residue resource utilization by the exploration and development of shale gas. Environ. Sci. Pollut. Res. Int. 2017, 24, 17816–17828. [Google Scholar] [CrossRef] [Scilit]
- Ma, Y.; Shao, F.; Fu, S.; Yue, C.; Xu, D. Study of pyrolysis characteristics and kinetics of oil-based drill cuttings. J. Therm. Anal. Calorim. 2023, 148, 9561–9570. [Google Scholar] [CrossRef] [Scilit]
- Liu, P.; Xiao, Q.; Dai, N.; Liu, Z.; Wang, C. Study on Pyrolysis of Shale Gas Oil-Based Drilling Cuttings: Kinetics, Process Parameters, and Product Yield. ACS Omega 2023, 8, 13593–13604. [Google Scholar] [CrossRef] [Scilit]
- GB/T 212-2008; Proximate Analysis of Coal. China Standards Press: Beijing, China, 2008.
- Koga, N.; Vyazovkin, S.; Burnham, A.K.; Favergeon, L.; Muravyev, N.V.; Pérez-Maqueda, L.A.; Saggese, C.; Sánchez-Jiménez, P.E. ICTAC Kinetics Committee recommendations for analysis of thermal decomposition kinetics. Thermochim. Acta 2023, 719, 179384. [Google Scholar] [CrossRef] [Scilit]
- Zhai, Z.; Zhou, J.; Wu, J.; Liu, J.; Yang, W. Pyrolytic gas analysis and evaluation from thermal plasma pyrolysis of simulated oil-based drill cuttings. Waste Dispos. Sustain. Energy 2023, 5, 367–382. [Google Scholar] [CrossRef] [Scilit]
- Xu, T.; Wang La Wu, H.; Jiang, D.; Qi, N.; Gou, Z. Municipal solid waste incineration (MSWI) fly ash could be used as a catalyst for pyrolysis of oil-based drill cuttings from shale gas exploitation industry. J. Clean. Prod. 2023, 387, 135754. [Google Scholar] [CrossRef] [Scilit]
- Bach, Q.-V.; Chen, W.-H. A comprehensive study on pyrolysis kinetics of microalgal biomass. Energy Convers. Manag. 2017, 131, 109–116. [Google Scholar] [CrossRef] [Scilit]
- Vyazovkin, S.; Burnham, A.K.; Favergeon, L.; Koga, N.; Moukhina, E.; Pérez-Maqueda, L.A.; Sbirrazzuoli, N. ICTAC Kinetics Committee recommendations for analysis of multi-step kinetics. Thermochim. Acta 2020, 689, 178597. [Google Scholar] [CrossRef] [Scilit]
- Zhang, J.; Ding, Y.; Chen, W.; Li, C.; Jiao, Y. Pyrolysis kinetics, thermodynamics, and interaction analysis of co-pyrolysis of bituminous coal and electrolytic aluminum solid waste. Fuel 2023, 333, 126375. [Google Scholar] [CrossRef] [Scilit]
- Wang, Y.; Yang, S.; Bao, G.; Wang, H. Investigation on prospective bioenergy from pyrolysis of macadamia nut shell waste using multicomponent Fraser-Suzuki kinetic model, kinetic triplet and thermodynamic parameters. J. Energy Inst. 2024, 114, 101611. [Google Scholar] [CrossRef] [Scilit]
- Perejon, A.; Sanchez-Jimenez, P.E.; Criado, J.M.; Perez-Maqueda, L.A. Kinetic analysis of complex solid-state reactions. A new deconvolution procedure. J. Phys. Chem. B 2011, 115, 1780–1791. [Google Scholar] [CrossRef] [Scilit]
- Roman, S. Fraser-Suzuki function as an essential tool for mathematical modeling of crystallization in glasses. J. Eur. Ceram. Soc. 2024, 44, 401–407. [Google Scholar]
- Cao, Y.; Chen, Z.; Boukhir, M.; Dong, B.; Zhang, J.; Gu, S.; Zhang, S. Insight into the pyrolysis of bamboo flour, polylactic acid and their composite: Pyrolysis behavior, kinetic triplets, and thermodynamic parameters based on Fraser-Suzuki deconvolution procedure. Bioresour. Technol. 2023, 391, 129932. [Google Scholar] [CrossRef] [Scilit]
- Pinzi, S.; Buratti, C.; Bartocci, P.; Marseglia, G.; Fantozzi, F.; Barbanera, M. A simplified method for kinetic modeling of coffee silver skin pyrolysis by coupling pseudo-components peaks deconvolution analysis and model free-isoconversional methods. Fuel 2020, 278, 118260. [Google Scholar] [CrossRef] [Scilit]
- Wang, W.; Luo, G.; Zhao, Y.; Tang, Y.; Wang, K.; Li, X.; Xu, Y. Kinetic and thermodynamic analyses of co-pyrolysis of pine wood and polyethylene plastic based on Fraser-Suzuki deconvolution procedure. Fuel 2022, 322, 124200. [Google Scholar] [CrossRef] [Scilit]
- Liu, H.; Xu, G.; Li, G. Pyrolysis characteristic and kinetic analysis of sewage sludge using model-free and master plots methods. Process Saf. Environ. Prot. 2021, 149, 48–55. [Google Scholar] [CrossRef] [Scilit]
- Sharma, A.; Aravind Kumar, A.; Mohanty, B.; Sawarkar, A.N. Critical insights into pyrolysis and co-pyrolysis of poplar and eucalyptus wood sawdust: Physico-chemical characterization, kinetic triplets, reaction mechanism, and thermodynamic analysis. Renew. Energy 2023, 210, 321–334. [Google Scholar] [CrossRef] [Scilit]
- Yan, J.; Jiao, H.; Li, Z.; Lei, Z.; Wang, Z.; Ren, S.; Shui, H.; Kang, S.; Yan, H.; Pan, C. Kinetic analysis and modeling of coal pyrolysis with model-free methods. Fuel 2019, 241, 382–391. [Google Scholar] [CrossRef] [Scilit]
- Moine, E.C.; Tangarfa, M.; Khachani, M.; El Hamidi, A.; Halim, M.; Arsalane, S. Thermal oxidation study of Moroccan oil shale: A new approach to non-isothermal kinetics based on deconvolution procedure. Fuel 2016, 180, 529–537. [Google Scholar] [CrossRef] [Scilit]
- Chen, R.; Li, Q.; Zhang, Y.; Xu, X.; Zhang, D. Pyrolysis kinetics and mechanism of typical industrial non-tyre rubber wastes by peak-differentiating analysis and multi kinetics methods. Fuel 2019, 235, 1224–1237. [Google Scholar] [CrossRef] [Scilit]
- Dong, R.; Chen, F.; Zhang, F.; Yang, S.; Liu, H.; Wang, H.; Hu, J. A comprehensive evaluation on pyrolysis kinetics, thermodynamics, product properties and formation pathways of jatropha oil for high-value utilization. Fuel 2022, 313, 122982. [Google Scholar] [CrossRef] [Scilit]
- Vyazovkin, S.; Burnham, A.K.; Criado, J.M.; Pérez-Maqueda, L.A.; Popescu, C.; Sbirrazzuoli, N. ICTAC Kinetics Committee recommendations for performing kinetic computations on thermal analysis data. Thermochim. Acta 2011, 520, 1–19. [Google Scholar] [CrossRef] [Scilit]
- Wang, X.; Hu, M.; Hu, W.; Chen, Z.; Liu, S.; Hu, Z.; Xiao, B. Thermogravimetric kinetic study of agricultural residue biomass pyrolysis based on combined kinetics. Bioresour. Technol. 2016, 219, 510–520. [Google Scholar] [CrossRef] [Scilit]
- Sestak, J.; Berggren, G. Study of the kinetics of the mechanism of solid-state reactions at increased temperature. Thermochim. Acta 1971, 3, 1–12. [Google Scholar] [CrossRef] [Scilit]
- Shao, Z.; Ma, Y.; Wang, B.; He, L.; Zhang, Z.; Yue, C. Study of pyrolysis and combustion kinetics of oil sludge. Energy Sources Part A Recovery Util. Environ. Eff. 2021, 47, 3862–3876. [Google Scholar]
- Jia, C.; Chen, J.; Bai, J.; Yang, X.; Song, S.; Wang, Q. Kinetics of the pyrolysis of oil sands based upon thermogravimetric analysis. Thermochim. Acta 2018, 666, 66–74. [Google Scholar] [CrossRef] [Scilit]
- Liu, H.; Xiang, C.; Mu, J.; Yao, J.; Ye, D.; Jin, K.; Lang, Z. Thermodynamic model and kinetic compensation effect of oil sludge pyrolysis based on thermogravimetric analysis. Therm. Sci. 2022, 26, 259–272. [Google Scholar] [CrossRef] [Scilit]
- Liu, F.; Jin, L.; Ban, Y.; Hu, H. Study on pyrolysis behavior of long-chain n-alkanes with photoionization molecular-beam mass spectrometer. J. Anal. Appl. Pyrolysis 2021, 159, 105324. [Google Scholar] [CrossRef] [Scilit]
- Chen, B.; Han, X.; Li, Q.; Jiang, X. Study of the thermal conversions of organic carbon of Huadian oil shale during pyrolysis. Energy Convers. Manag. 2016, 127, 284–292. [Google Scholar] [CrossRef] [Scilit]
- Balogun, A.O.; Adeleke, A.A.; Ikubanni, P.P.; Adegoke, S.O.; Alayat, A.M.; McDonald, A.G. Physico-chemical characterization, thermal decomposition and kinetic modeling of Digitaria sanguinalis under nitrogen and air environments. Case Stud. Therm. Eng. 2021, 26, 101138. [Google Scholar] [CrossRef] [Scilit]
- Song, S.; Liu, X.; Jiang, X.; Peng, T.; Gao, H.; Xu, Z. Kinetic analysis of slow pyrolysis of oily sludge at medium temperature (350 °C–650 °C) and the effects of heating rate on pyrolysis. Environ. Technol. 2023, 45, 4900–4913. [Google Scholar] [CrossRef] [Scilit]
- Matouq, M.; Amer, M.W.; Al-Ayed, O.S. Variable Activation Energy Principle to Model Oil Shale Pyrolysis Kinetics. Oil Shale 2017, 34, 181–194. [Google Scholar] [CrossRef] [Scilit]
- Vyazovkin, S. A time to search: Finding the meaning of variable activation energy. Phys. Chem. Chem. Phys. 2016, 18, 18643–18656. [Google Scholar] [CrossRef] [Scilit]
- Wang, Y.; Liu, H.; Duan, Q.; Li, Z. Understanding the Negative Apparent Activation Energy for Cu2O and CoO Oxidation Kinetics at High Temperature near Equilibrium. Catalysts 2024, 14, 832. [Google Scholar] [CrossRef] [Scilit]
- Xiao, F.; Sun, X.; Li, Z.; Li, X. Theoretical Study of Radical-Molecule Reactions with Negative Activation Energies in Combustion: Hydroxyl Radical Addition to Alkenes. ACS Omega 2020, 5, 12777–12788. [Google Scholar] [CrossRef] [Scilit]

Disclaimer/Publisher’s Note: The statements, opinions and data contained in all publications are solely those of the individual author(s) and contributor(s) and not of MDPI and/or the editor(s). MDPI and/or the editor(s) disclaim responsibility for any injury to people or property resulting from any ideas, methods, instructions or products referred to in the content. |
© 2026 by the authors. Licensee MDPI, Basel, Switzerland. This article is an open access article distributed under the terms and conditions of the Creative Commons Attribution (CC BY) license.