


Abstract
In the late high water cut stage of medium- and high-permeability sandstone reservoirs, remaining oil becomes highly dispersed, and rational optimization of the water injection rate is crucial for further recovery improvement. However, a quantitative relationship between pore-scale remaining oil mobilization and macroscopic displacement efficiency is still lacking, limiting mechanistic guidance for field-scale rate optimization and water cut control. To address this issue, variable-rate waterflooding experiments were conducted on medium- and high-permeability sandstone cores to establish the relationships among displacement rate, injected pore volume multiples, and oil displacement efficiency and to identify the optimal rate. In addition, an X-CT-based heterogeneous pore-scale geometric model and a series of idealized pore-throat models were used for oil–water two-phase flow simulations. Combined with an orthogonal experimental design, the effects of displacement rate, wettability, oil viscosity, interfacial tension, and pore structure parameters on remaining oil mobilization and displacement efficiency were systematically evaluated. The results indicate an optimal displacement rate of 2–3 mL/min. At low rates, remaining oil cannot be effectively mobilized, whereas excessively high rates intensify fingering and channeling along high-capacity pathways, reducing the final displacement efficiency. Simulations further show that a moderate rate increase markedly lowers remaining oil saturation, while overly high rates induce severe channeling. Orthogonal analysis reveals that displacement rate and wettability are the dominant factors, with normalized weights of 46.3% and 30.5%, respectively. Larger pore diameters, smaller pore-throat ratios, and higher coordination numbers reduce mobilization pressure and remaining oil saturation. This work elucidates pore-scale remaining oil mobilization kinetics under variable-rate waterflooding and provides a quantitative microscopic basis for rate optimization and fine-scale remaining oil exploitation in mature waterfloods.
1. Introduction
Medium- and high-permeability sandstone reservoirs are the dominant reservoir type supporting stable production in mature onshore oilfields in eastern China. They are typically characterized by high porosity, high permeability and good matrix connectivity, but also exhibit pronounced vertical and lateral heterogeneity, as well as complex pore-throat configurations. After long-term waterflooding, most of these reservoirs have entered a high- or even an ultra-high water cut stage, with overall water cut commonly exceeding 90% and recovery approaching the design limit of each block. In the late super-high water cut stage (≥98%), the remaining oil is often concentrated in unswept zones and other low-swept regions, and well pattern adjustment together with refined injection control becomes a practical necessity [1,2]. This challenge has also been reported in the Dagang Oilfield, where high water cut sandstone reservoirs still retain substantial microscopic residual oil trapped in pore-scale blind ends and films [3]. Under such circumstances, further stabilization and enhancement of oil production increasingly rely on fine-scale exploitation of the remaining oil and on optimized control of injection–production parameters [1,4,5]. Common measures for production enhancement in these reservoirs include increasing water injection intensity, adjusting injection–production well patterns, implementing cyclic water injection and applying variable-rate injection, with the aim of expanding the swept volume at limited additional cost and thereby improving ultimate oil recovery [2,6,7]. However, extensive field practice has shown that simply increasing flow rate and the injection–production pressure difference does not necessarily result in higher recovery; instead, it often aggravates fingering and early water channeling along high-capacity channels, causing a rapid rise in macroscopic water cut while microscopic remaining oil remains difficult to mobilize [6,8,9].
Recent field and laboratory studies have further quantified remaining oil distribution and waterflooding performance in multi-layer and ultra-high water cut reservoirs, and have proposed practical optimization strategies for injection patterns and rate control [10]. Jin et al. [11] performed layered water injection and high multiple waterflooding experiments to investigate the redistribution of the remaining oil with well-developed high-capacity channels. They pointed out that in the case of strong heterogeneity, simply increasing the water injection intensity significantly aggravates vertical channeling. Remaining oil recovery in the high-permeability zone is reduced. Ma et al. [7] provided a comprehensive summary of waterflood regulation technologies in the high water cut stage and pointed out that the superposition of interlayer contradictions and areal heterogeneity is a key cause of declining waterflooding efficiency in the late stage. They emphasized that refined zonal water injection combined with coordinated optimization of injection–production parameters remains one of the core approaches to improve the swept volume and inhibit water channeling. Based on a large number of logging and experimental data in multiple oilfields, Liu et al. [6] summarized the permeability evolution and remaining oil distribution patterns of reservoir intervals with different permeability levels during long-term waterflooding, and proposed targeted development strategies. In this context, substantial engineering experience has been accumulated in the fields regarding the integrated regulation and optimization of injection–production systems. Considerable research has been conducted in the fields to elucidate the mechanisms of oil recovery improvement through variable-rate water injection and to optimize the associated parameters. Some studies have employed core-scale displacement experiments to comparatively analyze oil–water distributions in carbonate and sandstone samples under different injection rates. Relevant core experiments and field cases generally point out that the change in oil displacement efficiency with injection rate is not monotonic. Instead, it typically exhibits an increase followed by a decrease, or an optimal rate. This behavior is closely related to reservoir permeability, heterogeneity and preferential channel development [12,13,14,15]. For example, Gong et al. [16] carried out a combination experiment of long-term waterflooding and variable-rate injection on sandstone cores with different permeabilities. They reported that, within a certain range, increasing the injection rate can accelerate the breakup of macroscale connected oil. However, for remaining oil trapped in small pores under strong capillary confinement, simply increasing the rate has limited effectiveness; its mobilization still depends on wettability alteration or interfacial tension control.
With the development of X-ray computed tomography (X-CT) and related imaging techniques, increasing attention has been paid to pore-scale multiphase flow [17,18,19,20] and the mobilization mechanisms of remaining oil [2,13,14,21,22,23]. In this context, to elucidate the kinetics of remaining oil mobilization and its controlling factors in the high water cut stage, researchers have developed a range of pore-scale numerical approaches based on imaging of pore structures and have reported corresponding insights [22,24,25]. Blunt and Raeini et al. [13,26,27] systematically reviewed the applications of digital rock imaging and pore-scale simulation in multiphase flow in hydrocarbon reservoirs, highlighting that micro/nano-scale three-dimensional imaging coupled with direct numerical simulation can reveal the mobilization mechanisms and connectivity characteristics of remaining oil at a single pore-throat. Zhou et al. [28] constructed pore-scale waterflooding models based on real sandstone images and systematically discussed the competition between viscous and capillary force under different flow rate conditions, as well as their roles in controlling waterfront morphology and saturation evolution. Their results showed that, under mixed–wet conditions, flow rate and capillary effects can markedly alter oil-phase connectivity and mobilization pathways within pores; however, their investigation primarily considered continuous constant-rate injection and did not address the stepwise rate-adjustment scenarios commonly encountered in field operations. Furthermore, Yang et al. [29] implemented a periodic water injection strategy in a two-dimensional model using OpenFOAM, identified a critical range of injection periods that govern oil recovery and remaining oil saturation, and revealed the modulating roles of interfacial tension and viscosity ratio on the performance of injection. This work provides computable pore-scale evidence for time-varying injection rates; however, it is mainly based on a homogeneous model and thus cannot adequately reflect the impacts of realistic sandstone pore-throat configurations and heterogeneous flow channels on remaining oil mobilization. To address this limitation, Zhang et al. [30] compared continuous and intermittent displacement modes in sandstone samples and quantitatively demonstrated that remobilization of remaining oil is closely related to variations in coordination number and pore-throat ratio. Building on this, Hui et al. [31] prescribed stepwise and piecewise injection rate schedules and found that, compared with continuous constant-rate injection, dynamic rate control promotes the emergence of preferential flow channels and yields pronounced non-stationary pressure responses. However, its geometry is still idealized, which needs to be considered in combination with real pore geometry of a specific oilfield and core-scale variable-rate flooding behavior. Tang et al. [32], based on direct numerical simulations of two-phase flow in CT-derived geometry, show that the change in injection rate will cause obvious dynamic capillary pressure effect. Their study discusses the dynamic capillary pressure relationship considering the influence of flow rate. Raeini et al. [33] developed a generalized pore network model, which introduces curved interface geometry and real pore-throat morphology into the network flow solution, capturing the relationship between capillary-pressure-dominated two-phase flow velocity, wettability, and relative permeability at a lower computational cost. In summary, the reservoir pore structure and heterogeneity including pore size distribution, pore-throat matching, coordination number, and the development of preferential high-capacity pathway, can markedly alter interfacial stability and the mobilization threshold of remaining oil during two-phase flow, thereby governing the effectiveness and applicable range of rate optimization waterflooding. Previous studies [34,35,36] have shown that, in strongly heterogeneous media, increasing injection intensity tends to preferentially enhance flow through high-permeability channels and trigger early water breakthrough, while providing limited mobilization of capillary-trapped remaining oil in low-permeability zones and small pore-throat systems. In contrast, optimizing the rate window by considering the coupled effects of pore-throat geometry and fluid properties can, to some extent, balance macroscopic sweep improvement with pore-scale mobilization. However, most existing studies have focused on homogeneous or near-homogeneous cores, and simulation conditions are typically limited to specific enhancing oil recovery processes such as low-salinity waterflooding or polymer–surfactant flooding. For the actual reservoirs such as typical medium- and high-permeability sandstone reservoirs, studies remain scarce on how to couple the physical simulation of variable flow rate with the phenomenon of pore-scale force, then identify the optimal injection rate matching the reservoir’s physical properties and pore-throat structure, together with the corresponding pore-scale mechanisms of remaining oil mobilization. Therefore, although the existing pore-scale simulations have revealed the influence of dynamic injection on the connectivity and production order of the remaining oil from different angles, it is still relatively insufficient to quantitatively couple the real CT geometry, pore structure parameters (pore diameter, pore-throat ratio, coordination number), physical parameters (contact angle, viscosity, interfacial tension) and oil displacement efficiency in the same framework for medium- and high-permeability sandstone under the premise of a macroscopic variable-rate waterflooding experiment.
Accordingly, this study combines experiments and numerical simulations to elucidate the pore-scale kinetics of remaining oil mobilization during variable-rate waterflooding in medium- and high-permeability sandstone reservoirs. The framework of this paper is summarized as follows: (1) Variable-rate waterflooding experiments are conducted on representative medium- and high-permeability sandstone cores to characterize the variation in oil displacement efficiency with waterflooding pore volume multiple and displacement rate. (2) Based on X-ray CT slice images, a two-dimensional heterogeneous pore geometry model is established, idealized pore-throat geometry models with different pore diameter, pore-throat ratio and coordination number are constructed. (3) The mathematical model of oil–water two-phase flow is established, in which the evolution of the phase interface during waterflooding is captured by coupling the Cahn–Hilliard equation. (4) Based on the above framework, the mechanisms and controlling factors of pore-scale remaining oil mobilization are analyzed in terms of displacement rate, fluid properties and pore structure characteristics, under the constraint of the core-scale variable-rate waterflooding experiments. The unique contributions of this work are as follows: (1) variable-rate waterflooding experiments on real sandstone cores identify an optimal displacement rate and its displacement behavior; (2) X-CT-based heterogeneous pore-scale models and idealized pore-throat models clarify the coupled effects of displacement conditions and pore structure on remaining oil mobilization; and (3) the impacts of rate, wettability, viscosity, interfacial tension, and structural parameters are quantitatively ranked, and a force-based mobilization mechanism under variable-rate conditions is established.
2. Variable-Rate Waterflooding Experiments
2.1. Methodology
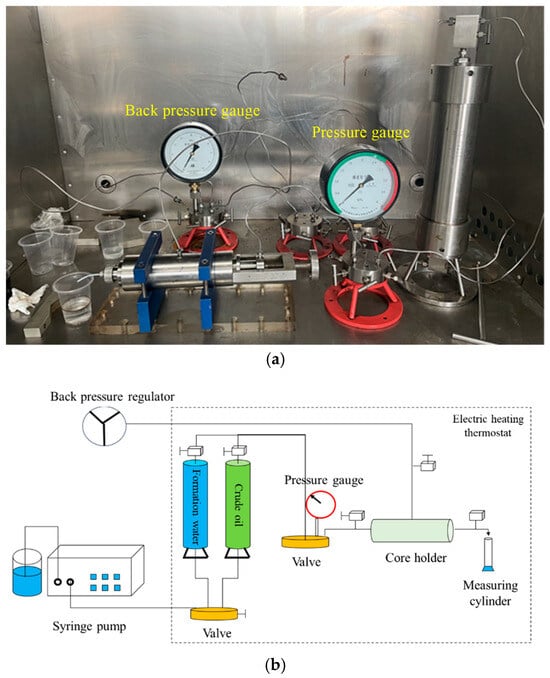
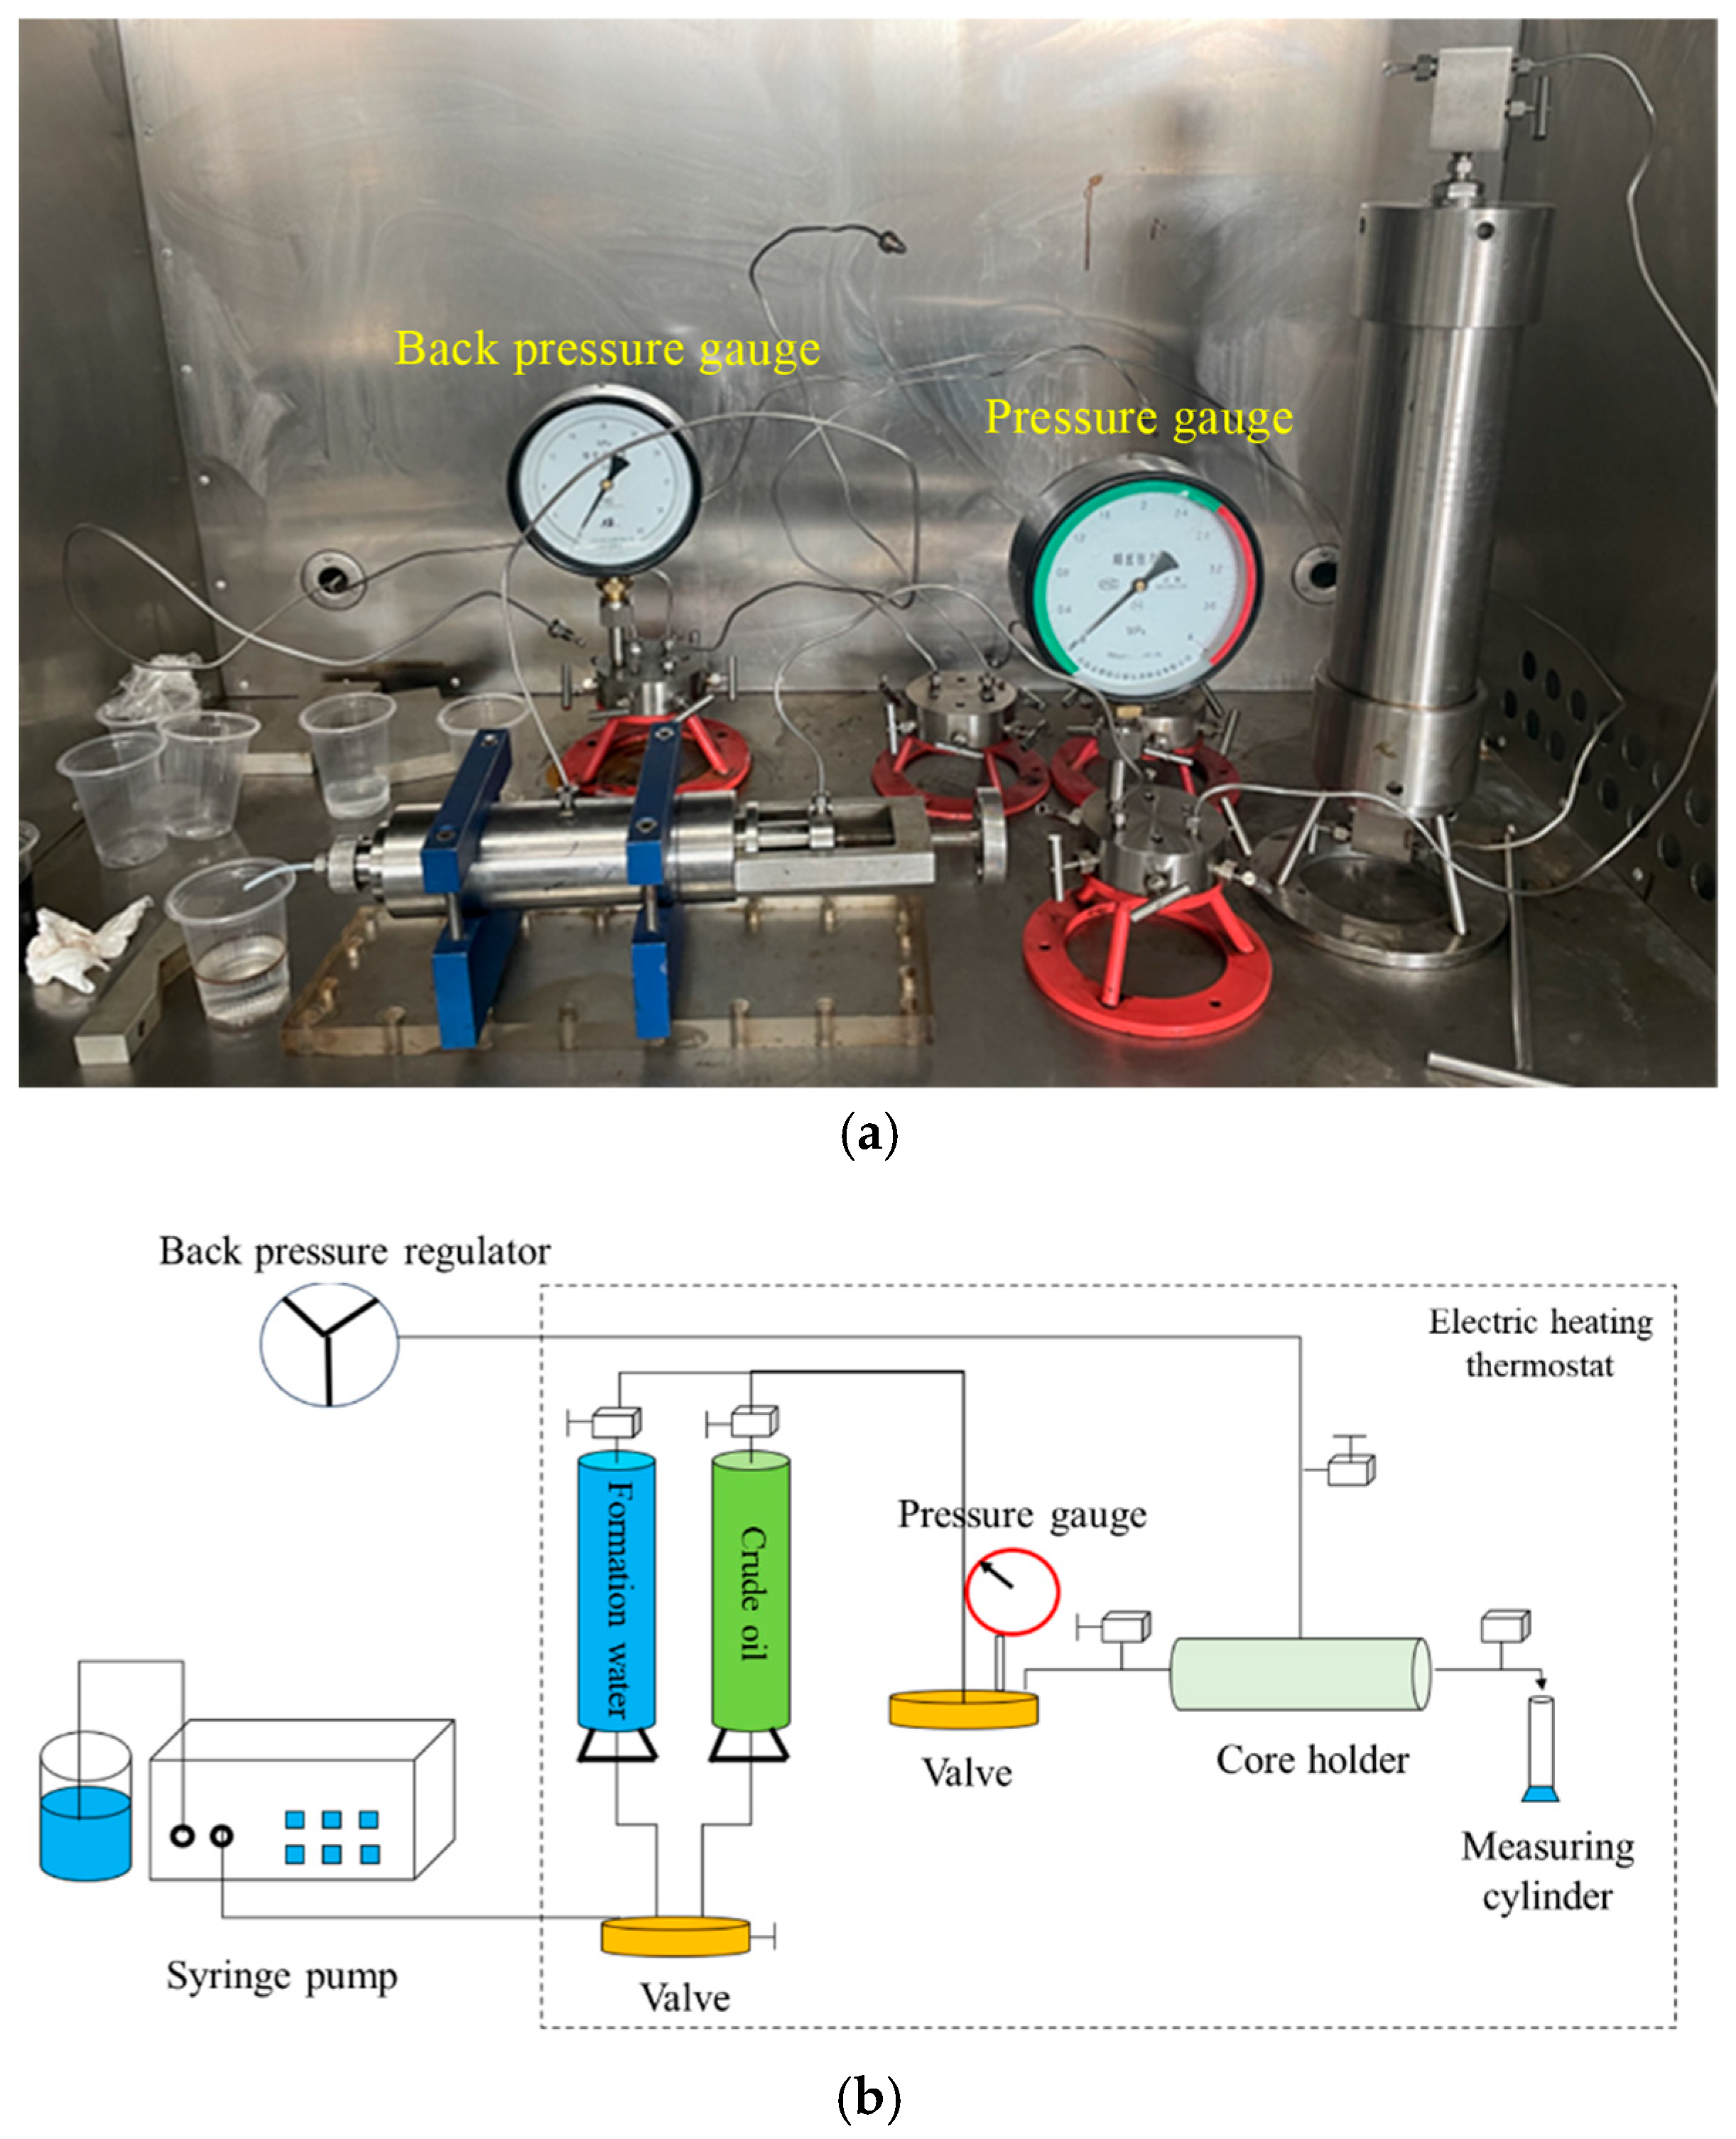
In this study, 14 representative medium- and high-permeability sandstone core samples from Dagang Oilfield were selected as the experimental objects. The selected cores are mainly composed of fine-medium grained sandstones with predominantly clay-carbonate cementation. Figure 1 shows the experimental setup of variable-rate waterflooding experiments. This system mainly consists of an electric heating thermostat, a constant-rate syringe pump, a high-pressure core holder, a back pressure regulator, measuring cylinders, an electronic balance, and a data acquisition system. During the experiments, the core and pipeline temperatures were maintained at the reservoir temperature via the electric heating thermostat. Formation water was injected into the core at a constant rate by a syringe pump, while a back-pressure regulator was used to maintain the outlet pressure, thereby simulating the in situ formation pressure conditions.
Figure 1.
Variable-rate waterflooding experimental device. (a) Experimental device; (b) schematic diagram of experimental device.
The fluids used in the experiments were simulated formation water and Dagang crude oil. Simulated formation water was prepared according to the salinity of the formation water in the Dagang reservoir, with the addition of a 25 wt% KCl solution to increase its salinity. Crude oil was obtained from field samples. It was degassed and its density and viscosity were measured at the experimental temperature to represent the crude oil system in medium- and high-permeability sandstone reservoirs. All fluids used in the experiments were vacuum-degassed to minimize the influence of solution gas in the displacement process. The main experimental steps were as follows: (1) Core pretreatment and matrix property measurement. The cores retrieved from the field were visually inspected and trimmed to a uniform diameter of 2.50 cm, wrapped with heat-shrink tubing, and then dried in an electric heating thermostat at 60 °C until a constant mass was achieved. After cooling to room temperature, the absolute permeability and dry weight of each core were measured to calculate pore volume and initial oil saturation. (2) Core saturation with formation water and oil. Each dry core was placed in a vacuum saturation cell, and simulated formation water was injected slowly to fully saturate the pore space. The mass of saturated water was recorded and used to calculate pore volume and porosity. Crude oil was then injected at a constant rate of 0.1 mL/min to displace the formation water until the produced water cut at the outlet approached zero and the pressure differential stabilized, establishing a high initial oil saturation state. (3) Variable-rate waterflooding experiments. The saturated core was mounted in the core holder, confining pressure and temperature were restored to reservoir conditions, and formation water was injected at prescribed constant rates. The cumulative volumes of produced water and oil were recorded using the graduated cylinders and electronic balance. The oil displacement efficiency (hereafter denoted Eod) and water cut were then calculated. Further, by comparing the final Eod, water cut and rate of water cut increase under different water injection pore volume (PV) multiples and displacement rates, the optimal displacement rate is defined as the rate that maximizes the Eod under the given water injection PV and reservoir types. Table 1 shows the basic physical property parameters of the 14 cores used in the experiments and the designed displacement rates.
Table 1.
Basic physical properties of cores and experimental data.
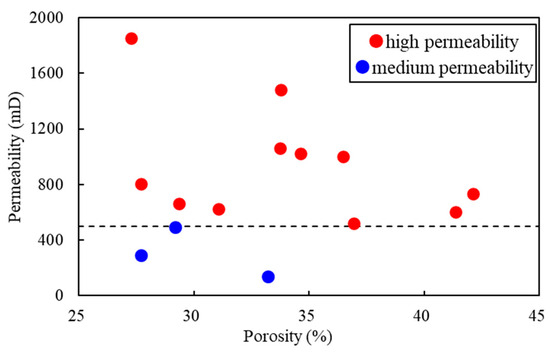
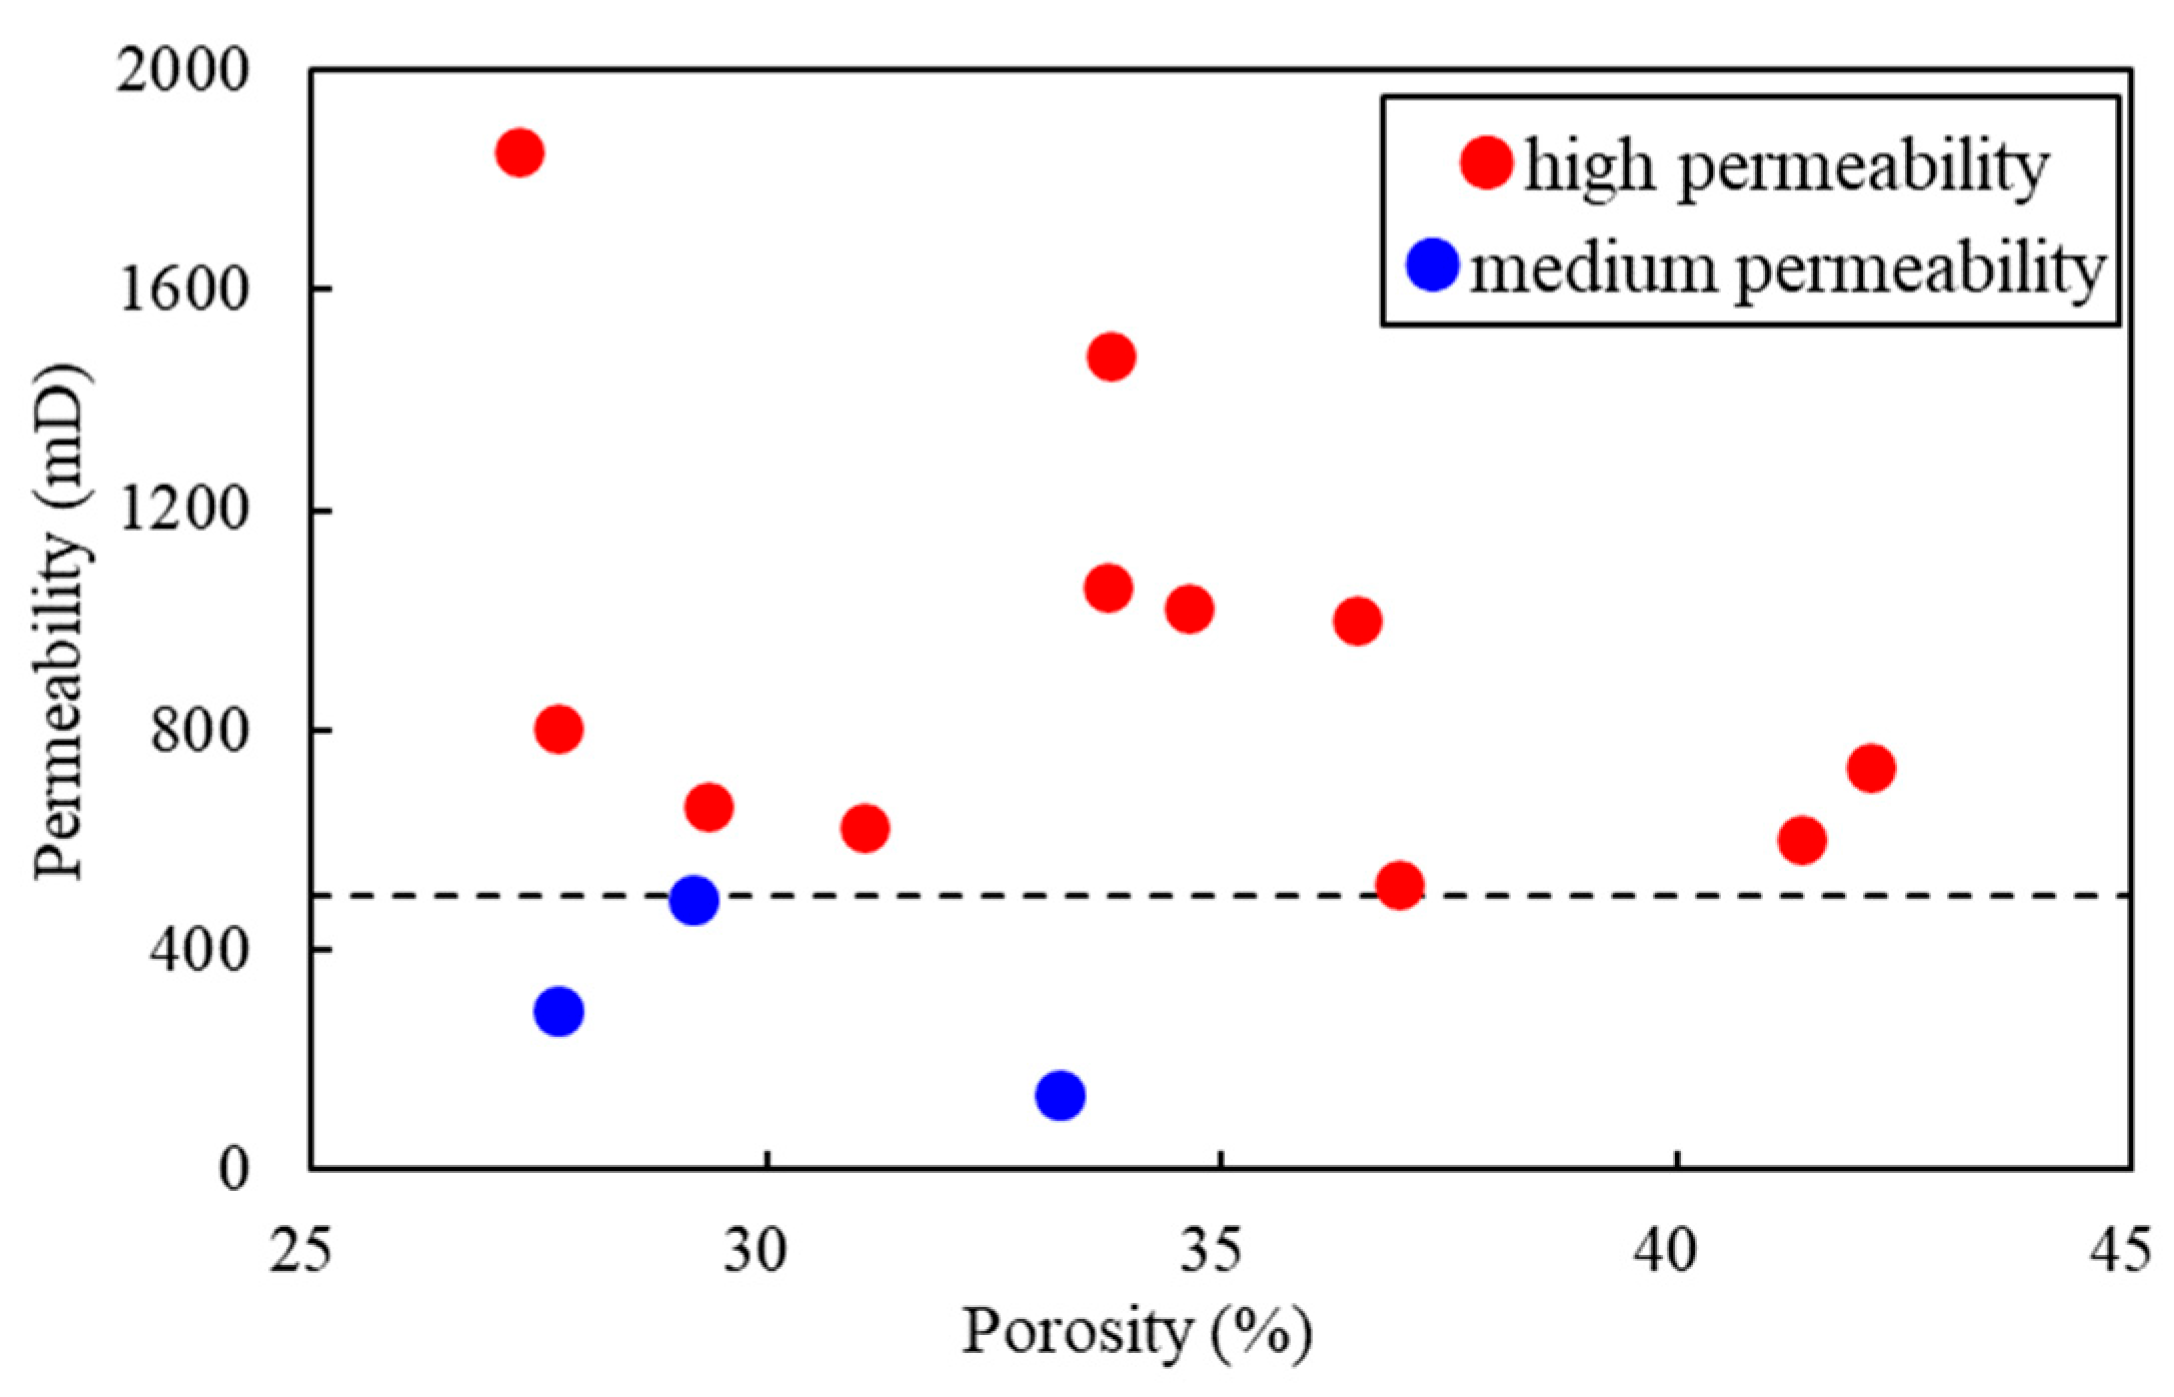
Figure 2 shows the scatter plot of selected core porosity and permeability properties. To quantitatively characterize the heterogeneity of the selected core samples, the permeability spans from 138.18 to 1854.1 mD (a 13.4-fold range), with a mean value of 805.94 mD and a coefficient of variation of 0.57. The porosity spans from 27.12% to 42.11%, with a mean of 33.14% and a CV of 0.15. These statistics confirm that the selected cores exhibit pronounced heterogeneity and are representative of the medium- and high-permeability sandstone reservoir interval studied. The overall physical properties are characterized by high porosity and high permeability. Based on the permeability values, the cores are categorized into two groups: medium permeability (100~500 mD) and high permeability (500~2000 mD), in order to cover the typical physical property range of the main producing layers in medium- and high-permeability reservoirs.
Figure 2.
Scatter plot of porosity–permeability properties of selected cores.
Rock samples were collected from different stratigraphic intervals of the well containing the W4 core, and the clay mineral composition was determined and analyzed; the results are shown in Table 2. It can be seen that the average clay mineral content of the core is 13%, mainly consisting of I/S mixed-layer and kaolinite, together with minor illite and chlorite; the I/S mixed-layer content is relatively high, with an average of 68.6%. The core exhibits an extremely high water sensitivity damage rate. During waterflooding, clay minerals absorb water and swell, causing pores and throats to become smaller, and thus its seepage capacity decreases significantly.
Table 2.
Clay mineral composition of core samples.
2.2. Variable-Rate Waterflooding Characteristics
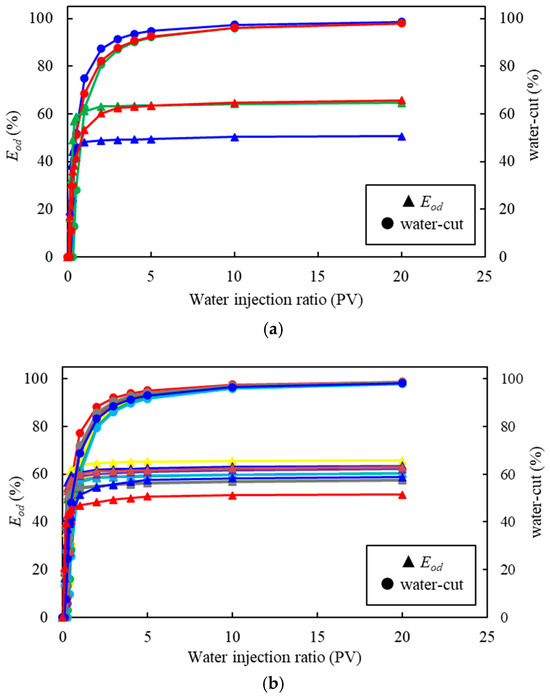
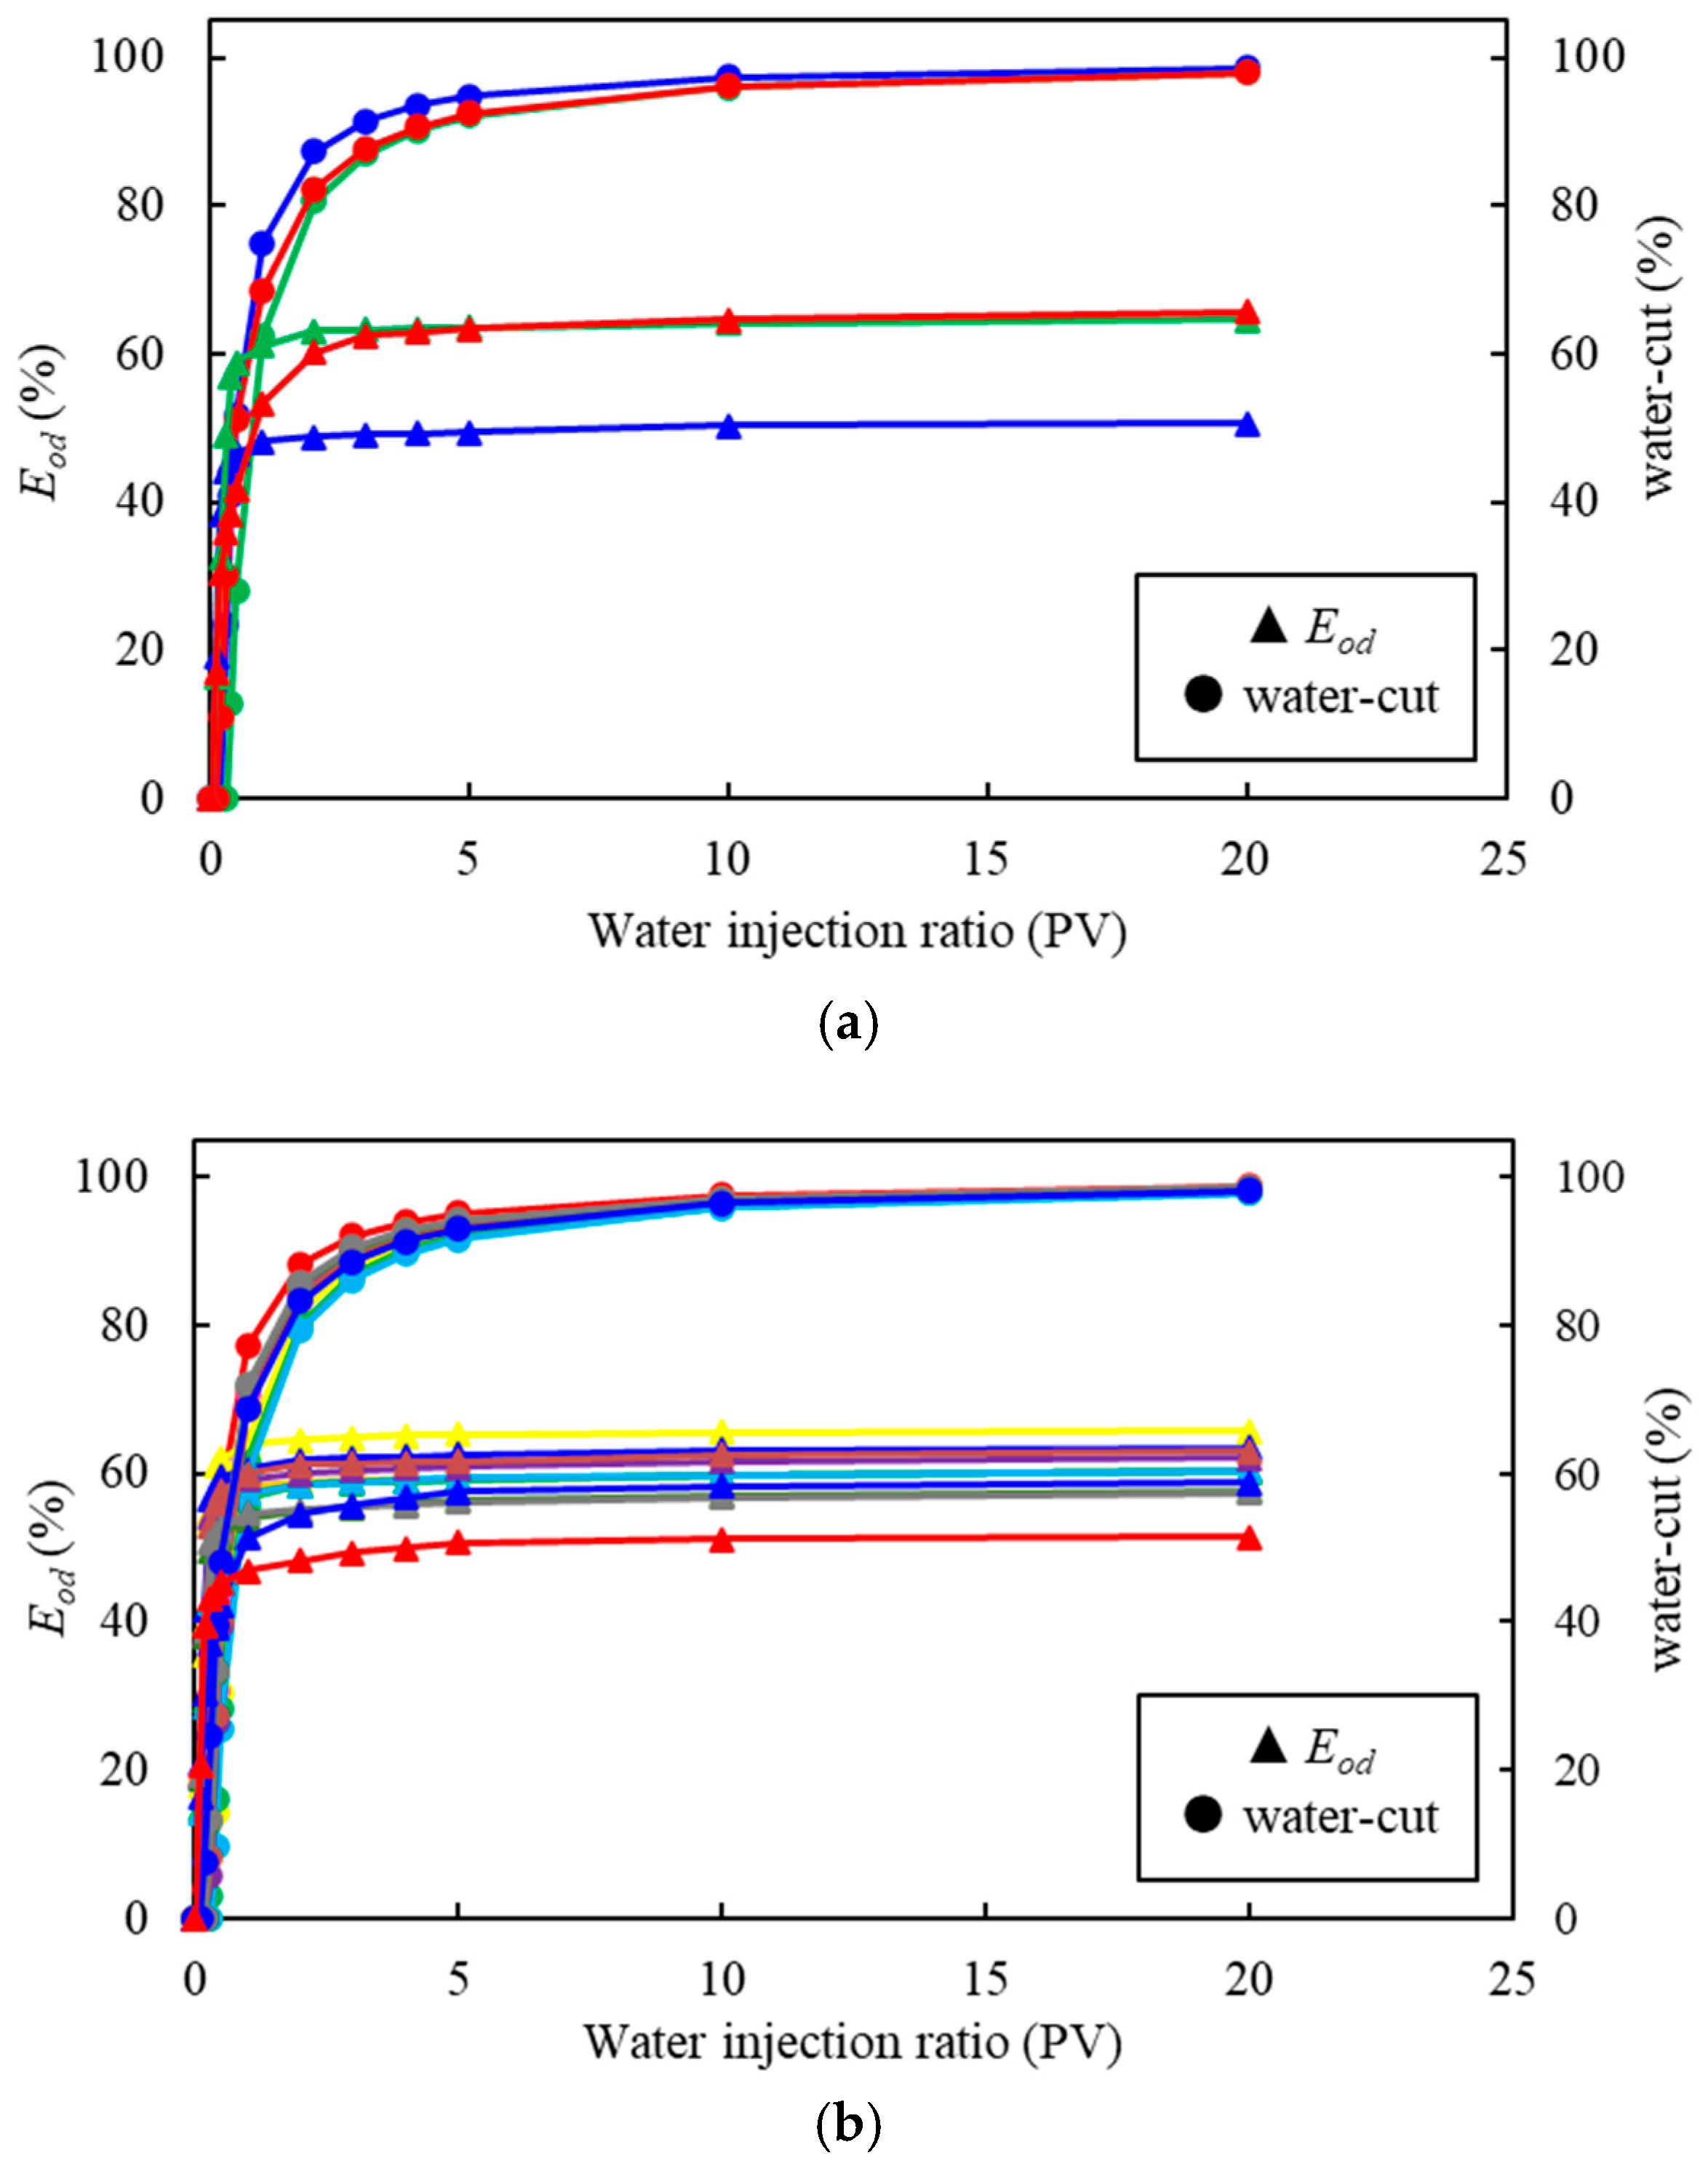
The variations in Eod, water cut and rate of water cut increase in the above 14 cores under different water injection PV multiples and displacement rate were statistically analyzed. Figure 3 illustrates the variation in water cut and Eod for cores within different permeability ranges. As illustrated, the water cut curve can be divided into three stages: a rapid increase stage, a slow increase stage, and a high water cut stage. Taking the results for medium-permeability sandstone in Figure 3a as an example, the water cut rapidly increases to over 75% within 1 PV of water injection; between 1 and 5 PV, the increase in water cut slows, reaching about 90% at 5 PV; after 5 PV, it increases very slowly, essentially stabilizing around 95% with little further change. It is analyzed that during the first PV of water injection, most of the movable oil in the core is displaced from the pores, with the oil–waterfront advancing rapidly. When approximately 1 PV of water has been injected, the waterfront breaks through the outlet and quickly establishes a preferential flow channel, causing the subsequent injected water to flow along those channels and form an ineffective water cycling. The Eod increased rapidly within the first PV and showed no significant change after reaching a stable state, indicating that most of the remaining oil has been expelled from the core. Due to the establishment of the preferential flow channel, the remaining oil in smaller pores could not be displaced under the existing pressure differential, ultimately forming residual oil.
Figure 3.
Oil displacement efficiency curves for cores within different permeability ranges. (a) Medium-permeability core; (b) high-permeability core. Different colors represent different cores.
By comparing the Eod and water cut curves for the two different permeability ranges, it is observed that the overall final Eod increased with higher permeability. This indicates a more developed fluid flow network and lower flow resistance for oil and water in high-permeability cores. Furthermore, fingering phenomena are more pronounced in low-permeability cores, leading to a faster water cut increase and earlier water breakthrough time.
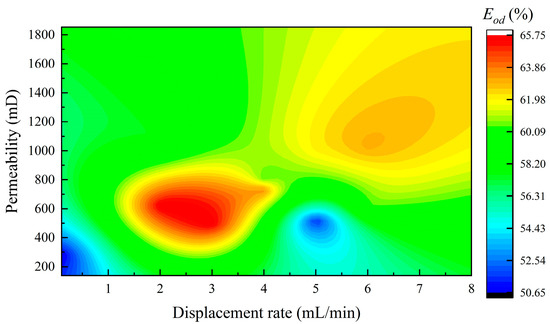
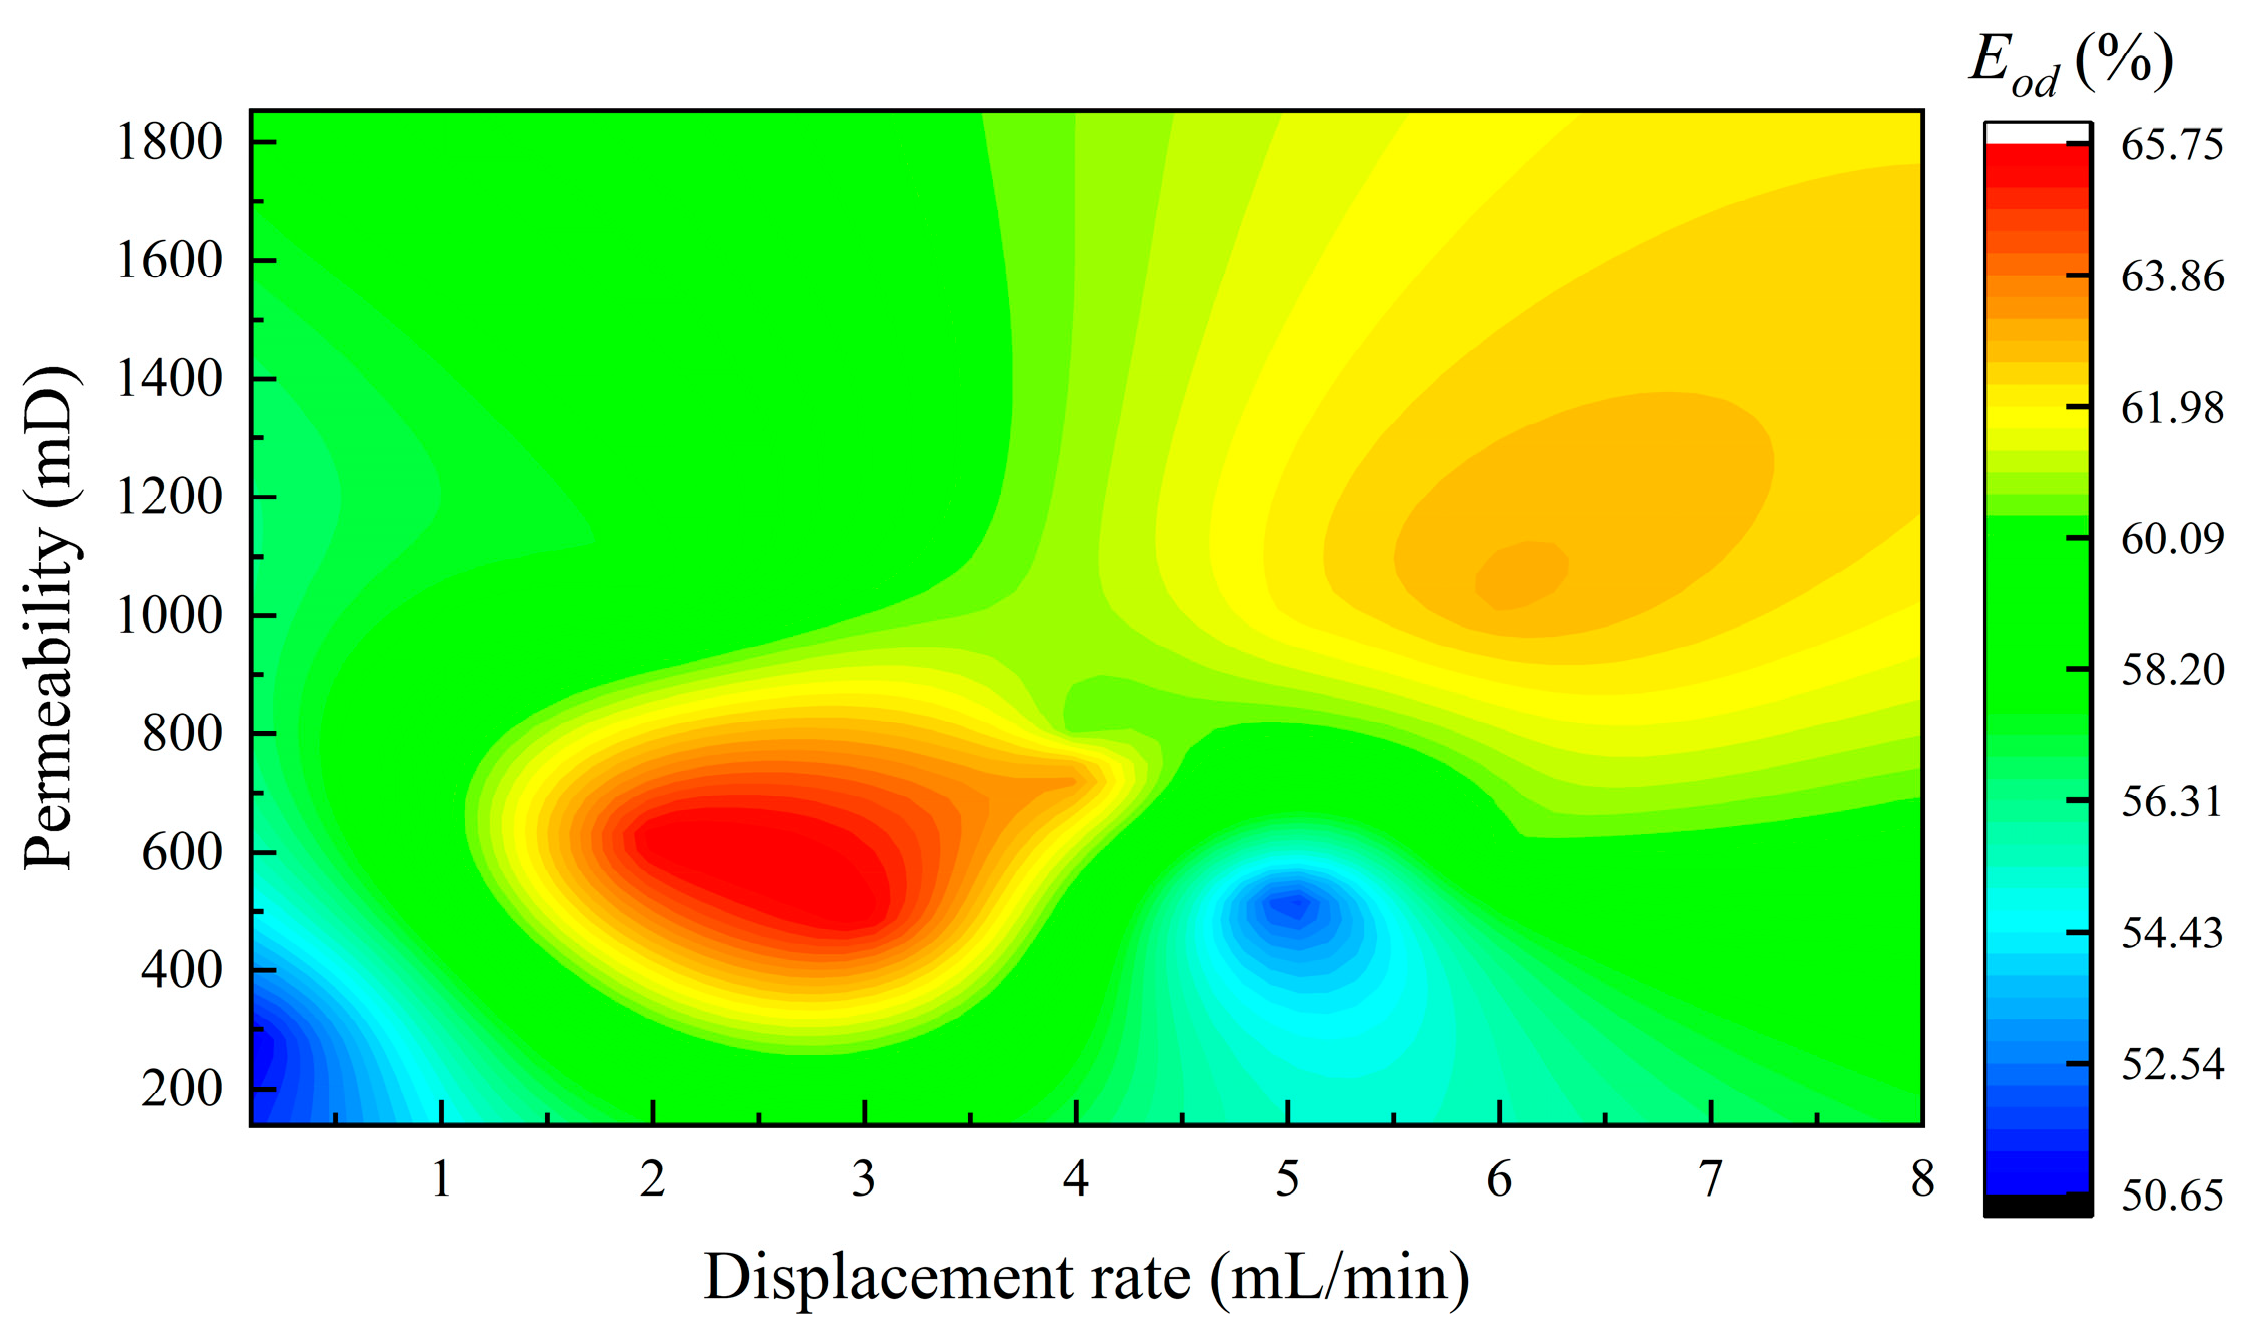
Figure 4 illustrates the variation in final Eod under different displacement rates and core permeability. It can be observed that, with an increase in the displacement rate, the final Eod initially rises and subsequently declines overall. An optimal displacement rate of 2~3 mL/min exists for the core (indicated by the red zone in Figure 4), which maximizes the ultimate oil displacement efficiency. It is analyzed that when the displacement rate is too low, it is insufficient to overcome the capillary and viscous resistance in most pores, resulting in insufficient mobilization of the remaining oil and consequently a lower final Eod. During waterflooding, a higher displacement rate tends to induce fingering and channeling, establishing preferential flow channels and leaving some remaining oil unswept. When the displacement rate is optimal, a balance between capillary pressure and viscous resistance among pores is achieved, allowing uniform advancement of the waterfront. This leads to maximum overall swept volume and final Eod.
Figure 4.
Influence of displacement rate and permeability on final Eod.
To quantify the speed of water breakthrough during variable-rate waterflooding, the rate of water cut increase was defined as the following equation:
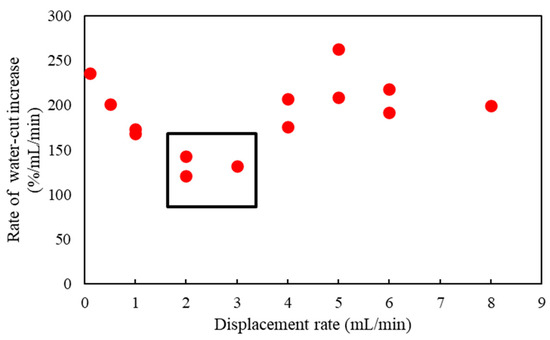
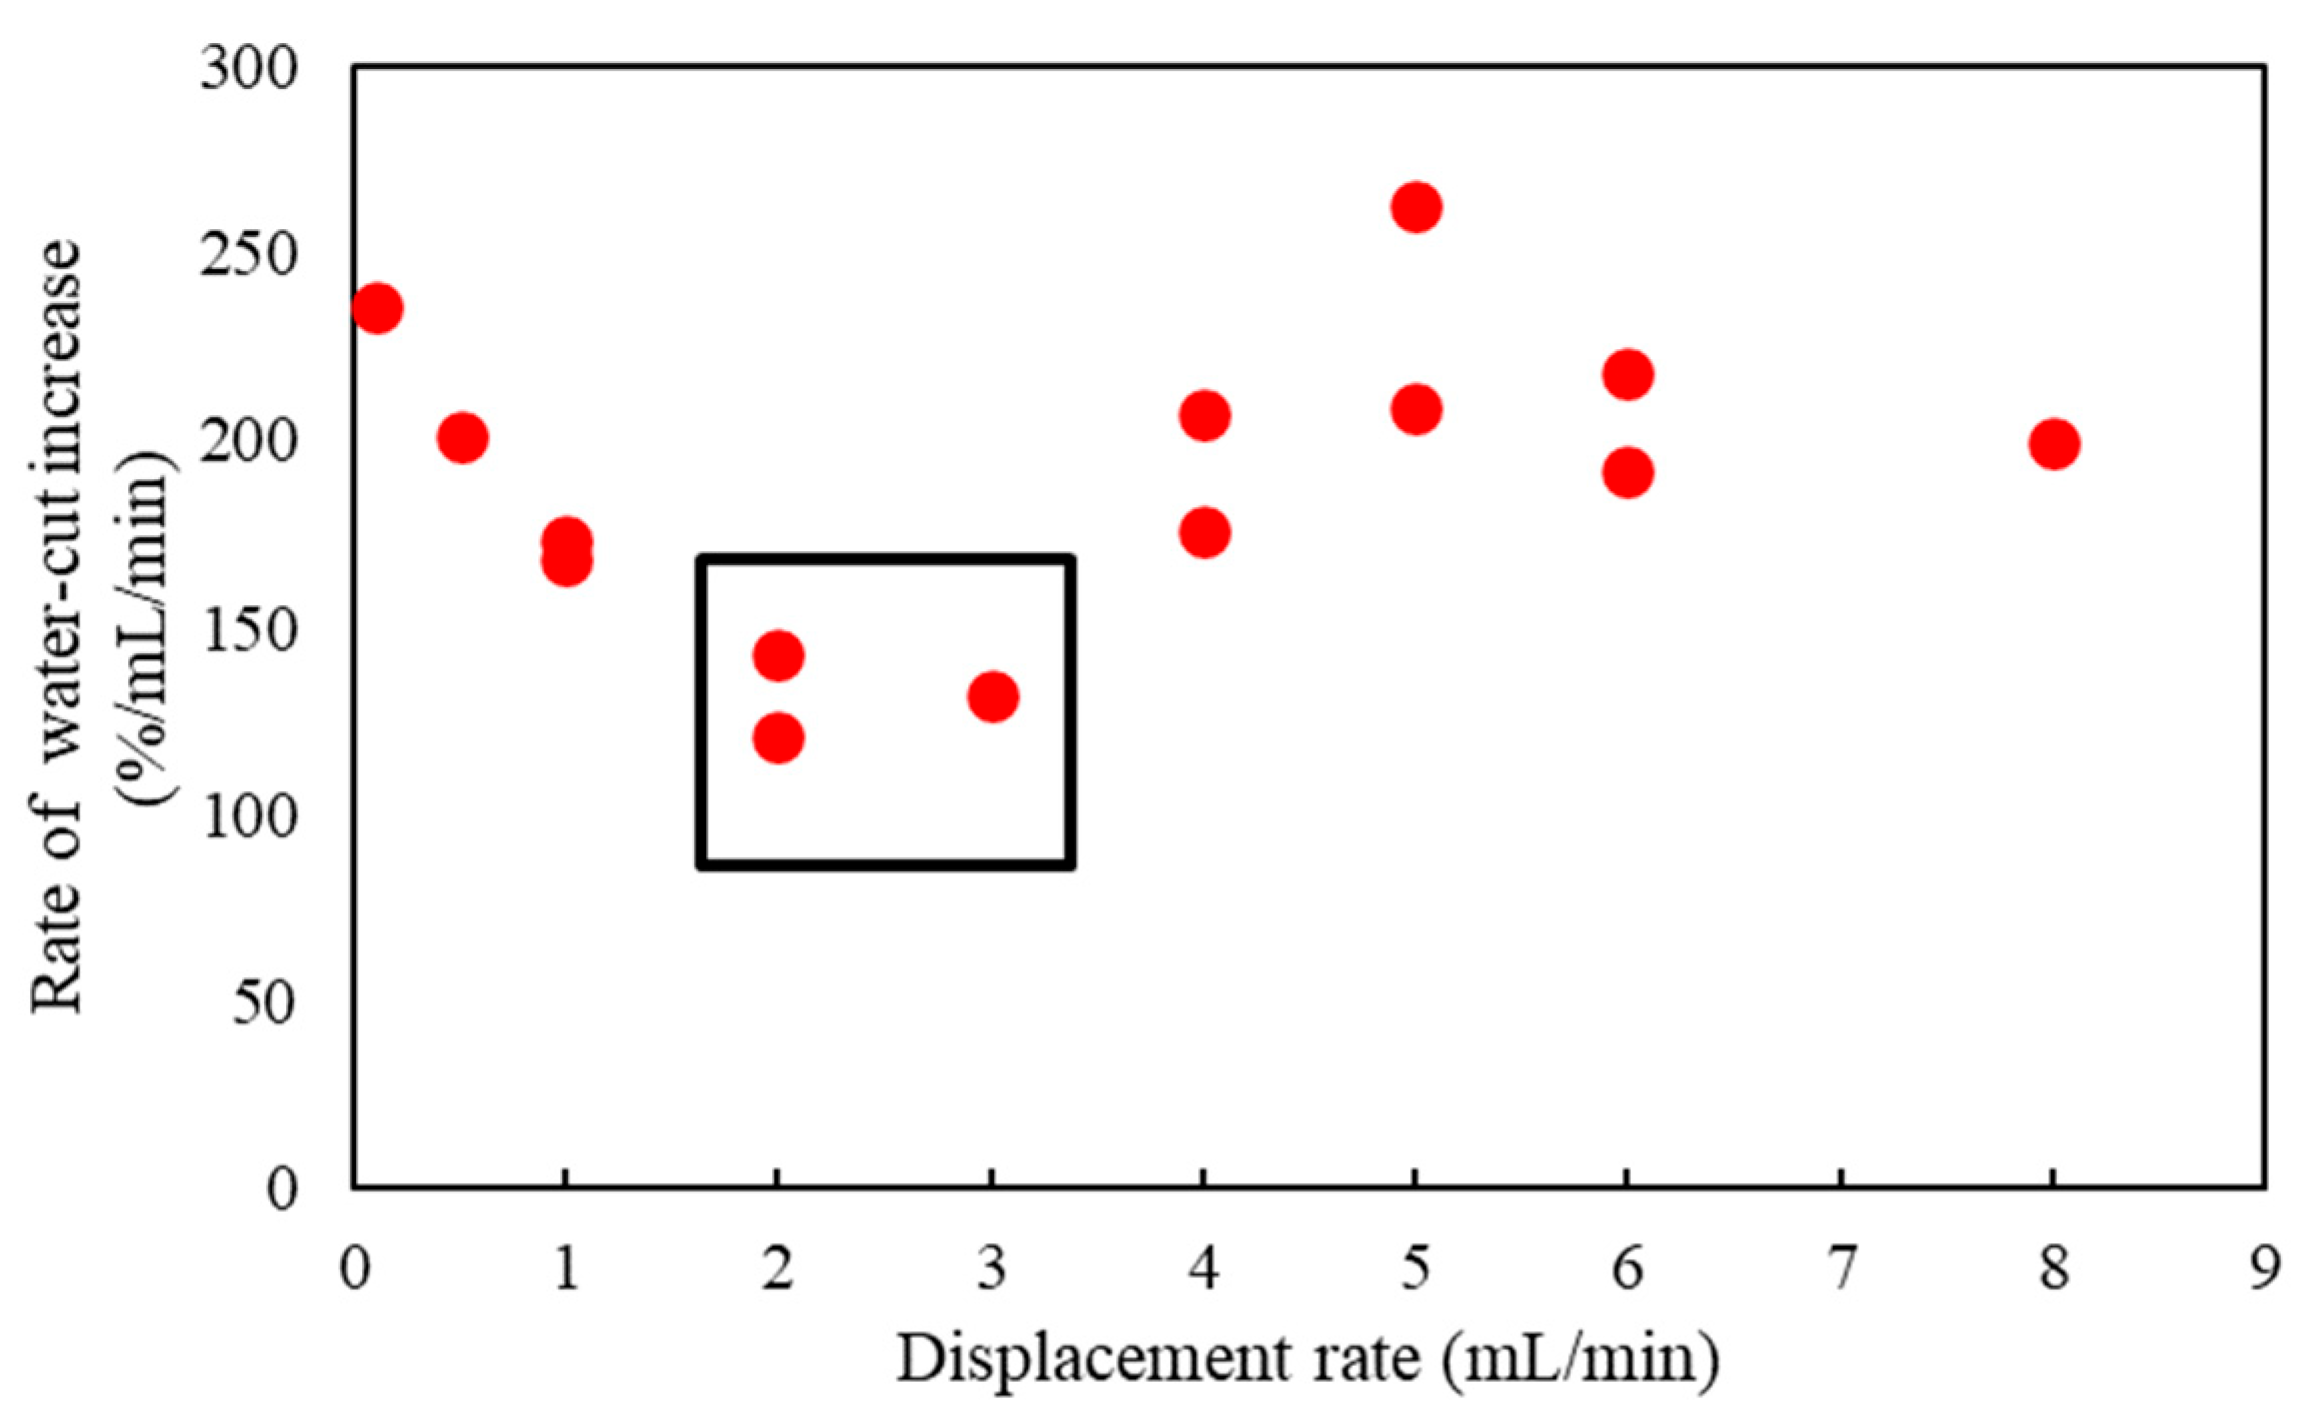
Figure 5 shows the maximum rate of water cut increase at each displacement rate. It can be observed that the rate of water cut increase is generally lower when the displacement rate ranging from 2 to 3 mL/min. This indicates that under the optimal displacement rate, water breakthrough occurred later at the macroscopic scale and the water cut increased more gradually in the core. This further demonstrates that, for medium- and high-permeability sandstone cores with pronounced heterogeneity, there exists an optimal displacement rate corresponding to their pore structure characteristics.
Figure 5.
Variation in the maximum rate of water cut increase with displacement rate. The black box highlights the optimal displacement rate range (2–3 mL/min).
3. Heterogeneous Geometric Model Construction
To further investigate the influence of displacement conditions and rock pore-throat structure on the microscopic mobilization mechanism of the remaining oil, representative core samples are selected for high-precision CT scanning. Heterogeneous pore-throat geometric models are digitally constructed to explore the impact of displacement conditions on microscopic remaining oil mobilization characteristics. Simultaneously, idealized pore-throat geometric models are designed to study the effects of structural parameters such as pore diameter, pore-throat ratio, and coordination number on the microscopic mobilization mechanism of remaining oil.
3.1. Heterogeneous Pore-Throat Geometric Model
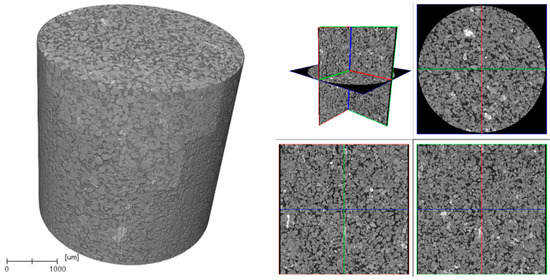
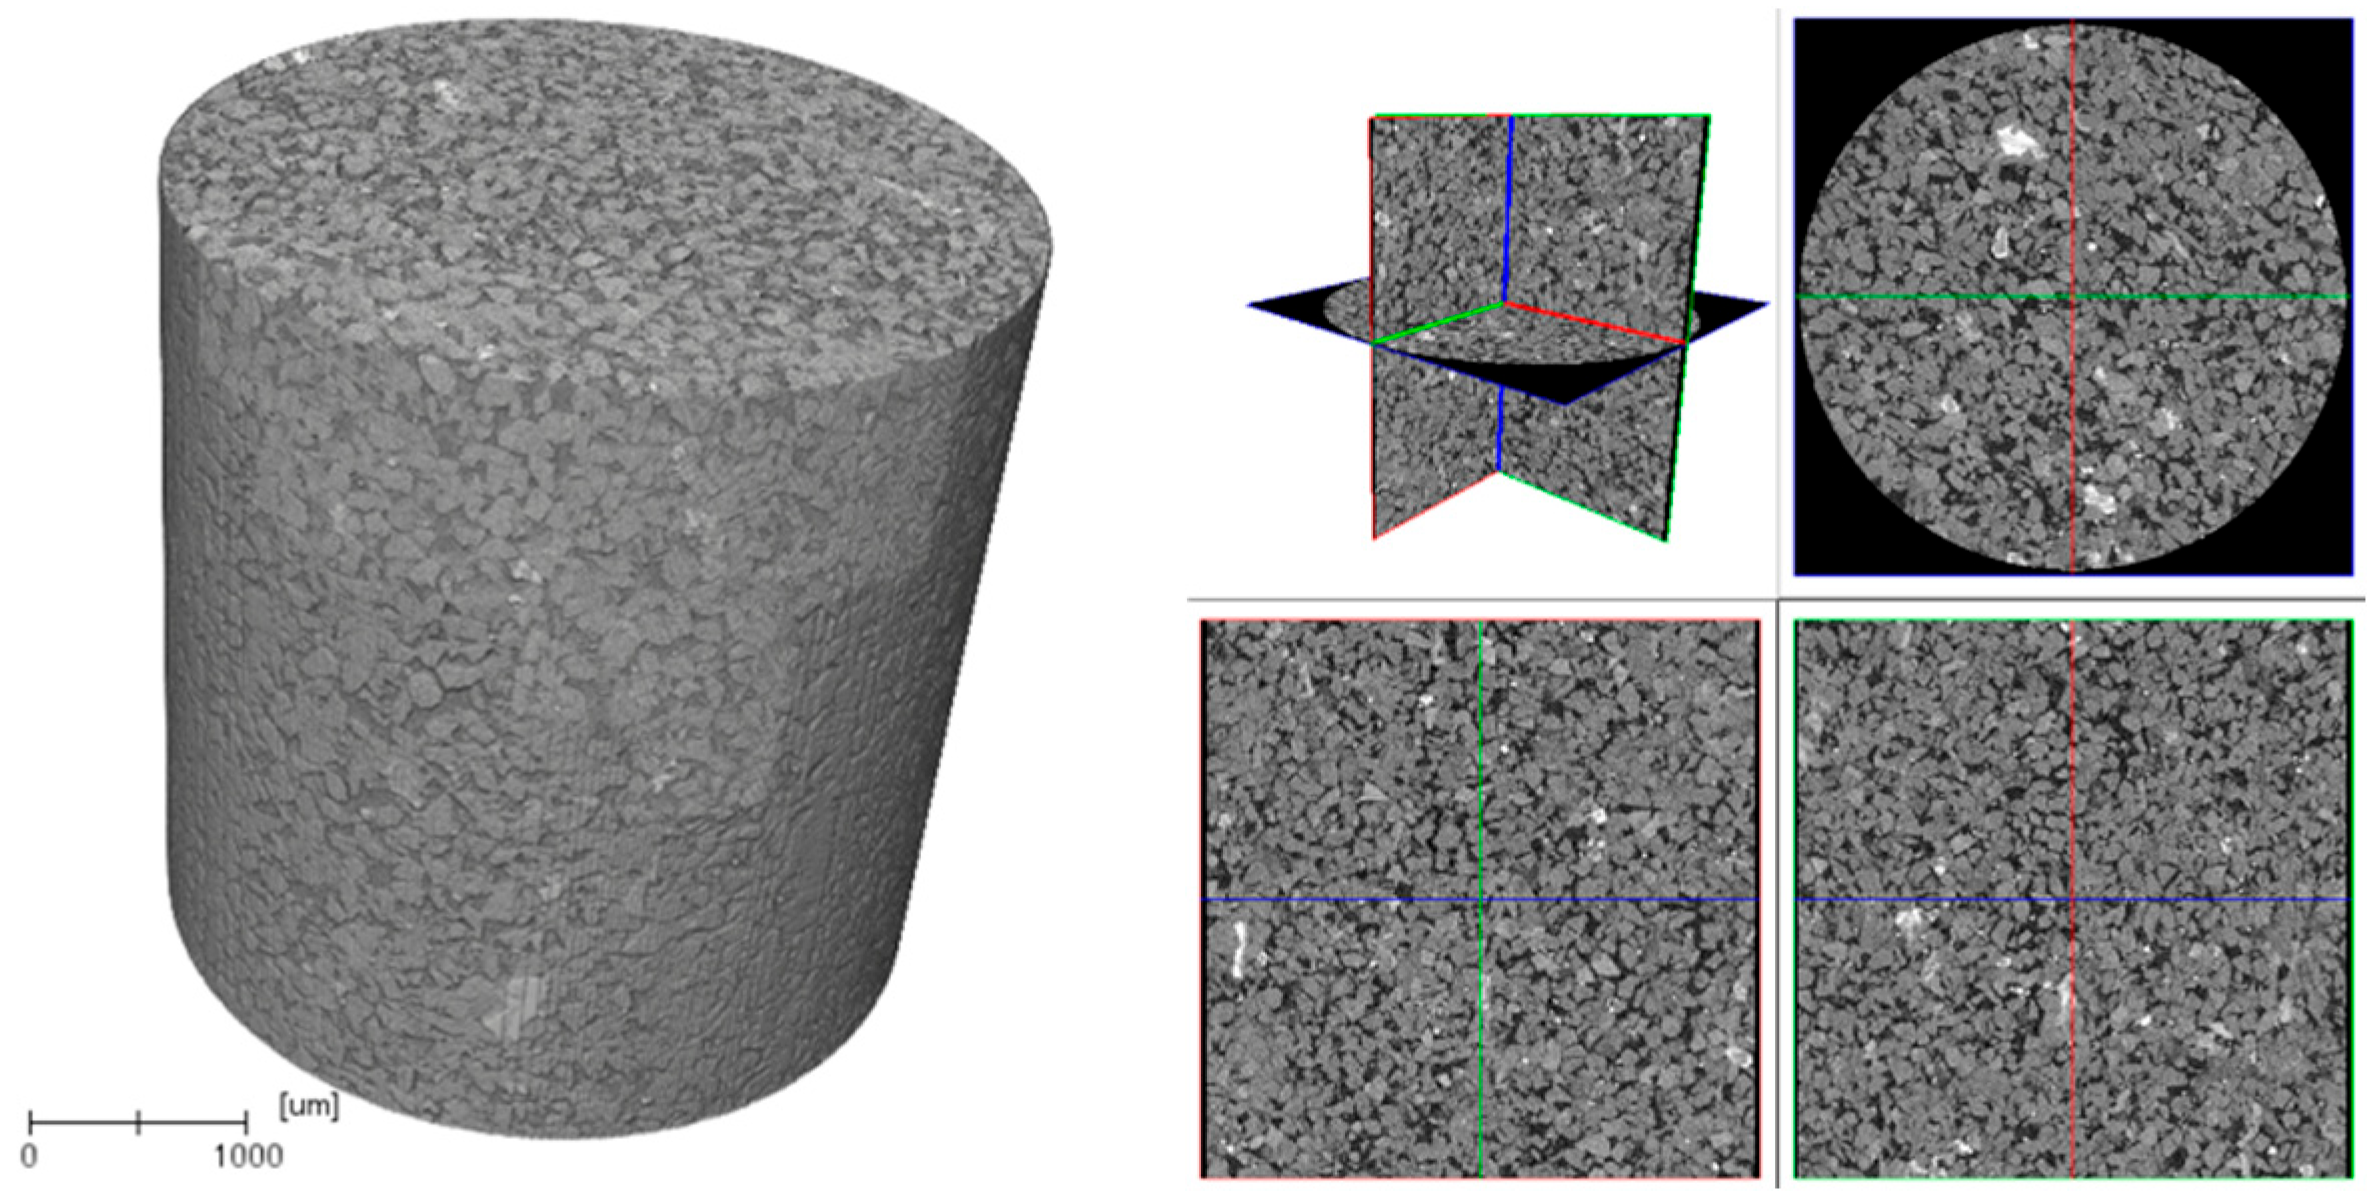
Core W4 was selected for three-dimensional micro-CT scan imaging. During the scanning process, the voltage, current, and exposure time were controlled to achieve good grayscale contrast among the rock matrix, remaining oil and pore space. An appropriate spatial resolution was adopted to clearly visualize the microscopic pore structure within the core. In this experiment, the spatial resolution of the CT scanning is 5 μm. Figure 6 shows the CT grayscale image volume and slice images of core W4, where relatively well-developed intergranular pores and locally thinner throats could be observed. Based on the 3D CT image, a set of representative 2D slices from the central part of the core were selected to construct the pore-throat geometric model. The selected slice should avoid end effects and significant fracture or boundary artifact regions to ensure that the slices reflect the typical characteristics of the internal pore-throat structure of the core.
Figure 6.
CT grayscale images of core W4. The red, green, and blue lines indicate the X-, Y-, and Z-directions, respectively.
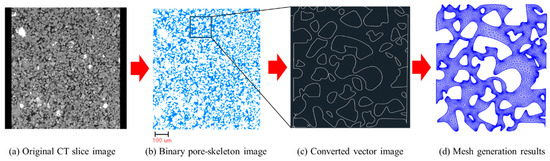
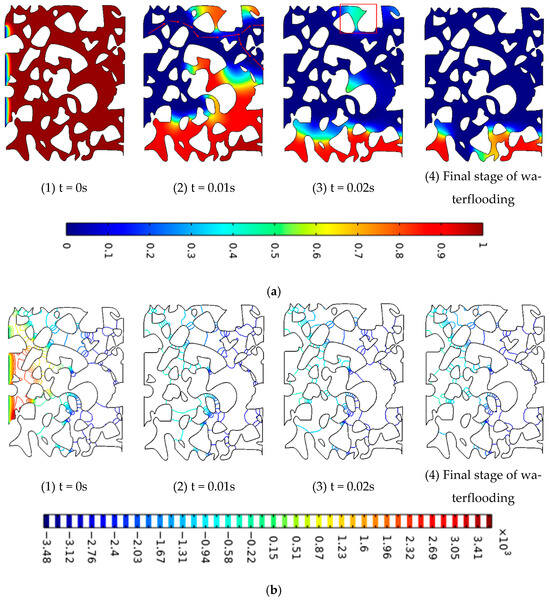
Figure 7a shows the grayscale image selected for constructing the pore-throat geometric model. Firstly, a median filtering algorithm was applied to reduce image noise while maintaining the clarity of pore boundaries. An anisotropic diffusion filtering algorithm was then used to further smooth the rock CT image. Based on the grayscale difference between the rock matrix and pores, the image was segmented into pores and rock skeleton by combining OTSU adaptive thresholding and region-growing methods. Through connectivity analysis and morphological operations, isolated noise points and pseudo-pores were removed, and boundaries were smoothed to ensure pore connectivity [37,38,39]. After completing the above process, a binary pore-skeleton image that accurately reflected the internal pore-throat connectivity of the medium- and high-permeability sandstone was obtained (Figure 7b). Subsequently, a workflow of contour extraction–vectorization–mesh generation was employed to convert the CT slice into a finite element computational domain. The extracted contour lines were then subjected to coordinate calibration and topological inspection, and small unclosed pore regions were removed. Sharp corners and bulges in the model were appropriately smoothed to prevent the generation of singular flow fields at geometric discontinuities during numerical solving. Figure 7c shows the final vectorized result of the selected pore region. Finally, the entire two-dimensional pore space was meshed using Delaunay triangulation, with refinement applied in areas such as pore-throat transition zones, near boundaries, and regions with complex local geometric details to enhance the resolution of velocity and pressure gradients near interfaces. Figure 7d illustrates the established heterogeneous pore-throat geometric model and the meshing result. After multiple rounds of trial calculations and calibration, the consistency between the model and the original CT slice in terms of pore-throat shape and connectivity exceeded 95%.
Figure 7.
Workflow of pore geometry construction and meshing.
3.2. Idealized Pore-Throat Geometric Model
To investigate the influence of structural parameters such as pore diameter, pore-throat ratio, and coordination number on the microscopic mobilization mechanism of the remaining oil, an idealized pore-throat geometric model was constructed, consisting of interconnected approximately circular pores. The geometric parameters of the constructed model could be independently adjusted, with the main structural parameters including: pore diameter (d), pore-throat ratio (β), and coordination number (N). In different sensitivity analyses, the corresponding idealized geometric models were generated by varying the values of these parameters. The model shown in Figure 8a was designed to investigate the influence of pore diameter (d) on the remaining oil mobilization mechanism and oil displacement efficiency. In this model, the overall pore diameter could be varied to 15, 50, 75, 100 and 150 μm, while all other parameters remained unchanged. Figure 8b and Figure 8c respectively show the idealized pore-throat geometric models for β = 20 and β = 5. Figure 8d and Figure 8e respectively present the idealized pore-throat geometric models for coordination numbers N = 5 and N = 3.
Figure 8.
Idealized pore-throat geometric models. (a) Model for pore diameter influence; (b) β = 20; (c) β = 5; (d) N = 5; (e) N = 3. Red indicates oil and blue indicates water.
All geometric models in this study were discretized using a high-precision Delaunay triangular meshing method. For each case, the total number of mesh elements exceeded 1 × 10⁵, and local mesh refinement was applied in narrow pore-throat constrictions and near the inlet. In this study, it was ensured that the narrowest section of each throat was covered by at least 10–20 mesh cells, so that the pressure field and interfacial evolution in this region could be captured.
4. Mathematical Model and Simulation Scheme
4.1. Pore-Scale Oil–Water Two-Phase Flow Equations
The Navier–Stokes equations are adopted to describe the changes in mass and momentum of oil and water two-phase fluids within the pores. In this mathematical model, the oil and water phases are assumed to be incompressible Newtonian fluids. The effects of capillary forces and wettability are characterized through an interfacial force term. The governing flow equations are given by Equations (2) and (3).
where u represents the velocity vector, p denotes pressure, ρ and μ are the fluid density and viscosity, respectively, and fc is the equivalent capillary pressure term resulting from interfacial tension and interface curvature. The classic pressure difference–curvature relationship was satisfied at the oil–water interface:
where σ represents the oil–water interfacial tension, and κ denotes the principal curvature of the interface. Different wettability conditions are characterized by assigning a specific contact angle θ at the solid walls.
Equation (5) is the Cahn–Hilliard equation, which describes the evolution of the phase interface during oil–water flow. This equation accurately captures the dynamic evolution of the phase interface during two-phase flow and is coupled with the Navier–Stokes equations through the interfacial tension term.
where ϕ is the phase-field variable, with values of ±1 representing the two immiscible fluid phases, and values between −1 and 1 indicating the phase interface, εpf is the interface thickness, γ is the interfacial mobility, λ is the mixing energy density, f represents the external force per unit volume of fluid, ρα is the density of phase α, Cα is the concentration of phase α, with α = 1, 2.
The above constitutes the mathematical model for microscopic oil–water two-phase flow. By employing numerical discretization and the finite element method, the model is solved to obtain the pressure and saturation distributions during the waterflooding process. For each case, the iterative residual tolerance in the solution process was set to converge below 1 × 10⁻⁶, indicating stable convergence of the numerical solution.
The phase-field method combined with the Navier–Stokes equations is widely used to track interfacial evolution in pore-scale two-phase flow studies. This model has been well validated in the authors’ previous studies [20,40] and in other studies [41,42]. The correctness of this approach has been verified by comparison with experimental observations and by fitting to analytical solutions.
4.2. Design of Microscopic Waterflooding Flow Simulation Scheme
The base-case simulation parameters were set to match those of the variable-rate waterflooding experiments. Specifically, the water phase density is set at 1 g/cm3, viscosity at 1.04 mPa·s, and salinity at 80,000 mg/L. The crude oil density is set at 0.8 g/cm3, and viscosity at 8.13 mPa·s. The water phase entered from the left inlet of the model at a fixed injection rate of 0.01 mL/min; the right side of the model is designated as a free outlet. A base case with an inlet rate of 0.01 mL/min was first considered, and the inlet rate was then varied to 0.001, 0.01, 0.1 and 0.2 mL/min to examine the influence of displacement rate on remaining oil mobilization.
The four parameters—contact angle θ, oil viscosity μ, inlet displacement rate v, and oil–water interfacial tension σ—are the most commonly varying and controllable factors in field waterflooding operations. Therefore, these four factors were selected to investigate how displacement conditions affect remaining oil mobilization. The displacement rate covers the optimal rate identified by the aforementioned experiments; the contact angles span the range from water-wet to intermediate-wet; and the viscosity and interfacial tension values were taken from measured experimental data or typical ranges for similar oil–water systems. On this basis, an L9(34) orthogonal experimental design was constructed. The specific values for each factor are as follows: contact angle (θ) is set at 60°, 90°, and 120°; crude oil viscosity (μ) is set at 5, 8, and 20 mPa·s; inlet velocity (vin) is set at 0.001, 0.01, and 0.1 mL/min; and interfacial tension (σ) is set at 1, 5, and 10 mN/m. The orthogonal experimental design scheme is presented in Table 3.
Table 3.
Orthogonal experimental design scheme.
5. Mechanism of Remaining Oil Mobilization
This section systematically analyzes the kinetic mechanism of remaining oil mobilization under variable-rate waterflooding and its controlling effect on Eod from pore-scale flow characteristics, displacement conditions, physical property parameters and influence of pore structure parameters.
5.1. Microscopic Mobilization Mechanism of Remaining Oil
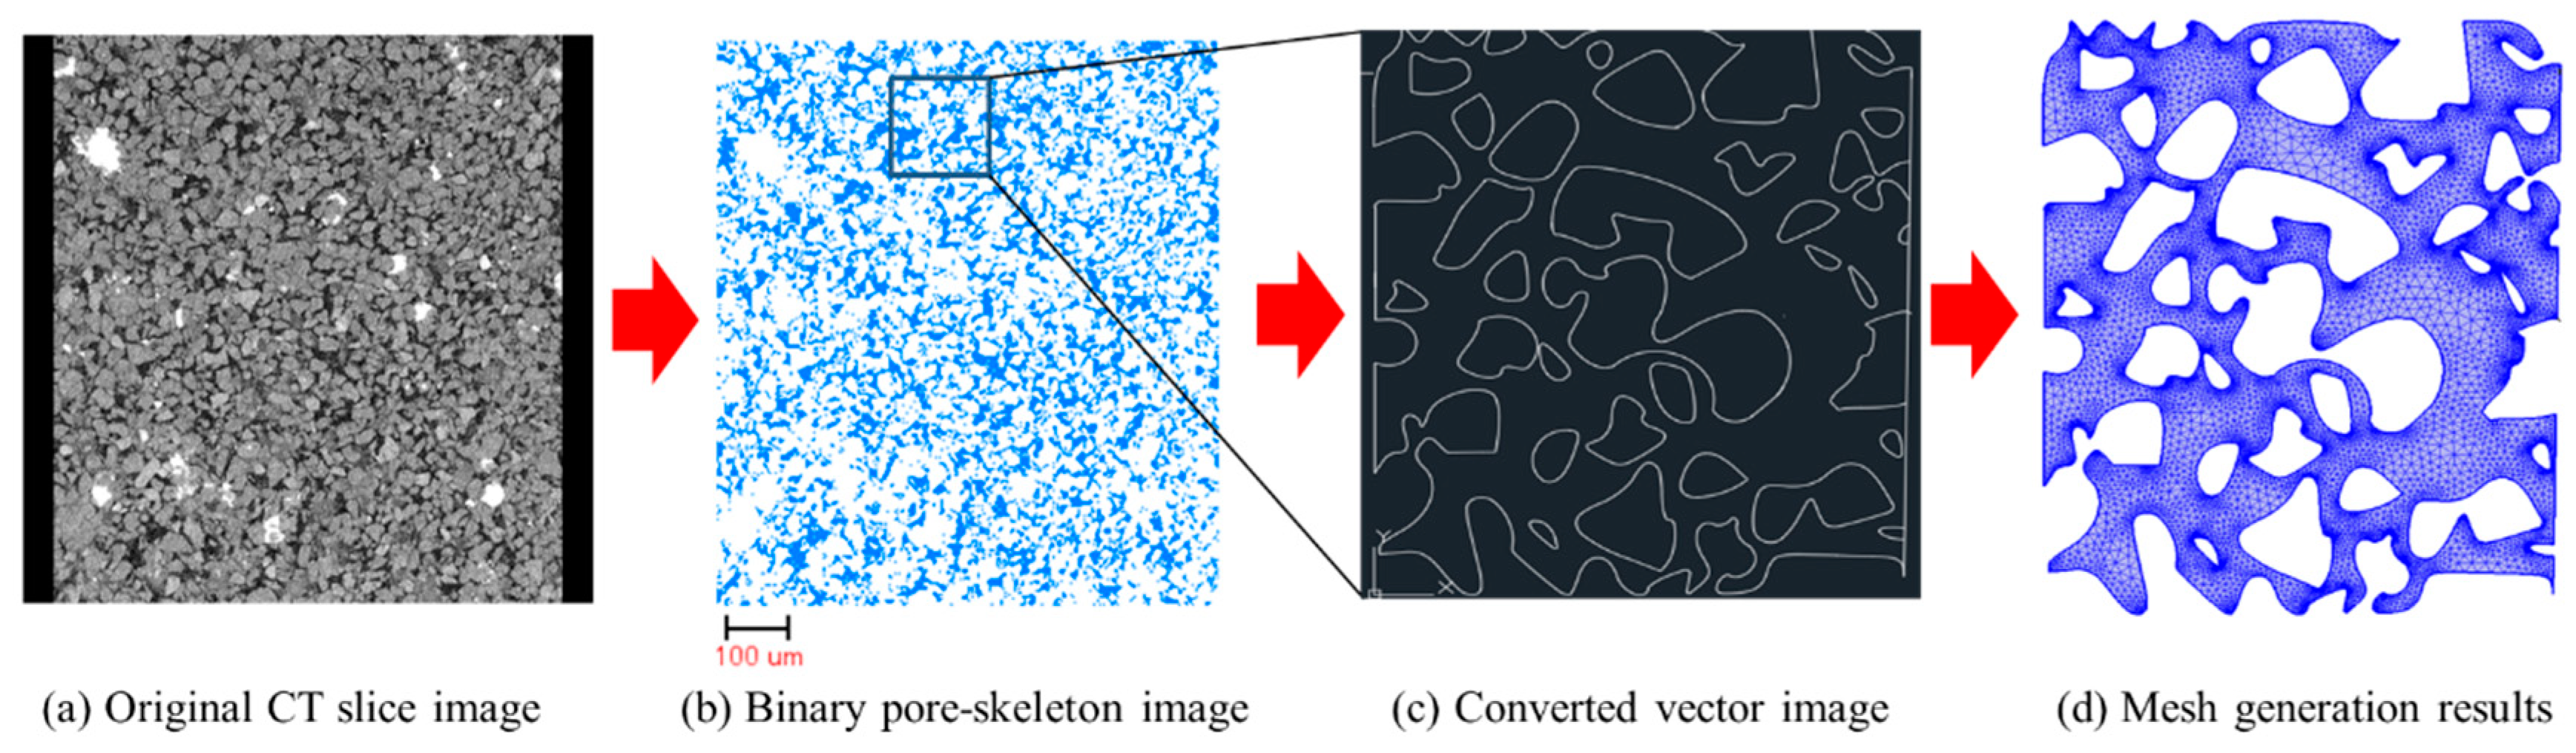
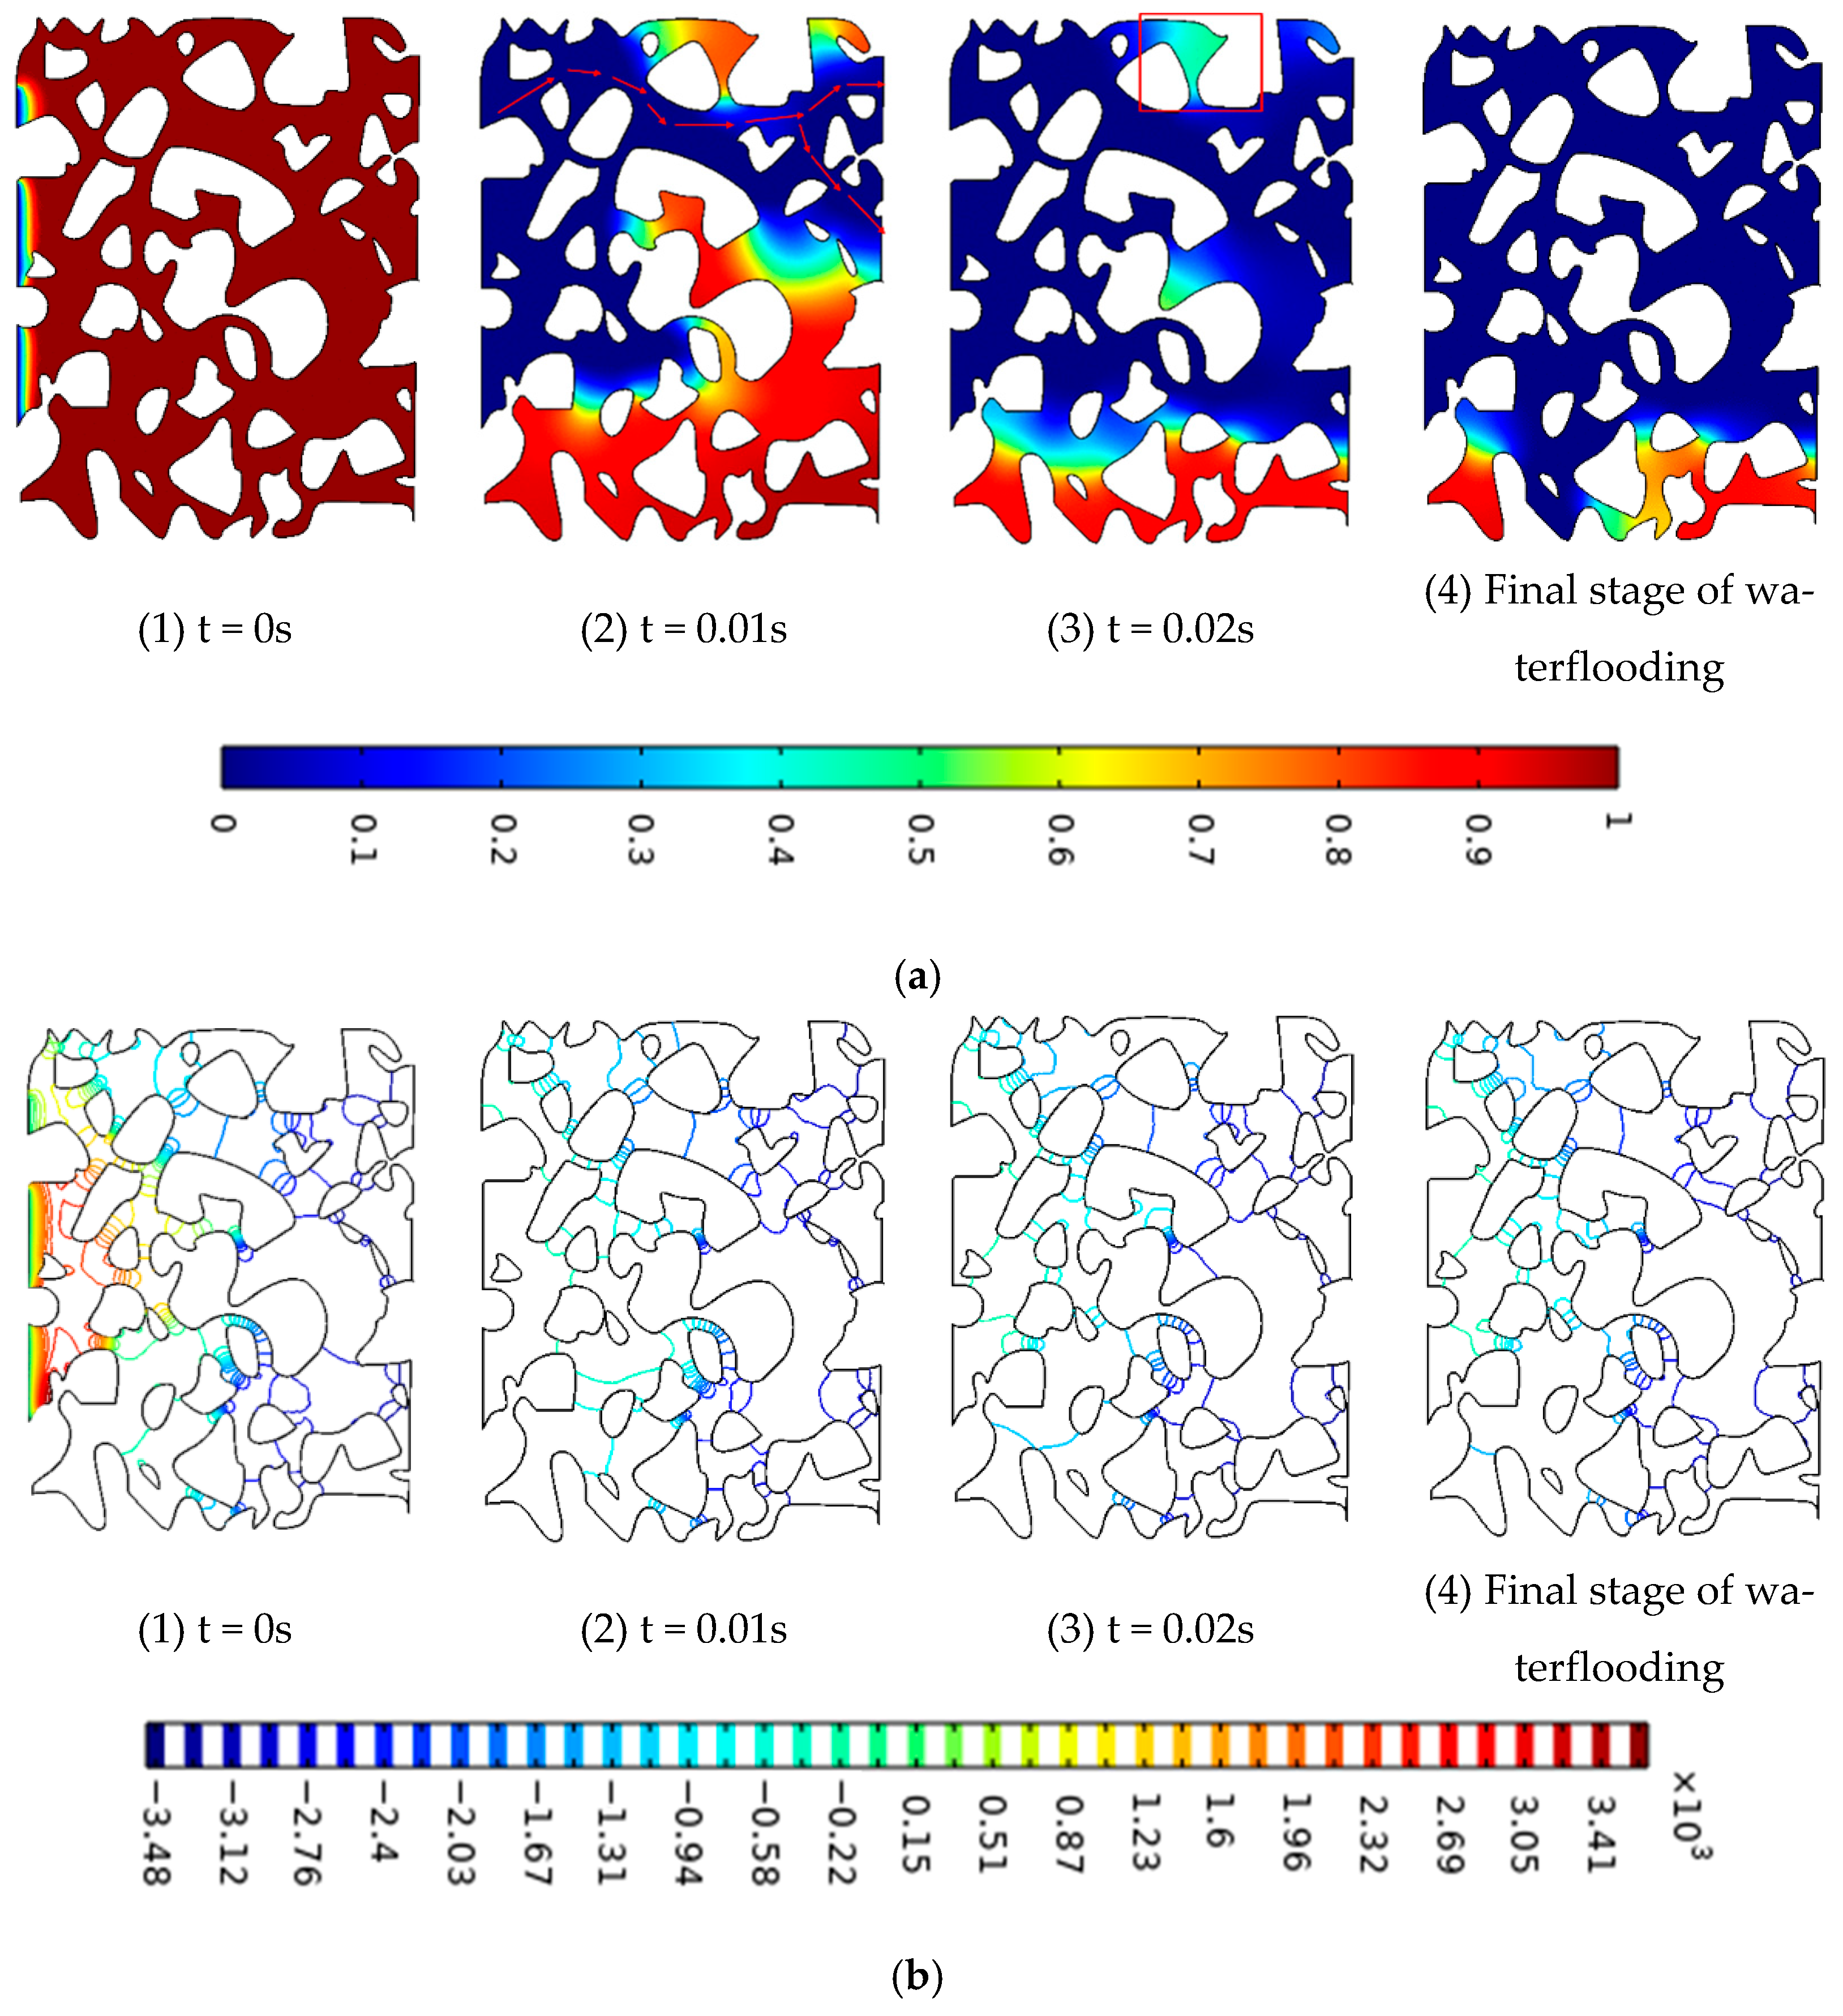
Figure 9 shows the temporal variation in oil–water saturation distribution under a heterogeneous pore-throat model. It was observed that after entering from the inlet, water phase first fingered along pores with good connectivity and large diameter, and rapidly established preferential flow channels (direction of red arrows in Figure 9a), leading to the trapping of the remaining oil in dead ends and the occurrence of bypass flow between pores. With the continuous injection of the water phase, the remaining oil in large pores was displaced under the pressure difference (in the red-boxed region in the third snapshot of Figure 9a), and the crude oil utilization degree was improved. In the lower part of the model, due to the small pore size and numerous dead ends, the displacement pressure difference could not effectively overcome the capillary pressure, resulting in high remaining oil saturation in these pores after waterflooding, forming a typical residual oil enrichment zone.
Figure 9.
Saturation and pressure distribution in heterogeneous pore-throat model. (a) Oil–water saturation distribution; (b) pressure distribution/Pa.
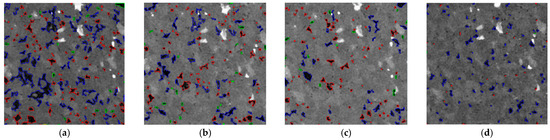
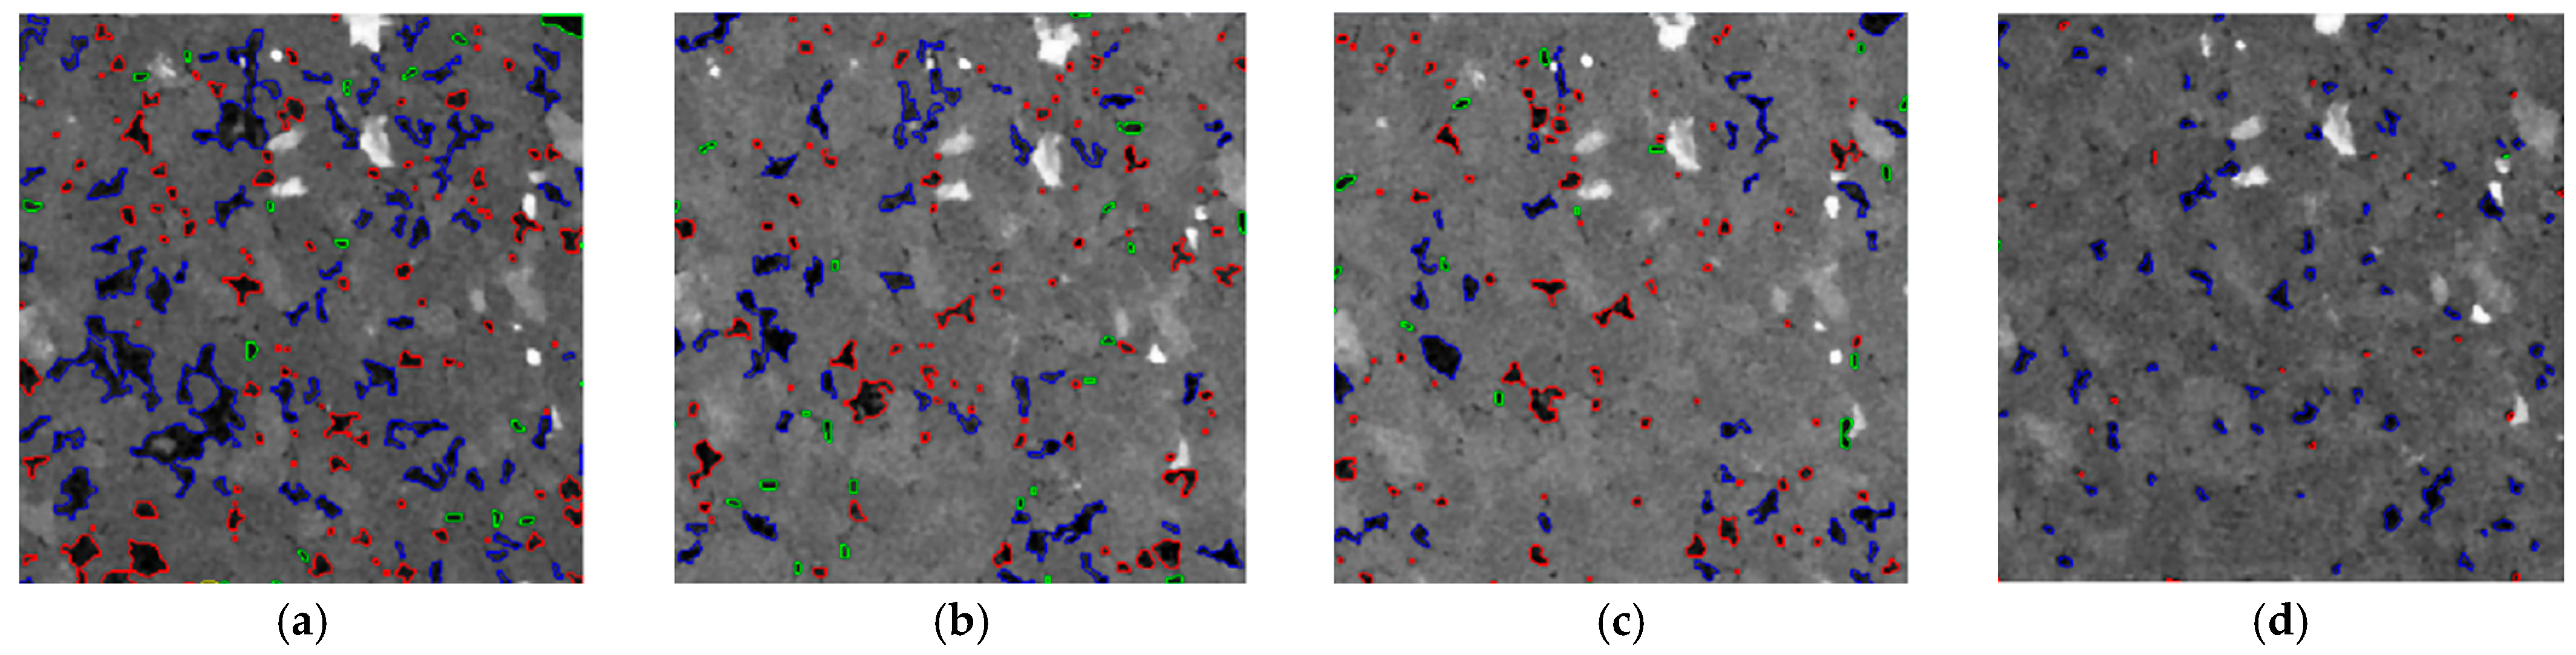
To verify the pore-scale evolution of remaining oil obtained from the above simulations, one core (W4) was selected for in situ micro-focus CT scanning, and CT slice images showing the evolution of remaining oil distribution at different waterflooding stages were obtained, as shown in Figure 10. Using image-processing methods, the remaining oil was classified into three categories according to its morphology: connected oil (marked in blue), ganglion oil (marked in red), and micro-droplets (marked in green). It can be seen that, as waterflooding proceeds, the remaining oil in large pores continuously decreases and is segmented by the injected water into isolated oil droplets. At the end of waterflooding, a portion of remaining oil in dead-end pores is still not sufficiently mobilized. This is consistent with the conclusions derived from the above simulations.
Figure 10.
CT slice images under different waterflooding stages. (a) Initial stage; (b) 0.5 PV; (c) 5 PV; (d) 20 PV. Blue indicates connected oil, red indicates ganglion oil and green indicates micro-droplets.
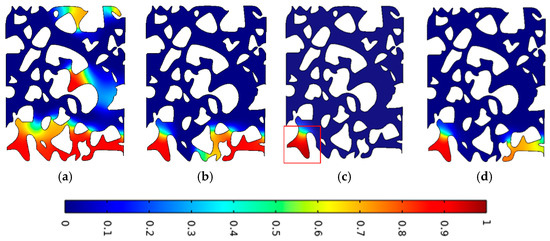
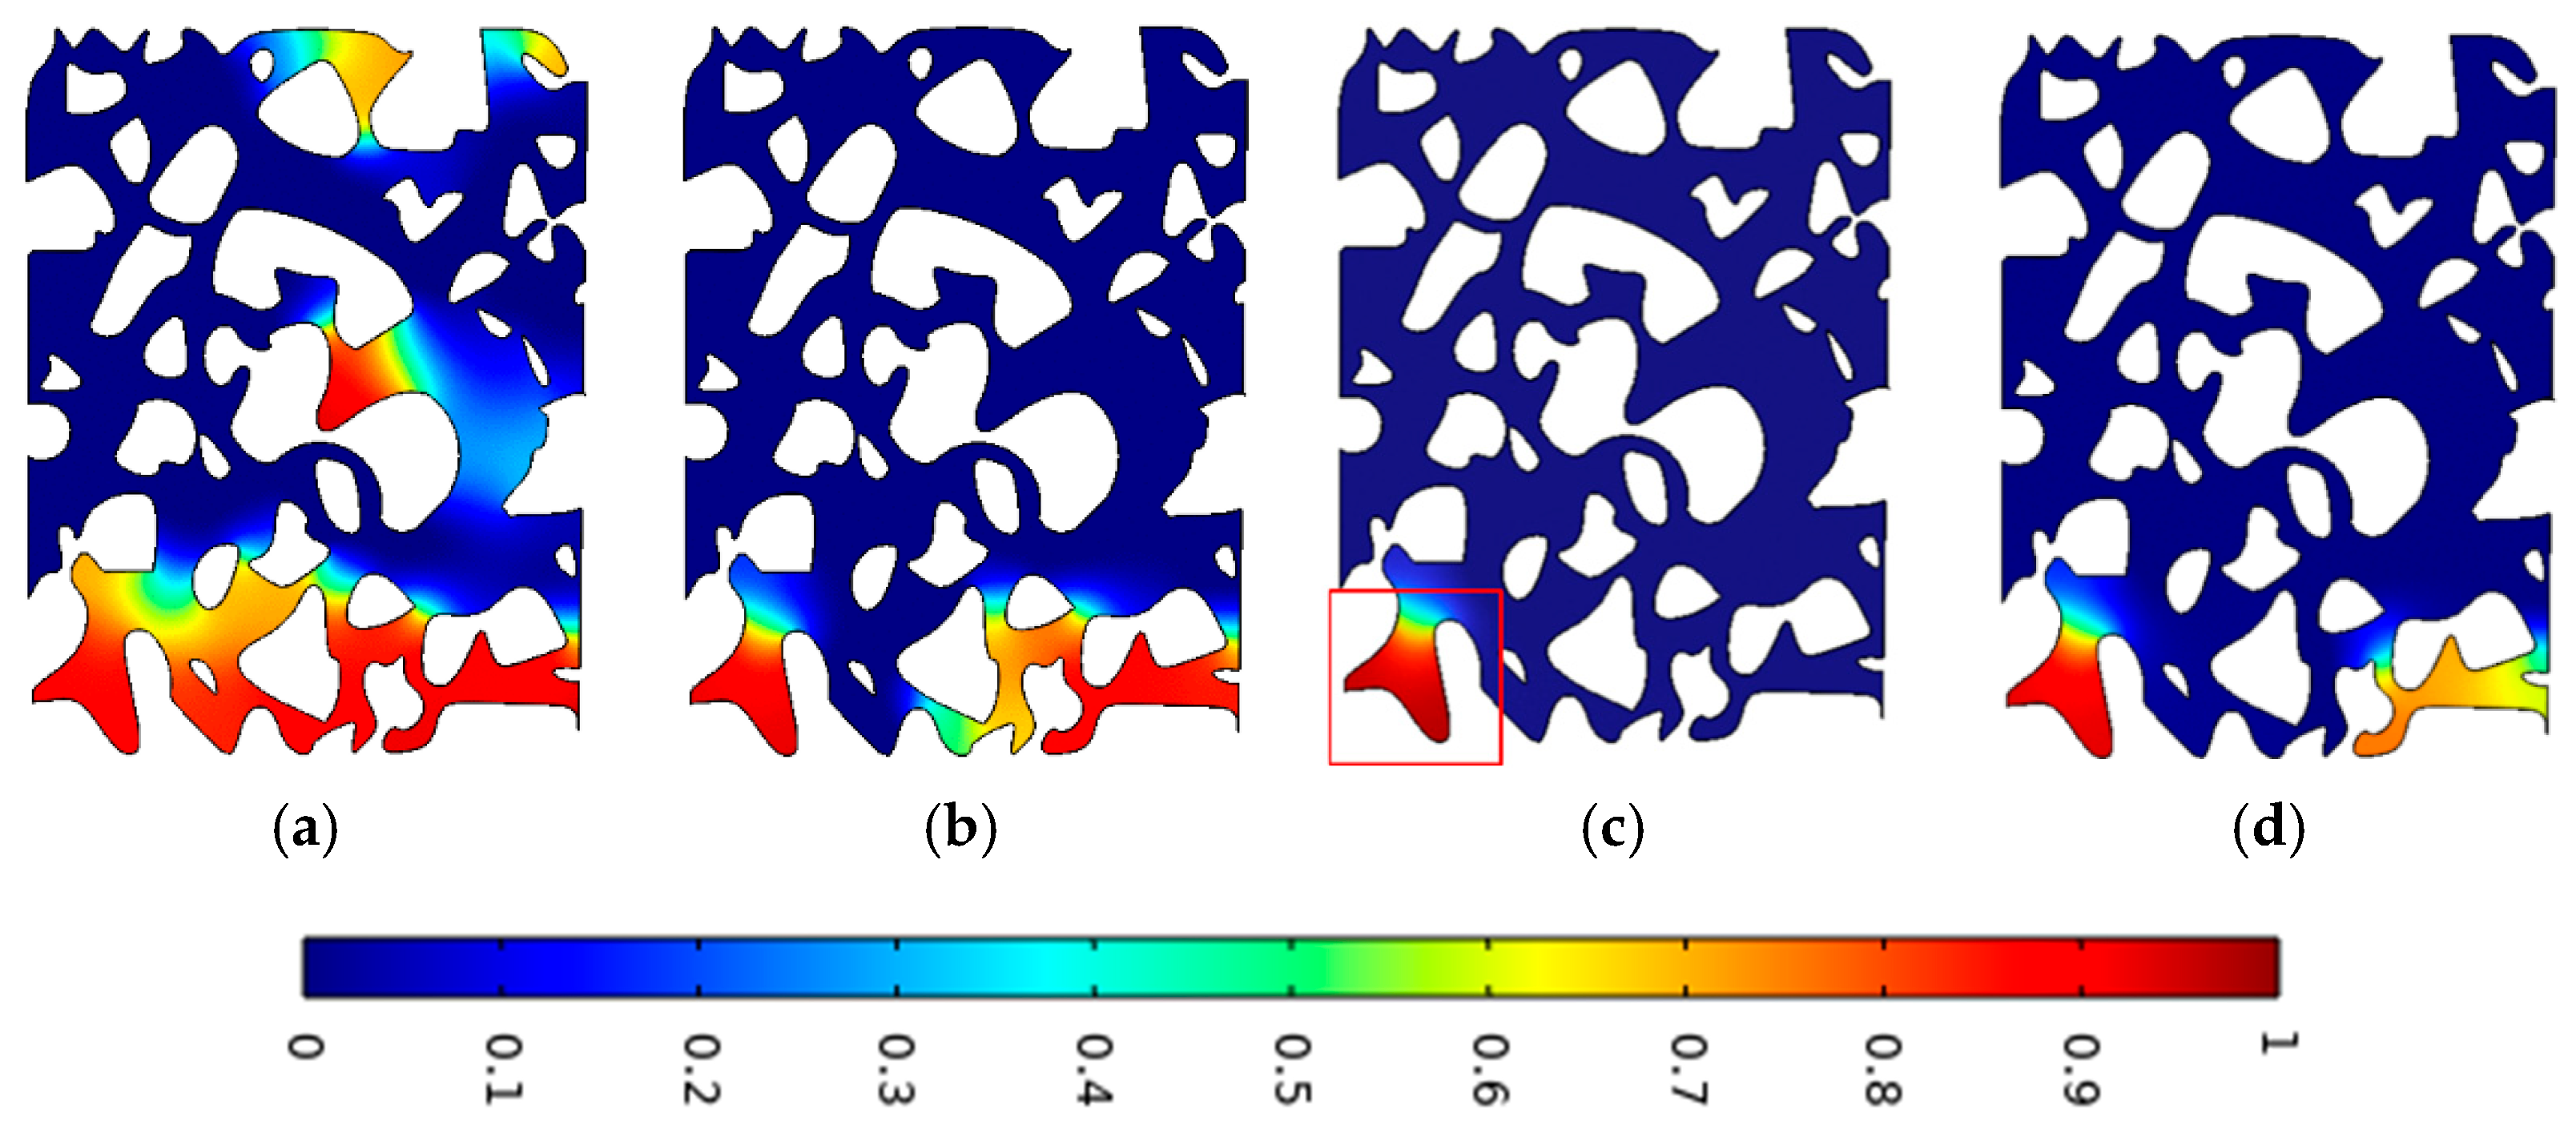
The evolution of oil–water saturation and the final Eod under different displacement rates were investigated by varying the inlet injection rate vin. Figure 11 shows the final oil–water saturation distribution under different injection rates. The results indicate that when other parameters were kept constant, a moderate increase in displacement rate could significantly improve Eod. As the displacement rate increased, the average pressure difference between the inlet and outlet increased. Part of the remaining oil overcame the capillary resistance and was displaced out of the pores under the action of the pressure difference, ultimately leading to a significant decrease in residual oil saturation. However, some remaining oil in blind pores was still not displaced (inside the red box in Figure 11c). It was analyzed that this part of the remaining oil had large capillary resistance due to the small size of the throats. Nevertheless, it could be gradually displaced out of the dead pores by reducing the interfacial tension to decrease the interfacial energy. When the displacement pressure difference was excessively large, the water phase would break through rapidly to form preferential flow channels, resulting in the untimely mobilization of part of the remaining oil. Therefore, excessively high displacement rates would cause channeling, ultimately leading to a decrease in Eod. Hence, there existed an optimal displacement rate during waterflooding to maximize the final Eod.
Figure 11.
Influence of displacement rate on final Eod. (a) 0.001 mL/min, E = 44.75%; (b) 0.01 mL/min, E = 45.71%; (c) 0.1 mL/min, E = 71.40%; (d) 0.2 mL/min, E = 68.64%.
5.2. Influence of Displacement Conditions
Based on the designed orthogonal experiments, the final Eod under each scheme was statistically analyzed, and the average value of Eod was calculated by repeating the experiment three times. Table 4 shows the results of the orthogonal experiments. It can be observed that the displacement rate has a significant impact on the final Eod, which increases markedly as the displacement rate increases. The change in wettability causes the variation in capillary pressure during the process. As contact angle increases, the capillary pressure decreases and the displacement driving force weakens, thus leading to a corresponding decrease in the final Eod. When the crude oil viscosity increases from 5 to 20 mPa·s, Eod decreases by only 5~8%, indicating that viscosity has a minor impact on the mobilization of remaining oil at the pore-scale, and only a significant increase in viscosity exerts a substantial influence on the waterflooding process. In this experiment, interfacial tension only altered the detailed morphology of the remaining oil, while the final Eod did not change significantly. Therefore, the final Eod is not sensitive to interfacial tension.
Table 4.
Data Table of Orthogonal Experiment Results.
The orthogonal results were analyzed using the mean response K at each level and the range R method. Here, K1, K2, and K3 represent the Eod corresponding to a given factor at levels 1, 2, and 3, respectively. The range is defined as R = max(Ki) − min(Ki), which is used to characterize the magnitude of the effect of this factor on Eod; a larger R indicates stronger sensitivity. The K1–K3 values, range R, normalized weights, and influence ranking of each factor are summarized in Table 5. It can be seen that the influence of the four factors on Eod decreases in the following order: displacement rate v (R = 23.89%, weight 46.3%) > contact angle θ (R = 15.74%, weight 30.5%) > oil viscosity μ (R = 7.68%, weight 14.9%) > interfacial tension σ (R = 4.30%, weight 8.3%). This indicates that displacement rate is the primary factor controlling the Eod of medium- and high-permeability cores, followed by rock wettability. The effects of oil viscosity and interfacial tension are relatively weaker.
Table 5.
Sensitivity analysis results of the orthogonal experiment.
5.3. Influence of Pore Structure
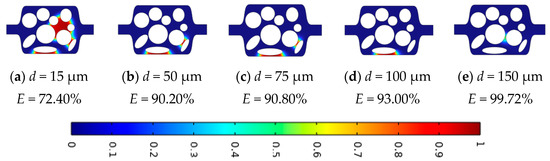
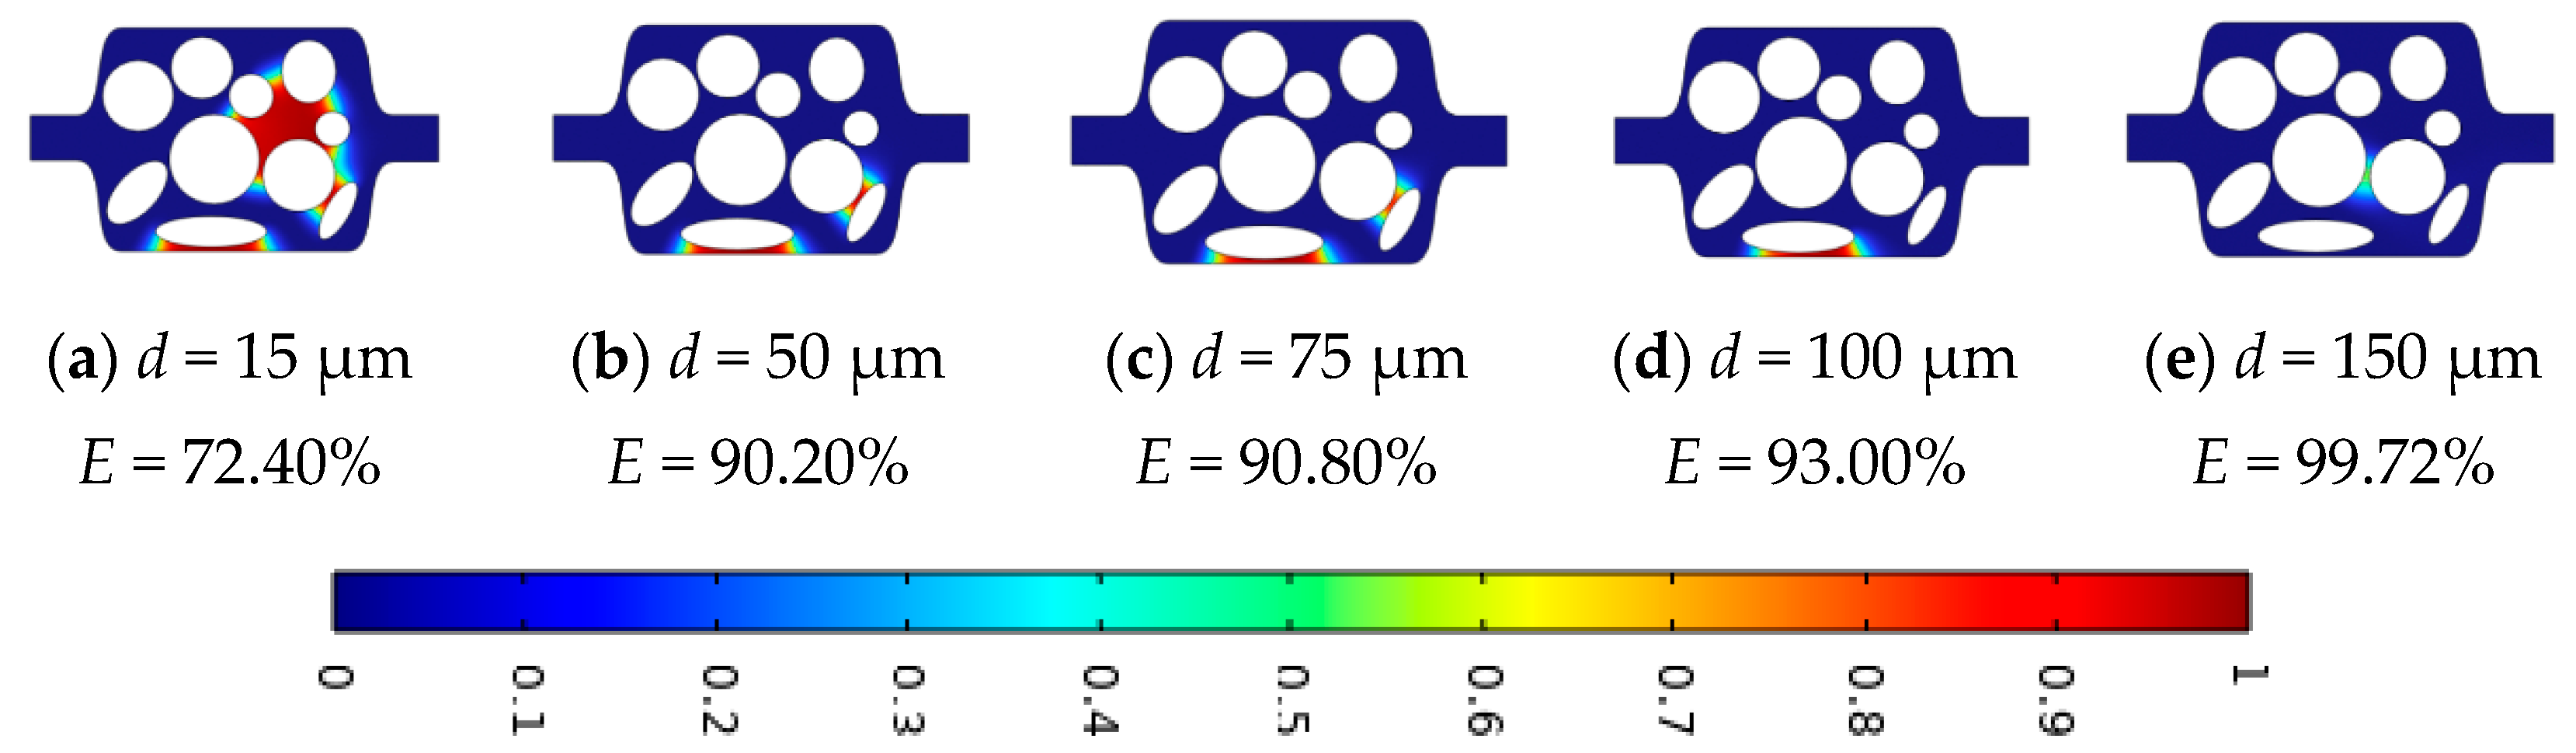
The pore diameter was varied to 15, 50, 75, 100 and 150 μm, and Figure 12 shows the final oil–water saturation distribution and Eod under different pore diameters. The results indicate that, as the pore diameter increased, the throat capillary pressure gradually decreased, and the water phase could more easily overcome the capillary pressure to achieve oil–water displacement, with the final Eod increased from 72.4% to 99.7%. More remaining oil was retained when the pore diameter was small; whereas a larger pore diameter made the oil more easily displaced out of the pores, leaving only a small amount of remaining oil distributed along the rock wall.
Figure 12.
Comparison of final oil-water saturation fields under different pore diameters.
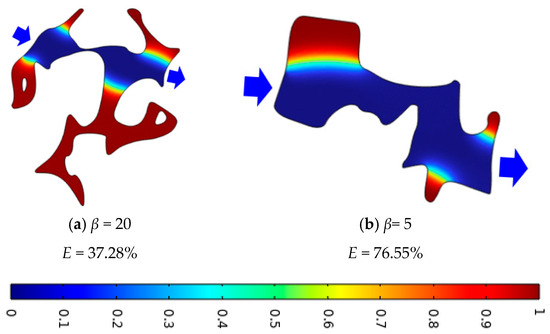
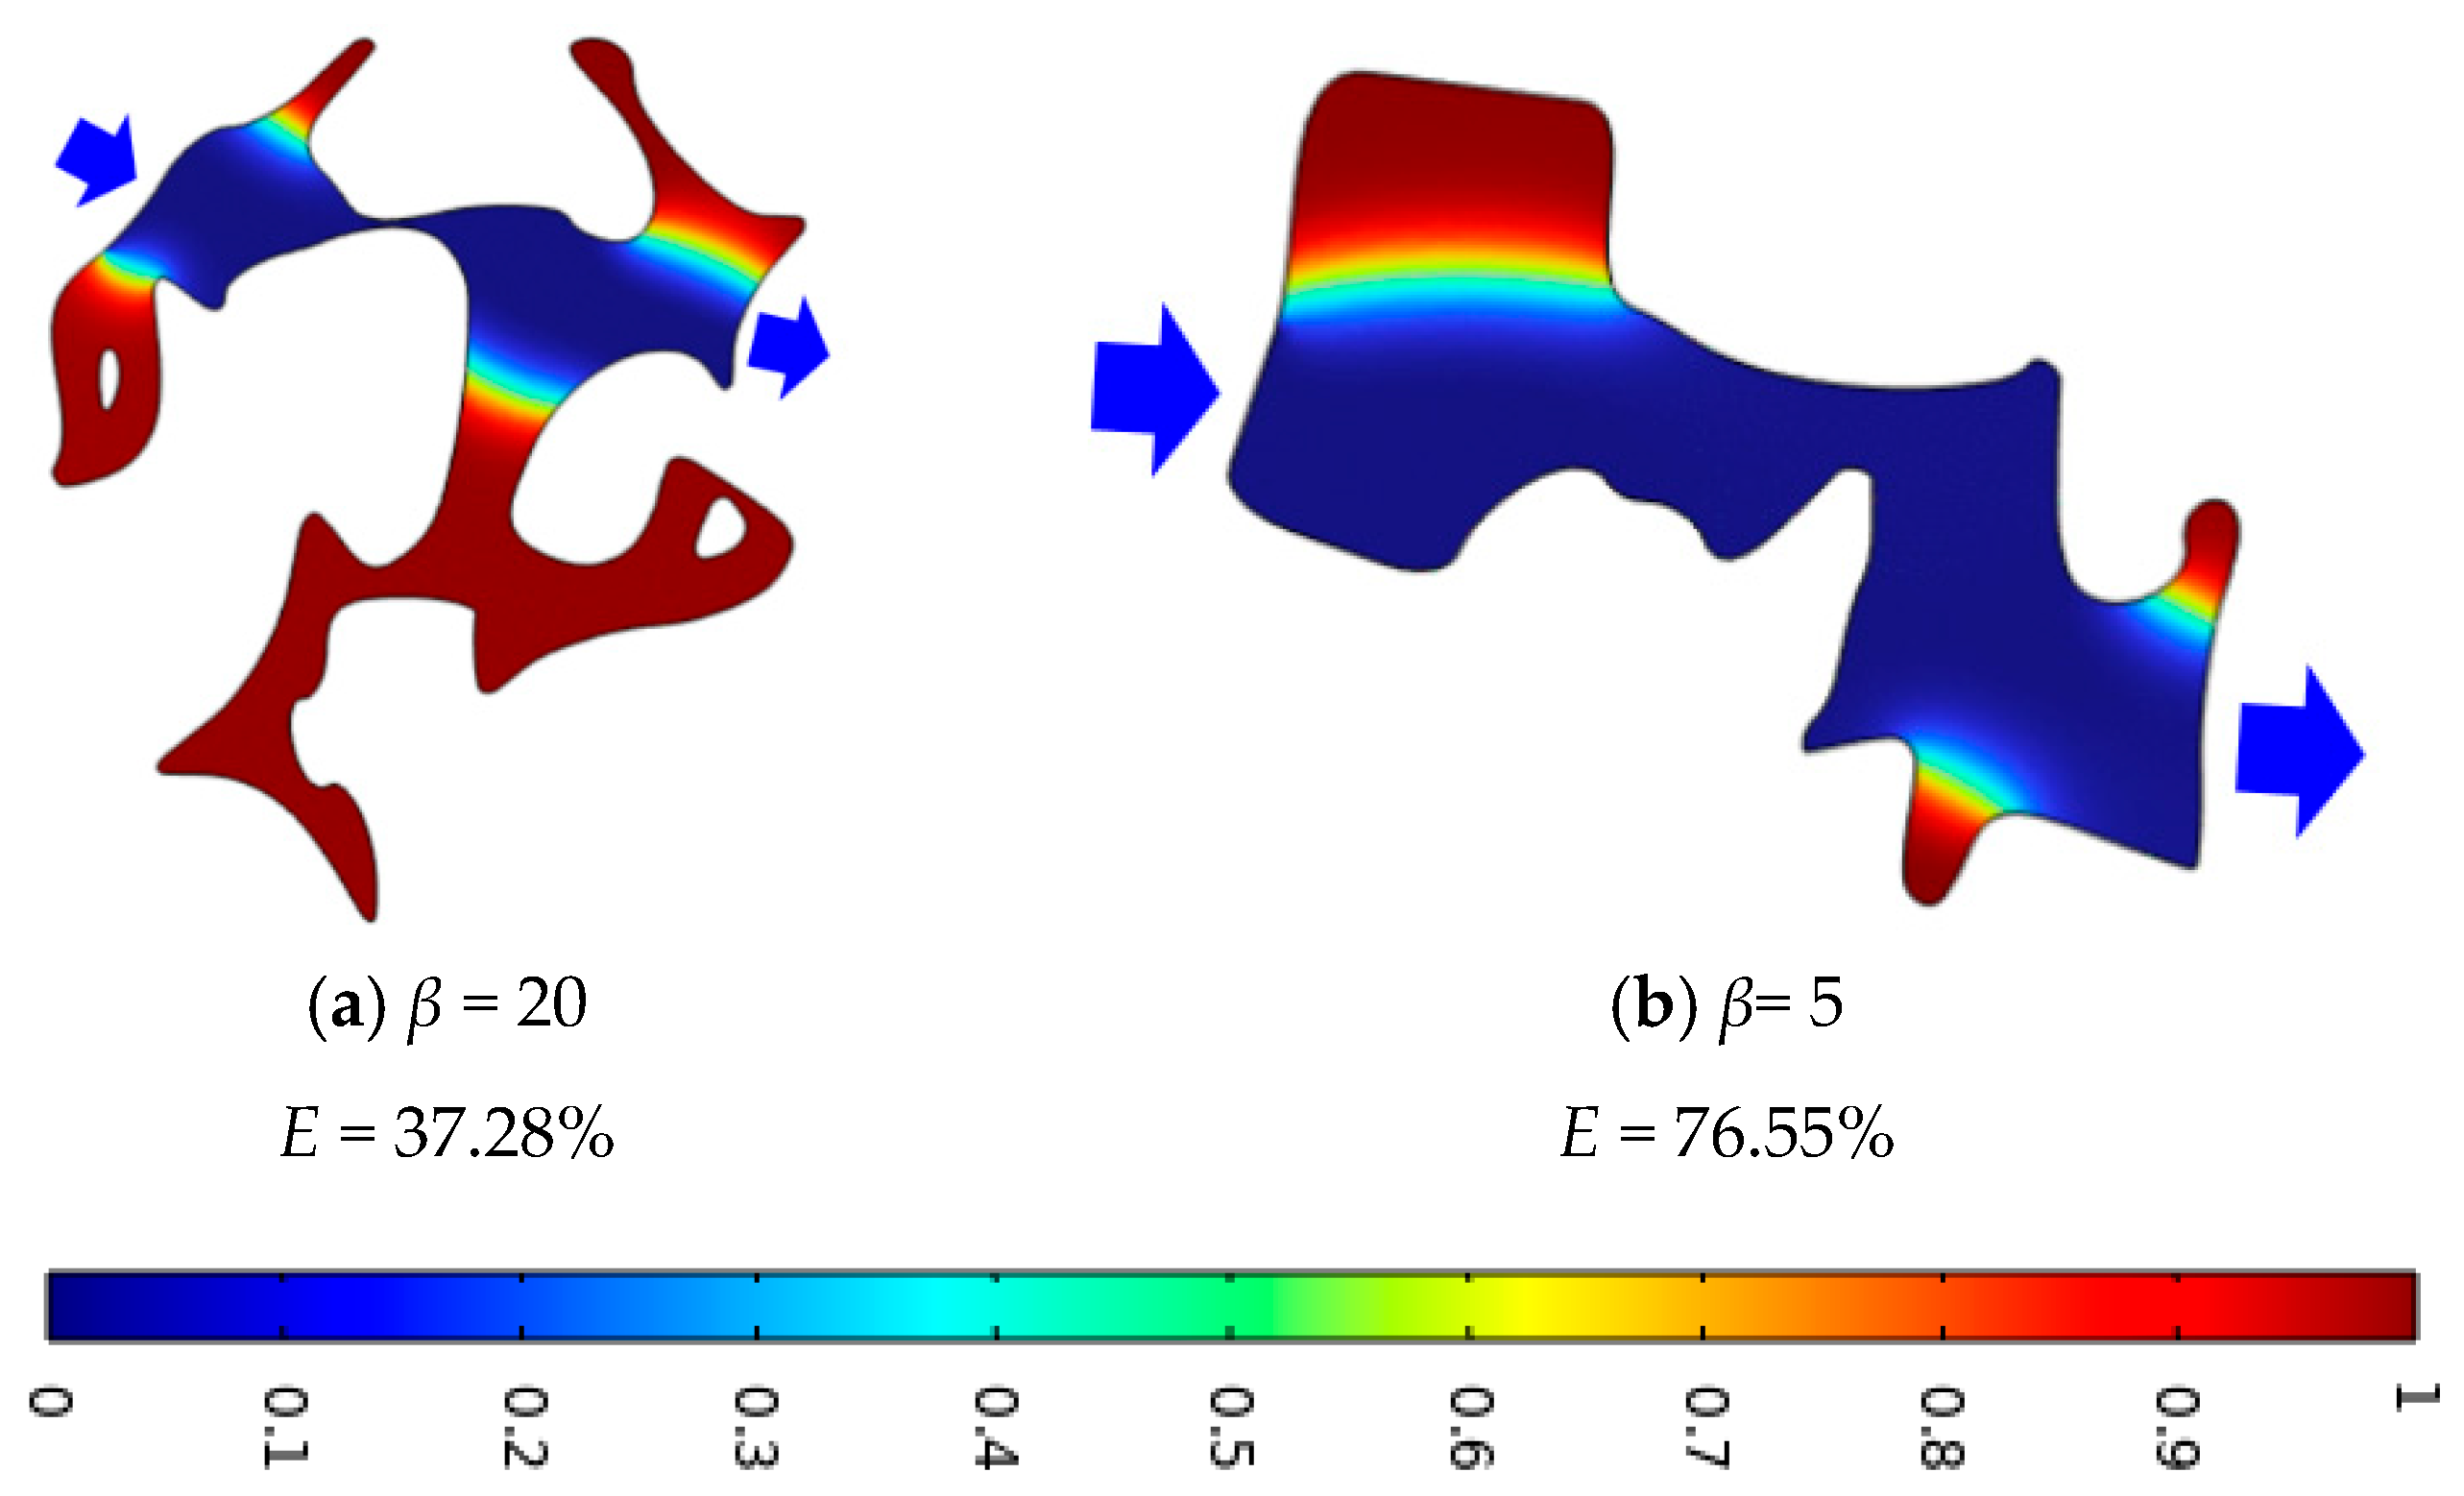
Figure 13 shows the final oil–water saturation distribution under different pore-throat ratios. Numerical results indicate that the larger the β, the greater the pressure difference and capillary resistance of the throat, and the more likely it was to form high oil enrichment zones on both sides of inlet and outlet. When β = 20, although the water phase broke through along the preferential flow channel, a large amount of remaining oil was still retained in large pores and dead ends, with an Eod of only 37.28%; when β decreased to 5, the transition from pores to throats was smoother, the capillary resistance was significantly reduced, and the oil phase was more easily displaced out, leaving only a small amount of remaining oil in the end, with the Eod increased to 76.55%.
Figure 13.
Final oil saturation distribution under different pore-throat ratios. The arrows indicate the inlet and outlet directions of water flow.
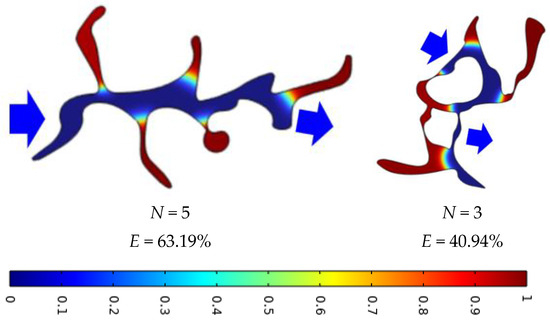
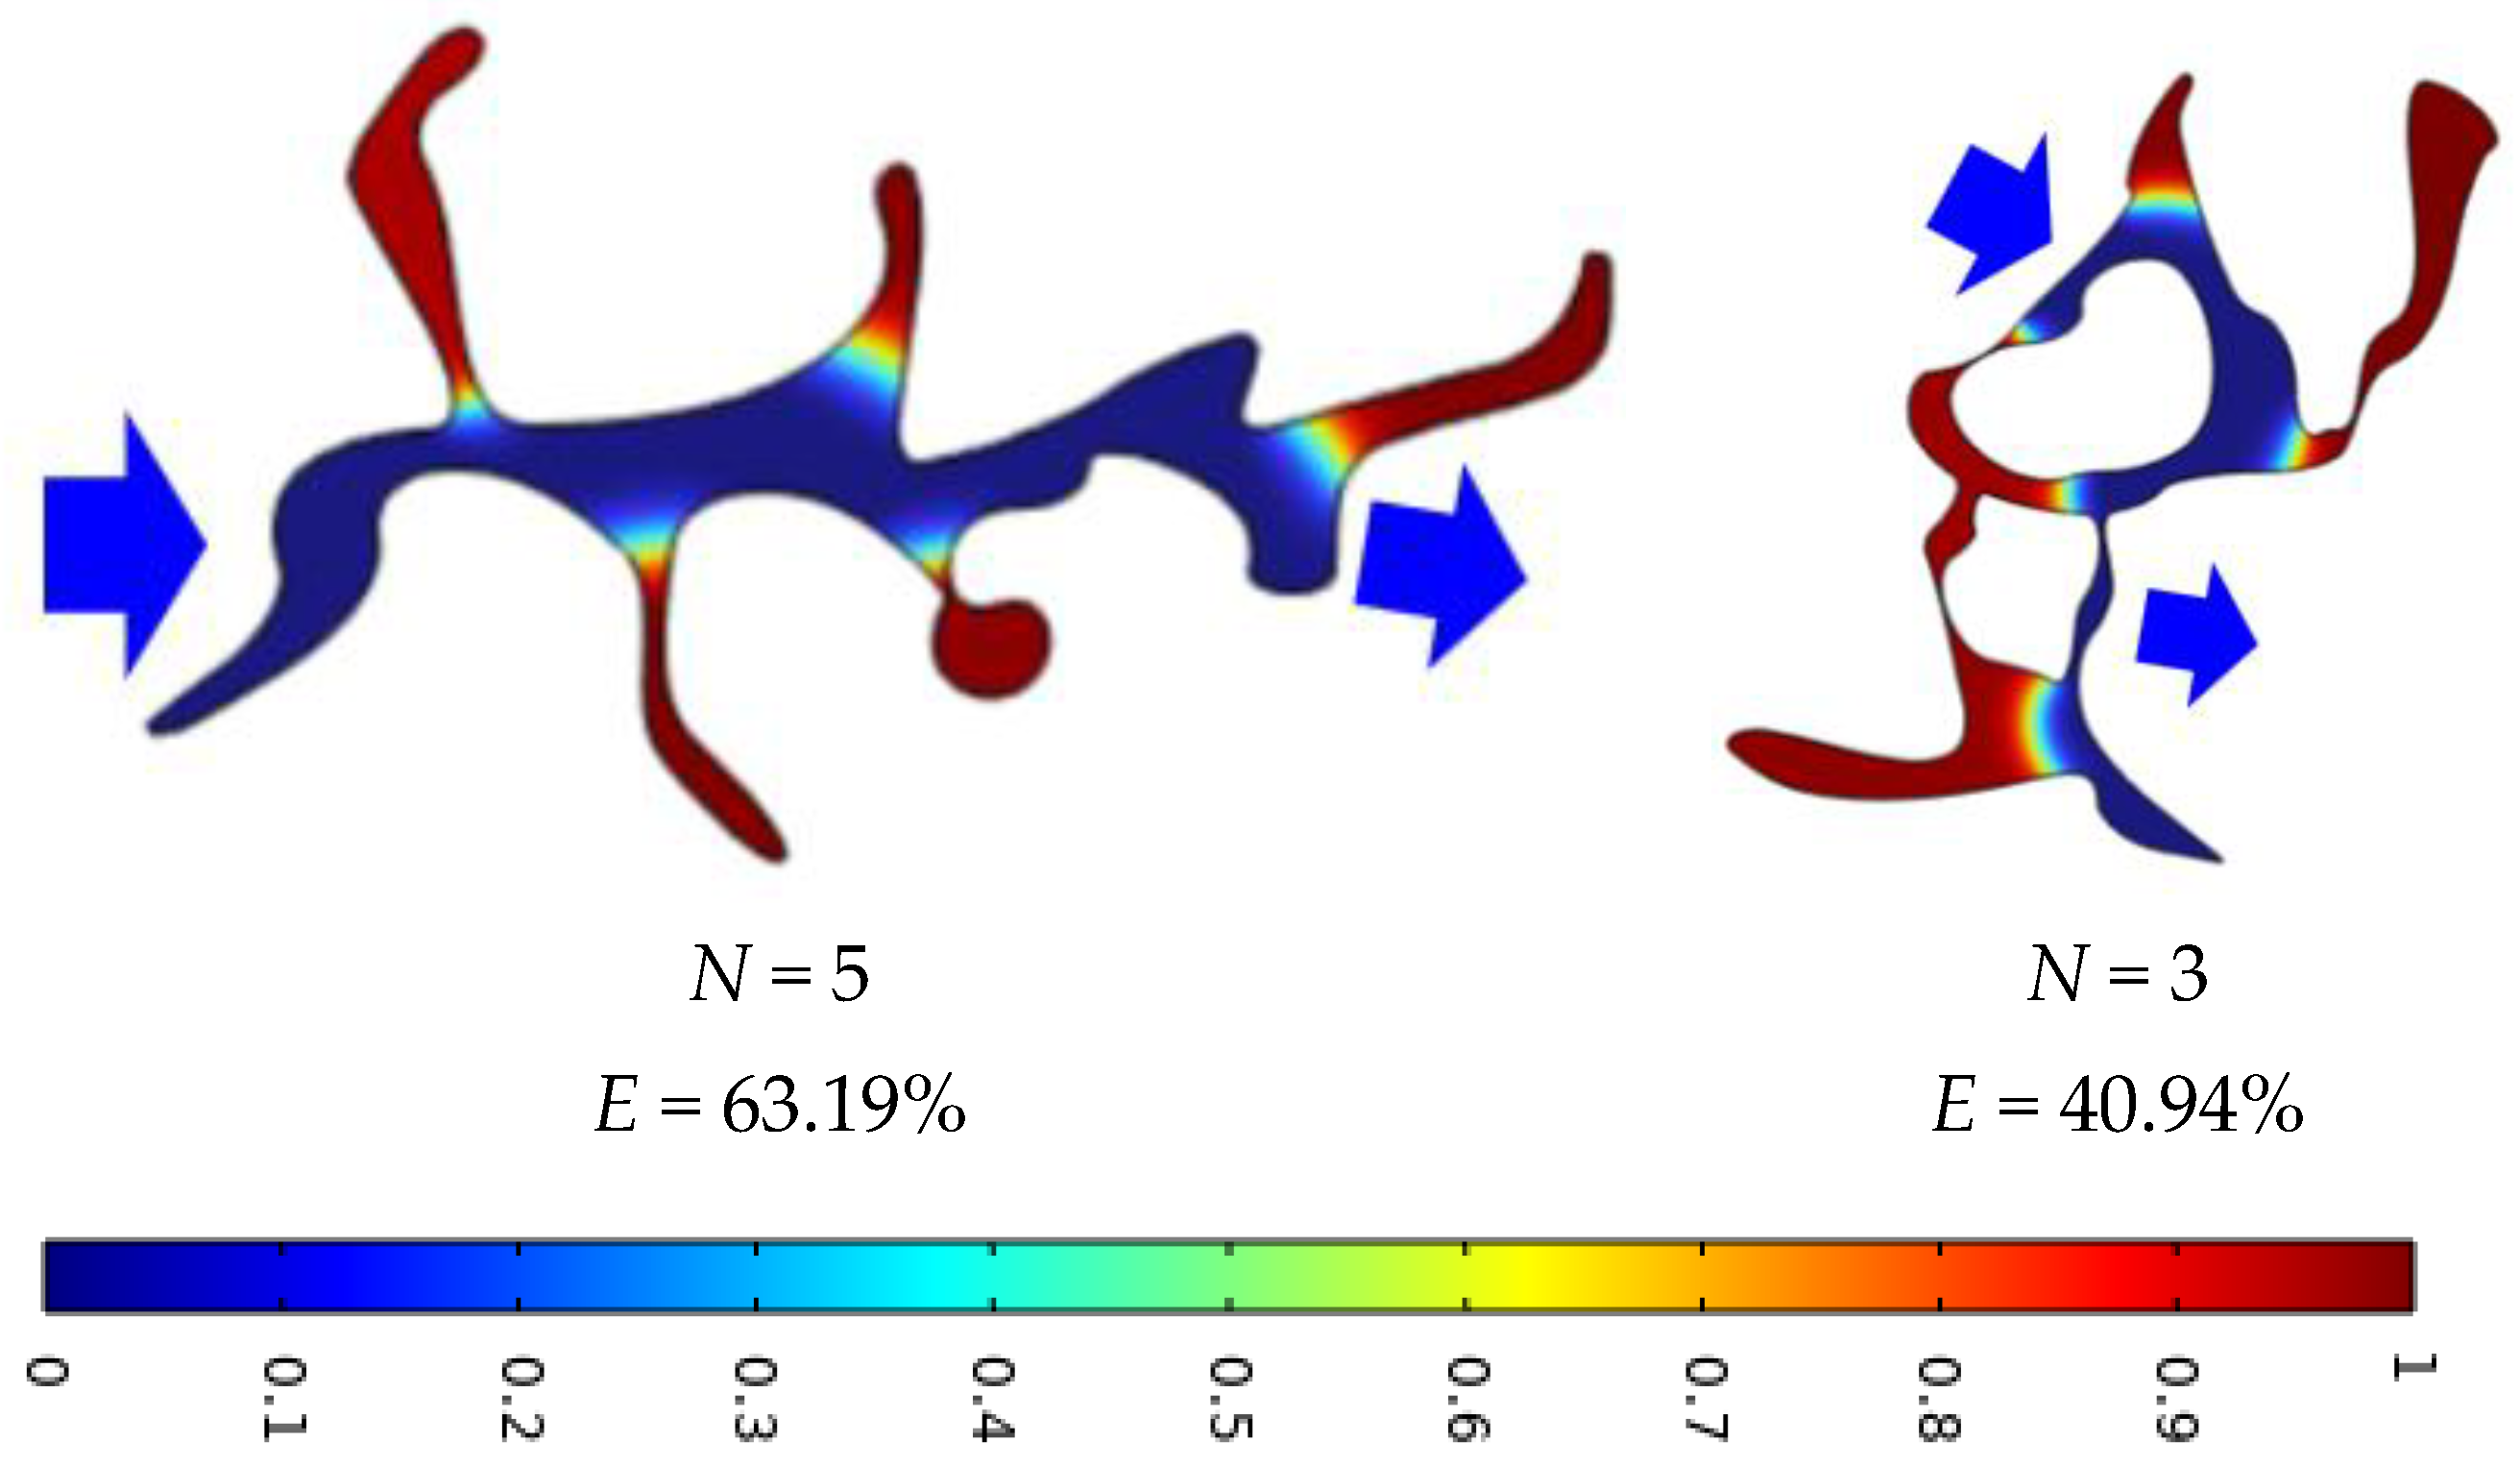
Figure 14 shows the final oil–water saturation distribution under different coordination numbers. By comparing the results of N = 3 and N = 5, it is found that under the same displacement conditions, the average oil saturation after waterflooding is significantly lower when N = 5, with the Eod increased from 40.9% to 63.19%, and the remaining oil is mainly distributed as small clusters and thin films. In contrast, when N = 3, the water phase is difficult to form stable flow paths, and a large amount of remaining oil is trapped in dead ends, which can only be effectively mobilized by subsequently increasing the pressure difference or adjusting the injection medium. The above results indicate that increasing the pore diameter, reducing the pore-throat ratio, and increasing the coordination number are all conducive to lowering the mobilization pressure, reducing the residual oil saturation, and improving the Eod. Excessively large pore-throat ratios and low coordination numbers are the reasons for the formation of dead-end remaining oil in medium- and high-permeability sandstones.
Figure 14.
Final oil saturation distribution under different coordination numbers. The arrows indicate the inlet and outlet directions of water flow.
Based on the optimal injection rate identified by the above experiments and the pore-scale remaining oil mobilization mechanisms, field operations should preferentially adopt graded rate control or stepwise rate adjustment to optimize water injection within a reasonable rate, rather than simply increasing the injection rate and pressure differential. Conventional monitoring data should be used to identify flow entry into preferential high-capacity pathways, thereby avoiding early water breakthrough caused by high-intensity injection. Rate optimization and water cut control should be implemented with priority in well groups exhibiting strong heterogeneity and pronounced preferential channels.
6. Conclusions
Through variable-rate waterflooding experiments and numerical simulations, this study, for the first time, combines realistic X-CT-derived geometry with an orthogonal experimental design to investigate the remaining oil mobilization mechanisms under variable-rate waterflooding in medium- and high-permeability sandstone, and the following conclusions are drawn:
- (1)
- Variable-rate waterflooding experiments show that Eod generally increases with the rise in permeability. The final Eod shows a trend of first increasing and then decreasing with the displacement rate, and there exists an optimal displacement rate for medium- and high-permeability sandstone cores. This optimal rate balances the capillary pressure and viscous resistance between pores, maximizing the overall swept volume and Eod.
- (2)
- The constructed two-dimensional heterogeneous geometric model well reproduces the pore-throat scale characteristics of medium- and high-permeability sandstone. Numerical simulation results indicate that the water phase preferentially enters large pores during waterflooding, forming preferential flow channels. The remaining oil undergoes microscopic dynamic phenomena such as trapping and bypassing. Insufficient displacement pressure difference fails to overcome the capillary resistance in small pores, leading to inadequate mobilization of remaining oil in small pores and thus forming high saturation residual oil enrichment zones.
- (3)
- Orthogonal experiment results demonstrate that displacement rate and wettability are the dominant factors affecting Eod, with their comprehensive contribution rate exceeding 70%. Moderately increasing the displacement rate and conducting wettability modification can significantly improve Eod. Viscosity and interfacial tension have little impact on the final Eod, and only a significant increase in viscosity will exert a substantial influence on the waterflooding process.
- (4)
- Sensitivity analysis of structural parameters based on the idealized geometric model shows that increasing pore diameter, reducing pore-throat ratio, and increasing coordination number are all conducive to lowering the remaining oil mobilization pressure and final residual oil saturation. Larger pore diameters enable the mobilization of remaining oil under lower pressure differences, while smaller pore diameters promote the formation of remaining oil. By combining the results of macroscopic variable-rate experiments with pore-scale simulations, this study establishes a quantitative connection between displacement conditions, pore structure, and Eod at the pore scale, providing actionable pore-scale mechanistic support for optimization of displacement rate and fine-scale remaining oil recovery in medium- and high-permeability sandstone reservoirs.
Author Contributions
Conceptualization, L.Z. and C.Z.; methodology, L.Z. and Y.M.; investigation, L.Z.; formal analysis, L.Z., Y.M. and B.L.; visualization, L.Z., B.L., J.F., J.H. and D.W. (Donghui Wang); software, B.L.; validation, Y.M. and B.L.; resources, C.Z., J.F., J.H. and D.W. (Donghui Wang); writing—original draft preparation, L.Z.; writing—review and editing, L.Z., C.Z., Y.M., B.L., D.W. (Daigang Wang), J.F., J.H. and D.W. (Donghui Wang); supervision, C.Z. and D.W. (Daigang Wang); project administration, D.W. (Daigang Wang); funding acquisition, D.W. (Daigang Wang); corresponding author, L.Z. and D.W. (Daigang Wang). All authors have read and agreed to the published version of the manuscript.
Funding
This research was funded by PetroChina Forward-looking and Fundamental Project, Grant No. 2023ZZ0403.
Data Availability Statement
Data will be made available on request.
Conflicts of Interest
Liang Zhao; Cunyou Zou; Jinde Feng; Jie Han and Donghui Wang were employed by the company Research Institute of Petroleum Exploration & Development, PetroChina, Beijing 100083, China. The remaining authors declare that the research was conducted in the absence of any commercial or financial relationships that could be construed as a potential conflict of interest.
References
- Yu, H.; Wang, Y.; Shu, Q.; Pang, Q.; Zhu, Y.; Wang, R.; Lyu, C.; Wu, Y.; Cui, W.; Zhang, J. Remaining Oil Distribution Characteristics and Potential Tapping Strategies for Integral Reservoirs at Different Waterflooding Stages. ACS Omega 2025, 10, 26538–26545. [Google Scholar] [CrossRef] [Scilit] [PubMed]
- Wang, J.; Zhao, L.; Zhang, A.; Zhang, X.; Guo, X.; Li, Y.; Zhao, W. Well pattern adjustment of variable-injection-production-rate waterflooding in high water-cut oilfields. J. Pet. Explor. Prod. Technol. 2025, 15, 152. [Google Scholar]
- Sun, C.; Wang, X.; Zhao, J.; Zhang, J.; Wu, X.; Wang, W.; Yan, X. Study on the Mobilization Mechanisms of Microscopic Residual Oil in High-Water-Cut Sandstone Reservoirs. Processes 2024, 12, 1608. [Google Scholar] [CrossRef] [Scilit]
- Guo, J.; Yang, E.; Zhao, Y.; Fu, H.; Dong, C.; Du, Q.; Zheng, X.; Wang, Z.; Yang, B.; Zhu, J. A New Method for Optimizing Water-Flooding Strategies in Multi-Layer Sandstone Reservoirs. Energies 2024, 17, 1828. [Google Scholar] [CrossRef] [Scilit]
- Sun, H.; Yao, J.; Zhao, Y. Water displacement characteristics at the high water-cut stage based on microscopic experiments and simulations. Simulation 2019, 97, 155–166. [Google Scholar] [CrossRef] [Scilit]
- Liu, C.; Zhou, W.; Jiang, J.; Shang, F.; He, H.; Wang, S. Remaining Oil Distribution and Development Strategy for Offshore Unconsolidated Sandstone Reservoir at Ultrahigh Water-Cut Stage. Geofluids 2022, 2022, 6856298. [Google Scholar] [CrossRef] [Scilit]
- Ma, K.; Li, A.; Guo, S.; Pang, J.; Xue, Y.; Zhou, Z. Techniques for improving the water-flooding of oil fields during the high water-cut stage. Oil Gas Sci. Technol.–Rev. D’ifp Energ. Nouv. 2019, 74, 69. [Google Scholar] [CrossRef] [Scilit]
- Alhammadi, A.M.; Gao, Y.; Akai, T.; Blunt, M.J.; Bijeljic, B. Pore-scale X-ray imaging with measurement of relative permeability, capillary pressure and oil recovery in a mixed-wet micro-porous carbonate reservoir rock. Fuel 2020, 268, 117018. [Google Scholar] [CrossRef] [Scilit]
- Hu, B.; Chai, G.; Liu, X.; Wen, X.; Gu, Z.; Xie, L.; Han, S.; Su, J. Insights into the Microscopic Oil–Water Flow Characteristics and Displacement Mechanisms during Waterflooding in Sandstone Reservoir Rock Based on Micro-CT Technology: A Pore-Scale Numerical Simulation Study. Materials 2023, 16, 3555. [Google Scholar] [CrossRef] [Scilit] [PubMed]
- Sun, K.; Liu, H.; Wang, Y.; Ge, L.; Gao, J.; Du, W. Novel method for inverted five-spot reservoir simulation at high water-cut stage based on time-varying relative permeability curves. ACS Omega 2020, 5, 13312–13323. [Google Scholar] [CrossRef] [Scilit] [PubMed]
- Jin, L.; Deng, J.; Liang, J.; Liu, L.; Zhang, X.; Lu, H.; Yang, T.; Tang, H. Effect of High-Multiple Water Flooding and Layered Allocation on Oil Displacement Efficiency in Unconsolidated Sandstone Reservoirs. ACS Omega 2025, 10, 56845–56855. [Google Scholar] [CrossRef] [Scilit]
- Chen, J.; Cai, D.; Zhang, T.; Yu, L.; Zhou, D.; Cheng, S. Asynchronous Injection-Production Method in the High Water Cut Stage of Tight Oil Reservoirs. Energies 2024, 17, 4838. [Google Scholar] [CrossRef] [Scilit]
- Blunt, M.J.; Bijeljic, B.; Dong, H.; Gharbi, O.; Iglauer, S.; Mostaghimi, P.; Paluszny, A.; Pentland, C. Pore-scale imaging and modelling. Adv. Water Resour. 2013, 51, 197–216. [Google Scholar] [CrossRef] [Scilit]
- Golparvar, A.; Zhou, Y.; Wu, K.; Ma, J.; Yu, Z. A comprehensive review of pore scale modeling methodologies for multiphase flow in porous media. Adv. Geo-Energy Res. 2018, 2, 418–440. [Google Scholar] [CrossRef] [Scilit]
- Sun, X.; Suo, L.; Huang, Y.; Wang, H.; Yu, H.; Xu, C.; Xu, J.; Qin, X.; Sun, W.; Cao, Y.; et al. Study on the occurrence characteristics of the remaining oil in sandstone reservoirs with different permeability after polymer flooding. Polymers 2024, 16, 1902. [Google Scholar] [CrossRef] [Scilit]
- Gong, W.; Liu, Y.; Xi, C.; Yang, G.; Ju, Y.; Wang, M. Dynamic characterization of residual oil during long-term waterflooding experiments in heterogeneous porous structures. Fuel 2023, 356, 129567. [Google Scholar] [CrossRef] [Scilit]
- Andrew, M.; Menke, H.; Blunt, M.J.; Bijeljic, B. The Imaging of Dynamic Multiphase Fluid Flow Using Synchrotron-Based X-ray Microtomography at Reservoir Conditions. Transp. Porous Media 2015, 110, 1–24. [Google Scholar] [CrossRef] [Scilit]
- Gao, Y.; Raeini, A.Q.; Selem, A.M.; Bondino, I.; Blunt, M.J.; Bijeljic, B. Pore-scale imaging with measurement of relative permeability and capillary pressure on the same reservoir sandstone sample under water-wet and mixed-wet conditions. Adv. Water Resour. 2020, 146, 103786. [Google Scholar] [CrossRef] [Scilit]
- Qin, C.Z.; Wang, X.; Zhang, H.; Hefny, M.; Jiang, H.; Tian, J.; Deng, W. Numerical studies of spontaneous imbibition in porous media: Model development and pore-scale perspectives. J. Pet. Sci. Eng. 2022, 218, 110961. [Google Scholar] [CrossRef] [Scilit]
- Wang, D.; Ma, Y.; Song, K.; Tao, J.; Bao, R.; Zhang, J. Phase-field modeling of pore-scale oil replacement by spontaneous imbibition in fractured porous media. Energy Fuels 2022, 36, 14824–14837. [Google Scholar] [CrossRef] [Scilit]
- Li, J.; Liu, Y.; Gao, Y.; Cheng, B.; Meng, F.; Xu, H. Effects of microscopic pore structure heterogeneity on the distribution and morphology of remaining oil. Pet. Explor. Dev. 2018, 45, 1112–1122. [Google Scholar] [CrossRef] [Scilit]
- Cheng, B.; Li, J.; Jiang, S.; Lu, C.; Su, H.; Yu, F.; Jiang, H. Pore-scale investigation of microscopic remaining oil variation characteristic in different flow rates using micro-CT. Energies 2021, 14, 3057. [Google Scholar] [CrossRef] [Scilit]
- Li, J.; Jiang, H.; Wang, C.; Zhao, Y.; Gao, Y.; Pei, Y.; Wang, C.; Dong, H. Pore-scale investigation of microscopic remaining oil variation characteristics in water-wet sandstone using CT scanning. J. Nat. Gas Sci. Eng. 2017, 48, 36–45. [Google Scholar] [CrossRef] [Scilit]
- Wang, X.; Yin, H.; Zhao, X.; Li, B.; Yang, Y. Microscopic remaining oil distribution and quantitative analysis of polymer flooding based on CT scanning. Adv. Geo-Energy Res. 2019, 3, 448–456. [Google Scholar] [CrossRef] [Scilit]
- Yang, J.; Shan, G.; Wang, Z.; Zhang, Q.; Yang, Y.; Ma, W. Experimental study of distribution and quantitative characterization of discontinuous oil phase based on micro-CT. Front. Earth Sci. 2023, 11, 1117971. [Google Scholar] [CrossRef] [Scilit]
- Raeini, A.Q.; Bijeljic, B.; Blunt, M.J. Modelling capillary trapping using finite-volume simulation of two-phase flow directly on micro-CT images. Adv. Water Resour. 2015, 83, 102–110. [Google Scholar] [CrossRef] [Scilit]
- Raeini, A.Q.; Blunt, M.J.; Bijeljic, B. Direct simulations of two-phase flow on micro-CT images of porous media and upscaling of pore-scale forces. Adv. Water Resour. 2014, 74, 116–126. [Google Scholar] [CrossRef] [Scilit]
- Zhou, Y.; Helland, J.O.; Hatzignatiou, D.G. Pore-scale modeling of waterflooding in mixed-wet-rock images: Effects of initial saturation and wettability. SPE J. 2013, 19, 88–100. [Google Scholar] [CrossRef] [Scilit]
- Yang, H.; Lao, J.; Tong, D.; Song, H. Numerical investigation on EOR in porous media by cyclic water injection with vibration frequency. Water 2022, 14, 3961. [Google Scholar] [CrossRef] [Scilit]
- Zhang, Q.; Yang, Y.; Wang, D.; Sun, H.; Zhong, J.; Yao, J.; Lisitsa, V. Correlations of residual oil distribution with pore structure during the water flooding process in sandstone reservoirs. Adv. Geo-Energy Res. 2024, 12, 113–126. [Google Scholar] [CrossRef] [Scilit]
- Hui, W.; Wang, L.; Liu, X.; Wang, Y. Effect of Dynamic Injection Velocity and Mixed Wettability on Two-Phase Flow Behavior in Porous Media: A Numerical Study. Energies 2025, 18, 879. [Google Scholar] [CrossRef] [Scilit]
- Tang, M.; Zhan, H.; Ma, H.; Lu, S. Upscaling of dynamic capillary pressure of two-phase flow in sandstone. Water Resour. Res. 2019, 55, 426–443. [Google Scholar] [CrossRef] [Scilit]
- Raeini, A.Q.; Bijeljic, B.; Blunt, M.J. Generalized network modeling of capillary-dominated two-phase flow. Phys. Rev. E 2018, 97, 023308. [Google Scholar] [CrossRef] [Scilit] [PubMed]
- Tahir, M.U.; Guo, S. Preliminary Investigation of Fracture Behavior during Carbon Dioxide Fracturing of Natural Hydrogen Reservoir with Hard-Core Imperfections. Reserv. Sci. 2026, 2, 34–51. [Google Scholar] [CrossRef] [Scilit]
- Li, W.; Liao, J. Microscopic Analysis of Flow Resistance of Oil Displacement Fluid in Reservoir Fractures. Reserv. Sci. 2026, 2, 16–33. [Google Scholar] [CrossRef] [Scilit]
- Xu, N.; Wang, Y. Effect of Nanomaterials on Improving the Apparent Viscosity of Heavy Oil and the Environmental Evaluation of Reservoir Environment. Reserv. Sci. 2026, 2, 1–15. [Google Scholar] [CrossRef] [Scilit]
- Iassonov, P.; Gebrenegus, T.; Tuller, M. Segmentation of X-ray computed tomography images of porous materials: A crucial step for characterization and quantitative analysis of pore structures. Water Resour. Res. 2009, 45. [Google Scholar] [CrossRef] [Scilit]
- Porter, M.L.; Wildenschild, D. Image analysis algorithms for estimating porous media multiphase flow variables from computed microtomography data: A validation study. Comput. Geosci. 2009, 14, 15–30. [Google Scholar] [CrossRef] [Scilit]
- Schlüter, S.; Sheppard, A.; Brown, K.; Wildenschild, D. Image processing of multiphase images obtained via X-ray microtomography: A review. Water Resour. Res. 2014, 50, 3615–3639. [Google Scholar] [CrossRef] [Scilit]
- Li, C.; Wang, D.; Sun, J.; Zhao, Y.; Liu, F.; Chen, J. Effect of dynamic displacement and imbibition on oil recovery in tight oil reservoirs: Pore-scale simulation. J. Pet. Explor. Prod. Technol. 2026, 16, 17. [Google Scholar] [CrossRef] [Scilit]
- Yin, X.; Li, J.; Wang, D.; Wu, K.; Zhang, S.; Chen, Z. The effects of micro-fractures and mixed wettability on oil/water imbibition in porous media. Phys. Fluids 2024, 36. [Google Scholar] [CrossRef] [Scilit]
- Zhou, Y.; Guan, W.; Zhao, C.; Zou, X.; He, Z.; Zhao, H. Numerical methods to simulate spontaneous imbibition in microscopic pore structures: A review. Capillarity 2024, 11, 1–21. [Google Scholar] [CrossRef] [Scilit]



Disclaimer/Publisher’s Note: The statements, opinions and data contained in all publications are solely those of the individual author(s) and contributor(s) and not of MDPI and/or the editor(s). MDPI and/or the editor(s) disclaim responsibility for any injury to people or property resulting from any ideas, methods, instructions or products referred to in the content. |
© 2026 by the authors. Licensee MDPI, Basel, Switzerland. This article is an open access article distributed under the terms and conditions of the Creative Commons Attribution (CC BY) license.