


Abstract
Implementing medium-voltage DC (MVDC) grids in ship power systems has many intricacies, such as larger fault currents, the inability to include conventional protection systems, etc.; however, this has not been deeply investigated. To circumvent these intricacies, it is important to understand the characteristics of MVDC grids installed in a ship power system environment. A feasible method to achieve this is to model the grid components in terms of their equivalent circuit and study their typical behaviour under fault conditions. Being a DC circuit, the steady-state grid parameters of the ship power system are predominantly resistive in nature; therefore, the pertinent circuit model approach remains theoretically adequate. Pertinent results and information gathered from such studies might provide a clear insight into the typical behaviour of MVDC grids under faults and help to resolve their diagnostic integrity. In this context, a simulation study that aims to understand the influence of inherent circuit parameters of MVDC grid components under normal and fault conditions is initiated. First, a circuit model that adequately represents a 2 MW MVDC grid is selected, and its transient and steady-state behaviours under normal and fault conditions are studied. The grid components (i.e., generator, converters, etc.) are modelled with , , and parameters in such a way that the steady-state and transient nature of the grid elements are theoretically represented. Later, the influence of these circuit representations during short-circuit faults in different sections of the DC grid is studied. Pertinent results reveal that the circuit representations of grid components manifest significant impact under fault conditions and induce damped-out oscillations superimposed on grid voltage and currents. This information is essential to developing smart fault protection systems operating independently of the main grid control algorithm and might help to enhance safety features along with grid resilience and reliability.
1. Introduction
The modern maritime industry is currently migrating towards developing fully electric ships, powered by medium-voltage direct current (MVDC) grids and protected by a fault diagnostic system [1,2,3,4]. A pertinent fault diagnostic system must be developed to be fast enough in responding to faults and operate independently of the generator and converter control while initiating preventive actions. In this context, prior knowledge of the typical behaviour of grid components under normal and fault conditions becomes essential. A suitable way to achieve this is by modelling the grid parameters in terms of their equivalent circuit representations and studying their responses via circuit, analytical and/or mathematical simulation methods [5,6]. Later, the findings from these simulation studies can be further extended to improve the design and development of an adequate fault diagnostic system. Amongst all, the MVDC grid architecture and its topology have received wide attention, whereas the same for fault detection and protection is still in its infancy [7,8,9,10,11]. In particular, understanding the modelling aspects of grid components and power apparatus in terms of the inherent circuit parameters and investigating their influence under normal and fault conditions has received scanty attention. Since this approach of circuit modelling and simulation not only reveals the typical response but also describes the typical characteristics of the grid under normal and fault conditions, it has gained importance.
The current literature on grid modelling and simulation primarily focuses on addressing power flow problems and/or stability issues along with fault mitigation through generator–converter control and hybrid circuit breakers [12,13,14]. These models focus on interactions of generator and power converter circuits and on improving methods that strongly depend on availing the current-limiting ability of generator and converter units [5,6,8,10,15,16]. Nevertheless, despite their adequacy, these methods of exploiting the current-limiting ability of generator and converter units take longer, i.e., up to 3 ms to detect the peak value of fault current [10] and 20 to 40 ms to react and isolate [6]; therefore, they are effective but slower. Naturally, grid components have to withstand larger fault currents, at least for a shorter duration, and have to be overrated [14]. This indicates a stronger need for an alternate fault detection and diagnostic method that is fast enough in detecting even incipient conditions and preventing premature failures, along with the capability to provide diagnostic information on the grid components. In this context, clear on the transient or dynamic response of grid components and their typical time- and frequency-based characteristics under normal and fault conditions is .
Under normal conditions, it is assumed that the total response of the DC grid network is predominantly resistive in nature. Considering minor voltage ripples, it is normal to expect the influence of the inductance of the grid network on its response. However, under fault conditions, the total response of the DC grid is governed not only by network resistance and inductance but also by fault resistance () and other parameters (i.e., resistance (), inductance () and capacitance ()) that are inherently present at the component and system levels [12,13,14,17]. So, modelling the grid components and apparatus using their respective inherent circuit parameters would capture their transient and steady-state characteristics; therefore, it might be considered adequate for representing their response [18,19,20]. Fault resistance () determines the overshoot and peak value of the fault current as it settles at a steady value, while the inherent circuit parameters, i.e., , and , determine transient and oscillatory behaviours [10,17]. Moreover, these inherent circuit parameters determine the magnitude and transient nature of the fault currents flowing from different sources through several branches to the fault location, thereby impacting the diagnostic condition of corresponding grid elements and components [12].
With these aspects in mind, there arise a few questions that have to be addressed in the process of understanding the typical behaviour of MVDC grids under normal and dynamic conditions. They are as follows:
- i.
- Do the inherent parameters of DC grid components have a significant impact on the fault currents in the network?
- ii.
- Can the influence of a short-circuit fault current impact the whole grid?
- iii.
- Do we need a complex fault management strategy that monitors the entire grid configuration?
- iv.
- If not, would a simplified fault protection scheme be sufficient to monitor localised grid distribution?
It is understood that the solutions to the above-mentioned questions may be quite useful for developing an adequate fault diagnostic system, pertinent intelligent sensors, switching devices and so on and are thus investigated in this paper.
The rest of the paper is organised as follows: Section 1 introduces the research problem identified. Section 2 summarises the background of the research problem identified. Following this, the existing literature that is currently focusing on topics relevant to the present study is gathered and analysed in Section 3. Section 4 provides a clear insight into the problem definition. Section 5 describes the simulation methodology adopted to resolve the research objectives. Subsequently, the results and discussion from this study and the conclusions drawn are analysed in Section 5 and Section 6, respectively. Finally, the concluding remarks and an overview of findings are presented in Section 7.
2. Background
The application of MVDC grids in fully electric ships poses a major challenge for protecting systems against incipient and fully developed fault conditions. The primary challenge during their implementation is the interruption of fault DC current, which is highly problematic. Currently practised fault management strategies lack comprehensive methods and strategies for interrupting such larger fault currents and reconfiguring DC grids in ship power systems [14,16,21,22,23]. This has created a major gap in fault management for DC grids in onboard power systems, and any attempt to close it is highly desirable. This requirement for effective fault containment and isolation demands new methods that include a circuit-based modelling approach, current measurement, and the use of non-conventional resonance-based hybrid switches [23]. However, these data have not yet been investigated or are at least not readily available in the public domain. Before development, it is essential to understand the typical behaviour of an MVDC grid installed in a ship power system network. The stringent requirements of the ship power system network define the parametric values of the grid elements and govern their typical characteristics and behaviour during a severe fault. This study focuses on understanding the typical transient and steady-state behaviours of interconnected MVDC grid elements that respond to a fault condition. Pertinent results might help develop a fault management strategy specific to an MVDC grid relevant to ship power systems.
The literature reports the possibility of multiple fault scenarios, such as conductor open-circuit, over-voltage, over-current, pole-to-pole-ground (shorted and grounded), pole-to-pole (line short circuit and floating), etc., in a DC grid [14,16,21,22,23]. Among all of them, the occurrence of short-circuit faults in the MVDC grids of ship power systems is considered severe since they induce transient currents that are quite larger in energy and magnitude [5,6,12]. Open-circuit and pole-to-ground faults are not considered severe due to the high impedance grounding, which is usual practice in ship power systems [10,14,23]. It is also reported that multiple sources located in different parts of a DC grid might contribute to fault location, forcing larger currents through different branches, thereby making the fault more severe and intense [13]. The other faults, such as over-voltages, over-currents, conductor open circuits, etc., can be easily controlled or avoided using converter units [24,25,26,27]. Clearing these faults requires fast, accurate, and reliable methods, which in turn need detailed information on time and frequency characteristics under normal and fault conditions [17].
The transient response induced by a short-circuit fault is predominantly contributed by the discharging of DC link capacitors into the fault circuit [6]. As time progresses, the transient nature of the fault current decays to a steady value supplied by generating sources and, in some cases, by motors [12]. In most cases, the capacitive discharge current is limited only by low busbar resistance; therefore, it is quite reasonable to assume that the ohmic resistance of the network and grid elements is the predominant limiting factor during transient fault conditions [12]. The rise and fall/drop of the fault current are determined by the settling and decay time constants [12,28,29]. On the contrary, it is normal to expect oscillations superimposed on the fault current, which also indicates the presence of high-frequency components [10]. So, the rise, fall time, and the oscillatory behaviour of the short-circuit fault current can be closely correlated to the inherent circuit parameters of the grid components [12,17,28,29]. As an added factor, other intermittent dynamic situations, such as overloading, switching, incipient or developed faults, overshoot due to transient operations, etc., might trigger the high-frequency elements that are inherently present in grid components [10,15,16]. So, by monitoring the transient behaviour and measuring network currents and voltage, it might be possible to resolve fault conditions and also assess the diagnostic status of grid elements.
3. Literature Review
The currently available literature on faults in ship power systems focuses either on improving current-limiting methods for generator converter control units or on developing hybrid circuit breakers that can be directly integrated into grid protection systems. There is little research on alternative methods for modelling grid parameters using their inherent circuit parameters and studying their typical behaviour in a fault scenario. This literature is gathered and grouped into four categories and is discussed below.
3.1. Current Knowledge on Fault Scenarios in Ship Power Systems
The literature reports the possibility of multiple fault scenarios, such as conductor open-circuit, over-voltage, over-current, pole-to-pole-ground (shorted and grounded), pole-to-pole (line short circuit and floating), etc., in a DC grid [14,16,22,23]. Among all of them, the occurrence of short-circuit faults in the MVDC grids of ship power systems is considered severe since they induce transient currents that are quite larger in energy and magnitude [5,6,12]. Open-circuit and pole-to-ground faults are not considered severe due to the high impedance grounding, which is usual practice in ship power systems [10,14,23]. It is also reported that multiple sources located in different parts of the DC grid might contribute to the fault location, forcing larger currents through different branches, making the fault more severe and intense [13]. The other faults, such as over-voltages, over-currents, conductor open-circuits, etc., can be easily controlled or avoided by avoiding the use of converter units [24,25,26,27]. Clearing these faults requires fast, accurate and reliable methods, which in turn need detailed information on time and frequency characteristics at the component and system levels under normal and fault conditions [17].
3.2. Present Status of Fault Detection Methods for MVDC Grids
The literature reveals the stringent requirements imposed on MVDC grids by ship power system networks to meet the space constraints and high power density [2,21]. These stringent requirements create a when including conventional DC circuit breakers and DC protection techniques in the MVDC grid arrangement [12,14]. So, the current approach adopted for fault detection and protection uses the current-limiting capability of the generator and converter units at the source to prevent currents from reaching hazardous levels and uses low-voltage-side circuit breakers in the consumer section to isolate and reconfigure defective sections [14]. These methods are effective but slower, require at least 40 ms as reaction/response time, must be incorporated into the control algorithm of control units, and demand larger cooling arrangements due to the overrating of converter components and units [21]. In this context, several efforts are underway to develop hybrid, resonant, and intelligent/smart circuit breakers that aim to circumvent the ambiguities [14]. In order to develop a fault protection system adequate for a ship power system, it is quite important to understand the time and frequency characteristics of fault currents that are strongly influenced by the inherent parameters of the grid components and circuit [17]. In this context, there is little research that directly investigates the correlation between the impacts of inherent circuit parameters of grid elements under fault conditions [12,16,17,28,29]. These results are compartment-specific (i.e., faults and the response of grid components at specific locations) and do not include the response and behaviour of the complete MVDC grid in a fault scenario. In this context, the simplified modelling and representation of the grid arrangement and its typical behaviour has to be developed and studied in detail.
3.3. Adequacy of Circuit Representation of MVDC Grid Components in Ship Power Systems
Earlier studies included only circuit resistance, and in some cases inductance, in their models when quantifying the impact and contribution of the power source in steady-state and fault scenarios in the power grid [6,30,31]. However, this approach does not capture the circuit’s transient and high-frequency behaviour and that of its grid components. Recent studies included the other inherent circuit parameters (i.e., , and ) and studied their influence in a fault scenario (i.e., , and ) [18,19,20]. In this context, the usual practice is to represent the linear functions of node voltages and branch currents directly into the equivalent circuit parameters along with dependent and independent sources [18,19,20]. Subsequently, time-domain-based transient analysis methods are adopted to determine changes in the DC line voltage and/or currents [32]. However, the relevant investigations and findings are only specific to the fault location and do not include the complete response of the grid.
3.4. Thevenin’s Equivalent Circuit Modelling of Power Grids
The equivalent circuit representation of terrestrial grids and land power systems popularly employs the method to model network interfacing with the load [33,34,35]. Using this method, power flow problems, load and stability issues, and voltage regulation are resolved by applying least-squares-based estimation and Gaussian elimination [33]. Alternatively, ’s theorem is applied at two subsequent data points obtained simultaneously from two synchronised measurements [36]. Recently, there were a few attempts to extend the equivalent circuit-based estimation of impedance relevant to power electronic converters in smart grids [33]. Using this approach, an attempt was made to enhance the control stability and performance of smart grids, along with fault and energy management [35]. Pertinent results seem highly beneficial in terms of optimising the controllers of power converter units; however, they are not extended to fault detection and analysis.
3.5. Transient Response and Natural Frequencies During Short-Circuit Faults
Research has been carried out to correlate the transient response recorded from the DC grids to their natural frequencies [37,38,39,40,41,42]. Pertinent methods model the grid components using equivalent circuits and their frequency dependence and apply a time-domain-based fault location approach [37]. Alternatively, a frequency-based detection method directly correlates the grid’s natural frequencies with the fault distance [38]. It is reported that as the fault occurs in a DC line of the grid, the natural forced frequencies are governed by the shunt capacitor and line inductor, which might appear as a resonant peak in their frequency response [41]. Furthermore, as the fault distance increases, so does the measurement accuracy, indicating the need for a localised fault detection approach [42]. This once again confirms the current interest in extending the equivalent circuit representation to the analysis of faults in DC grids for understanding their time and frequency-dependent behaviour.
In summary, the following conclusions can be drawn from the literature review:
- i.
- Short-circuit faults are considered more severe and intense and therefore require more attention. The currently adopted DC protection methods use indirect approaches (hybrid, resonant, etc.) and are slower, requiring further improvement.
- ii.
- It appears that there is a strong interest in modelling grid components and power apparatus in terms of their equivalent circuit (or at least using the model) and correlating the same to the transient conditions in an actual DC grid in a ship power system induced by a fault.
- iii.
- Extending these investigations on the effect of the inherent circuit parameters under short-circuit fault conditions would provide a clear picture of typical characteristics of grid components during a failure, which are yet to be investigated.
Motivated by these gaps, a simulation study of a circuit model representation of an MVDC grid for a maritime environment is initiated, and its typical time- and frequency-domain characteristics during a short-circuit fault are studied in detail.
4. Problem Definition
The primary objective of an MVDC grid is to distribute electric power from the source to the load without hindrance. To achieve this, the usual practice is to equip the MVDC grid with several power apparatuses or components interconnected in a series–parallel combination to deliver electric power. It is clear that each and every power apparatus in the MVDC grid and its typical steady-state and transient or dynamic characteristics and responses are governed by their inherent parameters, such as resistance (), inductance () and capacitance () [18,19,20,31]. So, the occurrence of any transient and/or dynamic behaviour of the grid would affect resistive and reactive components such as , and appropriately, which in turn would determine the respective branch currents and node voltages [20,31].
For example, the steady-state response would be predominantly determined by the circuit resistance () of the respective branch, while transient or dynamic behaviour would trigger the inherent parameters influencing the node voltage and branch currents [18,19,20,31]. So, it is feasible to represent the typical characteristics of the generator (or motor) by its equivalent resistance () and reactance (), which in turn present a close correlation with the electrical and magnetic response of core and winding parameters. Similar to this, power cables, transmission lines, busbar ties, etc., can also be adequately represented as a simple and complex ladder network of parameters, capturing their transient and steady-state behaviours [17,33,34]. The literature also reveals an alternate method of -based equivalent circuit representation of source () and resistance that describes the collective effect of all the and of the power apparatus in the grid. However, this approach of using the equivalent circuit does not capture transient information; hence, it is usually extended to study steady-state conditions, such as power flow, load flow, and so on [33,34,35,36,42].
Keeping these aspects in mind, this study focuses on understanding the influence of circuit parameters under normal and short-circuit fault conditions in MVDC grids for a ship power system, which is the subject matter of this paper.
5. Model and Method
This study is based on a linear circuit model that represents the transient and steady-state behaviours of an MVDC grid in a ship power system network. The adequacy of such circuit representations describing the transient and steady-state behaviours of terrestrial networks has been substantiated. Extending these assumptions and approaches to an MVDC grid for a ship power system requires theoretical investigations and experimental validation. There are few studies that focus on understanding DC grid behaviour under fault conditions. In this context, the present study expands these circuit-based analyses to consolidate the interactive behaviour of grid elements of the ship power system under short-circuit fault conditions.
The circuit model of the MVDC grid adopted in the present study is similar to that of a platform supply vessel popularly reported in [6,10,16,23]. It comprises multiple generators as AC sources, AC-to-DC converters to convert AC voltage into uncontrolled DC, DC-DC converters to control the amplitude of uncontrolled DC, and a DC-to-AC inverter to convert controlled DC into AC [21,23]. The sources and converters are cascaded with filters to remove unwanted high-frequency noise and harmonics, producing pure DC and AC signals, respectively [16]. These grid components are appropriately positioned for the effective transfer of electrical power from source to load. Subsequently, these apparatuses in the grid are represented in terms of their circuit equivalent to resolve the objectives of the present study. The circuit model of each grid component is represented by its equivalent circuit, including its steady-state and transient responses, so that the complete static and dynamic response of the MVDC grid is captured and adequately represented.
The chosen MVDC grid model comprises three sections, viz., primary, secondary, and tertiary. The primary section of the grid comprises four sections, each equipped with an AC generator, a rectifier with a low-pass filter, and an -based transmission line representing a cable. All four sections are interconnected via a busbar, which interfaces the primary section of the grid with the secondary side and transmits the power generated. The purpose of the secondary section is to transmit the power to the tertiary section; therefore, it is represented using an -based transmission line. The secondary section of the MVDC grid feeds power to the tertiary section via a secondary busbar. The tertiary section of the grid is considered more important because it distributes electrical power to different AC and DC loads at varying magnitudes. The tertiary section contains two consolidated DC loads rated 690 V and 700 A and AC loads rated 250 and 50 Hz and is assumed to have a series and parallel combination of end user loads. Since end user loads are not constant, they are not included individually in the MVDC grid model.
In addition, two asynchronous induction motors are included to represent propulsion. The power for the propulsion motors is derived directly from a section interconnected to the primary grid, which is dealt with individually. Once the model components are adequately modelled, they are simulated using MATLAB/SIMSCAPE using 23tb in discrete steps of 10 s. Later, the voltages and currents in the different sections of the grid model are studied under transient and steady-state conditions. Once this is accomplished, time-dependent short-circuit faults (i.e., pole-to-pole) are created for a duration of second, and the respective changes in the voltages and currents in the different sections of the grid model are studied. Furthermore, the fault currents are recorded and analysed in the time and frequency domains. The results from transient, steady-state, and fault conditions describe the significant influence of circuit parameters and can be used to develop a protection mechanism that operates independently of the power and energy management schemes or strategies.
The short-circuit fault current in the DC ship power system can be characterised by two responses:
- i.
- Transient current is governed by the settling time.
- ii.
- Steady-state current is governed by the inherent parameters of the circuit, i.e., resistance, inductance, capacitance, etc.
In this paper, the initial switching transient and the steady-state responses are studied. For this purpose, a switch is introduced a the generator side of the primary section, which is turned ON with a 3-s delay. Later, a short-circuit is induced at a specific location for 1 s and automatically cleared to study the responses of the circuit parameters in different sections and during transients under fault and reconfiguration. Since this study focuses on understanding the influence of circuit parameters during short-circuit faults in MVDC grids, no fault management schemes or preventive mechanisms other than time-controlled grid reconfiguration are considered.
Generally, the steady-state current is governed by the resistive nature of the circuit and arises mostly from generating sources and motors, whereas the transient current is due to the discharge of the DC link capacitors interfaced with the converters [23]. It is reported in [23] that a high capacitive discharge current causes thermal damage to the components in the fault path (especially the DC link capacitor itself), mechanical damage caused by magnetic forces exerted on conductors, and over-voltage damage. At the same time, the low-resistance faults in the DC ship power systems occurring under steady-state conditions are identified as the most severe single-point faults. So any attempt to detect the fault before it reaches the steady state is highly beneficial and hence desired.
The chosen MVDC grid model is developed with the requirements of DC ship power systems in mind. This implies high power density while meeting space–weight constraints. In this context, the chosen or developed models include parameters and criteria that satisfy the aforementioned conditions. In practice, a DC electric ship might operate with a generator–converter source and/or an alternative energy source, such as fuel cells or batteries. In the present context, a more generic, popular, and realisable approach that incorporates a generator–converter topology as a primary source is considered. As the objective of this work is to capture the transient and steady-state behaviours of the DC grid, the circuit model representation of each component in the DC grid is adopted and further simulated, while the dependencies of generator, motor response, and power converter circuits are not included for brevity. The reason is that the primary focus of this study is limited to understanding the steady-state and short-circuit behaviours of MVDC grid elements during short-circuit faults in different sections of MVDC grids. To minimise the dependencies and variations, the primary focus is on DC grid elements, while the dependencies specific to the generator and its control are not included.
In addition, it is important to note that the proposed approach and pertinent results and outcomes are relevant to faults in any section, irrespective of grid topology, but are limited to grids rated medium voltage (MV). As the operating voltage further increases, the inclusion of electrostatic couplings arising from higher DC electric fields in the circuit model becomes a necessity. As the DC arcs set up during short-circuit faults are quite high, this would further modify the transient parameters of the fault currents in the grid network. This forms a limitation of the proposed method.
5.1. Circuit Model of the MVDC Grid
The single-line diagram of the model of MVDC grid chosen for the present simulation study is shown in Figure 1. Detailed information on grid components, their inherent circuit parameters, ideal voltage and current ratings, and so on is given in Table 1. The model comprises three sections: primary, secondary, and tertiary. Among them, the primary grid comprises a generator source, an AC-to-DC converter, and a transmission line, along with filters and protective switches. The primary section of the MVDC grid produces rated DC voltage and current and transfers power to the secondary section of the grid. The purpose of the secondary grid is to convert the uncontrolled DC source into a controlled version by using DC-DC converter modules. In addition, the secondary section of the grid can supply part of its power to heavy loads such as cranes and humidifiers, which is usually considered optional. In the present context, the secondary grid is used only to interface the primary (or source) with the tertiary (load) sections. The tertiary section of the model comprises DC-DC converters and DC-AC inverters, which feed power to end user loads. The end users are primarily propulsion loads, modelled as induction motors, while the other, smaller loads are modelled using their inherent circuit parameters. Once the model’s adequacy is verified, it is simulated in MATLAB/SIMSCAPE to study its steady-state and transient behaviours. The MVDC grid model comprises four generator source arms in the primary, secondary, and tertiary sections of the grid, while the heavy loads, such as the propulsion motors, are directly connected to the primary section. Such an arrangement recreates the actual scenario currently found when adopting DC grids in ship power systems.
Figure 1.
Single-line diagram of MVDC grid adopted in the present study (Refer to Figure 2 in ref. [6] and refs. [10,16,23]).
Table 1.
Model parameters of MVDC grid adopted in the present study.
Steady-state behaviour is the study of the regular response of each component in the MVDC grid model over a specific period. Pertinent end results are nothing but voltage and currents, their typical wave shape, behaviour, etc., which effectively describe the steady-state behaviour of each and every component at their input and output. These results describe the adequacy model and also characterise the components and every node in DC grids appropriately. Once this is ensured, individual short-circuit faults are created in the primary, secondary, and tertiary sections of the grid model in sequential order, and the input and output responses of each component are studied. In addition, the fault current and voltage at the respective locations are recorded, deconvoluted into the frequency domain, and studied. Subsequently, the impact of the fault on the other nodes and sections of the grid is also studied in the time and frequency domains. All the information collected characterises the transient response at different nodes. Later, the circuit model is simulated in MATLAB/SIMSCAPE, and the resulting data are analysed to understand the influence of inherent or parasitic circuit parameters on the characteristics of short-circuit faults in the MVDC grid.
The parameters of the circuit elements are derived from their basic circuits and the mathematical equations that adequately describe their basic physics and deduced mechanisms. These values are directly entered into the built-in MATLAB/SIMSCAPE models adopted in this study. Figure 2 shows the equivalent circuit representation of a generator–rectifier set adopted in the present simulation study. The adopted generator–rectifier topology uses a generator circuit modelled as a voltage source with generated voltage and steady-state synchronous reactance in series, along with a full-bridge rectifier unit with a low-pass filter arrangement in tandem as the output unit. The parameter values are calculated using the basic equations in Equations (1)–(4).
Figure 2.
Equivalent circuit representation of the generator–rectifier in the MVDC grid adopted in the present study.
The generated voltage and other rated specifications can be easily obtained from the respective manufacturer or from the literature. In the present context, the circuit model represents a 2 MW generator rated 2000 V and 1000 A armature current. Pertinent values are calculated using the following (Equations (1) and (2)):
where is the generated EMF, is a constant, is the flux/pole and is the synchronous speed.
where is the terminal voltage, is the armature resistance, is the armature current, is the leakage reactance and is the armature reactance. Since is comparatively very low compared with the synchronous reactance (), it is usual practice to approximate it without it. So, the synchronous reactance is obtained from Equation (3),
which can be calculated from Equation (4),
where is the short-circuit current in amperes.
The second part of this circuit representation is the rectifier unit, along with a low-pass ripple filter. AC-DC conversion is performed using an uncontrolled rectifier, represented by a simple diode circuit with an LC filter in series. The diode parameters are included in the circuit representation as equivalent resistance and the filter as a C-L-C topology. Pertinent values are obtained with Equations (5) and (6), respectively.
In addition to the diode parameters, it is normal to expect additional resistance and inductance that are inherent to the circuit topology. This parameter, along with the C-L-C section passive filter circuit, is represented as simple R, L, and C elements (shown in Figure 2). The reason for selecting the C-L-C passive filter is that it offers a low ripple factor and combines the advantages of both C and L-C filter configurations. The values of the filter elements are calculated as per the conditions given below:
where is the cut-off frequency and is the load resistance calculated as grid specification. For the filter inductor, the value of inductance () is selected so that the reactance () is much higher than the foreseen output resistance. The output resistance is approximated based on the desired output voltage and current fed into the secondary section of the grid for transmission purposes. Since , the DC voltage (Equation (6)) appears at , since the inductor is short-circuited for DC. As expected, the DC component of the AC voltage, after rectification, appears at the output or at the load resistance. The DC component of voltage is calculated as
where is the DC voltage, is the peak-to-peak value of AC voltage, is the DC current and is the resistance of the inductor.
The next important stage in the process of DC generation is the DC link, which ensures the purity and stability of the DC voltage fed to the secondary section of the MVDC grid. This stage of the DC link is adequately modelled using a simple circuit in low-pass configuration. Thevenin’s equivalent DC output voltage is used to calculate the values of L and C. The pertinent equations are given below:
where is the DC voltage, is the Thevenin voltage, and and are the DC link inductor and capacitor.
Controlled DC power is transmitted to the secondary and tertiary sections via a power cable. To capture this condition, a circuit model of a short transmission line with the parameters of an actual MVDC cable is adopted. Figure 3 shows the circuit representation of the power cable modelled as a short transmission line to simulate device interfacing and power transmission from the source to the load. In practice, the representation of a short transmission line usually excludes parallel capacitance, as shown in Figure 3. Nevertheless, the short transmission line model adopted in the present study includes parallel capacitance to account for the use of MVDC cables in the design. Due to the large load, the cable capacitances, as inherent parameters, would significantly contribute to the dynamic or transient behaviour during a short-circuit fault and cannot be ignored.
Figure 3.
Circuit representation of the short transmission line.
Subsequently, the uncontrolled DC output is converted into a controlled version by using a DC-DC converter. For this purpose, a buck–boost topology is adopted. In series to the output of the DC-DC converter, a low-pass filter is interfaced to eliminate ripples up at least to 2% in magnitude. The values of the filter are calculated with Equations (9) and (10) given below:
and
where is the switching frequency, is the filter frequency to remove ripples, and and are the filter inductors and capacitors respectively. is usually selected to be less than ten times the switching frequency.
5.2. Characteristics of Short-Circuit Fault Current
As mentioned in [13,15], short-circuit faults are severe due to the collective contributions of sources and capacitors at their respective locations. So, it is normal to expect that large currents flow through the branches and nodes, despite the current-limiting action of the converter units [15]. Also, one can normally expect at least a mild reflection of fault characteristics on the fault response drawn from the source and sink units. As per the IEC standard (IEC 61660-1 [13]), in a broader sense, the fault current can be segregated into two parts, viz., transient (the former) and steady state (the latter). In the former part, the contribution is predominantly made by the inherent circuit parameters of the grid elements; hence, it has a faster rise time constant and, in many cases, overshoot or oscillations. The secondary steady state is contributed by the fault resistance as dictated at the respective location, since the effect of inherent circuit parameters slowly decays according to the circuit’s decay time constant. The collective behaviour of both transient and quasi-steady state forms the typical characteristics of a fault current.
IEC standard IEC 61660-1 further recommends applying the superposition principle to calculate the short-circuit currents in each network branch. As an additional note, circulating currents may occur due to unexpected looping in the network, which might be caused by a short-circuit fault. Incorporating all these aspects in mind, the fault current described by the IEC standard (IEC 61660-1 [13]) is given by Equations (11) and (12) as
where is the initial transient part of the fault current, is the time taken to reach the peak value of the fault current, is the rise time constant, and is the initial peak current. Since the fault current appears superimposed on the steady-state current, the impact of the same can be determined by Equation (12):
where is second steady-state part of the fault current, is the quasi-steady-state current, is the decay time constant and is the total short-circuit duration. These equations clearly describe the influence of circuit parameters on short-circuit fault currents and their significance in accurately calculating pertinent values. Such information is essential to designing fault detection and protection systems.
6. Results
During the simulation, the steady-state and fault responses of the chosen MVDC grid model are studied. Between them, the steady-state response indicates the normal operation of the grid in transmitting DC power from source to load, while the fault response indicates grid operation during a short-circuit fault at specific sections. During this study, short-circuit faults are introduced between pole-to-pole faults, as they are reported to be more severe and are therefore paid utmost attention. Initially, the steady-state response of the MVDC grid model is studied, and the responses of each component interfaced with the others in the primary, secondary, and tertiary sections are simulated.
6.1. Steady-State Response
In general, inherent parameters such as equivalent series and/or parallel combination of resistance, inductance (self and mutual), and capacitance (self and mutual) of grid elements and components such as solid-state devices, switches, cables, etc., remain dormant or inactive in DC grids other than during switching or transient operation. Under normal or no-fault conditions, the primary influence of these inherent circuit parameters governs the settling time to reach the steady state and is expected to introduce oscillations during transient and/or fault conditions. In this context, the initial study focuses on understanding the consolidated influence of the complex network of the inherent parameters of each component, interconnected in the DC grid model, under the steady-state condition. Since the grid model comprises three sections, each with four grid arms, the output voltages and currents at each critical location are recorded and analysed. However, only the results that provide more information on normal and fault responses are reported to avoid repetition and for brevity.
First, the voltage and current at the output of the primary and secondary sections of the MVDC grid are recorded and analysed. Such data not only provide the typical transient behaviour of the grid under normal conditions but also serve as a reference for comparing and evaluating the grid response under fault conditions. Pertinent peak values are quantified in Table 2. The grid is switched ON after a 3-s delay to study the initial transient behaviour and the influence of circuit parameters on the MVDC grid’s total settling time. Figure 4a,b show the output voltage and current of the primary MVDC grid section, which feeds power into the secondary side. It is clear from this figure that the applied DC voltage and current exhibit an initial transient response; however, they settle at a DC voltage of 2000 V and a current of 1000 A. It appears from this figure (Figure 4a,b) that the MVDC grid model responds as fast as possible during the initial switching. The applied voltage rises to the desired value, emulating a step signal. As the desired magnitude is reached, it can be observed that oscillations appear, indicating the response of inherent circuit parameters such as the inductance and capacitance, which are damped out once the steady state is reached. This indicates that the inherent equivalent and parasitic elements of the complete grid respond to transient conditions and that this behaviour can be adequately modelled using simple circuit parameters.
Table 2.
Fault response of grid components recorded in different sections during short-circuit fault in the first section of the primary side of the MVDC grid.
Figure 4.
DC voltage and current recorded at the output of the primary section of the MVDC grid feeding into the secondary side. (a) Voltage. (b) Current.
In addition to this, it can also be observed from Figure 4b that the output current of the primary section is superimposed on an overshoot in the initial transient region. In particular, the current reaches a peak of 1500 A and then settles at a steady-state value of 1000 A. Such behaviour might be attributed to the DC link capacitors in the converters, which provide buffer storage to mitigate larger transients. As expected, there are oscillations in the transient region of the DC current, indicating a strong influence of the inherent circuit parameters. Similar observations can be made for the other sections of the primary side of the grid but are not reported only on brevity grounds. Once this is ensured, the steady-state response of the busbar-tie section of the grid, which interfaces the primary section of the MVDC grid with the secondary section, is studied.
The primary purpose of busbar ties is to connect the primary and secondary grids and transmit electrical power without interruption. In addition, busbar ties are provided with switches to prevent any fault conditions from becoming catastrophic. Subsequently, the grid sections are reconfigured with the regular or backup source depending on the type of fault and its recovery procedure. Figure 5 shows the voltage and current transmitted to the secondary side of the MVDC grid. It becomes clear from Figure 5 that power is effectively transmitted in a steady state once the settling time is reached. However, compared with the steady-state responses of the primary section’s voltage and current, the transient behaviour of the busbar tie recorded is steep, with no oscillations nor overshoot. This indicates the predominant influence of circuit resistance faced at this particular node.
Figure 5.
DC voltage at the output of the busbar tie that interfaces the primary section of the MVDC grid with the secondary side transmitting power.
In addition to this, there are minor oscillations observable in Figure 5 which reflect the influence of inherent grid parameters such as inductance and capacitance, which are not so severe as in the present context. This indicates that the busbar-tie section of the grid might not be as sensitive to a transient fault as the primary section. However, voltage is transferred to the secondary side without any intricacies. Since, in the present context, the secondary grid is used only for transmission purposes and there are no devices interconnected, power is effectively transmitted to the tertiary section of the grid.
Figure 6a–c show the secondary-side voltage transmitted to the tertiary section of the grid. Since the voltage and current are progressively transferred between sections, so is the impact of the inherent circuit parameters of each grid element. Naturally, the apparent values of resistance, inductance, and capacitance are larger, since the tertiary grid feeds into heavy and light loads at the end users. As expected, these figures show that there are no issues and that power has been effectively transmitted. In conclusion, the transient condition in the tertiary section of the grid is not as slow as the busbar tie, but it does exhibit minor oscillations superimposed. Nevertheless, being a DC circuit, the apparent DC value remains constant and is further fed to the DC-DC converters and DC-AC inverters to convert and condition the power to a controlled value to meet the requirements of DC and AC loads.
Figure 6.
DC voltage at the output of the secondary section of the MVDC grid feeding to the tertiary side transmitting power: (a) Section 1; (b) Section 2; (c) Section 3; (d) Section 4.
Power is distributed to the different DC and AC loads after power conditioning and conversion, helping maintain power quality as required by the loads. Figure 7a,b show the typical DC voltage input and AC output to the inverter in the tertiary section of the grid, feeding AC propulsion motors and loads. To have better clarity, the steady-state output of the AC voltage fed to the two propulsion motors is expanded in time and shown in Figure 8a and Figure 8b, respectively. A pertinent DC-AC inverter is designed to represent a variable-voltage, constant-frequency source, converting constant DC voltage into variable-magnitude AC at power frequency (i.e., 50 Hz). Subsequently, a sine filter is cascaded with the DC-AC inverter circuit output to eliminate high-frequency disturbances and harmonics. Consequently, the DC-AC inverter output is adjusted to the load’s magnitude requirement at 50 Hz, the power frequency. For instance, the AC voltage to energise the two propulsion motors is set to 2000 at power frequency, while that for the two AC loads is 250 at 50 Hz, the power frequency.
Figure 7.
AC voltage (2000 V, 50 Hz) inverted from DC to AC and filtered and distributed to the AC loads that are interconnected at the output stage of the tertiary section of the MVDC grid: (a) Switch 1; (b) Switch 2.
Figure 8.
Enlarged view of the AC Voltage (2000 V, 50 Hz) inverted from DC to AC and filtered using sine-wave filters and distributed to the AC loads that are interconnected at the output stage of the tertiary section of the MVDC grid: (a) Switch 1; (b) Switch 2.
It becomes clear from Figure 7a,b and Figure 8a,b that the AC voltage fed to the propulsion motors is sinusoidal in nature. These figures show that no harmonics are present in the AC voltage supplied to the AC motors. Since the inverter used also includes a sine wave filter, harmonics are eliminated, the voltage magnitude can be controlled, and the spectral purity of the sine wave is retained.
Figure 9a,b show the AC voltage inverted from DC to AC and used to feed the AC loads interconnected at the tertiary side of the MVDC grid. Figure 9a,b show that it remains at 250 V at 50 Hz, the power frequency, to match the enlarged version of Figure 10a,b to ensure that the AC voltage applied to the load is spectrally pure and without harmonic distortion. The magnitude of the DC-AC inverter output is adjusted in such a way that it remains at 250 V at 50 Hz, power frequency, to meet the generic AC loads at the end user side of the grid.
Figure 9.
AC voltage (250 V, 50 Hz) inverted from DC to AC and filtered and distributed to the AC loads that are interconnected at the output stage of the tertiary section of the MVDC grid: (a) Switch 1; (b) Switch 2.
Figure 10.
Enlarged view of the AC voltage (250 V, 50 Hz) inverted from DC to AC and filtered using sine-wave filters and distributed to the AC loads that are interconnected at the output stage of the tertiary section of the MVDC grid.
In addition, another section, specifically designed to meet the requirements of DC loads interconnected to the tertiary section and available to the end user, is studied by generating constant DC voltage. Figure 11a,b show the DC voltage and the maximum DC current required to energise a series and parallel combination of loads, interconnected and available to the end user. The relevant magnitudes of DC voltage and DC current are set to 690 V DC and 700 A DC, respectively, to meet the requirements of low DC loads such as small compressor motors used in humidifiers, charging units, and so on. Similar to previous observations on DC, the settling times are much shorter, and the output reaches the steady state as quickly as possible.
Figure 11.
DC voltage and current of the DC load connected to the tertiary section of the MVDC grid: (a) Current. (b) Voltage.
Having investigated the steady-state conditions of the crucial parts of MVDC grids, their typical behaviour during short-circuit faults and the influence of inherent parameters represented by circuit constants are studied in the following subsection.
6.2. Response During Short-Circuit Faults
During this study, short-circuit faults are created at three locations in the MVDC grid: the primary section, the secondary section, and DC and AC loads. Subsequently, two aspects are investigated: first, the impact of short-circuit faults on the above locations and other locations of the grid and, second, the high-frequency behaviour of the fault currents with respect to the faults. The former might reveal the sensitivity of each section of the grid, and the latter would describe the type, nature, and characteristics of the fault and its location, influenced by the circuit parameters of the grid elements and components. In this context, the fault first occurs at the DC load, since it supplies consolidated current to the load.
Note that there is no doubt that a short-circuit fault occurring in the secondary section would alter the magnitude of voltage and current at the selected location. However, the induced effects on the other parts of the grid are crucial, as this information indicates the type of action necessary to initiate preventive measures. For instance, if the induced effect causes higher currents, it indicates faster fault clearance at these locations, whereas at the load side, this would manifest as a drop in voltage, which would hinder the normal functionality of the loads. This information is particularly valuable when developing fault management algorithms.
Figure 12 shows the typical response of current at the DC load during a short-circuit fault. As mentioned earlier, the operating voltage and current of the DC load supplying the end users are rated 690 V and 700 A. Comparatively, the initial switching transient and oscillations remain similar to the no-fault condition. As soon as the short-circuit fault occurs, the magnitude of the current shoots up through several oscillations to a larger value, i.e., to a peak value close to 3000 A. In addition, this fault current seems to be highly uncorrelated with the steady-state value. This indicates the possibility of using a sensor to directly decouple these high-frequency signals from the load side. Following this, the effects of short-circuit faults on other parts or sections of the MVDC grid are studied.
Figure 12.
Grid current at the DC load interconnected with the tertiary section of the MVDC grid during a short-circuit fault.
The impact of short-circuit faults appears to affect other AC and DC loads. In particular, the AC voltage applied to the propulsion motors (shown in Figure 13) seems to drop to a certain value (i.e., close to approximately 15 to 20 %); however, it regains its original value as soon as the fault is isolated. This value is slightly large, which might alter the operating condition of the propulsion motor, disrupting the speed and torque developed, requiring immediate attention. This indicates that the fault management strategy does not need to isolate the load; however, it may also require an algorithm that triggers the inverter circuit to maintain the voltage at a constant value. At the same time, the induced effect of short-circuit faults does not distort the spectral purity of the AC voltage or current.
Figure 13.
Induced effect of short-circuit fault on the AC voltage providing energy to the propulsion motors connected with the tertiary section of the MVDC grid.
Further investigations of other parts or sections indicate induced effects on their respective voltage and current, similar to those observed for an AC load and a propulsion motor. Figure 14 shows the voltage in the secondary section of the MVDC grid feeding the tertiary side. Surprisingly, the short-circuit fault at the DC load has induced attenuation in the secondary-side voltage. During the period of short-circuit fault, the secondary-side voltage has dropped to a smaller value (i.e., close to approximately ); however, it is restored to its original value once the fault is removed. In addition, the figure shows that the short-circuit fault has introduced minor oscillations in the voltage magnitude. This indicates a high-frequency response of circuit parameters to the fault condition at the DC load.
Figure 14.
Induced effect of short-circuit faults on voltage of the secondary section of the MVDC grid feeding the tertiary side: (a) Section 1; (b) Section 2; (c) Section 3; (d) Section 4.
Similar observations could be made for the busbar tie (Figure 15a,b). The short-circuit fault at the DC load has introduced a small disturbance to the busbar-tie voltage. Figure 15a,b show the voltages at both the busbar ties in the secondary section of the MVDC grid. It appears from Figure 15a,b that the induced effect of the short-circuit fault has caused a minor drop in the busbar-tie voltage. This once again confirms the strong response of the circuit parameters to high-frequency disturbance introduced by the short-circuit fault. Also, both the busbar ties are affected by the short-circuit fault. As observed in the previous cases, the magnitude of the voltage which dropped to a certain value (i.e., close to approximately ) remains unaltered as soon as the fault is removed. So, even if the fault is not removed, the busbar voltage will be at a considerable value, feeding both the faulty and non-faulty sections of the grid. So, necessary actions might be necessary to remove the faulty section connected to the busbar tie or to the secondary section of the MVDC grid.
Figure 15.
Induced effect of short-circuit faults on the bus-tie voltage of the MVDC grid interconnecting the primary and secondary sections of the grid: (a) bus tie 1; (b) bus tie 2.
Figure 16a–d show the voltage output from the primary section of the grid. This figure shows that the fault-induced effect has propagated to the primary section of the grid, affecting its magnitude. The pertinent output voltage exhibits prolonged oscillations with a drop in amplitude. The respective drop in the magnitude of the DC voltage is close to , which is a considerable value. It appears that all the sections are equally affected by the short-circuit faults. As mentioned earlier, preventive action must be initiated to stop feeding power into the faulty circuit to minimise its effects on other parts of the grid.
Figure 16.
Induced effect of short-circuit faults on the voltage output from the primary section of the MVDC grid: (a) Section 1; (b) Section 2; (c) Section 3; (d) Section 4.
Comparatively, more deviations appear on the DC current output from the primary section of the MVDC grid. Figure 17a–d reveal that stronger effects are exerted on the DC current in the primary section. The oscillations are larger, while the drop in magnitude is close to . This indicates a stronger response of the DC link capacitor, which causes a sudden increase in magnitude, while the inherent circuit parameters introduce prolonged oscillations superimposed. Comparatively, it appears from these figures that the settling time is slightly altered to reach the steady-state condition. Following this, the typical behaviour of short-circuit faults occurring at heavy loads and their respective effects on other loads are studied. For this purpose, the fault created at the second AC load is studied.
Figure 17.
Induced effect of short-circuit faults on the current output from the primary section of the MVDC grid: (a) Section 1; (b) Section 2; (c) Section 3; (d) Section 4.
Figure 18a,b show the voltage and current of the heavy AC load in the tertiary section of the MVDC grid, affected by a short-circuit fault at the load side. It becomes clear from Figure 18a,b that larger voltage and currents suffer severely during the fault. The fault current remains high, forcing the voltage to drop by at least . As soon as the fault is mitigated, the voltage returns to the normal value. Nevertheless, such a larger increase in current and a drop in voltage might exacerbate the severity of the pertinent converters and other grid elements in the vicinity. Following this, the severity of the faults at heavy loads in other parts of the MVDC grid is studied.
Figure 18.
Impact of short-circuit faults on the heavy load in the tertiary section of the MVDC grid: (a) Current. (b) Voltage.
Figure 19a–c show the induced effect on other parts caused by short-circuit faults occurring at heavy load. As fault detection and monitoring procedures at heavy loads require stringent measures to enable quick reaction and mitigate the effects, faults at heavy loads force the DC voltage at loads and propulsion motors to drop to very low levels. In particular, the impact of the faults at heavy load forces the voltage at the respective instants to reach a value close to zero. This indicates the severity of short-circuit faults at heavy loads in the tertiary section of MVDC grids. So, it implies that fault detection and monitoring procedures at heavy loads require stringent procedures to enable quick reaction and mitigate premature failure.
Figure 19.
Induced effect of short-circuit faults occurring at heavy load in the tertiary section of the MVDC grid: (a) Impact on DC load voltage. (b) Impact on AC load voltage. (c) Impact on AC voltage applied to propulsion motor.
Figure 20a–c show the impact of a fault in the primary section of the grid induced by a strong short-circuit fault occurring at heavy load. As expected, the strong effect of short-circuit faults at heavy load can also be observed in the primary section of MVDC grids. During the fault, the output voltage in the primary section drops to at least of its steady-state value, further confirming the severity of the fault throughout the MVDC grid. On the contrary, a slightly different behaviour is observable while monitoring the grid current in the primary section. Figure 21a–d show the deviations in the current output from the primary section of the MVDC grid, induced by the short-circuit faults at heavy load. As opposed to the voltage, the current seems to increase to at least of the steady-state value. In addition, there are minor prolonged oscillations until the fault is cleared. This indicates that the primary side continues feeding the secondary and tertiary sections, enabling rapid clearance of the fault location to prevent any premature failures. Also, the minor oscillations indicate a stronger influence of the circuit parameters, resulting in prolonged oscillations induced by the fault conditions at heavy load.
Figure 20.
Induced effect of short-circuit faults on the voltage output from the primary section of the MVDC grid: (a) Section 1; (b) Section 2; (c) Section 3; (d) Section 4.
Figure 21.
Induced effect of short-circuit faults on the current output from the primary section of the MVDC grid: (a) Section 1; (b) Section 2; (c) Section 3; (d) Section 4.
The short-circuit faults occurring in the secondary section of the MVDC grid seem to affect both the primary and secondary sections equally. Figure 22a–c show the respective deviations in the voltages in the primary and tertiary sections of the grid caused by short-circuit faults in the secondary side. During the fault period, the voltage drops to approximately of the steady-state value. In addition, stronger oscillations occur during the fault and after it is cleared at the secondary side. This once again confirms the stronger influence of circuit elements that inherently contribute to the fault response. Similar observations could be made from the data obtained from DC and AC loads connected to the tertiary section of the MVDC grid. It becomes clear from Figure 23a–c that the faults in the secondary section equally affect the voltage and current at the load side. In particular, the DC load voltage (shown in Figure 23a) clearly drops to during the fault period. Further oscillations expand after fault clearance until the voltage reaches the steady state. The voltage required for AC load and propulsion motors is similar to or higher than this value. The voltage of the AC load (Figure 23b) and propulsion motor (Figure 23c) drops to a value close to during the fault period. After fault clearance, the voltage shoots up by a small percentage and drastically reduces as the steady state is reached.
Figure 22.
Induced effect of short-circuit faults on the voltage output from the primary section of the MVDC grid: (a) Section 1; (b) Section 2; (c) Section 3; (d) Section 4.
Figure 23.
Induced effect of short-circuit faults on the voltage output from the primary section of the MVDC grid on the tertiary section.
So, in this context, it is better to isolate the faulty section and reconnect an alternate path to the main source or use backup power to feed at least the motor loads. With this information gathered, the effects of faults induced in the primary section on other parts of the DC grid are studied.
Figure 24a–d show the voltage output from the primary section of the DC grid. The short-circuit fault is introduced in section 1 of the primary side, and the pertinent changes in voltages and currents in all other sections and nodes are recorded and analysed. Similar to previous observations, the voltage in the fault section (Figure 24a) is superimposed on larger peak currents and prolonged oscillations. However, the short-circuit fault has induced a voltage drop in other sections of the primary grid, followed by stronger oscillations. Similar observations could be made for grid currents (shown in Figure 25a–d) in the primary grid. The fault current (Figure 25) appears superimposed on the actual current, while the other sections of the primary grid act as a source feeding the fault current in section 1. This pattern is similar to previous observations on the secondary section, indicating the need to isolate the faulty section and to clear or mitigate fault current at the respective location.
Figure 24.
Impact of short-circuit faults on the voltage output from the primary section of the MVDC grid: (a) Section 1; (b) Section 2; (c) Section 3; (d) Section 4.
Figure 25.
Impact of short-circuit faults on the current output from the primary section of the MVDC grid: (a) Section 1; (b) Section 2; (c) Section 3; (d) Section 4.
Further results on the tertiary section of the grid at the load side reveal a drop in the voltage magnitude. Figure 26a–c show the load voltage in the tertiary section of the MVDC grid. As in earlier observations, faults in the primary section of the grid cause a drop in voltage and current at the load side. Such a drop appears in voltage and current, irrespective of whether the load is DC or AC.
Figure 26.
Induced effect of short-circuit faults on the voltage in the tertiary section feeding the DC and AC loads: (a) DC load; (b) AC load; (c) AC voltage of propulsion motors.
Thus, these results indicate that faults in any section propagate and induce effects on voltage and current. As observed, fault currents are high-frequency signals, and they may exhibit a specific pattern that can help discriminate fault type and/or location, and so on. In order to understand this, the fault currents are recorded and deconvoluted in the frequency domain and further studied.
6.3. Time and Frequency Characteristics of Fault Currents
Prior investigations on steady-state and fault conditions revealed direct and induced responses in the different sections of the MVDC grid. Pertinent responses exhibit a typical pattern depending on the short-circuit fault location, device proximity, voltage and current magnitudes, and so on. The occurrence of short-circuit faults directly affects the grid at the relevant location by forcing momentary, high-amplitude, oscillatory currents and voltages that superficially overlap with the steady-state response. At the same time, these faults have different effects on other parts of the grid that are farther away from their point of occurrence. The induced effect of faults causes a momentary drop in voltage, while the current magnitude increases and becomes oscillatory. Such conditions prevail until the fault is cleared and normalcy is restored. The higher amplitude and oscillatory currents indicate a strong response from the inherent circuit parameters of grid elements and components, such as transmission lines and cables, and can be used to analyse the severity of fault conditions and assess the diagnostic status of devices. The best way to obtain this information is to study the time and frequency characteristics of such fault currents measured at different locations of the grid network. Figure 27a–c show the characteristics of the fault current with respect to time.
Figure 27.
Time and frequency characteristics of fault currents recorded at their location: (a) Primary section (a,d). (b) Secondary section (b,e). (c) Tertiary section (c,f), DC load.
It becomes clear from Figure 27a–c that the location and devices in the proximity of the fault manifest a significant impact on the response current. The fault occurring in the primary section, close to the generator (Figure 27a), emerges as oscillatory, while in the secondary and tertiary sections, it is more or less pulsating in nature. In particular, the current occurring close to the tertiary section appears as sharp pulses, while in the secondary section, it manifests as close to triangular. Such differences in wave shapes of the fault current response could be attributed to the type of impedance at the fault location. For instance, it is predominantly resistive in nature in the tertiary section due to strong DC loads, while at the generator, it is oscillatory due to the collective response of strong inductance of the generator and DC link capacitor of the rectifier unit. Since the secondary section is predominantly used for transmission, it is predominantly resistive and inductive, resulting in currents resembling a triangle wave. Similar observations could also be made for the frequency characteristics of fault currents.
Figure 27d–f show the typical magnitude–frequency response characteristics of fault currents measured in different sections of the grid. As expected, Figure 27d,f show that a clear discrimination can be made between faults occurring close to the primary and tertiary sections, respectively. Comparatively, the fault currents near the DC loads in the tertiary section exhibit a magnitude–frequency function at discrete frequencies, although they also spread throughout the spectrum. On the contrary, the magnitude–frequency function of the fault currents recorded shows stronger magnitude at low frequencies and is slowly damped out as the frequency increases.
The reason for such behaviour can be attributed to the typical impedance of the grid components and their respective interaction during a fault. Under normal conditions, these inherent parameters manifest only under transient conditions such as initial or intermediate switching functions. At the same time, fault conditions impose momentary, stronger transients that introduce high-frequency components, governed not only by the inherent circuit parameters of the grid components but also by parasitic elements. Naturally, the fault currents carry information about the fault condition governed by the type of grid component or apparatus in its proximity. Pertinent time- and frequency-domain characteristics of fault currents might reveal this information clearly in their magnitude–frequency response functions. As expected, the fault current recorded reveals not only the severity of the abnormality but also the type of grid apparatus in proximity.
7. Discussion
The results of this study are summarised and tabulated quantitatively in Table 2. In Table 2, the collective information on the steady-state and fault responses of grid components, recorded in different sections under normal or fault conditions, is provided. Upon comparison with Table 1, it can be observed that there is a slight reduction in steady-state values. The reason could be attributed to the mild influence of the inherent circuit parameters of the grid components, which introduce transient behaviour in voltage and currents, including overshoot, damping effects, and so on. At the same time, the direct impact of short-circuit faults introduces oscillatory currents with larger magnitudes. The influence of the oscillatory nature of fault currents and their position on the steady-state response can be clearly observed from the respective figures (i.e., Figure 12, Figure 13, Figure 14, Figure 15, Figure 16, Figure 17, Figure 18, Figure 19, Figure 20, Figure 21, Figure 22, Figure 23, Figure 24, Figure 25 and Figure 26), while their respective peak values are provided in Table 2.
The direct impact of fault currents results in magnitudes approximately higher than the steady-state values. This typical behaviour results from the direct impact of the fault response on the primary and tertiary sections of the grid, where the source and loads are present. On the contrary, the direct impact of faults occurring in the secondary section results in approximately higher currents than the steady-state values; however, the respective voltage drops to a value close to . This indicates that the secondary section, which is predominantly a transmission line, lacks source or load units and thus appears to reflect the induced response behaviour.
The induced effect of a short-circuit fault on the other sections of the grid seems to show similar patterns. Pertinent effects induced by fault forces cause the voltages and currents to drop below the steady-state response until the fault is cleared. For instance, a direct fault in the primary section of the grid induces effects on voltage and currents in the secondary section, reducing their values to of the steady-state response. However, similar situations in the tertiary section are specific to loads.
With this information, the following conclusions could be drawn from this study:
- Further investigations indicate that each and every element or component in a DC grid is represented in terms of its circuit equivalent, which adequately reveals the steady-state and transient responses and their typical characteristics. As expected, the circuit parameters strongly influence the transient phenomena. Circuit parameters such as resistance, inductance, and capacitance strongly govern the initial, faster rise times and later introduce oscillations superimposed on the DC voltage peak. The oscillations are damped out as soon as the settling time is reached, after which the values of voltage and current are governed by the circuit resistance. In DC circuits, particularly in the primary section of the grid, DC link capacitors exert a strong influence, causing overshoot in current amplitude, superimposed on a few minor oscillations. As time progresses, these overshoots and oscillations are damped out and settle at the expected value. Comparatively, the transient response of the primary grid appears to have faster rise times and stronger oscillations, whereas the busbar-tie response is slightly slower and less sensitive. As we reach the tertiary section of the grid, the transient behaviour appears slightly slower than in the primary section. All these behaviours collectively indicate that each node of the MVDC grid exhibits a specific behaviour, which is advantageous for developing a fault management scheme.
- Short-circuit faults at different locations of MVDC grids manifest specific behaviours. In particular, faults at heavy loads have a severe impact on the voltage and currents in other parts or sections of an MVDC grid. For instance, a fault at heavy load in the tertiary section of an MVDC grid forces larger currents from the primary section, which indicates faster clearance of the faulty section but also a slight overrating of the current path to withstand a momentary rise in voltage and current.
- Faults occurring at the load side of a grid manifest a specific pattern. The pertinent voltage drops to a certain value depending on the rating of the load, while steady-state currents are superimposed on fault currents. These fault currents are larger in magnitude and oscillatory; their influence can be understood from the equivalent circuit parameters of the grid components. At the same time, if the faults are elsewhere, then the corresponding load voltage and currents drop to a certain value, irrespective of whether it is DC or AC. For instance, if the load is lightly rated, the corresponding drop in voltage and current is smaller, i.e., say within , whereas at heavy loads, it remains as high as to . On the contrary, primary grids supply larger fault currents, which can reach up to depending on the type of load (heavy or light).
- The primary focus of this study is to understand the steady-state and transient behaviour of grid elements during short-circuit faults. The literature indicates that the linear circuit model adopted is widely used to represent terrestrial grid components and is limited to frequencies of up to 1 MHz [38]. The literature reports that the transient nature of short-circuit faults in MVDC grids in ship power systems is limited to a few microseconds, beyond which the resistive nature of power apparatus appears predominant. In this context, the linear circuit model is sufficient to capture the steady-state and transient behaviour of MVDC grid components. Further extension of these studies to understand impulse behaviour during surge over-voltage and over-current events during hard and soft switching operations of the converters requires a detailed non-linear model with dynamic equations, which also represents a limitation and a future direction.
Thus, it appears from this study that the equivalent circuit representation of each and every element in the grid is adequate enough to represent the transient, steady-state, and fault response phenomena. It appears that faults occurring at specific locations in the grid manifest a typical behaviour. The pertinent voltage drops for the duration of the fault, while larger currents are superimposed on the steady-state response, followed by larger oscillations. The grid section responsible for sourcing function supplies the required larger currents, indicating proper selection and isolation of fault current paths in the grid. In addition, the circuit parameters introduce oscillations in the voltage and current, which may contain not only diagnostic information but also the element’s status, location, and so on. In this context, more studies are required to extract this information, which is very valuable for developing a fault management algorithm. Since the protection concepts from land-based power systems cannot be directly used in the ship environment, any attempts to gather this information are high beneficial and desirable.
8. Conclusions
A circuit model of an actual MVDC grid is simulated, and its transient behaviour under short-circuit faults at different locations is investigated. The adequacy of these circuit-model-based representations for terrestrial power system elements has been substantially verified; however, they cannot be extended to the maritime environment. This study aims to simplify and modify the circuit model topology, verify its application to an MVDC ship power system, and investigate parameter effects under normal, steady-state, and fault conditions. Pertinent results presented here show that the transient behaviour not only indicates a fault condition but also provides information on fault characteristics and the diagnostic status of the faulty section of the grid. This information would allow for the development of a fault detection and management algorithm that could operate independently of the converter and grid control algorithms. Furthermore, the results also indicate that the overrating of the converter module for steady-state operation can be minimised, which might further help to reduce costs.
Future work will focus on evaluating the efficacy of the proposed configuration by extensive experiments on a demonstrator unit. A more realistic picture of the efficacy could emerge from extensive experiments done on a demonstrator. It is hoped that such an exercise will attract active support and involvement of shipbuilders. Once its suitability is adequately confirmed, it would serve as a valuable input for inclusion in the relevant standards on fault detection, isolation, and management in MVDC grids specific to ship power systems. As a further extension, the development of a complete circuit model with non-linear parameters and dynamic equations to capture the impulse behaviour of grid elements relevant to a ship power system is also under focus. This would further enhance the potential to understand and develop a dedicated smart fault detection and announcement system for ship power systems.
Author Contributions
Conceptualization, S.A., D.G. and C.W.; methodology, S.A.; software, S.A.; validation, S.A., D.G. and C.W.; formal analysis, S.A.; investigation, S.A.; resources, S.E.; data curation, S.A.; writing—original draft preparation, S.A., D.G., C.W., E.N. and S.E.; writing—review and editing, S.A., D.G., C.W., E.N. and S.E.; visualization, S.A.; supervision, S.E.; project administration, D.G.; funding acquisition, S.E. and D.G. All authors have read and agreed to the published version of the manuscript.
Funding
This research study was funded by German Aerospace Centre (DLR).
Data Availability Statement
There are no data associated with this manuscript.
Conflicts of Interest
The authors declare no conflicts of interest.
References
- Qazi, S.; Venugopal, P.; Rietveld, G.; Soeiro, T.B.; Shipurkar, U.; Grasman, A.; Watson, A.J.; Wheeler, P. Powering Maritime: Challenges and prospects in ship electrification. IEEE Electrif. Mag. 2023, 11, 74–87. [Google Scholar] [CrossRef] [Scilit]
- van der Sande, R.; Shekhar, A.; Bauer, P. Reliable DC Shipboard Power Systems—Design, Assessment, and Improvement. IEEE Open J. Indust. Electron. Soc. 2025, 6, 235–264. [Google Scholar] [CrossRef] [Scilit]
- Reed, G.F.; Grainger, B.M.; Sparacino, A.R.; Mao, Z.-H. Ship to Grid: Medium-Voltage DC Concepts in Theory and Practice. IEEE Power Ener. Mag. 2012, 10, 70–79. [Google Scholar] [CrossRef] [Scilit]
- Ericsen, T. The ship power electronic revolution: Issues and answers. In Proceedings of the 55th Annual IEEE Petroleum and Chemical Industry Conference (PCIC), Cincinnati, OH, USA, 14–17 September 2008; pp. 1–11. [Google Scholar]
- Staudt, V.; Bartelt, R.; Heising, C. Fault Scenarios in DC Ship Grids: The advantages and disadvantages of modular multilevel converters. IEEE Electrif. Mag. 2015, 3, 40–48. [Google Scholar] [CrossRef] [Scilit]
- Satpathi, K.; Ukil, A.; Pou, J. Short-Circuit Fault Management in DC Electric Ship Propulsion System: Protection Requirements, Review of Existing Technologies and Future Research Trends. IEEE Tran. Transp. Electr. 2018, 4, 272–291. [Google Scholar] [CrossRef] [Scilit]
- Kanellow, F.D.; Tsekouras, G.J.; Prousalidis, J. Onboard DC grid employing smart grid technology: Challenges, state of the art and future prospects. IET Electr. Syst. Transp. 2015, 5, 1–11. [Google Scholar] [CrossRef] [Scilit]
- Cuzner, R.M.; Singh, V. Future Shipboard MVdc System Protection Requirements and Solid-State Protective Device Topological Tradeoffs. IEEE J. Emerg. Sel. Top. Power Electron. 2017, 5, 244–259. [Google Scholar] [CrossRef] [Scilit]
- Babaei, M.; Shi, J.; Abdelwahed, S. A Survey on Fault Detection, Isolation, and Reconfiguration Methods in Electric Ship Power Systems. IEEE Access 2018, 6, 9430–9441. [Google Scholar] [CrossRef] [Scilit]
- Satpathi, K.; Ukil, A.; Nag, S.S.; Pou, J.; Zagrodnik, M.A. DC Marine Power System: Transient Behavior and Fault Management Aspects. IEEE Tran. Indus. Inform. 2019, 15, 1911–1925. [Google Scholar] [CrossRef] [Scilit]
- Yadav, S.; Qin, Z.; Bauer, P. Bipolar DC grids on ships: Possibilities and challenges. Elektrotech. Inf. 2022, 139, 458–467. [Google Scholar] [CrossRef] [Scilit]
- Deroualle, J.J.; Pescatori, D.; Dellacasa, A.; Davico, C. Comparison of short-circuit current calculations in DC shipboard power system for Fuse protection designing. Electr. Power Syst. Res. 2021, 199, 107353. [Google Scholar] [CrossRef] [Scilit]
- IEC Standard 61660-1; Short-Circuit Currents in DC Auxiliary Installations in Power Plants and Substations. IEC Standards: Geneve, Switzerland, 1997.
- Latorre, A.; Soeiro, T.B.; Geertsma, R.; Coraddu, A.; Polinder, H. Shipboard DC Systems—A Critical Overview: Challenges in Primary Distribution, Power-Electronics-Based Protection, and Power Scalability. IEEE Open J. Indust. Electron. Soc. 2023, 4, 259–286. [Google Scholar] [CrossRef] [Scilit]
- Zhou, D.; Zhao, Y.; Wang, Z.; He, X.; Gao, M. Review on Diagnosis Techniques for Intermittent Faults in Dynamic Systems. IEEE Trans. Ind. Electron. 2020, 67, 2337–2347. [Google Scholar] [CrossRef] [Scilit]
- Latorre, A.; Soeiro, T.B.; Fan, X.; Geertsma, R.; Popov, M.; Polinder, H. Pole-to-Pole Short-Circuit Categorization for Protection Strategies in Primary Shipboard DC Systems. IEEE Open J. Ind. Electron. Soc. 2024, 5, 596–615. [Google Scholar] [CrossRef] [Scilit]
- Shi, J.; Amgai, R.; Abdelwahed, S. Modelling of shipboard medium-voltage direct current system for system level dynamic analysis. IET Electr. Syst. Transp. 2015, 5, 156–165. [Google Scholar] [CrossRef] [Scilit]
- Pandey, A. Robust Steady-State Analysis of the Power Grid Using an Equivalent Circuit Formulation with Circuit Simulation Methods. Ph.D. Thesis, Carnegie Mellon University, Pittsburgh, PA, USA, 2019. [Google Scholar]
- Bromberg, D.; Jereminov, M.; Xin, L.; Hug, G.; Pileggi, L. An Equivalent Circuit Formulation of the Power Flow Problem with Current and Voltage State Variables. In Proceedings of the IEEE PowerTech (Power and Energy Society Conference), Eindhoven, The Netherlands, 29 June–2 July 2015. [Google Scholar]
- Jereminov, M.; Bromberg, D.M.; Pandey, A.; Xin, L.; Hug, G.; Pileggi, L. An equivalent circuit formulation for three-phase power flow analysis of distribution systems. In Proceedings of the 2016 IEEE/PES Transmission and Distribution Conference and Exposition (T&D), Dallas, TX, USA, 2–5 May 2016. [Google Scholar]
- Hebner, R.E.; Sulligoi, G. Electric Ship Technologies. Proc. IEEE 2015, 10, 2225–2228. [Google Scholar] [CrossRef] [Scilit]
- Ke, J.; Cong, C.; Qijuan, Z.; Tao, F.; Tianshu, B.; Haijun, L. Protection schemes and settings of DC distribution systems. IET Gen. Trans. Distrib. 2020, 14, 6754–6762. [Google Scholar] [CrossRef] [Scilit]
- Satpathi, K.; Balijepalli, V.M.; Ukil, A. Modeling and real-time scheduling of DC platform supply vessel for fuel efficient operation. IEEE Trans. Transp. Electrif. 2017, 3, 762–778. [Google Scholar] [CrossRef] [Scilit]
- Baran, M.E.; Mahajan, N.R. Overcurrent protection on voltage-source converter-based multiterminal DC distribution systems. IEEE Trans. Power Deliv. 2007, 22, 406–412. [Google Scholar] [CrossRef] [Scilit]
- Emhemed, A.A.S.; Burt, G.M. An advanced protection scheme for enabling an LVDC last mile distribution network. IEEE Trans. Smart Grid 2014, 5, 2602–2609. [Google Scholar] [CrossRef] [Scilit]
- Sneath, J.; Rajapakse, A.D. Fault detection and interruption in an earthed HVDC grid using ROCOV and hybrid DC breakers. IEEE Trans. Power Deliv. 2016, 31, 973–981. [Google Scholar] [CrossRef] [Scilit]
- Cinieri, E.; Fumi, A.; Salvatori, V.; Spalvieri, C. A new high-speed digital relay protection of the 3-kVdc electric railway lines. IEEE Trans. Power Deliv. 2007, 22, 2262–2270. [Google Scholar] [CrossRef] [Scilit]
- Das, J.C. Arc-Flash Hazard Calculations in LV and MV DC Systems—Part I: Short-Circuit Calculations. IEEE Trans. Ind. Appl. 2014, 20, 1687–1697. [Google Scholar] [CrossRef] [Scilit]
- Das, J.C. Arc-Flash Hazard Calculations in LV and MV DC Systems Part—II: Analysis. IEEE Trans. Ind. Appl. 2014, 20, 1698–1705. [Google Scholar] [CrossRef] [Scilit]
- Buja, G.; da Rin, A.; Menis, R.; Sulligoi, G. Dependable design assessment of integrated power systems for all electric ships. In Proceedings of the 2010 Electrical Systems for Aircraft, Railway and Ship Propulsion (ESARS), Bologna, Italy, 19–21 October 2010; pp. 1–8. [Google Scholar]
- Han, X.; Sima, W.; Yang, M.; Li, L.; Yuan, T.; Si, Y. Transient Characteristics Under Ground and Short-Circuit Faults in a ±500 kV MMC-Based HVDC System With Hybrid DC Circuit Breakers. IEEE Trans. Power Deliv. 2018, 33, 1378–1387. [Google Scholar] [CrossRef] [Scilit]
- Huang, Q.; Zou, G.; Wei, X.; Sun, C.; Gao, H. A non-unit line protection scheme for MMC-based multi-terminal HVDC grid. Int. J. Electr. Power Energy Syst. 2019, 107, 1–9. [Google Scholar] [CrossRef] [Scilit]
- Fonseca, A.; Salazar, G.; Quilumba, F.; Pérez-Yauli, F. Determination of the Thevenin equivalent in power grids using real records based on short circuit power. IET Gen. Trans. Distrib. 2021, 15, 13–23. [Google Scholar] [CrossRef] [Scilit]
- Song, J.; Cheah-Mane, M.; Prieto-Araujo, E.; Amorós, J.; Gomis-Bellmunt, O. Grid Equivalent Representation of Power Systems With Penetration of Power electronics. IEEE Trans. Power Deliv. 2023, 38, 2742–2756. [Google Scholar] [CrossRef] [Scilit]
- Premgamone, T.; Ortjohann, E.; Kortenbruck, J.; Holtschulte, D.; Schmelter, A.; Varada, S.D. Thévenin Equivalent Impedance Estimation for Power Electronic Devices in Smart Grids. In Proceedings of the 2022 International Symposium on Power Electronics, Electrical Drives, Automation and Motion (SPEEDAM), Sorrento, Italy, 22–24 June 2022; pp. 192–199. [Google Scholar]
- Smon, I.; Verbic, G.; Gubina, F. Local voltage-stability index using tellegen’s Theorem. IEEE Trans. Power Syst. 2006, 21, 1267–1275. [Google Scholar] [CrossRef] [Scilit]
- He, Z.Y.; Liao, K.; Li, X.P.; Lin, S.; Yang, J.W.; Mai, R.K. Natural frequency-based line fault location in HVDC lines. IEEE Trans. Power Deliv. 2014, 29, 2742–2756. [Google Scholar] [CrossRef] [Scilit]
- Styvaktakis, E.; Bollen, M.H.; Gu, I.Y. A fault location technique using high frequency fault clearing transients. IEEE Power Eng. Rev. 1999, 19, 58–60. [Google Scholar] [CrossRef] [Scilit]
- Huang, S.F.; Wang, X.G. A fault location scheme based on spectrum characteristic of fault-generated high-frequency transient signals. In Proceedings of the 2009 IEEE Power & Energy Society General Meeting, Calgary, AB, Canada, 26–30 July 2009; pp. 1–5. [Google Scholar]
- Wu, L.Y.; He, Z.Y.; Qian, Q.Q. A new single ended fault location technique using travelling wave natural frequencies. In Proceedings of the 2009 Asia-Pacific Power and Energy Engineering Conference, Wuhan, China, 28–30 March 2009; pp. 1–5. [Google Scholar]
- Song, G.B.; Cai, X.L.; Gao, S.P.; Suonan, J.L.; Li, G. Natural frequency based protection and fault location for VSC-HVDC transmission lines. In Proceedings of the 2011 International Conference on Advanced Power System Automation and Protection (APAP), Beijing, China, 16–20 October 2011; pp. 177–182. [Google Scholar]
- Song, G.; Chu, X.; Cai, X.; Gao, S.; Ran, M. A fault location method for VSC HVDC transmission lines based on natural frequency of current. Int. J. Electr. Power Energy Syst. 2014, 63, 347–352. [Google Scholar] [CrossRef] [Scilit]
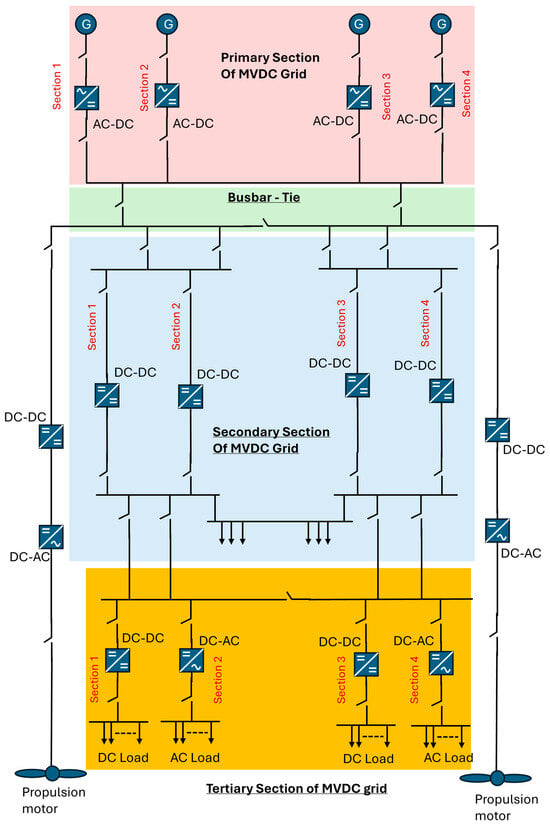
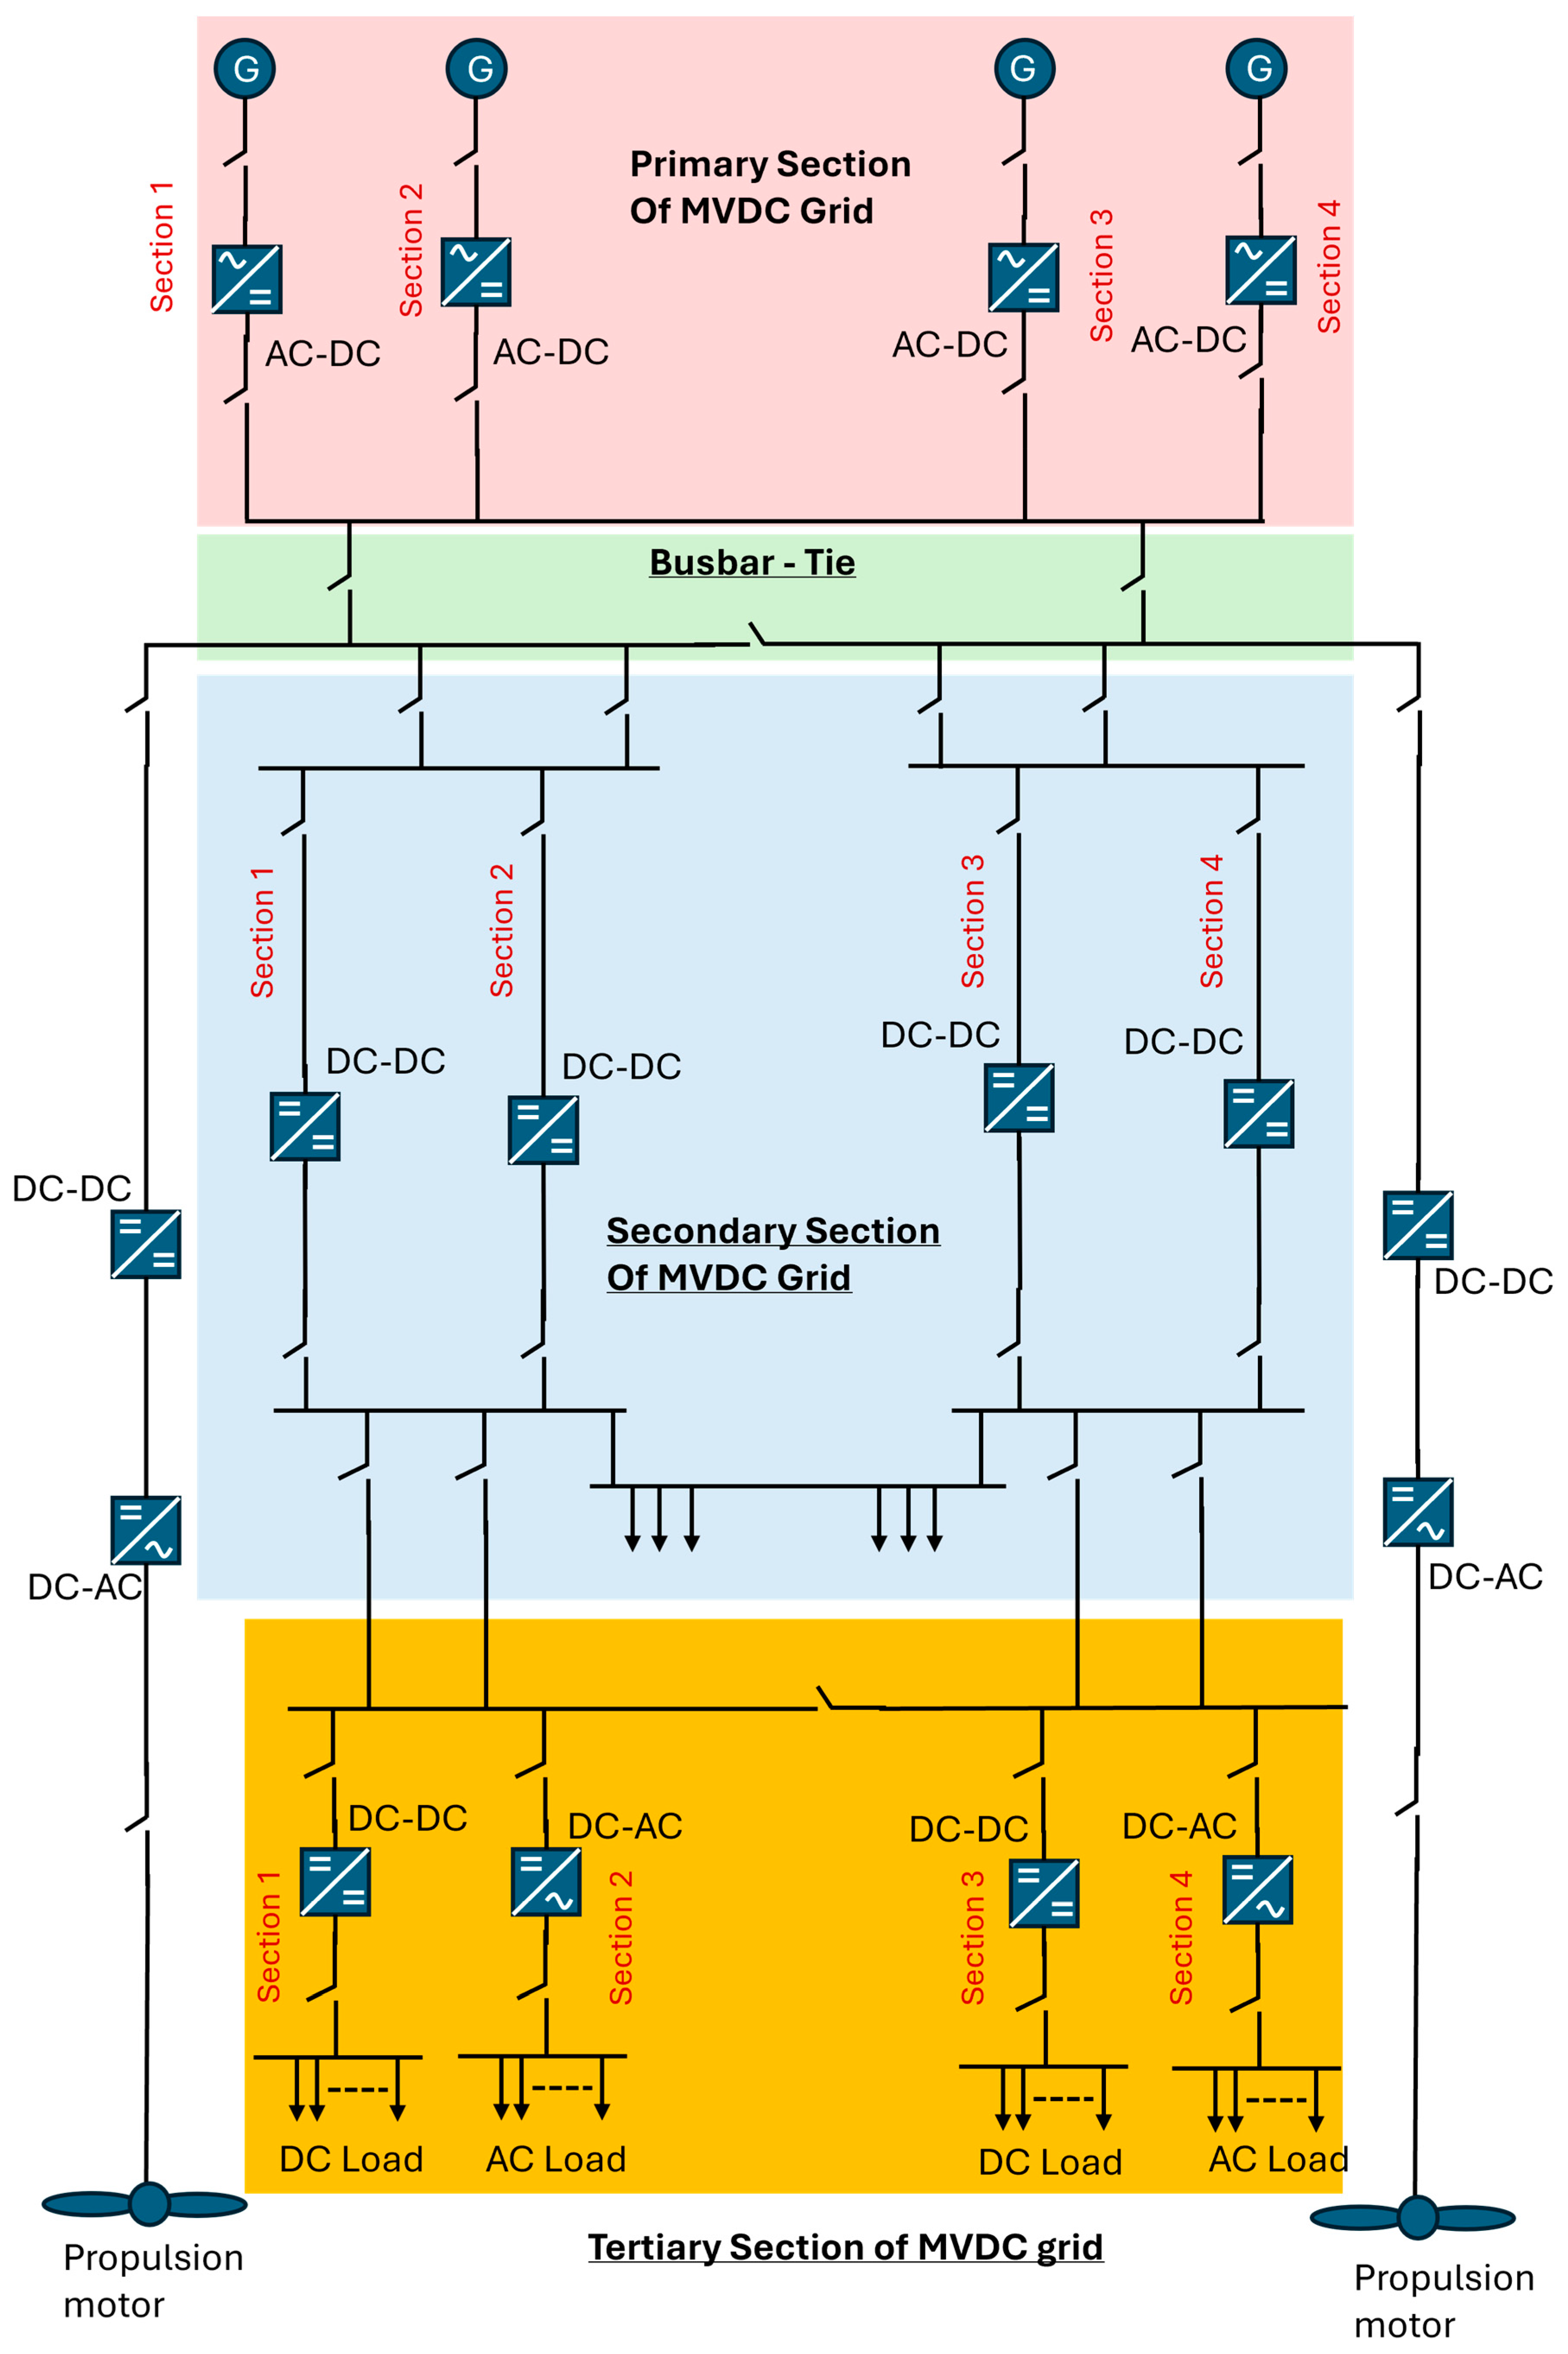
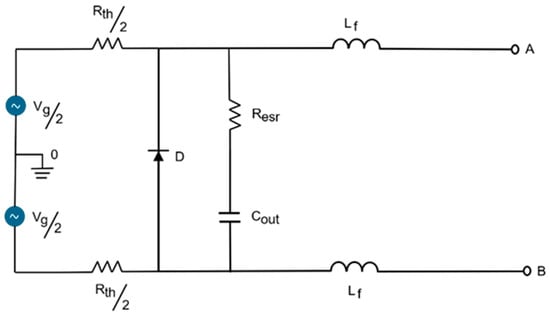
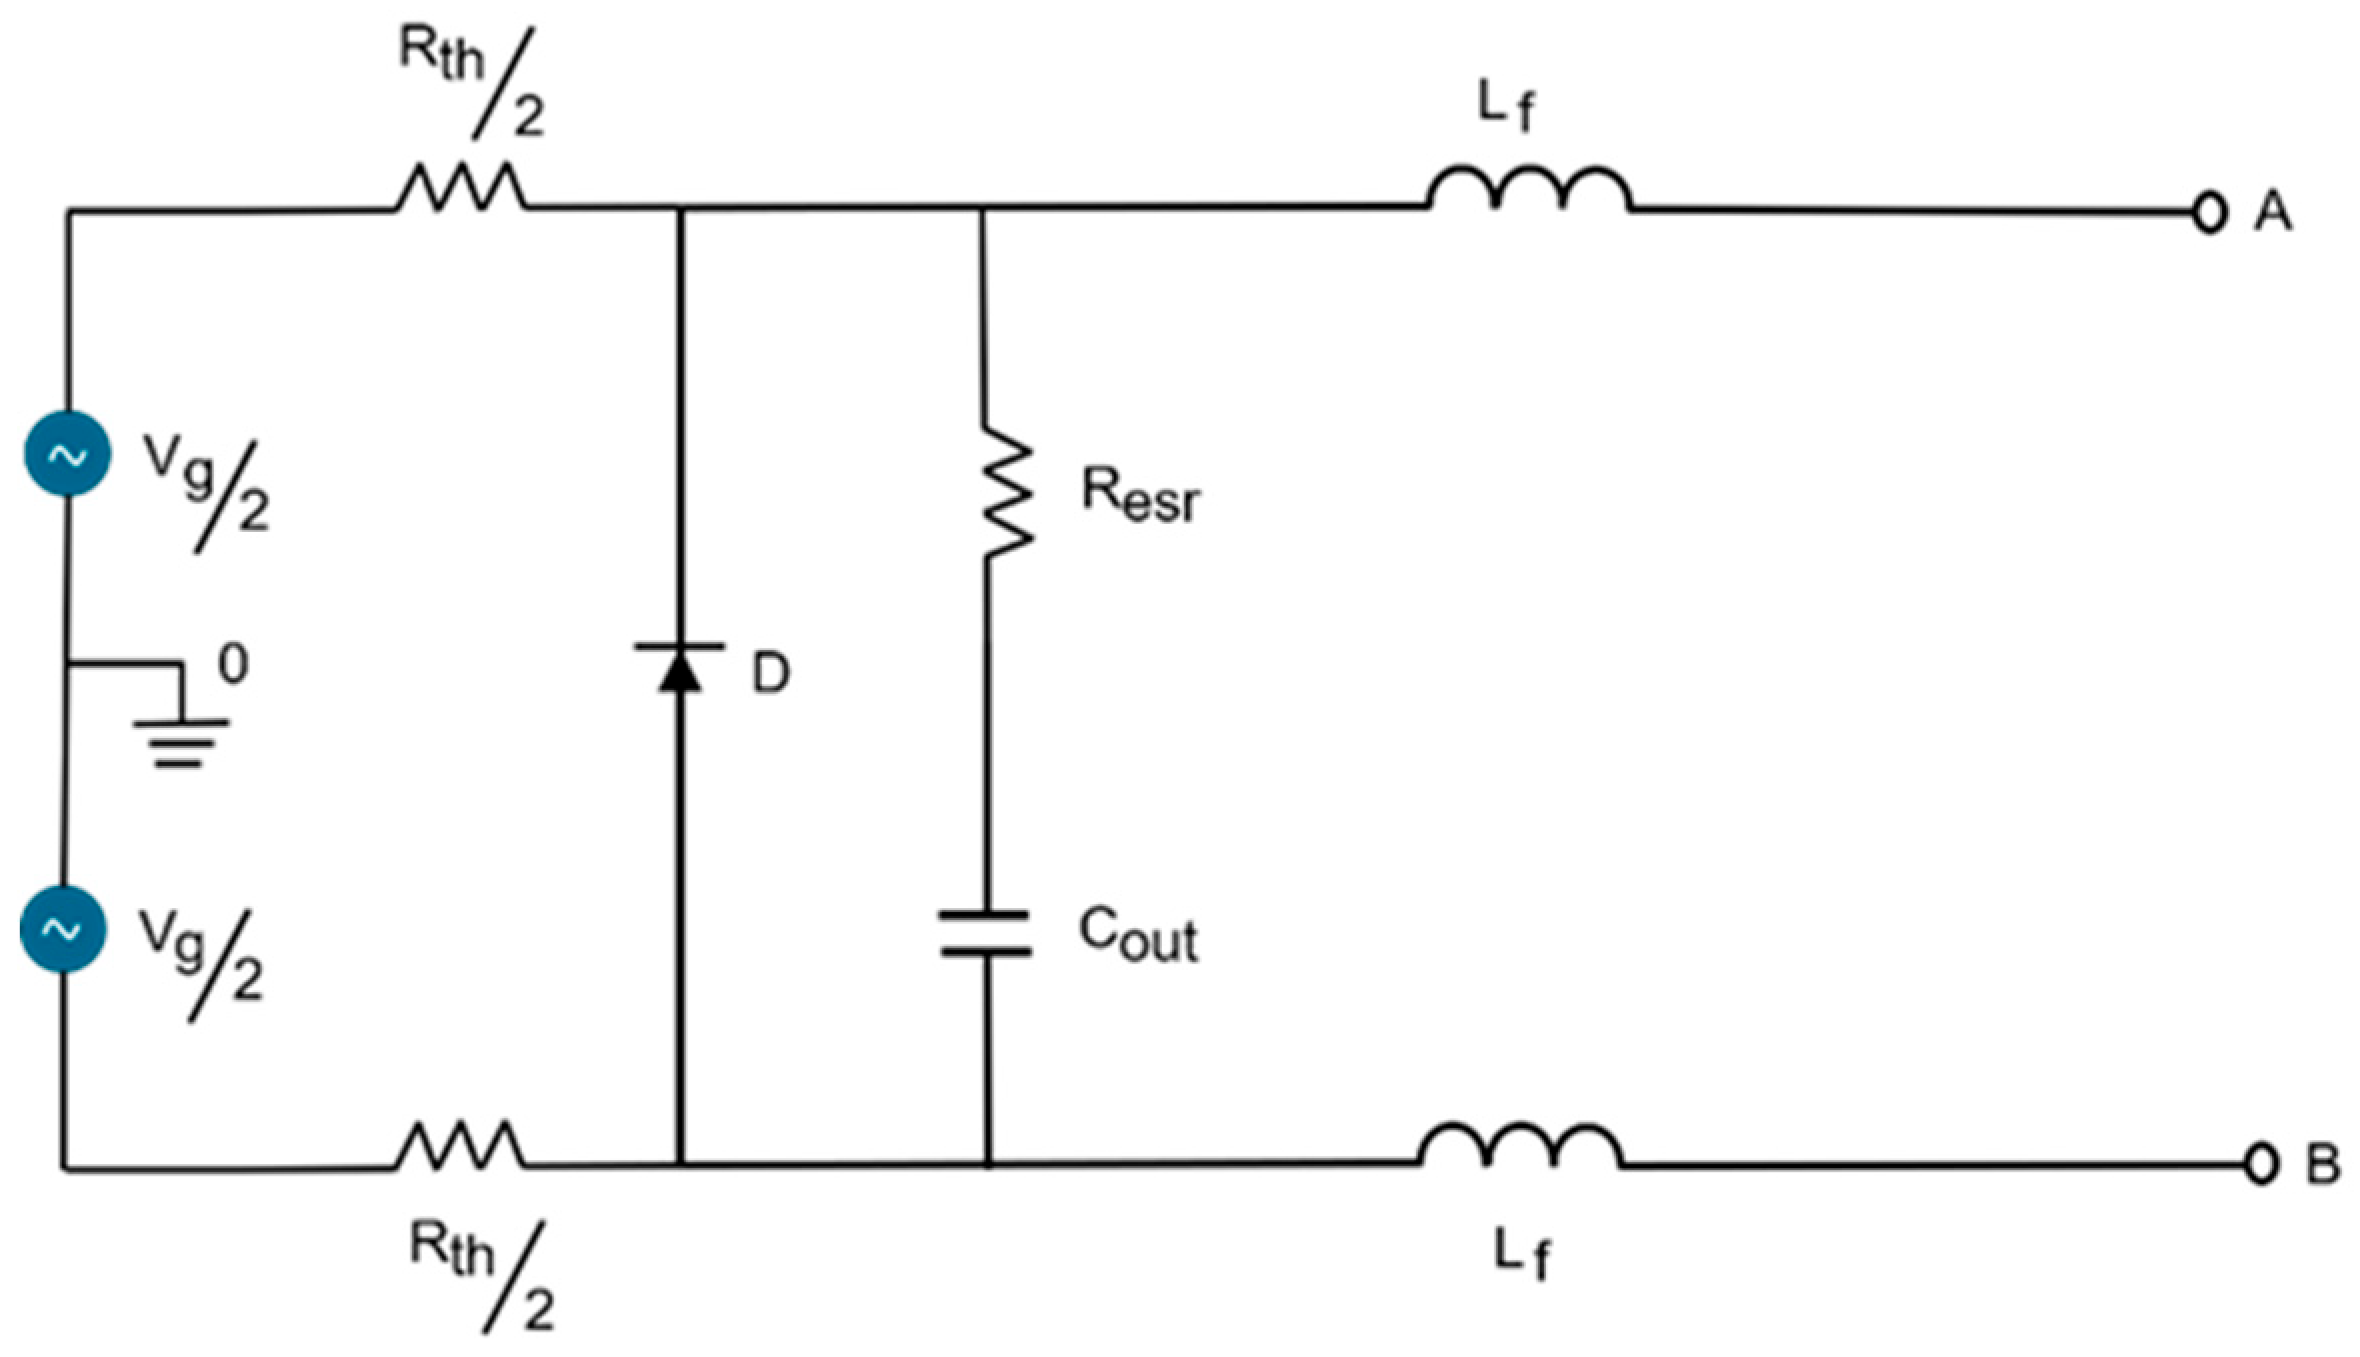
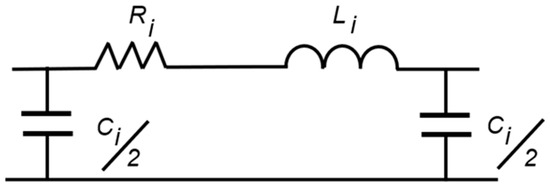
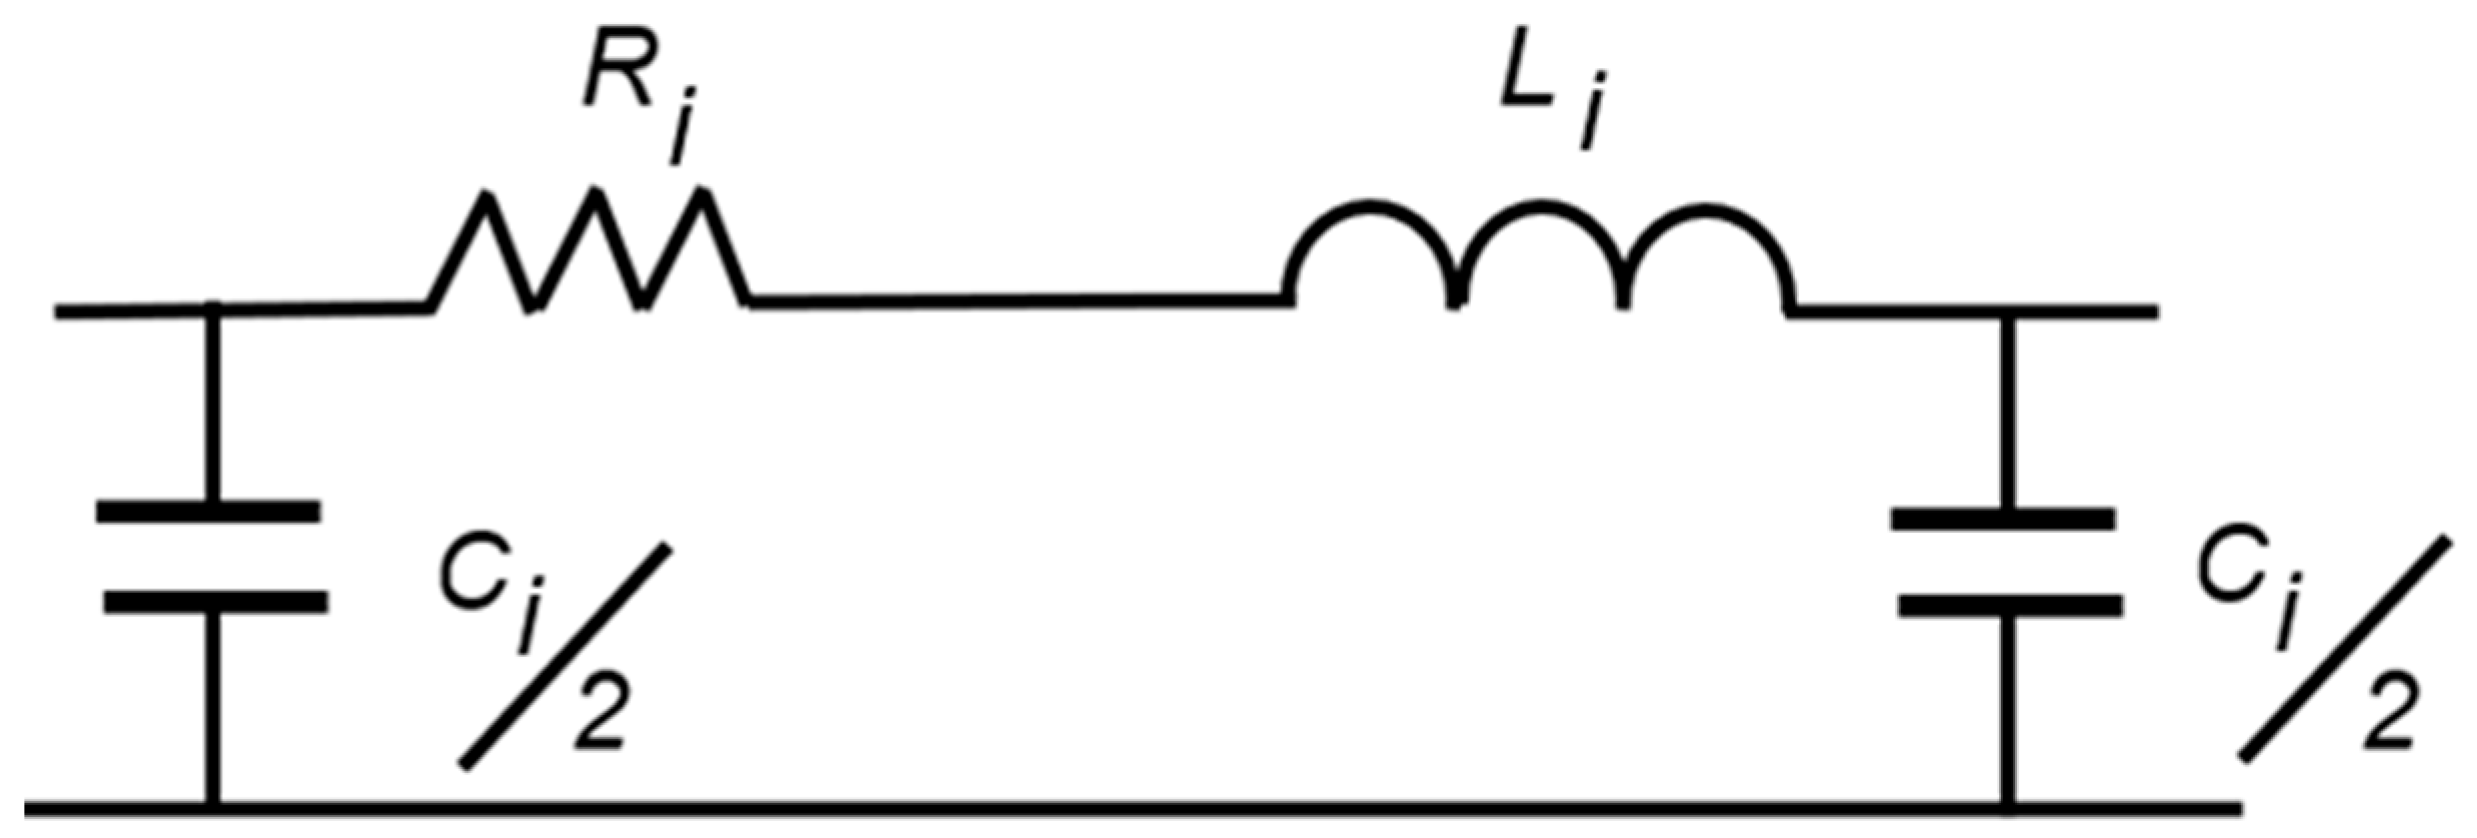
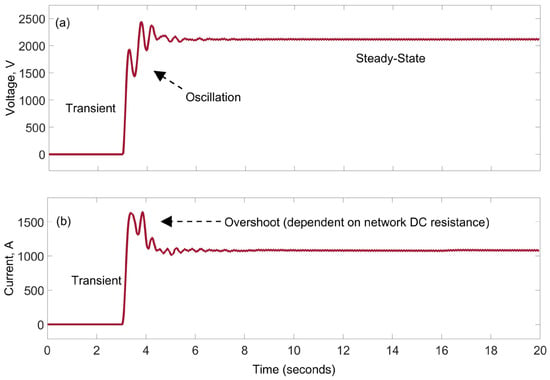
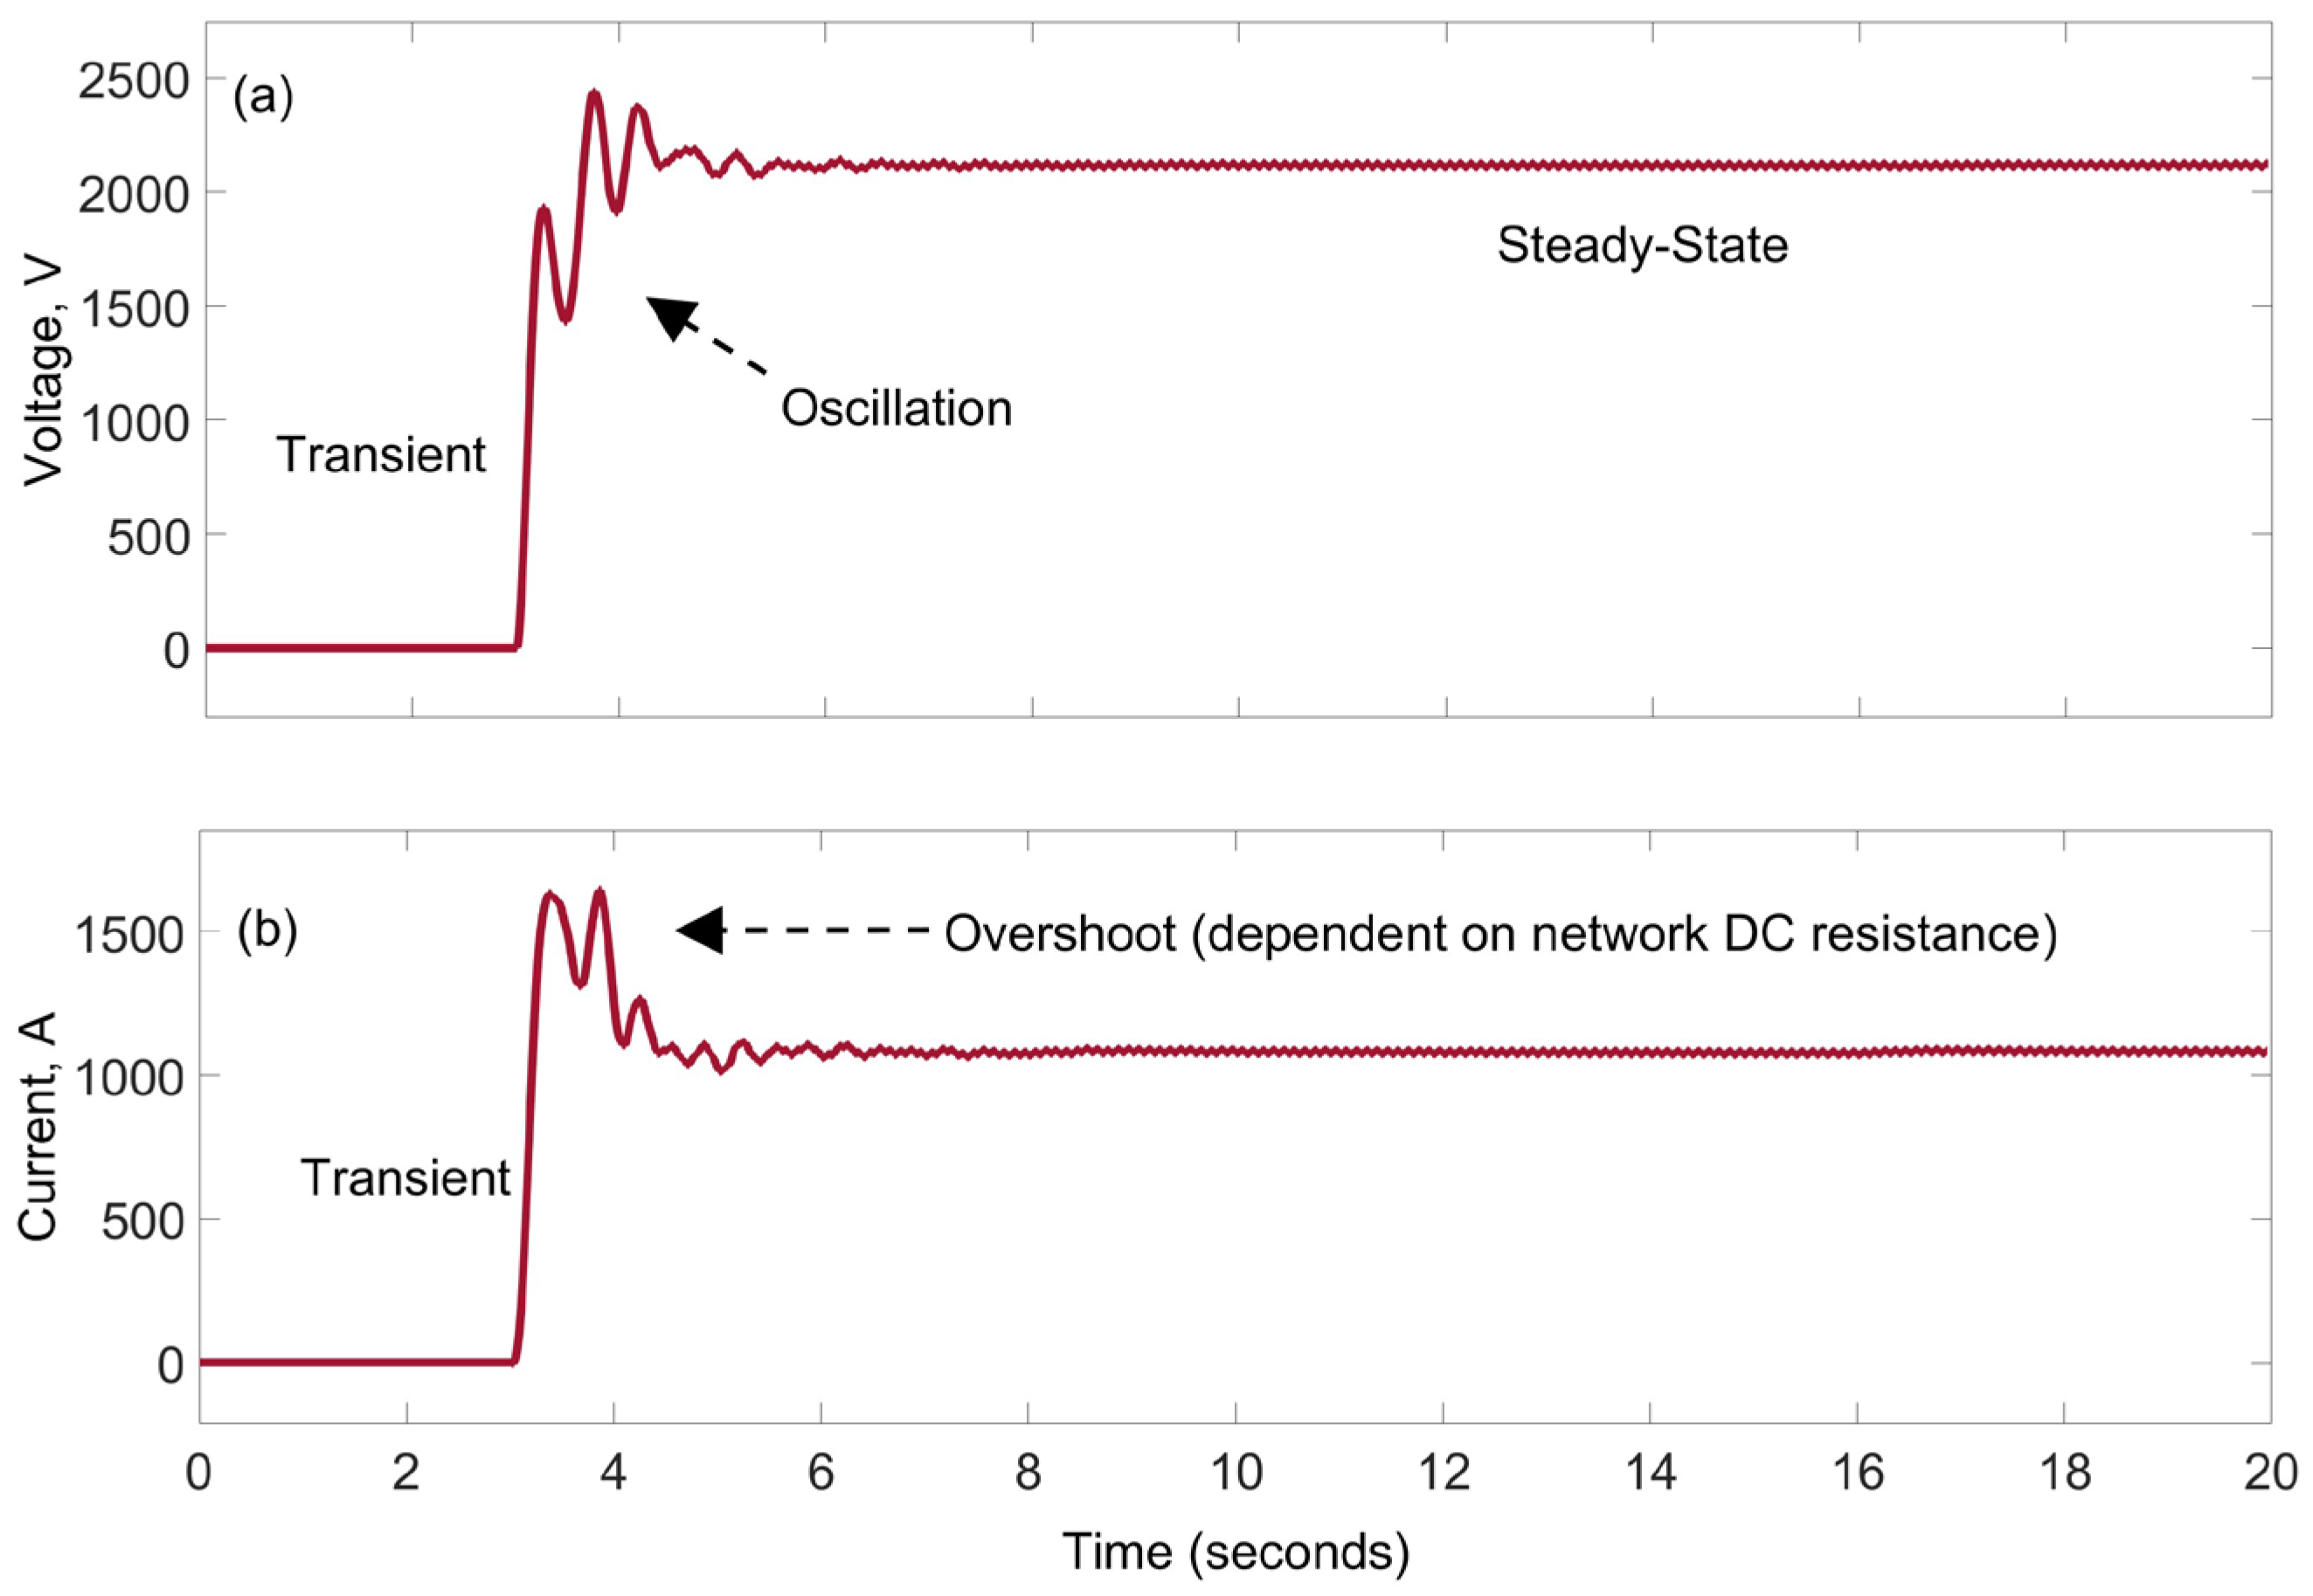
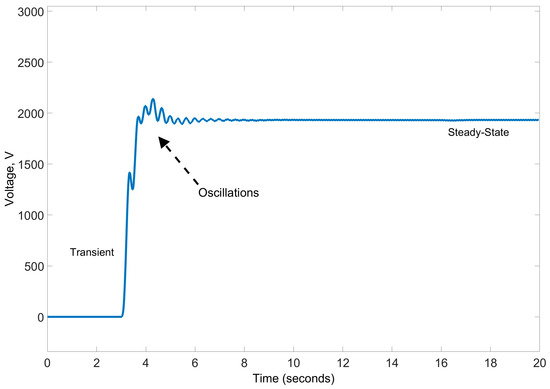
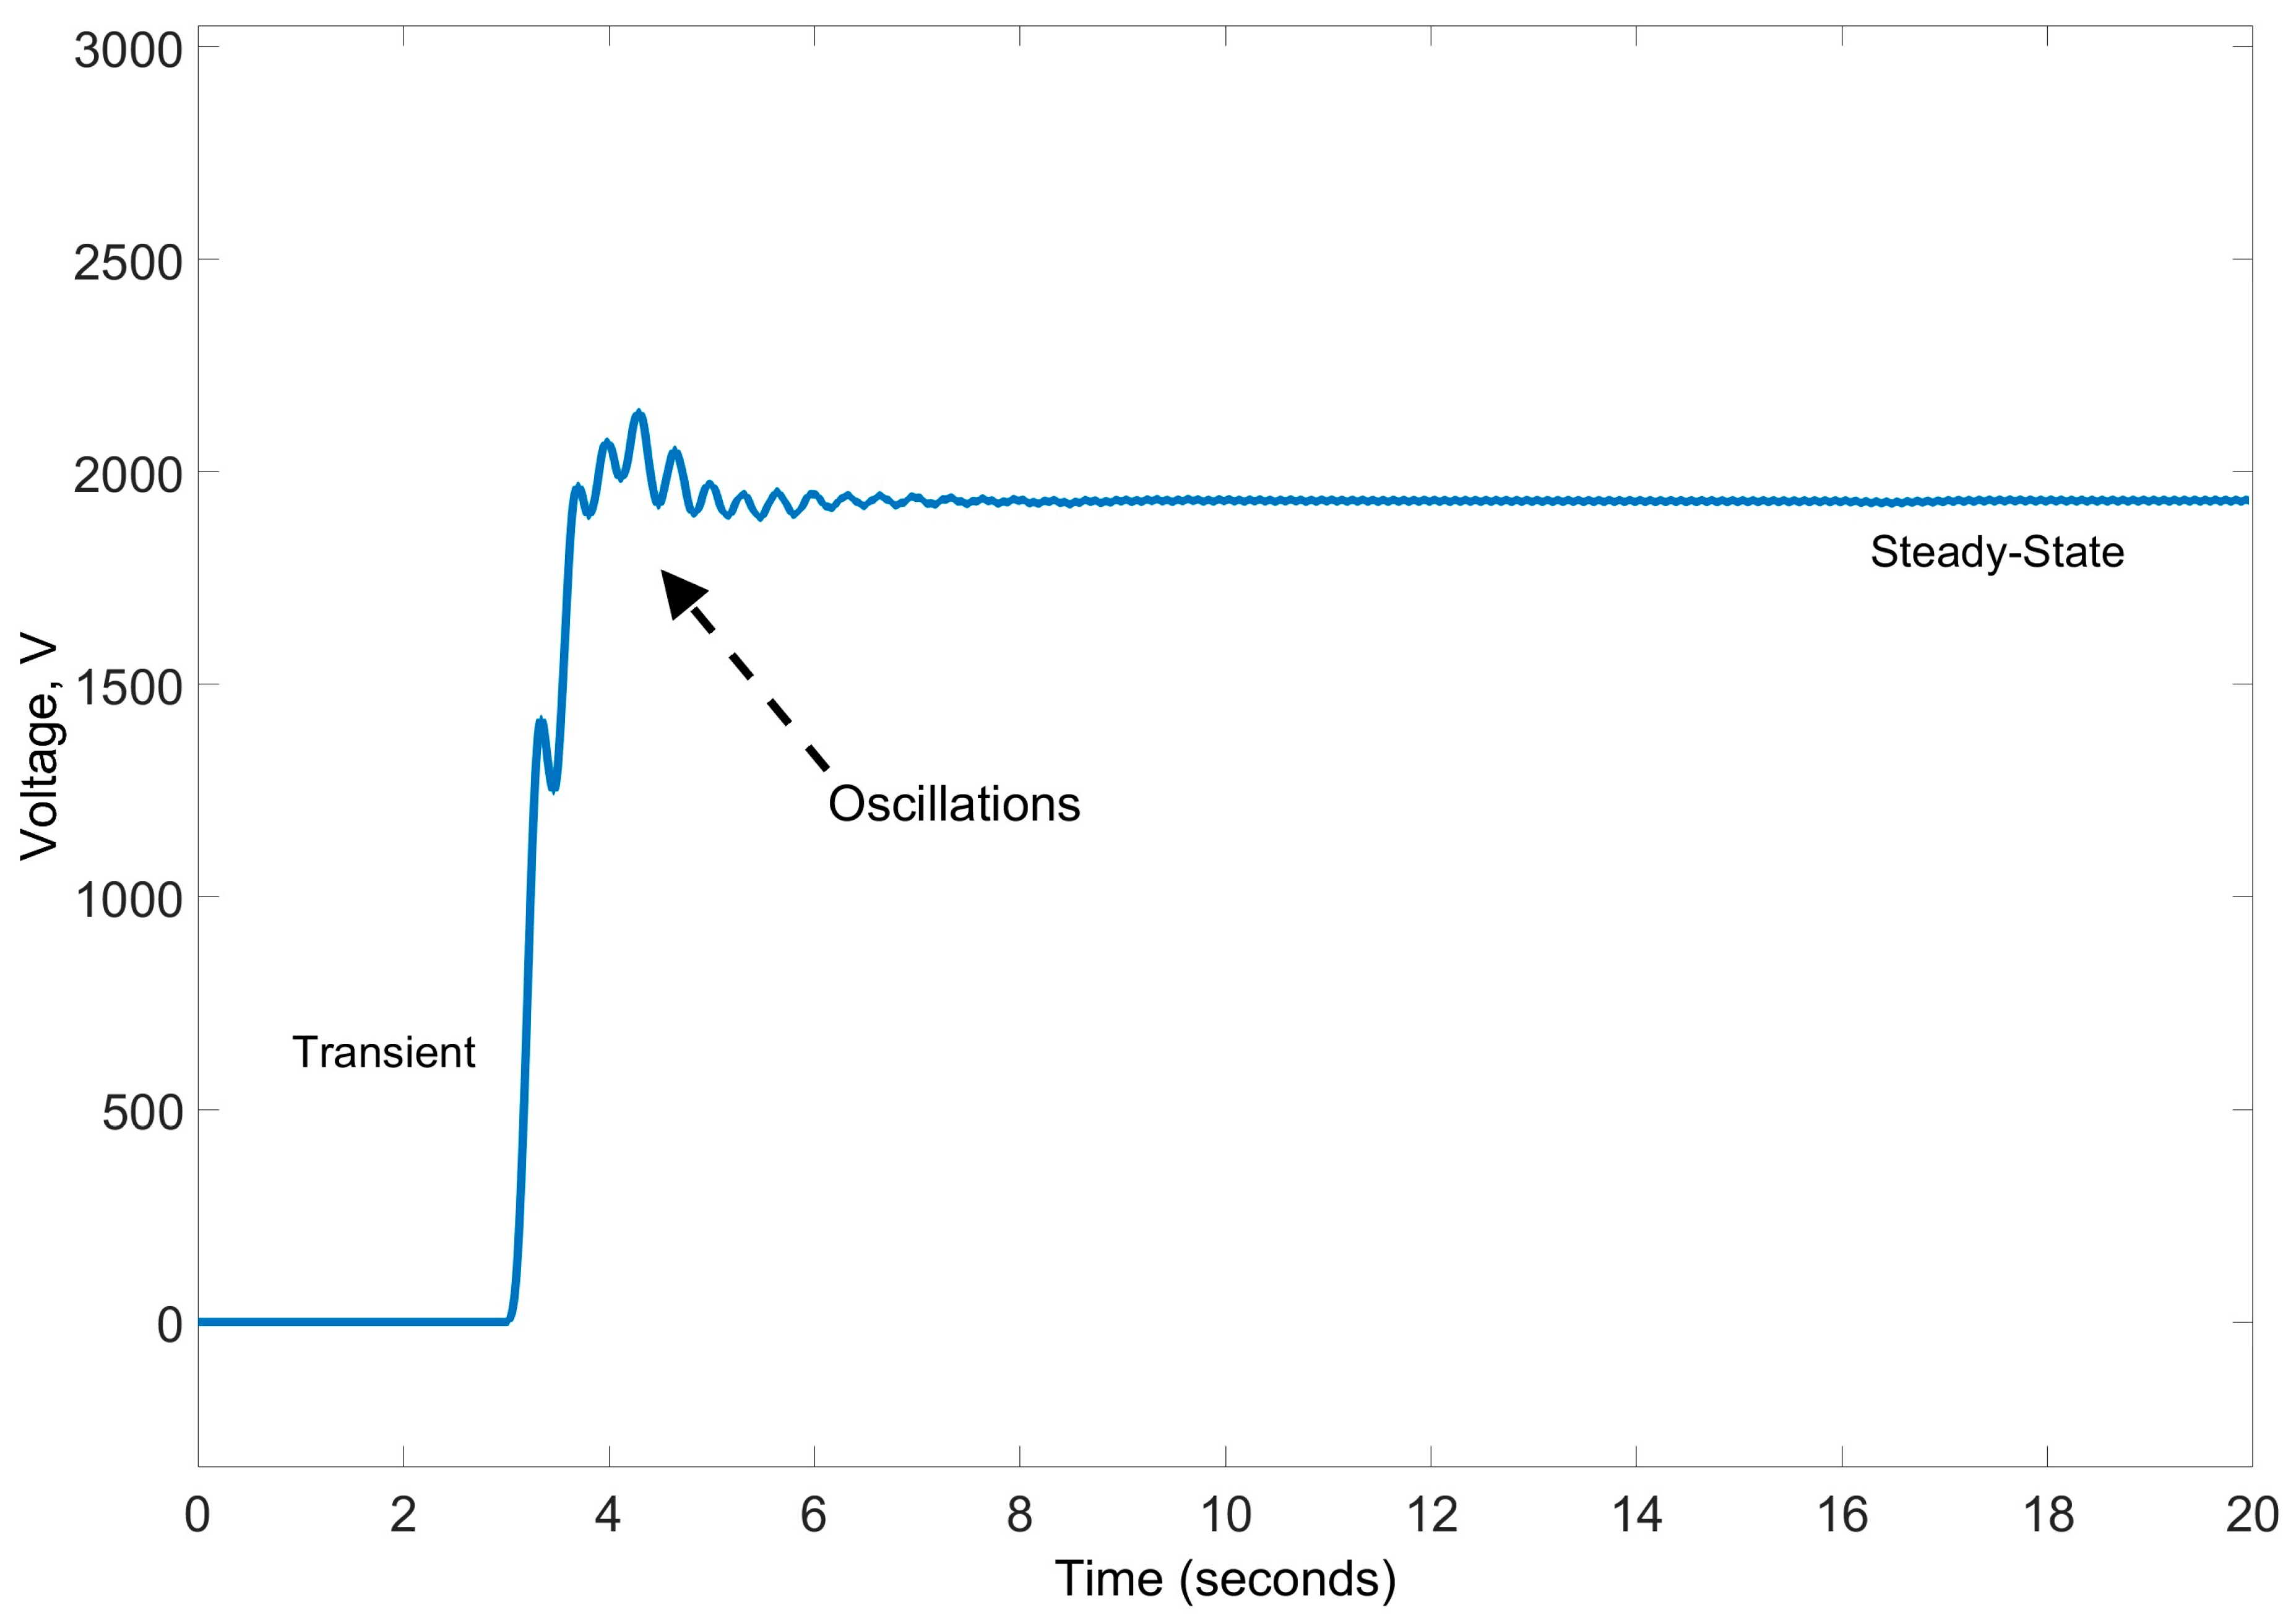
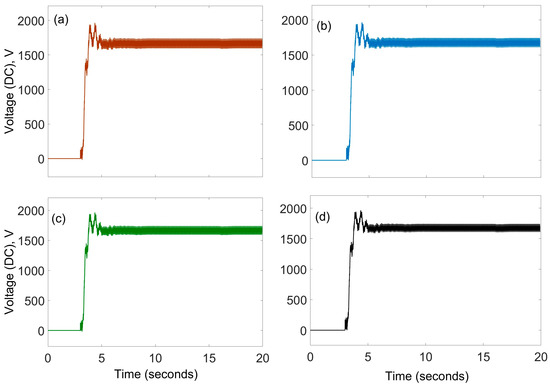
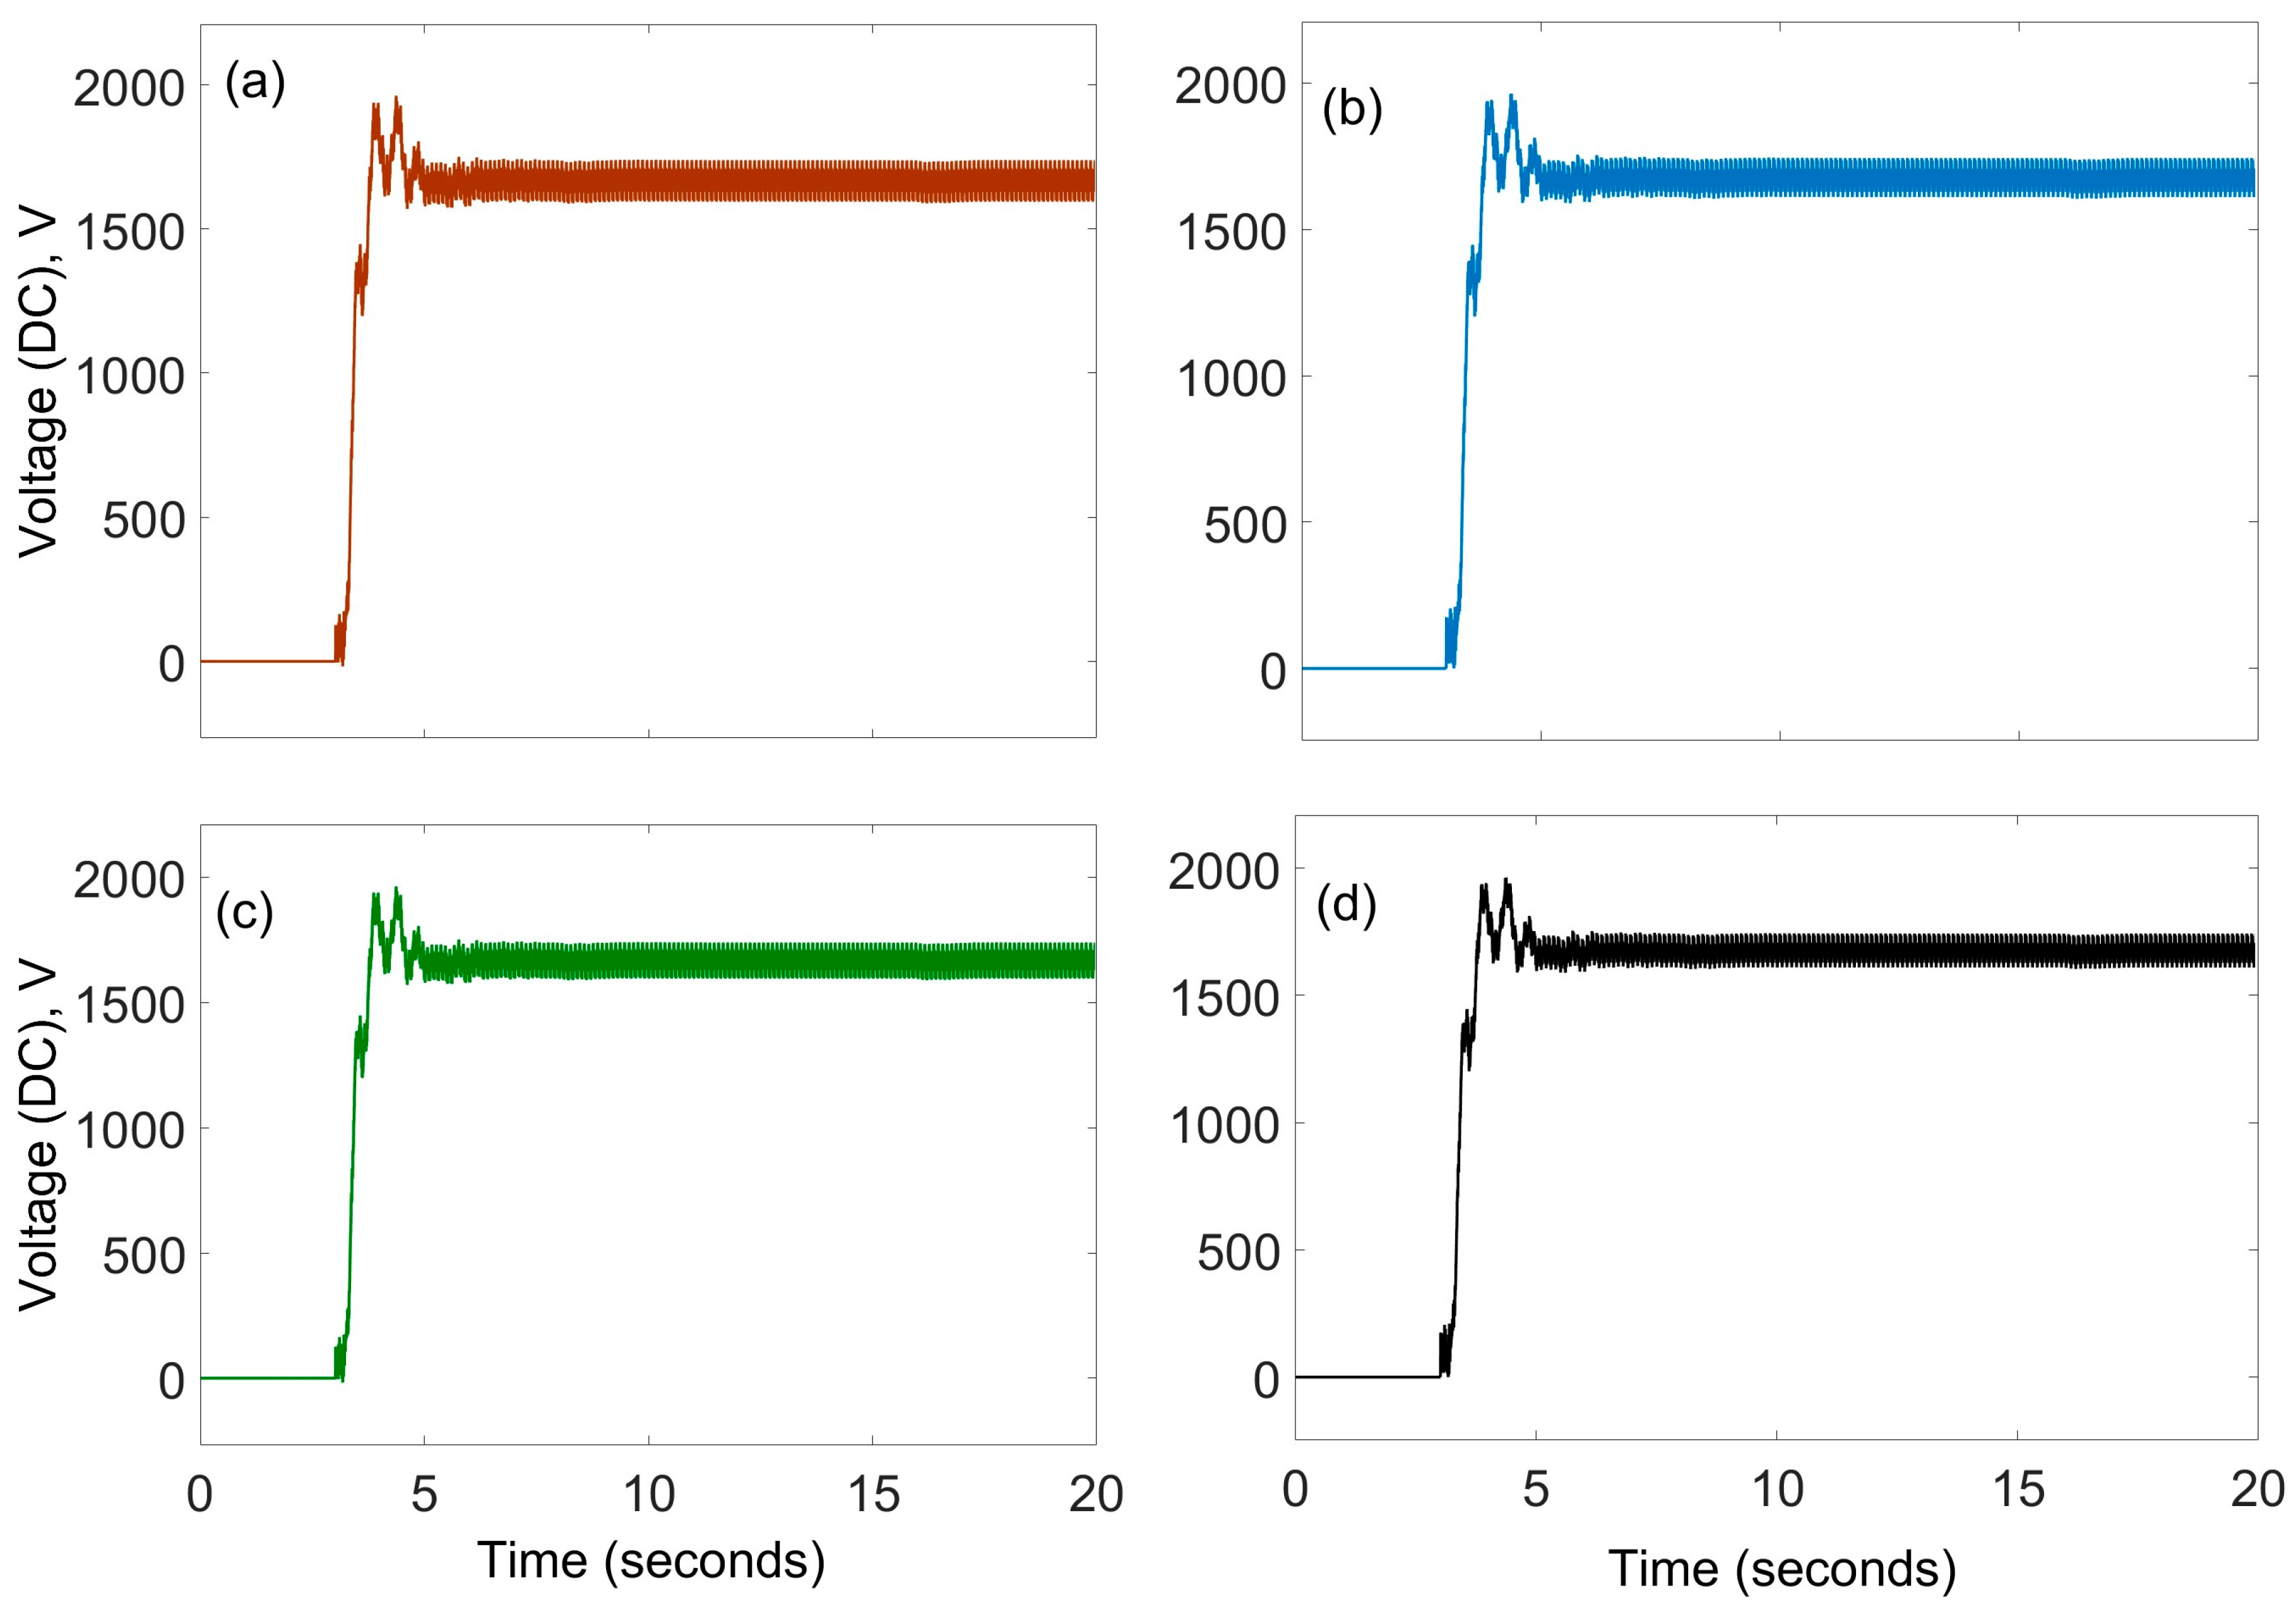
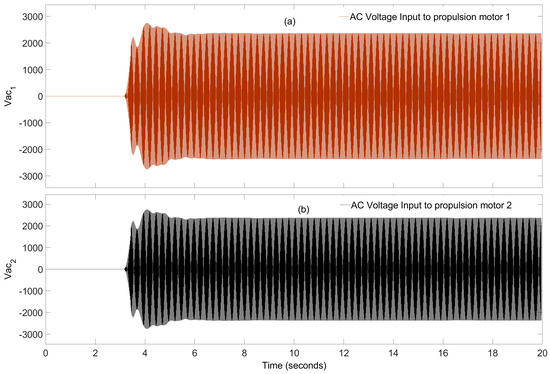
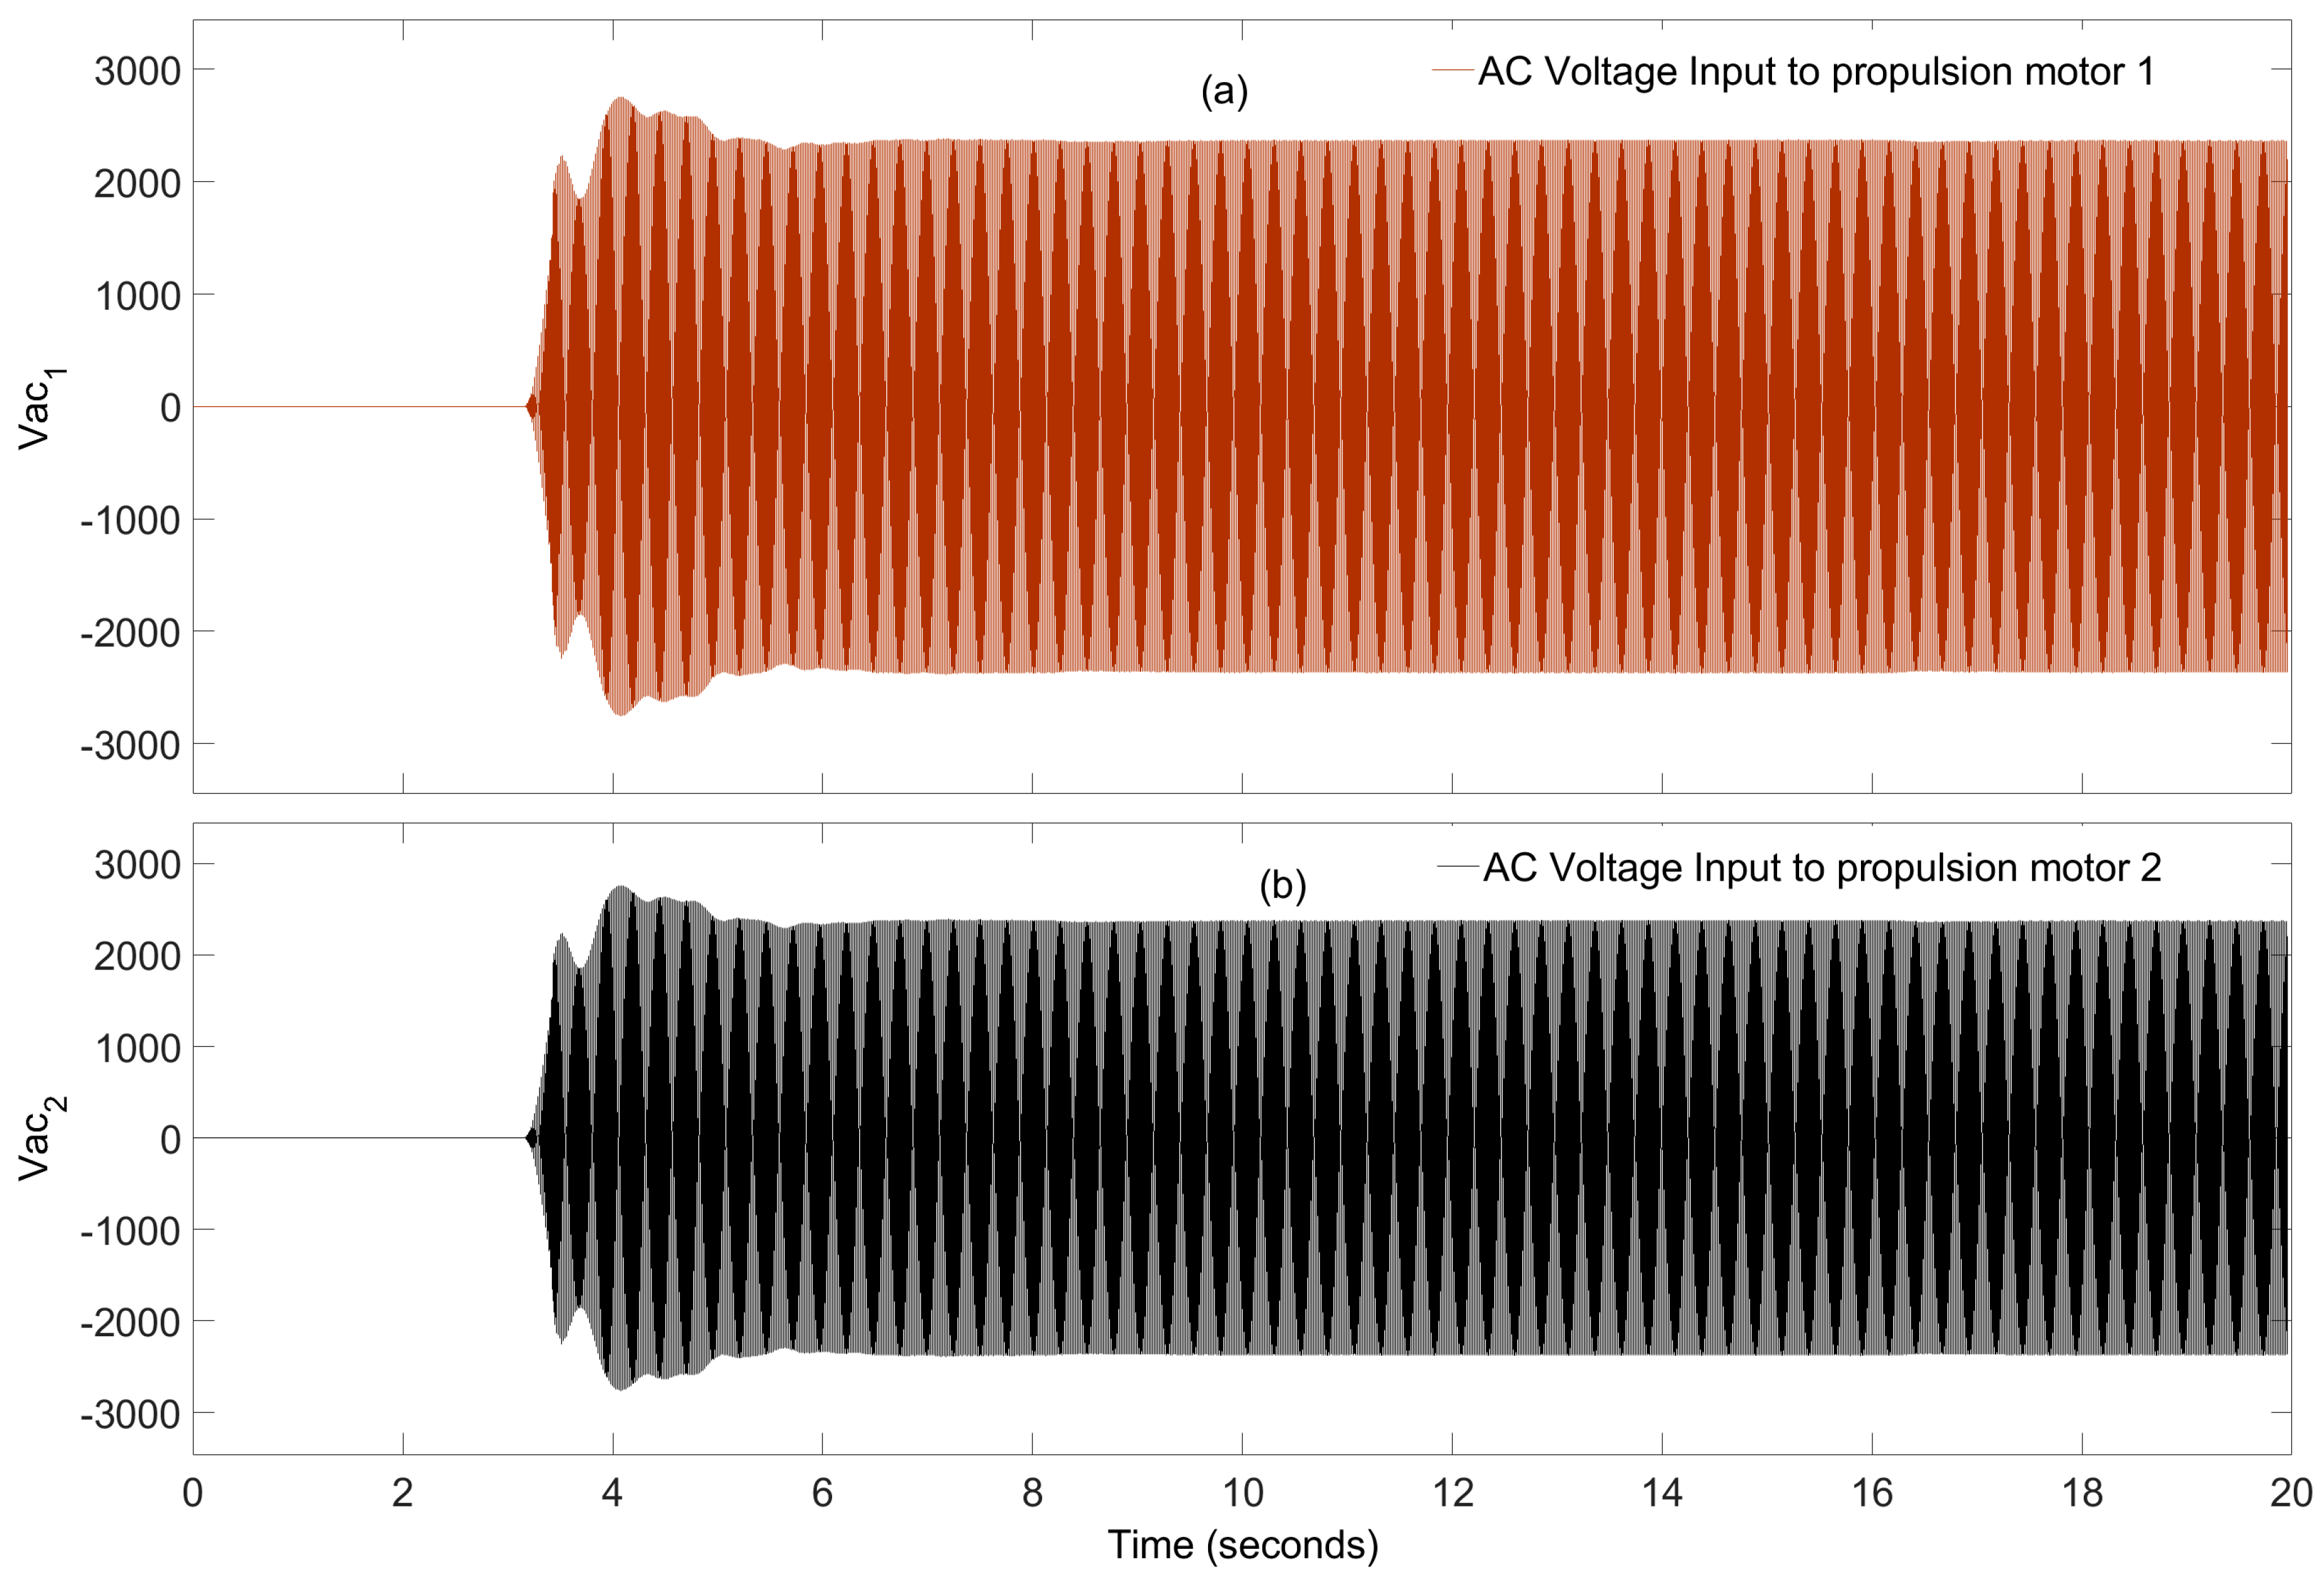
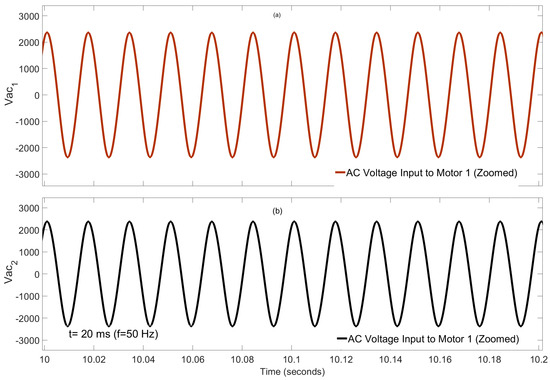
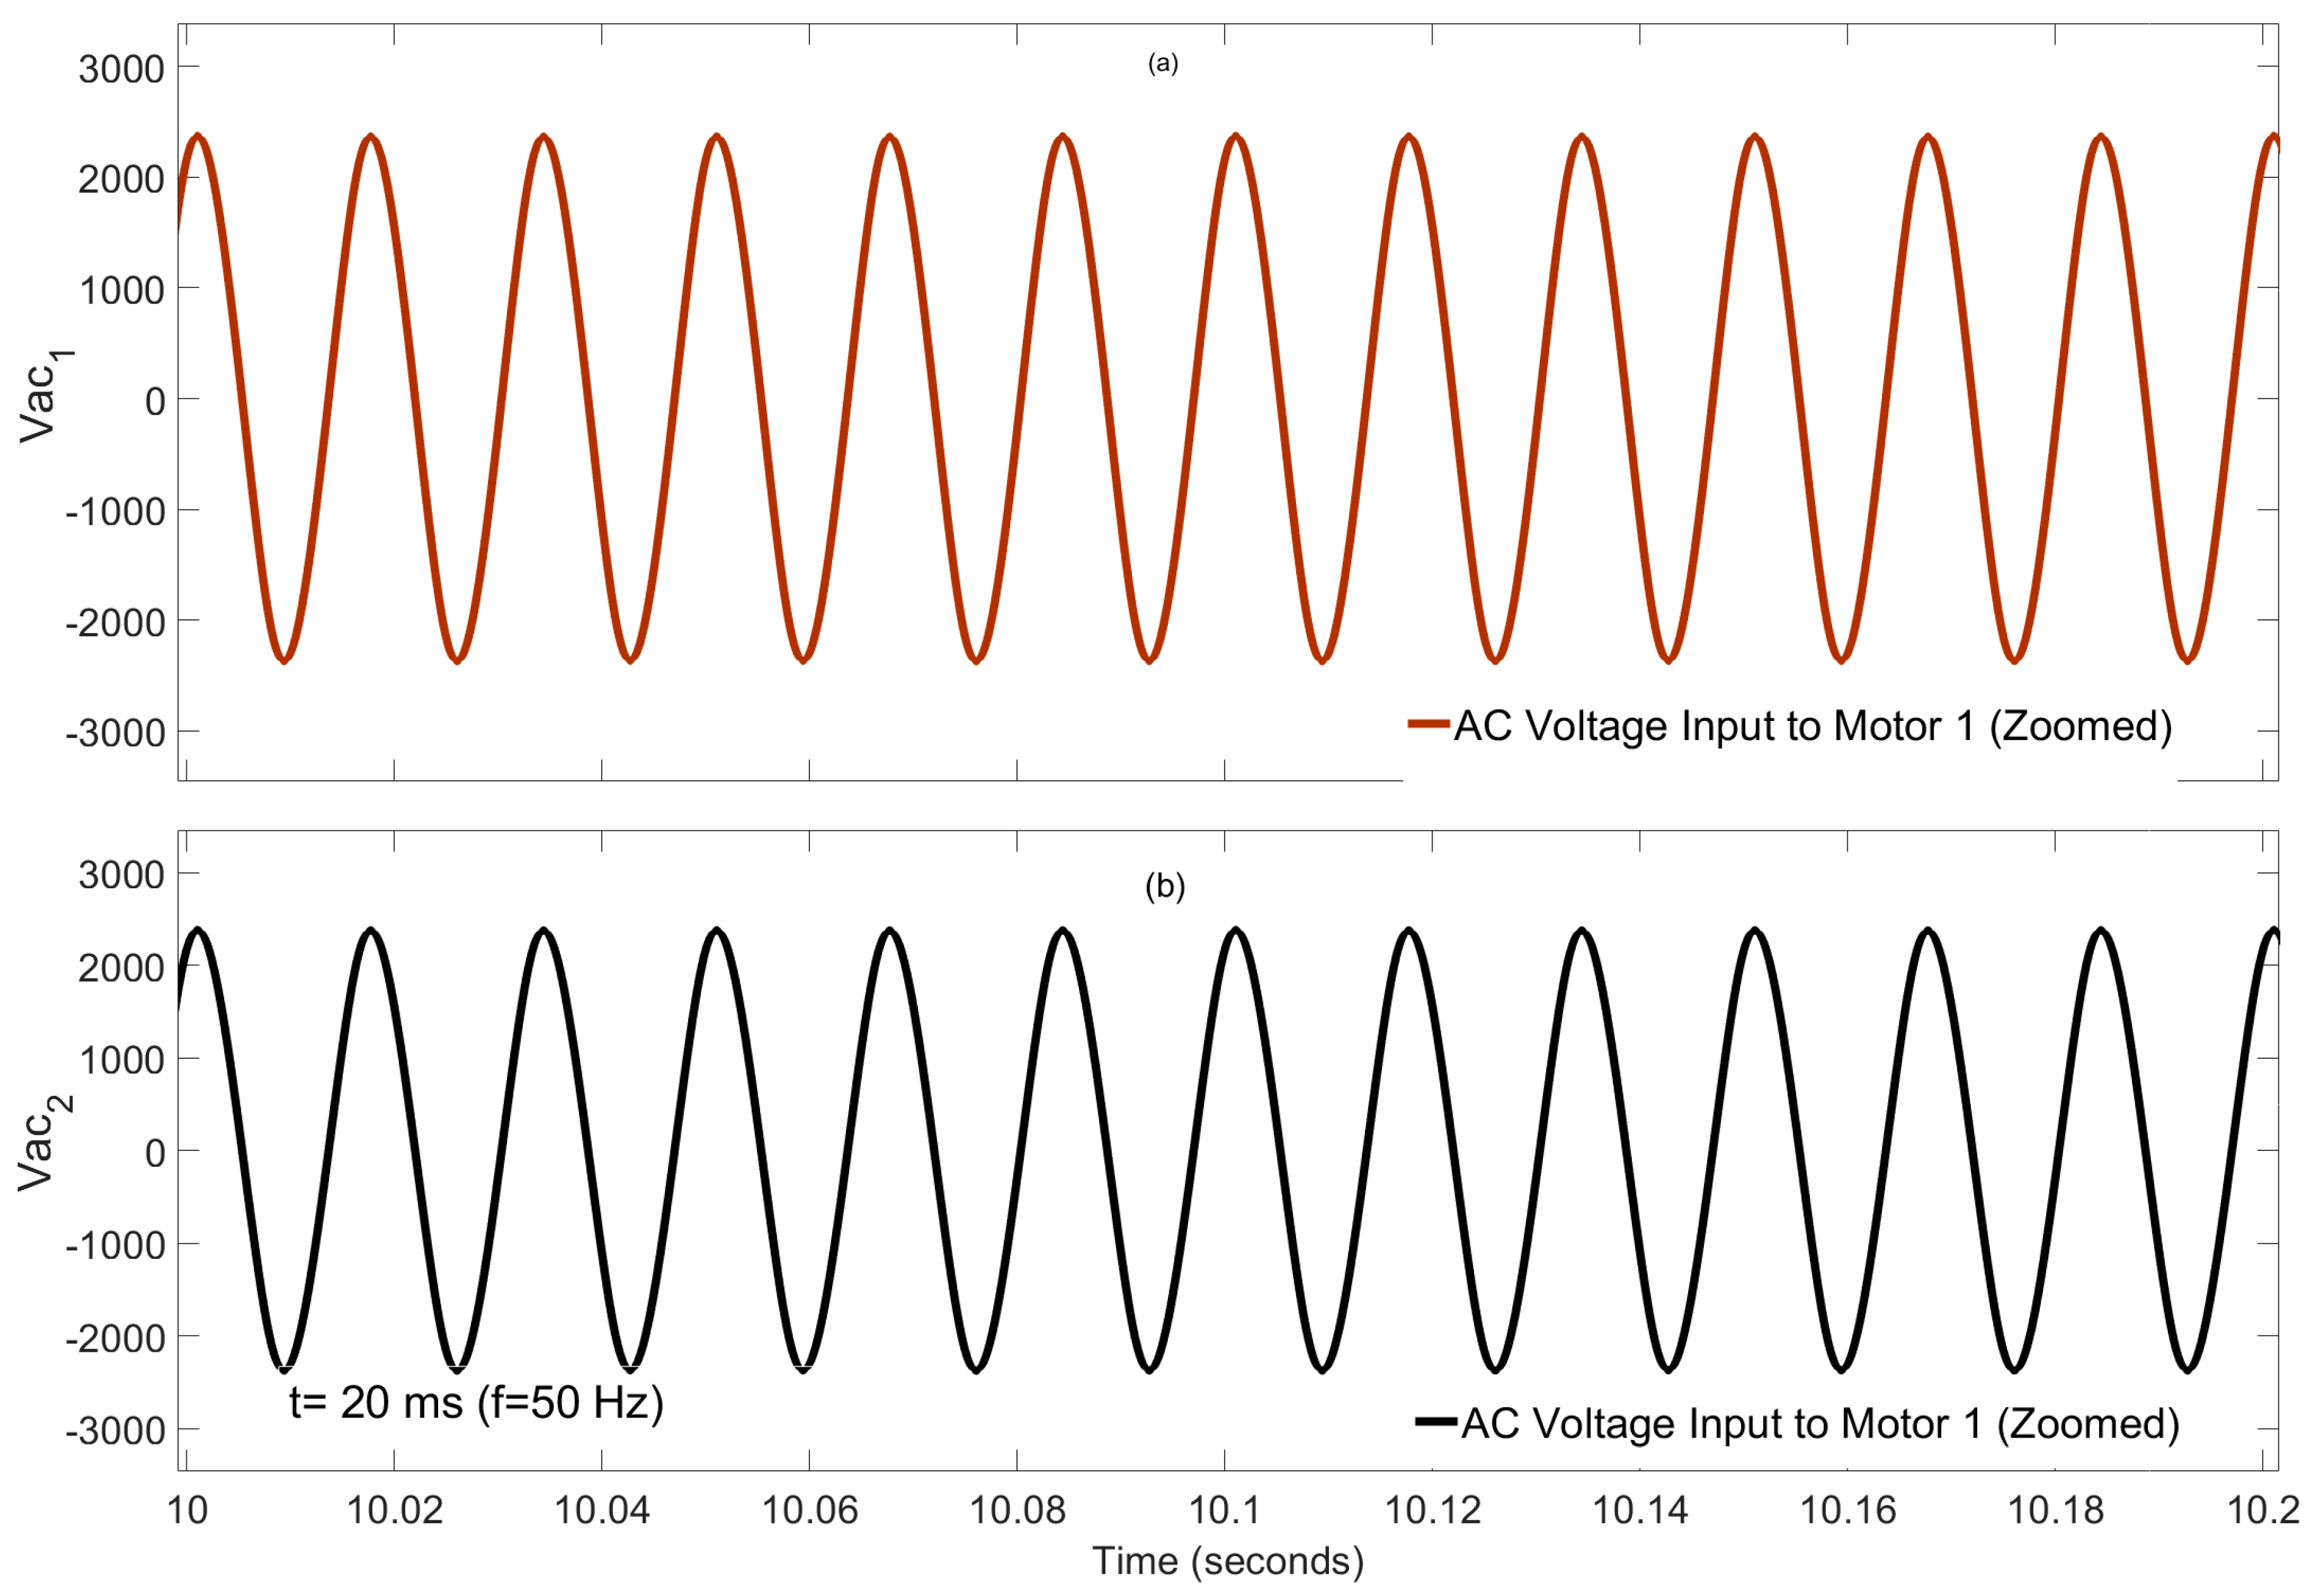
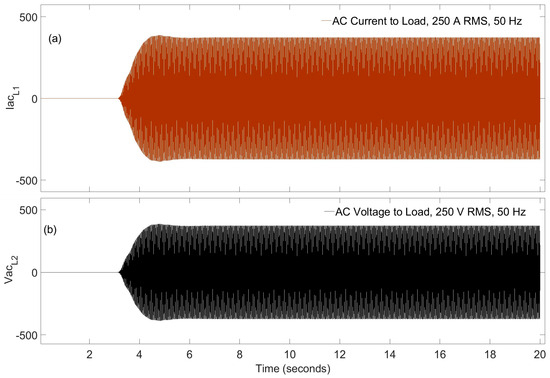
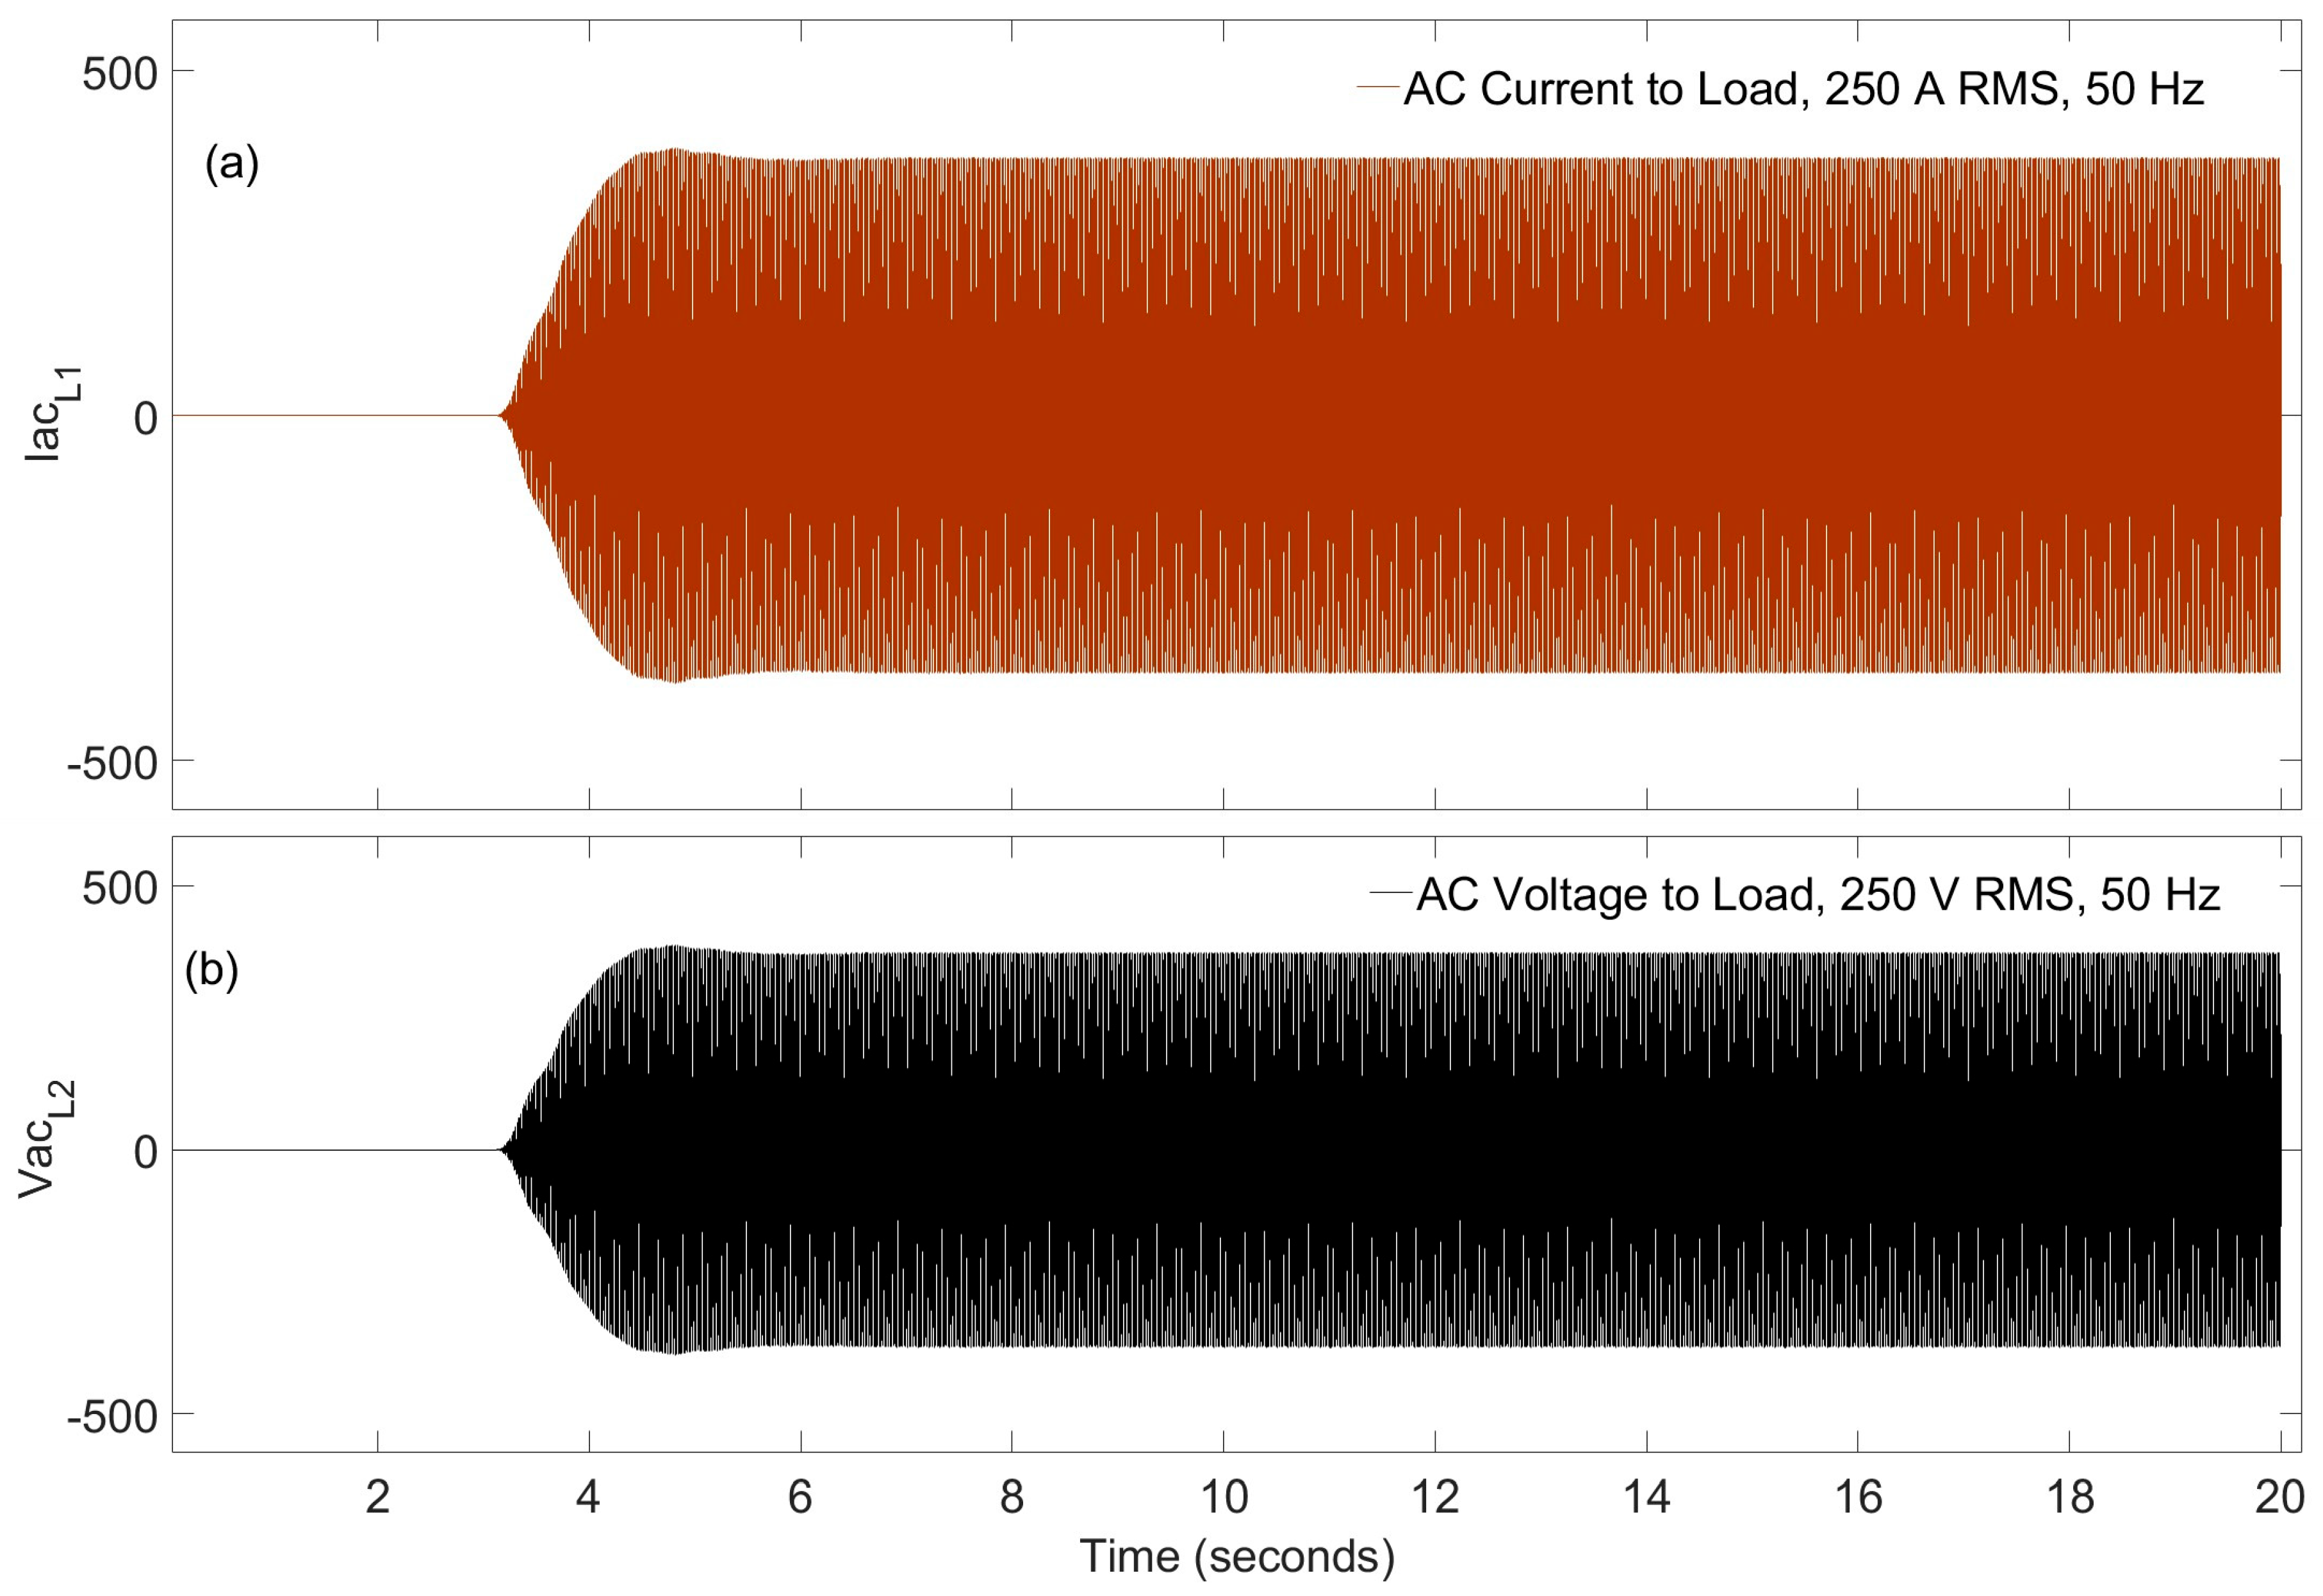
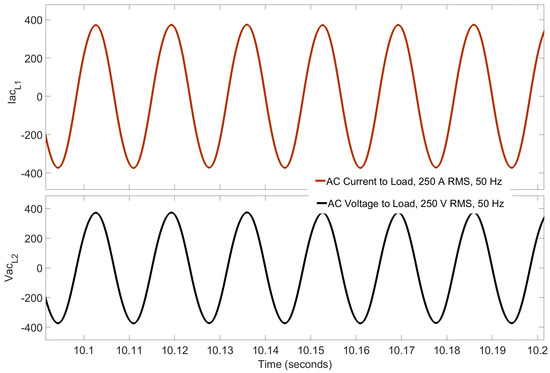
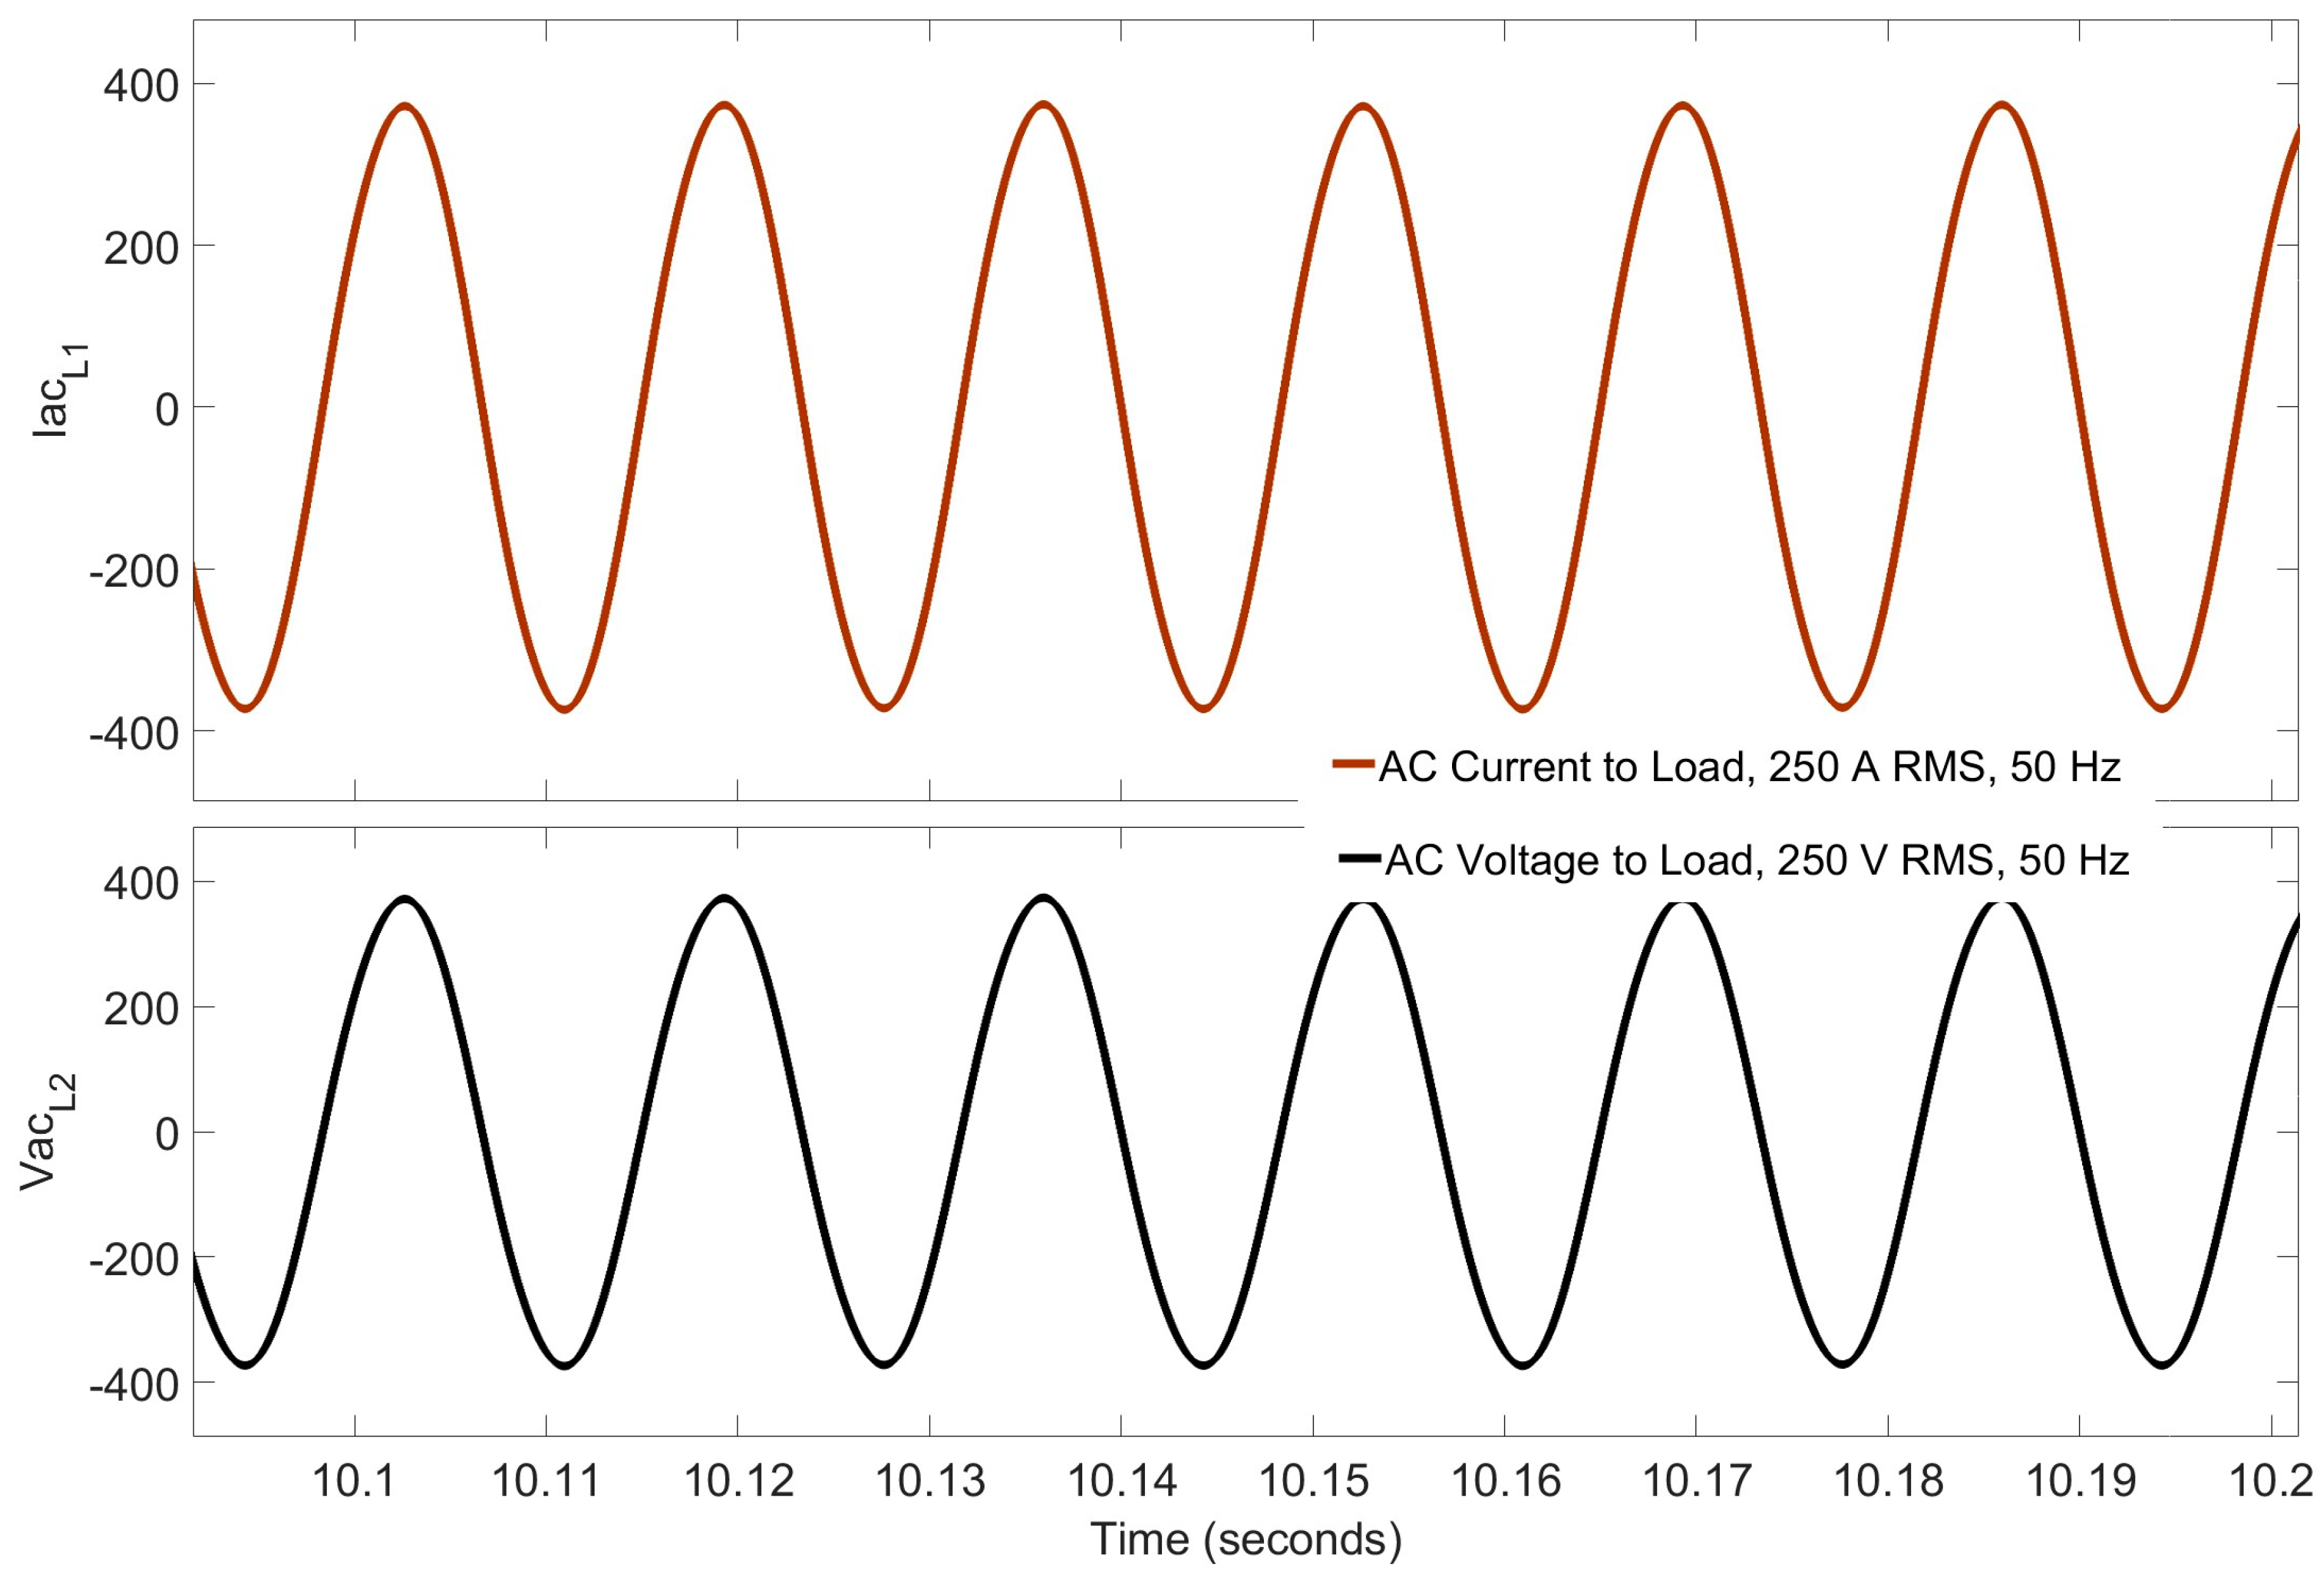
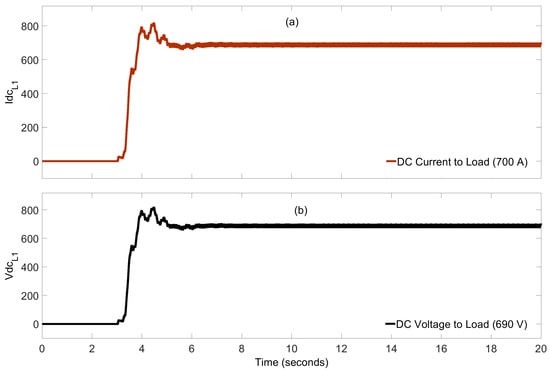
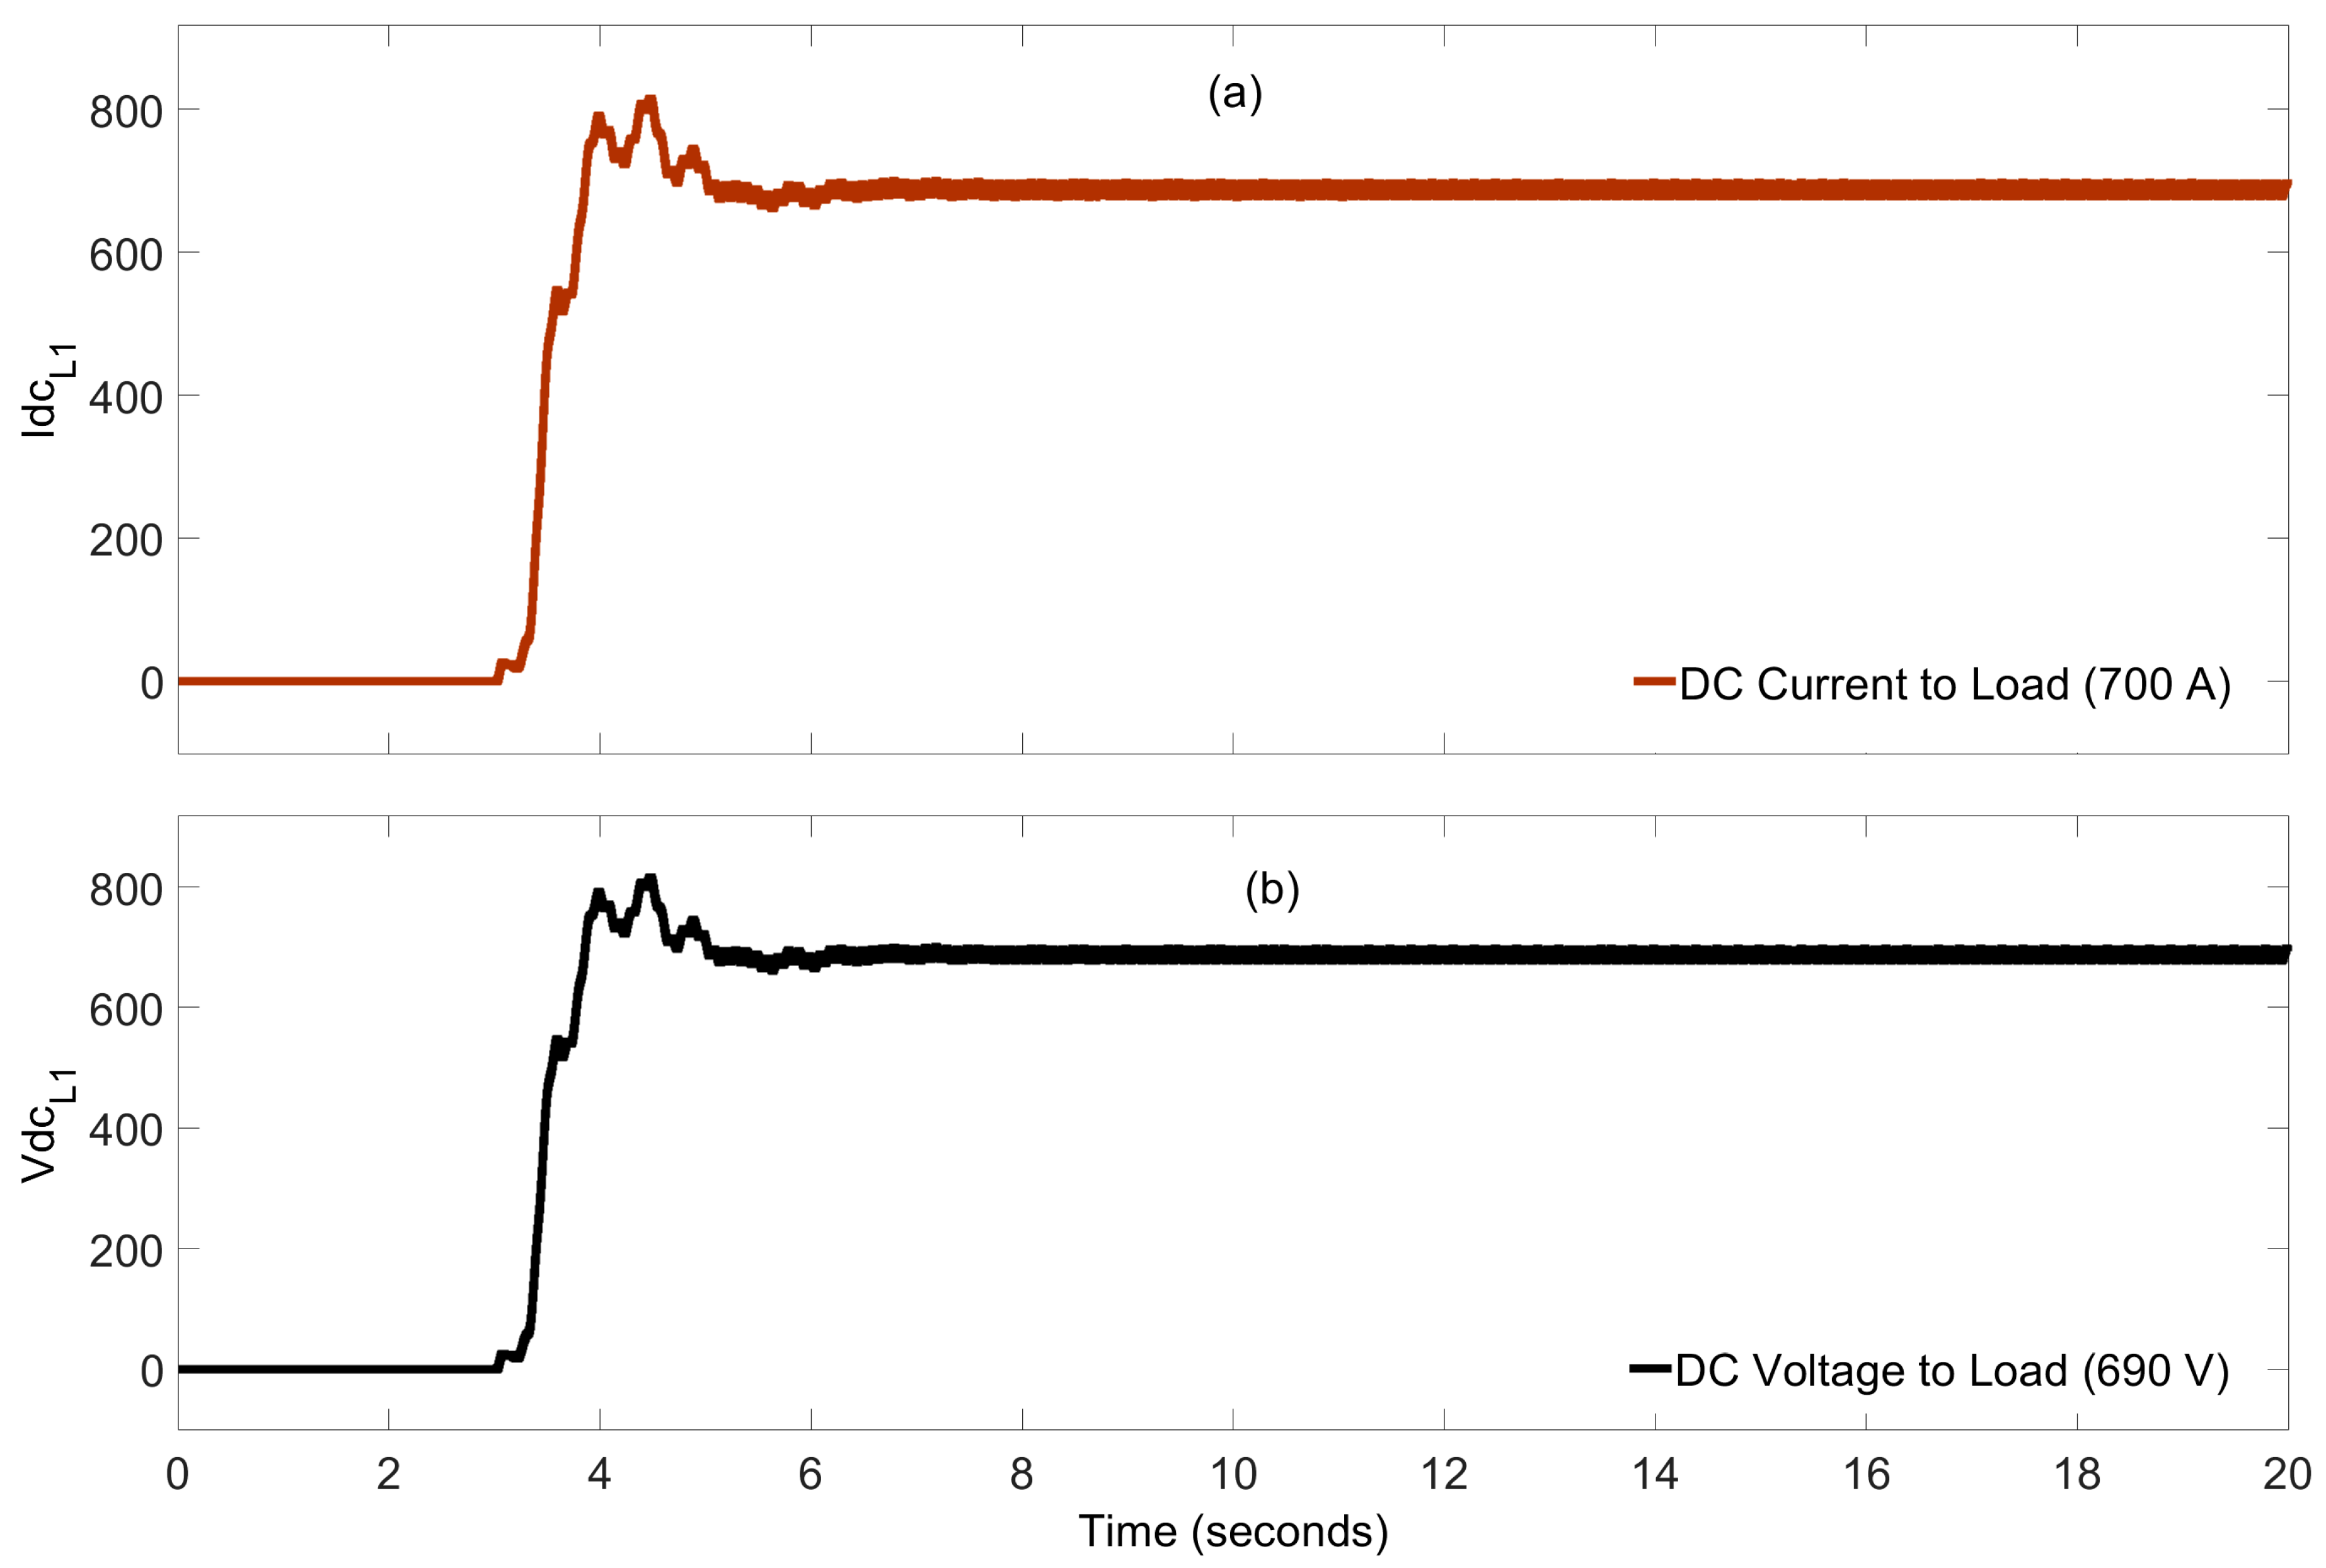
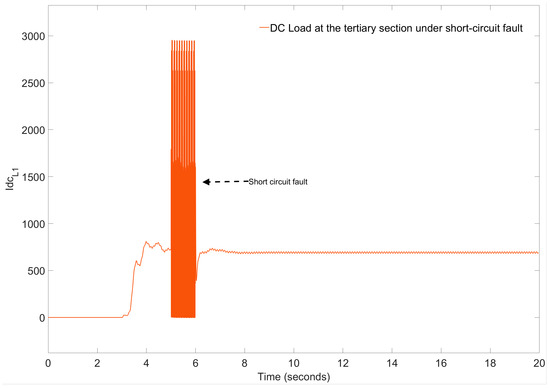
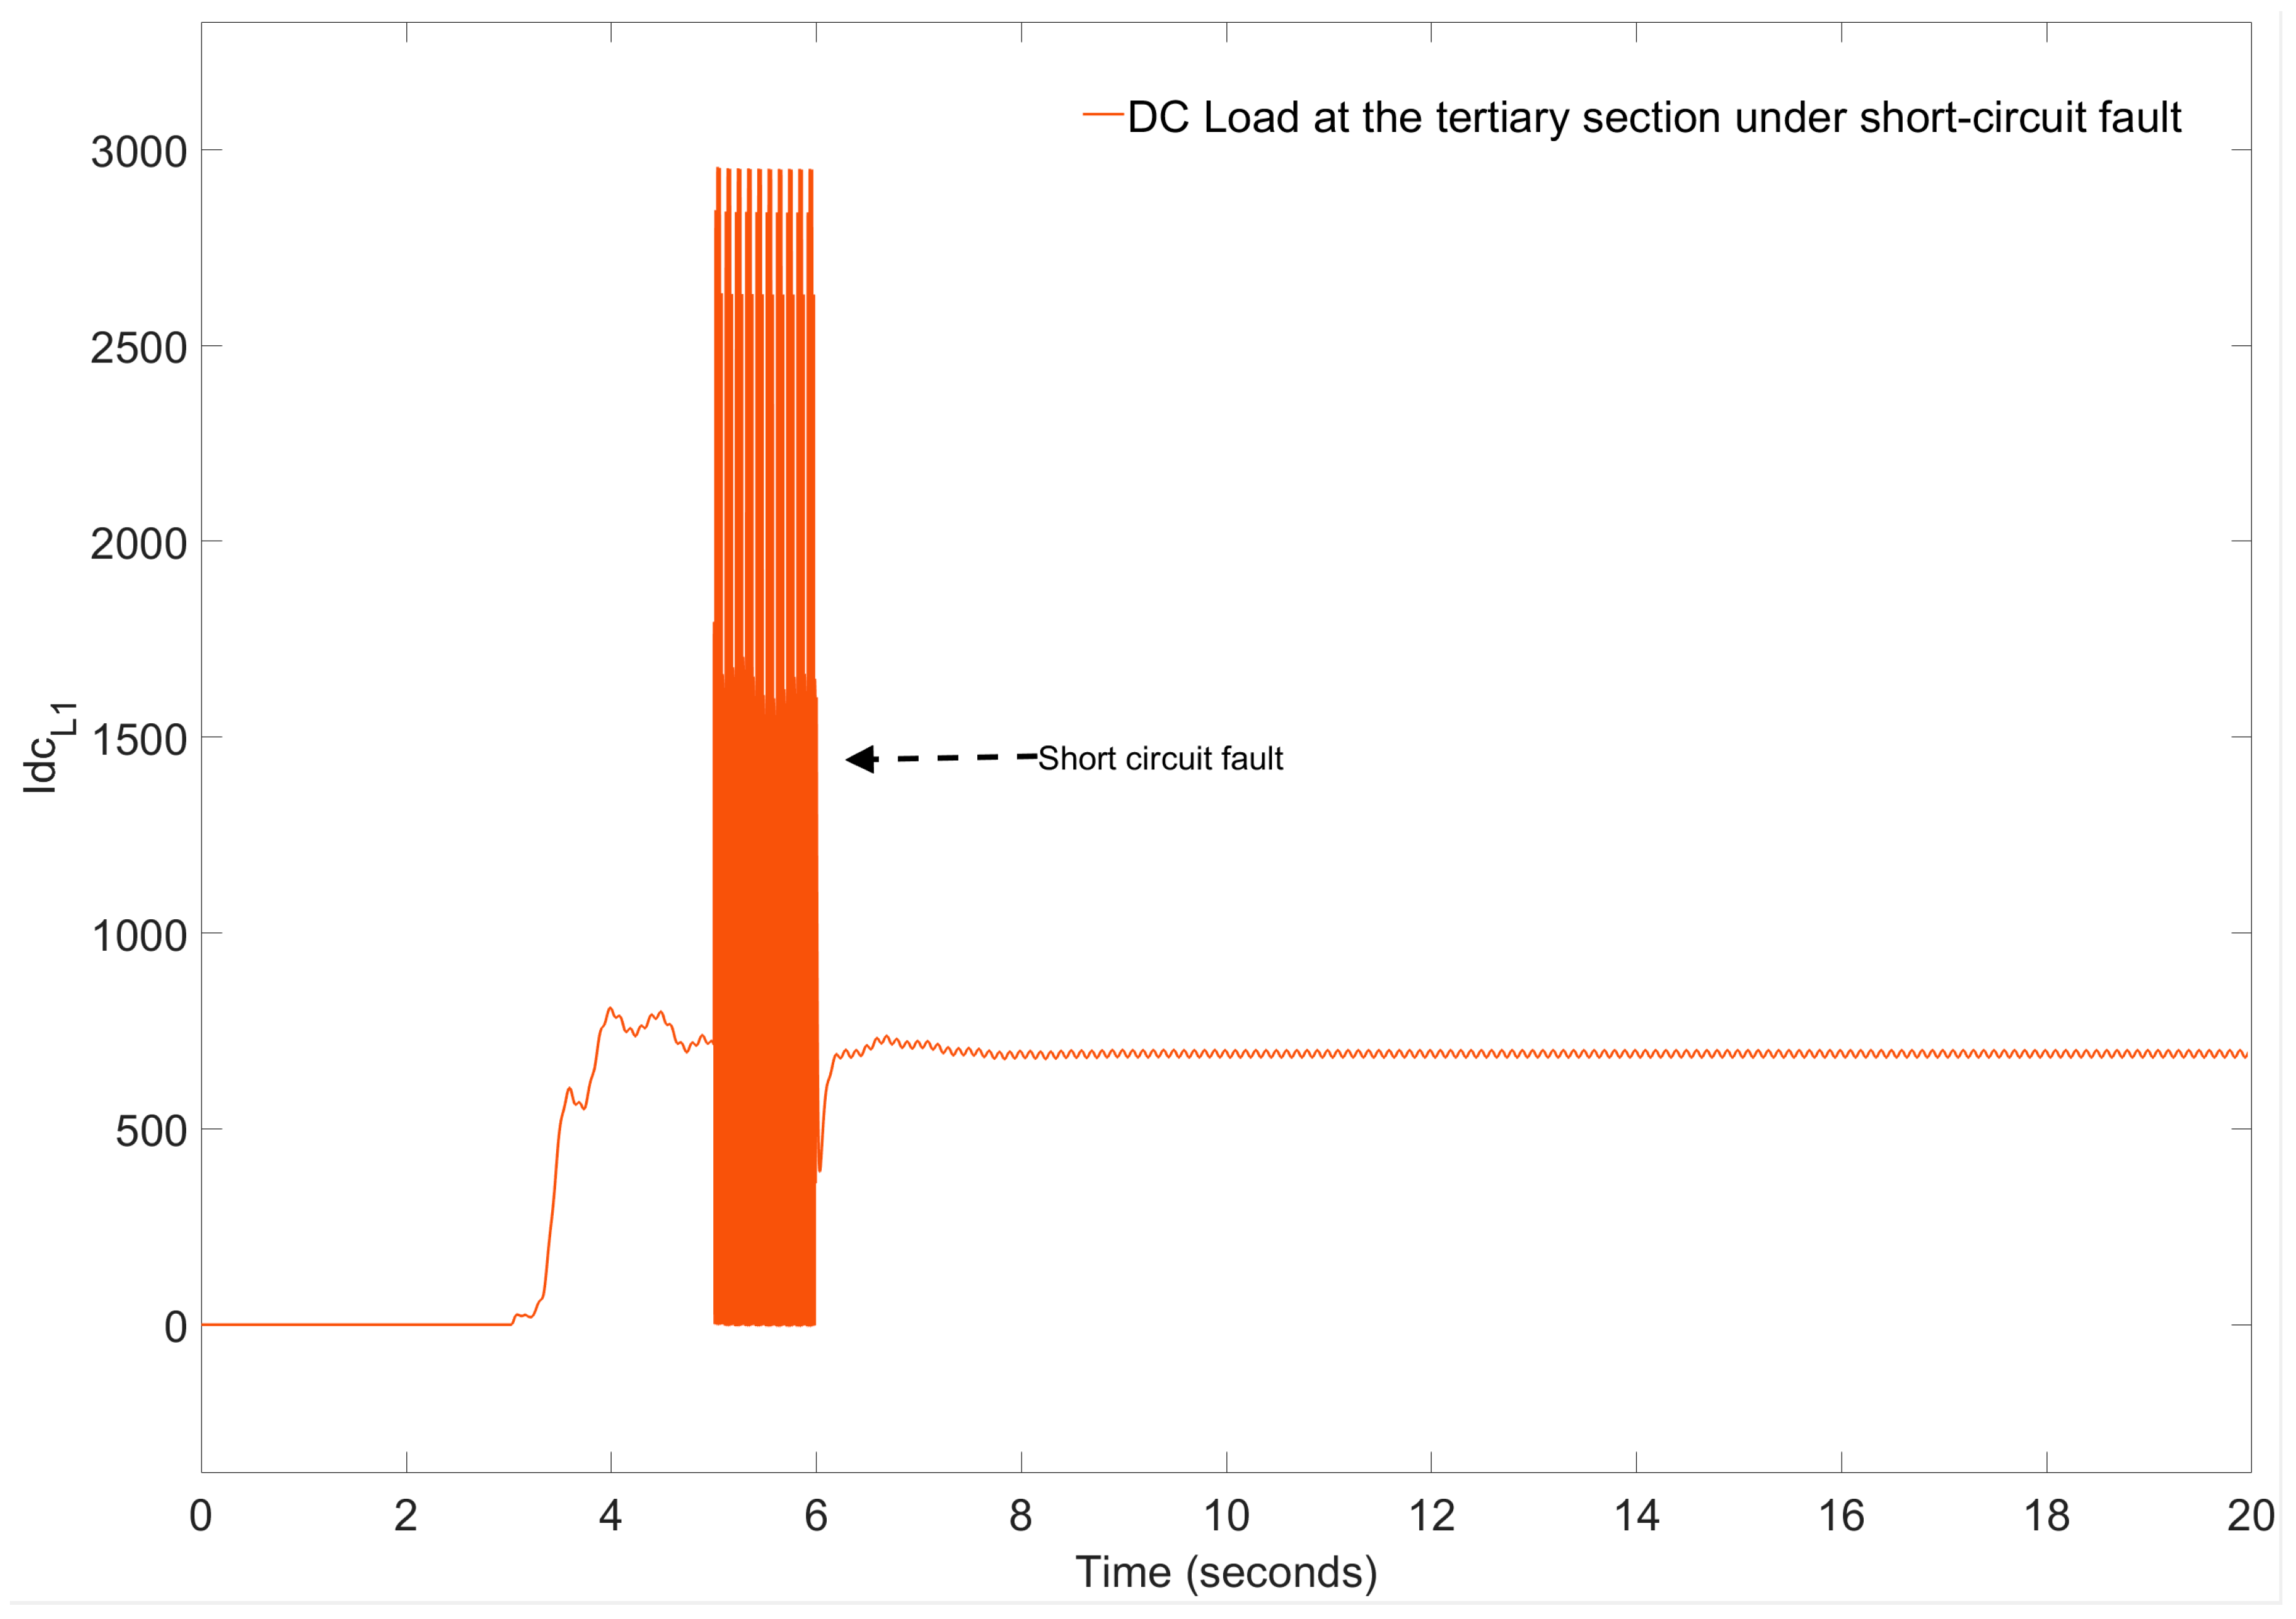
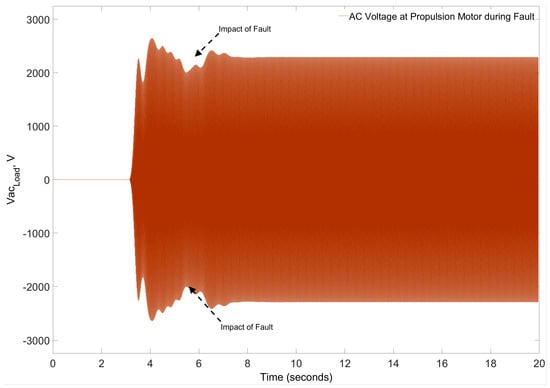
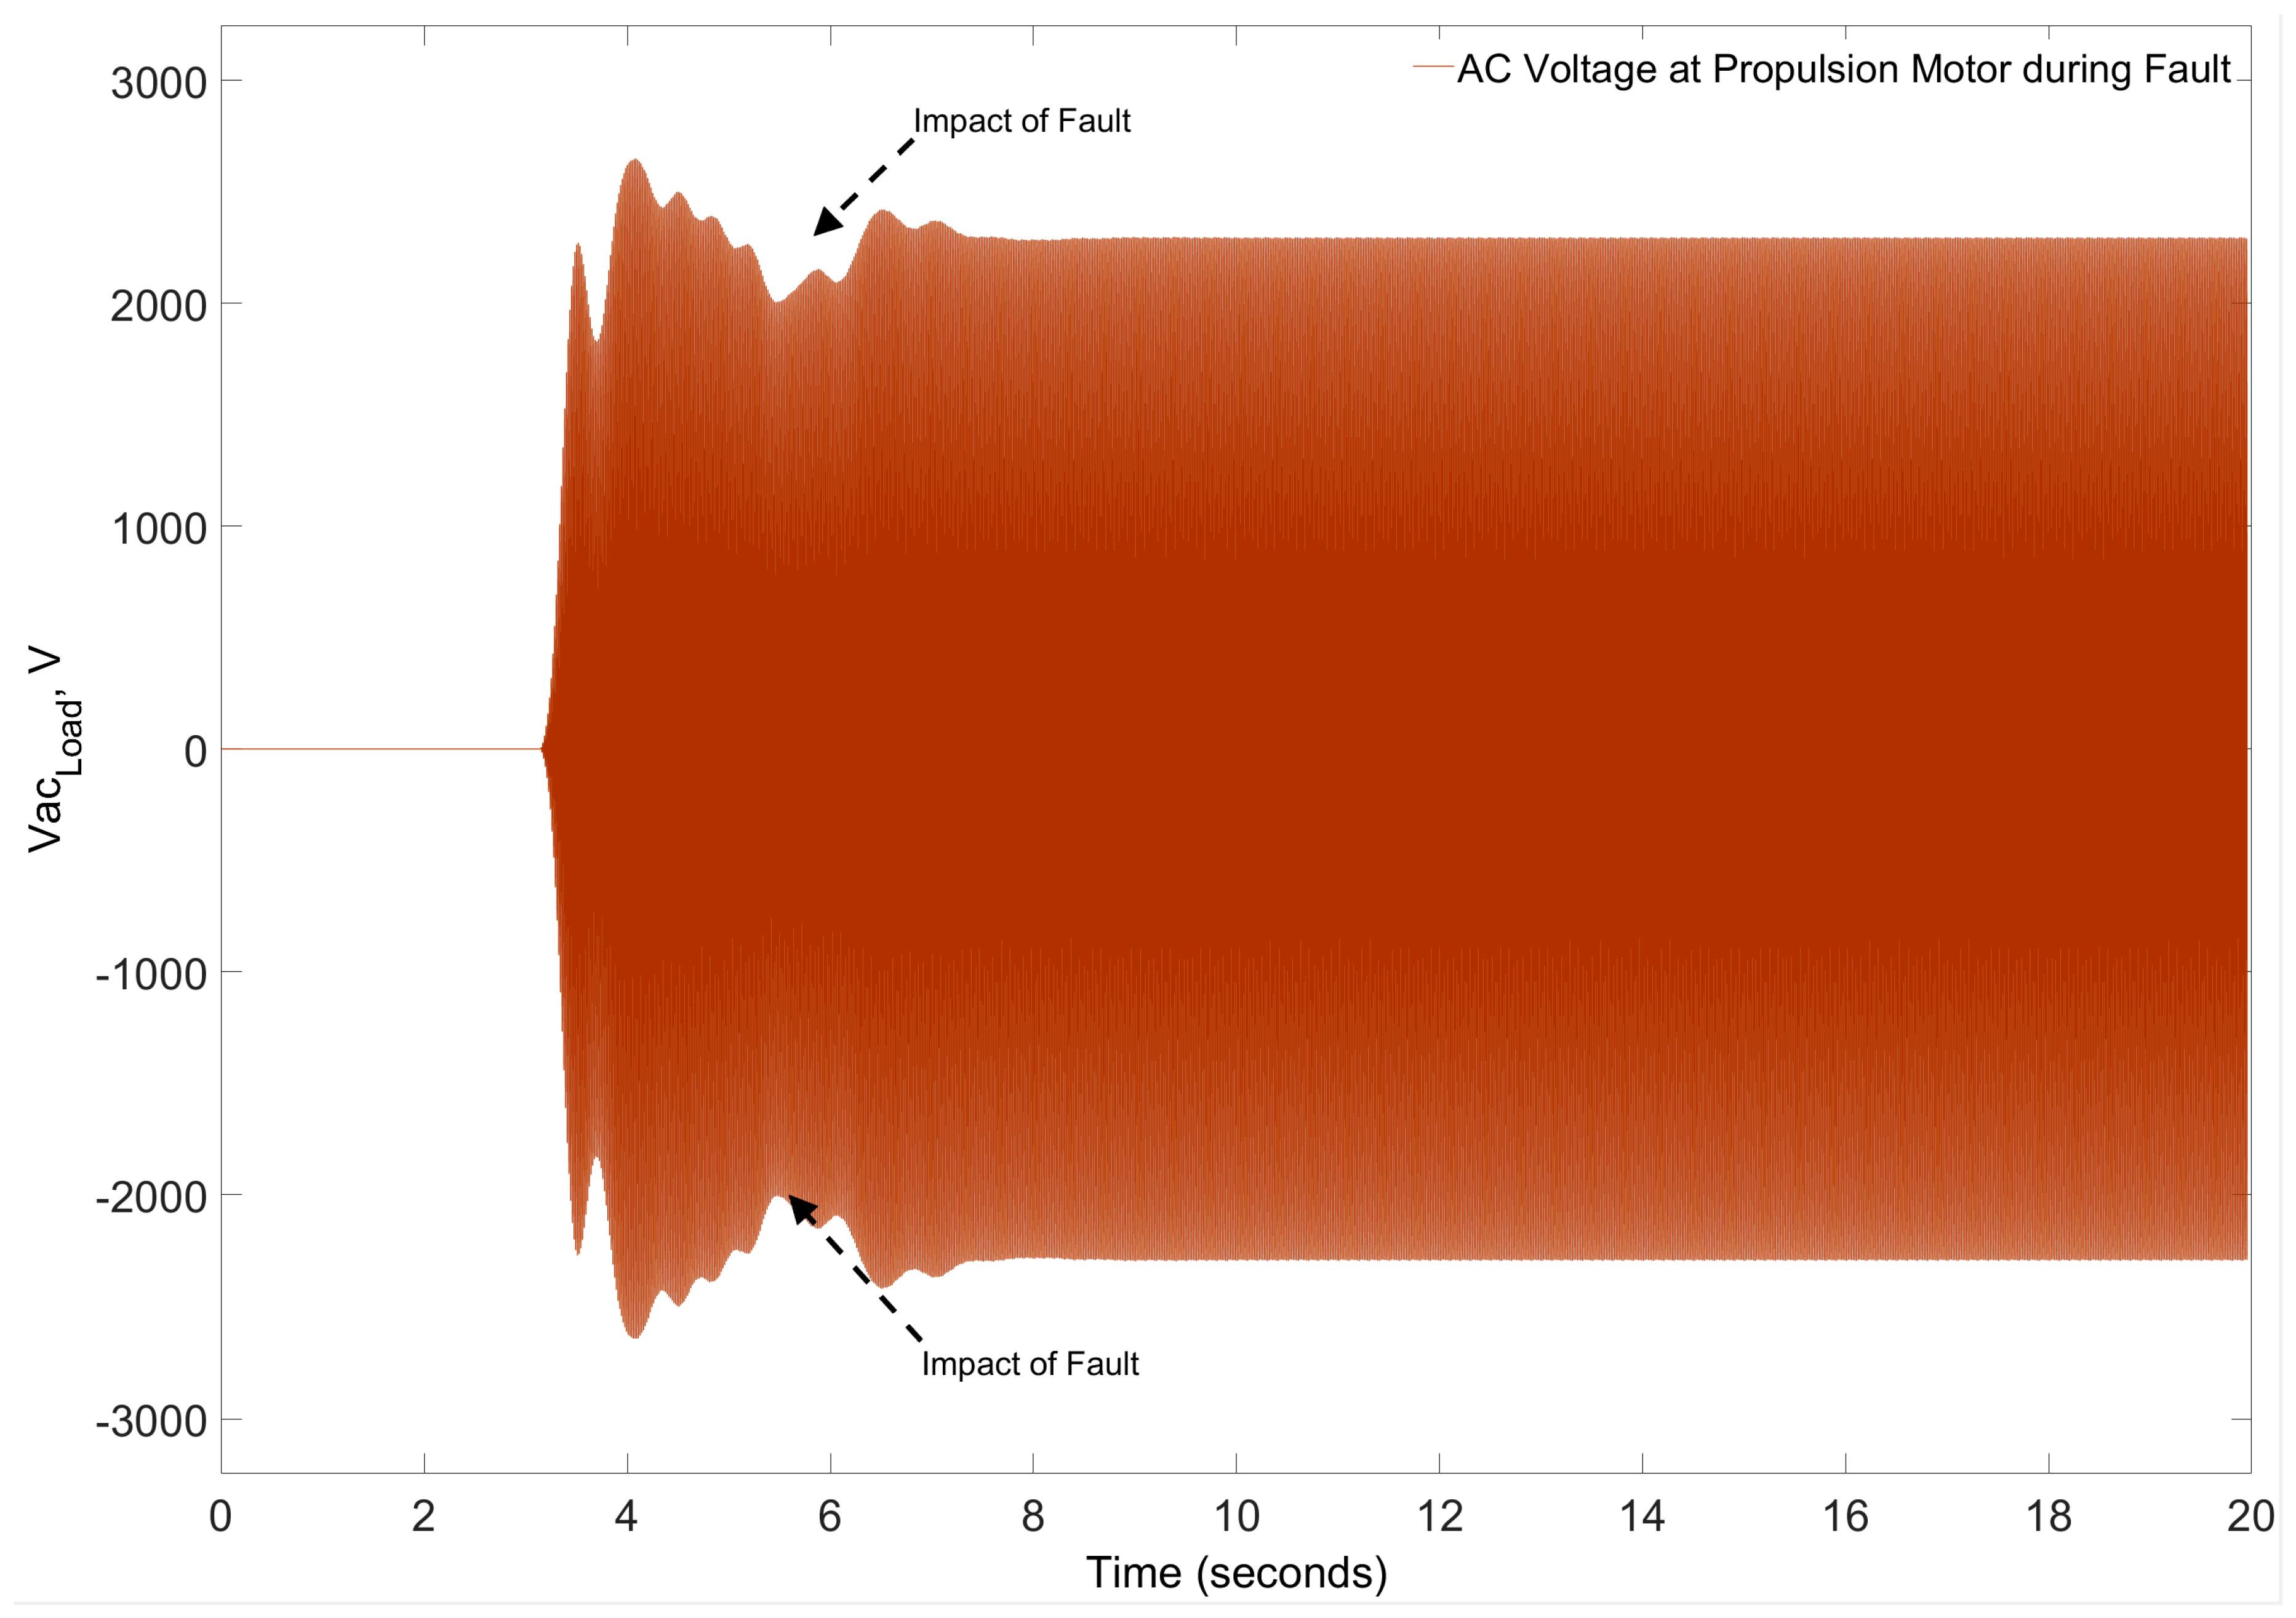
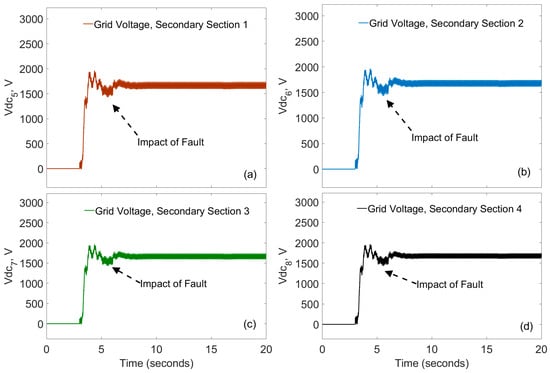
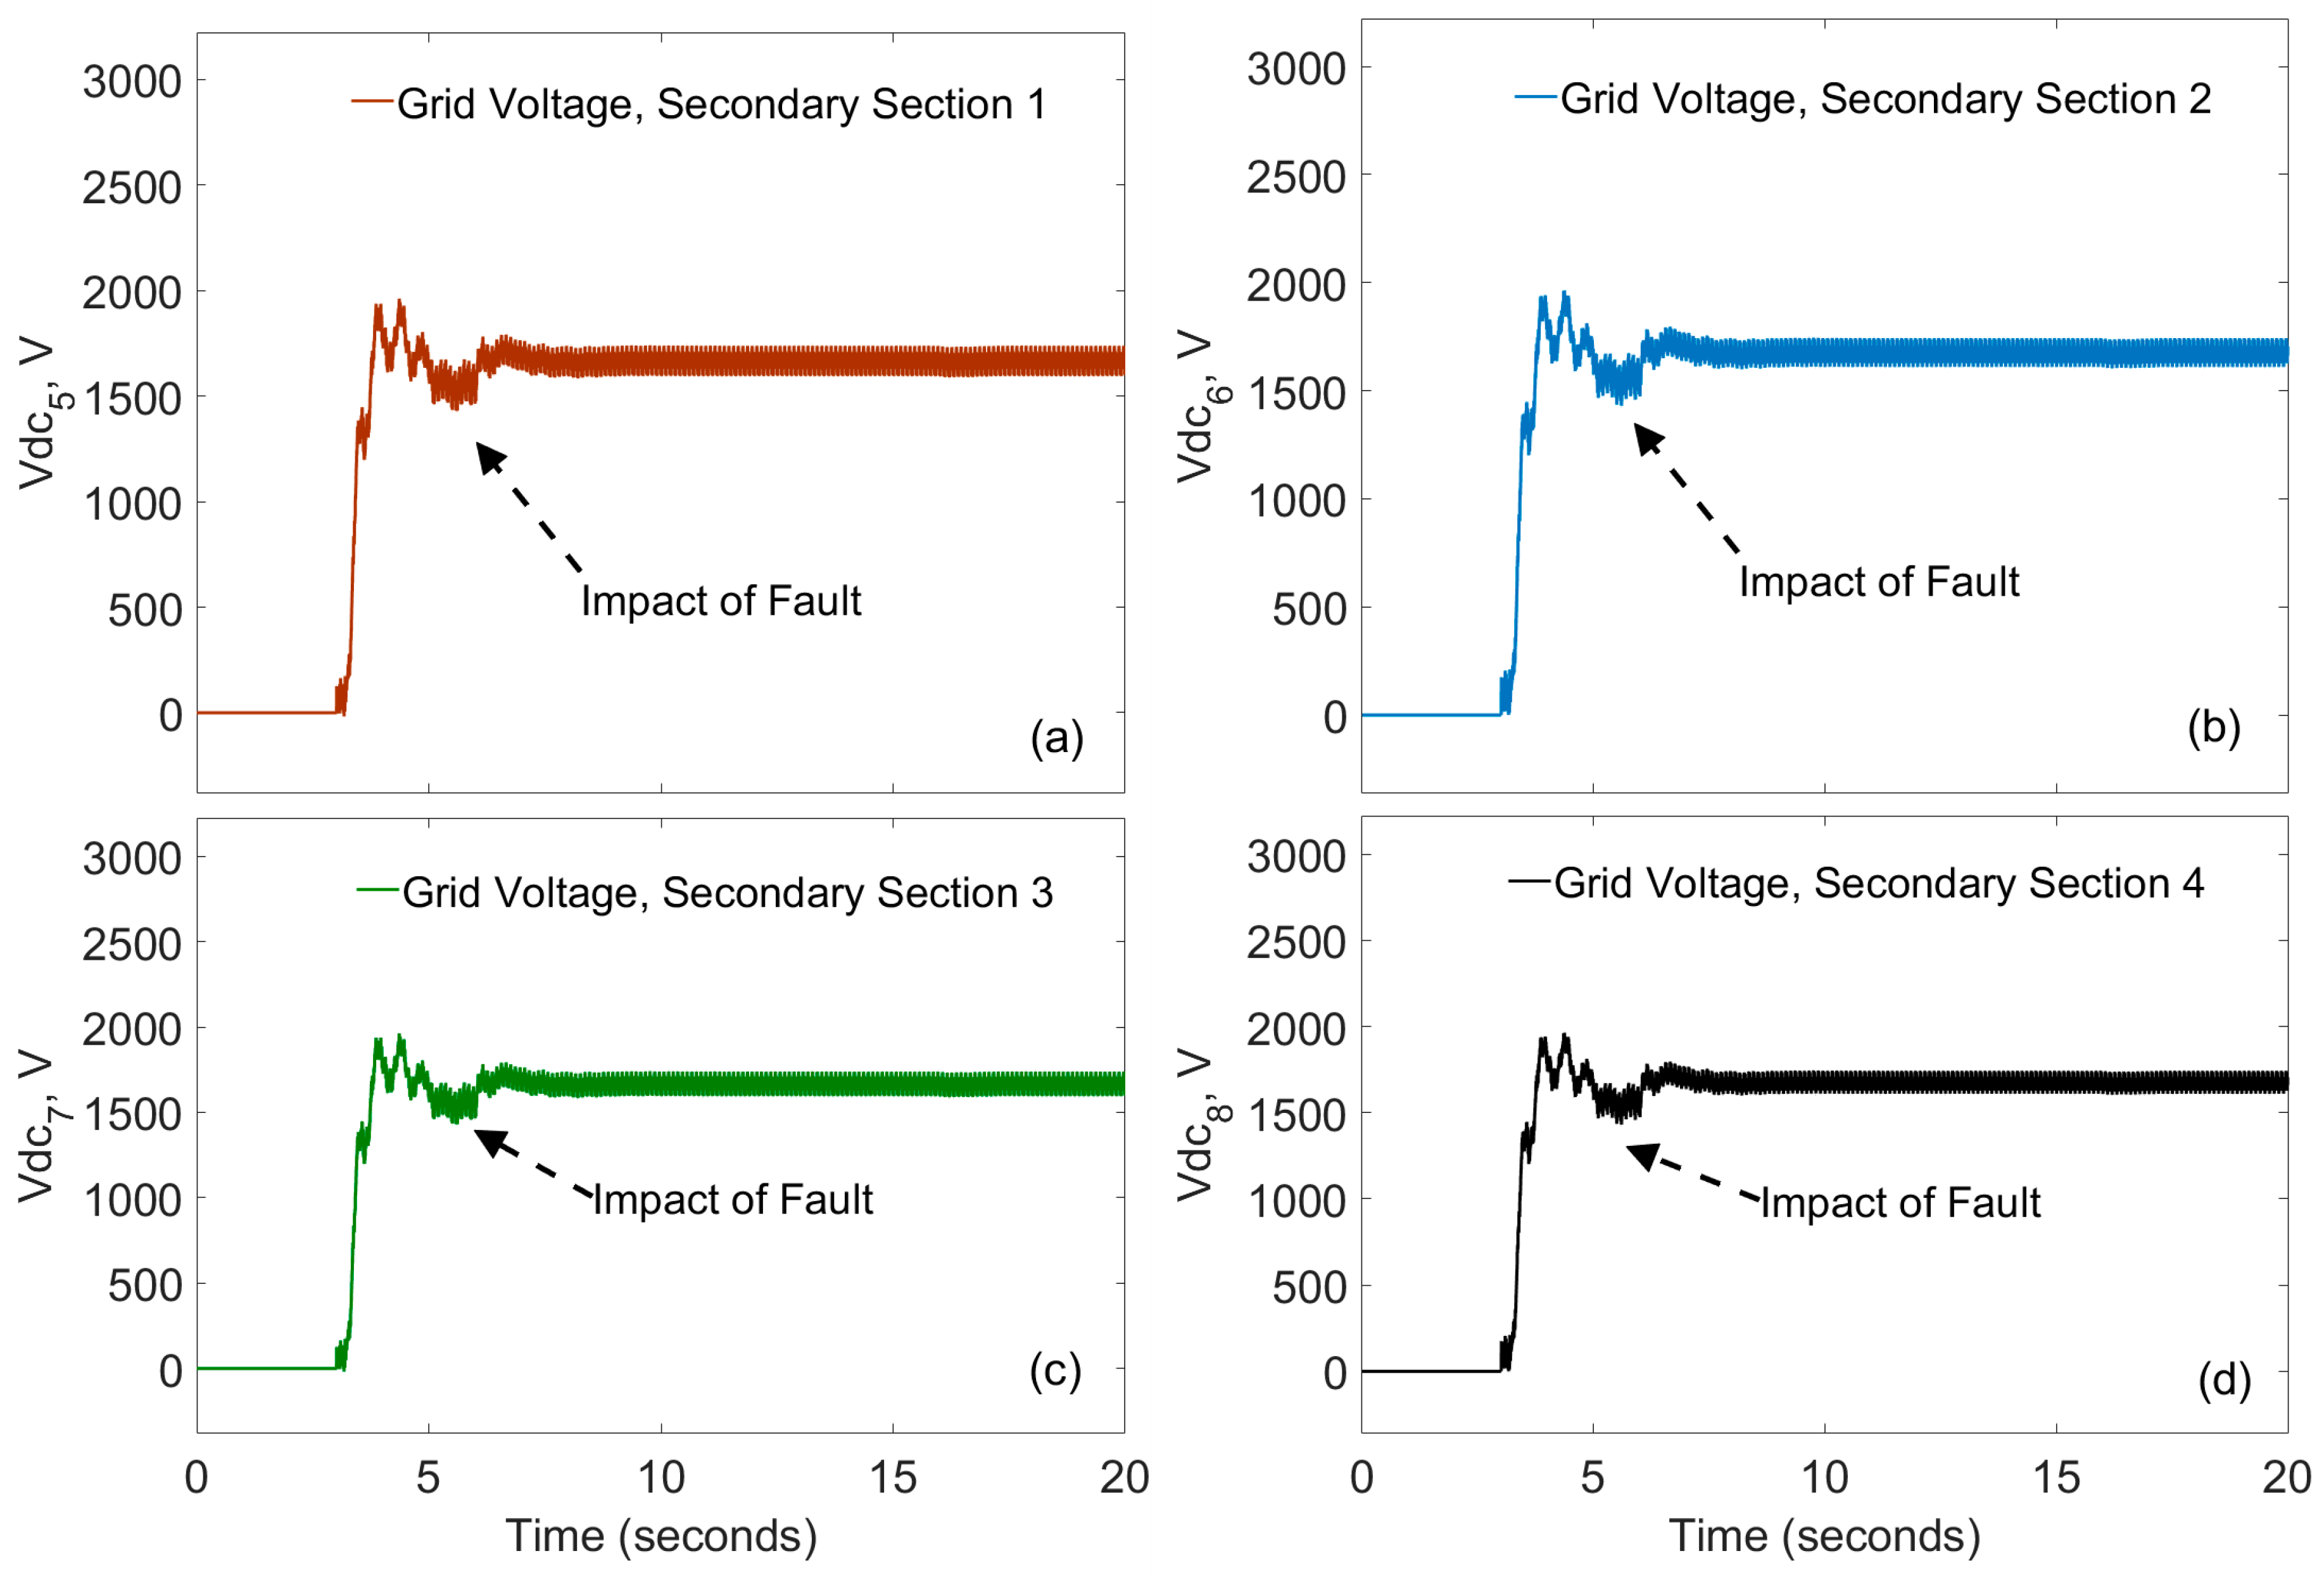
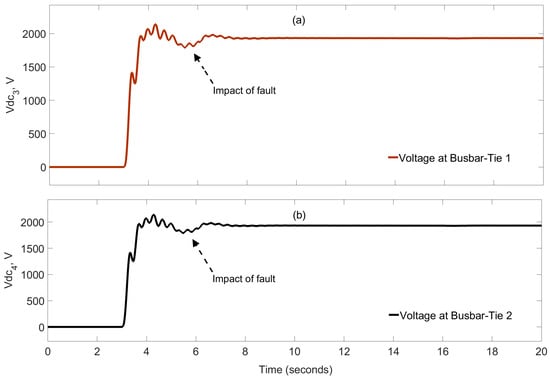
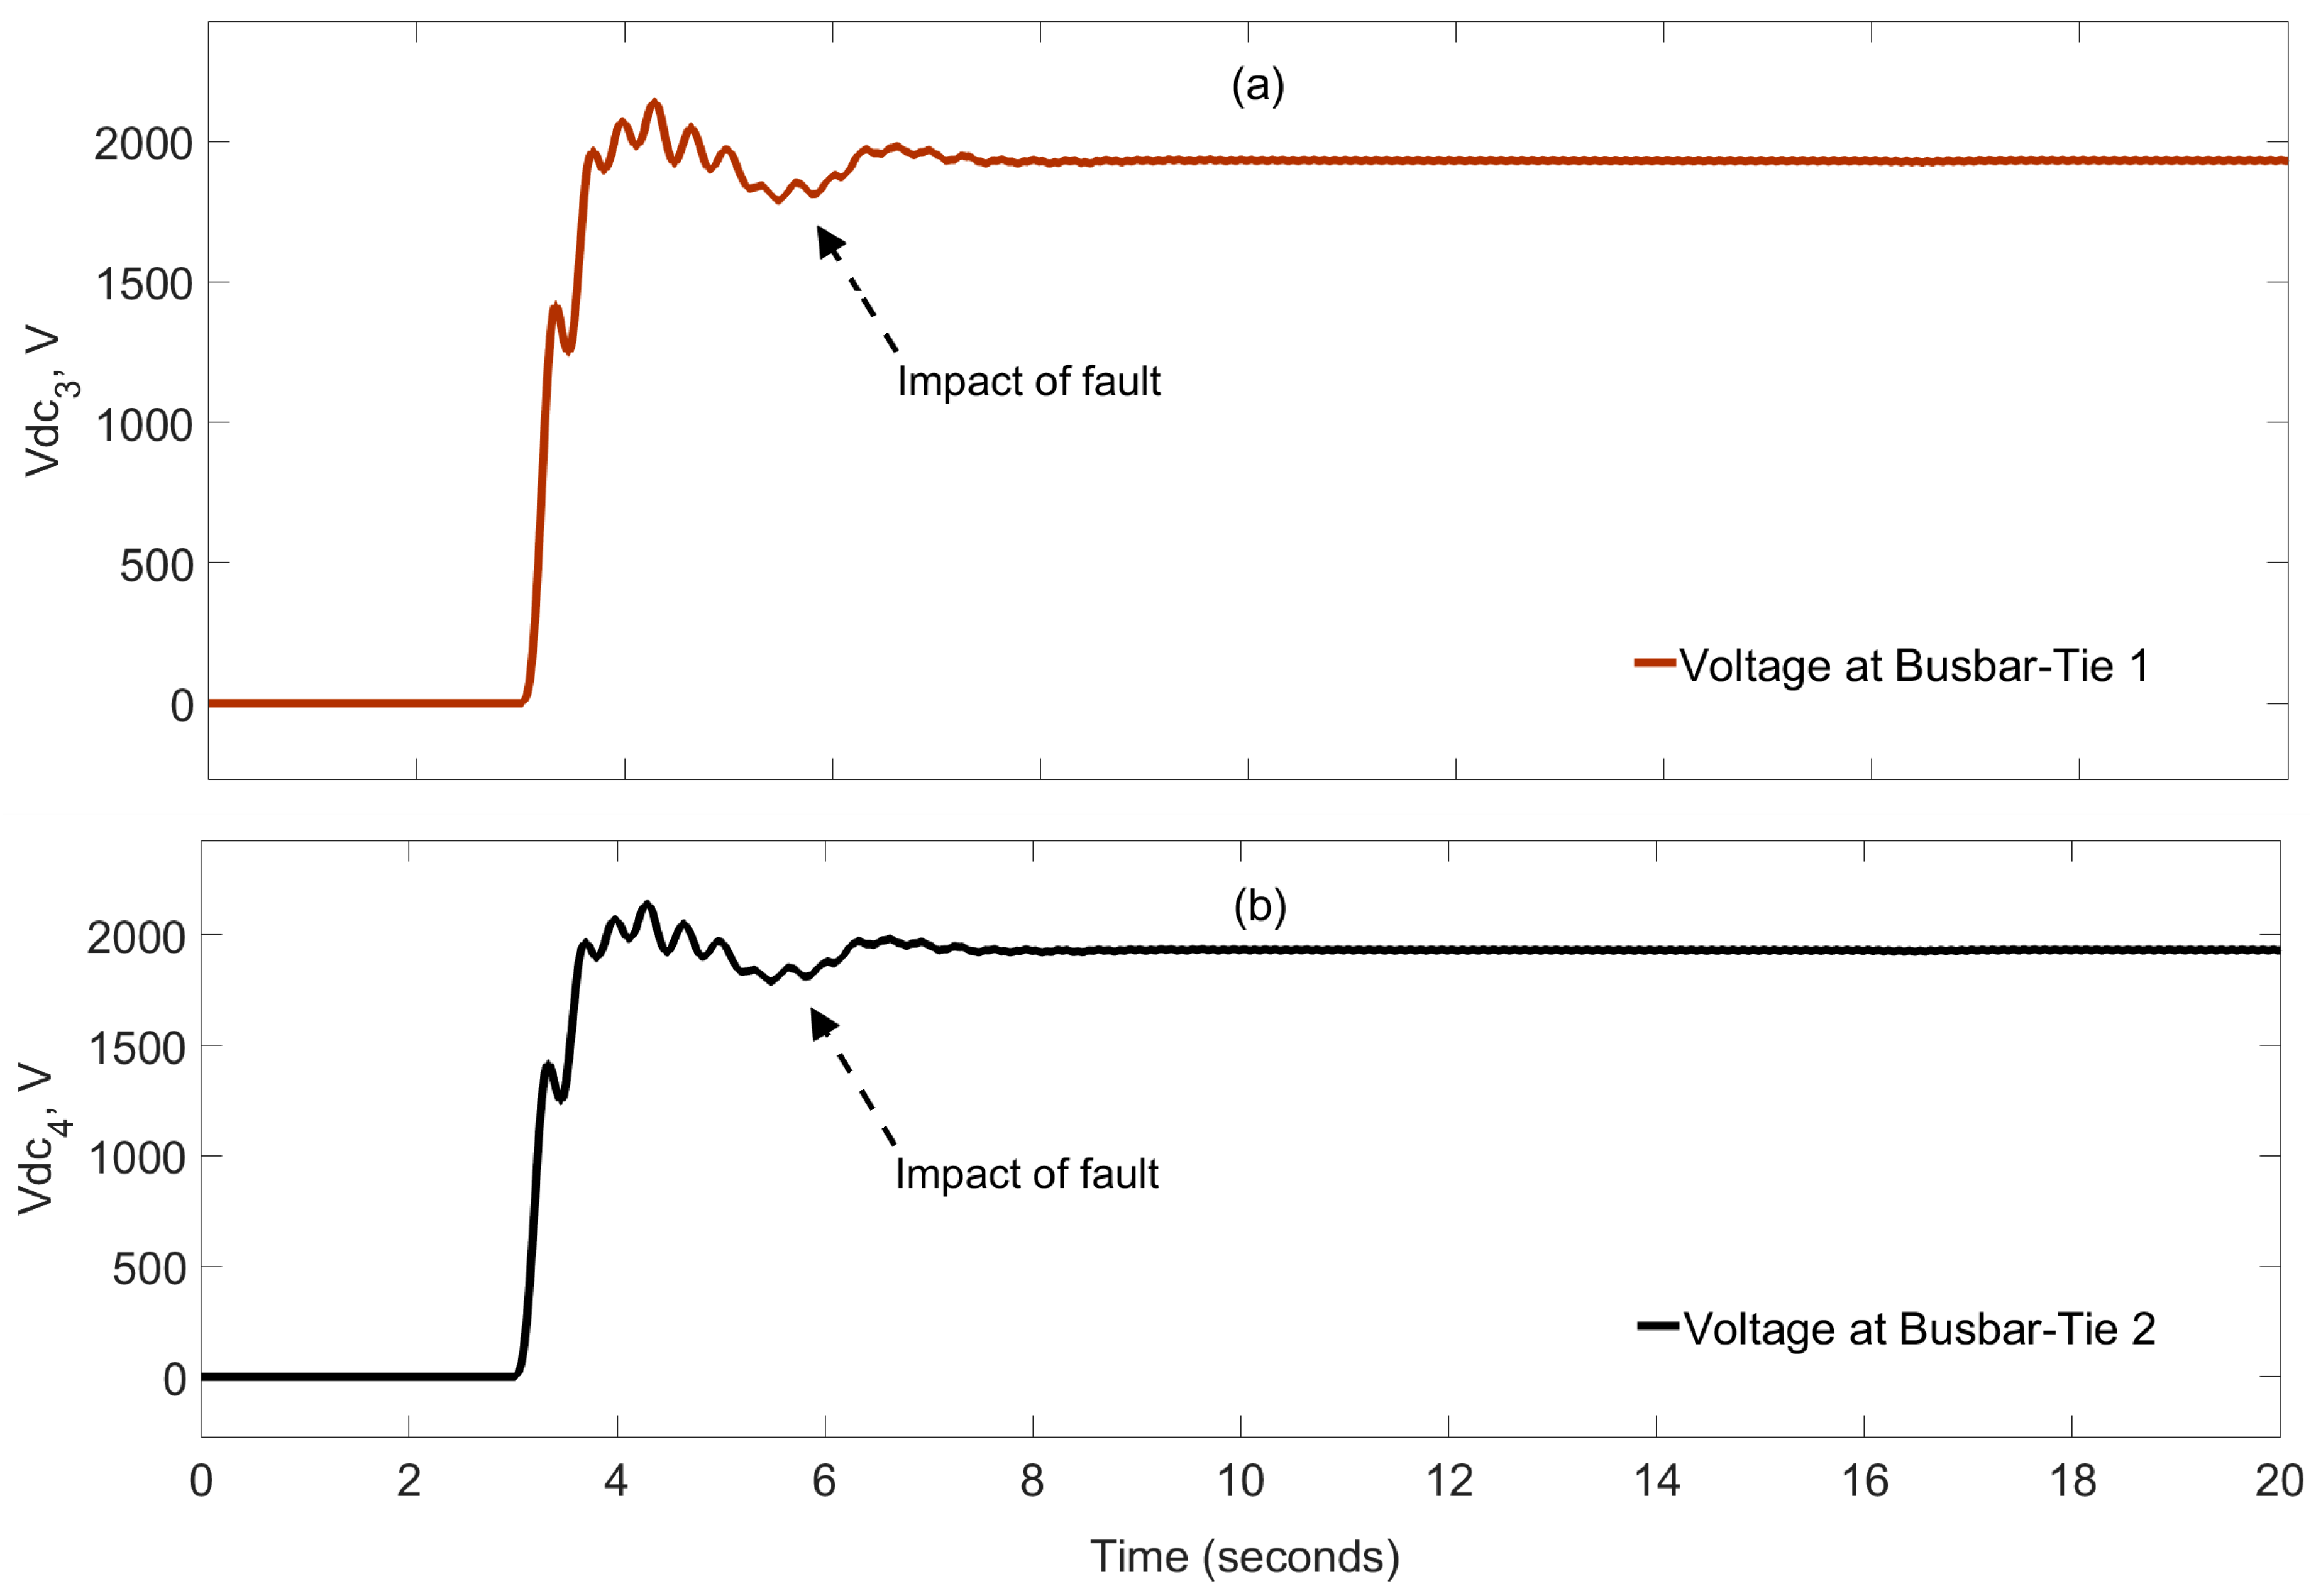
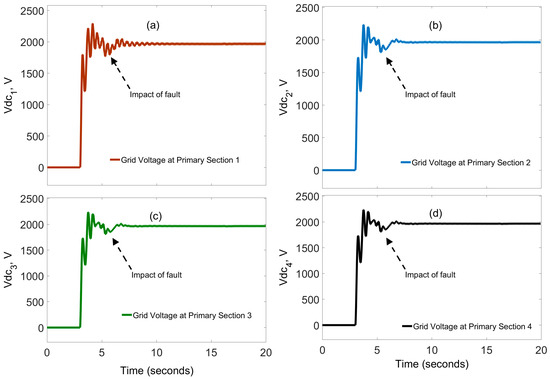
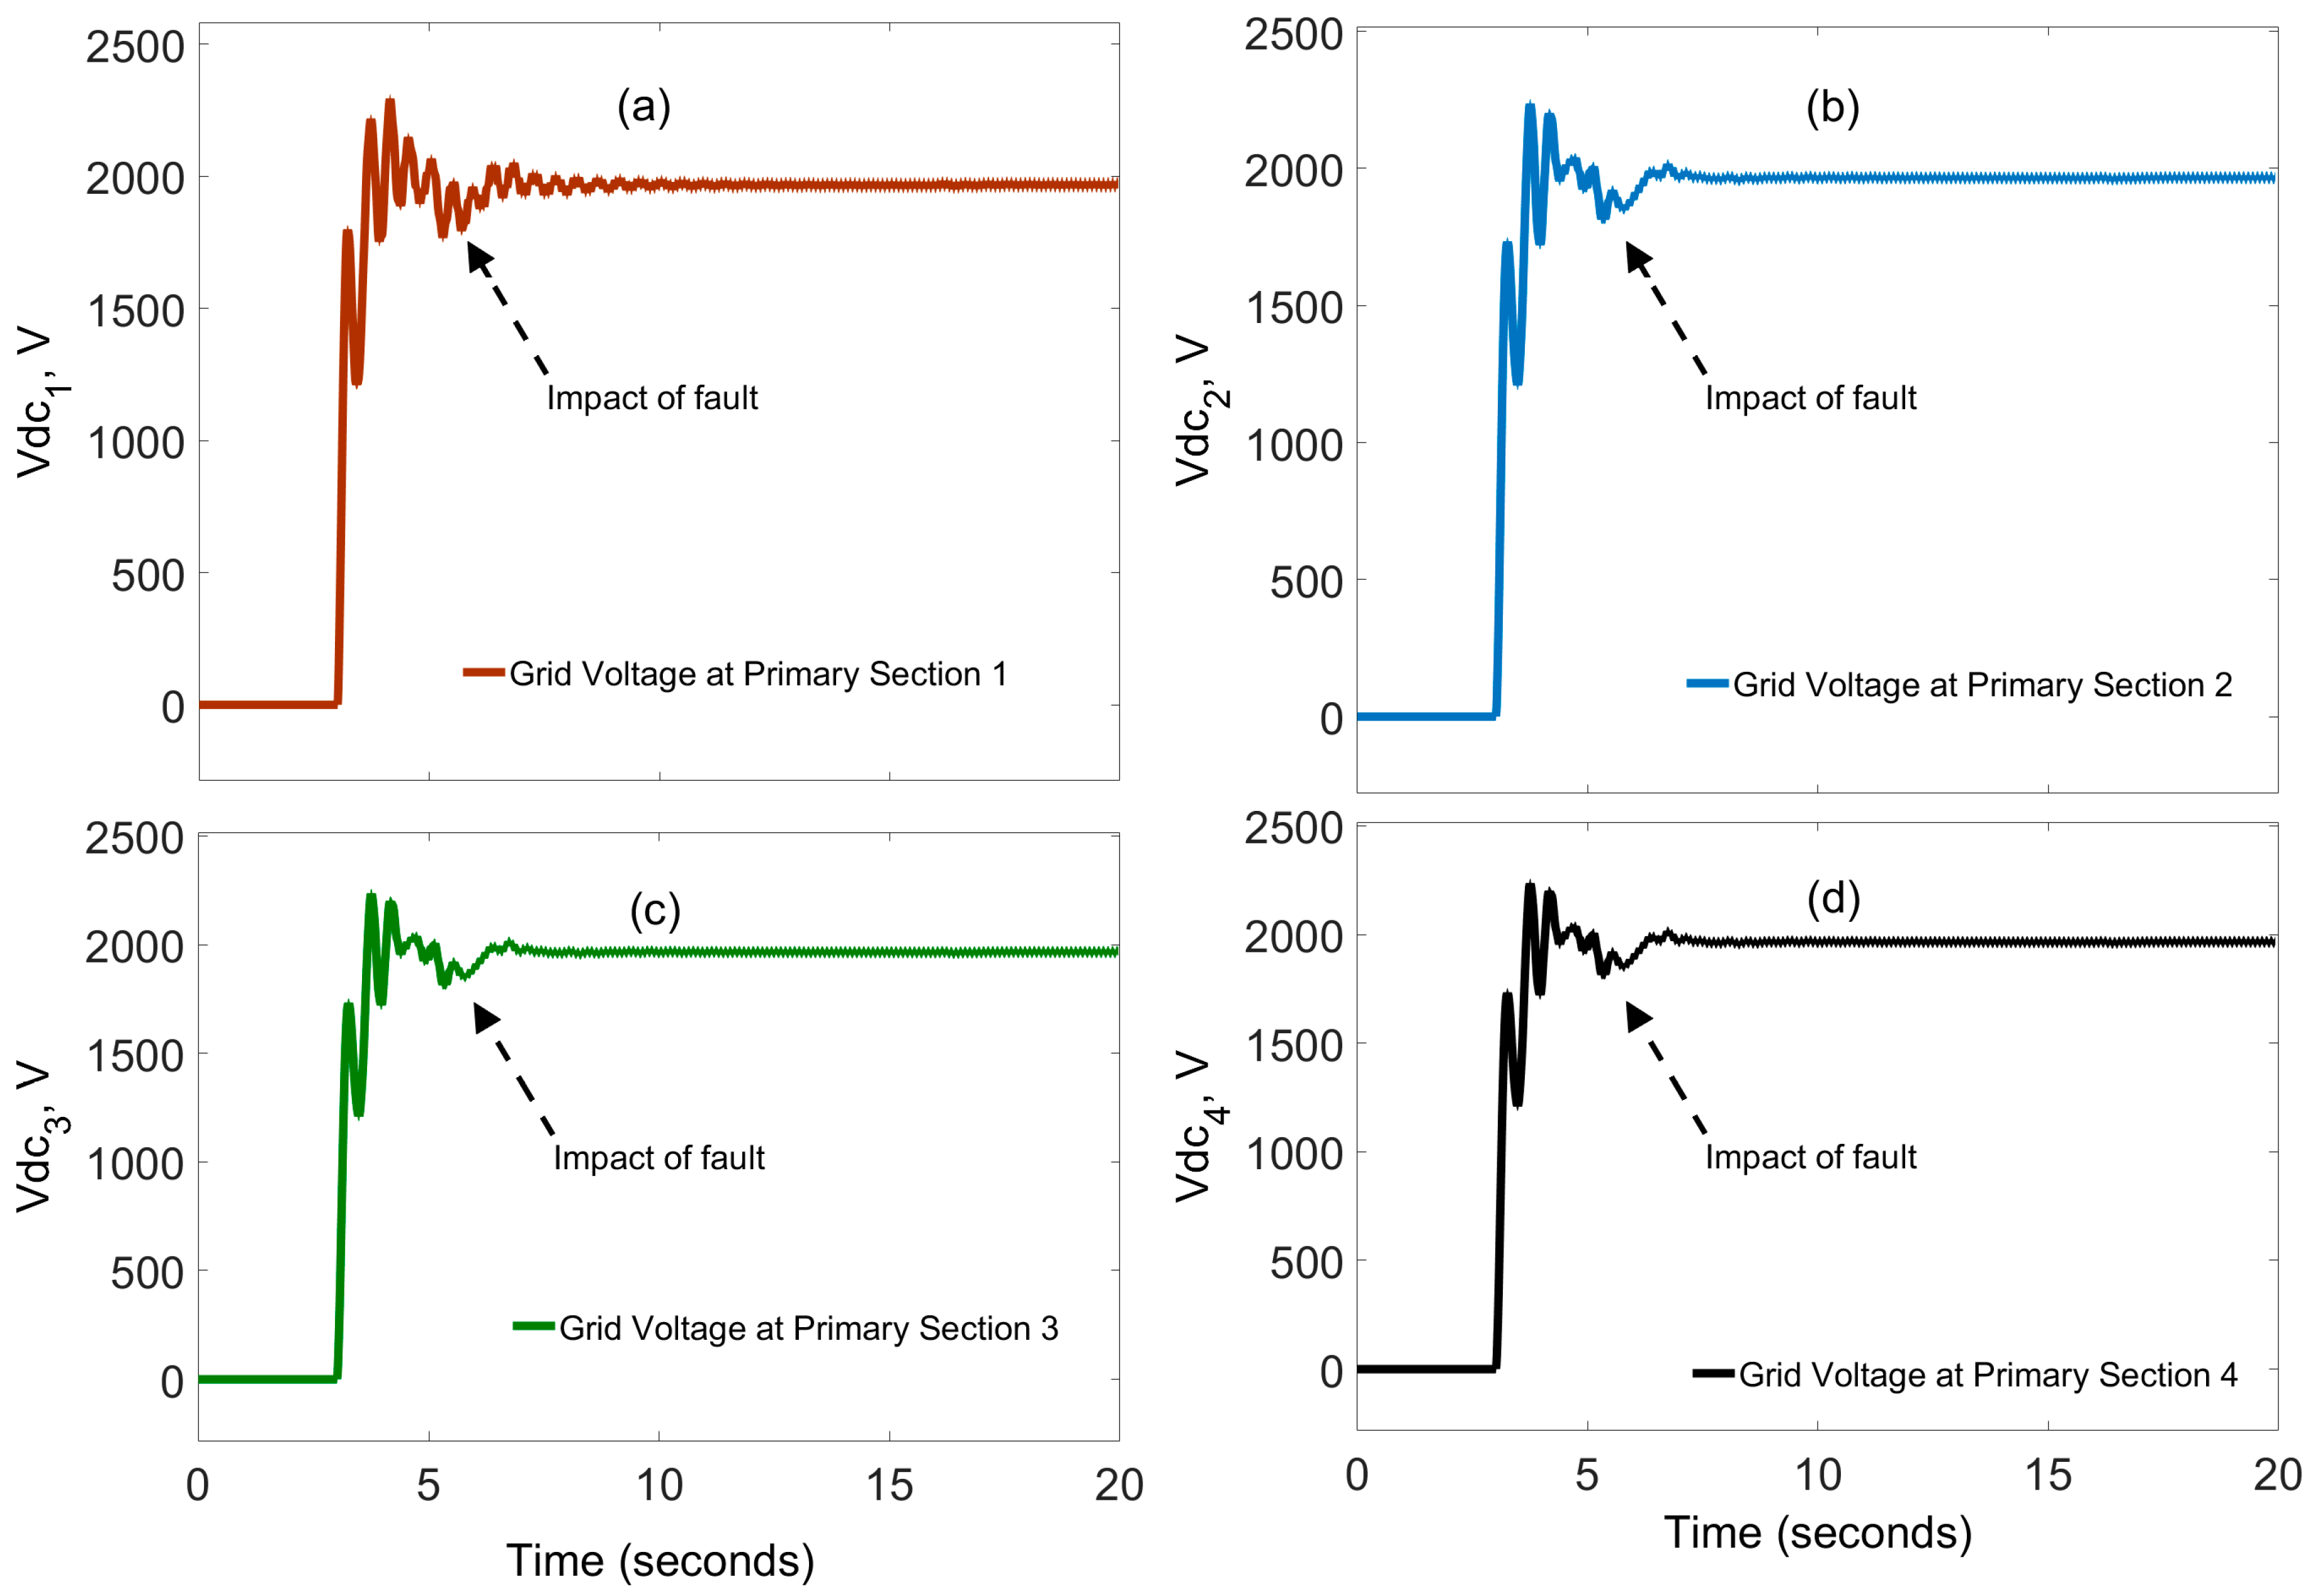
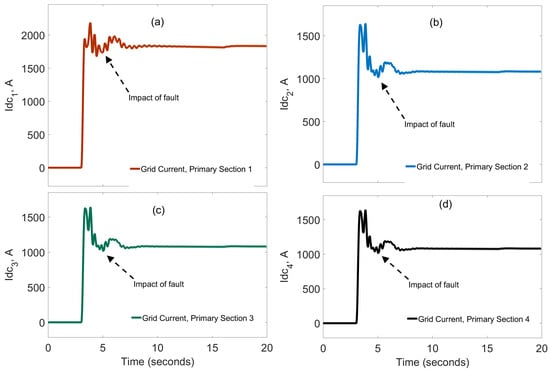
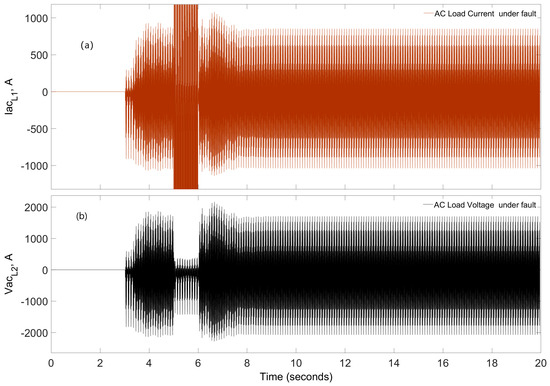
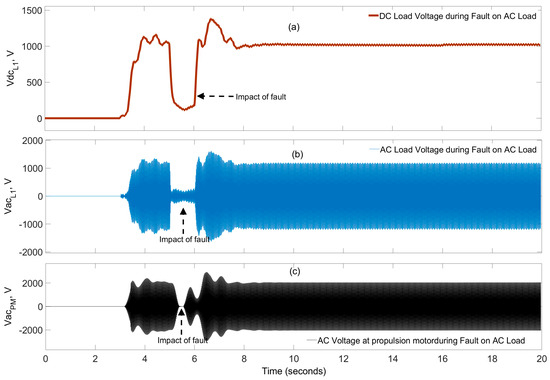
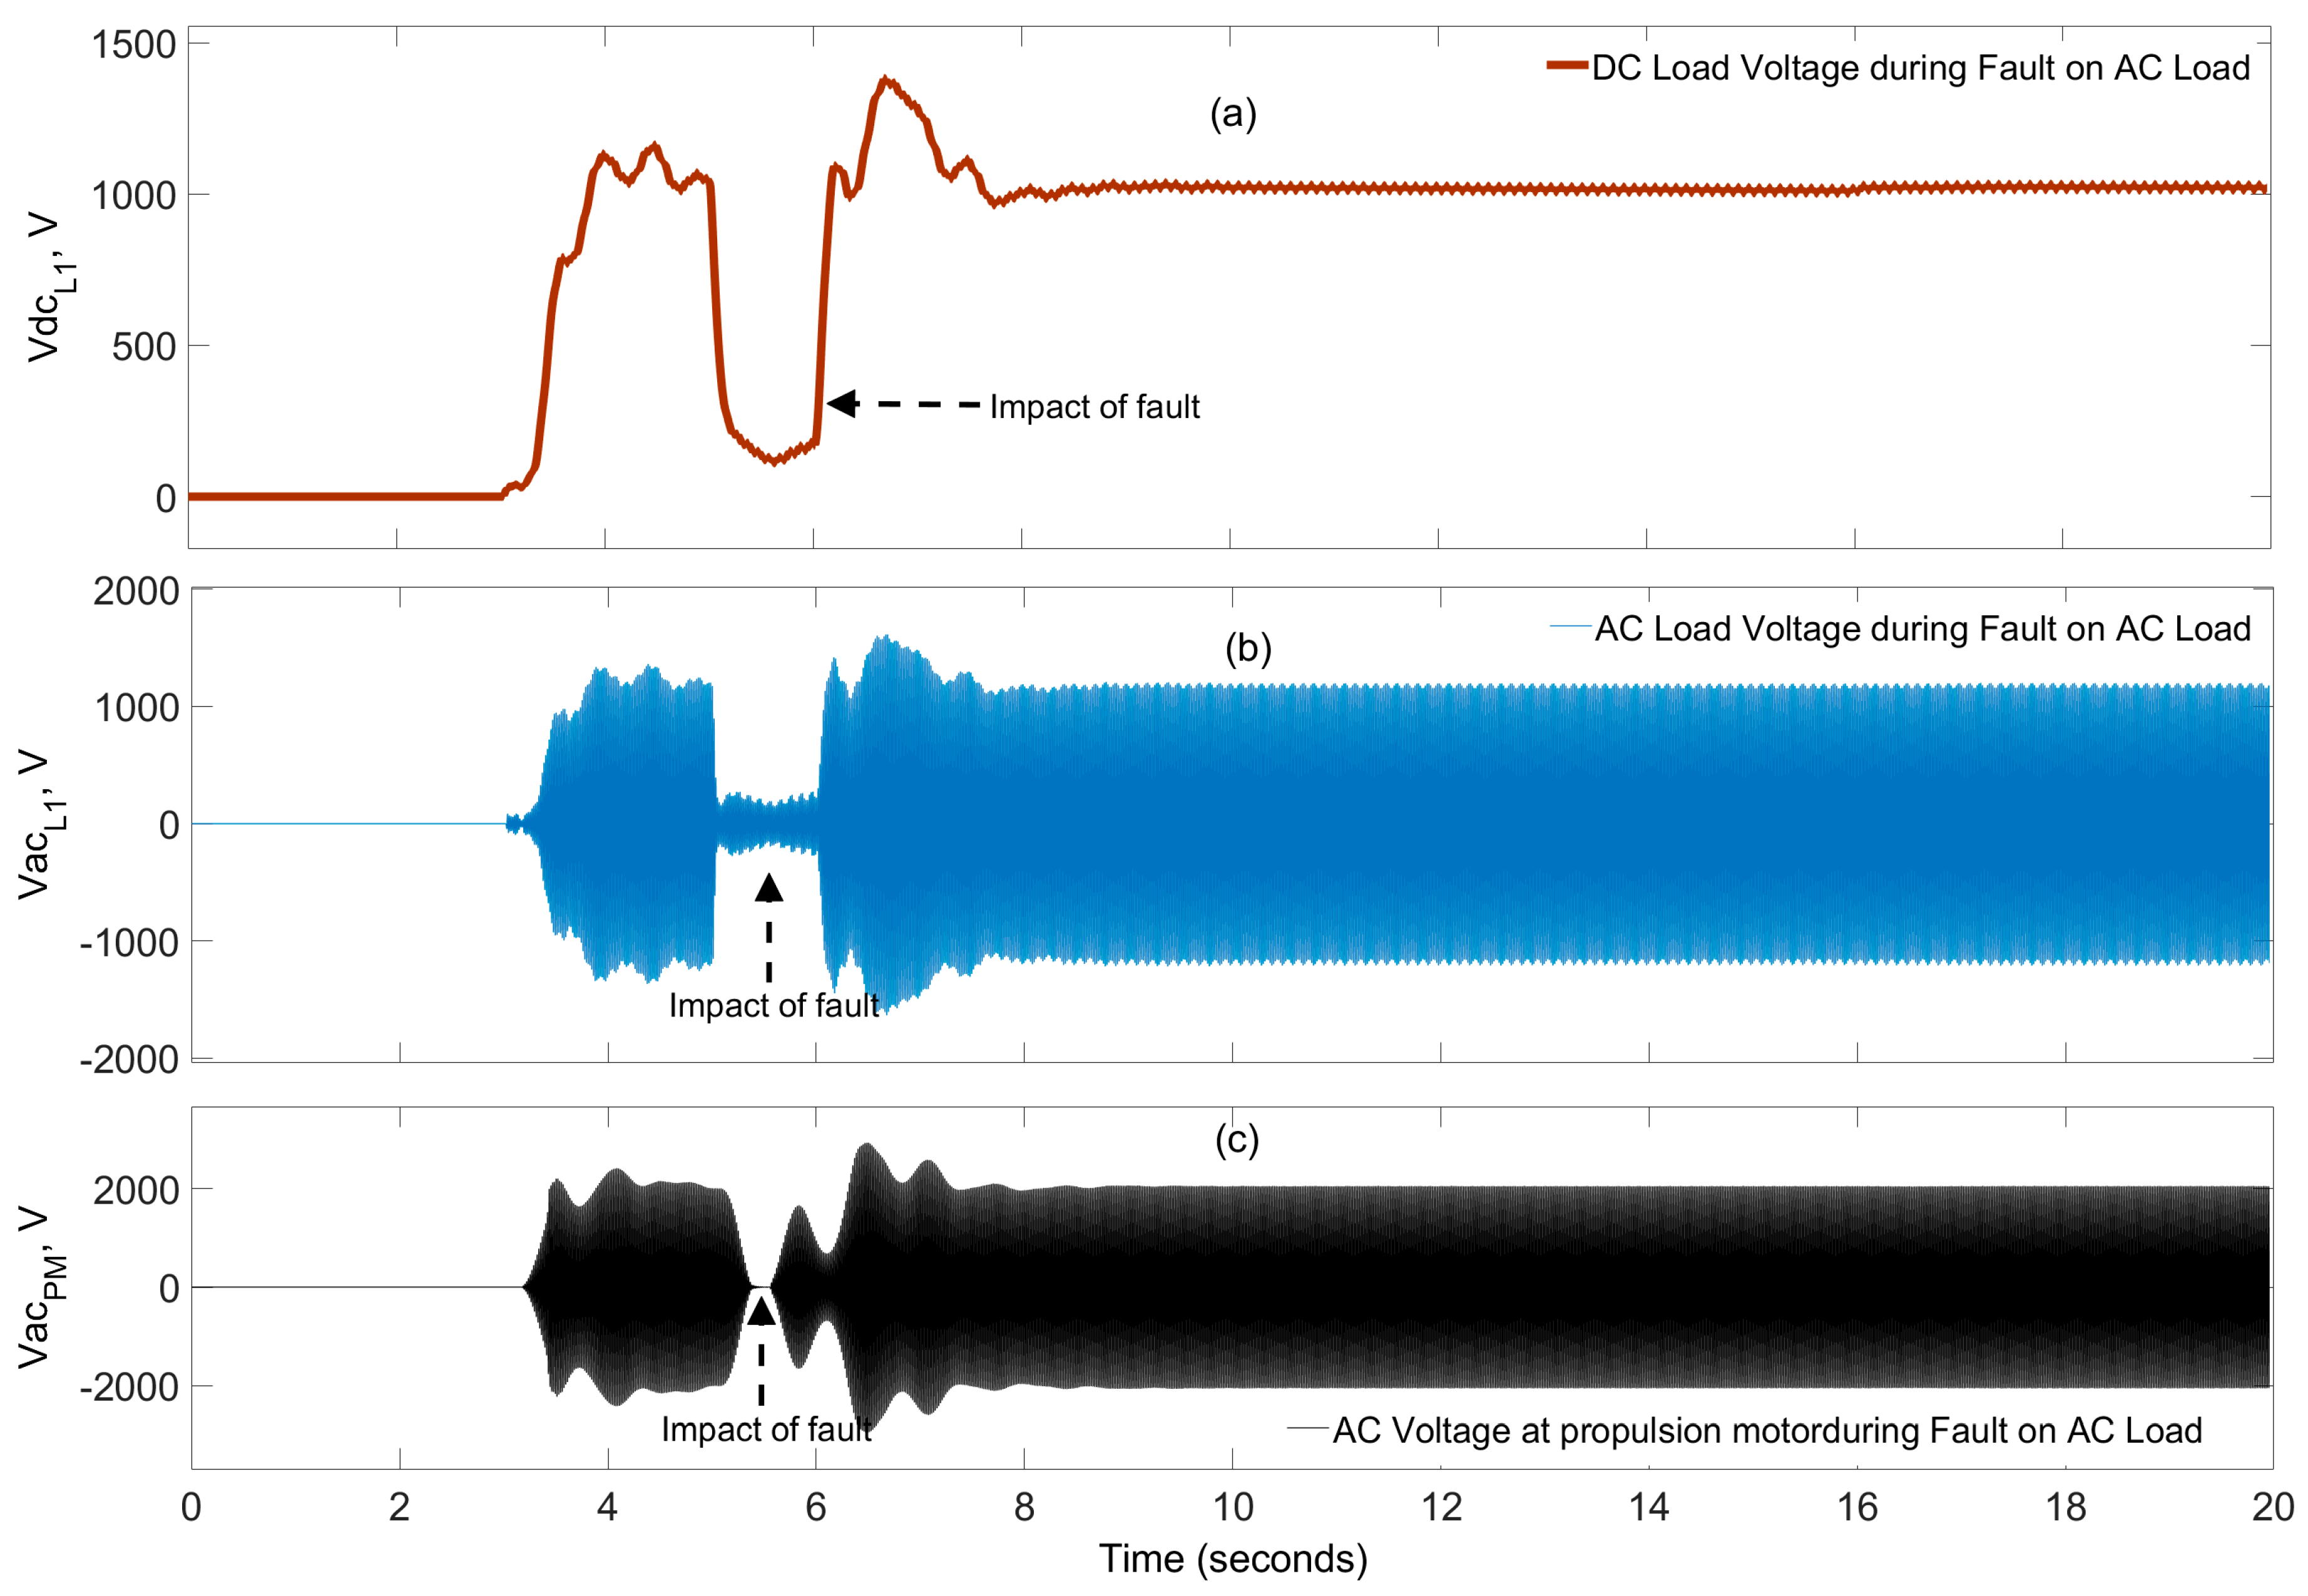
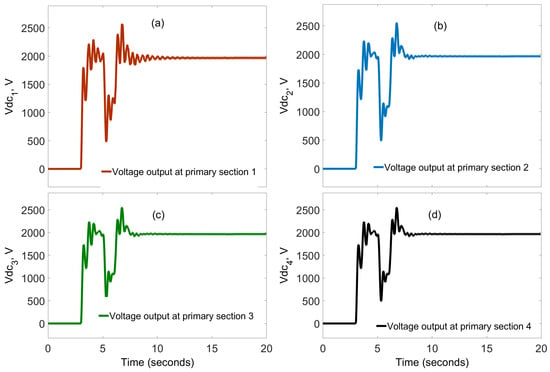
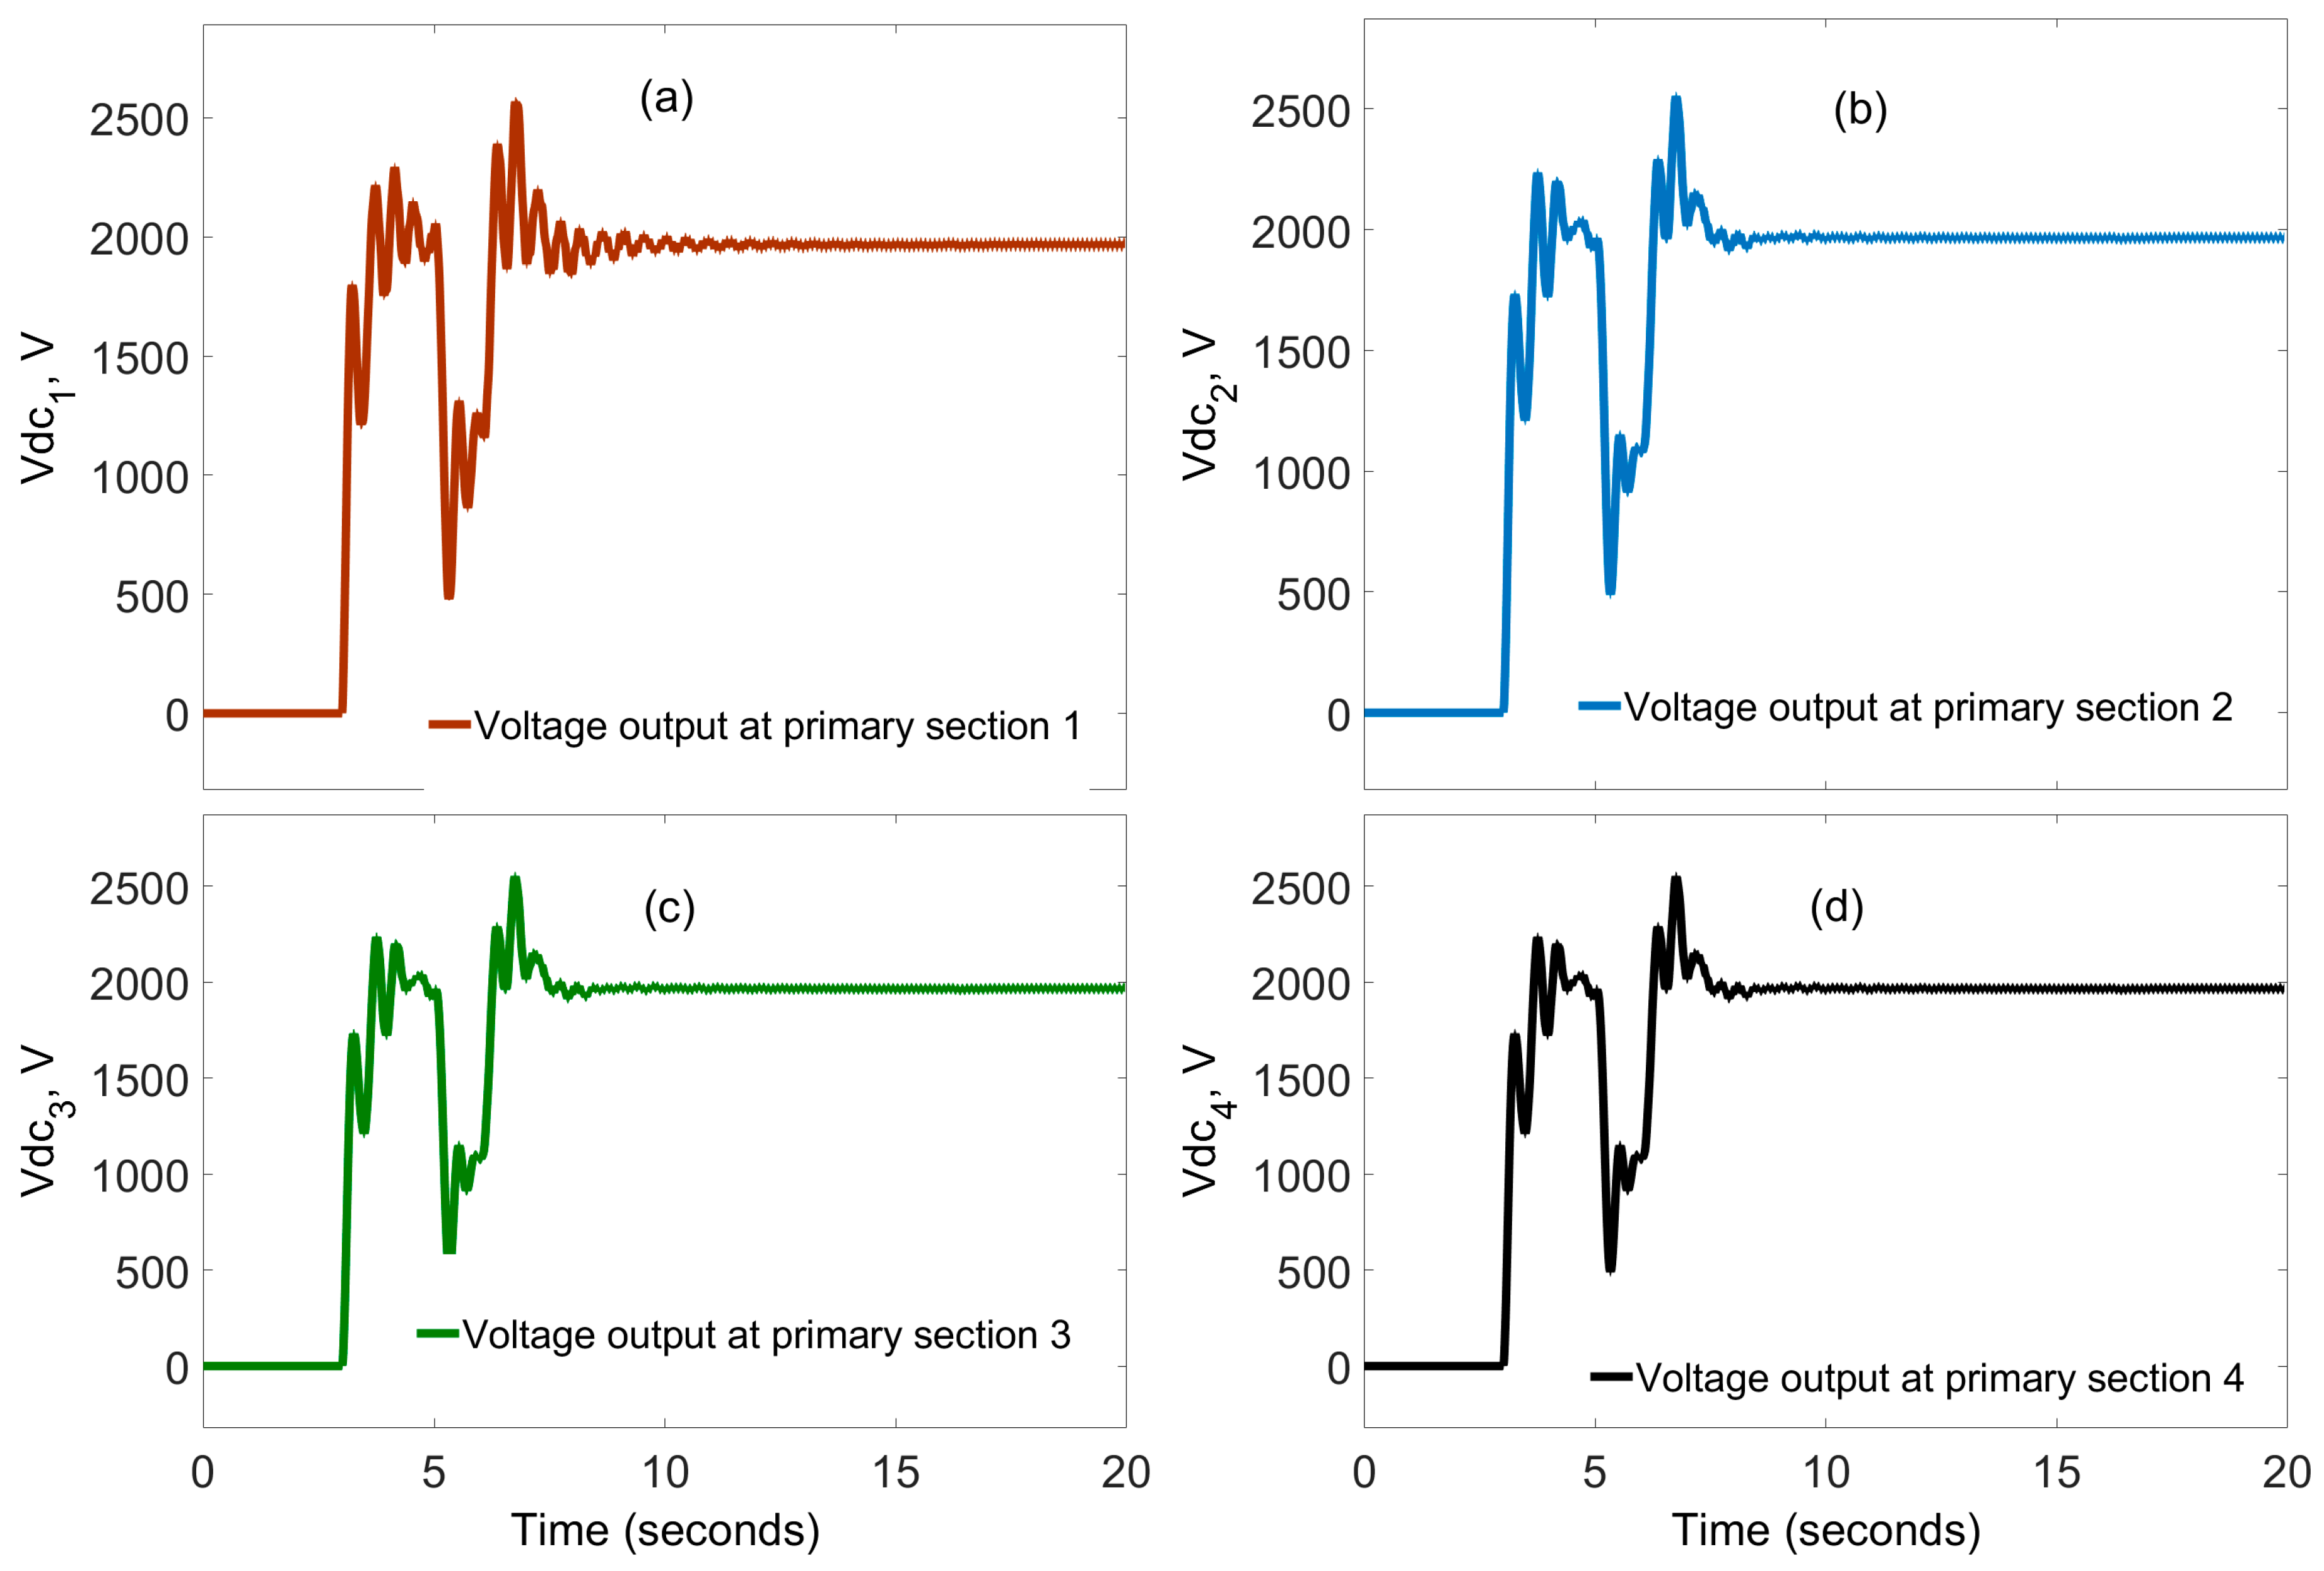
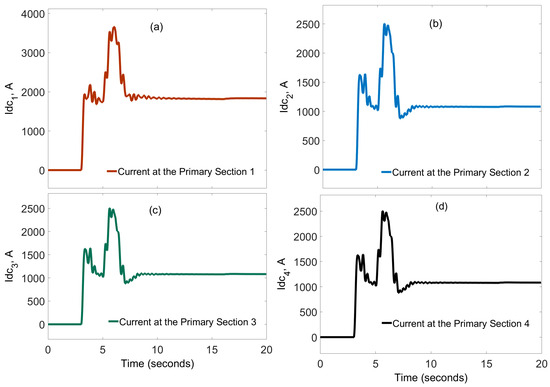
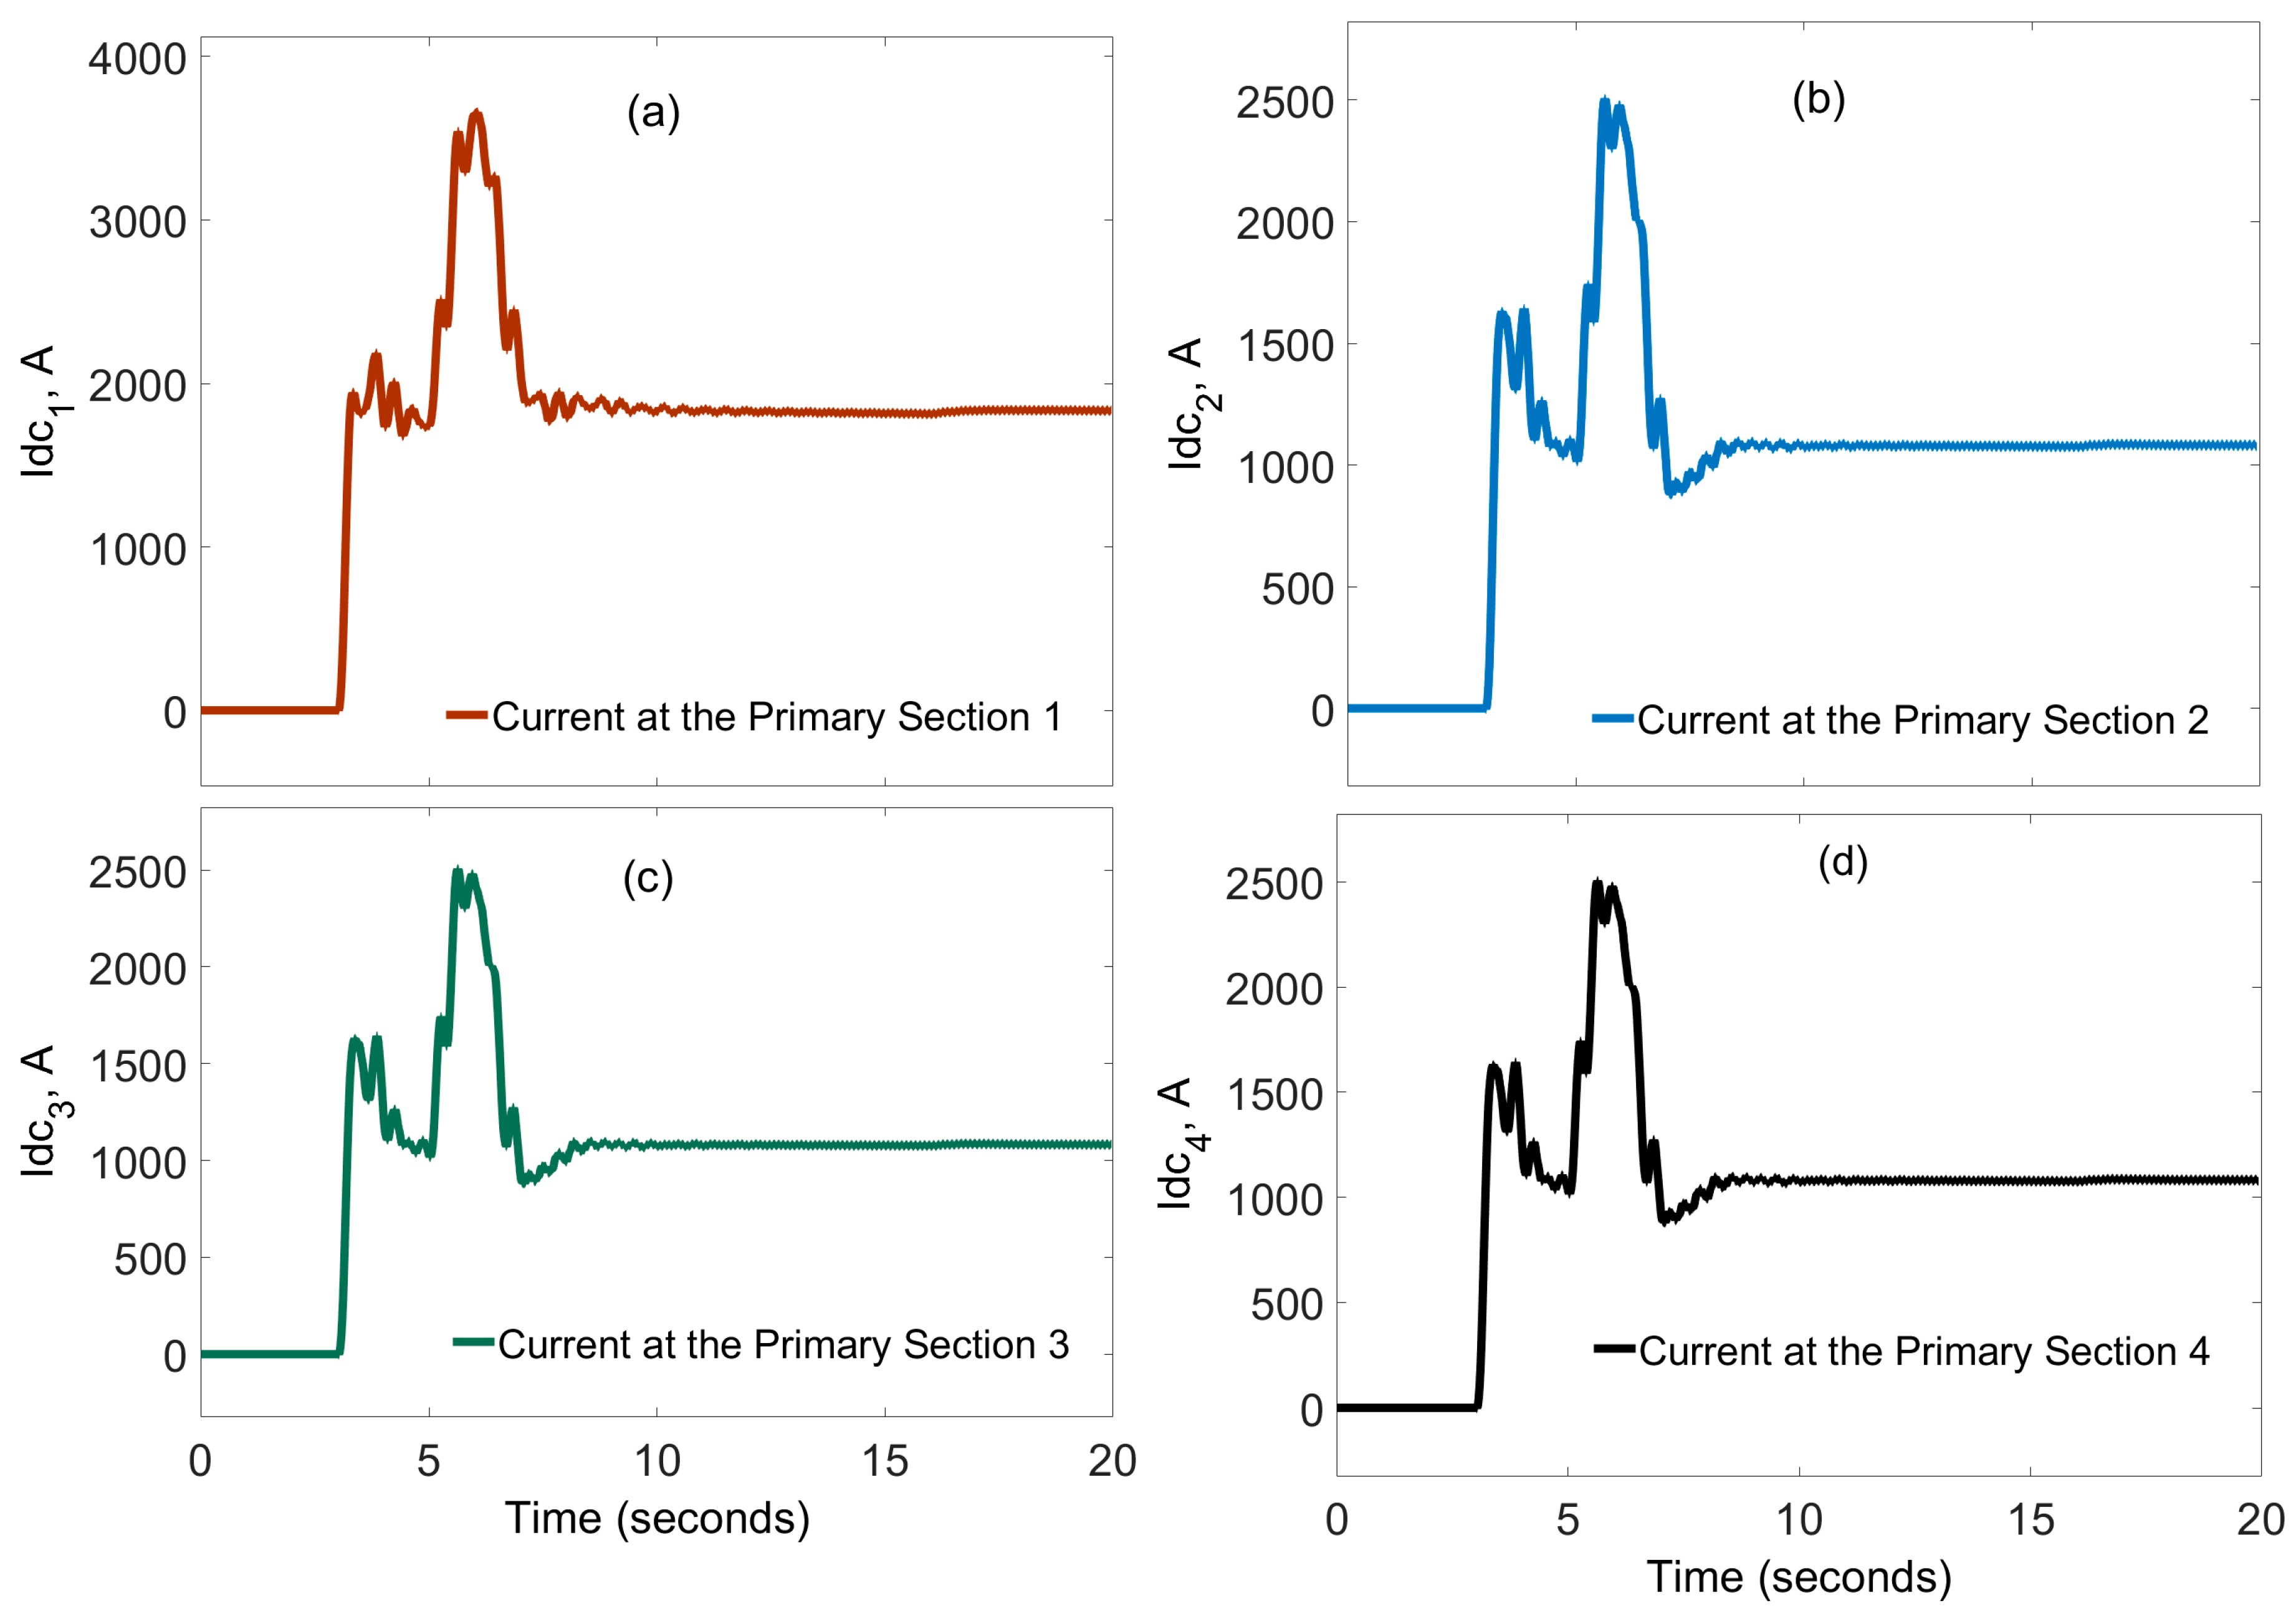
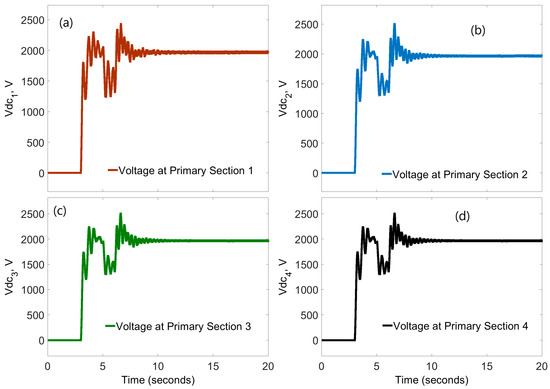
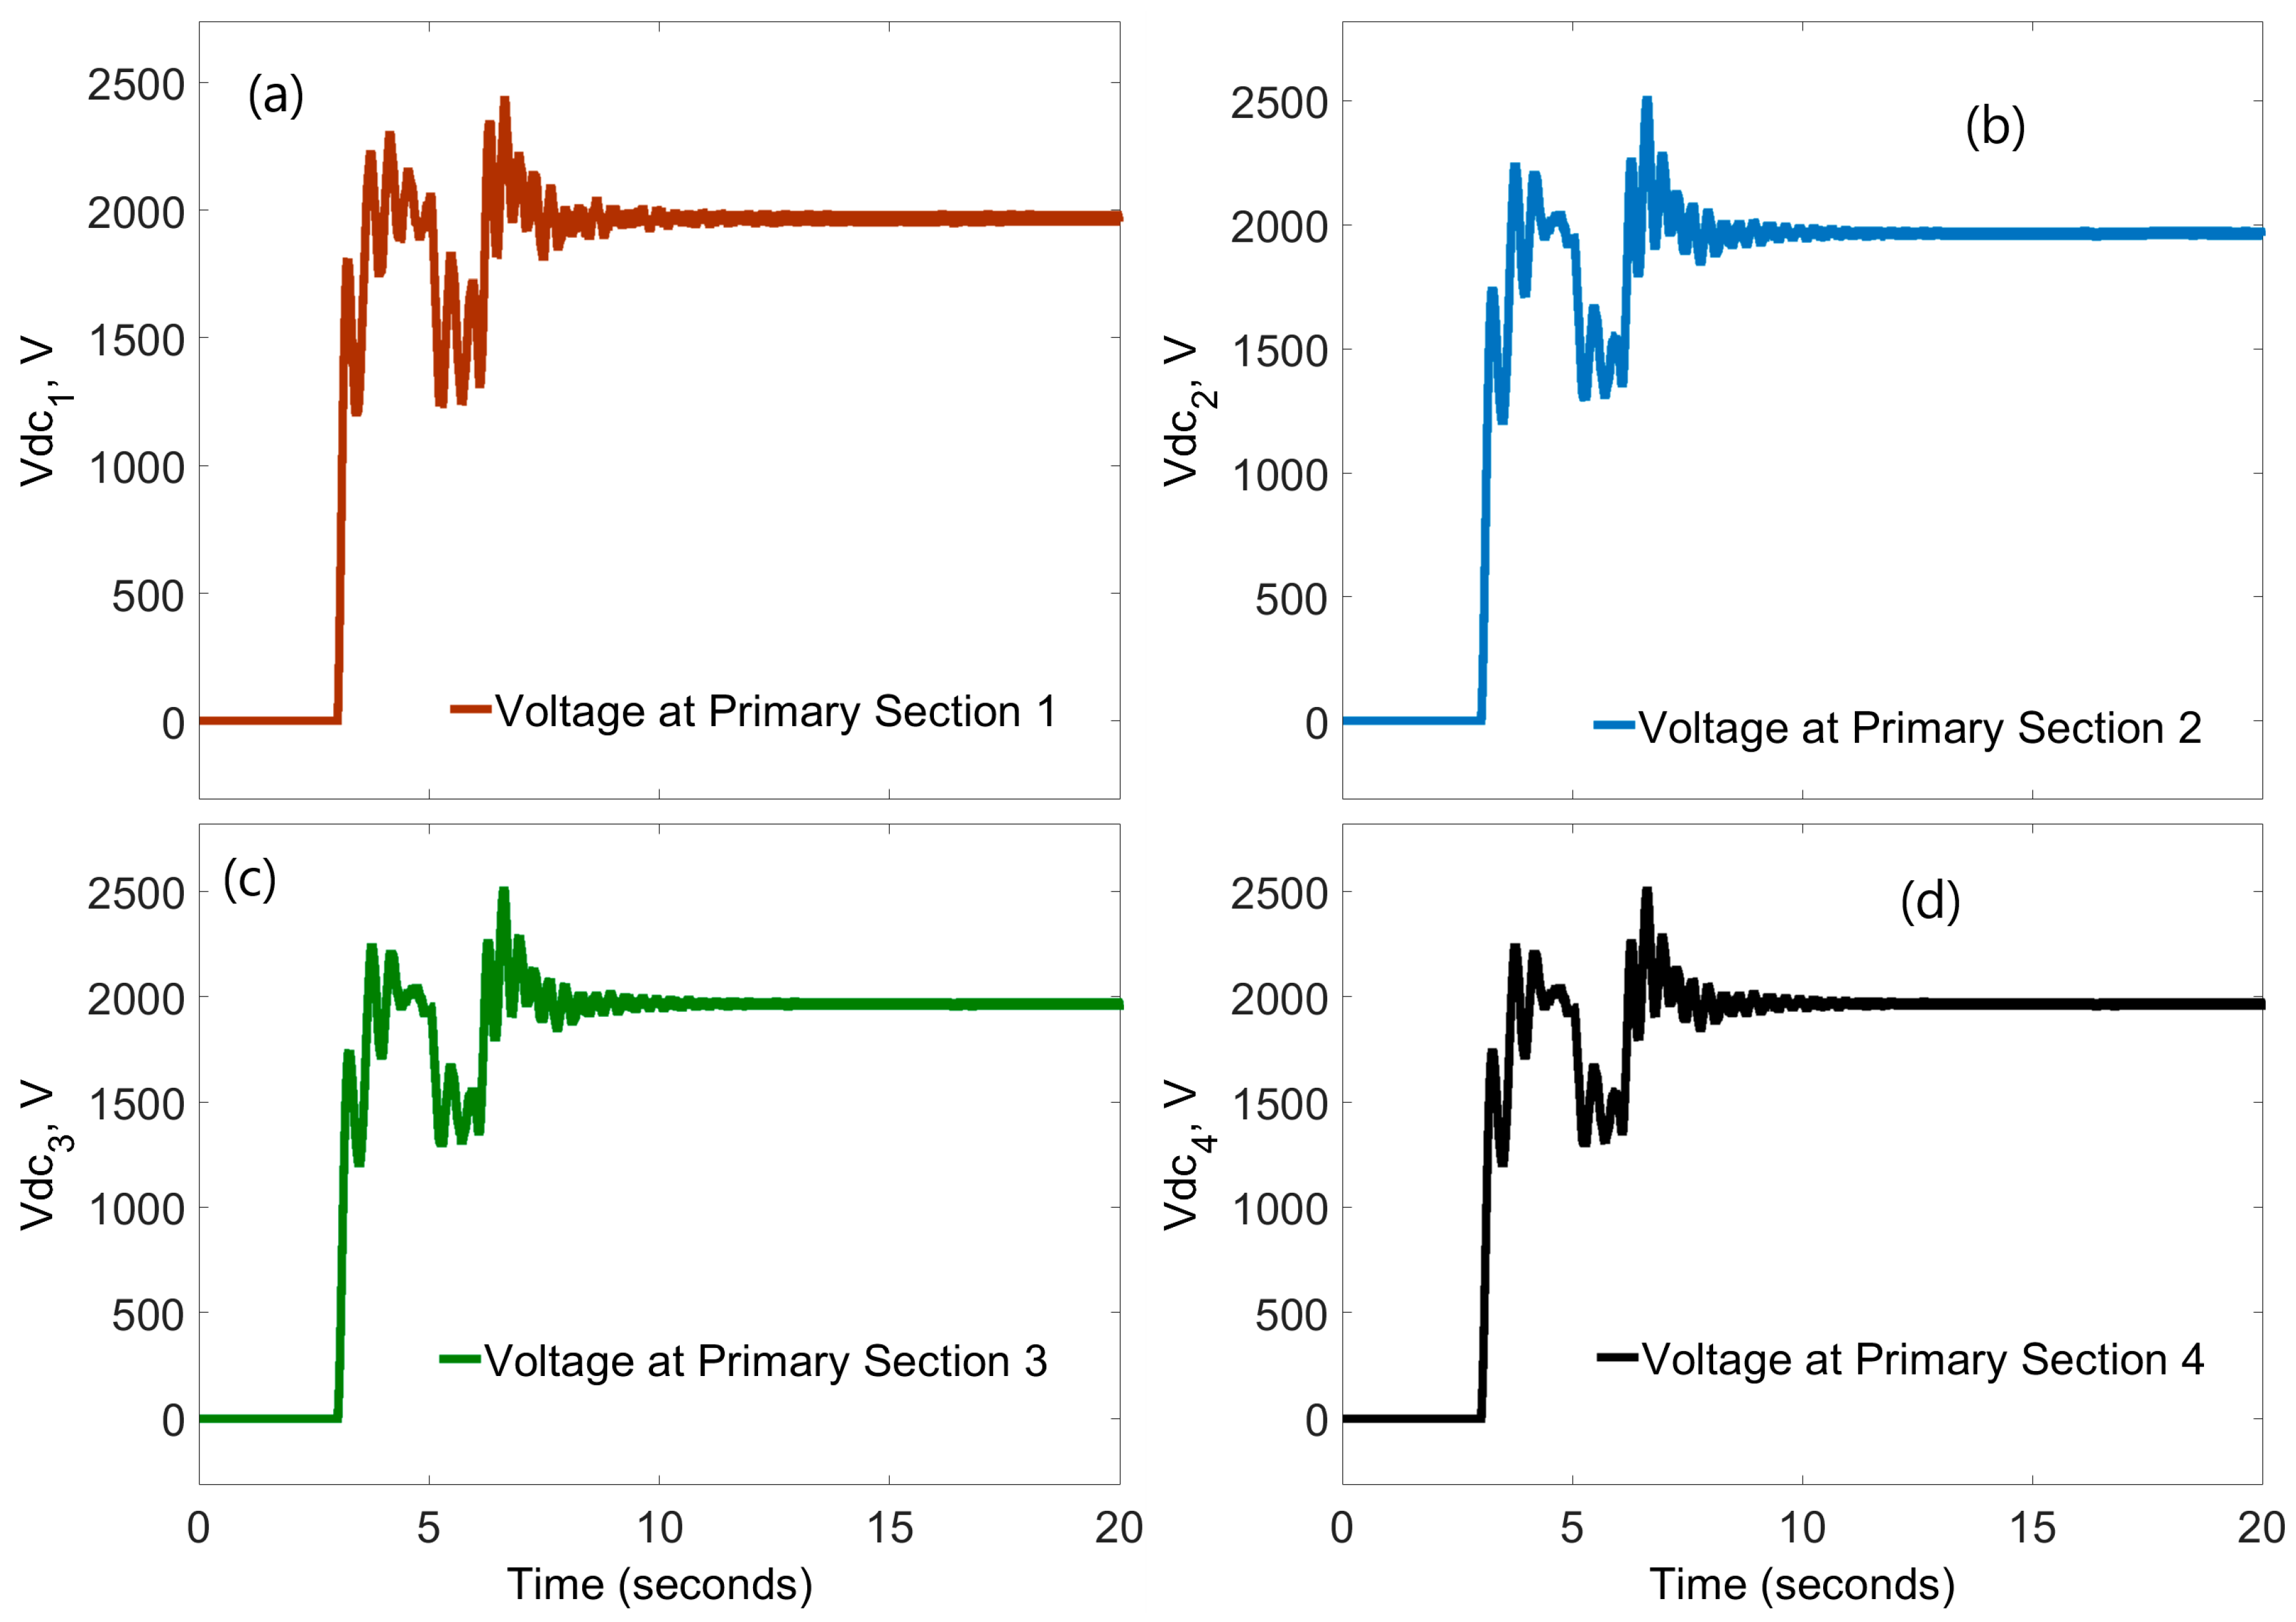
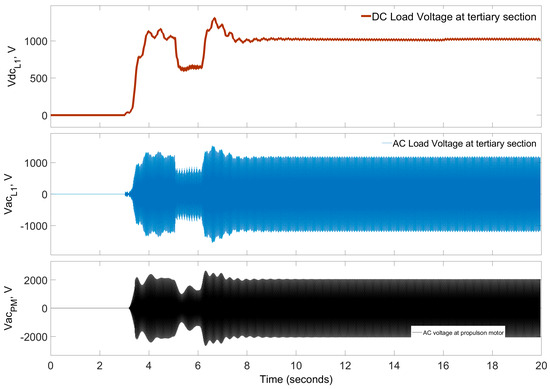
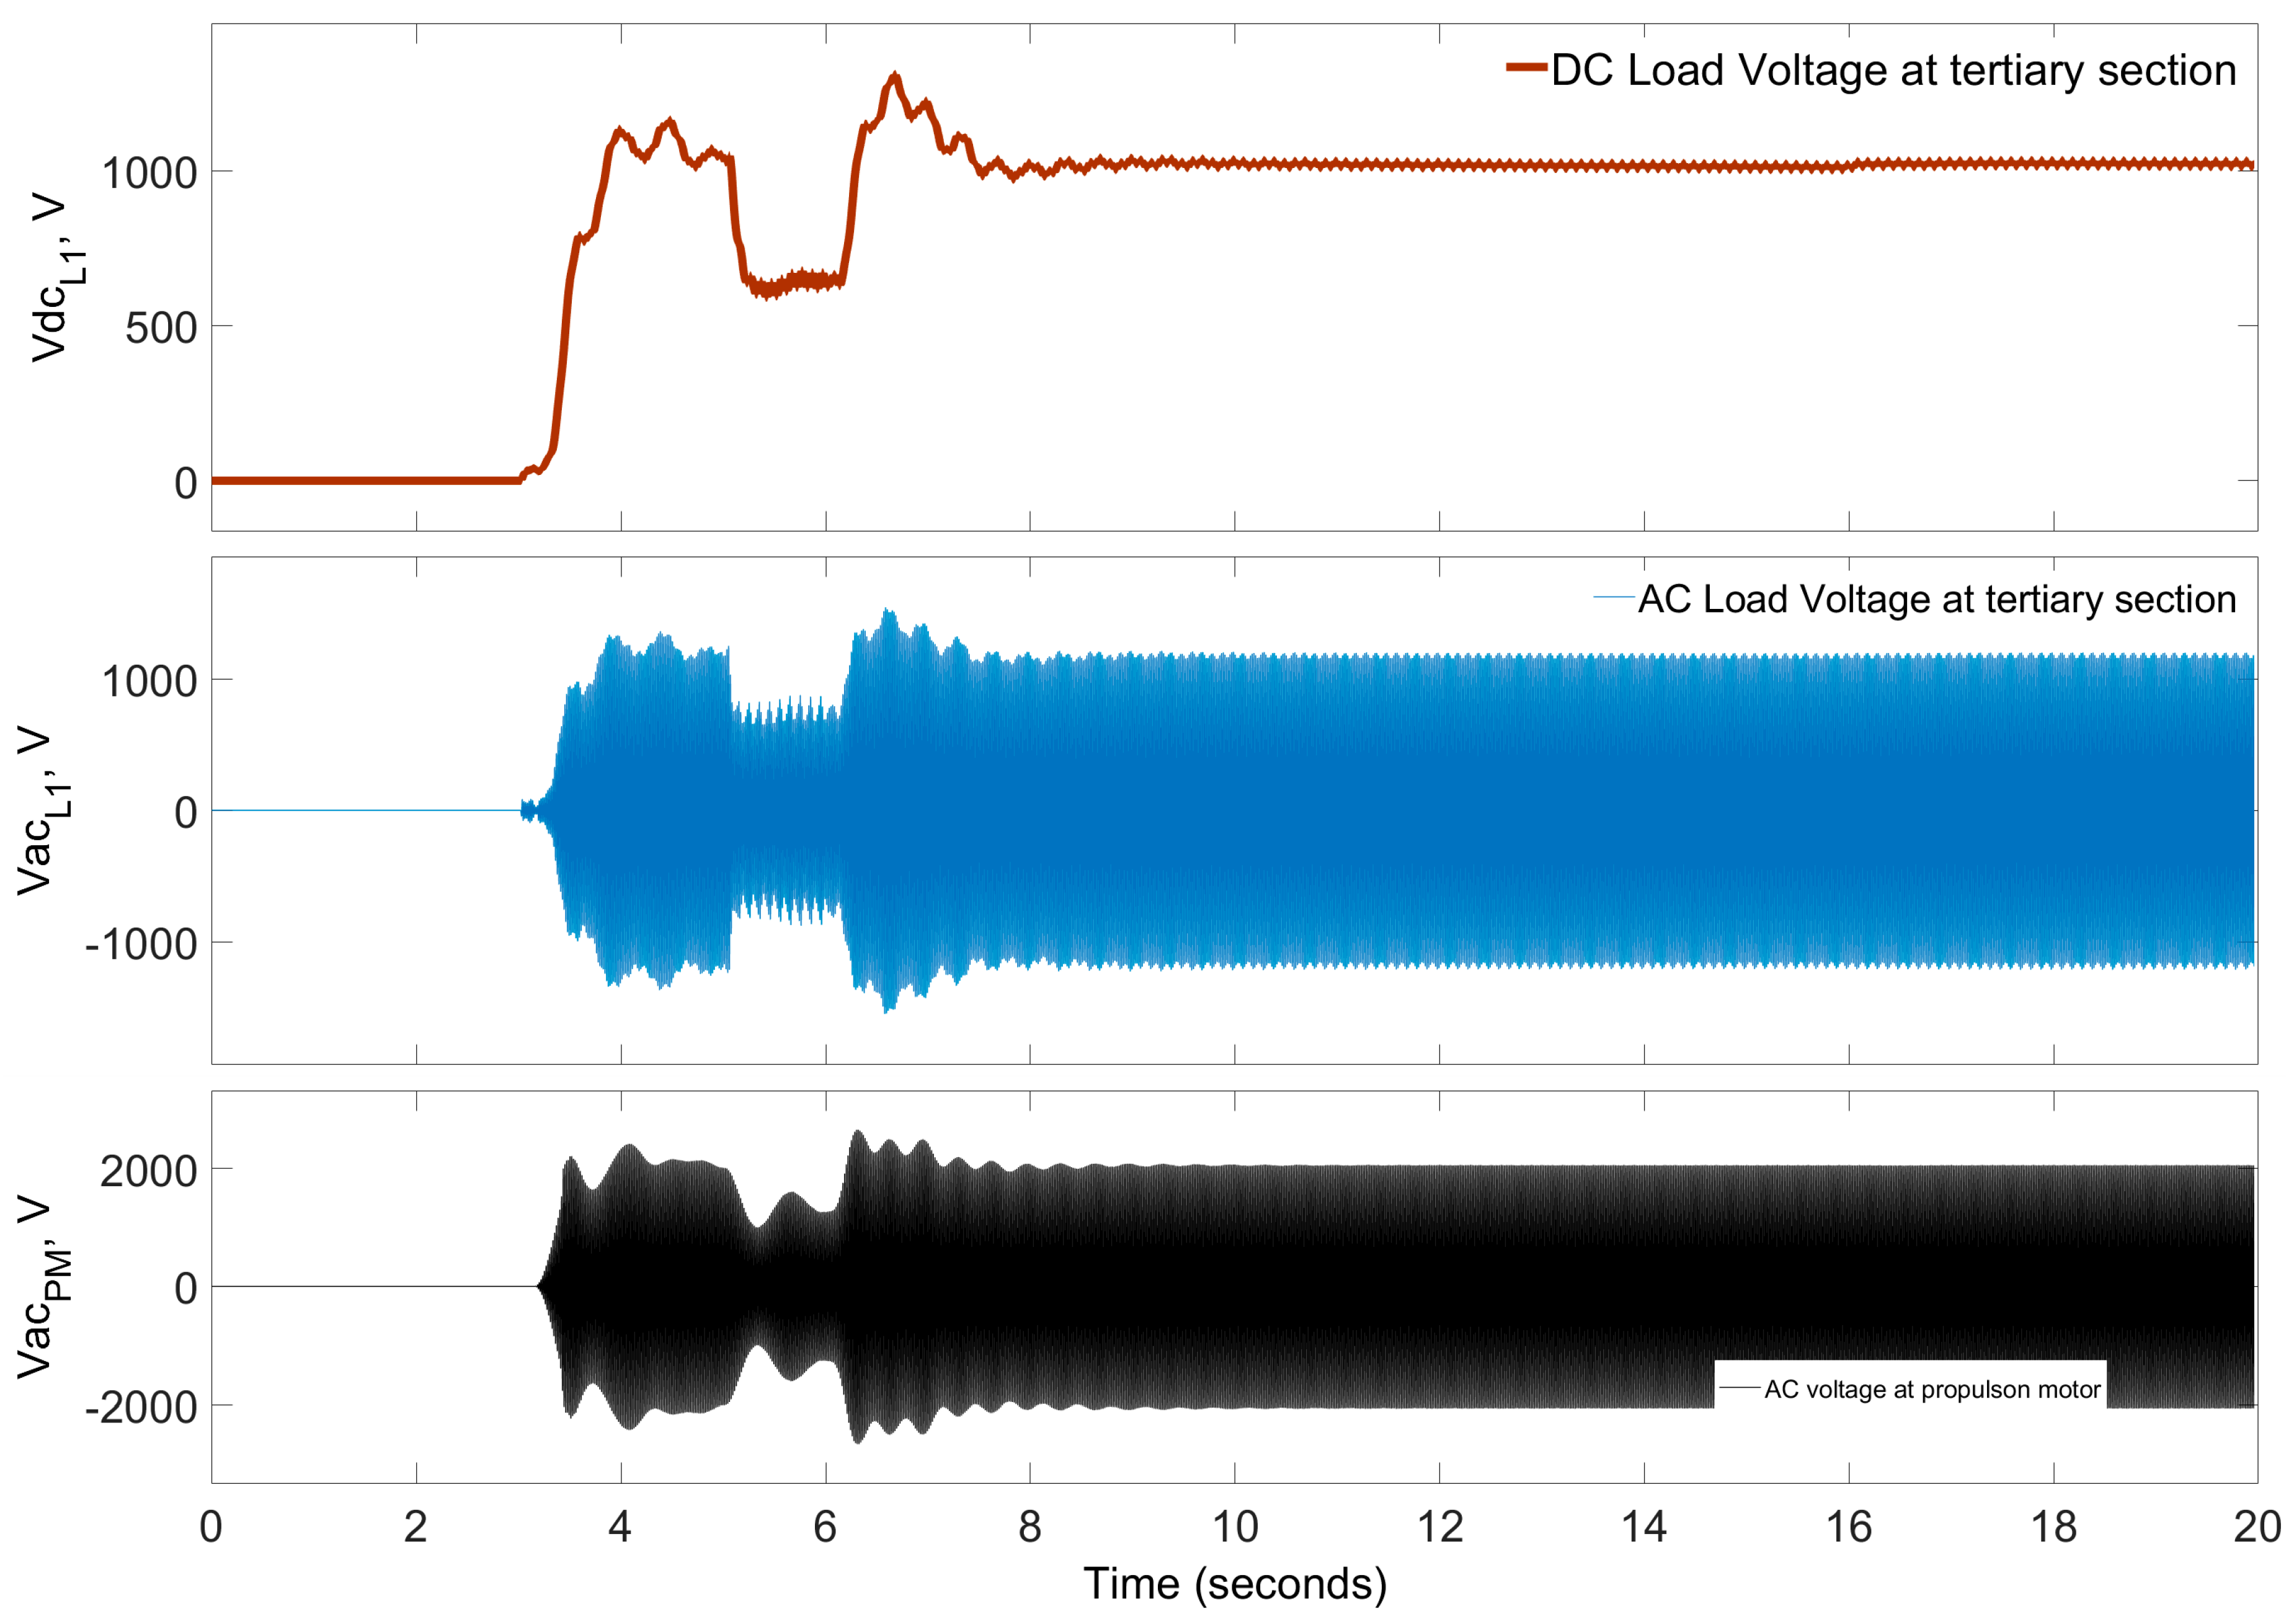
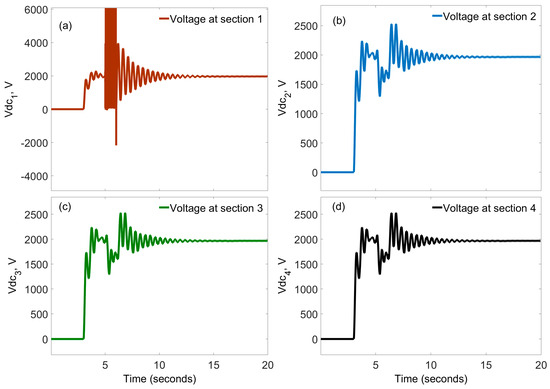
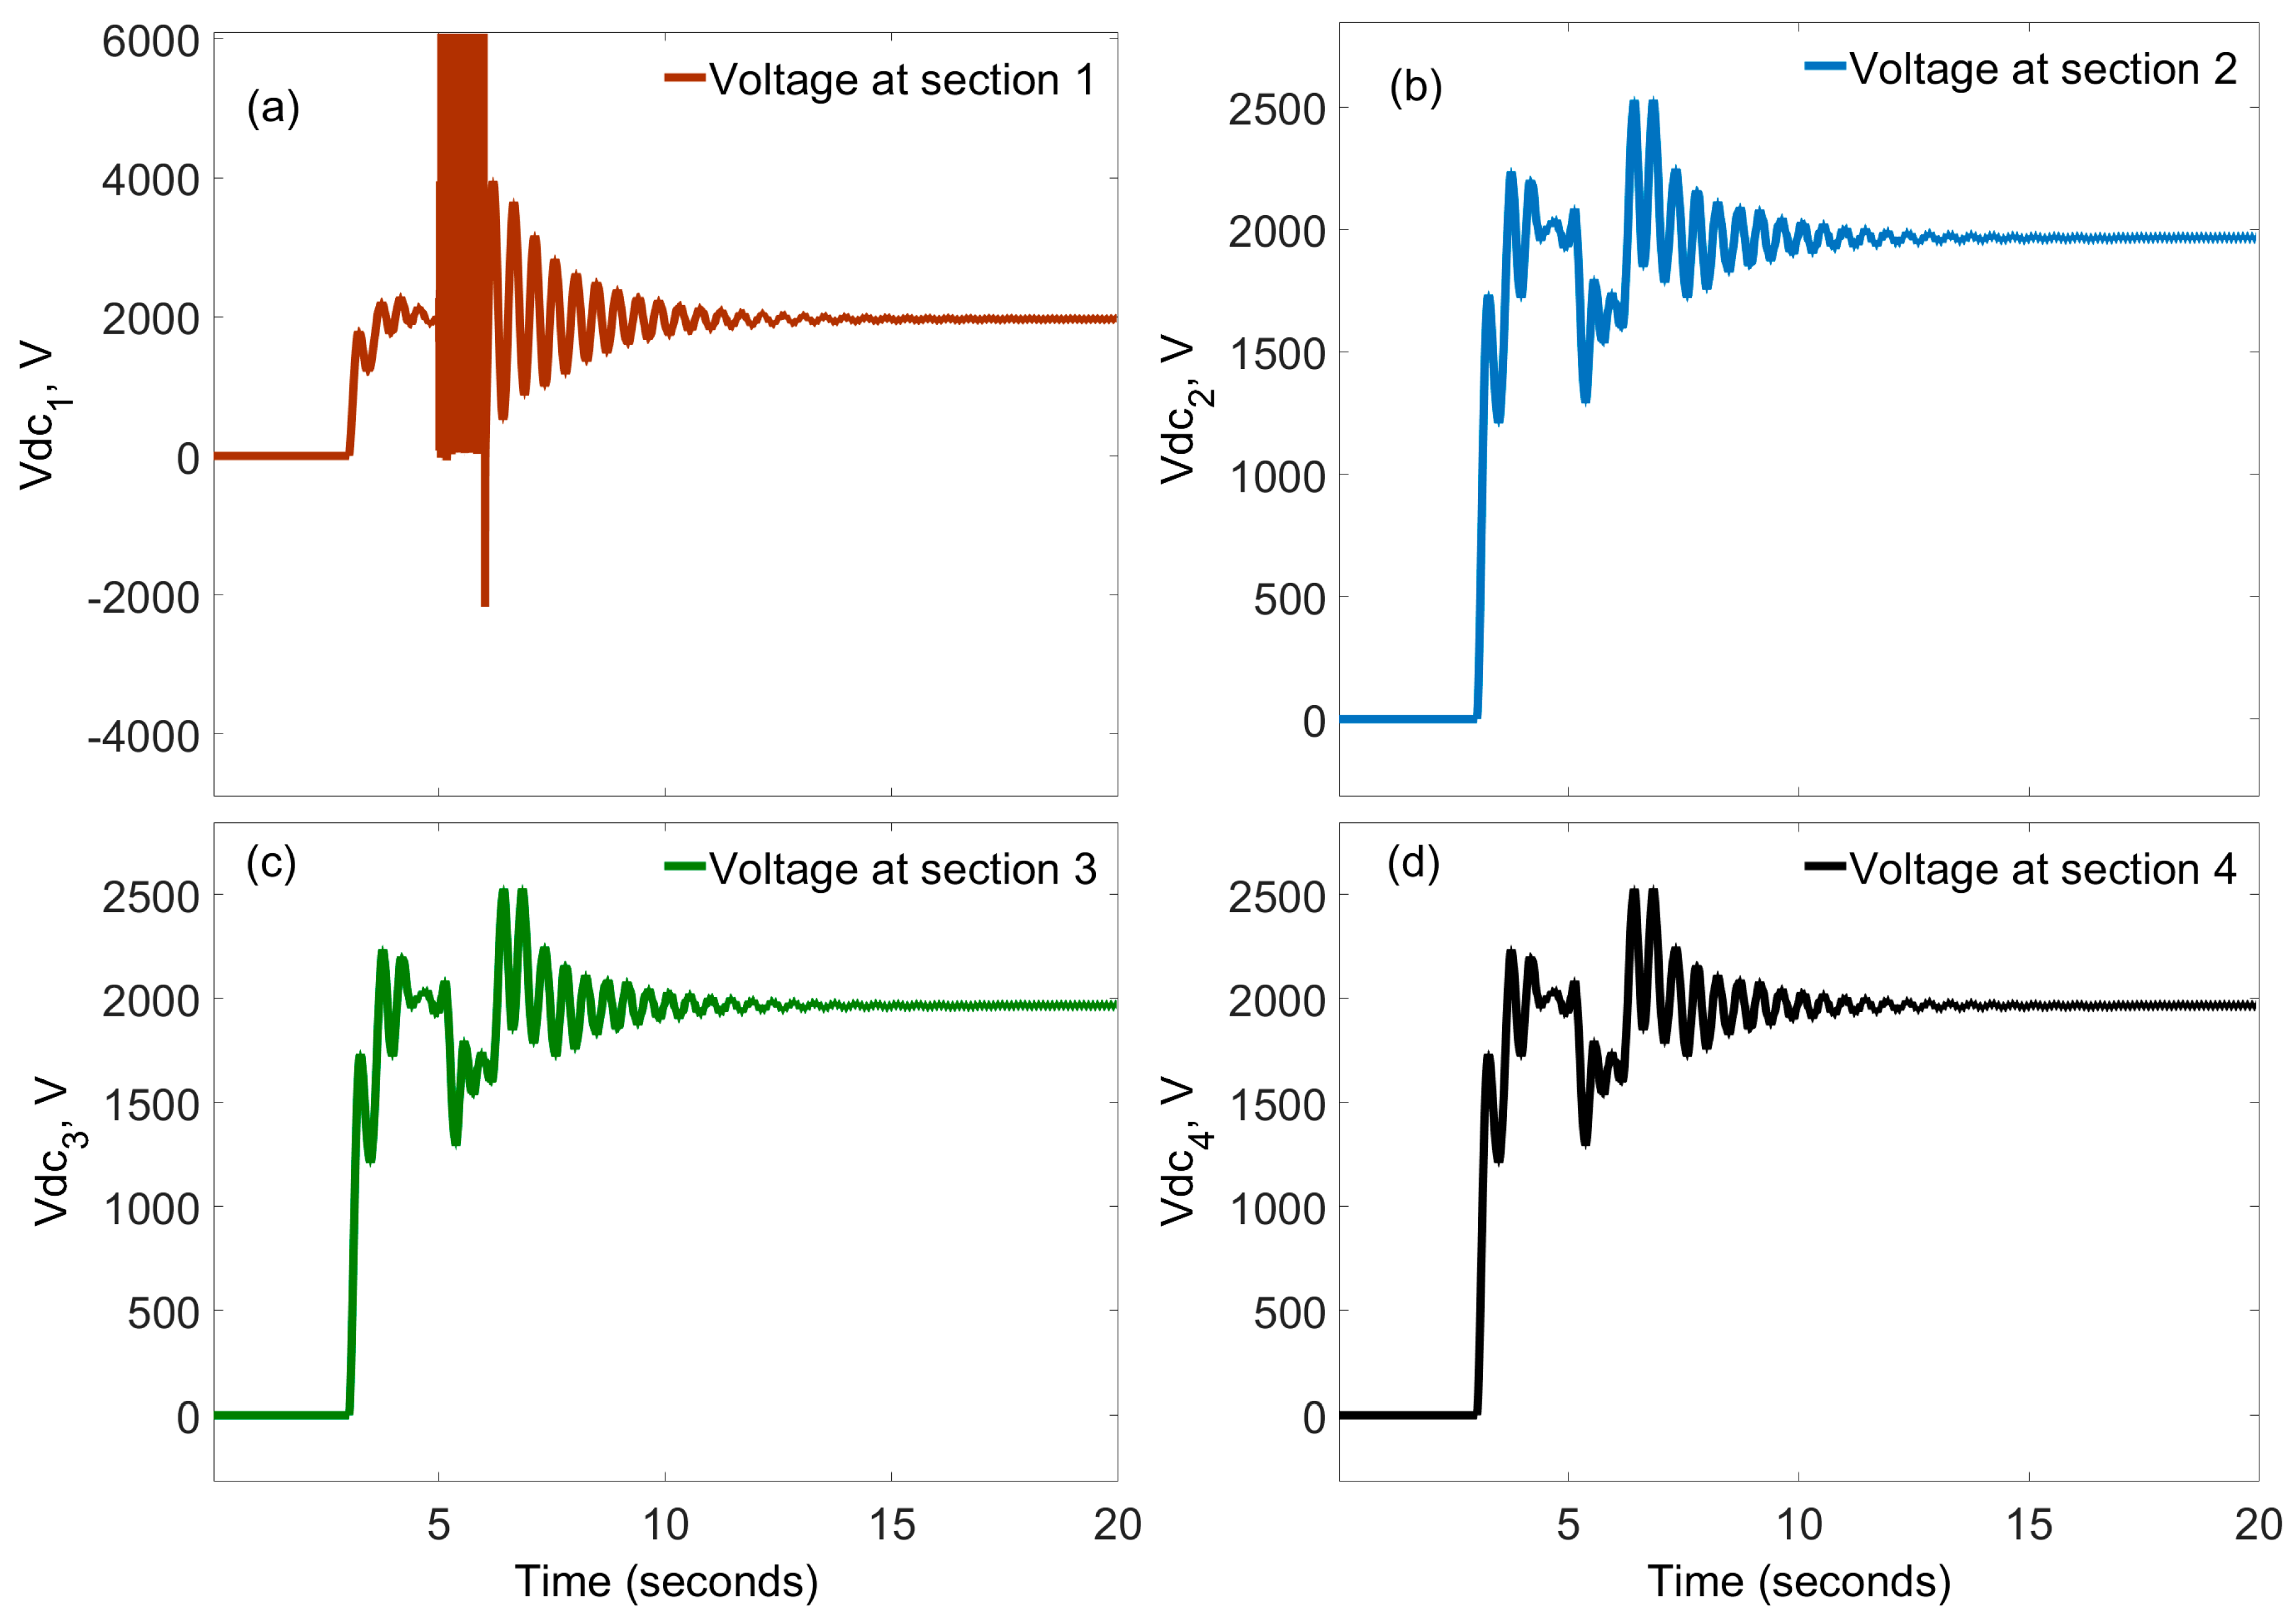
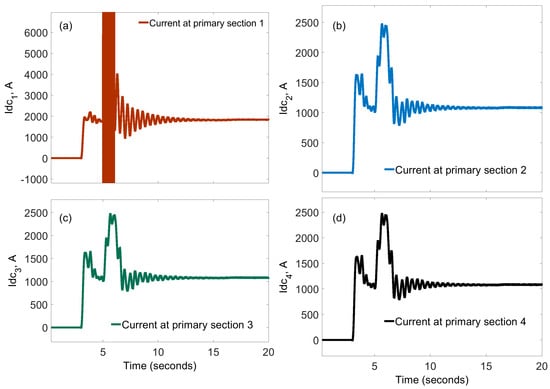
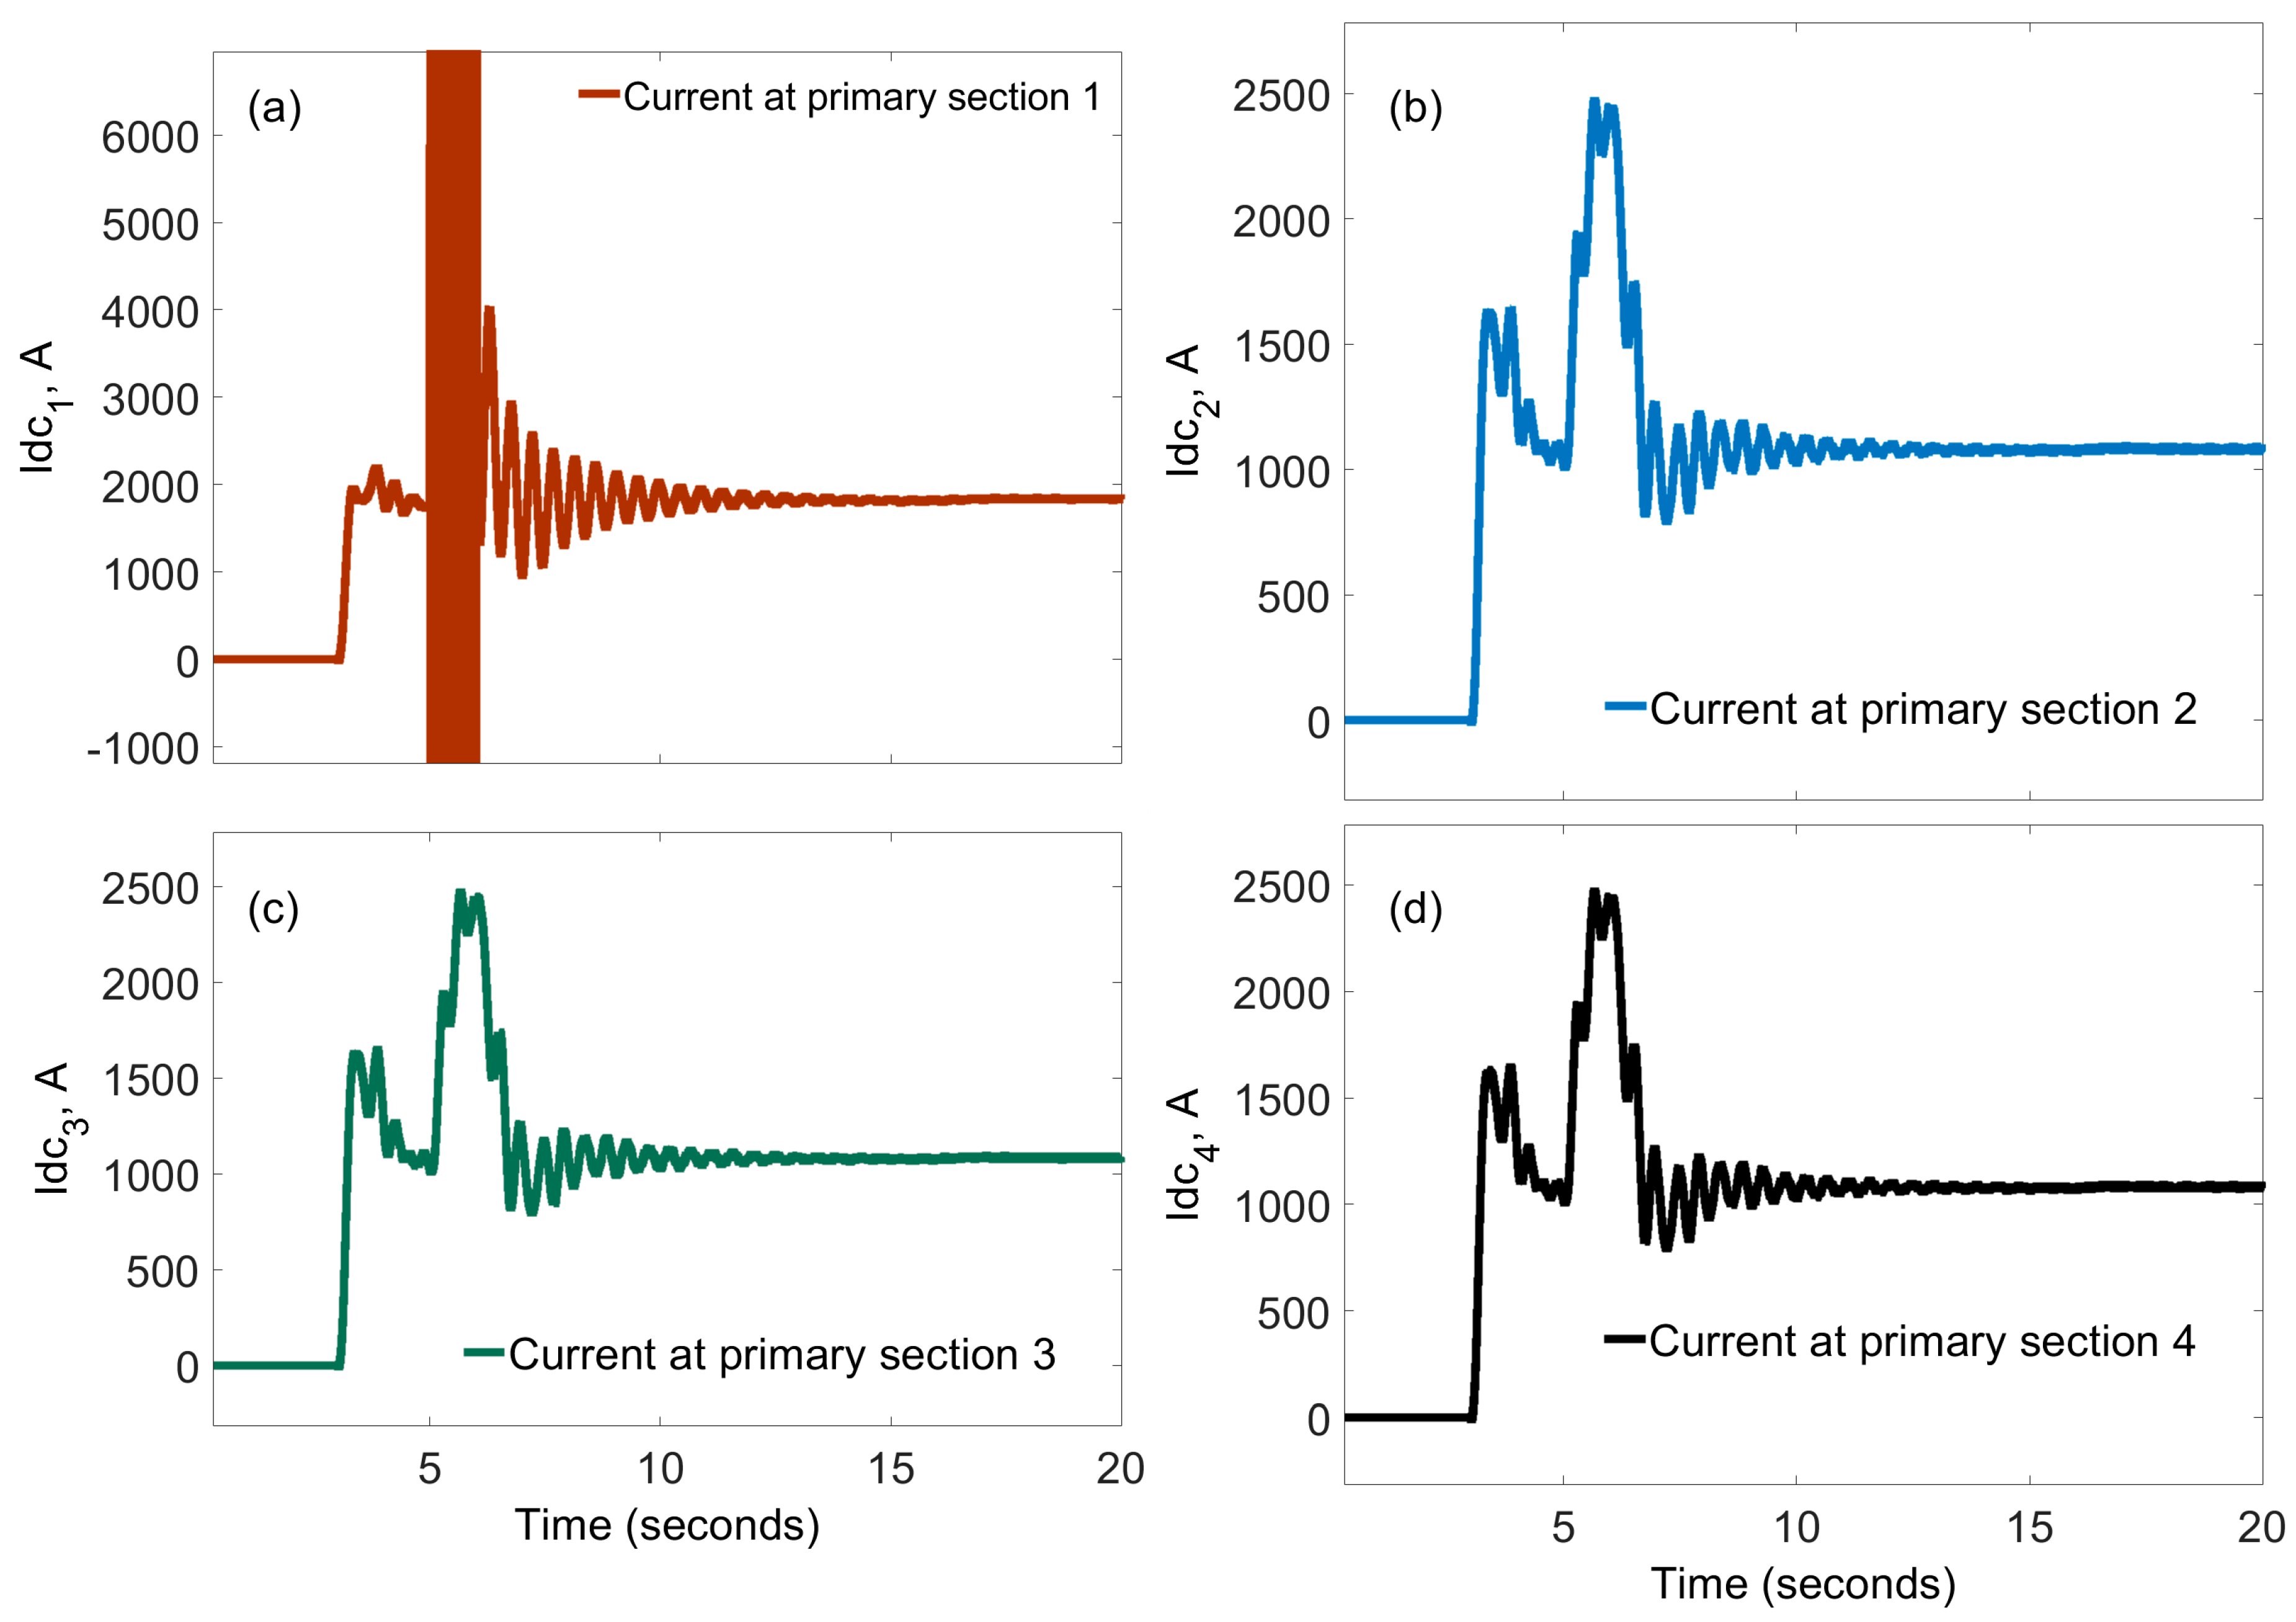
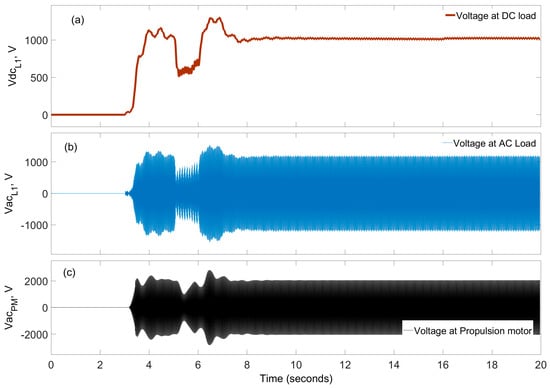
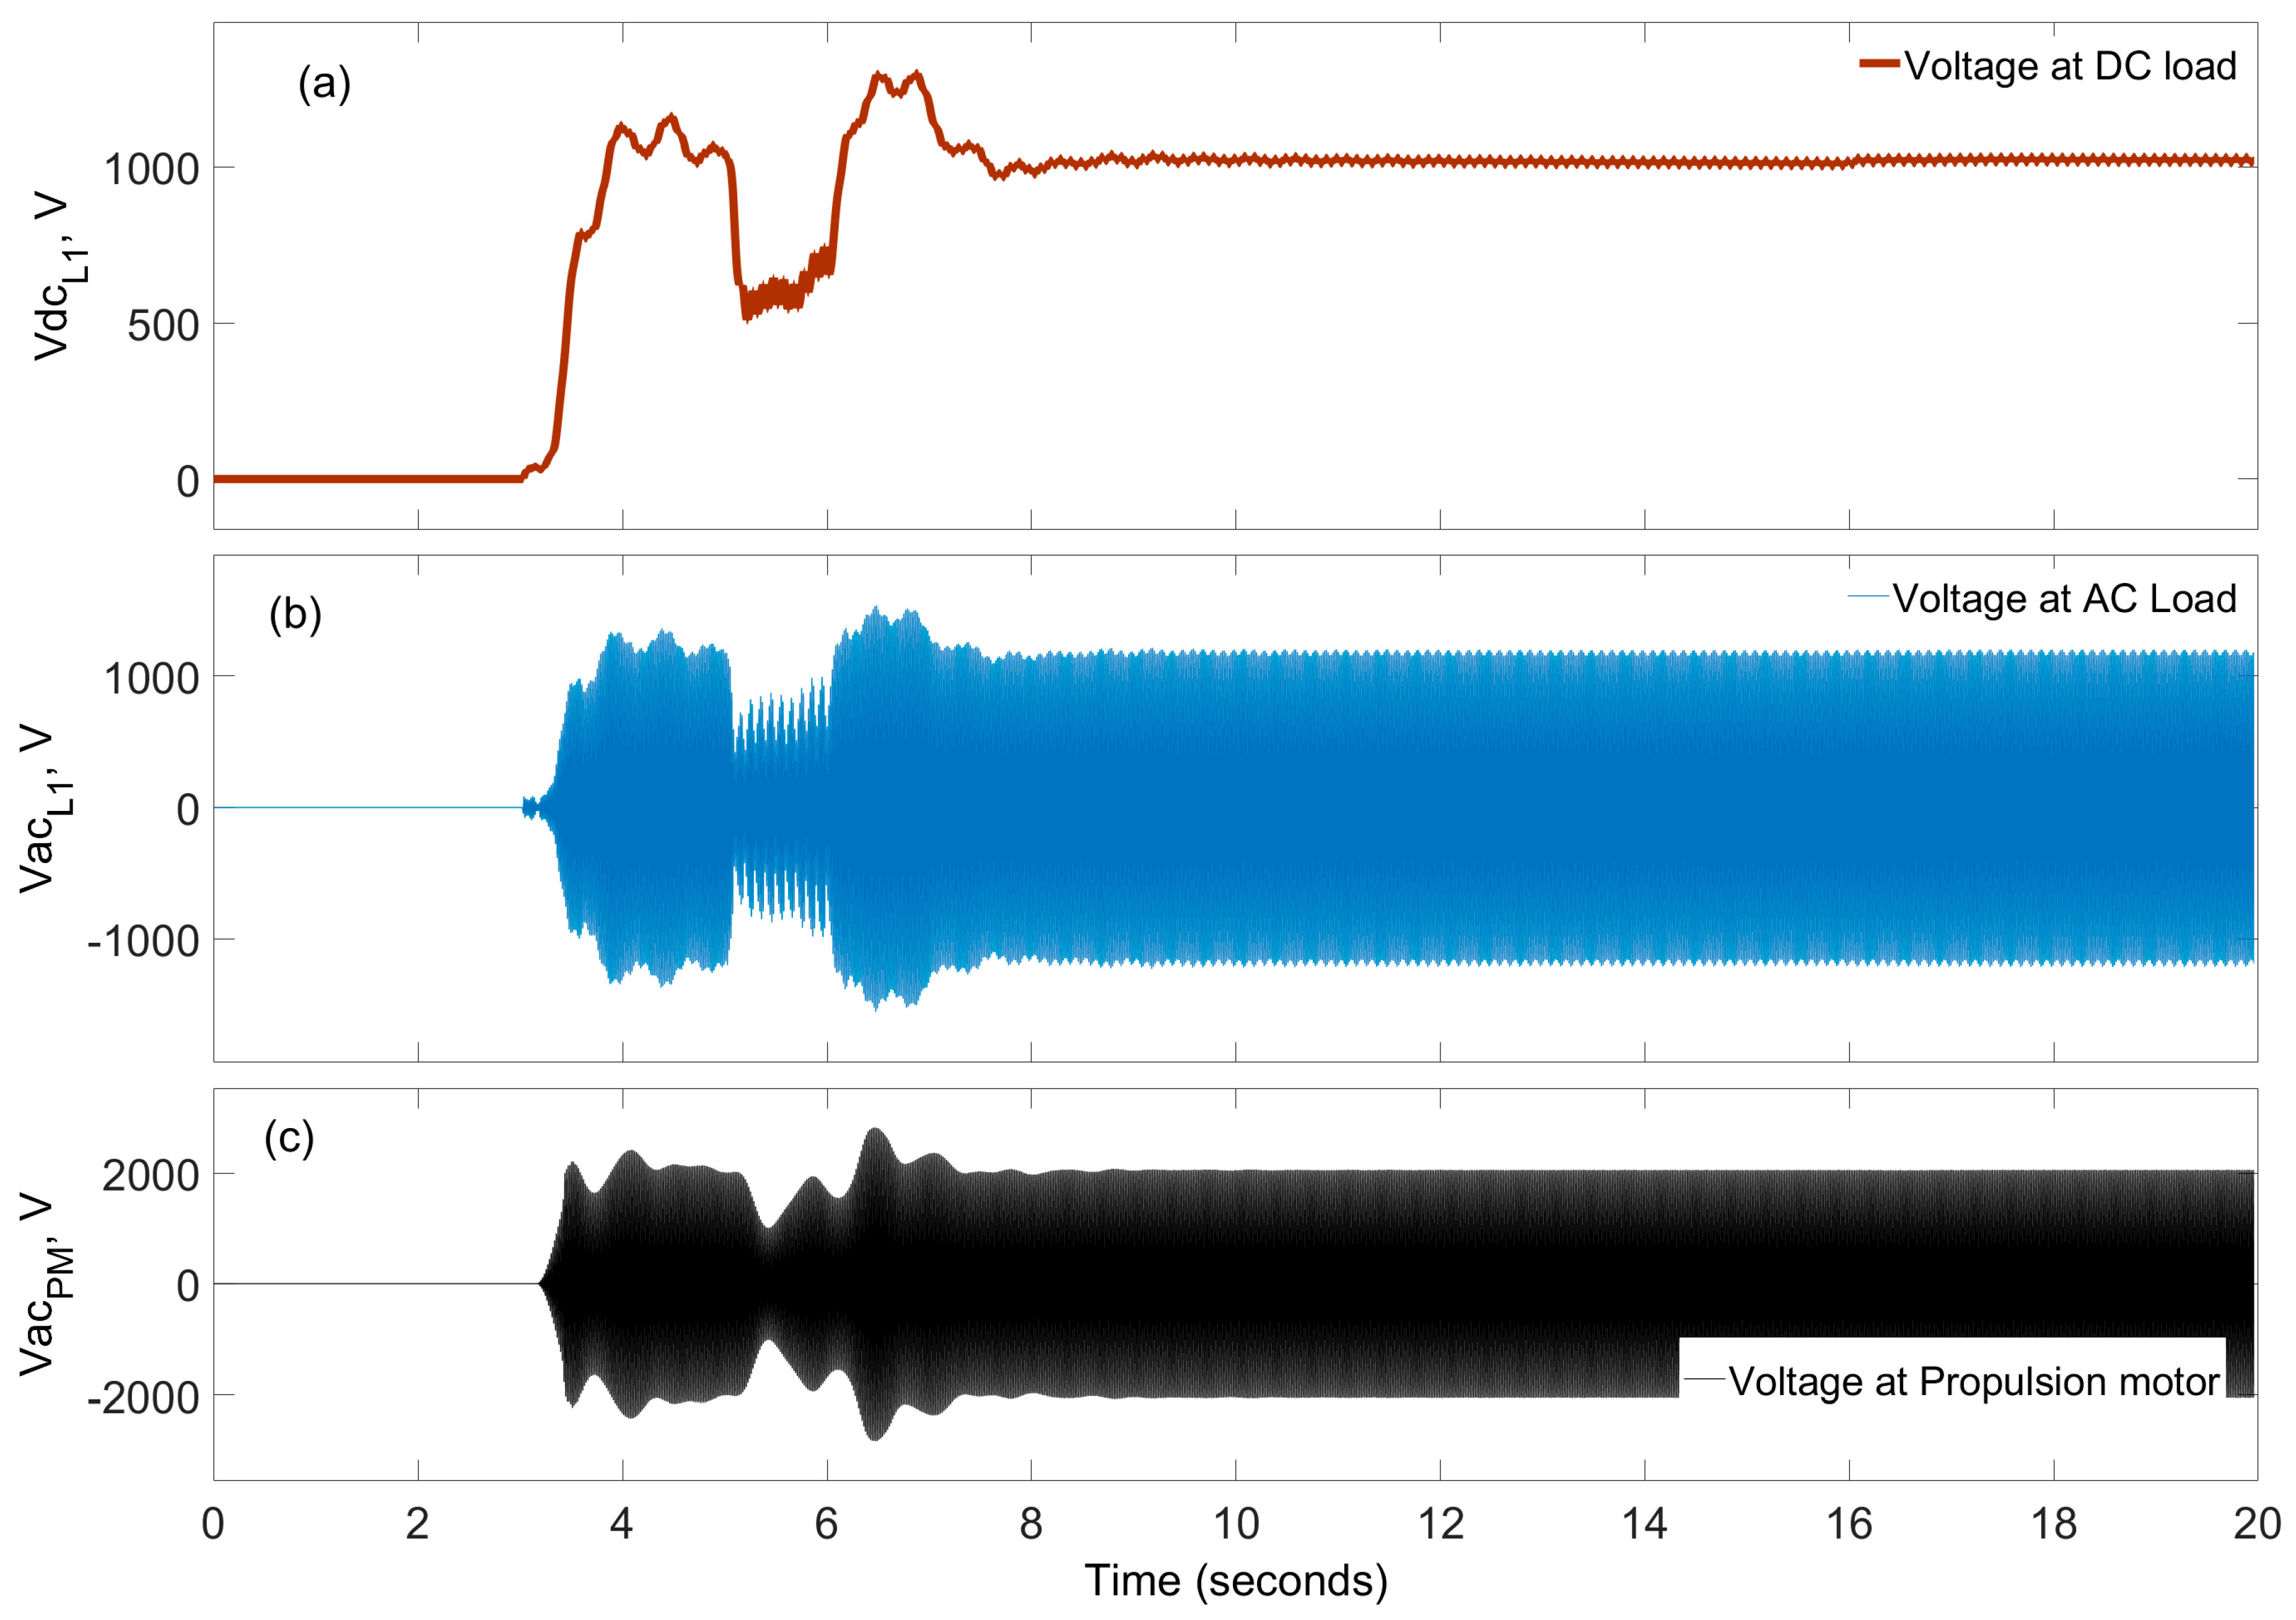
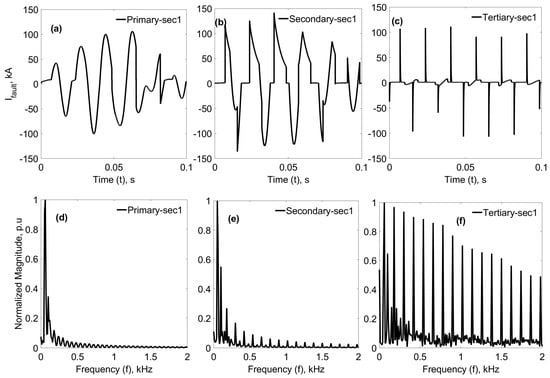
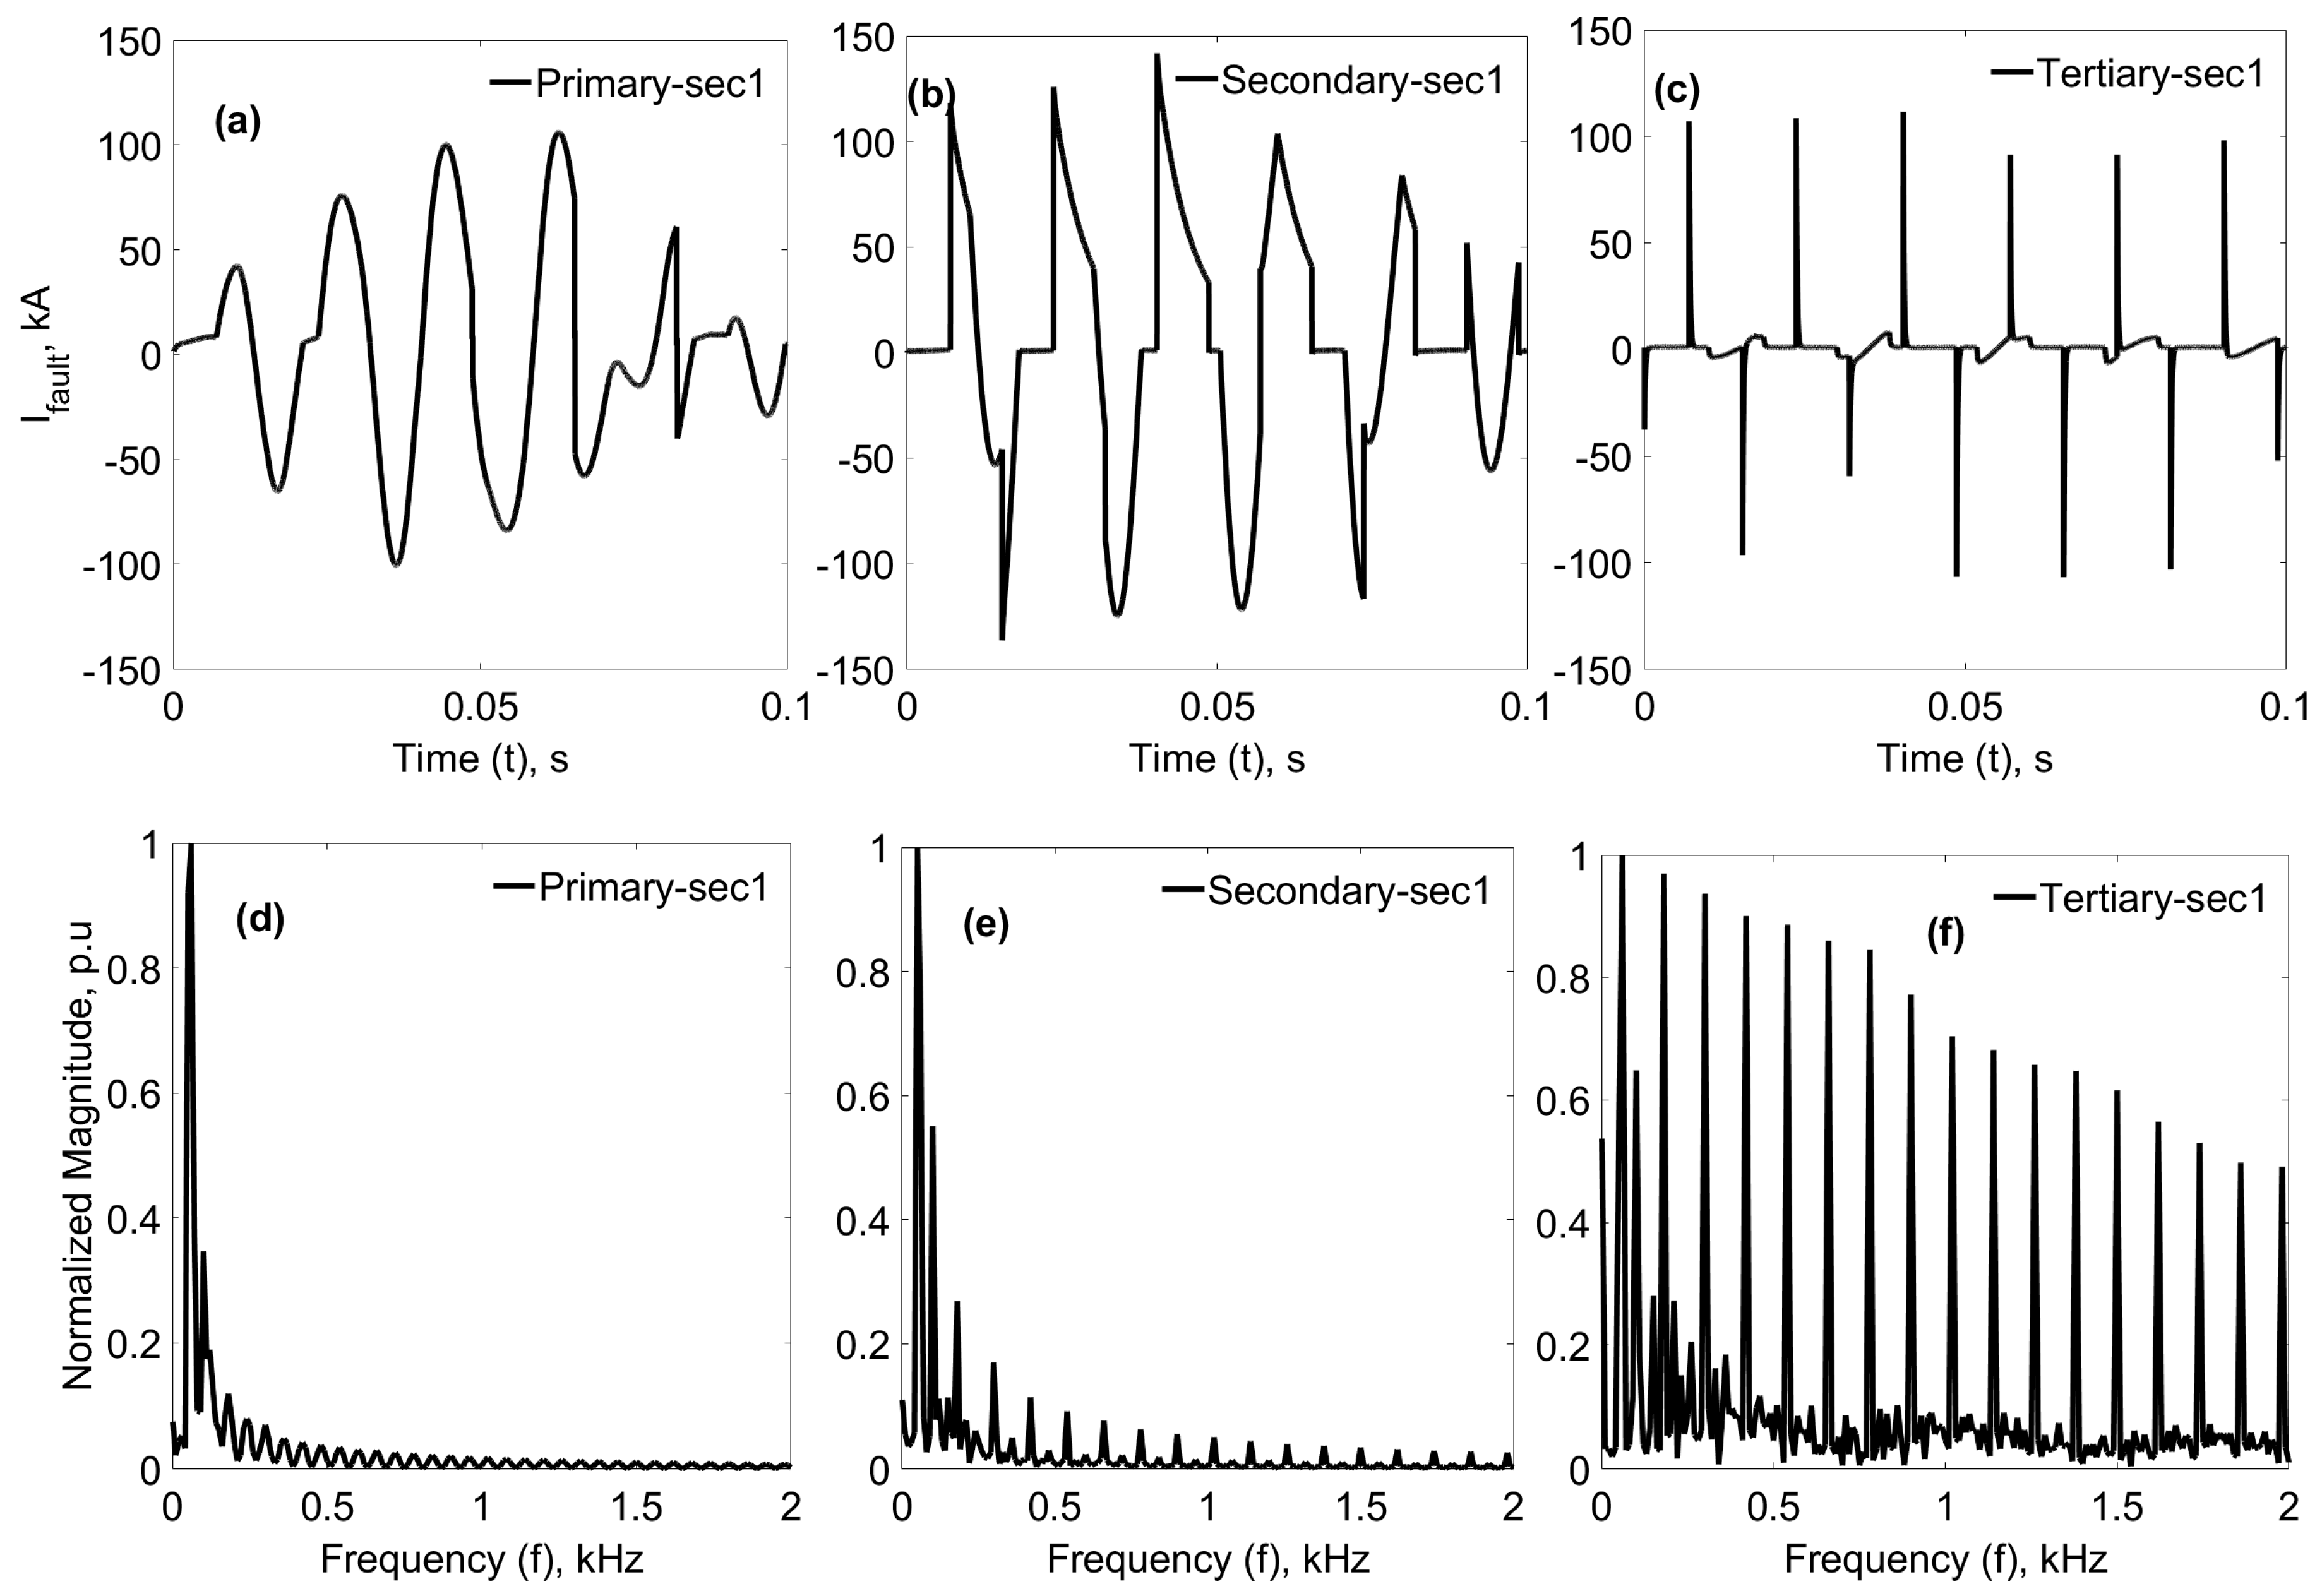

Disclaimer/Publisher’s Note: The statements, opinions and data contained in all publications are solely those of the individual author(s) and contributor(s) and not of MDPI and/or the editor(s). MDPI and/or the editor(s) disclaim responsibility for any injury to people or property resulting from any ideas, methods, instructions or products referred to in the content. |
© 2026 by the authors. Licensee MDPI, Basel, Switzerland. This article is an open access article distributed under the terms and conditions of the Creative Commons Attribution (CC BY) license.