


Abstract
Non-destructive cutting (NDC) is promising for fabricating high-efficiency half-cut solar cells by minimizing thermal and mechanical damage during cell cutting. Here, a dual-laser NDC process, comprising an infrared (IR) laser for pre-cut formation and a thermal laser for crack propagation, was applied to hybrid passivated back contact solar cells. Accordingly, the effects of scan speed, IR laser-induced pre-cut depth, and thermal laser power were systematically investigated at scan speeds of 300, 400, and 500 mm/s. Furthermore, stable process windows for cleaving were identified, within which fill factor and maximum power were evaluated. Despite differences in absolute laser power and scan speed, the highest electrical performance was consistently achieved at an intermediate pre-cut depth combined with the maximum thermal laser power available within each process window. To elucidate this behavior, a crack-driving index (ψ) was introduced to consider the coupled effects of thermal driving and crack guidance. The ψ-based analysis reveals that higher scan speeds enhance process sensitivity, highlighting a trade-off between peak performance and process robustness.
1. Introduction
The sustained demand for higher photovoltaic (PV) module efficiency has driven the development of advanced crystalline silicon solar cell architectures, including passivated contact and back-contact designs. Among these, hybrid passivated back contact (HPBC) solar cells have garnered significant attention owing to their elimination of front-side metallization, minimized optical shading, and enhanced carrier collection efficiency, which enables conversion efficiencies that approach industrial state-of-the-art (SoTA) limits [1,2].
To further improve reliability at the module level, half-cut cell technology has become prevalent. By dividing a full-size cell into two parallel sub-cells, half-cut architectures reduce operating current, thereby minimizing resistive losses and mitigating thermal stress [3,4]. Consequently, half-cut designs have become a standard configuration in high-efficiency industrial PV modules. Nevertheless, the cell cutting process required to fabricate half-cut cells remains a critical challenge, particularly for advanced back-contact architectures. In HPBC solar cells, all current collection occurs through finely patterned rear-side electrodes, where interdigitated n- and p-type contacts are densely arranged near the cell surface. This structural characteristic makes HPBC cells inherently more sensitive to edge-related damage, because any disturbance to the rear-side metallization, passivated contact layers, or near-edge silicon integrity can directly increase series resistance and degrade fill factor (FF).
In half-cut fabrication, laser scribing is commonly employed due to their high throughput and compatibility with industrial production lines [5,6,7]. However, these approaches typically rely on localized material ablation and mechanical force-driven fracture, which can introduce heat-affected zones, microcracks, and recast layers near the cut edge. Such damage is particularly detrimental for HPBC cells, where electrically active rear-side structures extend close to the cutting line. Laser-induced defects and subsurface cracks can act as recombination centers or increase contact resistance, causing irreversible electrical degradation and long-term reliability concerns [8,9].
To address these limitations, non-destructive cutting (NDC) has recently been proposed as an alternative laser-based cutting strategy for brittle materials like crystalline silicon solar cells [10,11]. Unlike conventional scribing processes, NDC attempts to separate the substrate via controlled, stress-driven crack propagation rather than material removal. By intentionally operating below the ablation threshold, thermal energy is primarily utilized to generate a tensile thermal stress field that drives crack propagation along a predefined path, thereby minimizing direct laser-induced damage to the active cell area.
A key NDC feature is the decoupling of crack initiation and propagation mechanisms [10,11]. In a dual-laser NDC scheme, an infrared (IR) laser is first applied to form a shallow pre-cut that defines the crack initiation site and propagation path [7,8], while a subsequent thermal laser scan provides the thermal driving force required for stable crack extension [11,12,13]. This separation of functions enables improved control over fracture behavior and minimizes sensitivity to mechanical perturbations [1,2,5], making NDC particularly attractive for cutting high-efficiency back-contact solar cells.
Previous studies on laser-based cutting and NDC have primarily focused on the independent effects of individual process parameters like laser power, scan speed, or pulse characteristics [7,11,14]. However, experimental observations frequently reveal non-monotonic trends and recurring optimal conditions that cannot be explained by single-parameter analysis alone. In particular, the existence of stable cutting windows and the persistence of similar optimal conditions across different scan speeds suggest that NDC is driven by a coupled balance between thermal driving and crack guidance, rather than by absolute laser power or interaction time.
Here, we systematically investigate the NDC of HPBC solar cells utilizing a dual-laser NDC process under controlled scan speed conditions of 300, 400, and 500 mm/s [10,11,12,15,16]. Accordingly, stable process windows are identified, and the resulting electrical performance of half-cut cells is evaluated relative to FF and maximum power (Pmax) [3,4,5,17,18]. To interpret the observed trends across different operating regimes, a crack-driving index (ψ) is introduced as an experimentally accessible descriptor that integrates the effects of thermal laser power, scan speed, and IR-induced pre-cut depth. By reformulating the cutting conditions relative to ψ, this study provides a structured framework for understanding process sensitivity, robustness, and optimization in the NDC-based fabrication of high-efficiency half-cut HPBC solar cells [16,19,20,21].
2. Materials and Methods
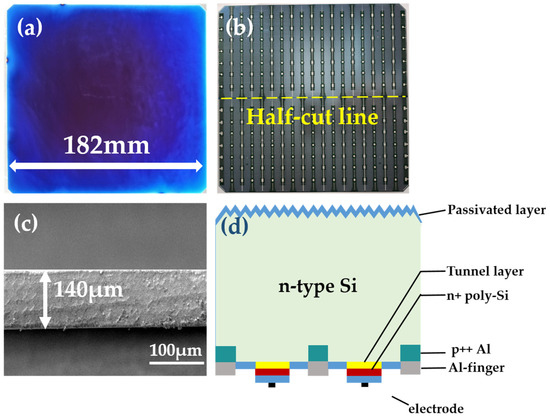
Commercially available M10-sized HPBC solar cells (182 mm side length; ~140-μm thickness) were employed in this study, with structural details provided in Figure 1a,b. Furthermore, the scheme’s illustration and corresponding real cross section of the HPBC cell are presented in Figure 1c,d. Cell cutting was performed using an NDC system (SL5-Shingled, Ooitech, Wuhan, China) equipped with two laser sources: an IR laser (YDLFP-E-50-LP-L-R, JPT Ltd., Shenzhen, China) and a thermal fiber laser (EB-DDLM-500A, Everbright Ltd., Beijing, China), following laser-based thermal cleavage concepts reported for brittle materials and silicon substrates [10,11,12,15,16].
Figure 1.
HPBC solar cell adopted in this study: (a) real pictures of front and (b) rear side of full-size cell, (c) cross-section of HPBC cell (~140 μm), and (d) schemes of HPBC.
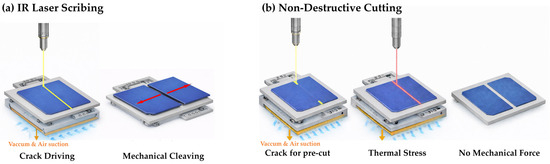
The two types of cutting procedure employed in this study are described in Figure 2. In both, vacuum and air suction are used to fix the HPBC cell in place without any other clamping. As illustrated in Figure 2a, an IR laser is first irradiated along the HPBC cell’s half-cut line to initiate crack formation, after which the cell is cleaved by applying a mechanical force. In contrast, the NDC process comprises sequential steps in Figure 2b. First, the IR laser was utilized to form shallow pre-cuts at the start and end points of the cutting line, which results in a total length of 2.0 cm, defining the crack initiation sites and guiding the subsequent crack propagation path [10,11,15]. Subsequently, the thermal laser was scanned along the central 16.2 cm region of the cell to induce controlled crack propagation along the predefined pre-cut path, thus completing cell separation [11,12,16]. This two-step cutting strategy enables stable cleaving by independently defining crack initiation and crack propagation.
Figure 2.
(a) Process flow of the conventional IR laser scribing and mechanical breaking method. The red arrows indicate the cleaving direction after laser-assisted crack initiation. (b) Process flow of the NDC method.
The IR laser frequency and pulse width were fixed at 140 kHz and 200 ns, respectively. The thermal laser was operated as a fiber-based continuous-wave laser with a 976 nm center wavelength and 10 ns fixed pulse width. In addition, scan speeds of 300, 400, and 500 mm/s were investigated. For each scan speed, the IR and thermal laser powers were varied at three levels each, resulting in nine experimental conditions per scan speed and a total of 27 stable cutting conditions. Processing conditions that resulted in incomplete cutting or excessive thermal damage were classified as unstable, excluded from the defined process window, and omitted from further analysis [15,16,19,20,21].
The IR-induced pre-cut depth was measured from cross-sectional images and expressed as a percentage of the total cell thickness (Figure 1). Electrical characteristics of the half-cut cells were evaluated using standard current–voltage (I–V) measurements obtained with a solar simulator (XHS-4040B300KPV1, Seric Ltd., Koshigaya, Japan) under standard test conditions (STC), which correspond to a 1000 W·m−2 irradiance, 25-°C cell temperature, and an AM 1.5 G spectral distribution [14,22,23,24]. In addition, selected samples were examined via scanning electron microscopy (SNE-4500M, SEC Co., Ltd., Suwon, Republic of Korea) to qualitatively assess the uniformity and quality of the cut surfaces.
To elucidate the experimental results, a crack-driving index, ψ, was defined. This index was introduced as an interpretive metric for the quantitative comparison and trend analysis of the experimental result. However, it was not intended as a predictive model for electrical performance. The physical meaning and role of ψ are comprehensively discussed in Section 3.
3. Results and Discussion
To clarify the cutting behavior and process characteristics of the proposed NDC approach, the experimental results are first presented and compared with the conventional cutting process.
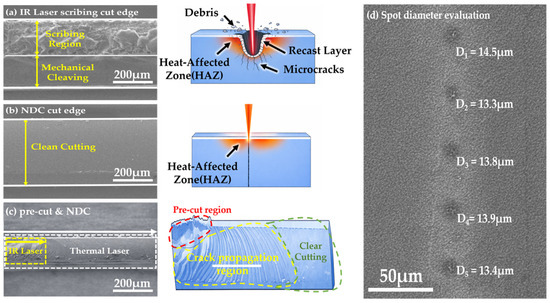
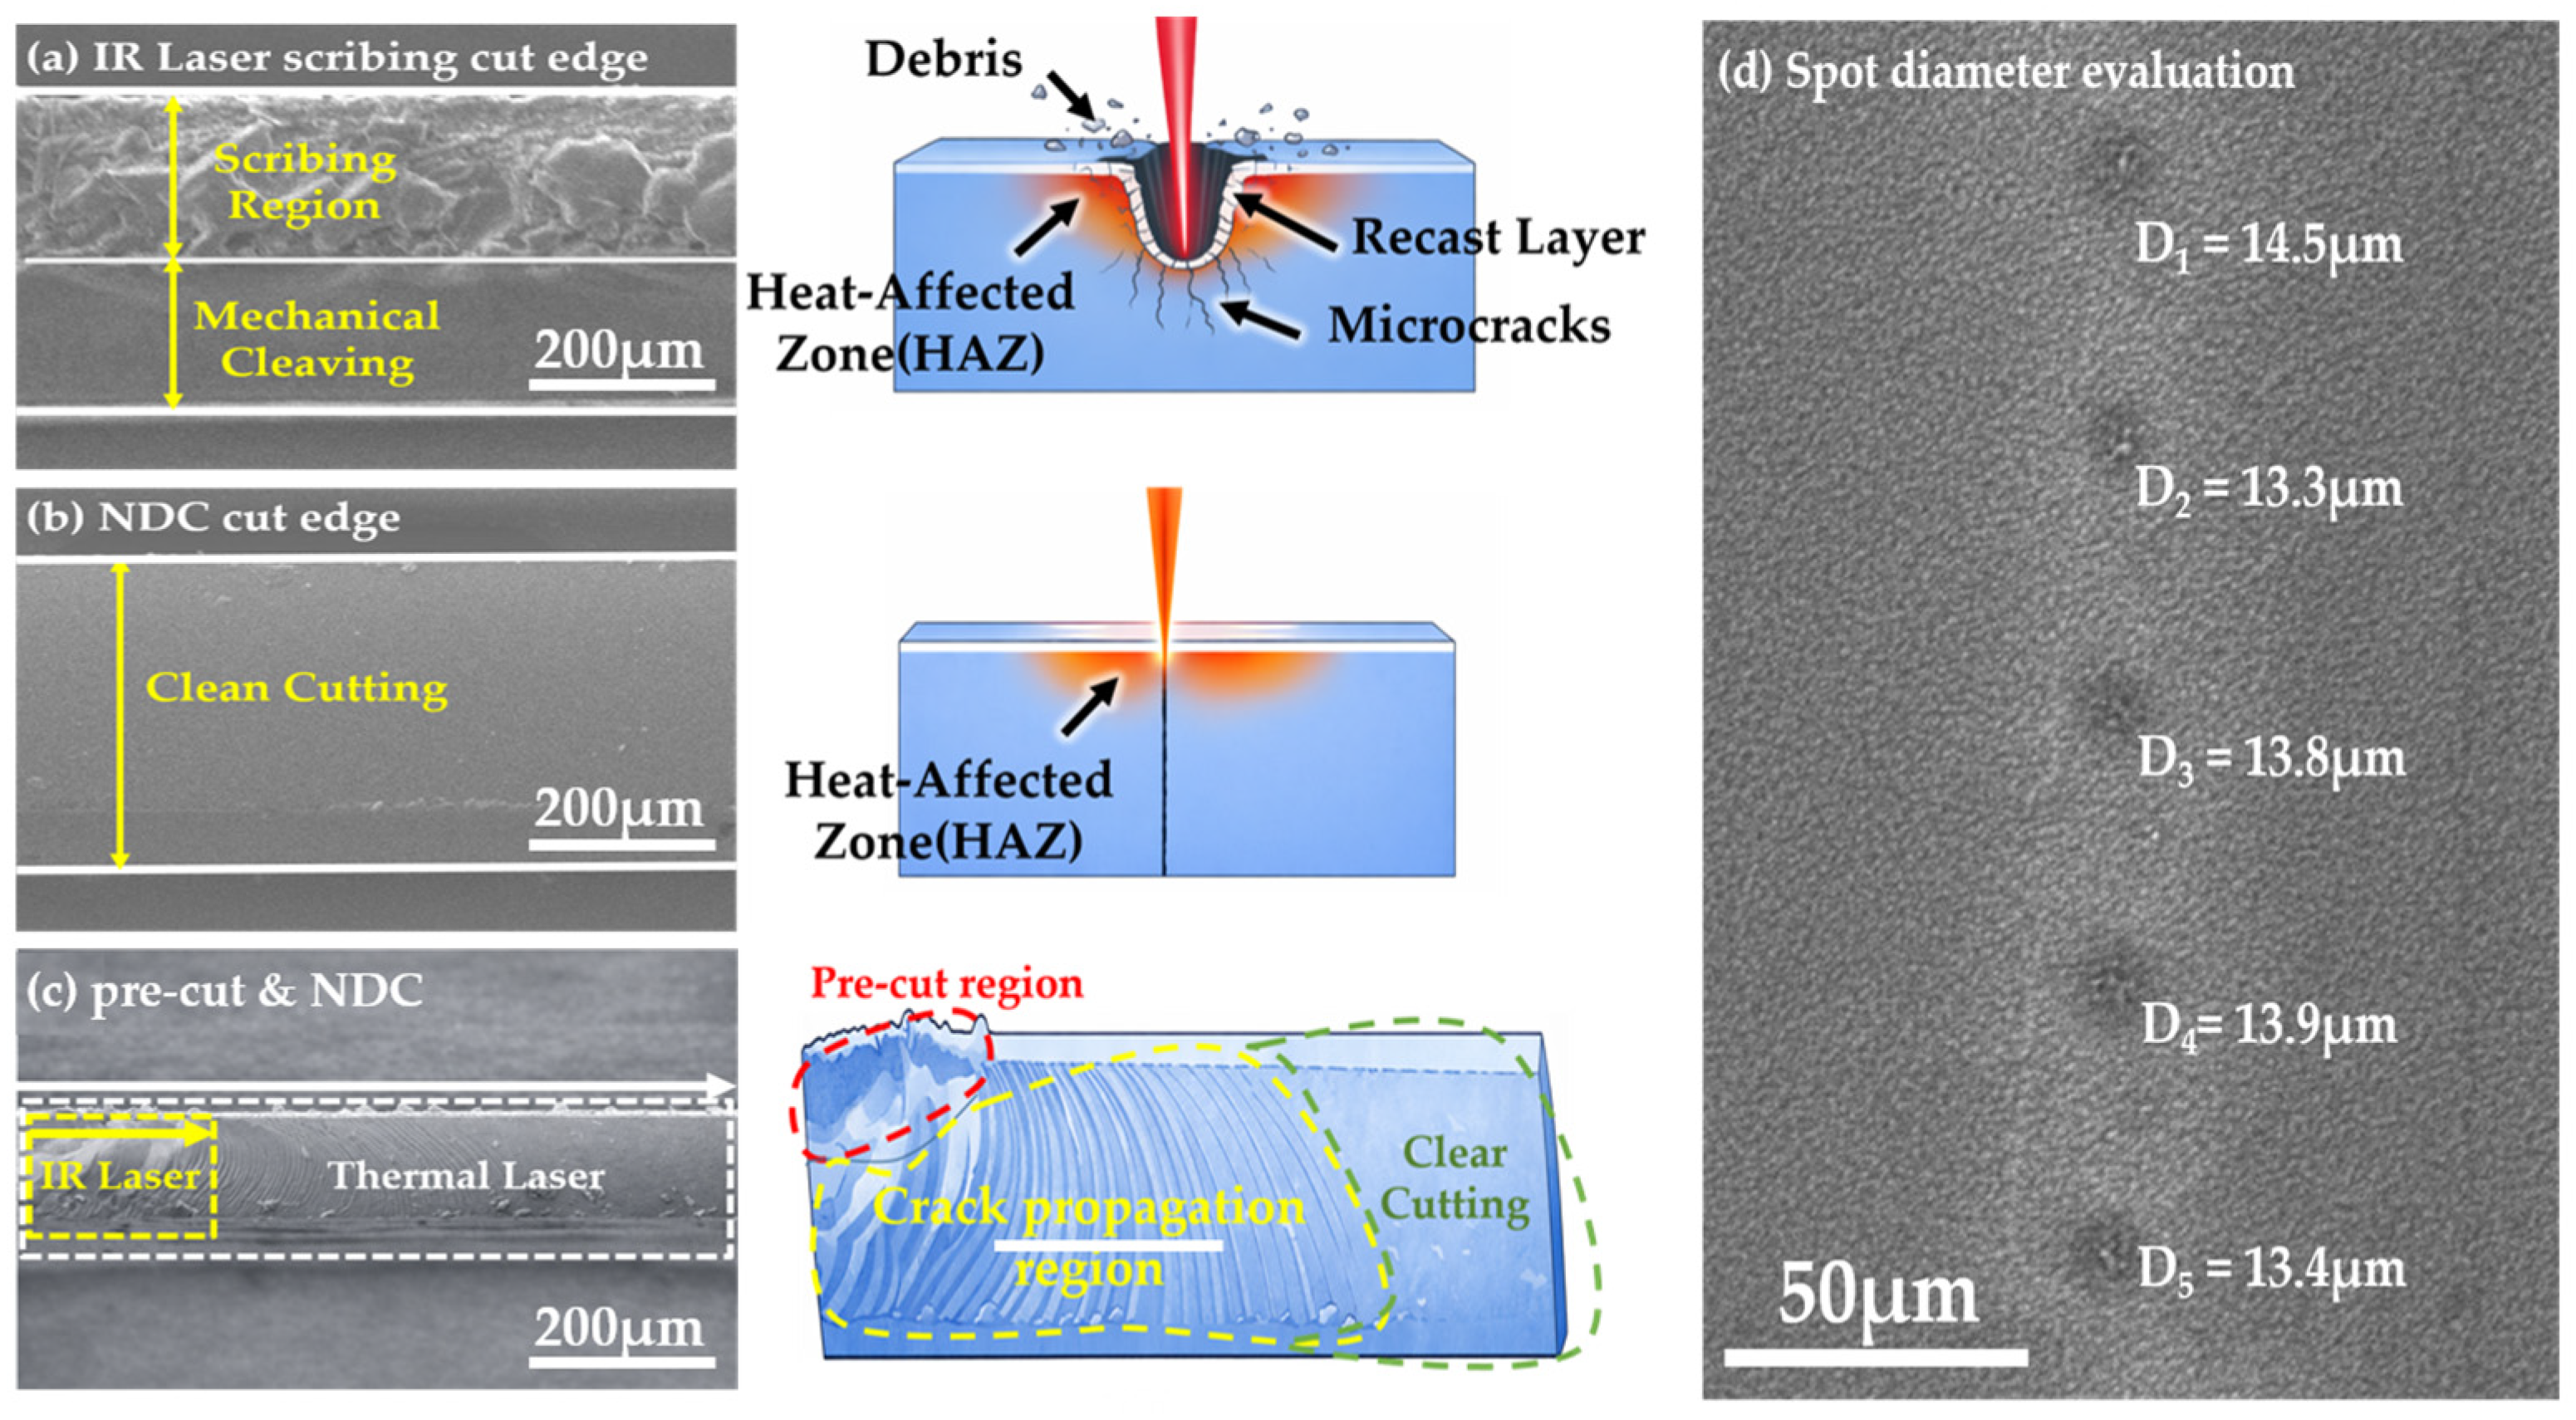
Figure 3a illustrates the conventional process, where IR laser scribing is applied along the cutting line and subsequently followed by mechanical cleaving, a process that often leads to defect formation like debris and microcracks [5,8,9,21]. In contrast, Figure 3b presents a clean cutting morphology obtained under optimized cutting conditions, exhibiting a smooth and uniform cleaved edge without visible debris or heat-affected damage. Figure 3c presents a cross-section of the full NDC process, highlighting the IR laser pre-cut region and the subsequent crack propagation driven by the thermal laser, which enables controlled cleaving along the intended cutting path. In addition, to classify consistent laser–material interactions, the laser spot size at the wafer plane was verified using a burn-mark method under near-threshold conditions. For this measurement, the IR laser was operated at a repetition rate and an output power of 10 kHz and 5 W, respectively. Under these conditions, the resulting burn-mark diameter (D) was measured to be approximately 13.3–14.5 μm in Figure 3d.
Figure 3.
Cross-section and damage induced morphology: (a) conventional IR laser scribing, (b) cleanly cut edge by NDC method. (c) Full NDC process; (d) shows SEM image for laser spot diameter evaluation.
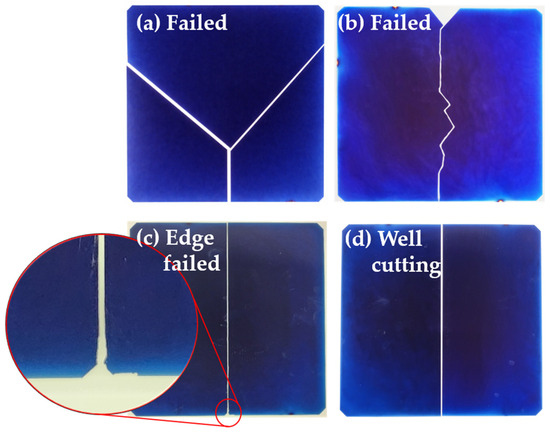
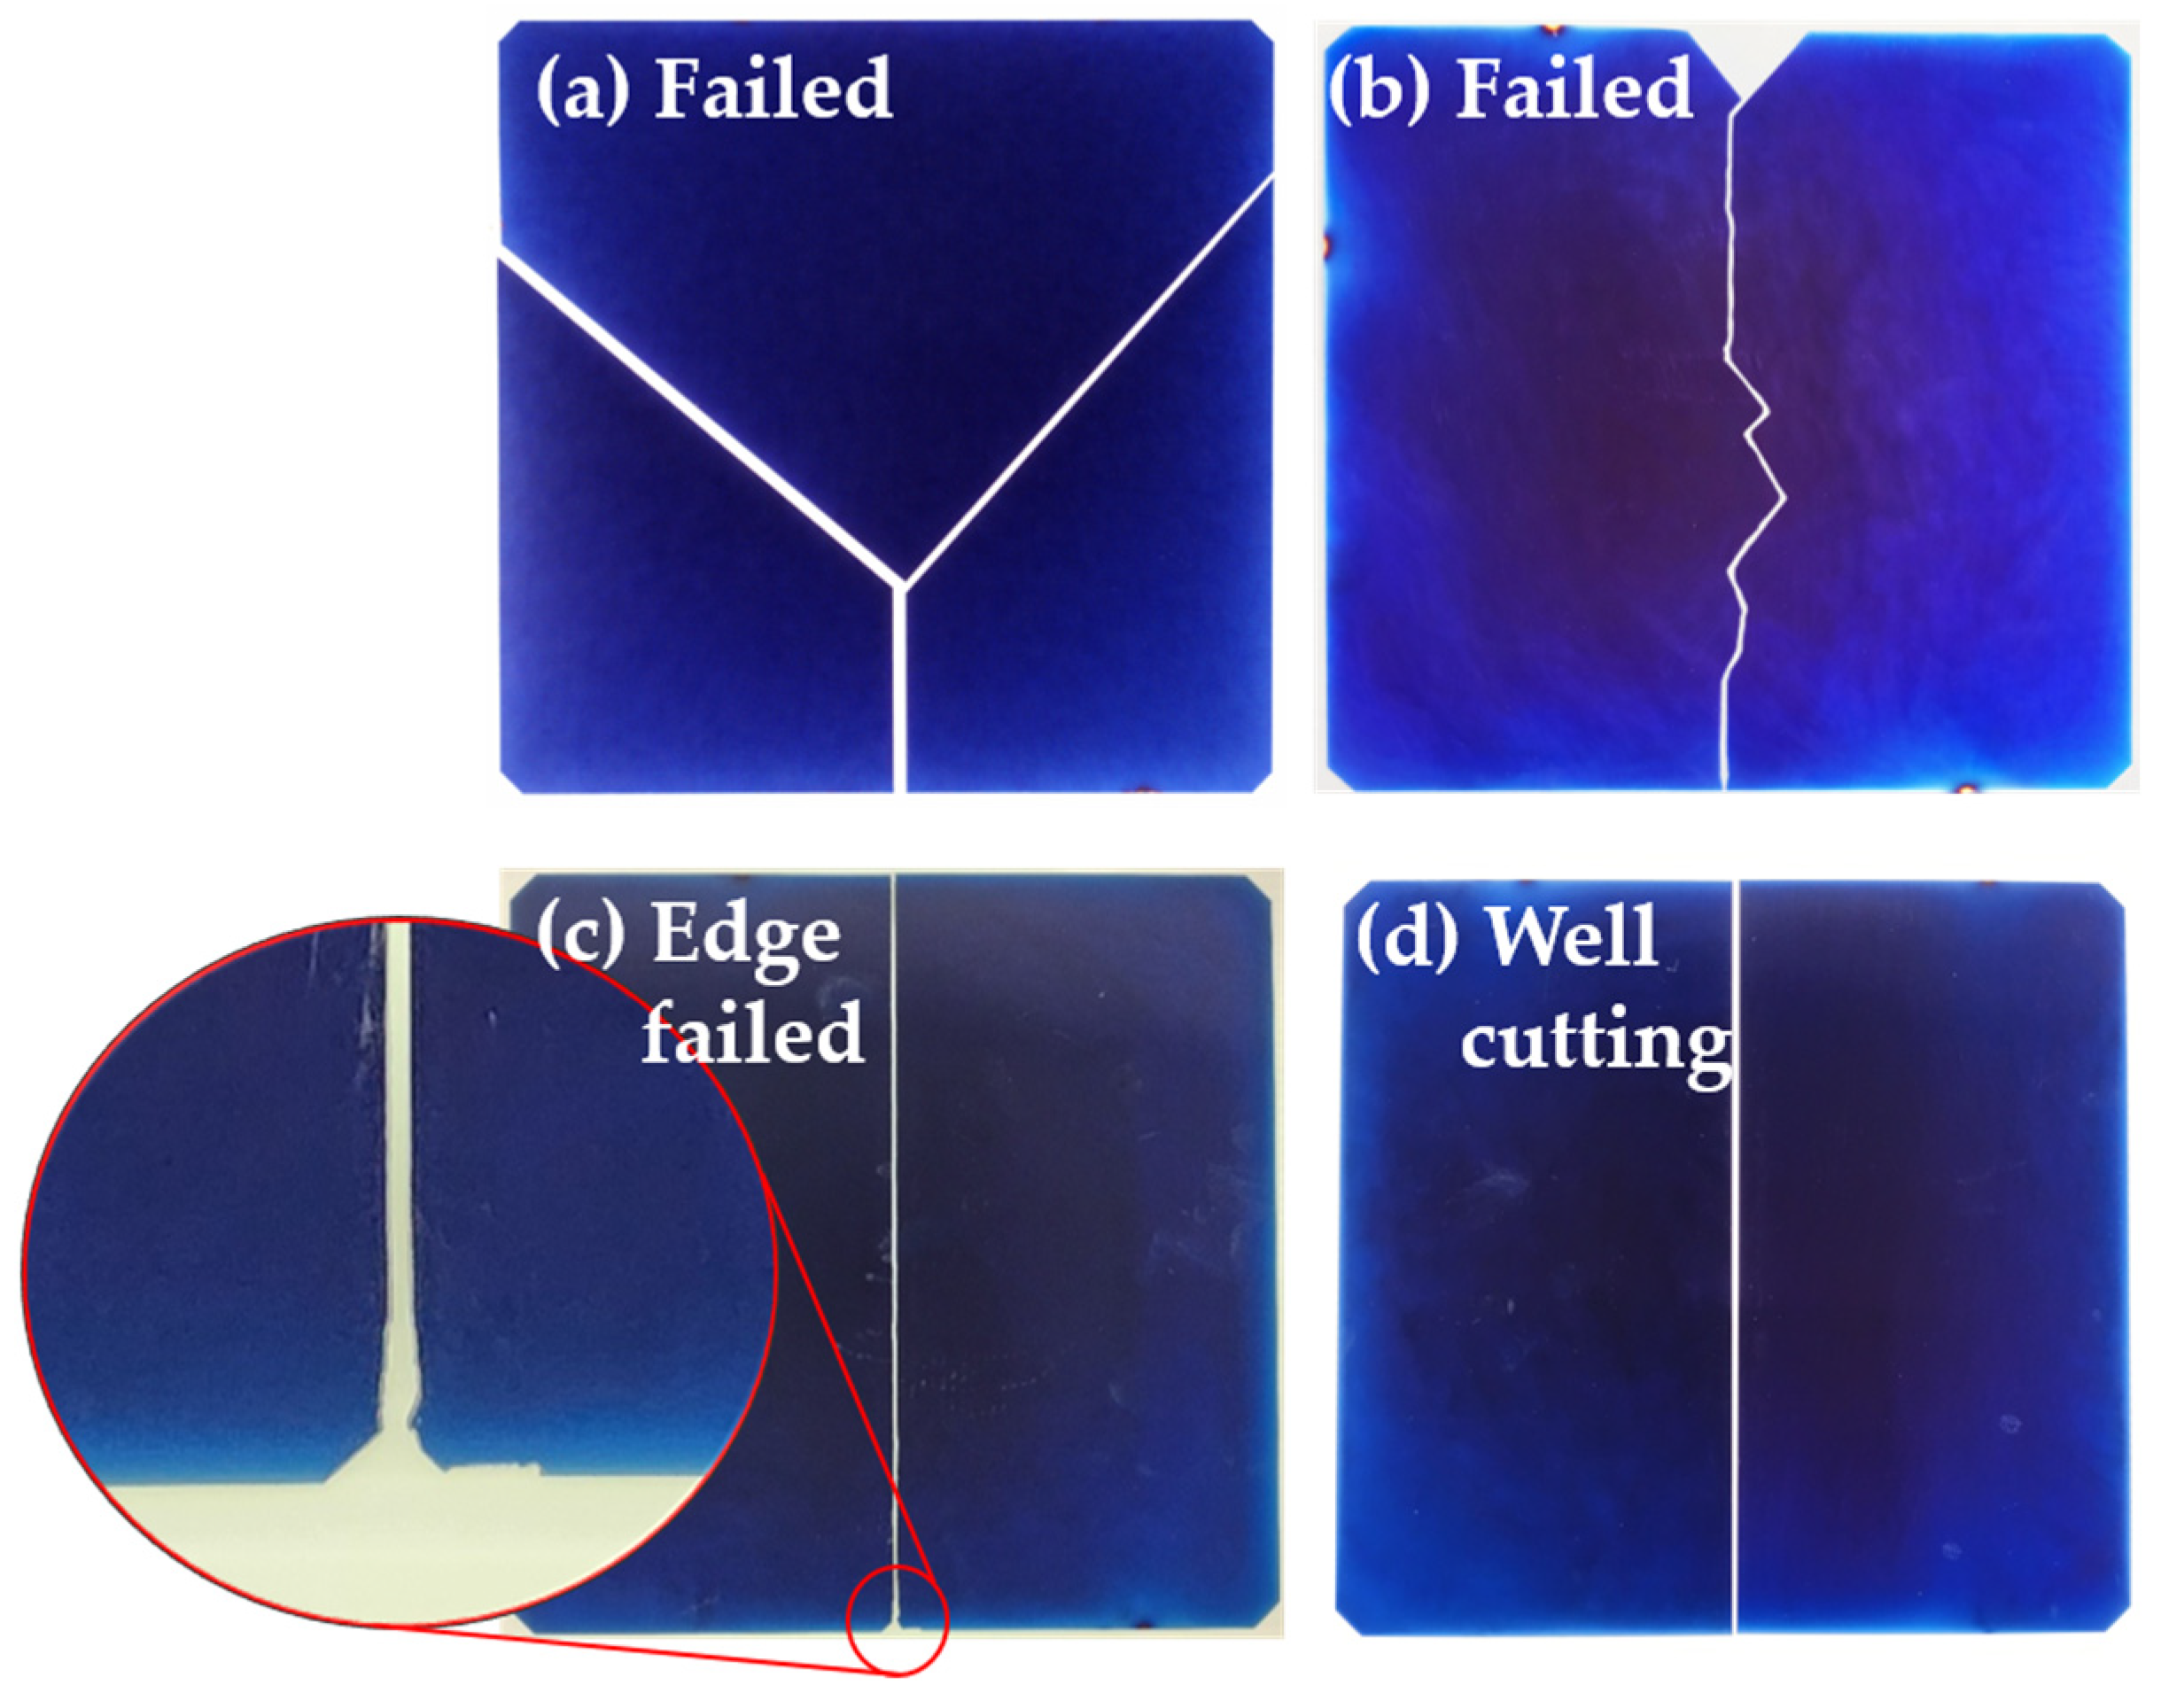
Prior to evaluating the electrical performance of half-cut HPBC solar cells, it is necessary to identify the processing conditions that yield stable and reproducible NDC behavior. Accordingly, a process window was required to ensure reliable processing, and as a supporting criterion, visually observable macroscopic defects were classified (Figure 4). Although a broad range of processing parameters was investigated, not all conditions resulted in reliable cleaving or facilitated substantial electrical characterization. For example, Figure 4a,b present clusters classified as failed cutting, primarily resulting from insufficient IR and thermal laser irradiation at the specified scan speed. In contrast, the edge-failed cutting observed in Figure 4c is mainly attributed to excessive IR laser power, which can cause damage along the pre-cut path.
Figure 4.
Illustration of phenomena occurring during NDC process. (a,b) Failed cutting, (c) edge failed cutting, and (d) optimal cutting conditions.
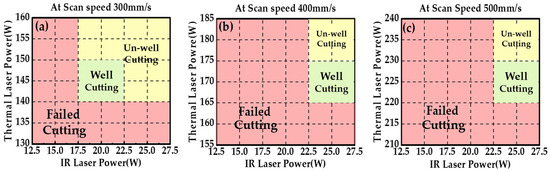
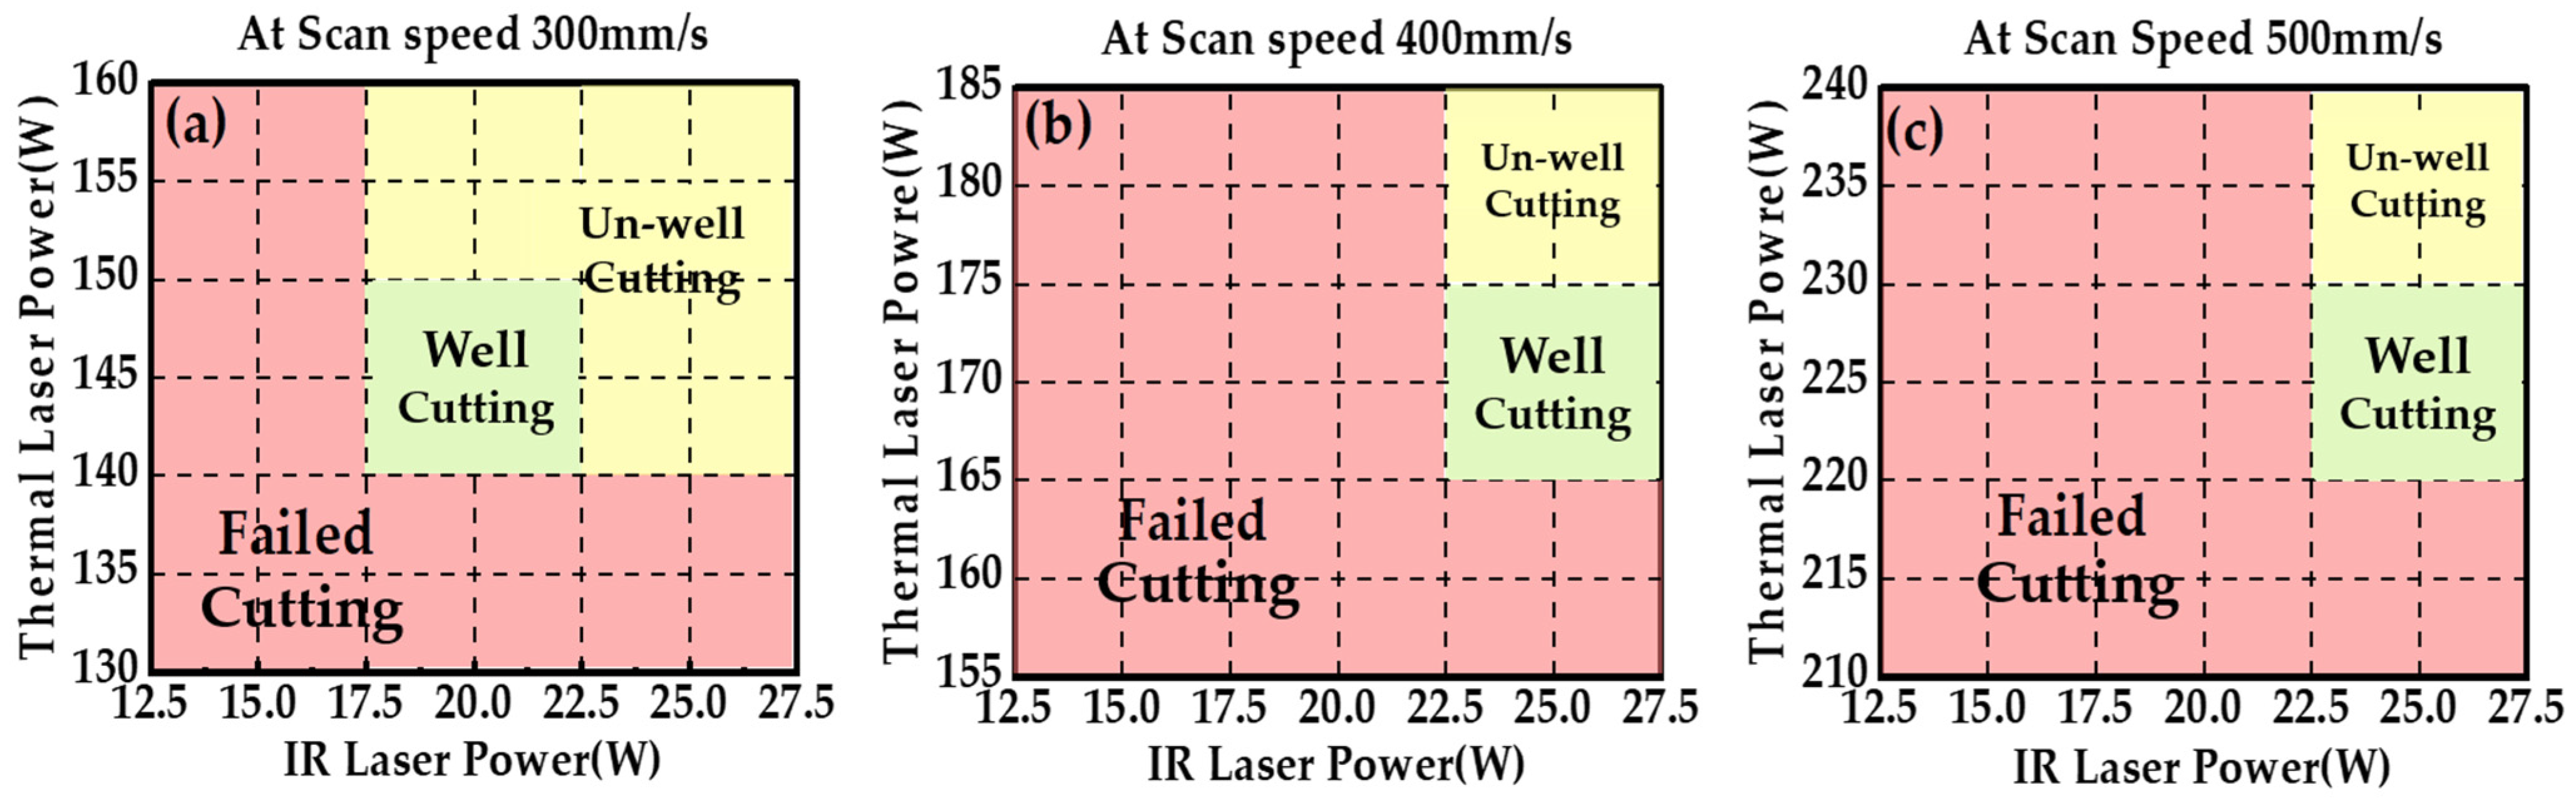
Accordingly, process windows were developed for each scan speed in Figure 5. To elucidate each processing condition, cutting trials were conducted under identical parameters to assess reproducibility. Representative conditions were repeated 50–55 times per condition, resulting in operational yields of approximately 70–80%, depending on scan speed. Successful samples were defined by complete separation along the intended cutting path, the absence of visible macroscopic defects, and the feasibility of reliable I–V characterization.
Figure 5.
Process windows in adopted scan speeds: (a) 300 mm/s, (b) 400 mm/s, (c) 500 mm/s.
Stable conditions were defined as those that consistently produced complete cleaving and reproducible electrical characteristics across repeated trials. Within these stable regimes, the extracted electrical parameters exhibited limited statistical dispersion (±0.374–±0.610 in FF and ±0.064–±0.130 in Pmax) verifying that the observed performance trends are not dominated by random experimental scatter. In contrast, unstable conditions were characterized by incomplete cleaving, excessive thermal damage, or inconsistent electrical behavior. Accordingly, a stable process window for NDC operation was established.
Following the definition of the stable process window, the electrical characteristics of half-cut HPBC solar cells evaluated under stable NDC conditions are summarized. For reference, a representative conventional IR laser scribing condition is included to provide a quantitative baseline for contextualizing the electrical performance achieved by the NDC process. The IR laser scribing condition was selected using a scribing depth approximately 45–48% of the wafer thickness, which is consistent with prevalent industrial practice in the half-cut fabrication of crystalline silicon solar cells.
It should be emphasized that the inclusion of the IR laser scribing result is not intended as a direct performance comparison or optimization study relative to NDC. Instead, IR laser scribing is included as a reference baseline to quantitatively demonstrate the electrical performance advantages enabled by the NDC process. Accordingly, Table 1 presents electrical performance data evaluated exclusively within the stable NDC process window, showing certain tendencies. Focusing exclusively on the NDC method, a consistent trend was observed across all scan speeds: the best electrical characteristics were obtained under conditions employing an intermediate pre-cut depth together with the maximum thermal laser power. For example, in the 400 mm/s condition, the best performances with 79.00% FF and 7.84 W Pmax were investigated. This behavior persisted despite substantial differences in absolute laser power and laser–material interaction time among the processing conditions, indicating the presence of a common governing mechanism across different regions of the process window.
Table 1.
Comparison of electrical characteristics between conventional IR laser scribing and NDC.
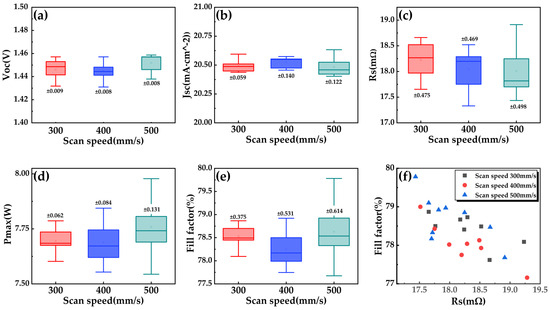
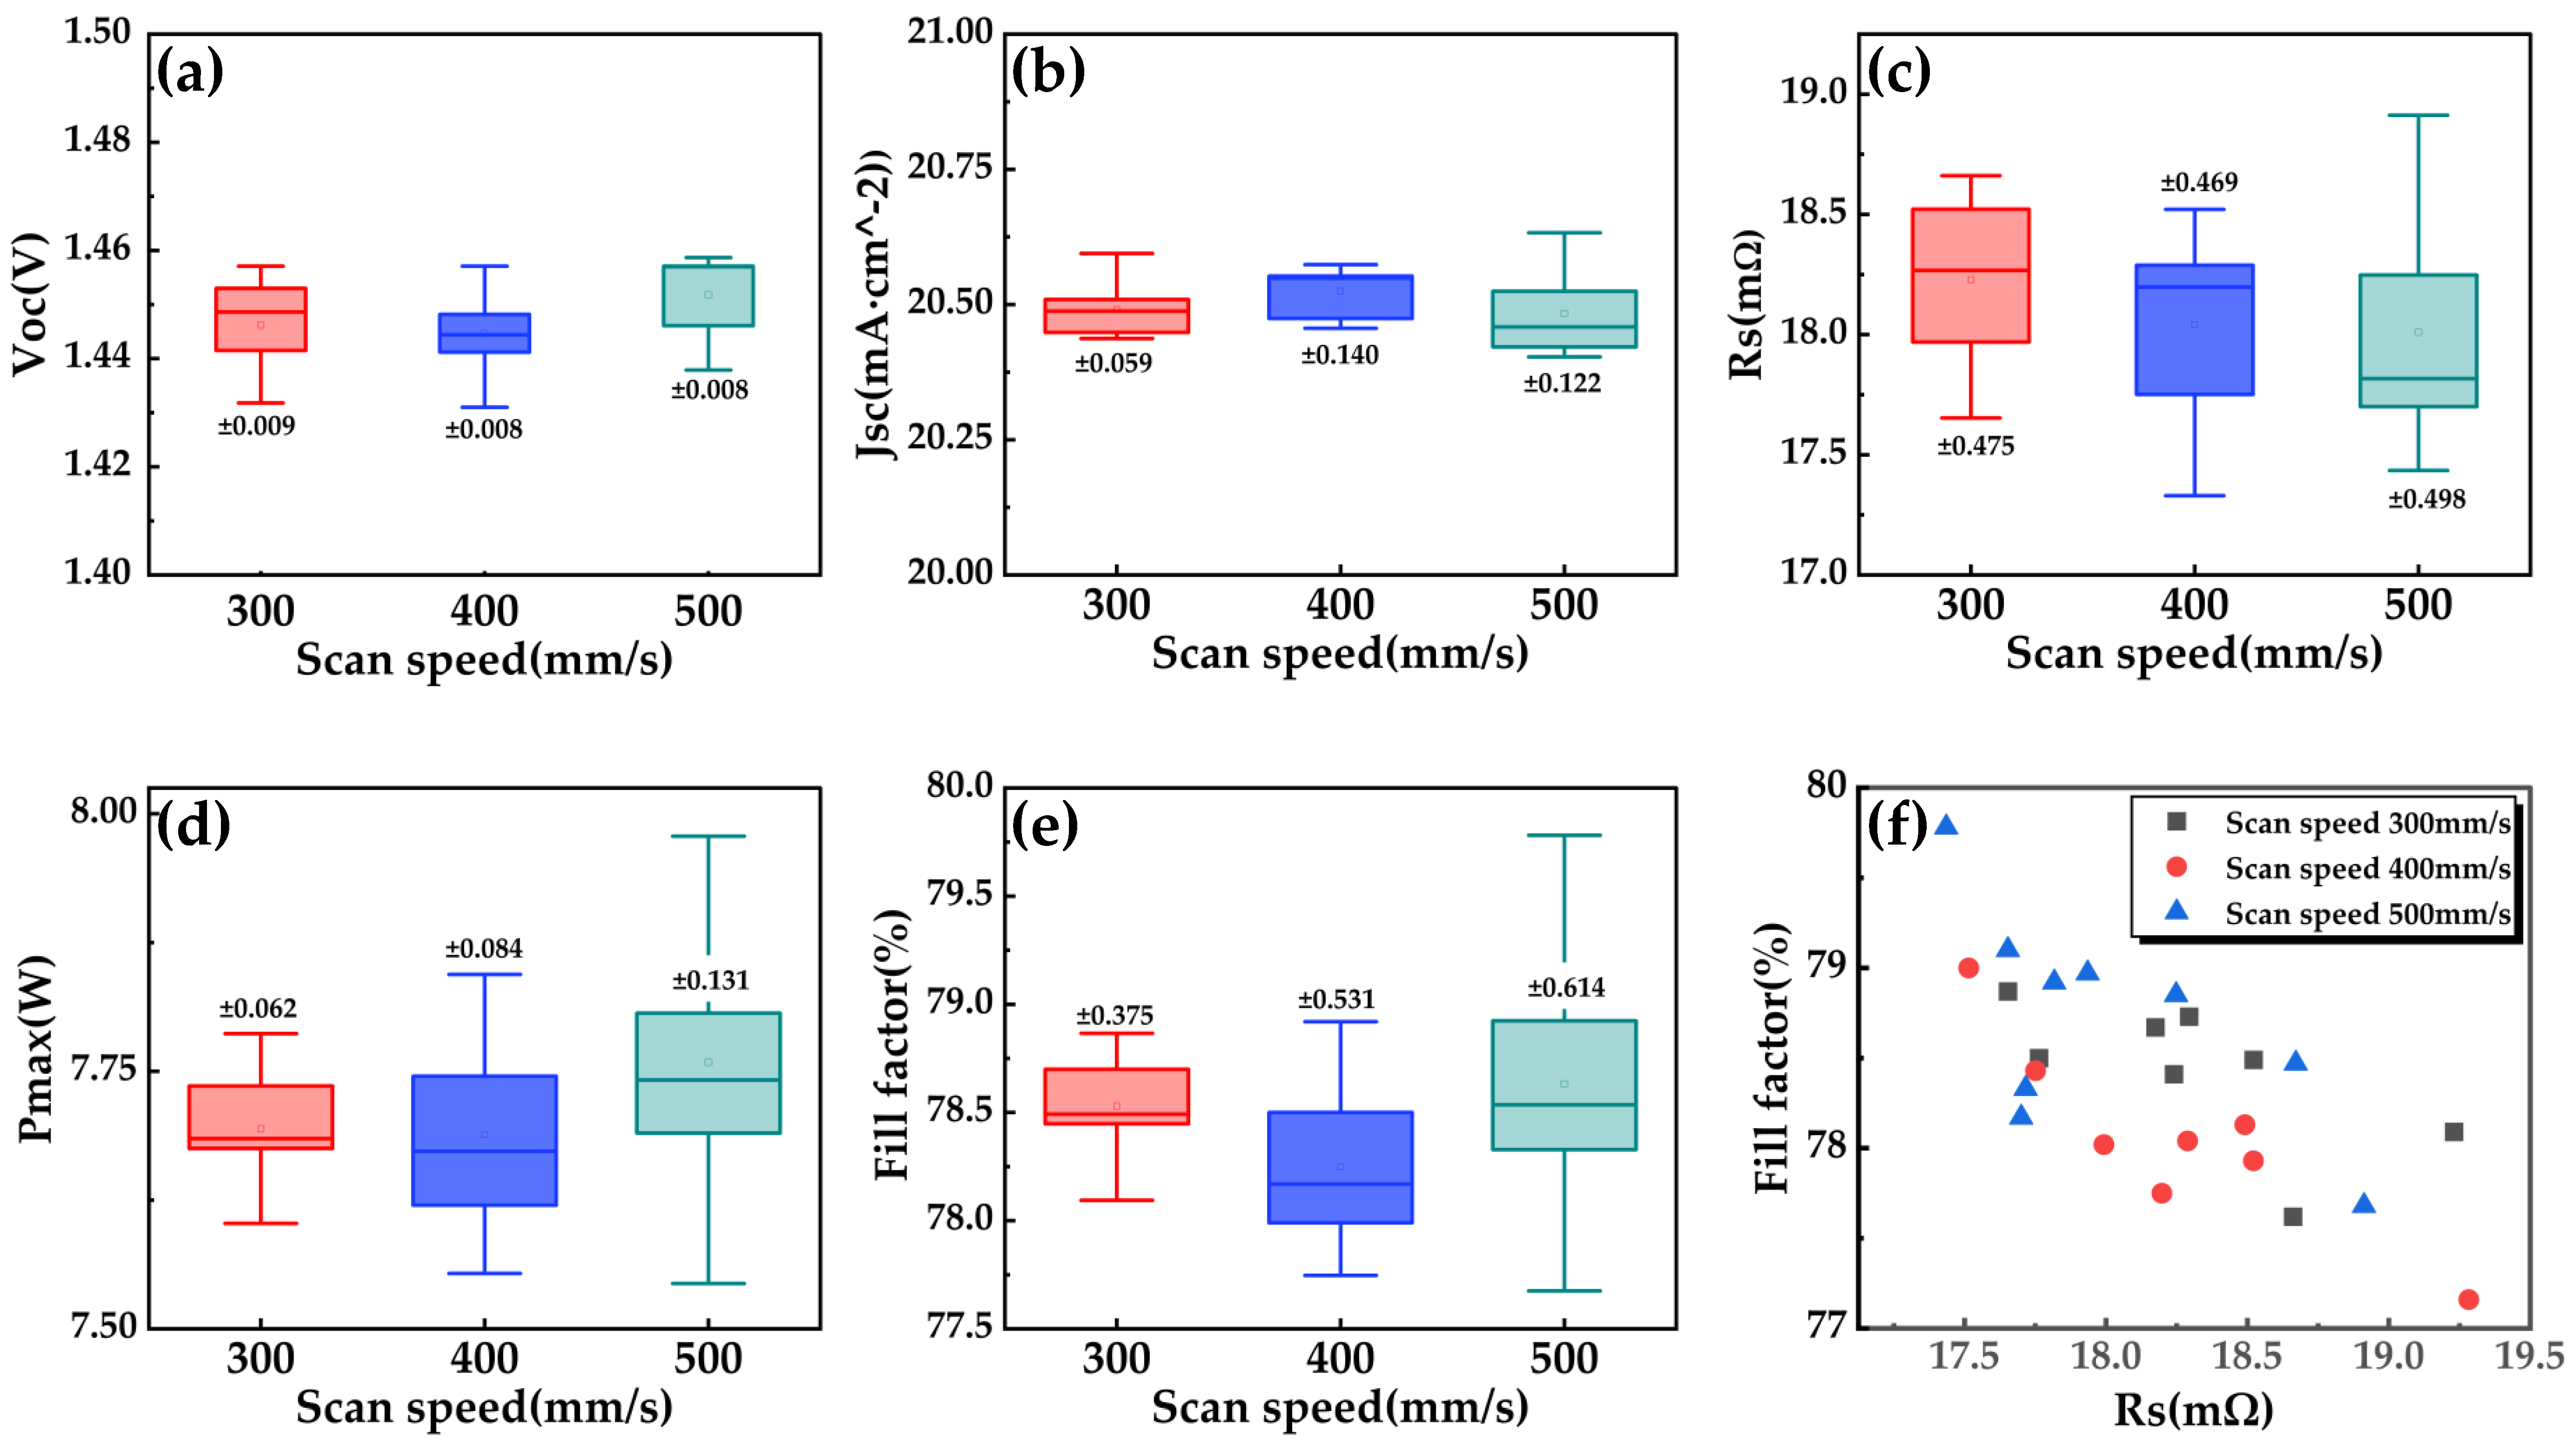
To elucidate the origin of the observed variations in FF and Pmax, the distributions of the open-circuit voltage (Voc), short-circuit current density (Jsc), and series resistance (Rs) were investigated for all stable NDC conditions. Figure 6 presents box plots of Voc, Jsc, and Rs as a function of scan speed. As illustrated in Figure 6a, Voc exhibits only minor variations across the investigated scan speeds. Because Voc is primarily governed by bulk recombination, junction quality is defined under open-circuit conditions where the influence of series resistance vanishes [14,22]. Therefore, the limited spread in Voc suggests that the cutting process does not significantly affect recombination-related losses or junction integrity under optimal cutting conditions.
Figure 6.
Distribution of (a) Voc, (b) Jsc, and (c) Rs for HPBC half-cut cells processed under optimal cutting NDC conditions at different scan speeds. Voc and Jsc remain nearly unchanged across all conditions, whereas Rs exhibits a larger variation, indicating that electrical performance differences are primarily governed by resistive losses. (d) Distribution of Pmax and (e) of FF. (f) Scatter plot of FF versus series resistance under optimal cutting NDC conditions.
Similarly, Figure 6b shows that Jsc remains clustered with minimal variation because Jsc reflects global photogeneration and carrier collection over the entire cell area [23,24]. The observed invariance of Jsc suggests that the NDC process does not introduce substantial losses in optical absorption or charge collection efficiency. This behavior is consistent with the localized nature of the cutting process, which primarily affects the cell edge rather than the active area.
In contrast, Figure 6c reveals a comparatively larger variation in Rs. Series resistance is highly sensitive to localized resistive losses along the current flow path, particularly near the cell edge, which directly influences the IV curve’s slope near the maximum power point [17,18]. The substantial dispersion observed in Rs indicates that resistive effects are crucial in differentiating the electrical performance among optimal cutting NDC conditions. Figure 6d,e present the distributions of Pmax and FF, respectively, and reveal nearly identical trends. This observation reaffirms that variations in series resistance play a dominant role in governing both Pmax and FF. In addition, Figure 6f presents a scatter plot of FF as a function of Rs for all stable NDC conditions. Here, a correlation is observed, indicating that FF degradation is primarily governed by series-resistance-related losses induced by the cutting process. This trend is consistently observed across different scan speeds, confirming that Rs is the dominant electrical parameter linking the NDC process conditions to device performance. These observations demonstrate that the performance differences observed within the stable process window are not driven by changes in Voc or Jsc, but are closely associated with variations in series resistance.
Based on the above analysis, the selection of FF and Pmax as the primary metrics for evaluating cutting-induced electrical performance can be justified. Although Voc and Jsc function as essential indicators for distinguishing recombination- and photogeneration-related effects, their limited variation across stable NDC conditions indicates that they do not govern the observed performance differences. In contrast, FF and Pmax are sensitive to series resistance. Consequently, these parameters effectively capture the impact of cutting-induced resistive losses and provide a clearer basis for comparing different NDC process conditions.
To consider the obtained electrical performance in an industrial context, the obtained results were compared with reported performance ranges of SoTA industrial back-contact and HPBC solar cells. According to recent industry roadmaps and technology reports (e.g., ITRPV 2024 roadmap and BC solar cells white papers), industrial scale HPBC and related back-contact solar cells typically exhibit FF values in the range of approximately 78–82%, depending on cell architecture and metallization schemes [1,2].
Here, the half-cut HPBC solar cells fabricated via the NDC process achieved maximum FF values up to 79.8%, with corresponding Pmax values comparable to those reported for full-size industrial HPBC cells. Considering that cell cutting processes often introduce additional series resistance and edge-related damage, the preservation of FF and Pmax within this reported SoTA industrial range indicates that the proposed NDC approach effectively minimizes cutting-induced electrical degradation [3,4,5].
Therefore, although this study did not attempt to surpass record laboratory-scale efficiencies, the results demonstrate that the NDC process enables half-cut fabrication of SoTA HPBC solar cells while maintaining electrical performance at an industry-relevant level.
A closer inspection of the experimental results reveals that this trend cannot be explained by considering individual process parameters independently. Although increasing thermal laser power generally enhances crack driving, excessive thermal input does not necessarily improve electrical performance and may even lead to localized thermal damage or stress concentration. Similarly, while the introduction of an IR-induced pre-cut facilitates crack initiation, excessively shallow and deep pre-cuts result in unstable fracture behavior. These coupled effects trigger non-monotonic variations in FF and Pmax as functions of pre-cut depth and thermal laser power. This observation indicates that cutting stability and device performance are driven by the interaction between thermal driving and crack guidance rather than a single dominant parameter.
To explicate the physical origin of this coupled behavior, the NDC process can be interpreted within a thermally driven fracture mechanics framework [16]. Laser irradiation induces a localized temperature rise in the material, which leads to constrained thermal expansion and tensile thermal stress generation, as described in classical thermal fracture theory [12,16].
During scanning laser processing, the thermal driving force is driven by the amount of energy delivered per unit cutting length rather than by the absolute laser power alone [12,16]. This thermal input is typically described using the line energy concept derived from the moving heat source theory. Here, η denotes an effective thermal coupling efficiency, representing the fraction of the applied laser power effectively converted into localized thermal energy, thus contributing to thermo-elastic stress generation. Due to optical reflection at the silicon surface, scattering, heat diffusion within the substrate, and the moving nature of the laser heat source, not all of the optical output directly cause crack-driving thermal stress [13,25]. Here, η is considered a lumped, system-dependent constant, because the same laser wavelength, optical configuration, and material system were utilized throughout all experiments. Accordingly, η is absorbed into the line-energy scaling term to enable relative comparison among different processing conditions rather than being evaluated as an independent variable.
Because of this energy scaling, the resulting temperature increase is primarily governed by the ratio between thermal laser power and scan speed [12,16].
This relationship explains why comparable thermal driving conditions can be achieved under different combinations of laser power and scan speed, provided that the effective line energy remains similar.
Consequently, this study proposes a crack-driving index, ψ, as an experimentally accessible descriptor that captures the combined effects of thermal driving and crack guidance in the NDC process. Although the physical components underlying ψ such as thermal stress generation, line energy scaling, and pre-cut-assisted crack initiation have been discussed extensively in previous studies, their integration into a single normalized experimental index has not been explicitly formulated [10,21,26,27].
Here, and denote the thermal laser power, scan speed, IR laser-induced pre-cut depth, and reference thickness of the cell, respectively. In this formulation, the proportional coefficient α represents the contribution of the IR pre-cut to crack driving, relative to the applied line energy, and is treated as an effective mechanism-dependent constant. A detailed interpretation of α and its relationship with fracture-mechanics considerations is provided in the Appendix A. When the experimental conditions are reformulated relative to the crack-driving index ψ, the relationship between process parameters and electrical performance becomes more interpretable.
For each cutting condition, ψ was calculated from the applied thermal laser power, scan speed, and measured IR pre-cut depth, together with the corresponding FF and Pmax values. In addition, ψ was formulated as a multiplicative combination of independent physical contributors, reflecting the fact that crack initiation and propagation require the simultaneous presence of sufficient thermal driving force and effective crack guidance [27]. Such multiplicative formulations are prevalent in fracture mechanics and laser–material interaction studies to represent coupled driving conditions, where the absence of any single factor suppresses the overall fracture response [28,29,30]. This formulation enables direct comparison across conditions with different absolute laser powers and scan speeds, while preserving the coupled nature of thermal driving and crack guidance. The calculated ψ values for each processing condition are summarized in Table 2.
Table 2.
Crack-driving index corresponding to multiple process parameters.
Replotting the experimental results as FF versus ψ indicates that ψ captures the overall crack-driving tendency, yet FF is not uniquely determined by ψ alone. Instead, the data suggest an optimal region (or ridge) in which a suitable ψ level is combined with an appropriate pre-cut depth. For example, at a 300 mm/s scan speed, increasing ψ at the shallow pre-cut depth (17.3 µm) does not continuously improve FF; they decrease at the highest ψ condition within that depth set, while the intermediate pre-cut depth (23.0 µm) achieves the maximum FF at a higher ψ value. A similar conditional behavior is observed at 400 and 500 mm/s, where the highest FF appears at intermediate-to-high ψ values only when the pre-cut depth provides sufficient crack guidance. These results indicate that ψ is most meaningful as a physically informed descriptor when interpreted together with pre-cut depth, rather than as a single-variable predictor.
The ψ–electrical performance relationship provides additional insight into the sensitivity of the NDC process under different operating regimes. To quantify this sensitivity, a peak-width concept was introduced based on the ψ–FF distribution and ψ–Pmax in Table 3 and Table 4, where near-optimal electrical performance was defined as values exceeding 98% of the peak performance [31,32]. This threshold captures conditions that are functionally equivalent to the optimum while excluding minor variations attributable to experimental uncertainty, thus providing a practical measure of process tolerance.
Table 3.
ψ-FF and ψ-Pmax values satisfying up to 98% of max FF and Pmax at each scan speed.
Table 4.
Peak width of ψ defined by the 98% criterion at each scan speed.
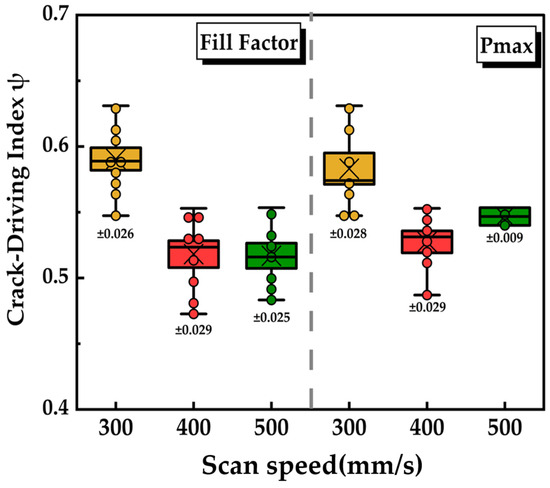
Analysis of the resulting ψ distributions indicates that the acceptable ψ window progressively narrows as the scan speed increases. This behavior is directly related to the definition of ψ: at higher scan speeds, small variations in thermal laser power or IR pre-cut depth cause relatively larger alterations in ψ, thus amplifying process sensitivity [31,32,33,34]. Conversely, at lower scan speeds, near-optimal FF-Pmax values are maintained over a broader ψ range, indicating greater robustness against parameter fluctuations. Consequently, although higher scan speeds enable higher peak FF-Pmax values, the effective process window becomes increasingly restricted, explaining the experimentally observed trade-off between throughput and process stability. This trend is illustrated by the reduced spread of ψ at 500 mm/s in Figure 7. This interpretation establishes ψ as a practical bridge between fracture mechanics and experimental process optimization [32].
Figure 7.
Box-plot representation of ψ as a function of scan speed for conditions corresponding to near-optimal (98%) FF and Pmax.
4. Conclusions
This study systematically investigated a dual-laser NDC process combining IR laser pre-cut formation and thermal laser-driven crack propagation for half-cut HPBC silicon solar cells. The obtained results demonstrate that although higher scan speeds can improve peak electrical performance, stable and reproducible operations are achieved only within a constrained process window governed by the combined effects of thermal driving and pre-cut-assisted crack guidance.
To interpret this coupled behavior, ψ was introduced as an experimentally accessible descriptor integrating thermal laser power, scan speed, and IR pre-cut depth. Re-analysis using ψ reveals that near-optimal electrical performance is obtained within a bounded ψ window defined using a consistent 98% criterion applied to both FF and Pmax, rather than via monotonic increases in thermal loading alone.
Furthermore, the permissible ψ window was deduced to progressively narrow with increasing scan speed, indicating that while higher throughput enables improved peak performance, it also requires substantially tighter control of thermal laser conditions and IR pre-cut formation. This ψ-based interpretation provides a clear explanation for the trade-off between throughput and process robustness observed in high-speed NDC operation.
Overall, the proposed ψ-based framework offers a coherent and internally consistent approach for analyzing laser-based cutting processes, linking electrical performance directly to crack-driving conditions without relying on complex thermo-mechanical simulations, and providing practical guidance for optimizing NDC processes for high-efficiency solar cell manufacturing.
Although long-term reliability testing is beyond the scope of this work, the lack of immediate electrical degradation after the dual-laser NDC process allows the exclusion of major laser-induced damage mechanisms. Furthermore, although this study focuses on cell-level electrical performance, comprehensive long-term reliability assessment at the module level, including damp heat and temperature cycling tests, is left for future work.
Author Contributions
W.C.: Conceptualization, Methodology, Investigation, Formal Analysis, Data Curation, Validation, Visualization, Writing—Original Draft, Writing—Review and Editing. M.K.: Investigation, Validation, Formal Analysis, Data Curation. G.K.: Investigation, Writing—Review and Editing. J.S. (Jinho Shin), K.J. and J.S. (Jinyong Seok): Investigation, Writing—Review and Editing. C.J.: Conceptualization, Funding Acquisition, Project Administration, Supervision, Writing—Review and Editing. All authors have read and agreed to the published version of the manuscript.
Funding
This work was partially supported by a Korea Institute of Energy Technology Evaluation and Planning (KETEP) grant funded by the Korean government (MOTIE) (RS-2023-00303745), “Development of photovoltaic module materials and process technology with low carbon emissions and easy recycling” by Korea Institute of Planning and Evaluation for Technology in Food, Agriculture and Forestry (IPET) and Korea Smart Farm R&D Foundation (Kos-Farm) through Smart Farm Innovation Technology Development Program, funded by the Ministry of Agriculture, Food and Rural Affairs (MAFRA) and the Ministry of Science and ICT (MSIT), Rural Development Administration (RDA) (RS-2025-02305965). This work was also supported by the Korea Institute of Industrial Technology (KITECH) under grant EH-26-0003, “Development of core technologies of AI based self-power generation and charging for next-generation mobility”.
Data Availability Statement
The original contributions presented in this study are included in the article and Appendix A. Further inquiries can be directed to the corresponding author.
Conflicts of Interest
The authors declare no conflict of interest.
Appendix A
Appendix A.1. Linear Thermo-Elastic Model Describing Thermally Induced Stress
The thermal stress induced by laser heating was estimated via the following linear elastic relationship:
This formulation represents a standard expression for thermal stress in brittle materials subjected to localized heating, where thermally induced expansions is partially or fully constrained by the surrounding material [13,25]. Under free expansion, a temperature change produces only thermal strain without stress generation. However, when the expansion is constrained—as in thin wafers or locally heated regions surrounded by colder material—the thermal strain is converted into elastic stress according to classical thermos-elasticity.
The factor E/(1−ν) emerges from the constitutive relationship for isotropic elastic solids under plane-stress or biaxially constrained conditions, which are commonly assumed for thin crystalline silicon cells during laser processing. Here, the out-of-plane stress component is negligible, while in-plane deformation is restricted, effectively amplifying the thermally induced stress via Poisson coupling.
In the NDC process, the IR pre-cut defines a preferential crack initiation site and constrains the fracture path. This role is directly reflected in the cross-sectional morphologies of the pre-cuts.
Appendix A.2. Fracture-Mechanics Framework for Thermally Driven Crack Propagation
From a fracture-mechanics perspective, crack propagation under tensile loading is commonly characterized by the mode-I stress intensity factor, , which quantifies the local amplification of stress at a crack tip [35]. Here, the crack-driving force generated by laser-induced thermal stress is expressed as:
where Y, , and denote a dimensionless geometry factor accounting for crack configuration and boundary conditions, the thermally induced tensile stress, and the effective crack length, respectively. Crack propagation is expected when exceeds the fracture toughness of the material, KIC [35]. In the NDC process, the intentionally introduced IR pre-cut is crucial in controlling crack initiation and propagation by defining a preferential crack path and modifying the effective crack geometry.
In the presence of an IR pre-cut, the effective crack length is no longer determined solely by intrinsic material flaws, but increases systematically with the pre-cut depth. This behavior can be phenomenologically expressed as:
where , , and λ represent the initial crack length associated with pre-existing defects or microstructural imperfections, depth of the IR pre-cut, and proportionality factor reflecting the effectiveness of the pre-cut in promoting crack extension under thermal loading, respectively. The parameter λ accounts for non-ideal crack-tip conditions, including finite notch radius, microcrack formation, and local damage accumulation near the pre-cut tip [36].
This formulation captures the dual function of the IR pre-cut: it lowers the effective fracture threshold by increasing and simultaneously constrains the crack path, enabling stable and guided crack propagation under laser-induced thermal stress. Consequently, for a given thermal loading condition, deeper or more effective pre-cuts result in higher stress intensity factors and promote controlled cleaving along the intended cutting line.
Although these formulations elucidate the thermal and fracture mechanics driving the NDC process, their direct application to experimental process optimization is limited. Accurate evaluation of transient temperature fields, stress distributions, and stress intensity factors would require detailed thermo-mechanical simulations, which are impractical for routine experimental analysis [19,20].
To connect the fracture-mechanics framework described above with the experimentally defined index ψ, the proportional coefficient α is introduced as an effective weighting factor. While the coefficient λ quantifies how the IR pre-cut depth increases the effective crack length under thermal loading, α translates this fracture-mechanics effect into the ψ formulation by weighting the contribution of the experimentally measured pre-cut depth relative to the applied line energy.
Physically, α reflects the effectiveness with which the pre-cut geometry enhances crack driving via mechanisms like crack-tip sharpening, local damage accumulation, and stress concentration near the pre-cut. Hence, for a given material system and IR pre-cut formation mechanism, α is considered a mechanism-dependent constant rather than a condition-dependent fitting parameter. Variations in crack guidance are primarily captured by the experimentally measured pre-cut depth, while α provides a consistent scaling that enables comparison of crack-driving tendencies across different processing conditions.
References
- LONGi Green Energy Technology Co., Ltd. Back Contact (BC) Solar Technology Development White Paper; LONGi: Xi’an, China, 2024. [Google Scholar]
- International Technology Roadmap for Photovoltaic (ITRPV). ITRPV Results 2024; VDMA: Frankfurt, Germany, 2024. [Google Scholar]
- Zuboy, J.; Springer, M.; Palmiotti, E.C.; Karas, J.; Smith, B.L.; Woodhouse, M.; Barnes, T.M. Getting Ahead of the Curve: Assessment of New Photovoltaics Module Reliability Risks Associated with Projected Technological Changes. IEEE J. Photovolt. 2024, 14, 4–22. [Google Scholar] [CrossRef] [Scilit]
- Haedrich, I.; Eitner, U.; Wiese, M.; Wirth, H. Unified methodology for determining CTM ratios: Systematic prediction of module power. Sol. Energy Mater. Sol. Cells 2014, 131, 14–23. [Google Scholar] [CrossRef] [Scilit]
- Kaule, F.; Pander, M.; Turek, M.; Grimm, M.; Hofmueller, E.; Schoenfelder, S. Mechanical Damage of Half-Cell Cutting Technologies in Solar Cells and Module Laminates. AIP Conf. Proc. 2018, 1999, 020013. [Google Scholar] [CrossRef] [Scilit]
- Kyeong, D.; Gunasekaran, M.; Kim, H.; Kwon, T.; Moon, I.; Han, K. Laser Edge Isolation for High-Efficiency Crystalline Silicon Solar Cells. J. Korean Phys. Soc. 2009, 55, 124–128. [Google Scholar] [CrossRef] [Scilit]
- Yang, L.; Huang, W.; Deng, M.; Li, F. MOPA Pulsed Fiber Laser for Silicon Scribing. Opt. Lasers Technol. 2016, 80, 67–71. [Google Scholar] [CrossRef] [Scilit]
- Lv, X.; Hu, J.; Yang, L.; Huang, J.; Yu, X.; Jin, C.; Yang, D. Transmission Electron Microscopy Study on the Laser-cutting induced microdefects in silicon heterojunction solar cells. Sol. Energy Mater. Sol. Cells 2025, 292, 113792. [Google Scholar] [CrossRef] [Scilit]
- Hwang, S.; Kang, Y. Reliability Study on the Half-Cutting PERC Solar Cell and Module. Energy Rep. 2023, 10, 678–685. [Google Scholar] [CrossRef] [Scilit]
- Xu, J.; Hu, H.; Zhuang, C.; Ma, G.; Han, J.; Lei, Y. Controllable Laser Thermal Cleavage of Sapphire Materials. Opt. Laser Eng. 2016, 78, 57–64. [Google Scholar] [CrossRef] [Scilit]
- Kubota, S.; Saimoto, A.; Yasufumi, I. High-Speed Thermal Stress Cleaving by Moving Heat with mist cooling. Acta Mech. 2010, 214, 159–167. [Google Scholar] [CrossRef] [Scilit]
- Zhou, Y.; Zhu, Z.; Duan, Z. Thermal Fracture Characteristics Induced by Laser Beam. Int. J. Solids Struct. 2001, 38, 5647–5660. [Google Scholar] [CrossRef] [Scilit]
- Carslaw, H.S.; Jaeger, J.C. Conduction of Heat in Solids, 2nd ed.; Oxford University Press: Oxford, UK, 1959. [Google Scholar]
- Green, M.A. Solar Cells: Operating Principles, Technology, and System Applications; Prentice-Hall: Englewood Cliffs, NJ, USA, 1982. [Google Scholar]
- Saman, A. Study on Laser Cleaving Mechanism of Brittle Materials. Ph.D. Dissertation, The University of Kanazawa, Kanazawa, Japan, 2017; pp. 118–130. [Google Scholar]
- Tan, C.; Wen, C.; Ang, H. Influence of Laser Parameters on the microstructures and surface properties in laser surface modification of biomedical magnesium alloys. J. Magnes. Alloys 2024, 12, 72–97. [Google Scholar] [CrossRef] [Scilit]
- Green, M.A. Solar cell fill factors: General graph and empirical expressions. Solid-State Electron. 1981, 24, 788–789. [Google Scholar] [CrossRef] [Scilit]
- Sinton, R.A.; Cuevas, A. Contactless determination of current–voltage characteristics and minority-carrier lifetimes in semiconductors from quasi-steady-state photoconductance data. Appl. Phys. Lett. 1996, 69, 2510–2512. [Google Scholar] [CrossRef] [Scilit]
- Abdulla, H.; An, H.; Barsoum, I.; Maalouf, M. Mathematical Modeling of Multi-Performance Metrics and Process Parameter Optimization in Laser Powder Bed Fusion. Metals 2022, 12, 2098. [Google Scholar] [CrossRef] [Scilit]
- Bansch, E.; Luttmann, A.; Urquizo, J.M.; Schmidt, A.; Marroquin, M.G. Simulation and Multi-Objective Optimization to improve the final shape and process efficiency of a laser-based material accumulation process. J. Math. Ind. 2020, 10, 2. [Google Scholar] [CrossRef] [Scilit]
- Xu, G.; Yan, K.; Wang, L.; Lv, S.; Ma, A.; Li, J.; Qing, A. A Comparative Experimental Study on Front and Back Laser Cutting Technology for Mass Separation of n-TOPCon Crystalline Silicon Solar Cells. Sol. Energy Mater. Sol. Cells 2024, 271, 112844. [Google Scholar] [CrossRef] [Scilit]
- Luque, A.; Hegedus, S. (Eds.) Handbook of Photovoltaic Science and Engineering; John Wiley & Sons: Chichester, UK, 2011. [Google Scholar]
- Nelson, J. The Physics of Solar Cells; Imperial College Press: London, UK, 2003. [Google Scholar]
- Green, M.A.; Dunlop, E.D.; Yoshita, M.; Kopidakis, N.; Bothe, K.; Siefer, G.; Hao, X. Solar cell efficiency tables (version 62). Prog. Photovolt. Res. Appl. 2023, 31, 651–663. [Google Scholar] [CrossRef] [Scilit]
- Steen, W.M.; Mazumder, J. Laser Material Processing, 4th ed.; Springer: London, UK, 2010. [Google Scholar]
- Zhou, Y.; Wu, B.; Tao, S.; Forsman, A.; Gao, Y. Physical Mechanism of Silicon Ablation with Long Nanosecond Laser Pulses at 1064 nm Through Time-resolved Observation. Jpn. J. Appl. Phys. 2011, 257, 2866–2890. [Google Scholar] [CrossRef] [Scilit]
- Ready, J.F.; Farson, D.F. LIA Handbook of Laser Materials Processing; Laser Institute of America (LIA): Orlando, FL, USA, 2001. [Google Scholar]
- Huang, Y. Comprehensive Analytical Modeling of Laser Powder-Bed/Fed Additive Manufacturing Processes and an Associated Magnetic Focusing Module. Ph.D. Thesis, University of Waterloo, Waterloo, ON, USA, 2019. [Google Scholar]
- Leung, C.L.A.; Luczyniec, D.; Guo, E.; Marussi, S.; Atwood, R.C.; Meisnar, M.; Saunders, B.; Lee, P.D. Quantification of Interdependent Dynamics during Laser Additive Manufacturing Using X-Ray Imaging Informed Multi-Physics and Multiphase Simulation. Adv. Sci. 2022, 9, 2203546. [Google Scholar] [CrossRef] [Scilit]
- Meurig, T.; Baxter, J.G.; Todd, I. Normalized Model-Based Processing Diagrams for Additive Layer Manufacture of Engineering Alloys. Acta Mater. 2016, 108, 26–35. [Google Scholar] [CrossRef] [Scilit]
- Agrawal, A.K.; Rankouhi, B.; Thoma, D.J. Predictive Process Mapping for Laser Powder Bed Fusion: A Review of Existing Analytical Solutions. Curr. Opin. Solid State Mater. Sci. 2022, 26, 101024. [Google Scholar] [CrossRef] [Scilit]
- Oliveira, J.P.; LaLonde, A.D.; Ma, J. Processing Parameters in Laser Powder Bed Fusion Metal Additive Manufacturing. Mater. Des. 2020, 193, 108762. [Google Scholar] [CrossRef] [Scilit]
- Abbas, T.F.; Algburi, R.; Ebraheem, A.A.; Gu, Y.H.; Al-antari, M.A. Physics-Informed Optimization of Dross Formation in Fiber-Laser Cutting: From Multi-Variable Design to a Single Decision Rule. Res. Sq. 2025; preprint. [CrossRef] [Scilit]
- Cheng, X.; Cui, Z.; Chen, J.; Wang, Y.; Yang, L. Understanding the Processing Quality Problem for Cutting Ceramic Materials Using the Thermal-Controlled Fracture Method Induced by a Single-Surface Heat Source. Micromachines 2024, 15, 957. [Google Scholar] [CrossRef] [Scilit]
- Gross, D.; Seelig, T. Fracture Mechanics: Fundamentals and Applications, 4th ed.; CRC Press: Boca Raton, FL, USA, 2017. [Google Scholar]
- Zhao, C.; Yang, Z.; Kang, S.; Qiu, X.; Xu, B. High-Speed Laser Cutting Silicon–Glass Double Layer Wafers with Laser-Induced Thermal-Crack Propagation. Processes 2023, 11, 1177. [Google Scholar] [CrossRef] [Scilit]

Disclaimer/Publisher’s Note: The statements, opinions and data contained in all publications are solely those of the individual author(s) and contributor(s) and not of MDPI and/or the editor(s). MDPI and/or the editor(s) disclaim responsibility for any injury to people or property resulting from any ideas, methods, instructions or products referred to in the content. |
© 2026 by the authors. Licensee MDPI, Basel, Switzerland. This article is an open access article distributed under the terms and conditions of the Creative Commons Attribution (CC BY) license.