


Abstract
The decarbonization of the building sector is a critical challenge for achieving Japan’s net-zero targets. However, comprehensive assessments comparing residential construction methods and building heights at the national scale remain limited. This study applies Environmentally Extended Input–Output Analysis (EEIOA) to evaluate the embodied CO2 emissions associated with four distinct residential construction methods. The results reveal that, when accounting for carbon storage, the net CO2 emissions per unit of floor area were significantly lower for wooden houses (195 kg-CO2/m2) compared to steel-reinforced concrete (1109 kg-CO2/m2), reinforced concrete (857 kg-CO2/m2), and steel-framed houses (803 kg-CO2/m2). A further analysis based on building height indicates a structural divergence: while wooden houses account for the majority of emissions in one- to three-story buildings due to their high market share, reinforced concrete houses dominate emissions in four- to nine-story buildings driven by their high carbon intensity. These findings suggest that promoting timber construction, particularly in taller buildings, is a vital strategy for climate change mitigation. Consequently, policy support focusing on technological advancement, cost reduction, and consumer awareness is essential to accelerate the adoption of wooden architecture.
1. Introduction
Climate change is a major issue for human society, with many governments setting goals of achieving net-zero CO2 emissions by 2050 [1]. In Japan, the building sector accounts for approximately 30% of energy consumption, and measures are urgently needed for this sector [2]. In recent years, efforts made during construction have become increasingly important in terms of the environmental impact of buildings [3,4].
The use of wood in buildings has been implemented in Japan as a strategy for mitigating climate change. The Act on the Promotion of Wood Use in Public Buildings, enacted in 2010, was revised in 2021 to the Act on the Promotion of Wood Use in Buildings for Contributing to the Realization of a Carbon-Free Society, emphasizing the importance of wood in public buildings and in all types of buildings [5]. In 2023, Japan initiated 820,000 new housing projects, with 450,000 (55%) and 370,000 (45%) of the houses being wooden and non-wooden, respectively [6]. Wooden houses are more common in detached houses and small apartments, whereas non-wooden houses are more common in large apartments and condominiums, depending on the number of floors and building size. To promote the abovementioned policies as measures against climate change, quantifying the environmental impact of buildings, specifically the differences in construction methods and the number of floors, is crucial.
However, despite the growing body of literature on the environmental impacts of residential buildings, several important gaps remain. First, national-scale analyses based on input–output analysis have either relied on outdated data or focused on a single construction method, particularly wooden houses, limiting comparisons across different construction types. Second, while the influence of building height on embodied CO2 emissions has been examined mainly using process-based approaches, it has rarely been analyzed within a consistent environmentally extended input–output framework, especially in the Japanese context, where mid- and high-rise wooden construction is increasingly promoted. To address these gaps, this study aims to quantify CO2 emissions associated with housing construction across different construction methods and to examine how variations in construction methods and building height influence embodied CO2 emissions using a unified environmentally extended input–output approach.
This paper begins by first reviewing the relevant literature to position the present study within existing research on embodied carbon in residential buildings (Section 2). Section 3 describes the analytical framework and methodology, followed by Section 4, which details the data sources and assumptions employed in the analysis. The results are presented in Section 5. Section 6 discusses the implications of the findings, addresses the study’s limitations, and outlines directions for future research. Finally, Section 7 concludes the paper by summarizing the main findings and policy implications.
2. Literature Review
Process-based Life Cycle Analysis (LCA) and Environmentally Extended Input–Output Analysis (EEIOA) have commonly been used to examine the environmental impact of housing throughout its life cycle [7,8].
2.1. Previous Studies Using Process-Based LCA
Process-based LCA quantifies the environmental impacts of products and processes throughout their life cycles, from cradle to grave [4]. This bottom-up approach allows for a detailed assessment of the material and energy balances at each process stage. Moreover, it is widely used in environmental impact assessments of energy, buildings, transportation, material footprints, and infrastructure [9,10]. Studies employing process-based LCA have also focused on wooden houses [11,12,13,14,15,16]. For instance, Monahan and Powell (2011) reported that the embodied carbon of a low-energy timber-frame house in the UK was approximately 405 kg-CO2/m2, which was 34% lower than that of a traditional masonry home [14]. Similarly, Petrovic et al. (2019) conducted a process-based LCA of a one-story wooden house located in Sweden; the CO2 emissions per floor area were 566.7 kg-CO2/m2 [16]. These studies illustrate how results can vary depending on regional characteristics and building specifications.
Studies have used process-based LCA to analyze wood in buildings [17,18,19,20,21,22,23]. For example, Upton et al. (2008) demonstrated that substituting wood for concrete or steel in residential construction could reduce net greenhouse gas emissions by 20–50% over a 100-year period [17]. In the Japanese context, Nakano et al. (2024) conducted a process-based LCA of structural wood production in Japan [23]. They found that the CO2 emissions of wood were 79.9 kg-CO2/m3, while its carbon storage effect was −291 kg-CO2/m3. This highlighted the importance of long-term wood use in mitigating global warming. However, it is important to note that process-based LCA has the disadvantage of including truncation errors depending on the system boundary definition [8,9,24]. Additionally, since system boundaries are defined subjectively in each study, comparisons across studies are difficult [25].
To address system boundary issues, hybrid LCA, which combines process-based LCA with input–output analysis, can be used [8,9,24]. Several studies have applied hybrid LCA to analyze wooden houses [9,26,27]. Gerilla et al. (2007) used hybrid LCA to evaluate the environmental impact of Japanese wooden houses and steel-reinforced concrete houses [26]. They found that carbon emissions were the primary factor influencing the environmental impact of houses, with steel-reinforced concrete houses having a greater impact than wooden houses. However, the practical application of hybrid LCA remains limited, and accurately eliminating double counting is challenging [9].
2.2. Previous Studies Using EEIOA
EEIOA is a top-down approach that quantifies both direct and indirect environmental impacts associated with economic activities by linking input–output tables with environmental intensity data [10]. Unlike process-based LCA, which requires subjective system boundary definitions, EEIOA captures the entire upstream supply chain consistently at the national level. Hence, it is the most commonly used approach for quantifying carbon emissions from the building sector [9,10]. Additionally, EEIOA’s top-down approach is useful for the decision-making of sustainable development policies, especially when assessing the overall environmental impacts of a country or industrial sector [10].
Studies have used EEIOA to assess the environmental impact of the construction sector in various countries such as Japan [28,29], China [30], the United States [31], Australia [32], Sweden [33], Ireland [34], and Hong Kong [35]. Studies have also focused on the global environmental impacts of production activities in the construction sector [8,36].
Suzuki et al. (1995) [28] and Imada et al. (2024) [29] studied the Japanese housing sector. Suzuki et al. (1995) used EEIOA to analyze the CO2 emissions associated with housing construction in Japan and found that the direct and indirect CO2 emissions per floor area were 250 kg-CO2/m2, 850 kg-CO2/m2, and 400 kg-CO2/m2 for wooden houses, steel-reinforced concrete houses, and steel-framed houses, respectively [28]. Additionally, Imada et al. (2024) used EEIOA to analyze the direct and indirect CO2 emissions of an average Japanese wooden house with a total floor area of 119 m2 and found them to be 38 t-CO2, which indicated CO2 emissions per floor area of 319 kg-CO2/m2 for wooden houses in Japan [29].
2.3. Contributions of This Study
Research on the environmental impacts of houses was conducted using both bottom-up and top-down approaches. However, the studies have had several limitations. First, studies adopting input–output analysis to analyze housing across Japan have been limited to using outdated data from 1988 [28] or to focusing only on wooden houses [29]. Given the critical nature of global warming, the environmental impact of the specific differences in construction methods remains unclear. Second, most studies focusing on the number of floors in housing have used process-based LCA, and none have used input–output analysis. Therefore, how differences in the number of floors of housing impact the environment in Japan, where the use of wood in mid- and high-rise buildings is encouraged, remains unclear.
To address these gaps, this study used Japan’s latest input–output table to quantify the direct and indirect embodied CO2 emissions of four different construction methods, namely wooden houses, steel-reinforced concrete houses, reinforced concrete houses, and steel-framed houses, for analysis of the construction sector in 2015. Using data on the number of houses by the number of aboveground floors and total floor area, we calculated the average CO2 emissions per house by construction method and number of floors, analyzed the CO2-related impact of differences in construction methods and the number of floors on CO2 emissions, and discussed policy implications.
3. Methodology
3.1. Overview of the Input–Output Framework
This study employed EEIOA to quantify the total carbon footprint of residential buildings. In this study, the carbon footprint is defined as the cumulative carbon emissions produced directly and indirectly by an activity [37]. Unlike process-based LCA, which typically requires subjective system boundary definitions, EEIOA utilizes the national input–output table to capture the interdependence of industries across the entire economy, ensuring a consistent assessment of the entire upstream supply chain.
The underlying methodology is based on the Leontief input–output model [37]. This model conceptualizes the national economy as a system of linear equations, where each equation describes how the product of a specific sector is distributed across other sectors and final consumers. By utilizing observed data on inter-industry flows over a specific period (in this study, 2015), the model quantifies the interdependence of production activities.
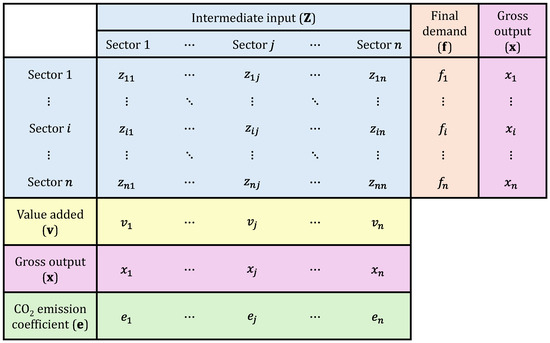
The structure of the environmentally extended input–output framework with industrial sectors is illustrated in Figure 1. In Figure 1, denotes an matrix of intermediate demand, where each element represents the input supplied by sector to sector . For instance, when sector represents “Residential construction (wooden),” the inputs capture the inputs from upstream sectors, such as “Timber” and “Fabricated architectural metal products”, as well as service sectors like “Electricity” and “Road freight transport.” is an vector of final demand, representing products of sector purchased by final consumers. is an vector of gross output, representing the total output of sector . is a vector of value added, representing value added generated by sector . Environmental concerns arise because producers in each sector generate CO2 emissions through their production activities; therefore, is a vector of direct CO2 emission coefficient, representing the direct CO2 emissions per unit of production in sector .
Figure 1.
Structure of the environmentally extended input–output framework used in this study.
In this study, the residential construction sectors (wooden, steel-reinforced concrete, reinforced concrete, and steel-framed houses) are explicitly represented as individual sectors in the input–output table, allowing construction-method-specific final demand to be traced throughout the entire supply chain.
3.2. Estimation of Carbon Footprint
We used EEIOA to estimate both direct and indirect CO2 emissions (i.e., the carbon footprint). The gross output vector in the input–output table consisting of sectors was formulated as follows [38]:
where represents the intermediate input matrix and represents the intermediate inputs from sector to sector . shows the summation vector whose elements are all 1, represents the final demand vector (including domestic final demand and exports). represents the input coefficient matrix, and represents the intermediate input from sector required per unit of production in sector . By rearranging Equation (1), we obtained the following equation:
where represents the identity matrix. represents the Leontief inverse matrix, and represents the output in sector directly and indirectly required per unit of final demand in sector . In this study, as the utilized input–output table consists of 217 sectors, the Leontief inverse matrix has dimensions .
We used Equation (3) to estimate CO2 emissions associated with final demand (see, e.g., Suh, 2010 [39]).
where is a vector representing the direct and indirect CO2 emissions. represents the diagonal matrix of the direct CO2 emissions vector , where represents the direct CO2 emissions per unit of production in sector .
In this study, to estimate the direct and indirect CO2 emissions induced specifically by each construction method, we constructed a target-specific final demand vector. We assigned the construction cost to the element corresponding to the specific construction method (e.g., wooden houses), while setting the final demand of all other sectors to zero, and substituted this vector into the right-hand side of Equation (3). This configuration allows us to isolate the CO2 emissions attributable solely to residential construction by excluding emissions driven by final demand in other sectors. In this context, indirect demand refers to the production activities induced in upstream sectors—such as construction materials, energy supply, and transportation services—required to fulfill the housing construction. Although the final demand vector is specified only for the target construction sector, these necessary intermediate inputs are determined endogenously through the input coefficient and Leontief inverse matrices. Therefore, the indirect emissions quantified in this study consistently reflect the production ripple effects throughout the supply chain, rather than relying on exogenously specified intermediate inputs.
3.3. Estimation of Carbon Storage
We employed Equation (4) to estimate the carbon storage capacity of wood, following guidelines published by the Japanese government [40].
where represents the amount of carbon stored in wood (CO2 equivalents). represents the wood volume (m3), represents the wood density (t/m3), represents the carbon content weight of wood, and is a coefficient for converting the atomic weight of carbon into the molecular weight of CO2. We used data (obtained from the Japanese government’s domestic production value table) on the unit cost of timber (m3/million JPY) by sector, as well as data (obtained from the input–output table for the analysis of construction sectors) on the input amount of the timber sector (million JPY), and calculated the wood volume used in houses by construction method [41,42]. The wood density was set at t/m3, which is commonly used for Japanese wooden houses [43]. Based on a previous study [44], the average carbon content of dry wood was set at 0.5. Of note, this study only estimated the average carbon storage in wood and did not consider variations in carbon storage due to tree age or the impact of wood utilization on deforestation.
4. Data
We used Japan’s 2015 input–output table, which provides the highest sectoral resolution (496 row sectors × 380 column sectors) and which was published by the Ministry of Internal Affairs and Communications [41,45]. Additionally, the 2015 input–output table for construction-sector analysis, published by the Ministry of Land, Infrastructure, Transport and Tourism, was utilized [42]. In this table, the residential construction sector is classified into four detailed construction methods: wooden houses, steel-reinforced concrete houses, reinforced concrete houses, and steel-framed houses. Because these two input–output tables differ in the number of sectors and the national input–output table does not provide intermediate input data for the detailed construction methods, we developed a new database. This database comprises a 217 × 217 sector national input–output table for 2015 that includes intermediate inputs and the final demand for the detailed construction methods. The monetary values in the database are expressed in million JPY. Since EEIOA captures interdependence across the entire national economy to calculate the Leontief inverse matrix, the database includes all 217 sectors defined in the Japanese industrial classification, regardless of their direct relevance to residential construction. The input–output database is available on the open data site (https://doi.org/10.5281/zenodo.18382989).
This study estimated direct and indirect CO2 emissions by inserting a final demand vector that includes only the final demand for a specific construction method, while setting the final demand of all other sectors to zero, into the right-hand side of Equation (3) [39]. It is important to note that the final demand vector included in the uploaded database represents the actual national demand observed in 2015 for reference purposes, which differs from the vector used for the estimation in this study. Additionally, the direct CO2 emission intensity values of the sectors estimated by the National Institute for Environmental Studies in Japan were used [46,47].
Furthermore, we used the Building Starts Statistics [48], which covers all new residential construction projects initiated in Japan in 2015. Since this study utilizes aggregated national data rather than specific case-study buildings, the analysis reflects the average characteristics of houses constructed across Japan, averaging out specific parameters such as location, site context, and regional climatic differences. Using the total floor area and the number of newly built homes categorized by construction method and number of floors, we estimated the CO2 emissions per unit of floor area.
To analyze differences based on the number of floors in a house, we incorporated data from the same survey on the number of buildings and on the total floor area, both characterized by construction method and number of aboveground floors. First, the total floor area of homes built from 2015 was divided by the number of homes for which building started that year to calculate the average total floor area per building, categorized by construction method and number of floors. For each floor category, the construction method with the largest total floor area per building was used to determine the average total floor area per building for homes with that number of floors. The average total floor area per house for homes newly built in Japan in 2015 was as follows: 134 m2/house for one-story houses, 213 m2/house for two-story houses, 728 m2/house for three-story houses, 1095 m2/house for four-to-five-story houses, and 2417 m2/house for six-to-nine-story houses. The classification of floors as “1-story,” “2-story,” “3-story,” “4–5-story,” or “6–9-story” aligned with the survey’s classification of usage data. In this study, the average CO2 emissions per house for a given construction method and number of floors were calculated by multiplying the average total floor area per house for the specific number of floors by the CO2 emissions per unit of floor area for the corresponding construction method.
5. Results
5.1. CO2 Emissions by Construction Method
In 2015, the gross output of Japan’s residential construction sector by construction method was 8820 billion JPY for wooden houses, 102 billion JPY for steel-reinforced concrete houses, 4108 billion JPY for reinforced concrete houses, and 3099 billion JPY for steel-framed houses [42]. The combined gross output of these residential construction sectors accounted for 1.6% of Japan’s total sectoral gross output in 2015. Based on the Embodied Energy and Emission Intensity Data (3EID) for Japan Using Input–Output Tables, published by the National Institute for Environmental Studies, the direct (on-site) CO2 emissions from the residential construction sector in Japan for 2015 were 139 kt-CO2 and 267 kt-CO2 for wooden and non-wooden houses, respectively [46,47].
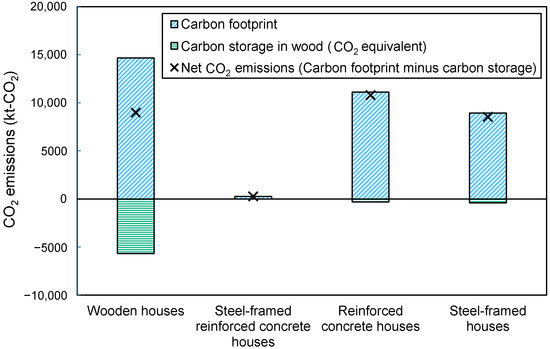
Figure 2 shows the direct and indirect CO2 emissions (i.e., the carbon footprint) associated with the final demand for houses, as well as the amount of carbon stored (CO2 equivalent) by wood used in houses by construction method. Positive values indicate the carbon footprint, and negative values represent the CO2 emissions avoided through the carbon storage of wood. The total carbon footprint of houses across all construction methods was 34,985 kt-CO2, while the total carbon storage was 6400 kt-CO2. This carbon footprint value was 86 times larger than the direct CO2 emissions from houses across all construction methods (406 kt-CO2), suggesting that the residential construction sector induced significantly more indirect CO2 emissions through the construction supply chain than through direct activities at construction sites.
Figure 2.
Carbon footprint, carbon storage, and net CO2 emissions from residential construction in Japan in 2015 by construction method. Carbon footprint includes both direct and indirect emissions induced along the construction supply chain, while carbon storage represents the CO2 equivalent stored in wooden materials. Net CO2 emissions are calculated as the difference between the carbon footprint and carbon storage.
Additionally, the net CO2 emissions, calculated by subtracting the amount of carbon stored from the carbon footprint, were 8982 kt-CO2, 263 kt-CO2, 10,802 kt-CO2, and 8538 kt-CO2 for wooden houses, steel-reinforced concrete houses, reinforced concrete houses, and steel-framed houses, respectively. As shown in Figure 2, compared to those of other construction methods, wooden houses had a larger amount of avoided CO2 emissions due to carbon storage (−5679 kt-CO2) relative to their carbon footprint (14,660 kt-CO2). This indicated that the amount of carbon stored in wooden houses played a remarkable role in reducing CO2 emissions.
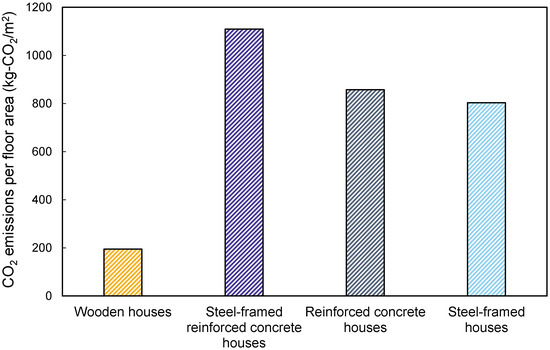
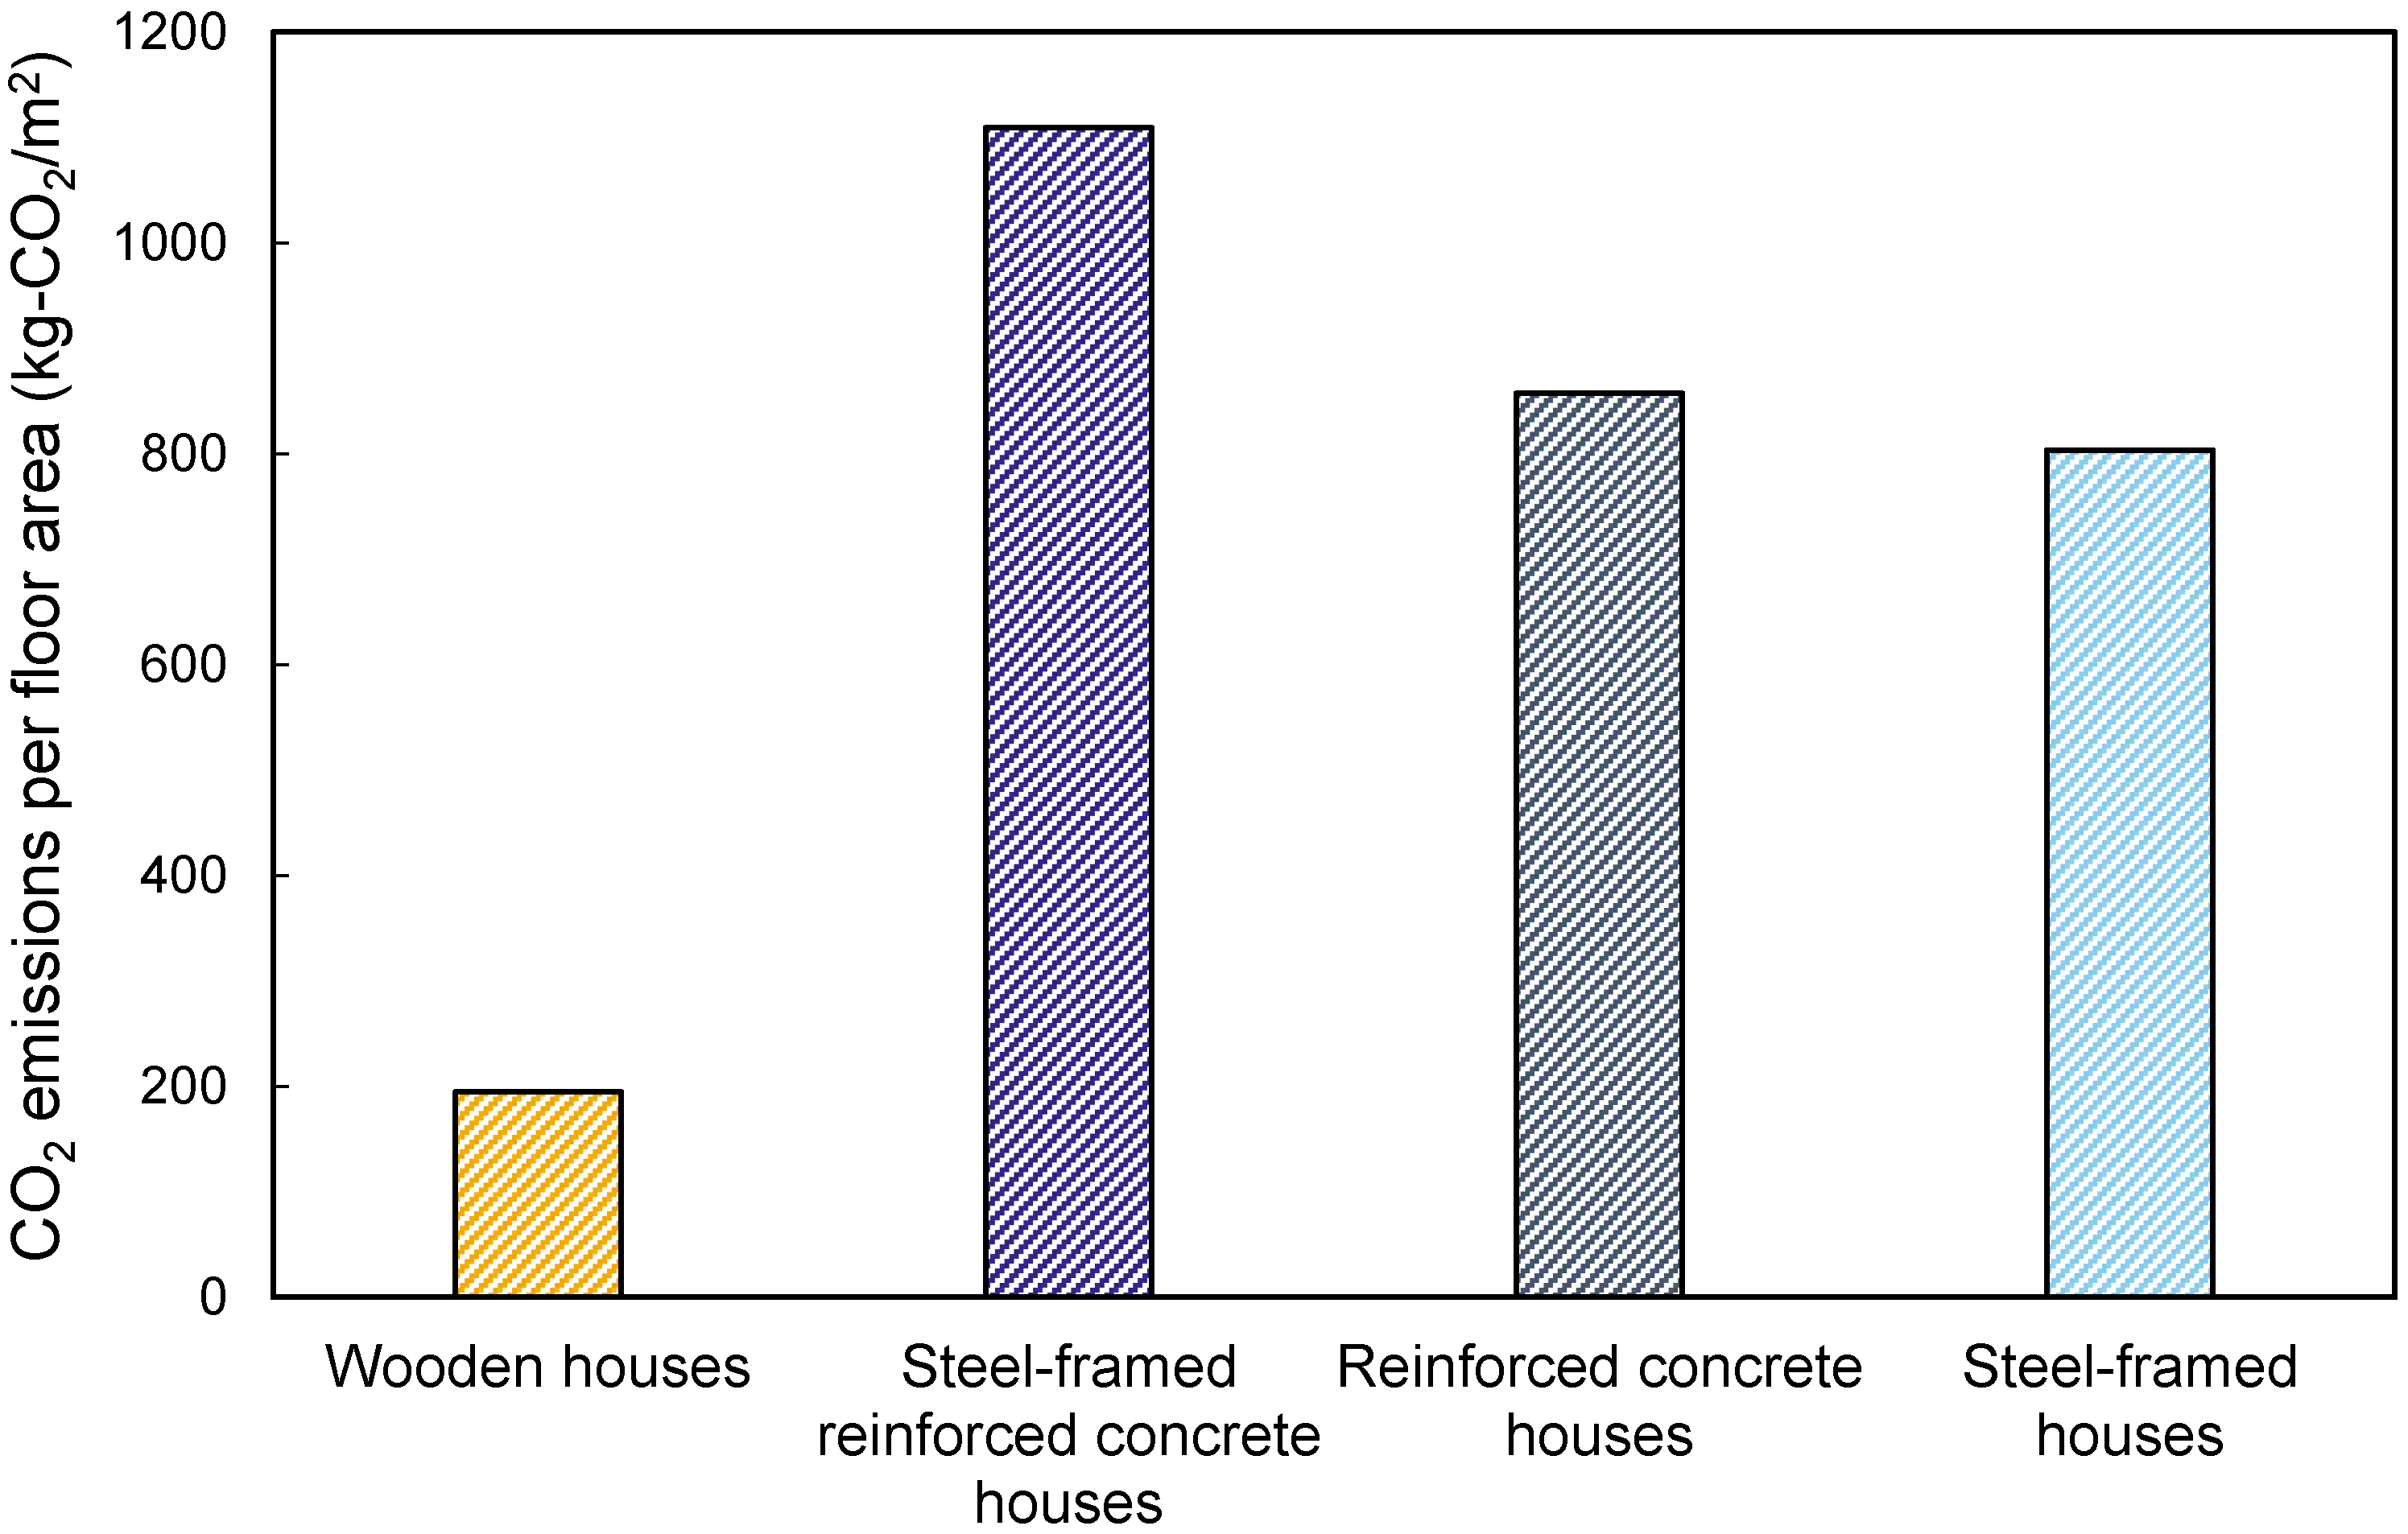
The estimated CO2 emissions per total floor area of houses by construction method are shown in Figure 3. In 2015, the total floor area of newly constructed houses in Japan was 46,079,607 m2, 237,373 m2, 12,599,939 m2, and 10,626,360 m2 for wooden houses, steel-reinforced concrete houses, reinforced concrete houses, and steel-framed houses, respectively [48]. The CO2 emissions per floor area were 195 kg-CO2/m2, 1109 kg-CO2/m2, 857 kg-CO2/m2, and 803 kg-CO2/m2 for wooden houses, steel-reinforced concrete houses, reinforced concrete houses, and steel-framed houses, respectively. Bahramian and Yetilmezsoy (2020) reviewed studies on environmental impacts in the building industry published between 1997 and 2018 and found that CO2 emissions per floor area of buildings ranged from 0.07 kg-CO2/m2 to 35,765 kg-CO2/m2 [9]. Considering that this included values from analytical methods other than input–output-based analysis and that the values reported using process-based LCA and hybrid LCA exceeded those reported using the input–output table, the values determined in our study are considered appropriate.
Figure 3.
CO2 emissions from houses per floor area by construction method (2015).
5.2. Breakdown of CO2 Emissions by Construction Method
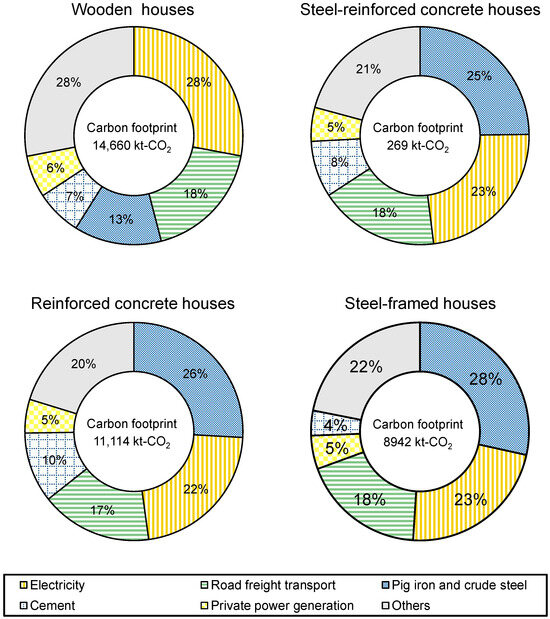
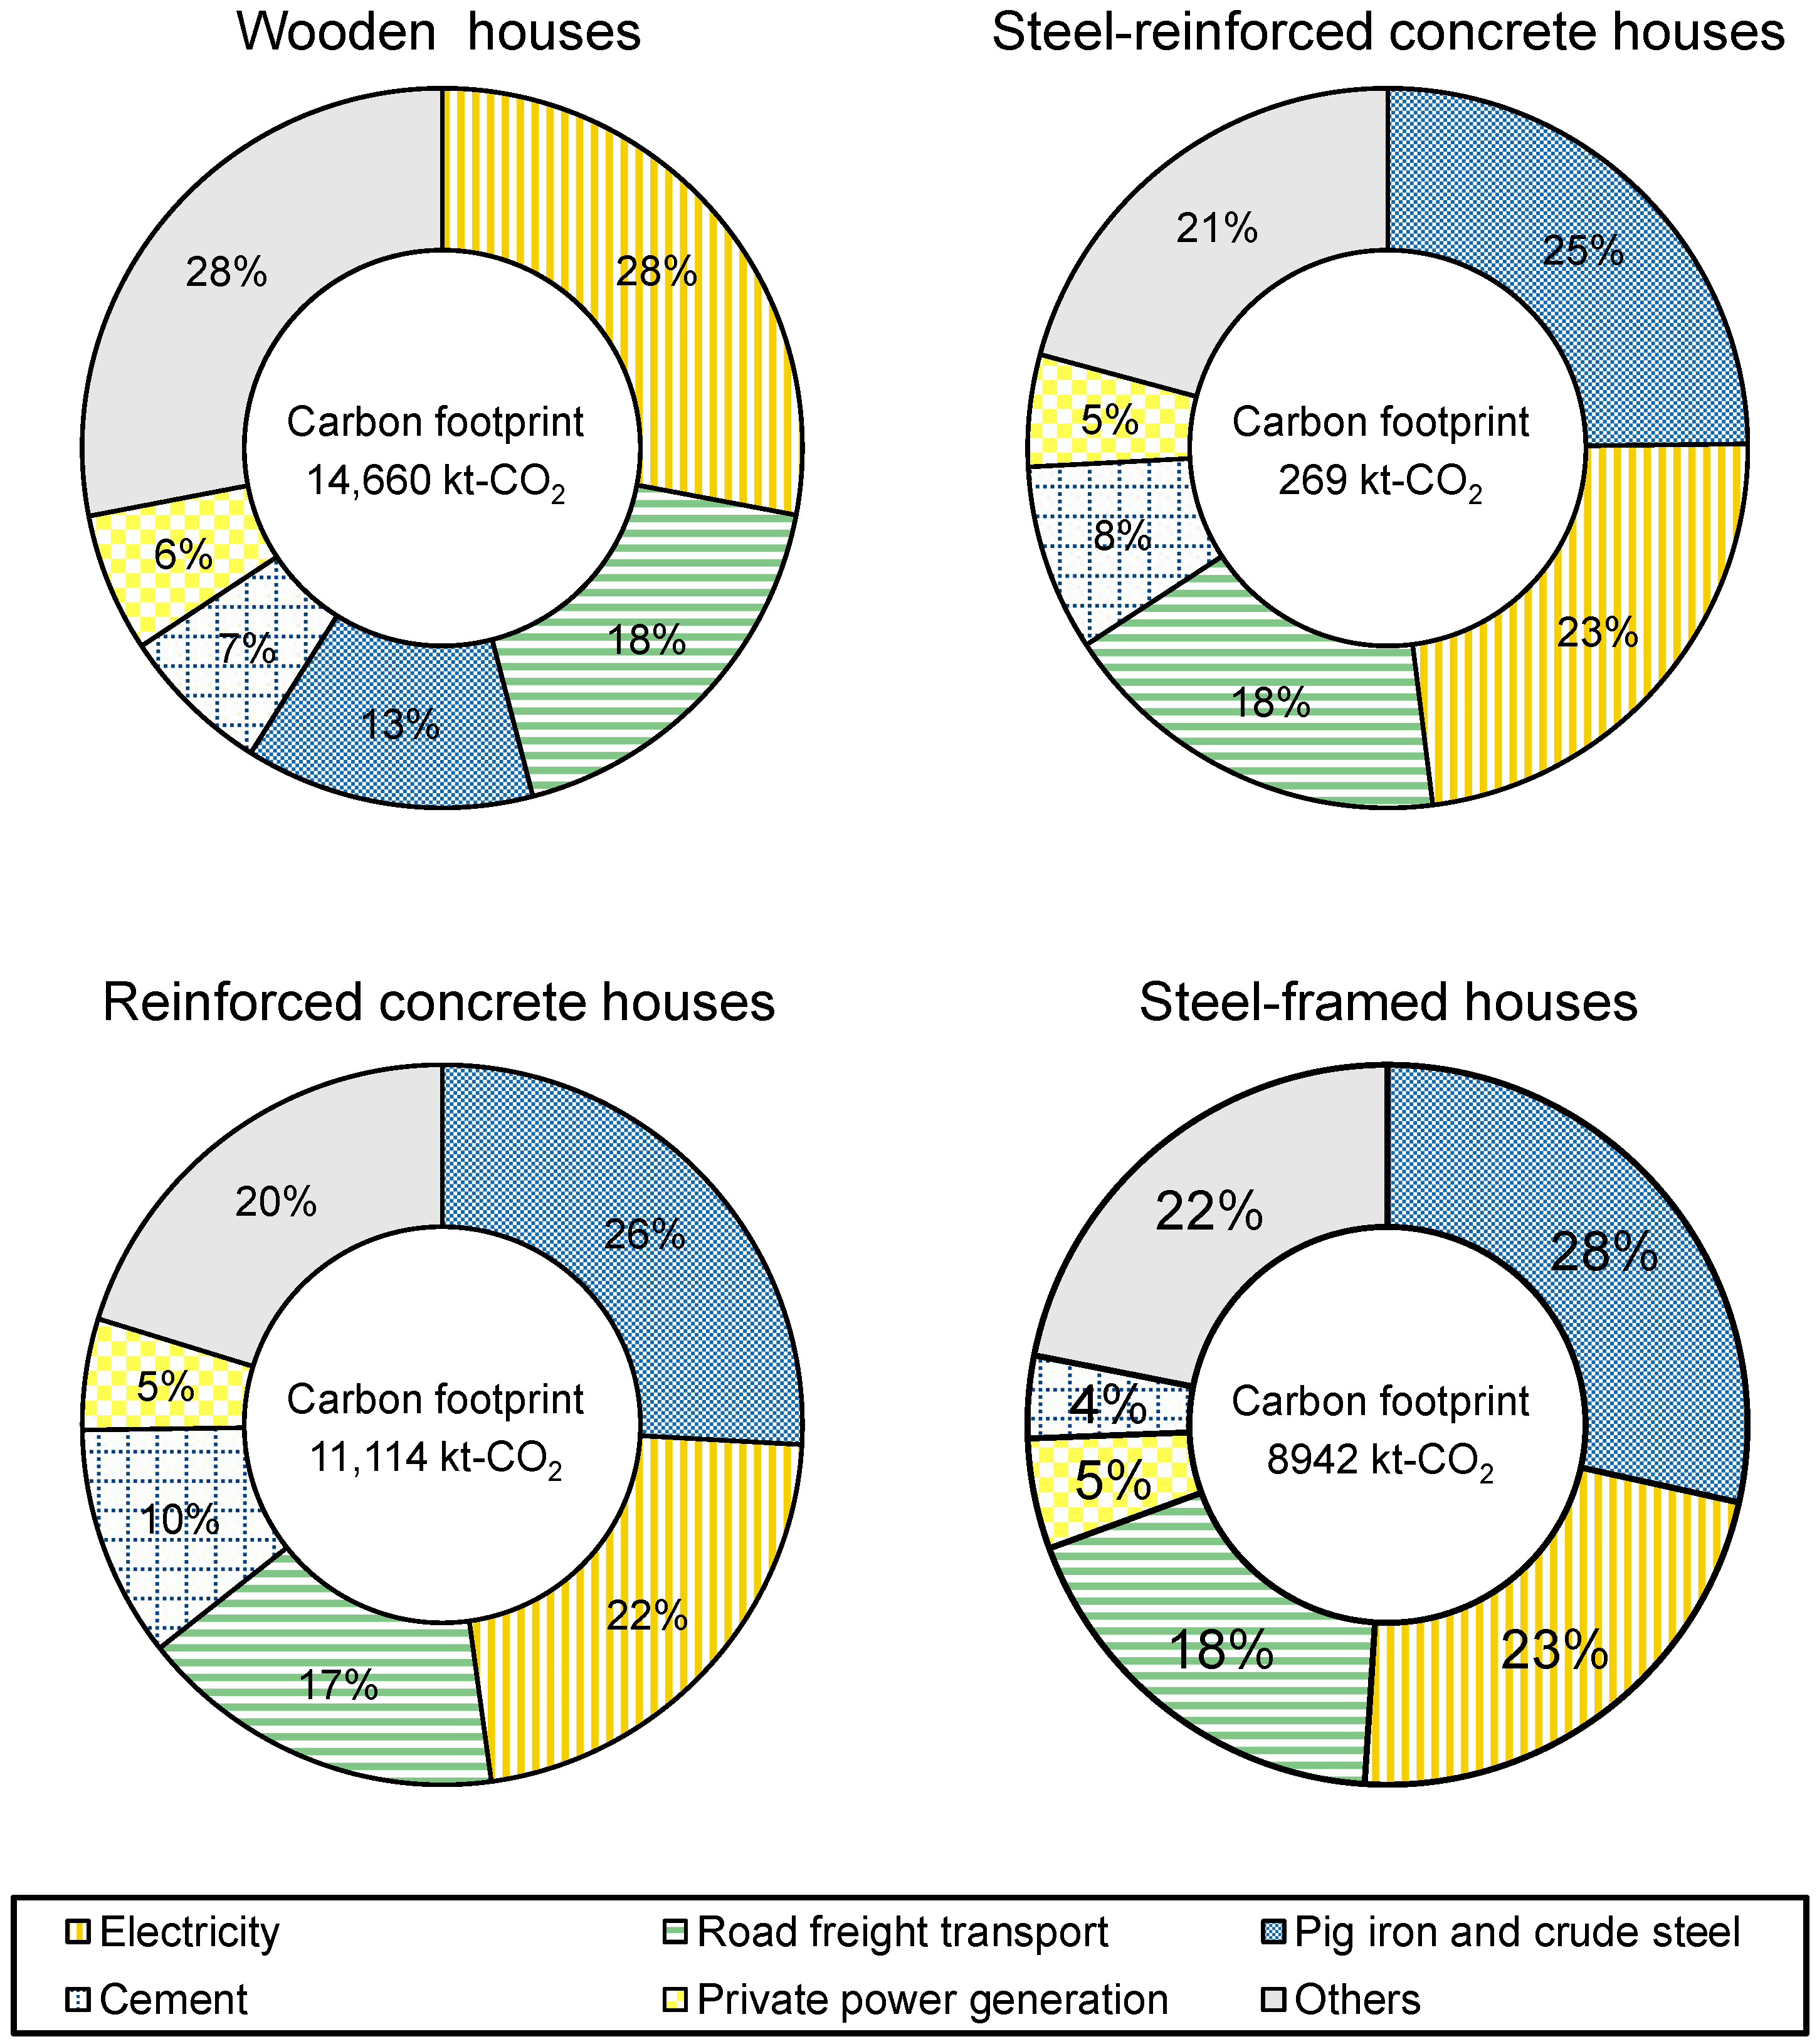
Figure 4 shows a breakdown of the top five sectors contributing to the carbon footprint of houses for each construction method. For all construction methods, the carbon footprints of the top five sectors, out of a total of 217 sectors, accounted for more than 70% of the total carbon footprint. Among steel-reinforced concrete houses, reinforced concrete houses, and steel-framed houses, where steel and rebar are primarily used as the framework, the proportion of the carbon footprint attributable to the pig iron and crude steel sectors was the highest, accounting for more than 25%.
Figure 4.
Breakdown of the top five sectors contributing to the carbon footprint from houses by construction method (2015).
Additionally, the carbon footprint of the cement sector in steel-reinforced concrete houses and reinforced concrete houses exceeded that of the private power-generation sector. Steel-reinforced concrete houses and reinforced concrete houses are associated with construction methods that achieve excellent durability by combining rebar (which is strong in tension) with concrete (which is strong in compression). Therefore, compared to other construction methods, the use of cement, an essential material for concrete, has a greater impact on the carbon footprint. Furthermore, the direct CO2 emissions per gross output in the cement sector were 38 t-CO2/million JPY, which was the highest among the 217 sectors. This suggested that the cement sector, which is carbon-intensive, contributed significantly to the high CO2 emissions per floor area of steel-reinforced concrete houses and reinforced concrete houses (Figure 3).
5.3. Analysis of CO2 Emissions by Construction Method and Number of Floors
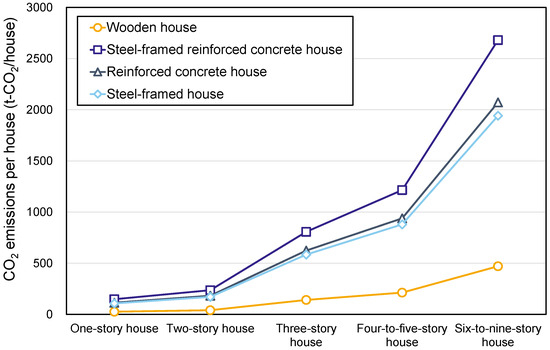
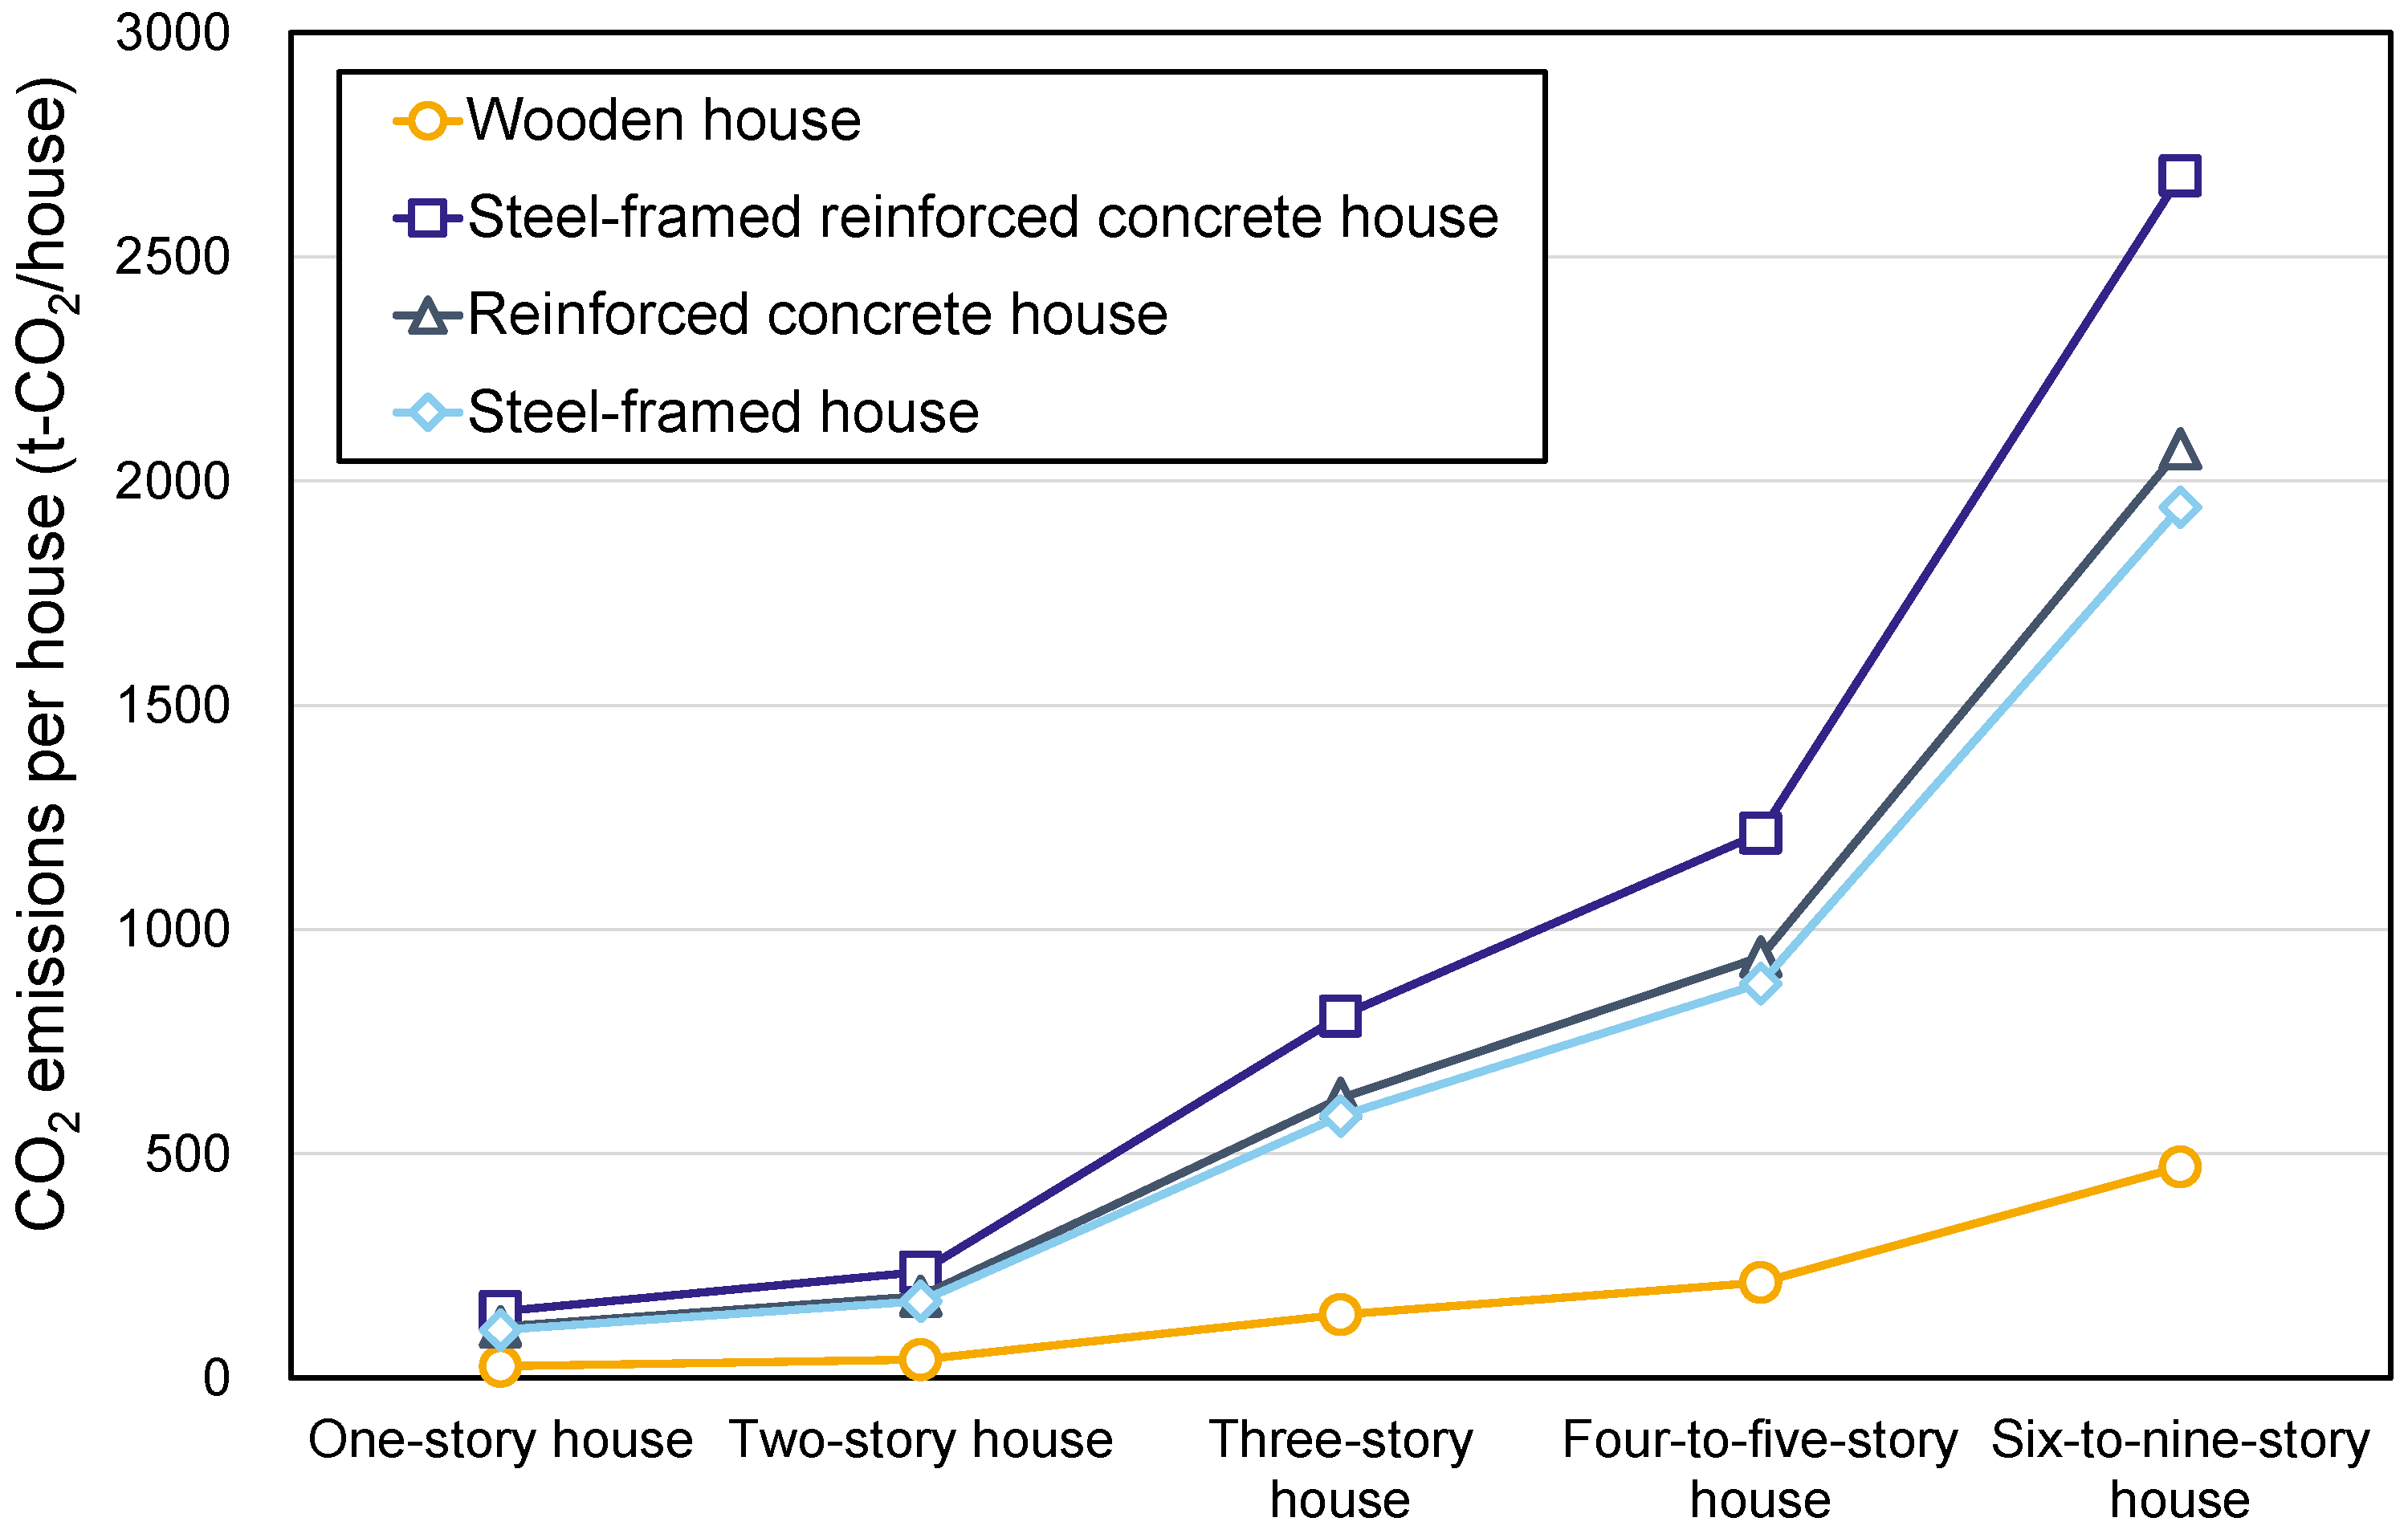
We analyzed the CO2 emissions based on the number of floors in a house, using the CO2 emissions by construction method as a reference. The average total floor area per house, by number of floors, for newly built houses in Japan in 2015 was 134 m2/house for one-story houses, 213 m2/house for two-story houses, 728 m2/house for three-story houses, 1095 m2/house for four-to-five-story houses, and 2417 m2/house for six-to-nine-story houses [48]. By multiplying the CO2 emissions per floor area of houses by construction method (Figure 3) and the total floor area per average house by number of floors, we estimated the average CO2 emissions per house by construction method and number of floors. The CO2 emissions per average house, by number of floors, for each construction method are shown in Figure 5.
Figure 5.
Average CO2 emissions per house by construction method and number of floors (2015). These values are calculated by multiplying the CO2 emissions per unit of floor area by the national average total floor area per house for each height category.
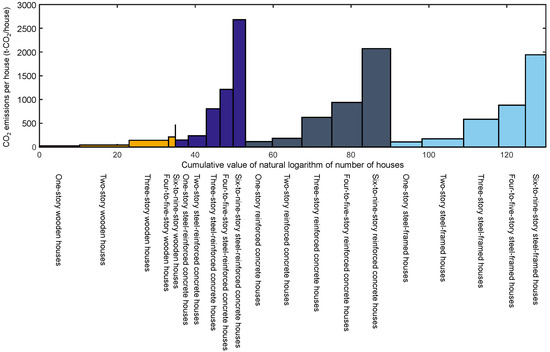
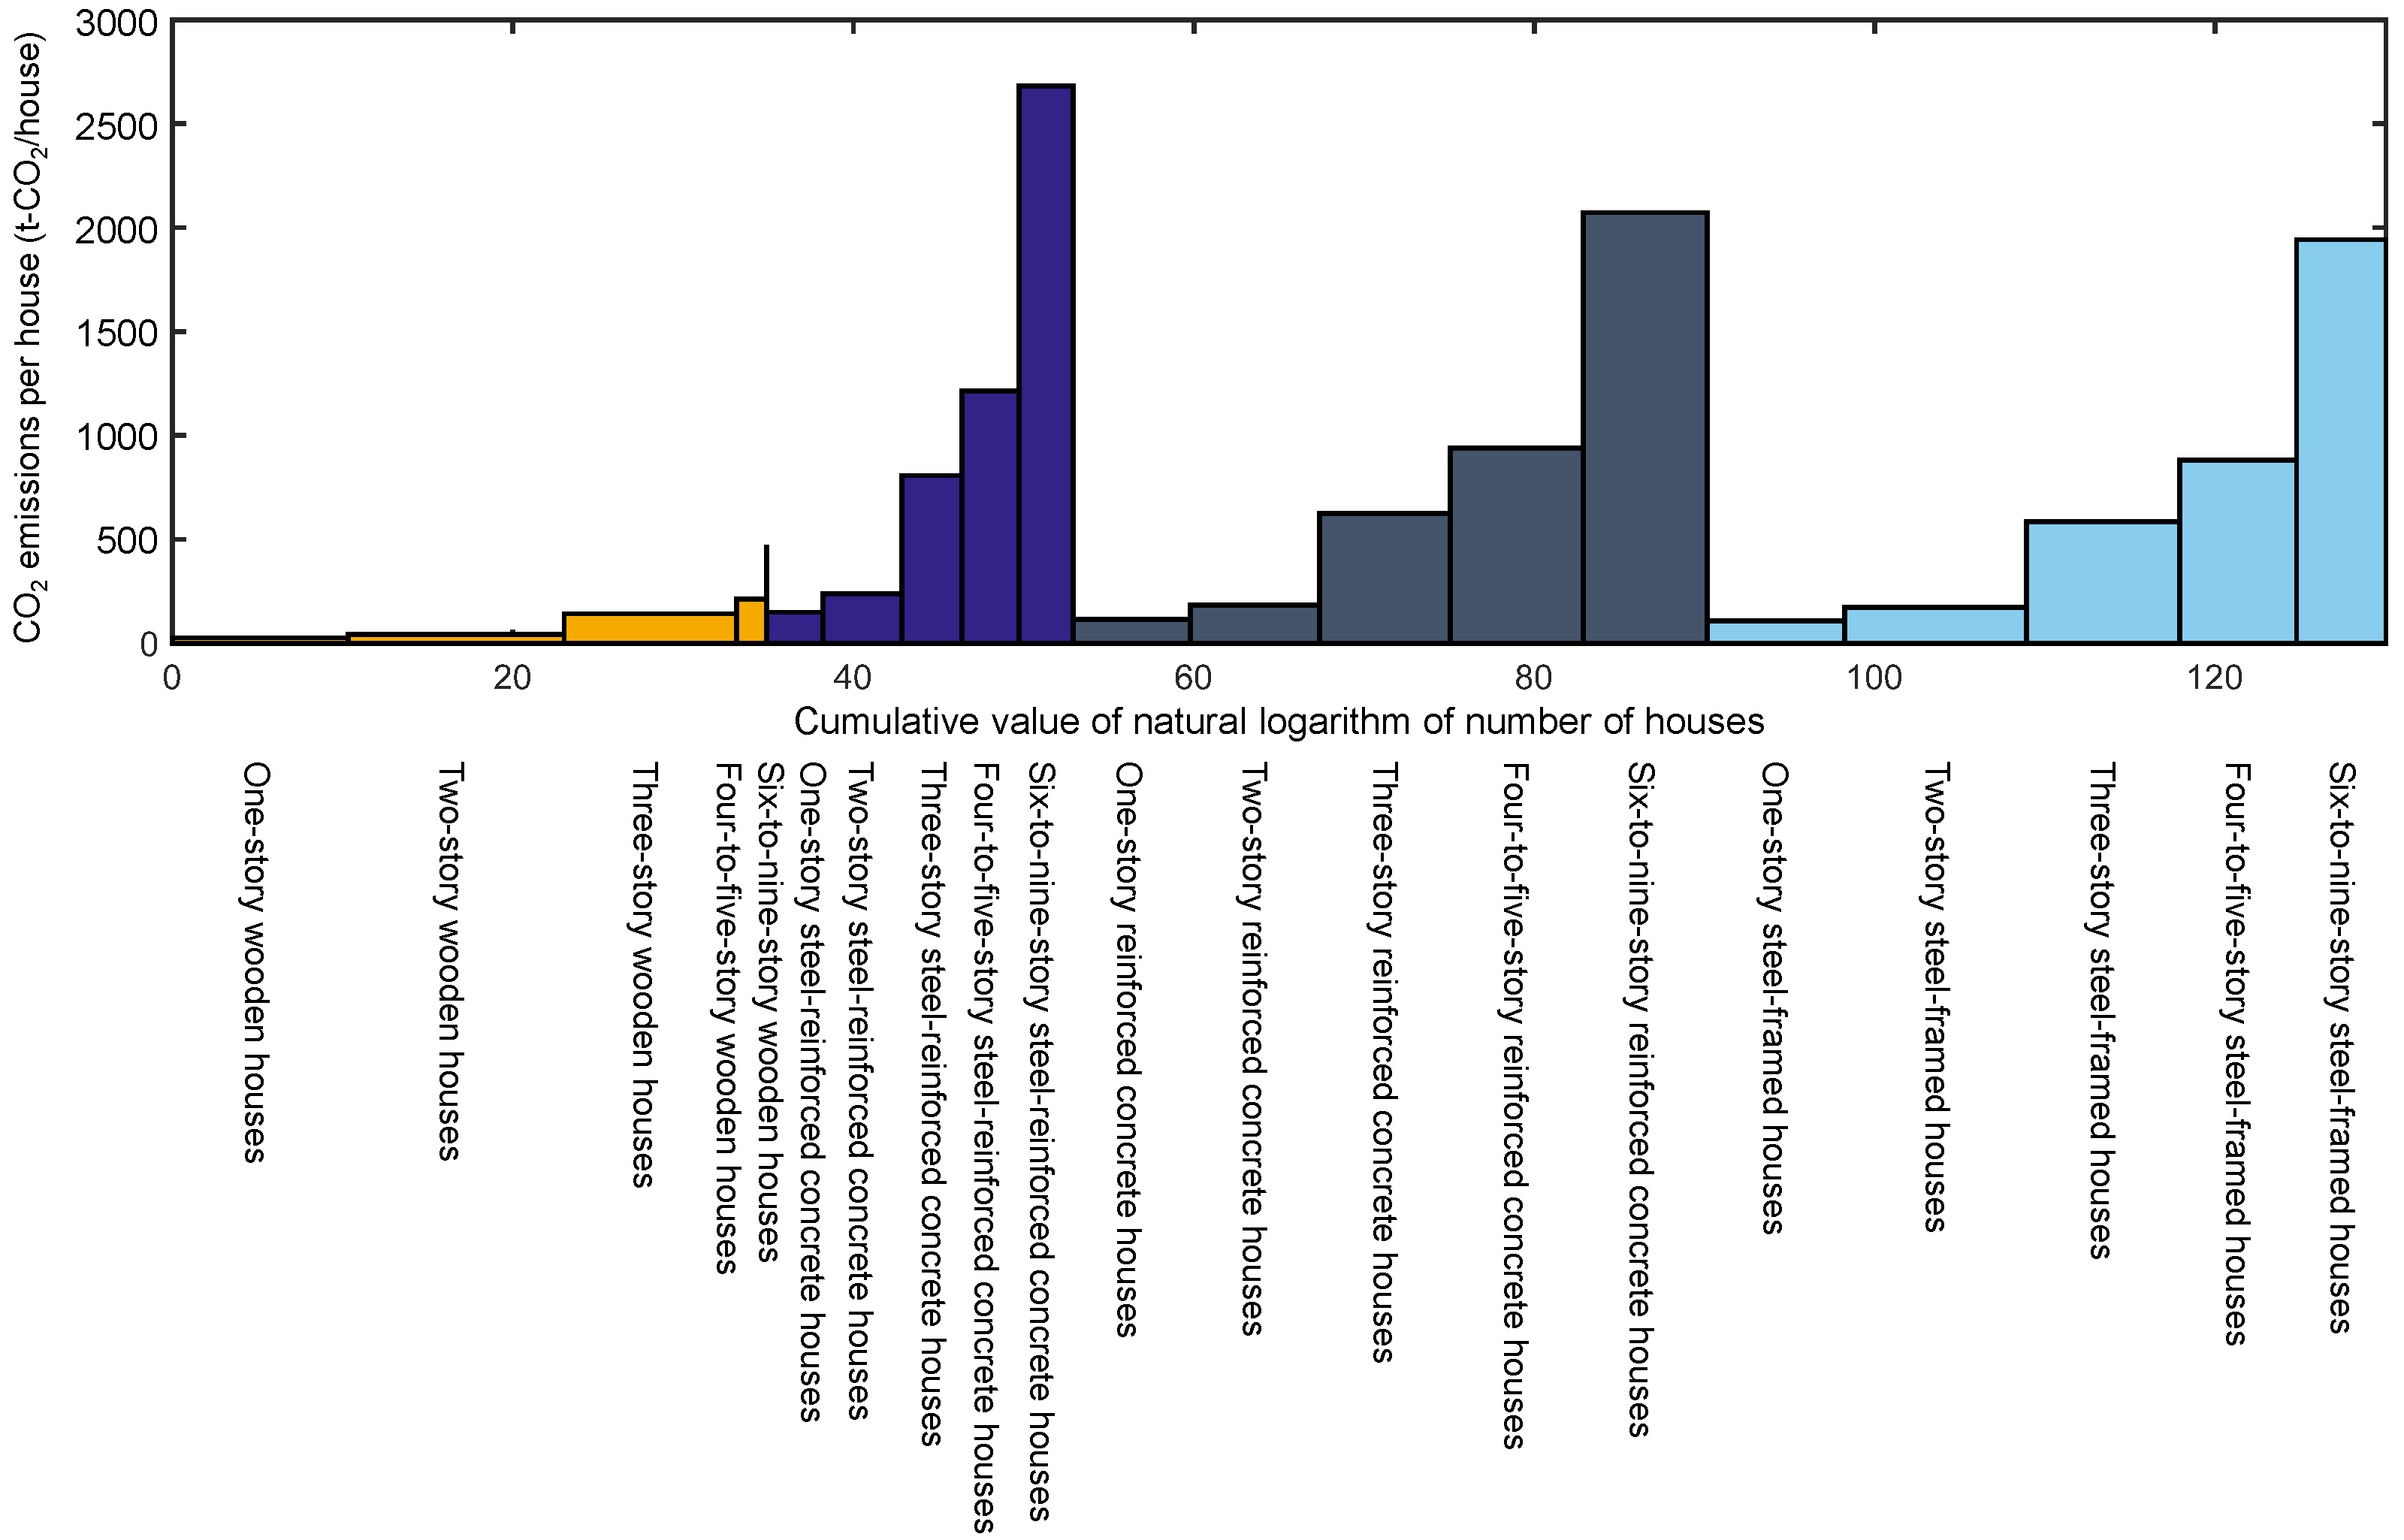
Figure 6 shows a skyline chart of the CO2 emissions from houses by construction method and number of floors. The vertical axis shows the average CO2 emissions per house for each construction method and number of floors, while the horizontal axis shows the cumulative values scaled by the natural logarithm of the number of houses for which building started in 2015. Because the scale of the data for the number of houses varied significantly, comparisons would be difficult. There was a large value of 320,000 and a very small value of 1, and if these values were plotted directly on a chart, extreme visual differences would make comparisons challenging. To address this issue, the data were transformed using the natural logarithm to compress the range of values and improve the visual clarity. From left to right, the bars are arranged in the order of one-story wooden houses, two-story wooden houses, three-story wooden houses, four-to-five-story wooden houses, and six-to-nine-story wooden houses, followed by bars for steel-reinforced concrete houses, reinforced concrete houses, and steel-framed houses, according to the same classification by number of floors. For houses between one and three stories tall, one-story wooden houses, two-story wooden houses, and three-story wooden houses emitted the most CO2. These three house types accounted for 45% of the CO2 emissions from all houses. Figure 6 shows that the bars for these three types of houses were horizontally longer, indicating that, while the CO2 emissions per house were smaller than those of other construction methods, the number of these houses was larger, contributing to higher total CO2 emissions.
Figure 6.
Skyline chart showing the contribution of residential buildings to total CO2 emissions by construction method and number of floors in Japan (2015). The vertical axis shows the average embodied CO2 emissions per house (t-CO2/house), while the horizontal axis represents the cumulative value scaled by the natural logarithm of the number of houses for each category. Each bar, therefore, reflects both emission intensity per house (height) and the relative number of houses constructed (width). Low-rise wooden houses contribute substantially to total emissions due to their large construction volume, whereas mid- to high-rise reinforced concrete houses show higher emissions per house, leading to a dominant contribution despite fewer buildings. The colors correspond to different construction materials: orange bars represent wooden structures; dark blue bars represent steel-framed structures; grey bars represent reinforced concrete structures; and light blue bars represent steel-reinforced concrete structures.
For houses between four and nine stories tall, the highest CO2 emissions came from four-to-five-story reinforced concrete houses and six-to-nine-story reinforced concrete houses, which together accounted for 14% of the total CO2 emissions from all houses. Figure 6 shows that the bars for these houses were longer vertically, indicating that both a larger number of houses and higher CO2 emissions per house contributed to the higher total CO2 emissions.
In summary, the results demonstrate distinct characteristics in the carbon footprint of Japanese residential buildings. Wooden houses exhibit the lowest net CO2 emissions per unit of floor area (195 kg-CO2/m2), benefiting significantly from carbon storage. In contrast, non-wooden structures show much higher emission intensities (e.g., 1109 kg-CO2/m2 for steel-reinforced concrete) driven by carbon-intensive sectors such as pig iron and cement. Furthermore, the skyline chart analysis reveals a structural divergence: total emissions in one- to three-story buildings are driven by the sheer volume of wooden housing starts, whereas emissions in four- to nine-story buildings are driven by the high carbon intensity of reinforced concrete structures.
6. Discussion
6.1. Policy Implications
The findings of this study highlight the critical need to promote wooden construction to reduce greenhouse gas emissions in the residential sector. Currently, Japan’s tallest pure wooden building is an 11-story structure completed in 2022, with an 18-story project scheduled for 2026 [49,50]. However, ensuring the widespread adoption of such mid- to high-rise wooden structures faces strict regulatory and technical challenges, particularly regarding fire resistance and seismic resilience. To overcome these barriers, government agencies should enhance support through R&D funding and demonstration projects for advanced timber technologies, such as Cross-Laminated Timber (CLT). Updating design guidelines to embed performance-based standards is also essential.
Furthermore, beyond regulatory and technical support, policy measures must also target the entire construction supply chain to foster market demand, with a specific focus on expanding the adoption of mid- to high-rise wooden structures. Economic incentives—such as tax credits, accelerated depreciation, or subsidies—should be directed toward manufacturers of low-emission materials and developers implementing certified low-carbon practices. Simultaneously, construction companies should actively communicate the environmental performance and safety of modern wooden architecture to foster consumer acceptance. Implementing a “green procurement” evaluation system for public and private projects would further encourage builders to select environmentally friendly suppliers, creating a stable market for high-performance wooden materials.
Finally, regarding non-wooden construction, policies must focus on reducing emissions along the entire supply chain of carbon-intensive materials. Rather than promoting specific technologies, policy support should prioritize R&D and deployment pathways that demonstrably achieve net emission reductions when assessed across the full life cycle and upstream supply chains of steel and cement production. This includes evaluation frameworks that explicitly account for potential burden shifting across regions and sectors, alongside carbon pricing mechanisms that internalize upstream emissions. At the international level, harmonizing embodied carbon assessment methods and promoting the transparent exchange of best practices can help ensure that low-carbon material strategies deliver verifiable mitigation outcomes beyond the Japanese context, aligning national climate goals with global industry standards.
6.2. Limitations and Future Research
This study has several limitations that should be acknowledged and addressed in future research. First, because this study relies on Japan’s national input–output tables, the analysis represents an “average” residential building for each construction method and does not capture regional heterogeneity. Differences in local construction practices, climatic conditions, or regional supply chains are therefore averaged out. In addition, the geographical origins of imported materials cannot be explicitly identified within the single-region input–output framework. Applying global or multi-regional input–output tables would enable a more geographically nuanced assessment of embodied CO2 emissions and international supply-chain dependencies.
Second, due to data classification constraints, residential buildings with four or more floors were treated as aggregated categories, limiting the ability to distinguish emissions by more detailed height classes. Moreover, variations in CO2 emissions across building heights were primarily attributed to differences in total floor area, without explicitly accounting for height-related changes in material requirements, structural systems, or construction methods. In practice, taller buildings often require additional structural reinforcement, different load-bearing systems, and altered material compositions, which may increase embodied emissions per unit floor area. Owing to the aggregated nature of the input–output data, such design-level differences could not be explicitly modeled in this study. Future research should incorporate more detailed material input data based on architectural and structural design specifications, potentially at the bill-of-materials or detailed construction drawing level, to better capture the complex relationship between building height, construction methods, and embodied carbon emissions.
Third, this study’s treatment of carbon storage in wooden buildings represents another important limitation. While carbon stored in wood products contributes to temporary carbon sequestration, the analysis does not explicitly account for potential carbon release at the end-of-life stage, such as through demolition, incineration, or decay. Consequently, the carbon storage effect discussed here should be interpreted as time-limited rather than permanent mitigation. From a climate-policy perspective, the net mitigation benefit of wooden buildings depends on assumptions regarding building lifespan, end-of-life treatment, and material reuse or recycling. Future research should adopt dynamic life-cycle perspectives that explicitly consider carbon release pathways and timing.
Fourth, this study focuses exclusively on embodied CO2 emissions associated with the construction stage and does not consider emissions during the operational stage. Operational energy use can vary substantially depending on building design, insulation performance, occupant behavior, and energy systems [51]. Consequently, the total life-cycle carbon performance of residential buildings cannot be fully evaluated based on construction-stage emissions alone. Nevertheless, the primary objective of this study was to isolate and compare embodied carbon impacts attributable to construction methods and building height using a consistent national-scale framework. Future research should aim to integrate operational-stage emissions with embodied emissions, potentially through hybrid approaches combining EEIOA with building energy simulation models.
Finally, the international applicability of the findings should be interpreted with caution. This study reflects Japan’s construction practices, industrial structure, and material supply chains, where wooden construction is relatively common and supported by domestic forestry resources. Nevertheless, the underlying mechanisms identified in this study—namely, the lower embodied emissions of wood-based construction relative to mineral-based materials and the role of carbon storage—have also been observed in Europe and North America [13,14,15,16,17]. Therefore, while the absolute emission values reported here are Japan-specific, the relative trends and the EEIOA-based analytical framework are broadly applicable. Moreover, considering Japan’s strict seismic building codes, which necessitate robust structural materials, the finding that wooden structures maintain a significant carbon advantage provides a compelling reference for other earthquake-prone regions aiming to decarbonize their housing sectors. Future research could enhance international comparability by applying the same framework to multi-regional input–output tables or through harmonized cross-country analyses.
7. Conclusions
This study employed EEIOA to estimate CO2 emissions from house construction using four different construction methods in Japan. The results demonstrated that wooden houses achieved the lowest net CO2 emissions per unit of floor area (195 kg-CO2/m2) due to the carbon storage effect. In contrast, steel-reinforced concrete houses exhibited the highest emissions (1109 kg-CO2/m2). The analysis by building height revealed a structural divergence: wooden houses dominated emissions in the low-rise segment (one- to three-story) due to their large supply volume, whereas reinforced concrete houses were the primary emitters in the mid- to high-rise segment (four- to nine-story) due to their high carbon intensity. These findings provide quantitative evidence supporting the promotion of timber construction, particularly in taller buildings, alongside the decarbonization of the concrete and steel supply chains, as essential strategies for achieving Japan’s net-zero targets.
Author Contributions
Conceptualization, A.N. and S.K.; methodology, A.N., S.M. and S.K.; validation, A.N., S.M. and S.K.; formal analysis, A.N. and S.K.; investigation, A.N.; data curation, A.N. and S.M.; writing—original draft preparation, A.N.; writing—review and editing, S.M. and S.K.; visualization, A.N.; supervision, S.K.; project administration, S.K.; funding acquisition, S.K. All authors have read and agreed to the published version of the manuscript.
Funding
This work was supported by JST SPRING, Japan Grant Number JPMJSP2136.
Data Availability Statement
The input–output database is available as material information on the open data site: https://doi.org/10.5281/zenodo.18382989 (accessed on 28 January 2026).
Conflicts of Interest
The authors declare no conflicts of interest.
References
- IEA. Net Zero by 2050; IEA: Paris, France, 2021. [Google Scholar]
- Ministry of Land, Infrastructure, Transport and Tourism. Overview of the FY2022 Revised Energy Conservation Act for Buildings. 2023. Available online: https://www.mlit.go.jp/jutakukentiku/house/shouenehou_r4.html (accessed on 24 November 2024). (In Japanese)
- Ibn-Mohammed, T.; Greenough, R.; Taylor, S.; Ozawa-Meida, L.; Acquaye, A. Operational vs. embodied emissions in buildings—A review of current trends. Energy Build. 2013, 66, 232–245. [Google Scholar] [CrossRef] [Scilit]
- Röck, M.; Saade, M.R.M.; Balouktsi, M.; Rasmussen, F.N.; Birgisdottir, H.; Frischknecht, R.; Habert, G.; Lützkendorf, T.; Passer, A. Embodied GHG emissions of buildings—The hidden challenge for effective climate change mitigation. Appl. Energy 2020, 258, 114107. [Google Scholar] [CrossRef] [Scilit]
- Forestry Agency. Act for Promotion of Use of Wood in Buildings to Contribute to the Realization of a Carbon-Neutral Society. 2026. Available online: https://www.rinya.maff.go.jp/j/riyou/koukyou/ (accessed on 24 January 2026). (In Japanese)
- Ministry of Land, Infrastructure, Transport and Tourism. Statistics on Building Construction Started in 2023. 2024. Available online: https://www.e-stat.go.jp/stat-search/files?page=1&layout=datalist&toukei=00600120&tstat=000001016965&cycle=7&year=20230&month=0&result_back=1&tclass1val=0 (accessed on 28 January 2026). (In Japanese)
- Onat, N.C.; Kucukvar, M.; Tatari, O. Scope-based carbon footprint analysis of U.S. residential and commercial buildings: An input-output hybrid life cycle assessment approach. Build. Environ. 2014, 72, 53–62. [Google Scholar] [CrossRef] [Scilit]
- Zhang, X.; Wang, F. Hybrid input-output analysis for life-cycle energy consumption and carbon emissions of China’s building sector. Build. Environ. 2016, 104, 188–197. [Google Scholar] [CrossRef] [Scilit]
- Bahramian, M.; Yetilmezsoy, K. Life cycle assessment of the building industry: An overview of two decades of research (1995–2018). Energy Build. 2020, 219, 109917. [Google Scholar] [CrossRef] [Scilit]
- Onat, N.C.; Kucukvar, M. Carbon footprint of construction industry: A global review and supply chain analysis. Renew. Sustain. Energy Rev. 2020, 124, 109783. [Google Scholar] [CrossRef] [Scilit]
- Mithraratne, N.; Vale, B. Life cycle analysis model for New Zealand houses. Build. Environ. 2004, 39, 483–492. [Google Scholar] [CrossRef] [Scilit]
- Gustavsson, L.; Joelsson, A. Life cycle primary energy analysis of residential buildings. Energy Build. 2010, 42, 210–220. [Google Scholar] [CrossRef] [Scilit]
- Gustavsson, L.; Joelsson, A.; Sathre, R. Life cycle primary energy use and carbon emission of an eight-storey wood-framed apartment building. Energy Build. 2010, 42, 230–242. [Google Scholar] [CrossRef] [Scilit]
- Monahan, J.; Powell, J.C. An embodied carbon and energy analysis of modern methods of construction in housing: A case study using a lifecycle assessment framework. Energy Build. 2011, 43, 179–188. [Google Scholar] [CrossRef] [Scilit]
- Passer, A.; Kreiner, H.; Maydl, P. Assessment of the environmental performance of buildings: A critical evaluation of the influence of technical building equipment on residential buildings. Int. J. Life Cycle Assess. 2012, 17, 1116–1130. [Google Scholar] [CrossRef] [Scilit]
- Petrovic, B.; Myhren, J.A.; Zhang, X.; Wallhagen, M.; Eriksson, O. Life cycle assessment of a wooden single-family house in Sweden. Appl. Energy 2019, 251, 113253. [Google Scholar] [CrossRef] [Scilit]
- Upton, B.; Miner, R.; Spinney, M.; Heath, L.S. The greenhouse gas and energy impacts of using wood instead of alternatives in residential construction in the United States. Biomass Bioenergy 2008, 32, 1–10. [Google Scholar] [CrossRef] [Scilit]
- Salazar, J.; Meil, J. Prospects for carbon-neutral housing: The influence of greater wood use on the carbon footprint of a single-family residence. J. Clean. Prod. 2009, 17, 1563–1571. [Google Scholar] [CrossRef] [Scilit]
- Bolin, C.A.; Smith, S.T. Life cycle assessment of borate-treated lumber with comparison to galvanized steel framing. J. Clean. Prod. 2011, 19, 630–639. [Google Scholar] [CrossRef] [Scilit]
- Gustavsson, L.; Sathre, R. Energy and CO2 analysis of wood substitution in construction. Clim. Change 2011, 105, 129–153. [Google Scholar] [CrossRef] [Scilit]
- Pierobon, F.; Huang, M.; Simonen, K.; Ganguly, I. Environmental benefits of using hybrid CLT structure in midrise non-residential construction: An LCA based comparative case study in the U.S. J. Build. Eng. 2019, 26, 100862. [Google Scholar] [CrossRef] [Scilit]
- Jayalath, A.; Navaratnam, S.; Ngo, T.; Mendis, P.; Hewson, N.; Aye, L. Life cycle performance of Cross Laminated Timber mid-rise residential buildings in Australia. Energy Build. 2020, 223, 110091. [Google Scholar] [CrossRef] [Scilit]
- Nakano, K.; Koide, M.; Yamada, Y.; Ogawa, T.; Hattori, N. Environmental impacts of structural lumber production in Japan. J. Wood Sci. 2024, 70, 4. [Google Scholar] [CrossRef] [Scilit]
- Crawford, R.H.; Bontinck, P.A.; Stephan, A.; Wiedmann, T.; Yu, M. Hybrid life cycle inventory methods—A review. J. Clean. Prod. 2018, 172, 1273–1288. [Google Scholar] [CrossRef] [Scilit]
- Dixit, M.K.; Culp, C.H.; Fernandez-Solis, J.L. System boundary for embodied energy in buildings: A conceptual model for definition. Renew. Sustain. Energy Rev. 2013, 21, 153–164. [Google Scholar] [CrossRef] [Scilit]
- Gerilla, G.P.; Teknomo, K.; Hokao, K. An environmental assessment of wood and steel reinforced concrete housing construction. Build. Environ. 2007, 42, 2778–2784. [Google Scholar] [CrossRef] [Scilit]
- Stephan, A.; Crawford, R.H.; De Myttenaere, K. Towards a comprehensive life cycle energy analysis framework for residential buildings. Energy Build. 2012, 55, 592–600. [Google Scholar] [CrossRef] [Scilit]
- Suzuki, M.; Oka, T.; Okada, K. The estimation of energy consumption and CO2 emission due to housing construction in Japan. Energy Build. 1995, 22, 165–169. [Google Scholar] [CrossRef] [Scilit]
- Imada, S.; Maeno, K.; Kagawa, S. CO2 emission hotspots analysis on supply chains for wooden houses in Japan. J. Environ. Manage. 2024, 353, 120151. [Google Scholar] [CrossRef] [Scilit] [PubMed]
- Hou, H.; Feng, X.; Zhang, Y.; Bai, H.; Ji, Y.; Xu, H. Energy-related carbon emissions mitigation potential for the construction sector in China. Environ. Impact Assess. Rev. 2021, 89, 106599. [Google Scholar] [CrossRef] [Scilit]
- Kucukvar, M.; Tatari, O. Towards a triple bottom-line sustainability assessment of the U.S. construction industry. Int. J. Life Cycle Assess. 2013, 18, 958–972. [Google Scholar] [CrossRef] [Scilit]
- Man, Y.; Thomas, W.; Robert, C.; Catriona, T. The carbon footprint of Australia’s construction sector. Procedia Eng. 2017, 180, 211–220. [Google Scholar]
- Nässén, J.; Holmberg, J.; Wadeskog, A.; Nyman, M. Direct and indirect energy use and carbon emissions in the production phase of buildings: An input–output analysis. Energy 2007, 32, 1593–1602. [Google Scholar] [CrossRef] [Scilit]
- Acquaye, A.A.; Duffy, A.P. Input–output analysis of Irish construction sector greenhouse gas emissions. Build. Environ. 2010, 45, 784–791. [Google Scholar] [CrossRef] [Scilit]
- Hung, C.C.W.; Hsu, S.; Cheng, K. Quantifying city-scale carbon emissions of the construction sector based on multi-regional input-output analysis. Resour. Conserv. Recycl. 2019, 149, 75–85. [Google Scholar] [CrossRef] [Scilit]
- Huang, L.; Krigsvoll, G.; Johansen, F.; Liu, Y.; Zhang, X. Carbon emission of global construction sector. Renew. Sustain. Energy Rev. 2018, 81, 1906–1916. [Google Scholar] [CrossRef] [Scilit]
- Miller, R.E.; Blair, P.D. Input–Output Analysis: Foundations and Extensions; Cambridge University Press: Cambridge, UK, 2009. [Google Scholar]
- Leontief, W. Input-Output Economics; Oxford University Press: Oxford, UK, 1986. [Google Scholar]
- Suh, S. Handbook of Input-Output Economics in Industrial Ecology (Eco-Efficiency in Industry and Science, 23); Springer: Berlin/Heidelberg, Germany, 2010. [Google Scholar]
- Ministry of Agriculture, Forestry and Fisheries. Guidelines for Carbon Storage Labeling in Wood Utilized for Building Construction. 2021. Available online: https://www.rinya.maff.go.jp/j/mokusan/mieruka.html (accessed on 24 November 2024). (In Japanese)
- Ministry of Internal Affairs and Communications. Input-Output Table in 2015. 2019. Available online: https://www.soumu.go.jp/toukei_toukatsu/data/io/ (accessed on 24 November 2024). (In Japanese)
- Ministry of Land, Infrastructure, Transport and Tourism. Input-Output Table for Analysis of Construction Sectors in 2015. 2020. Available online: https://www.mlit.go.jp/sogoseisaku/jouhouka/sosei_jouhouka_tk4_000020.html (accessed on 24 November 2024). (In Japanese)
- Ministry of Land, Infrastructure, Transport and Tourism. Standards for Planning and Design in Wood Construction. 2017. Available online: https://www.mlit.go.jp/gobuild/mokuzai_torikumi/dounyuu4-2.pdf (accessed on 24 November 2024). (In Japanese)
- Martin, R.A.; Doraisami, M.; Thomas, C.S. Global patterns in wood carbon concentration across the world’s trees and forests. Nat. Geosci. 2018, 11, 915–920. [Google Scholar] [CrossRef] [Scilit]
- Matsushima, S.; Kagawa, S.; Nansai, K.; Xue, J. A comparison of deflation methods for carbon footprint calculations using Japanese data. Econ. Syst. Res. 2024, 36, 337–352. [Google Scholar] [CrossRef] [Scilit]
- Nansai, K. Embodied Energy and Emission Intensity Data for Japan Using Input–Output Tables (3EID), National Institute for Environmental Studies, Japan, 2019. Available online: http://www.cger.nies.go.jp/publications/report/d031/index.html (accessed on 24 November 2024).
- Nansai, K.; Fry, J.; Malik, A.; Kondo, N. Carbon footprint of Japanese health care services from 2011 to 2015. Resour. Conserv. Recycl. 2020, 152, 104525. [Google Scholar] [CrossRef] [Scilit]
- Ministry of Land, Infrastructure, Transport and Tourism. Statistics on Building Construction Started in 2015. 2016. Available online: https://www.e-stat.go.jp/stat-search/files?page=1&layout=datalist&toukei=00600120&tstat=000001016965&cycle=7&year=20150&month=0&result_back=1&tclass1val=0 (accessed on 28 January 2026). (In Japanese)
- Mitsui Fudosan. Sustainability Report 2024; Mitsui Fudosan: Tokyo, Japan, 2024; Available online: https://www.mitsuifudosan.co.jp/english/esg_csr/backnumber/ (accessed on 11 December 2024).
- Obayashi Corporation. Obayashi Corporate Report 2022. 2022. Available online: https://ir.obayashi.co.jp/en/ir/data/report.html (accessed on 11 December 2024).
- Lukić, N.; Jurišević, N.; Nikolić, N.; Gordić, D. Specific heating consumption in the residential sector of Serbia—Example of the city of Kragujevac. Energy Build. 2015, 107, 163–171. [Google Scholar] [CrossRef] [Scilit]
Disclaimer/Publisher’s Note: The statements, opinions and data contained in all publications are solely those of the individual author(s) and contributor(s) and not of MDPI and/or the editor(s). MDPI and/or the editor(s) disclaim responsibility for any injury to people or property resulting from any ideas, methods, instructions or products referred to in the content. |
© 2026 by the authors. Licensee MDPI, Basel, Switzerland. This article is an open access article distributed under the terms and conditions of the Creative Commons Attribution (CC BY) license.