


Abstract
This study investigates the crucial role energy leaders play in driving strategic energy management (SEM) and accelerating cost savings within a manufacturing organization and consequently, the industrial sector. Whereas energy efficiency can be seen as an innovative business practice with irrefutable cost benefits, its effective implementation requires strategic leadership and a structured approach. This research analyzes data collected from 120 participants representing 71 companies attending the Energy Bootcamp events organized by the U.S. Department of Energy’s (DOE) Better Plants program. The collected data focused on the state of SEM implementation, the presence and responsibilities of energy leaders, and the formation and function of energy teams. The findings reveal a significant gap between the perceived importance of SEM and its actual adoption, highlighting the need for strong leadership to drive behavioral changes by championing energy efficiency initiatives. Results indicate that effective energy leaders possess a diverse skill set, including the ability to secure top management buy-in, foster a culture of energy consciousness, and collaborate across departments. This study emphasizes the importance of empowering energy leaders with clearly defined roles and responsibilities as well as the authority to build and lead cross-functional energy teams. Furthermore, integrating energy management into existing organizational structures and leveraging readily available resources are identified as key factors for successful implementation. This research underscores how dedicated leadership and effective SEM practices help achieve industrial energy efficiency goals, providing practical insights for organizations seeking to improve performance and contribute to a resilient future.
1. Introduction
There is a sense of urgency in the manufacturing sector to improve resource efficiency, reduce the environmental footprint, and streamline manufacturing processes. According to the International Energy Agency (IEA), global energy efficiency investments have risen by 150% since 2015, creating new avenues for market opportunities [1]. Despite this progress, a significant barrier to action remains. Although technological advancements are promising, associated risks and costs hinder widespread adoption of energy-efficient manufacturing practices. The 2025 study from the US Department of Energy (DOE) highlights near- and long-term strategies for emerging and transformative technology pathways for the industrial sectors (Figure 1) [2,3]. In this context, companies face increasing global pressure to adopt transformative technologies. By executing near-term actions to optimize energy efficiency, industrial manufacturing facilities can jumpstart their progress toward internal energy efficiency goals.
Figure 1.
Transformative technologies in the industrial sector [2,3].
Implementing effective energy management practices not only reduces costs and improves efficiency but also provides a pathway for a resilient future. Energy efficiency may often be overlooked as attention shifts to transitioning current processes to emerging technologies and low energy prices reduce the urgency for increased efficiency [3]. Capital initiatives frequently prioritize new technologies, ignoring the considerable benefits of routine maintenance and established improvements. Such innovations are crucial for challenging sectors such as steel and cement, and their lasting impact hinges on robust leadership and strategic energy management (SEM) from major energy stakeholders. By integrating energy management into daily operations and empowering employees, SEM enables facilities to optimize energy use, reduce costs, and improve the bottom line. For an organization to successfully implement SEM and maximize its impact, strong leadership is essential [3]. Firms often decline the adoption of commercially viable energy-efficient technologies without personal involvement from energy managers because they might perceive energy efficiency improvements as of secondary importance [4].
Energy leaders possess a multifaceted skill set and are instrumental in securing top management support, championing a culture of energy efficiency, and collaborating with internal and external stakeholders. These leaders play a pivotal role in bridging the gap between corporate-level commitment and facility-level implementation. This is particularly evident in situations where corporate long-term energy goals and plant-level short-term objectives diverge, often due to a lack of communication or awareness regarding corporate initiatives at the plant level. An effective energy leader can directly address this misalignment by fostering clear communication channels and ensuring that corporate energy goals are understood and integrated into daily operations at the plant. This study explores the critical role of energy leaders in driving SEM and accelerating the pursuit of organizational objectives. By examining responsibilities, skills, and challenges faced by energy leaders, this study aims to highlight the impact this role can have on an organization’s energy efficiency achievement.
To advance this discourse, researching the role of effective leadership in SEM implementation across industrial sectors is essential. The following are the objectives of this research: (1) study the literature to synthesize the importance of leadership to advance SEM initiatives and implement energy efficiency projects; (2) collect and analyze data from DOE’s Better Plants Energy Bootcamp participants on the state of SEM, energy teams, and energy leaders within their organizations at both facility and corporate levels; (3) conduct a statistical analysis on how leadership influences the use of SEM mechanisms; and (4) review best practices to formulate energy teams that can support successful SEM initiatives.
2. Literature Review
Global academic research, industrial trends, and policymaking for industrial energy efficiency have largely focused on development and deployment of advanced technologies designed to improve process efficiency, fuel usage, and system-level performance. Studies from DOE underscore that improving energy-intensive industries will require a mix of near-commercial and emerging technologies, emphasizing process innovation and infrastructure change [2]. The report also underscores the central role of alternative fuels, feedstocks, and biomass, along with modern higher-efficiency technologies for industrial energy efficiency transformation. Other benchmark studies, such as Bataille et al. and Kim et al., focus on industrial subsector-level analysis of applicable technologies and highlight the need for continued research, design, and deployment [5,6]. Thiel et al. investigated the effect of heat to demonstrate the importance of process heating technologies on industrial energy efficiency [7]. DOE and IEA also point to the importance of technology for thermal process intensification and advanced industrial energy pathways [8,9]. This research reinforces the prevailing belief that technological innovation is an undeniable cornerstone of industrial efficiency and environmental awareness. However, this techno-centric perspective often overlooks the systemic, organizational, personal/behavioral, and social aspects that significantly influence energy outcomes in industrial settings.
Whereas technologies are vital, an emerging body of literature stresses the critical role of stewardship, organizational leadership, and energy management culture in realizing the full potential of energy and cost reductions. Energy efficiency in industry is as much a management challenge as it is a technical one, where the lack of leadership and senior management commitment can hinder the implementation of even well-established basic energy-saving practices. Moreover, studies like Fitzgerald et al. find that companies with structured energy management programs (e.g., the ISO 50001 standard for energy management and superior energy performance [SEP]) achieve more consistent and more significant energy savings compared with those that do not employ SEM [10]. Organizations committed to ISO 50001 are expected to more readily designate energy leaders and empower energy champions, as opposed to facilities that do not employ SEM. These insights reveal a gap in the literature that can inform the importance of effective leadership, which complements and drives technological implementations with robust organizational strategies for change management and cross-functional engagement for SEM.
2.1. Strategic Energy Management
Energy efficiency is highlighted as a key strategy for manufacturing facilities to achieve improved cost and energy savings. Figure 2 highlights the focus areas for energy efficiency, including SEM, system efficiency, smart manufacturing, improving life cycle efficiency, and use of combined heat and power. SEM emphasizes a systems-based approach to continuous improvement in energy performance. The focus is on integrating energy management into everyday business practices and operations while equipping and enabling personnel to modify energy consumption through both behavioral and operational changes. By centering activities around energy management, a facility or corporation will focus on first reducing the amount of energy loss within systems. This makes the value of total purchased energy as close as possible to the value of useful energy consumed within the facility. When energy efficiency is improved, it results in reduced energy intensity, lower energy costs, and increased reliability [3].
Figure 2.
Energy efficiency pillar as adapted from [3].
From the literature and industry practice, ISO 50001 is one of the most effective energy management systems (EnMS) frameworks used by organizations to establish SEM initiatives. The ISO 50001 standard helps facilities improve energy efficiency and save on energy costs associated with processes and practices within a facility’s chosen boundary [11,12,13]. The plan-do-check-act cycle framework included in the standard is especially beneficial for strategic focus and has resulted in tangible benefits in energy, cost, and supply chain key performance indicators, as well as intangible benefits such as culture and company image [13,14]. Fitzgerald et al. (2023) found an average annual improvement rate of 3.4% from 12 years of energy performance data from 83 manufacturing facilities that implemented ISO 50001 [10]. Facilities that implemented the standard achieved higher energy efficiency and energy improvement rates in comparison with the achievements of uncertified facilities. Of more than 45,000 facilities worldwide that have implemented ISO 50001, most facilities identify support and engagement from upper management and leadership, as well as company culture, as the two critical drivers for successfully applying the ISO 50001-based EnMS [10,15]. Upper management support has also proven to be a critical driver for SEM, yielding benefits that extend beyond direct energy improvements. Leadership support of SEM spurs innovation and process optimization [15,16].
To effectively implement SEM and achieve significant energy reductions, strong leadership is essential. Studies by Blass and May demonstrate that when top management (i.e., leadership, particularly those with operational knowledge) actively support SEM initiatives, companies are more likely to embrace energy efficiency practices [17,18]. In 2017, May et al. carried out a comprehensive review of 365 journal articles on energy management in manufacturing and found that dedicated energy managers significantly increase energy efficiency adoption [18]. These leaders contribute expertise across the entire energy management process—from influencing the design and construction of capital assets to energy data reporting and metric tracking—to achieve ambitious goals [19,20].
Previous studies showed that effective leadership is paramount to accelerate energy management practices adoption [14]. Furthermore, the role of a dedicated “energy leader” emerges as a critical factor in successful implementation. In a manufacturing company, an energy leader is someone who formally or informally drives energy-efficiency initiatives, promotes behavioral changes to align with these improvements, and leads the company toward reducing its overall energy consumption. The leader often does this by championing innovative solutions, motivating teams to participate, and consistently monitoring energy usage to identify areas for improvement. Significant literature exists on the importance of leadership in manufacturing organizations to boost performance. Research suggests that dedicated energy managers can significantly increase energy efficiency adoption [18]. These leaders contribute expertise across the entire energy management process, from influencing the design and construction of capital assets to conducting energy data reporting and tracking metrics to achieving ambitious energy goals [19,20].
Solnørdal et al. (2018) identified vital internal and external factors driving corporate energy efficiency in manufacturing firms [4]. The systematic literature review conducted between 1998 and 2016 discussed the complexity of the motivations of manufacturing firms and identified four main categories of drivers: economic, management and organizational, market, and government policy. Economic drivers comprised technology solutions, cost of operations, and financial elements such as capital, investment, and payback periods for the energy-efficiency projects. Organizational drivers included the need for management buy-in, organizational structure, competency levels, and motivation of employees as empirical drivers for enabling energy efficiency within those firms. Economic and organizational drivers were significant contributors to the success of energy-efficiency improvements within the manufacturing firms [4,21,22]. Effective management can help build organizational buy-in and acceptance, which are vital factors to enable energy efficiency adoption. Effective leadership—visible through a skilled and trained workforce, promotion and adoption of commercial-ready technologies supported by favorable policies, management goals, and access to capital—will enhance the impact on energy efficiency [22]. Effective energy leaders can have the highest direct impact on energy efficiency, facilitate energy management practices, and help raise awareness among other employees to build workforce capacity within an organization [22].
2.2. Energy Leaders at the Corporate Level
As discussed in the previous section, the importance of effective leadership is paramount; hence, the value of energy leaders as corporate leaders cannot be overemphasized. Effective leadership is enabled through the role of a corporate energy manager, or an environmental, health, and safety (EHS) leader; evidence shows that such management structures lead to significant reductions in energy consumption. Many of the Better Plants program partners position individuals in these crucial roles to serve as key points of contact and drive energy efficiency initiatives within their organizations. However, the effectiveness of these teams hinges on strong leadership buy-in (e.g., executive sponsorship and/or an executive champion that enables the establishment of a corporate energy manager, team, etc.) and a well-defined support system [20].
To maximize the effect of energy management teams, companies should define clear roles and responsibilities within the team itself (e.g., data collection, analysis, and project implementation). Engaging with plant leadership is crucial to establishing and empowering these teams with the necessary authority to enact change. Additionally, promoting internal resources available to the team (e.g., software tools and training programs) and aiding with reporting energy data and progress furthers their ability to function effectively. Finally, recognizing and rewarding successful projects and individual performance within the team serves as a powerful motivator to maintain momentum and a culture of continuous improvement.
The significant energy intensity improvements observed in Better Plants partner facilities, which have collectively reported savings of 2.4 quadrillion Btu (2.5 exajoules) of energy since 2011 [23] and $14.1 billion since 2009 [24], strongly correlate with the presence and effectiveness of these corporate energy leaders. These leaders often spearhead efforts to address a major challenge for organizations: the lack of technical knowledge about energy-efficient technologies. Through initiatives like in-plant training programs, which are a hallmark of the Better Plants program, corporate leaders actively foster workforce development, thereby improving technical expertise and accelerating the adoption of new energy-saving measures [3].
2.3. Energy Leaders at the Facility Level
The assignment of dedicated energy leaders at individual manufacturing facilities presents an excellent opportunity for corporations looking for robust improvement in energy and cost performance. In the United States, approximately 16% (29,330 of 181,126) of surveyed facilities indicated assigning a “person responsible for energy management,” according to the US Energy Information Administration (EIA) Manufacturing Energy Consumption Survey (MECS) in 2018 [25,26]. Boyd et al. (2021) [27] were able to assign a valuation to the energy leader role through their analysis of MECS (2018) and non-public U.S. Census Bureau data. It was found that the designation of an energy manager resulted in a 6.4% reduction in total energy consumption at those facilities. The study also suggested that while technical retrofits and computerized monitoring offer potential gains, the appointment of a dedicated manager provided the most consistent and statistically significant pathway to energy savings [27]. This aligns with the ‘energy efficiency gap’ literature, which suggests that the primary barriers to efficiency are often not technical, but organizational and managerial in nature [27]. Since this study was completed, EIA has released MECS 2022 data, which shows 16.5% (30,577 of 185,115) of surveyed facilities indicated assigning a “person responsible for energy management”—the stagnation in numbers clearly exposes a gap between the adoption of energy leaders and their perceived value [28].
But who is the right person for this job? Ideally, a full-time employee at the facility is dedicated to helping achieve organizational energy goals. Creating a management position to carry out energy-related projects and practices could empower the energy leader to achieve these goals [20]. However, this is not always the case. Individuals working in asset reliability or maintenance departments often have the most exposure in their current roles to energy losses throughout these facilities. Additional evaluation of typical responsibilities may also assist in identifying the proper person for this position.
The first step in the development of energy management is adequate and accurate data reporting. This task involves consolidating invoices and tracking monthly consumption and costs for each energy type. In some cases, corporate-wide systems may be available for this tracking, or automated systems may read bills and input the data. The US Environmental Protection Agency’s (EPA’s) ENERGY STAR Guidelines for Energy Management offers guidance for the creation and success of an energy management program [29]. The first steps in the guidelines are setting targets and committing resources to achieve continuous development and growth in energy management.
The crucial factor in the success of an energy leader is the support of a champion from top leadership of the facility. Ideally, this is the facility director or a person who oversees facility operations at the highest level. A study of small and medium-sized manufacturing firms in the United States shows that top operations managers significantly increase the adoption of energy-efficiency initiatives, whereas general top managers without an operational role have little or no effect [17]. A key role of this individual is the co-ownership of the facility’s energy goals to ensure the energy efforts are prioritized and valued at all levels within the facility. This requires collaboration between the energy leader and the champion to ensure plans are implemented and desired results are achieved, thereby creating an accountability chain for work to be accomplished. This champion can also grant the appropriate level of authority to the energy leader so that they may call upon the resources required to execute projects.
2.4. The Energy Team
Members of the energy team have a certain level of accountability for their participation, perhaps including this as a formal responsibility of their primary role or adding it to their performance evaluation as something beyond existing responsibilities [30]. The energy team should hold regularly scheduled meetings that make sense for the facility and activities; for example, a quarterly cadence may make sense for an organization with relatively stable energy use and production, whereas monthly may work better for those with more variability in these categories [30]. The members of the team should be cross-functional, meaning they should represent different groups and various levels of leadership from across the facility. Cross-functional teams can easily help evaluate auxiliary benefits associated with energy-related projects, which are often overlooked by a team focused purely on technical energy. A recent DOE factsheet identified the value of quantifying these “nonenergy benefits” such as maintenance savings, safety improvements, and productivity gains associated with energy-related projects and upgrades [31]. These additional impacts strengthen the business case for projects, improve payback periods, and align with broader strategic objectives, thus simplifying the process to gain project approvals from stakeholders.
EPA’s ENERGY STAR Guidelines for Energy Management mention that instituting an energy management program involves establishing an energy team and an energy policy. The energy team, involving people in leadership as well as from the facility level, is crucial in identifying goals, tracking performance, creating awareness and education, and executing energy performance projects for compliance with established corporate energy policies [29].
Another benefit to the cross-functional energy team is the ability to reframe the notion that energy-efficiency projects only save operational costs, when in reality they also positively impact several nonenergy aspects. IEA reported savings in the range of 40% to 50% of the costs of the energy efficiency measures implemented, effectively lowering the payback on the measures by half [32]. The report highlights different types of nonenergy benefits that result from energy-efficiency measures implemented in the industrial sector. DOE also identified numerous key areas that benefit from the pursuit of energy-efficiency projects [33]. Energy efficiency helps increase overall facility productivity, enhance product quality and save time on production cycles. These improvements are primarily due to reduced labor and maintenance costs, and a reduction in water and materials usage creates less waste [33]. Managing an energy-efficient project that will lead to operational savings and increased productivity requires the ability to identify and execute those measures. EPA’s ENERGY STAR Guidelines for Energy Management outlines establishing a dedicated team, appointing an energy leader, and instituting organizational policy as a pivotal foundation for developing and continuously improving the organization’s energy performance [29]. The key to continuous improvement is developing an inclusive culture that promotes energy efficiency and waste reduction. Energy leaders are fundamentally responsible for embedding energy management across their organizations. Moreover, energy leaders influence entire organizations by developing policies and a culture focused on energy management and efficiency. A step in the guidelines is creating tracking methodologies and benchmarking: tools that are critical in evaluating progress and guiding the direction of future energy-efficiency initiatives, innovation, and planning. Setting tangible goals and technical guidelines serves as a roadmap to current and future employees and stakeholders.
For those embarking on an energy management journey, a phased approach is recommended, beginning with small, manageable steps, such as piloting an initiative at a single facility to demonstrate success before replicating it elsewhere. Integrating energy management into existing organizational structures can streamline implementation. For example, leveraging established frameworks like an EHS team, with its departmental representatives, meeting cadence, and reporting structure, can provide a ready-made model. Ultimately, recreating established processes is not necessary; teams should build on existing resources and best practices.
3. Methods
DOE’s Better Plants program is a voluntary partnership initiative that assists US manufacturers with their organizational objectives [34,35]. Manufacturers that join the program (referred to as partners) commit to energy efficiency goals with optional water and waste goals. Partners receive technical assistance, tools, resources, and national recognition. Energy Bootcamp—one of the workforce development events hosted by the program—addresses energy management, process heating, steam, compressed air, and other prominent industrial energy systems. This industrial-focused workshop was originally conceptualized for manufacturing partners in the Better Plants program, but later, was opened on a limited basis to non-partner organizations. The event is geared toward individuals relatively new to a role in energy efficiency/management, junior professionals, and seasoned employees needing a refresher on energy efficiency fundamentals. Workshop participants include attendees with titles such as plant energy manager, energy analyst, engineer, facility manager, electrical manager, and management personnel with the responsibility for plant utilities oversight [36]. Note that the participant pool consists primarily of organizations engaged with the Better Plants program and individuals actively seeking energy management training. This convenience sample represents a highly engaged group, often viewed as early adopters and high performers in SEM, meaning the results likely reflect leading indicators and best practices for the industrial sector rather than sector-wide averages. This intrinsic selection bias allows for the identification of advanced organizational practices, but the results should be interpreted cautiously against broader industry adoption rates.
The Better Plants program delivered two Energy Bootcamps—workshops to educate attendees on the key aspects of industrial energy efficiency and fundamentals of energy management—from 13 May to 17 May 2024, and 28 October to 1 November 2024. A total of 120 participants representing 71 companies and organizations attended the two events. The training sessions were conducted in person at Oak Ridge National Laboratory’s Hardin Valley Campus in Knoxville, Tennessee.
Data for this study were derived from an exploratory data collection questionnaire activity, which was administered to engage participants and collect feedback during the “Where to Start with Energy Management” workshop session. The exploratory data collection was an interactive activity deployed during two separate events using the Slido platform [37]. The 120 participants responded anonymously (i.e., names and email addresses of participants were not recorded). Though the registration information of the events recorded names, email addresses, job titles, and affiliation information, the anonymized nature of the responses imposed limitations on the analysis.
The original intent of the exploratory data collection was to serve as a live icebreaker and engagement tool to encourage participation and allow instructors to gauge the collective experience level of the class. It helped the instructors to collect high-level, practical data on the organizational status of participants (for example, Q1 on SEM maturity, Q3 on leadership presence) to help instructors tailor the training content and initiate peer discussions. It was subsequently recognized that the collected responses, which were gathered from highly relevant individuals, offered an exploratory but valuable dataset for understanding the role of energy leaders and SEM adoption trends in the industrial sector. The post hoc analysis focused on responses related to five major categories: (1) existing SEM standing, (2) leadership, (3) understanding of performance, (4) operations energy efficiency capabilities, and (5) support mechanisms. Questions also covered existing leadership structures pertaining to energy-related programs and energy team members, if applicable.
The activity included 11 multiple-choice questions, three true or false questions, and one word cloud question. The questionnaire is reproduced in Appendix A. The collected responses were anonymized through the Slido platform and aggregated into a larger dataset. The activity was designed for quick response using categorical scales. The questionnaire primarily used nominal scales (e.g., multi-select questions on certifications in Q2, job roles in Q3, and true/false in Q6) and ordinal scales (e.g., Q1 for SEM maturity, Q5 for time dedicated, which used ordered categories ranging from 100% to 10%). This structure, while originally created for classroom interaction, was suitable for the final research objective because it yielded categorical data necessary to perform a comparison analysis based on the responses.
A comprehensive literature review was conducted on SEM initiatives and the role of effective leadership in achieving better outcomes from established energy efficiency goals and related organizational efforts.
The information collected was collated and studied. To facilitate analysis and creation of visuals, the dataset was processed using Microsoft Power BI (Version 2.121.903.0) and Excel (Version 2511). An important step taken in data processing was addressing missing data, which occurred when participants skipped specific questions (e.g., the 36 nonresponses to Q6 on the existence of an energy team). Given the investigative nature of the exploratory data collection and the use of an anonymous interactive platform, missing data were treated as missing completely at random. For the descriptive statistics, an analysis was conducted on the available case count for each specific question; therefore, the reported percentages and counts (N) vary by question. For the inferential statistical analysis (chi-squared tests), any participant with a missing response for the specific variables being cross-tabulated was excluded from that evaluation. The following section summarizes the findings from the literature review and the analysis of the data collected from Energy Bootcamp participants in supporting those findings. The detailed methodology is presented in Figure 3.
Figure 3.
Overall study methodology.
4. Results
Attendee data were analyzed from the registration data for the events. For quantitative clarity and to substantiate the diversity of the sample, the distribution of the top-represented subsectors is presented in Table 1, showing that Chemicals (16%), Primary Metals (13%), and Machining/Computer Equipment (11%) formed the largest segments of the participant pool. This diversity, although representing high-energy-consuming sectors, offers varied perspectives on SEM implementation.
Table 1.
Subsector breakdown of participants in Energy Bootcamp events.
The respondents’ backgrounds or job titles from their registration are shown in Figure 4, which shows that participants most commonly have engineer or manager titles.
Figure 4.
Job titles of Energy Bootcamp participants, most of whom were corporate and facility energy managers and engineers.
4.1. Strategic Energy Management
The activity results showed that only 24 of the 120 participants indicated that their facilities had an established, formal SEM program, whereas 34 participants reported just getting started with the basics. Out of 120 Energy Bootcamp participants, only 13 participants reported their facilities to be certified or compliant with ISO 50001 EnMS; 10 of these participants cited having both ISO 9001 [38] quality management and ISO 14001 [39] environmental management certifications, one participant reported an additional ISO 9001 certification, and one reported an additional ISO 14001. However, 51 participants indicated that their facility was ISO 9001 quality management certified or compliant, and 48 facilities were identified as certified or compliant under ISO 14001 environmental management. Note that these additional ISO standards provide the baseline framework, which lends itself well to the implementation of the ISO 50001 standard [16].
The results showed that 39 participants indicated they had upper management support at the facility level. Five participants indicated they had been working with the Better Plants program and showed a willingness to engage more with the 50001 Ready protocols. The 50001 Ready is a DOE program that provides a self-guided approach for organizations to establish an EnMS in alignment with the ISO 50001 standard [10,40]. Seven respondents reported plans to pursue SEP at one or more sites within their organizations. SEP is a certification program that is built on ISO 50001 and provides a structured framework for continuous improvement in energy performance and verified savings [40]. Ten of the participants had either the 50001 Ready Recognition or ISO 50001 certification and planned to attain similar status for other facilities in their organizations. Only four participants indicated a lack of energy management practices at their facilities.
4.2. Validation of the Energy Leader’s Role
To further examine the role of energy leadership in enabling project implementation, the team analyzed the association between the presence of dedicated leaders or teams and key organizational support factors: the use of a project tracking system (hopper) and the institution of dedicated project funding. Comparative analysis (Table 2) reveals a strong correlation between the presence of dedicated leadership and the formal tracking and funding of energy-efficiency projects.
Table 2.
Comparative analysis of energy leadership on organizational prioritization of energy projects.
Among organizations reporting a corporate energy leader, 89% use a project hopper to track energy-efficient projects, contrasting sharply with the 11% that do not. This high tracking rate is supported by the availability of dedicated funding: 55% report facility-level funds, meaning 78% have some level of reserved funding. Only 21% report a lack of dedicated project budgets. Similarly, for facilities with a dedicated energy leader, 87% maintain a project hopper, indicating high engagement in implementation readiness. Overall, 80% of these facilities report having dedicated funds (50% company level, 30% facility level) compared with just 20% reporting no dedicated project budgets. In contrast, organizations that answered “no energy leader” showed lower rates of both tracking and funding. Only 54% track projects via a hopper, and a majority, 83%, report having no dedicated project budgets. The same pattern holds for teams: 86% of facilities with an energy team use a project hopper, and 76% report having reserved funds (46% company level, 30% facility level).
To further validate these associations, a chi-squared test of independence was conducted on the observations presented in Table 2, specifically comparing the groups with “any energy leader” (corporate or facility) against the “no energy leader” group. The detailed statistical report is provided in Appendix B.
The test concluded that a statistically significant relationship exists between having an energy leader and the use of a project hopper (χ2(1, N = 97) = 7.26, p = 0.007). Sites with any designated energy leader are significantly more likely to use a project hopper than sites with no leader. And on the topic of resource allocation, the link between leadership and funding is extremely strong. The presence of any energy leader is strongly associated with the existence of a dedicated project budget (χ2(2, N = 112) = 21.04, p < 0.001). This is confirmed by the dramatic difference shown in Table 2, where 83% of sites without a leader lack dedicated budgets. A nuance revealed by the analysis is that although the presence of a dedicated energy leader is highly significant in predicting positive outcomes, the binary indicator for presence of an energy team alone showed no statistically significant association with either project hopper use or dedicated budgets (p > 0.05 for both tests). The results are confounded due to simplicity of collection of exploratory data and are elaborated in the Section 5.
To further understand the association between leadership and resource allocation, a subgroup analysis was performed by dividing the sample into “beginner” and “mature” SEM organizations. This analysis revealed a divergent pattern. For “beginner” organizations, the association between the presence of an energy leader and a dedicated budget was not statistically significant (χ2(2, N = 28) = 4.91, p = 0.086). However, for “mature” organizations, the association was highly significant (χ2(1, N = 76) = 15.29, p = 0.00048).
The following subsections (Section 4.3 and Section 4.4) further detail the different leadership roles and structures explored in the comparative analysis.
4.3. Energy Leaders at the Corporate and Facility Level
Of the bootcamp participants, 40% (51) indicated that they had a corporate energy manager. Among the 82 participants who reported that their facilities had energy leaders, only 8 indicated that energy leaders dedicated 100% of their time to energy-related activities. Among the 120 participants, 109 reported that their organizations have an employee (e.g., corporate energy manager, part-time facility-level energy champion, or dedicated facility-level energy manager) whose primary responsibility is to direct or plan energy strategies related to energy use and energy-efficient technology across the company or facility level. Forty-one participants indicated that their energy leaders spent approximately 25–75% of their time working on plant energy-related activities. Only 22 participants reported that energy leaders worked on related activities for 10% of their full-time role.
Figure 5 shows activity results from the 109 participants who indicated they had a facility-level energy leader and what that individual’s key responsibilities are.
Figure 5.
Responsibilities of the facility energy leader.
Forty-four energy leaders were reported to be responsible for facility-level energy targets, and 40 participants indicated that the energy leaders head their organizations’ energy and/or sustainability teams. Thirty-three participants reported that their facilities have existing mechanisms and lines of accountability with activities related to energy use and performance, and 38 respondents indicated that energy leaders facilitate the energy projects within the facility. Only 23 participants reported that the energy leaders at their facilities coordinate compliance or certification with an EnMS (e.g., ISO 50001 or similar).
4.4. The Energy Team
Out of the 120 bootcamp participants, only 40 respondents (33%) indicated that their facilities have energy teams to guide energy projects. Another 44 participants (37%) said their facilities have no energy teams, and the remaining 36 did not register an answer. Engineering, environmental, maintenance, and site management personnel made up the facilities’ energy teams for 88 of the respondents (Figure 6). Other answers included production, procurement, accounting, finance, quality, and administration personnel as members of site energy teams. The number of energy team members ranged from 1 to 25, with most of the teams meeting monthly or weekly to discuss operations, projects, and strategies.
Figure 6.
Area representation of energy team personnel.
Almost 86% of the participants with energy teams reported facility-level tracking of energy-efficiency projects in comparison to only 14% of participants reporting that their organizations were without energy-efficiency projects in the pipeline. Finally, fostering a culture of energy conservation through awareness campaigns and engaging activities is crucial for long-term success. The exploratory data collection results revealed that some facilities organized activities such as lunch-and-learn meetings, published company best practices handbooks, introduced rewards and incentive programs, and conducted pre-shift group meetings to review energy performances and strategies. Of the bootcamp participants, 25% reported that their facilities organized webinars, distributed brochures, or conducted their own surveys for discussing energy performance and best practices.
5. Discussion
While the sample in this study was concentrated in energy-intensive sectors, such as Chemicals, Primary Metals, and Machinery/Computer Equipment, the underlying structural findings are sector agnostic. This is especially relevant when looking at the presence of an energy leader and existence of a dedicated project budget. Regardless of whether a facility is a light manufacturing food plant or a heavy industrial chemical plant, the internal competition for capital remains constant. The necessity of a ‘Resource Gatekeeper’ to navigate the capital allocation process is a requirement in any hierarchical organizational environment. A dedicated individual can help in bridging this gap between the competing priorities within the manufacturing organization, treating energy as an important variable alongside other capital projects.
The assignment of dedicated energy leaders at individual manufacturing facilities presents a great opportunity for corporations looking for robust improvement in energy and cost performance. In the United States, approximately 16% of facilities indicate the assignment of a “person responsible for energy management,” according to the MECS (2018) [25]. Furthermore, the statistical results suggest that the presence of a dedicated “energy leader” is a critical predictor of an organization’s ability to successfully implement SEM. Formal leadership structures are critical for mobilizing the necessary institutional resources (like project budgets) for continuous improvement. The inferential analysis validates this, where those organizations without a leader (83%) lack such dedicated project budgets. Without this formal structure, energy efficiency initiatives remain ad hoc and struggle to secure the institutional capital necessary for continuous improvement.
A key insight from the analysis is that the relationship between leadership and resources evolves as an organization matures in its level of SEM. The lack of a leadership–budget association for beginner-level organizations can be explained through the Dynamic Capabilities Theory [41]. This indicates that in early stages of SEM implementation, the energy leader often initially exists as a “champion,” an ad hoc advocate with a title but without formal authority. However, as the organization matures, it develops Organizational Routines that structurally couple authority and resources [42]. This suggests that the energy leader role is not just a job title, but a stabilized capability that only emerges once the organization moves beyond ad hoc advocacy toward formalized energy management systems like ISO 50001. This indicates that for SEM to be sustainable, the leadership role must eventually transition into a true “manager” position equipped with formal resource control.
To implement SEM effectively based on the findings from this study, organizations should first explicitly define the energy leader’s role as having budgetary authority, granting them the agency to propose and defend energy-specific capital expenditures. The appointment and training of this energy leader before the formation of larger cross-functional teams to ensure that the team’s technical identification of projects has a direct line to funding. Lastly, a standardized project hopper at either or both the facility and corporate level, which is regularly reviewed by the appropriate energy leader(s) and facility or corporate leadership (Facility Director, or Chief Financial Officer, for example) at the same cadence as other capital projects, will ensure energy project identification and financial approval are built into normal business operations.
The study’s responses from 120 participants showed that 90% of participants indicated the assignment of energy leaders within their organization, compared to the 16% of U.S. manufacturing facilities with this assignment as found by MECS (2018) [28]. This is likely a result of sampling from early adopter organizations (Better Plants partners) who have understood the value of SEM and are highly motivated to demonstrate energy goal progress. It is evident that they are willing to empower, select, and seek training for their energy leaders and team members at a higher rate than found through MECS. Research leveraging non-public census data confirms that leadership role designation is responsible for moving plants toward the more efficient end of the industry’s energy intensity distribution [27]. This study contributes by explaining the ‘why’ behind this performance through the exploratory analysis of a sample of participants from the Better Plants Bootcamp. Specifically, the leader transitions from an ad hoc champion to a manager of formalized organizational routines, a shift that Boyd et al. (2021) [27] link to tangible reductions in energy per dollar of output.
5.1. Best Practices for Energy Team Formation
To undertake the challenge of supporting facility-wide goals, a cross-functional team is recommended (Figure 7). While the statistical analysis showed the binary indicator for team presence was not associated with the existence of a project hopper or budget outcomes, these findings are confounded by factors such as team size, team maturity, program priority, and participant responsibilities and authority. The authors caution against interpreting these results as teams are not important or are secondary compared to assigning leadership and recommend taking into account team maturity and empowerment. However, this finding, when viewed through the lens of Agency Theory, provides an interesting suggestion for organizations looking to effectively implement energy efficiency initiatives [43]. In this framework, top management (or, in theory, the principal) delegates authority to an energy leader (referred to as the agent) to implement facility-level improvements. Because capital budgets represent a high-stakes resource, management is more likely to delegate spending authority to an individual held personally accountable than to a collective team where the structure is “flat”, and responsibility is diffused. The cross-functional team works together to identify technical opportunities, but the leader provides the structural legitimacy required to mobilize capital. This team should be sponsored by a top management champion that is discussed and directed and led by the facility’s energy leader. Titles for positions may vary; see Appendix C for descriptions of key personnel to include on the energy team.
Figure 7.
Example site energy team structure.
Once an energy team is in place, their ongoing efforts promote continuous improvement, which includes identifying activities such as regularly scheduled walkabouts through departments or formalized Energy Treasure Hunt events. Maintaining a project pipeline is essential, with a range of options to suit different budgets and timelines.
Although the establishment of an effective energy team is crucial for achieving energy management goals, many organizations struggle with implementation. Ingersoll Rand’s experience with its Green Excellence team, or Green X, offers a compelling real-world example of how a dedicated, cross-functional team can operationalize energy efficiency and achieve significant energy savings [44,45]. Ingersoll Rand is a prominent manufacturer, best known for manufacturing air compressors, power tools, and material handling equipment, and has been a part of the Better Plants program since 2020 [46]. To achieve its organizational targets, Ingersoll Rand formed its Green X operational sustainability team in 2018. The team was tasked with leading the efficiency across various manufacturing operations and services at a single facility. This initiative helped the facility double its energy productivity, allowing it to manufacture twice as much output per energy consumed and subsequently reducing energy costs by as much as 70% [46]. Green X achieved this feat by establishing a standardized framework for tracking and reporting multiple key operational indicators, including energy consumption, water, and waste reduction [44,45,47].
After successfully piloting the approach at the Waco, Texas, facility—where it had demonstrated measurable and considerable improvements in energy efficiency and cost savings—Ingersoll Rand scaled the effort into the corporate scope 1 and scope 2 reduction roadmap under the team, program, and continuous improvement pillars of green excellence. The Green Excellence Program team included the following team members across the seven cross-functional pillars identified: site team/program leader, compressed air champion, water champion, HVAC/lighting champion, waste champion, start-up/shutdown champion, manufacturing efficiency team member, and controlling representative. Other team members providing support to the plant teams were identified as: site sponsor, business unit program leader, and global program director [47].
The program established a quick reference guideline for individual system champions as part of the operational maintenance standardization. Currently, the 35 Green X teams across various Ingersoll Rand facilities focus on equipment and infrastructure-related operational excellence and improvements and report a 4% average reduction in energy consumption throughout the various Ingersoll Rand manufacturing facilities [47].
5.2. Limitations and Future Work
This study has several methodological limitations that warrant consideration:
- A convenience sample drawn from DOE Better Plants bootcamp participants likely exhibits selection bias, overrepresenting organizations with higher SEM engagement and thereby limiting generalizability to the broader industrial population.
- Cross-sectional design precludes causal inference; observed associations between leadership roles and management enablers may reflect reverse causality, wherein established management systems precipitate leadership formalization rather than the converse.
- Workshop-based polling instrument, designed for instructional purposes, employs simplified categorical measures that inadequately capture variation in leadership authority, decision-making power, and team functionality, limiting construct validity.
- Reliance on self-reported data introduces potential recall bias, social desirability bias, and measurement error, particularly in large or multi-site organizations; additionally, respondent anonymity precludes control for organizational clustering.
- Small sample sizes and sparse contingency tables limit statistical power and robustness; furthermore, the absence of multi-variate analysis necessitates that results be interpreted as exploratory.
Collectively, these limitations suggest the findings should be interpreted as hypothesis-generating patterns within a motivated cohort rather than as definitive causal evidence. To move beyond the descriptive boundaries of this exploratory study, the authors propose three hypotheses to guide future longitudinal research:
- Hierarchical leadership authority is a primary predictor of energy budget institutionalization, whereas lateral team collaboration is a secondary support mechanism for project identification.
- The association between leadership and resource allocation is moderated by organizational maturity, appearing only after SEM routines have been formalized.
- The effectiveness of cross-functional teams is dependent on the presence of a formal leader who serves as the ‘Resource Gatekeeper’ between the team and top management.
6. Conclusions
Manufacturing and industrial sector partners play a pivotal role in advancing operational performance through innovation, efficiency, and leadership in energy management practices. The objective of this research was to analyze the impact of leadership and team structure on SEM by evaluating the existing literature, investigating Better Plants partners, and performing a statistical analysis on responses from a Better Plants bootcamp event to identify best practices. Results confirm that a significant gap exists between the recognized importance of SEM and its consistent implementation. This gap highlights the need for dedicated energy leaders with formal authority who can champion energy efficiency initiatives, secure top management support, and build cross-functional energy teams. These leaders act as catalysts, connecting corporate-level commitments and facility-level action through both operational improvements and behavioral changes, such as project hoppers and dedicated project budgets.
This study suggests that the energy leader is critical for resource mobilization. By securing dedicated budgets and maintaining disciplined project pipelines (hoppers), these leaders translate high-level corporate commitments into facility-level operational reality. Crucially, this study finds that while cross-functional teams provide essential support, they cannot systematically replace the accountability and authority inherent in a formal leadership role. Without a designated leader, energy management remains ad hoc; with a leader, it becomes a stabilized organizational routine.
Our study contributes to the literature by establishing the hierarchical coupling requirement. This suggests that SEM cannot succeed through lateral collaboration alone; it requires the direct coupling of individual leadership authority with financial resource control to bridge the energy efficiency gap. By applying Agency Theory, it is demonstrated that the “Principal” (top management) requires a single “Agent” (the energy leader) to overcome the diffusion of responsibilities inherent in collective, team-based structures. The findings contribute to the Dynamic Capabilities theory by identifying that leadership and budgeting are co-evolving capabilities that only “crystallize” as an organization matures in its adoption of SEM. This provides a new theoretical lens for understanding why SEM interventions often fail in nascent organizations: they attempt to implement complex collaborative routines before a requisite hierarchical agency and resource coupling are established.
To support the transition to a mature SEM program, manufacturing organizations should invest in their personnel and workforce. Cultivating internal leadership capacity is the key to transforming employees and workers from passive energy users into informed individuals who actively manage behavior and energy consumption. Professional certifications such as the Association of Energy Engineers’ Certified Energy Manager, participation in DOE technical assistance and workforce development programs such as the Better Plants program, and internal activities like energy treasure hunts, energy kaizens, webinars, and continuous learning initiatives represent valuable mechanisms to build workforce capability [34,48,49,50]. By empowering energy leaders with the authority to drive both behavioral and technical changes, the industrial manufacturing sector can unlock significant energy savings, enhance competitiveness, and secure long-term operational resilience.
Author Contributions
Conceptualization, K.M. and I.B.; methodology, K.M., I.B. and S.S.; validation, S.C. and S.S.; formal analysis, K.M.; investigation, K.M., I.B., S.C. and S.S.; resources, K.M., I.B., S.C. and S.S.; data curation, K.M.; writing—original draft preparation, K.M., I.B. and S.C.; writing—review and editing, K.M., I.B., S.C., S.S. and T.W.; visualization, K.M., I.B. and S.C.; supervision, S.S. and T.W.; project administration, T.W.; funding acquisition, T.W. All authors have read and agreed to the published version of the manuscript.
Funding
This manuscript has been authored by UT-Battelle, LLC, under contract DE-AC05-00OR22725 with the US Department of Energy (DOE). The US government retains and the publisher, by accepting the article for publication, acknowledges that the US government retains a nonexclusive, paid-up, irrevocable, worldwide license to publish or reproduce the published form of this manuscript, or allow others to do so, for US government purposes. DOE will provide public access to these results of federally sponsored research in accordance with the DOE Public Access Plan (https://www.energy.gov/doe-public-access-plan, accessed on 1 November 2025).
Institutional Review Board Statement
The Oak Ridge Sitewide Institutional Review Board (IRB#: IRB00000547) determined that the proposed activity is not research involving human subjects as defined by the US Department of Health and Human Services and FDA regulations. IRB review and approval by this organization is not required.
Data Availability Statement
Data for the analysis were obtained from live activities conducted during Better Plants events. Aggregated figure results can be found in Appendix D; the authors do not have permission to share the raw data.
Acknowledgments
The authors would like to thank Kristina Armstrong for the creation of the questions from which the Better Plants Energy Bootcamp Questionnaire was adapted; the authors also thank Wendy Hames, Stacey Montgomery, and Leslie Jones for their editing services, and the participants and instructors of the Energy Bootcamp events.
Conflicts of Interest
The authors declare no conflicts of interest. The funders had no role in the design of the study; in the collection, analyses, or interpretation of data; in the writing of the manuscript; or in the decision to publish the results.
Abbreviations
The following abbreviations are used in this manuscript.
| DOE | US Department of Energy |
| EHS | environmental, health, and safety |
| EIA | US Energy Information Administration |
| EnMS | energy management system |
| EPA | Environmental Protection Agency |
| IEA | International Energy Agency |
| MECS | Manufacturing Energy Consumption Survey |
| SEM | strategic energy management |
| SEP | superior energy performance |
Appendix A. Better Plants Energy Bootcamp Questionnaire
Appendix A.1. Strategic Energy Management
- 1.
- Where do you feel your company/facility is?
- a.
- Has not started with energy management
- b.
- Just starting with the basics
- c.
- Has an energy management program
- d.
- Has been working with Better Plants and is ready to engage more with 50001 Ready
- e.
- Has some sites with 50001 Ready Recognition and plans to do more
- f.
- Has some sites with ISO 50001 certification and plans to do more
- g.
- Has plans to pursue superior energy performance (SEP) at one or more sites
- 2.
- Our facility is currently certified/compliant in the following areas. (Please check all that apply.)
- a.
- ISO 14001 Environmental Management
- b.
- ISO 9001 Quality Management
- c.
- ISO 50001 Energy Management System
- d.
- Leadership in Energy and Environmental Design (LEED)
- e.
- No certifications
Appendix A.2. Leadership
- 3.
- Our company has a person whose job function is to direct strategies relating to energy use and energy-efficient technology across the company or facility level. (Please check all that apply.)
- a.
- Corporate energy manager
- b.
- Facility-level energy manager (dedicated FTE role)
- c.
- Facility-level energy champion (energy is a portion of role)
- d.
- None
- 4.
- How does the facility-level energy manager or champion assist each facility? (Please check all that apply.)
- a.
- Completes facility energy data reporting for corporate
- b.
- Analyzes or tracks facility energy performance
- c.
- Leads the facility energy or sustainability team
- d.
- Completes energy projects within the facility
- e.
- Coordinates the facility’s energy management system
- f.
- Has a line of accountability with plant leadership related to energy activities
- g.
- Is responsible for facility-level sustainability goal achievement
- 5.
- How much of the facility-level energy manager’s time is dedicated to improving the plant’s energy performance?
- a.
- All of their time (100%)
- b.
- Most of their time (75%)
- c.
- About half of their time (50%)
- d.
- Less than half of their time (25%)
- e.
- Very little of their time (10%)
- f.
- Not applicable
- 6.
- Our facility has an energy team to guide energy projects.
- a.
- True
- b.
- False
- 7.
- Are these departments represented on this energy team? (Please check all that apply.)
- a.
- Engineering
- b.
- Maintenance
- c.
- Site management
- d.
- Procurement
- e.
- Production
- f.
- Quality
- g.
- Environmental
- h.
- Administration
- i.
- Accounting/Finance
- 8.
- How large is your energy team?
- a.
- _________ people
- 9.
- How often does your facility’s energy team meet?
- a.
- Daily
- b.
- Weekly
- c.
- Monthly
- d.
- Quarterly
- e.
- Annually
Appendix A.3. Understanding Performance
- 10.
- At what level(s) does your facility track energy consumption or cost? (Please check all that apply.)
- a.
- By individual equipment
- b.
- By submeter (groups of equipment)
- c.
- By utility meter (main feeds of facility)
- d.
- By entire plant/facility
- e.
- By business unit division
- f.
- By division (may be based on product types)
- g.
- Corporate
- 11.
- At what cadence is energy performance reviewed?
- a.
- Daily
- b.
- Weekly
- c.
- Monthly
- d.
- Quarterly
- e.
- Annually
- 12.
- Our facility has identified and recorded the systems and equipment that use the most energy, or “significant energy users” (SEUs).
- a.
- True
- b.
- False
Appendix A.4. Support
- 13.
- How does your facility maintain and improve employees’ awareness on general energy efficiency/performance or best practices? (Please check all that apply.)
- a.
- Company best practices handbook
- b.
- Newsletter/emails/brochures/posters
- c.
- Webinars/pre-shift meetings
- d.
- Lunch and learns/ongoing training
- e.
- Surveys
- f.
- Rewards/incentive systems
- g.
- Annual reports
Appendix A.5. Operation
- 14.
- Our facility tracks or has a hopper of energy-efficiency projects.
- a.
- True
- b.
- False
- 15.
- Dedicated funding is set aside for energy projects at the…
- a.
- Company level
- b.
- Facility level
- c.
- Is not set aside
Appendix B. Chi-Square Analysis of Strategic Energy Management Implementation Enablers
This report summarizes chi-square tests of independence examining how different forms of leadership support (energy leaders and energy teams) relate to the following aspects of strategic energy management:
- Use of a project hopper.
- Presence of dedicated project budgets at the company or facility level.
All tests use Pearson’s chi-square test of independence with a nominal significance level of α = 0.05. Effect size is reported using Cramer’s V (approximately: 0.1 = small; 0.3 = medium; 0.5 = large).
Appendix B.1. Energy Leader Type Versus Project Hopper Use
Variables:
- Row variable—type of energy leadership (corporate energy leader, facility energy leader, no energy leader).
- Column variable—project hopper use (used versus not used).
The chi-square test of independence on the 3 × 2 contingency table (N = 97) gives χ2(2) = 9.63, p = 0.0081, Cramer’s V = 0.32.
Observed counts:
| Title of Team Member | Project Hopper Used | Project Hopper Not Used |
| Corporate Energy Leader | 40 | 5 |
| Facility Energy Leader | 34 | 5 |
| No Energy Leader | 7 | 6 |
The test is statistically significant (p < 0.05), indicating that project hopper use is associated with the type of energy leadership. Organizations with either a corporate or facility energy leader show much higher use of a project hopper (~88–87%) than organizations with no energy leader (~54%). Absence of an energy leader is associated with a higher tendency not to use a project hopper.
Appendix B.2. Energy Leader Type Versus Project Budget Structure
Variables:
- Row variable—type of energy leadership (corporate energy leader, facility energy leader, no energy leader).
- Column variable—budget structure (dedicated project budget [company], dedicated project budget [facility], no dedicated project budgets).
The chi-square test of independence on the 3 × 3 contingency table (N = 112) gives χ2(2) = 21.62, p = 0.000239, Cramer’s V = 0.31.
Observed counts:
| Title of Team Member | Dedicated Project Budget (Company) | Dedicated Project Budget (Facility) | No Dedicated Budgets |
| Corporate Energy Leader | 31 | 13 | 12 |
| Facility Energy Leader | 22 | 13 | 9 |
| No Energy Leader | 2 | 0 | 10 |
The test is statistically significant with a medium effect size. Sites with corporate or facility energy leaders are much more likely to report some form of dedicated project budget (either at the company or facility level). Sites with no energy leader are dominated by cases with no dedicated project budgets (about 83% of such sites). Thus, the presence of an energy leader is strongly associated with having dedicated budgets to support energy projects.
Appendix B.3. Energy Team Presence Versus Project Hopper Use
Variables:
- Row variable—energy team versus no energy team.
- Column variable—project hopper use (used versus not used).
The chi-square test of independence on the 2 × 2 contingency table (N = 71) gives χ2(1) = 0.31, p = 0.5771, Cramer’s V = 0.07.
Observed counts:
| Team Presence | Project Hopper Used | Project Hopper Not Used |
| Energy Team | 30 | 5 |
| No Energy Team | 28 | 8 |
This test is not statistically significant (p > 0.05). The proportion using a project hopper is slightly higher where an energy team exists (~86% versus ~78%), but the difference could reasonably be due to random variation in this sample. Within the available data, the presence of an energy team alone is not clearly associated with project hopper use.
Appendix B.4. Energy Team Presence Versus Project Budget Structure
Variables:
- Row variable—energy team versus no energy team.
- Column variable—budget structure (dedicated project budget [company], dedicated project budget [facility], no dedicated project budgets).
The chi-square test of independence on the 2 × 3 contingency table (N = 80) gives χ2(2) = 0.92, p = 0.6299, Cramer’s V = 0.11.
Observed counts:
| Team Presence | Dedicated Budget (Company) | Dedicated Budget (Facility) | No Dedicated Budgets |
| Energy Team | 19 | 12 | 10 |
| No Energy Team | 17 | 15 | 7 |
This test is not statistically significant. Sites with and without an energy team exhibit broadly similar mixes of company-level, facility-level, and no dedicated project budgets. Within this dataset, simply having an energy team does not appear to be strongly associated with how project budgets are structured.
Appendix B.5. Any Energy Leader Versus No Energy Leader (Collapsed Analysis)
To sharpen interpretation, corporate and facility energy leaders were combined into a single category (i.e., any energy leader) and compared with sites that have no energy leader.
Variables:
- Row variable—any energy leader versus no energy leader.
- Column variable—project hopper use (used versus not used).
The chi-square test of independence on the 2 × 2 contingency table (N = 97) gives χ2(1) = 9.59, p = 0.00195, Cramer’s V = 0.31.
Observed counts:
| Leader Presence | Project Hopper Used | Project Hopper Not Used |
| Any Energy Leader | 74 | 10 |
| No Energy Leader | 7 | 6 |
Sites with any type of energy leader use a project hopper in about 88% of cases, compared with about 54% where no energy leader exists. This association is statistically significant and indicates that the mere presence of an energy leader, regardless of level, supports more systematic project management.
Variables:
- Row variable—any energy leader versus no energy leader.
- Column variable—budget structure (dedicated project budget [company], dedicated project budget [facility], no dedicated project budgets).
The chi-square test of independence on the 2 × 3 contingency table (N = 112) gives χ2(2) = 21.04, p = 0.000027, Cramer’s V = 0.43.
Observed counts:
| Leader Presence | Dedicated Budget (Company) | Dedicated Budget (Facility) | No Dedicated Budgets |
| Any Energy Leader | 53 | 26 | 21 |
| No Energy Leader | 2 | 0 | 10 |
When an energy leader exists, the overwhelming majority of sites have some form of dedicated project budget (company or facility). In contrast, sites without an energy leader are much more likely to lack dedicated budgets altogether. The effect size here is moderate-to-large, emphasizing the central role of leadership in securing resources for energy projects.
The same variables were used with the introduction of two groups to compare based on their response to Q1 (SEM Maturity):
- Group 1: “Beginners”—individuals who answered (a) “has not started” or (b) “just starting”.
- Group 2: “Mature”—individuals who answered (c) “has an energy management program,” (d) “has been working with Better Plants and is ready to engage more with 50001 Ready,” (e) “has some sites with 50001 Ready Recognition and plans to do more,” (f) “has some sites with ISO 50001 certification and plans to do more,” or (g) “has plans to pursue superior energy performance (SEP) at one or more sites”.
Group 1 “Beginners”: The chi-square test of independence on the 2 × 3 contingency table (N = 28) gives χ2(2) = 4.91, p = 0.086, Cramer’s V = 0.42.
Observed counts:
| Leader Presence | Dedicated Budget (Company) | Dedicated Budget (Facility) | No Dedicated Budgets |
| Any Energy Leader | 9 | 4 | 8 |
| No Energy Leader | 1 | 0 | 6 |
For ‘Beginner’ SEM organizations, the association between the presence of an energy leader and a dedicated budget was not statistically significant (p > 0.05). This suggests that in the early stages of SEM adoption, organizational structures are often ad hoc, with leadership roles and funding mechanisms remaining ‘decoupled.’
Group 2: The chi-square test of independence on the 2 × 3 contingency table (N = 76) gives χ2(2) = 15.29, p = 0.00048, Cramer’s V = 0.45.
Observed counts:
| Leader Presence | Dedicated Budget (Company) | Dedicated Budget (Facility) | No Dedicated Budgets |
| Any Energy Leader | 44 | 23 | 7 |
| No Energy Leader | 0 | 0 | 2 |
For ‘Mature’ SEM organizations, the association was statistically significant. This indicates that as energy management practices become embedded, the role of the energy leader and the provision of dedicated funding become structurally interdependent.
Appendix B.6. Conclusions
Taken together, these chi-square tests suggest the following:
- The presence and level of an energy leader (corporate or facility) are strongly associated with both higher use of a project hopper and greater likelihood of having dedicated project budgets. This indicates that clear leadership accountability is a key enabler of disciplined project identification and resourcing.
- In contrast, the presence of an energy team by itself shows no statistically significant association with project hopper use or budget structure in this dataset. Energy teams may still be valuable, but without empowered leadership, they do not appear to systematically change how projects are pipelined or funded.
- Strategically, organizations that wish to strengthen their energy management programs should prioritize establishing designated energy leaders (at corporate and/or facility levels) with authority over project pipelines and budgets. Energy teams can then support these leaders, but leadership commitment and control of resources appear to be the primary drivers.
In summary, leadership matters more than structure alone. Formal energy leadership is closely linked to having both the tools (project hoppers) and the resources (dedicated budgets) needed for effective strategic energy management.
Appendix C. Key Team Members for a Facility Energy Team
Table A1 provides descriptions of key personnel to include on the energy team.
Table A1.
Key team members for a facility energy team.
References
- International Energy Agency. Multiple Benefits of Energy Efficiency; IEA: Paris, France, 2025. [Google Scholar]
- Cresko, J.; Dollinger, C.; Ray, B.; Shimizu, K.; Marchetti, L.; Gage, S.; Gainer, M.; Kirkbride, C.; Armstrong, K.; Atnoorkar, S. Transformative Pathways for US Industry: Unlocking American Innovation; Oak Ridge National Laboratory (ORNL): Oak Ridge, TN, USA, 2024. [Google Scholar]
- Sundaramoorthy, S.; Kamath, D.; Nimbalkar, S.; Price, C.; Wenning, T.; Cresko, J. Energy Efficiency as a Foundational Technology Pillar for Industrial Decarbonization. Sustainability 2023, 15, 9487. [Google Scholar] [CrossRef] [Scilit]
- Solnørdal, M.T.; Foss, L. Closing the Energy Efficiency Gap—A Systematic Review of Empirical Articles on Drivers to Energy Efficiency in Manufacturing Firms. Energies 2018, 11, 518. [Google Scholar] [CrossRef] [Scilit]
- Bataille, C.; Åhman, M.; Neuhoff, K.; Nilsson, L.J.; Fischedick, M.; Lechtenböhmer, S.; Solano-Rodriquez, B.; Denis-Ryan, A.; Stiebert, S.; Waisman, H.; et al. A review of technology and policy deep decarbonization pathway options for making energy-intensive industry production consistent with the Paris Agreement. J. Clean. Prod. 2018, 187, 960–973. [Google Scholar] [CrossRef] [Scilit]
- Kim, J.; Sovacool, B.K.; Bazilian, M.; Griffiths, S.; Yang, M. Energy, material, and resource efficiency for industrial decarbonization: A systematic review of sociotechnical systems, technological innovations, and policy options. Energy Res. Soc. Sci. 2024, 112, 103521. [Google Scholar] [CrossRef] [Scilit]
- Thiel, G.P.; Stark, A.K. To decarbonize industry, we must decarbonize heat. Joule 2021, 5, 531–550. [Google Scholar] [CrossRef] [Scilit]
- Cresko, J.; Thekdi, A.; Nimbalkar, S.U.; Thirumaran, K.; Hasanbeigi, A.; Chaudhari, S. Thermal Process Intensification: Transforming the Way Industry Uses Thermal Process Energy (Workshop Report); Oak Ridge National Laboratory (ORNL): Oak Ridge, TN, USA, 2022. [Google Scholar]
- International Energy Agency. Net Zero by 2050 Scenario; IEA: Paris, France, 2021. [Google Scholar]
- Fitzgerald, P.; Therkelsen, P.; Sheaffer, P.; Rao, P. Deeper and persistent energy savings and carbon dioxide reductions achieved through ISO 50001 in the manufacturing sector. Sustain. Energy Technol. Assess. 2023, 57, 103280. [Google Scholar] [CrossRef] [Scilit]
- Javied, T.; Rackow, T.; Franke, J. Implementing Energy Management System to Increase Energy Efficiency in Manufacturing Companies. Procedia CIRP 2015, 26, 156–161. [Google Scholar] [CrossRef] [Scilit]
- ISO 50001; Energy Management Systems—Requirements with Guidance for Use (ISO 50001:2018). International Organization for Standardization: Geneva, Switzerland, 2018.
- Marimon, F.; Casadesús, M. Reasons to Adopt ISO 50001 Energy Management System. Sustainability 2017, 9, 1740. [Google Scholar] [CrossRef] [Scilit]
- Fuchs, H.; Aghajanzadeh, A.; Therkelsen, P. Identification of drivers, benefits, and challenges of ISO 50001 through case study content analysis. Energy Policy 2020, 142, 111443. [Google Scholar] [CrossRef] [Scilit]
- ISO. ISO Survey 2020. 2022. Available online: https://www.iso.org/the-iso-survey.html (accessed on 12 May 2022).
- Yuriev, A.; Boiral, O. Implementing the ISO 50001 System: A Critical Review. In ISO 9001, ISO 14001, and New Management Standards; Heras-Saizarbitoria, I., Ed.; Springer International Publishing: Cham, Switzerland, 2018; pp. 145–175. [Google Scholar]
- Blass, V.; Corbett, C.J.; Delmas, M.A.; Muthulingam, S. Top management and the adoption of energy efficiency practices: Evidence from small and medium-sized manufacturing firms in the US. Energy 2014, 65, 560–571. [Google Scholar] [CrossRef] [Scilit]
- May, G.; Stahl, B.; Taisch, M.; Kiritsis, D. Energy management in manufacturing: From literature review to a conceptual framework. J. Clean. Prod. 2017, 167, 1464–1489. [Google Scholar] [CrossRef] [Scilit]
- Clayton, K.L. The Energy Manager’s Role in the Design–build–operation Process. Strateg. Plan. Energy Environ. 2003, 23, 45–53. [Google Scholar] [CrossRef] [Scilit]
- Lung, R.B. Trailblazers and Goal Achievers: How Better Plants Partners Achieved Ambitious Energy Goals; U.S. Department of Energy: Washington, DC, USA, 2021.
- Palm, J.; Thollander, P. An interdisciplinary perspective on industrial energy efficiency. Appl. Energy 2010, 87, 3255–3261. [Google Scholar] [CrossRef] [Scilit]
- Soepardi, A.; Pratikto, P.; Santoso, P.; Tama, I.; Thollander, P. Linking of Barriers to Energy Efficiency Improvement in Indonesia’s Steel Industry. Energies 2018, 11, 234. [Google Scholar] [CrossRef] [Scilit]
- U.S. Department of Energy. Better Buildings Progress Report 2023; U.S. Department of Energy: Washington, DC, USA, 2023.
- U.S. Department of Energy. Better Buildings Progress Report 2024; U.S. Department of Energy: Washington, DC, USA, 2024.
- U.S. Energy Information Administration. 2018 Manufacturing Energy Consumption Survey; U.S. Energy Information Administration: Washington, DC, USA, 2021.
- U.S. Energy Information Administration. Table 8.4: Number of Establishments by Participation in Specific Energy-Management Activities, 2018; U.S. Energy Information Administration: Washington, DC, USA, 2018.
- Boyd, G.; Curtis, M.; Zhang, Z. Impact of Strategic Energy Management Practices on Energy Efficiency: Evidence from Plant-Level Data. In Proceedings of the ACEEE 2021 Summer Study on Energy Efficiency in Industry, Virtual, 12–15 July 2021. [Google Scholar]
- U.S. Energy Information Administration. Table 8.4: Number of Establishments by Participation in Specific Energy-Management Activities, 2022; U.S. Energy Information Administration, Office of Energy Demand and Integrated Statistics: Washington, DC, USA, 2025.
- U.S. Environmental Protection Agency. Guidelines for Energy Management; U.S. Environmental Protection Agency: Washington, DC, USA, 2013.
- Lazarou, K. Energy Leaders: The Powerhouse of Energy Management at 3M. In Proceedings of the AEE East Energy Conference and Expo 2022, Cincinnati, OH, USA, 23–24 March 2022; pp. 35–47. [Google Scholar]
- U.S. Department of Energy. Better Plants Non-Energy Benefits Fact Sheet; U.S. Department of Energy: Washington, DC, USA, 2024.
- International Energy Agency. Capturing the Multiple Benefits of Energy Efficiency; International Energy Agency: Paris, France, 2015. [Google Scholar]
- Lung, B.; Nimbalkar, S.U.; Wenning, T. Multiple Benefits of Industrial Energy Efficiency—Lessons Learned and New Initiatives. In Proceedings of the Industrial Energy Technology Conference (IETC), New Orleans, LA, USA, 18–20 June 2019. [Google Scholar]
- U.S. Department of Energy. About Better Plants. 2024. Available online: https://betterbuildingssolutioncenter.energy.gov/better-plants/about (accessed on 7 February 2024).
- U.S. Department of Energy. About Better Climate Challenge. 2024. Available online: https://betterbuildingssolutioncenter.energy.gov/climate-challenge (accessed on 7 February 2024).
- U.S. Department of Energy. Better Plants Energy Bootcamp. 2024. Available online: https://energybootcamp.ornl.gov/ (accessed on 24 June 2024).
- Slido. Slido—Audience Interaction Made Easy. 2024. Available online: https://www.slido.com/features-survey (accessed on 25 January 2025).
- ISO 9001; Quality Management Systems—Requirements (ISO 9001:2015). International Organization for Standardization: Geneva, Switzerland, 2015.
- ISO 14001:2015; Environmental Management Systems—Requirements with Guidance for Use. International Organization for Standardization: Geneva, Switzerland, 2015.
- U.S. Department of Energy. SEP 50001™ Better Buildings Solution Center. 2024. Available online: https://betterbuildingssolutioncenter.energy.gov/iso-50001/sep-50001 (accessed on 23 September 2024).
- Teece, D.J.; Pisano, G.; Shuen, A. Dynamic Capabilities and Strategic Management. Strateg. Manag. J. 1998, 18, 509–533. [Google Scholar] [CrossRef] [Scilit]
- Feldman, M.S.; Pentland, B.T. Reconceptualizing Organizational Routines as a Source of Flexibility and Change. Adm. Sci. Q. 2003, 48, 94–118. [Google Scholar] [CrossRef] [Scilit]
- Eisenhardt, K.M. Agency Theory: An Assessment and Review. Acad. Manag. Rev. 1989, 14, 57–74. [Google Scholar] [CrossRef] [Scilit]
- Ingersoll Rand. 2024 Sustainability Report: Enabling Growth—Leading Sustainably with Purpose; Ingersoll Rand Inc.: Davidson, NC, USA, 2024. [Google Scholar]
- Ingersoll Rand. Environmental Goals—Operate Sustainably. 2025. Available online: https://www.irco.com/en/sustainability/operate/environmental-intro/environmental-goals/ (accessed on 30 September 2025).
- U.S. Department of Energy. Better Buildings Solution Center. 2025. Available online: https://betterbuildingssolutioncenter.energy.gov/partners/ingersoll-rand (accessed on 24 June 2025).
- Gordon, S. Sustainability Excellence in Operations Leading Sustainably with Green-X. In Proceedings of the Better Buildings Summit 2023, Washington, DC, USA, 11–13 April 2023. [Google Scholar]
- Miera, K.; Botts, A.; Lemar, P.; Kamath, D.; Wenning, T. Unlocking Manufacturing Sustainability: Energy Efficiency Opportunities through the US Department of Energy’s Better Plants Program Energy Treasure Hunts (2023–2024). Sustainability 2024, 16, 7918. [Google Scholar] [CrossRef] [Scilit]
- U.S. Department of Energy. Association of Energy Engineers Certified Energy Manager Program Becomes First Credential Recognized Under Better Buildings Workforce Guidelines; U.S. Department of Energy, Office of Energy Efficiency and Renewable Energy: Washington, DC, USA, 2015.
- Association of Energy Engineers. Certified Energy Manager®—CEM®; Association of Energy Engineers: Atlanta, GA, USA, 2025. [Google Scholar]


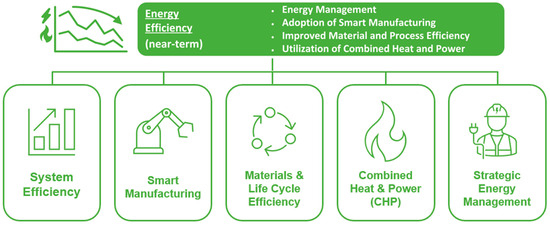
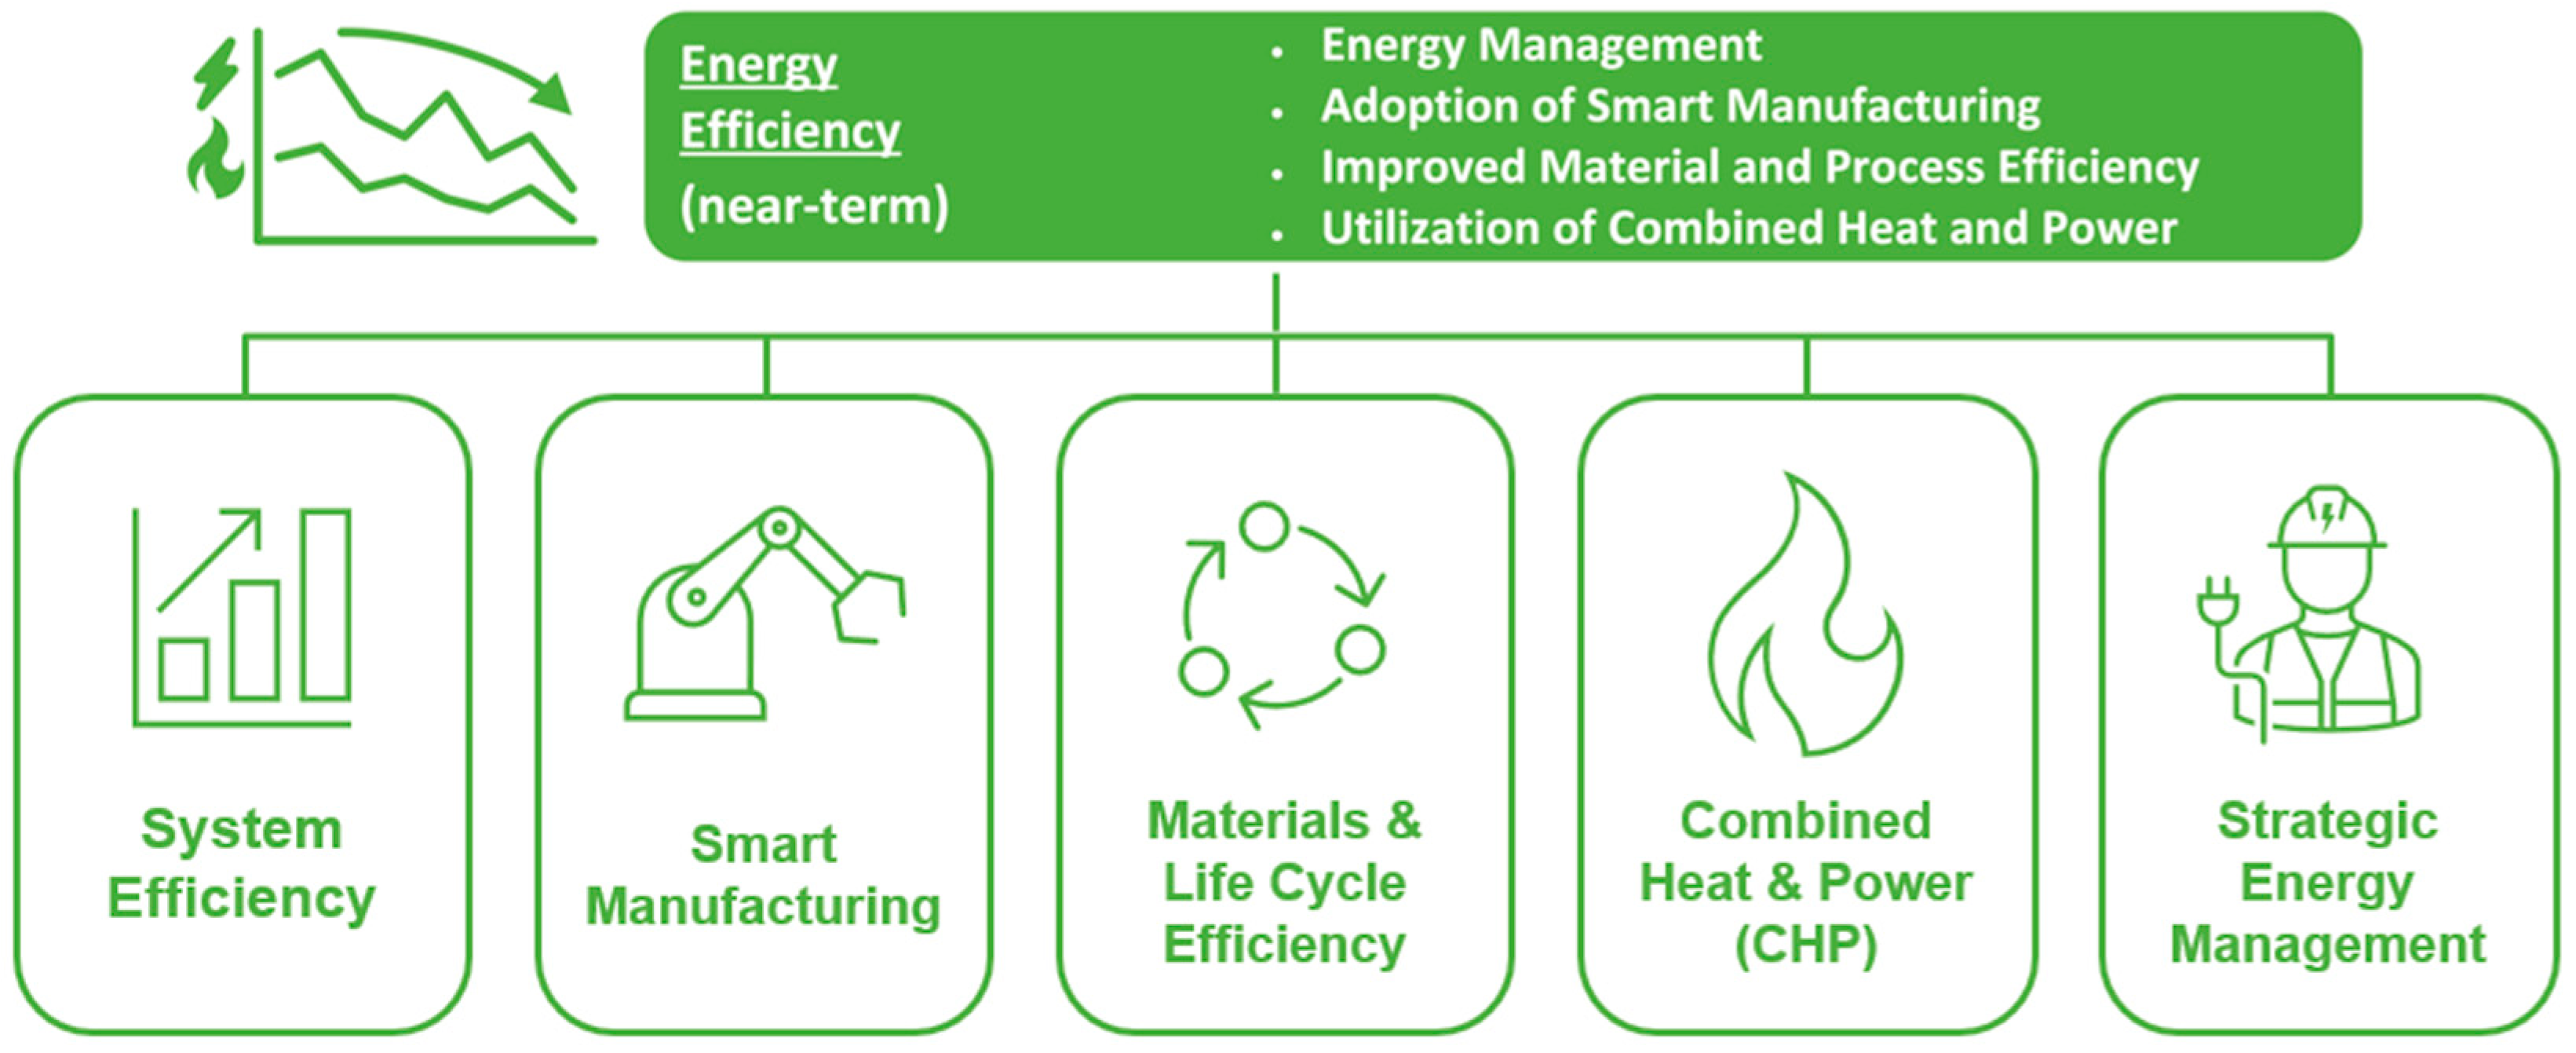
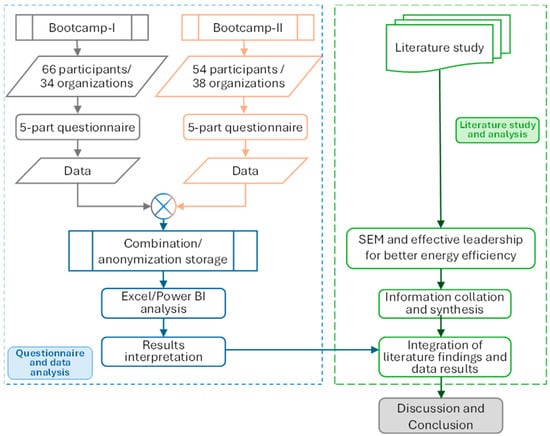
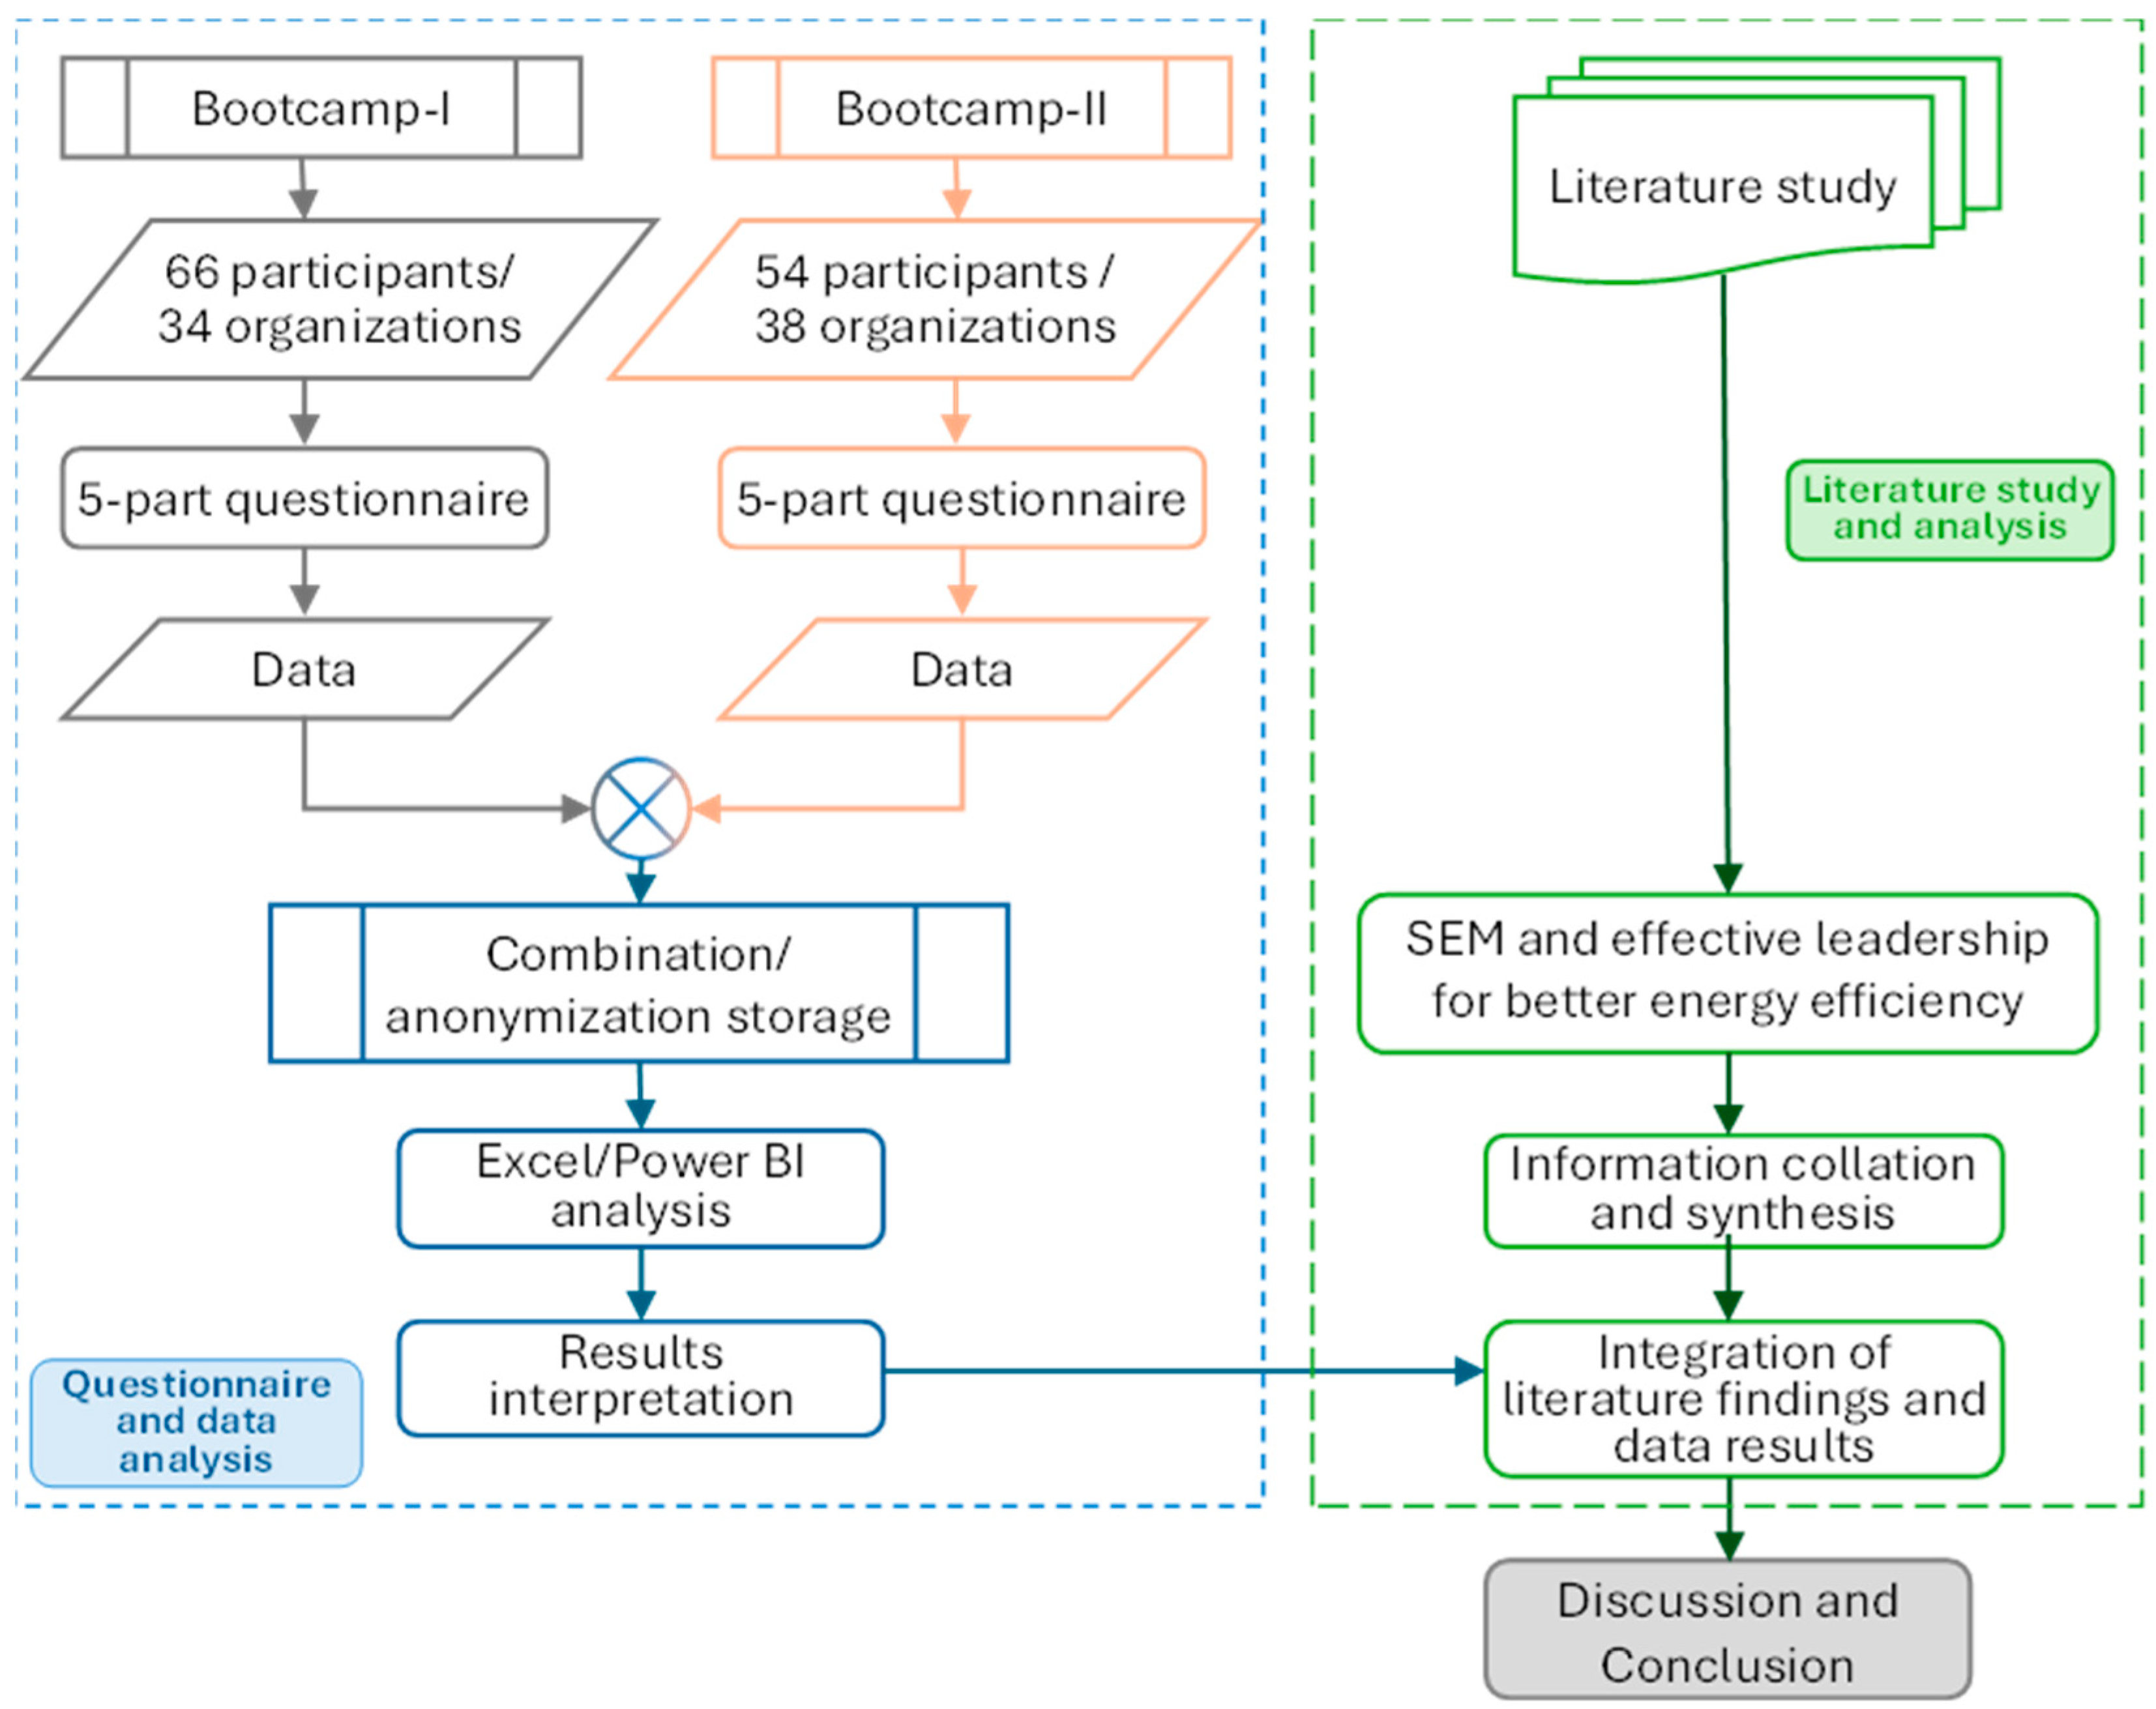
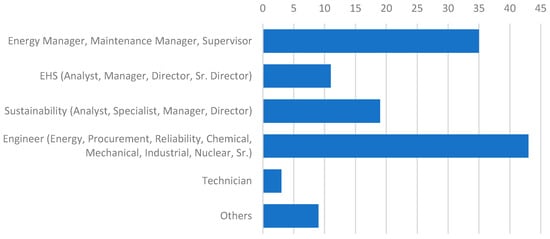
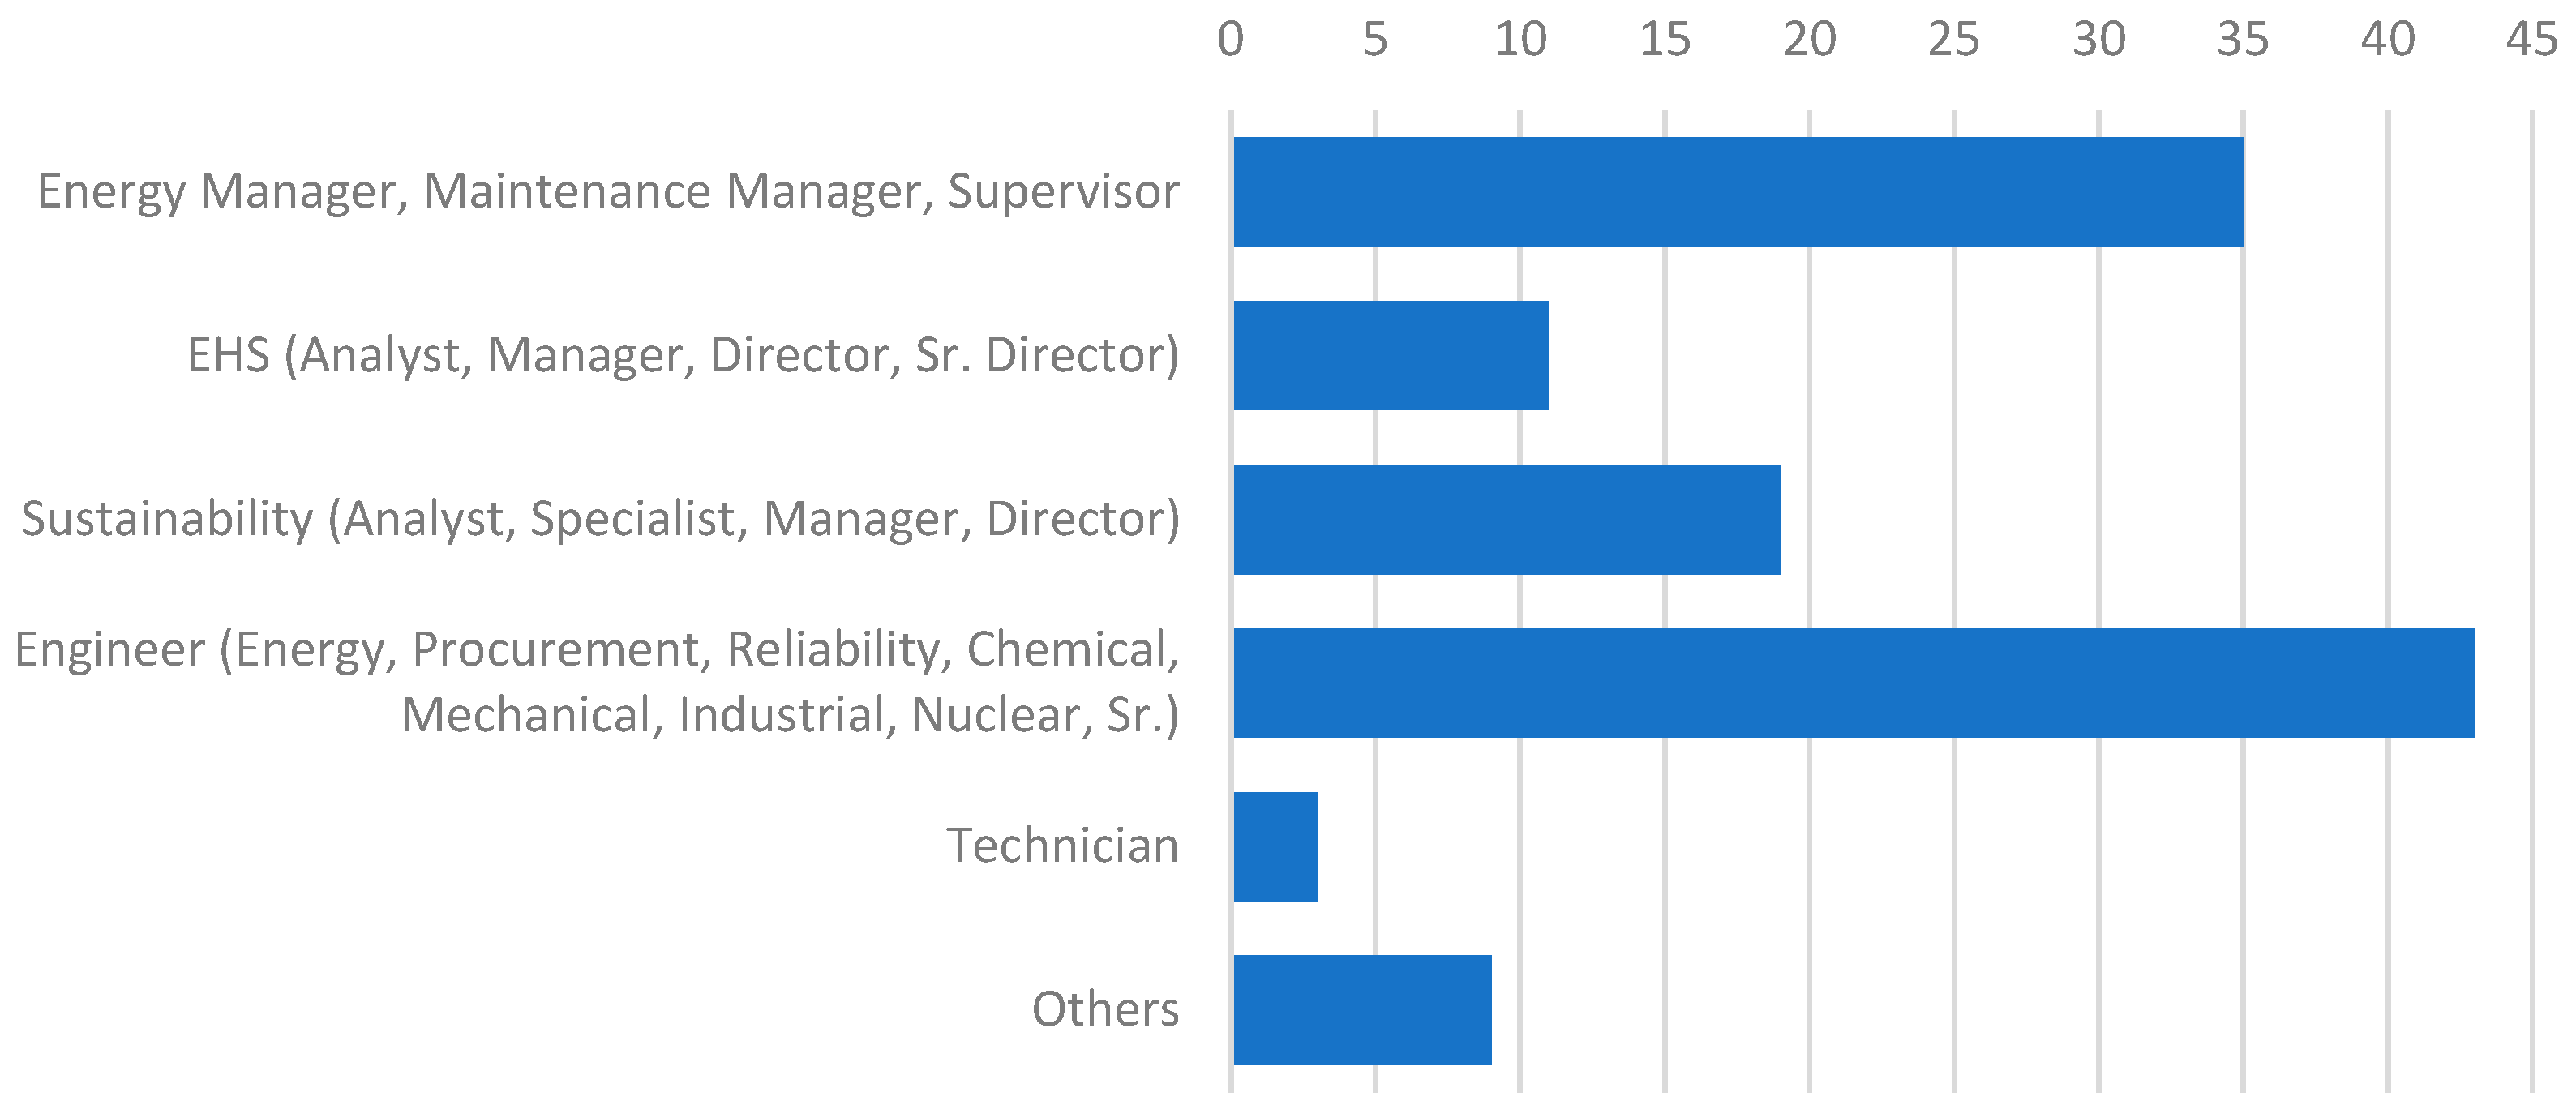
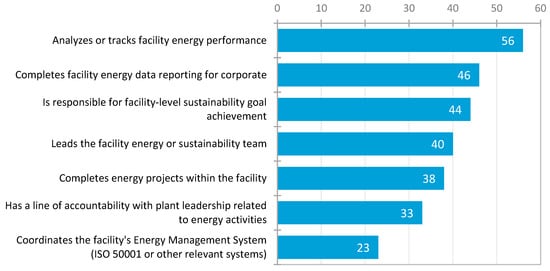
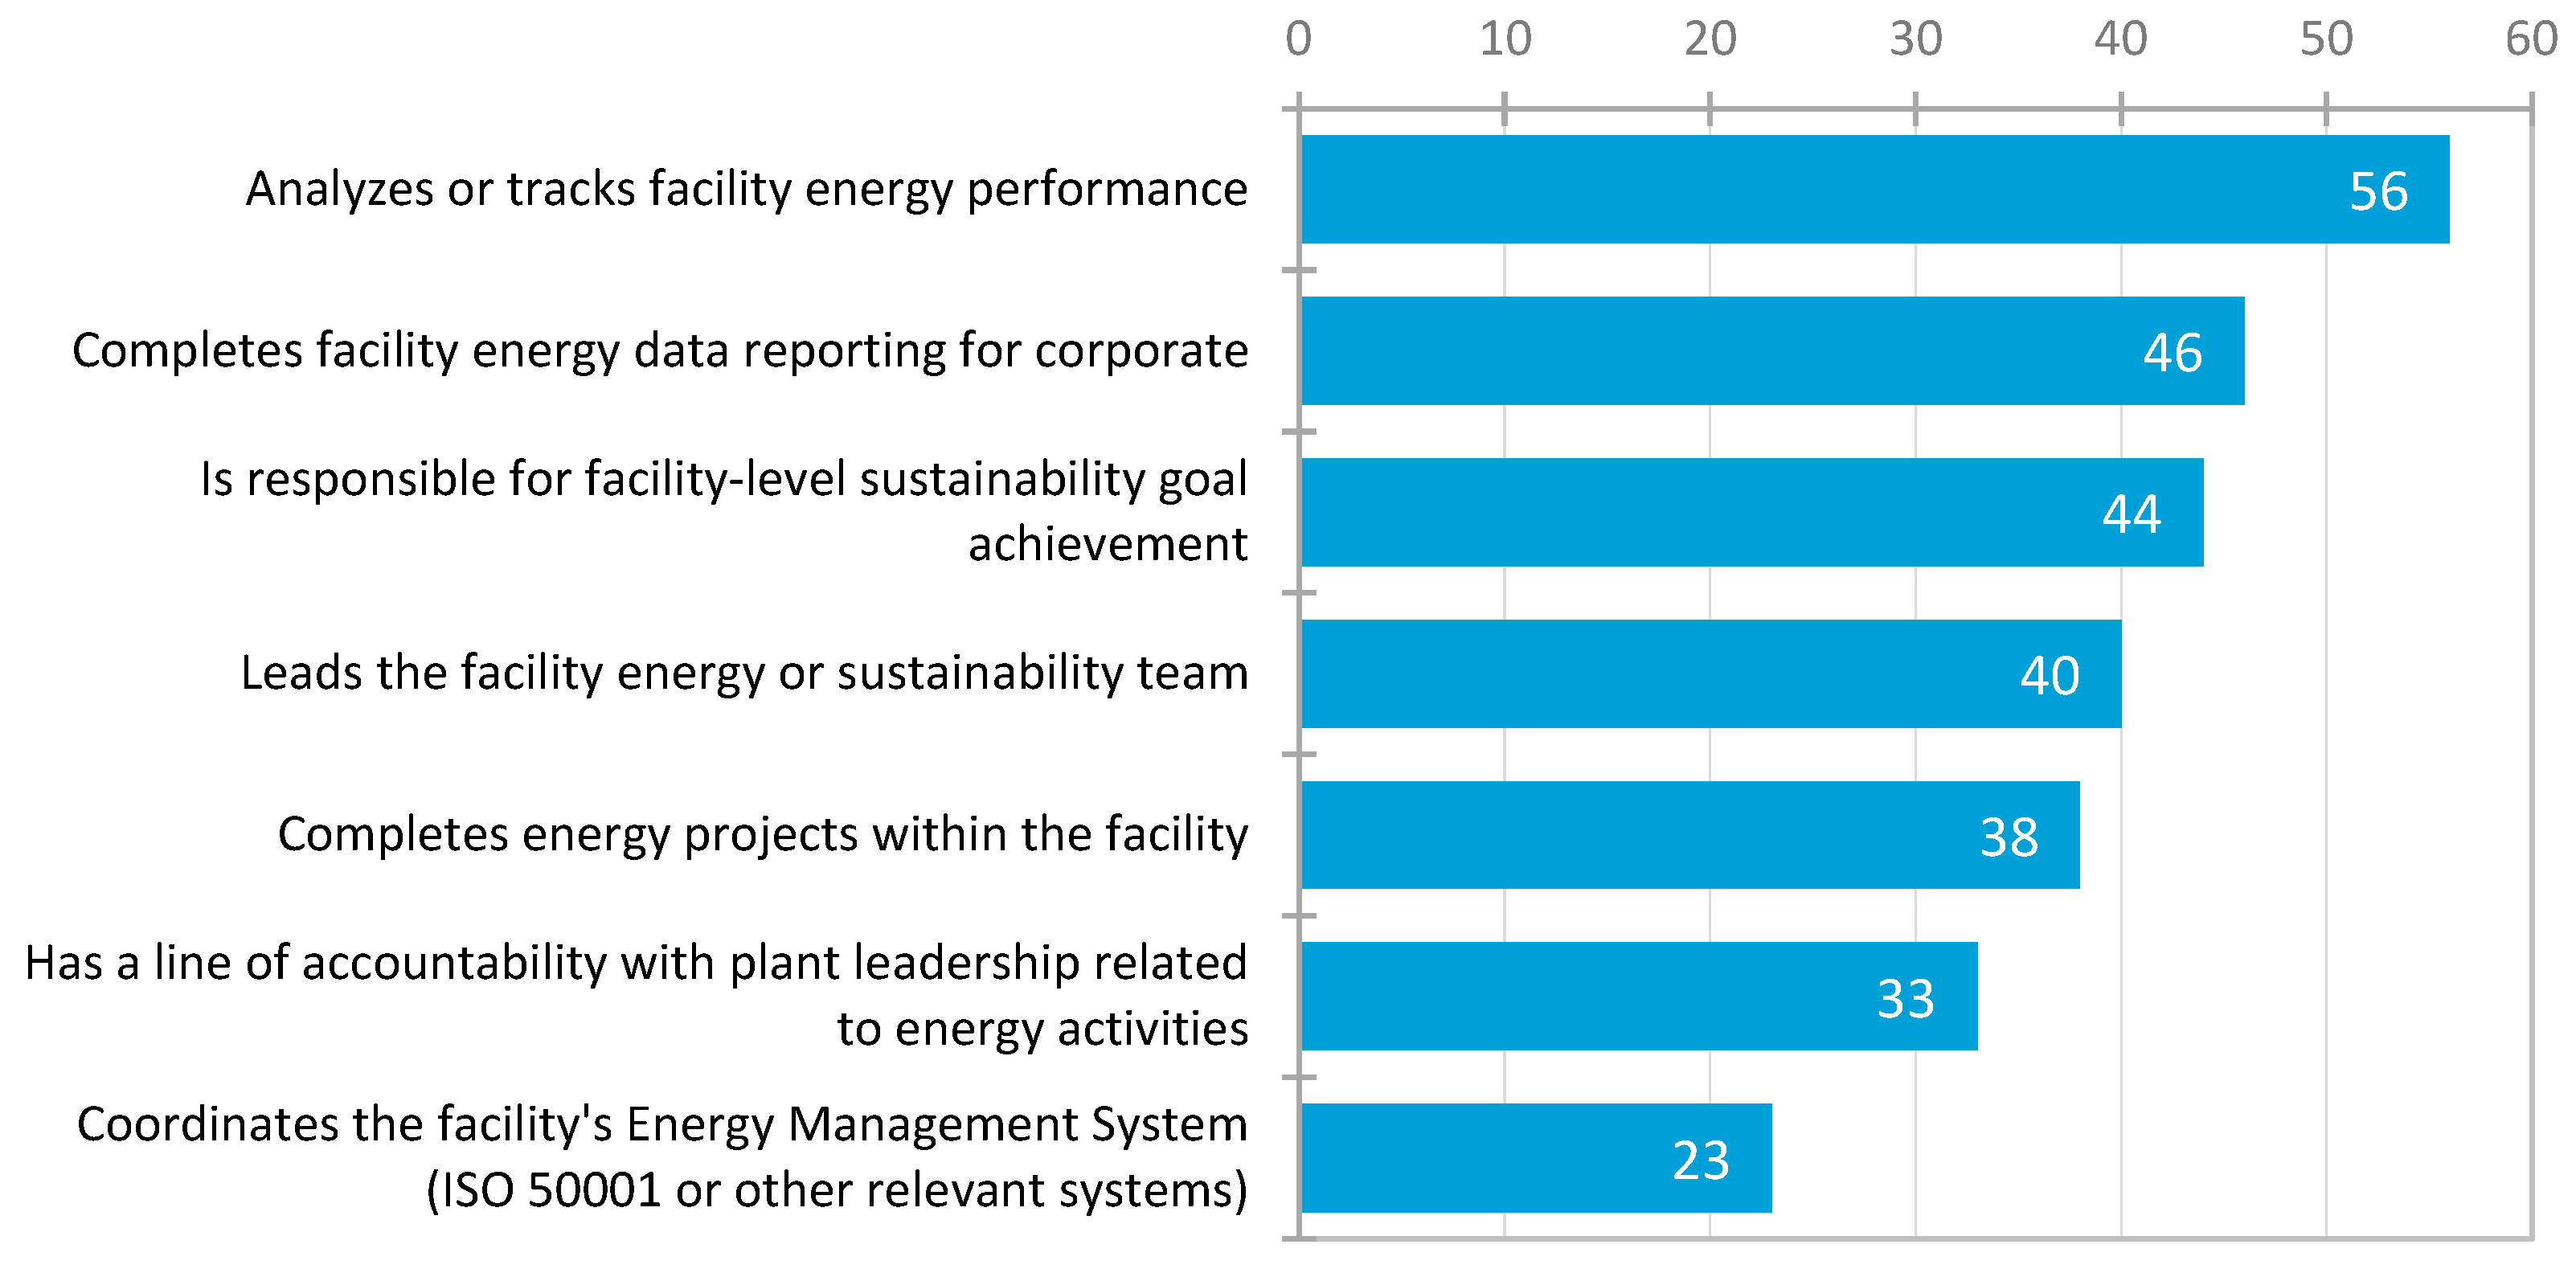
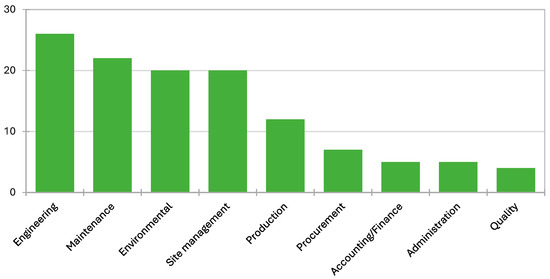
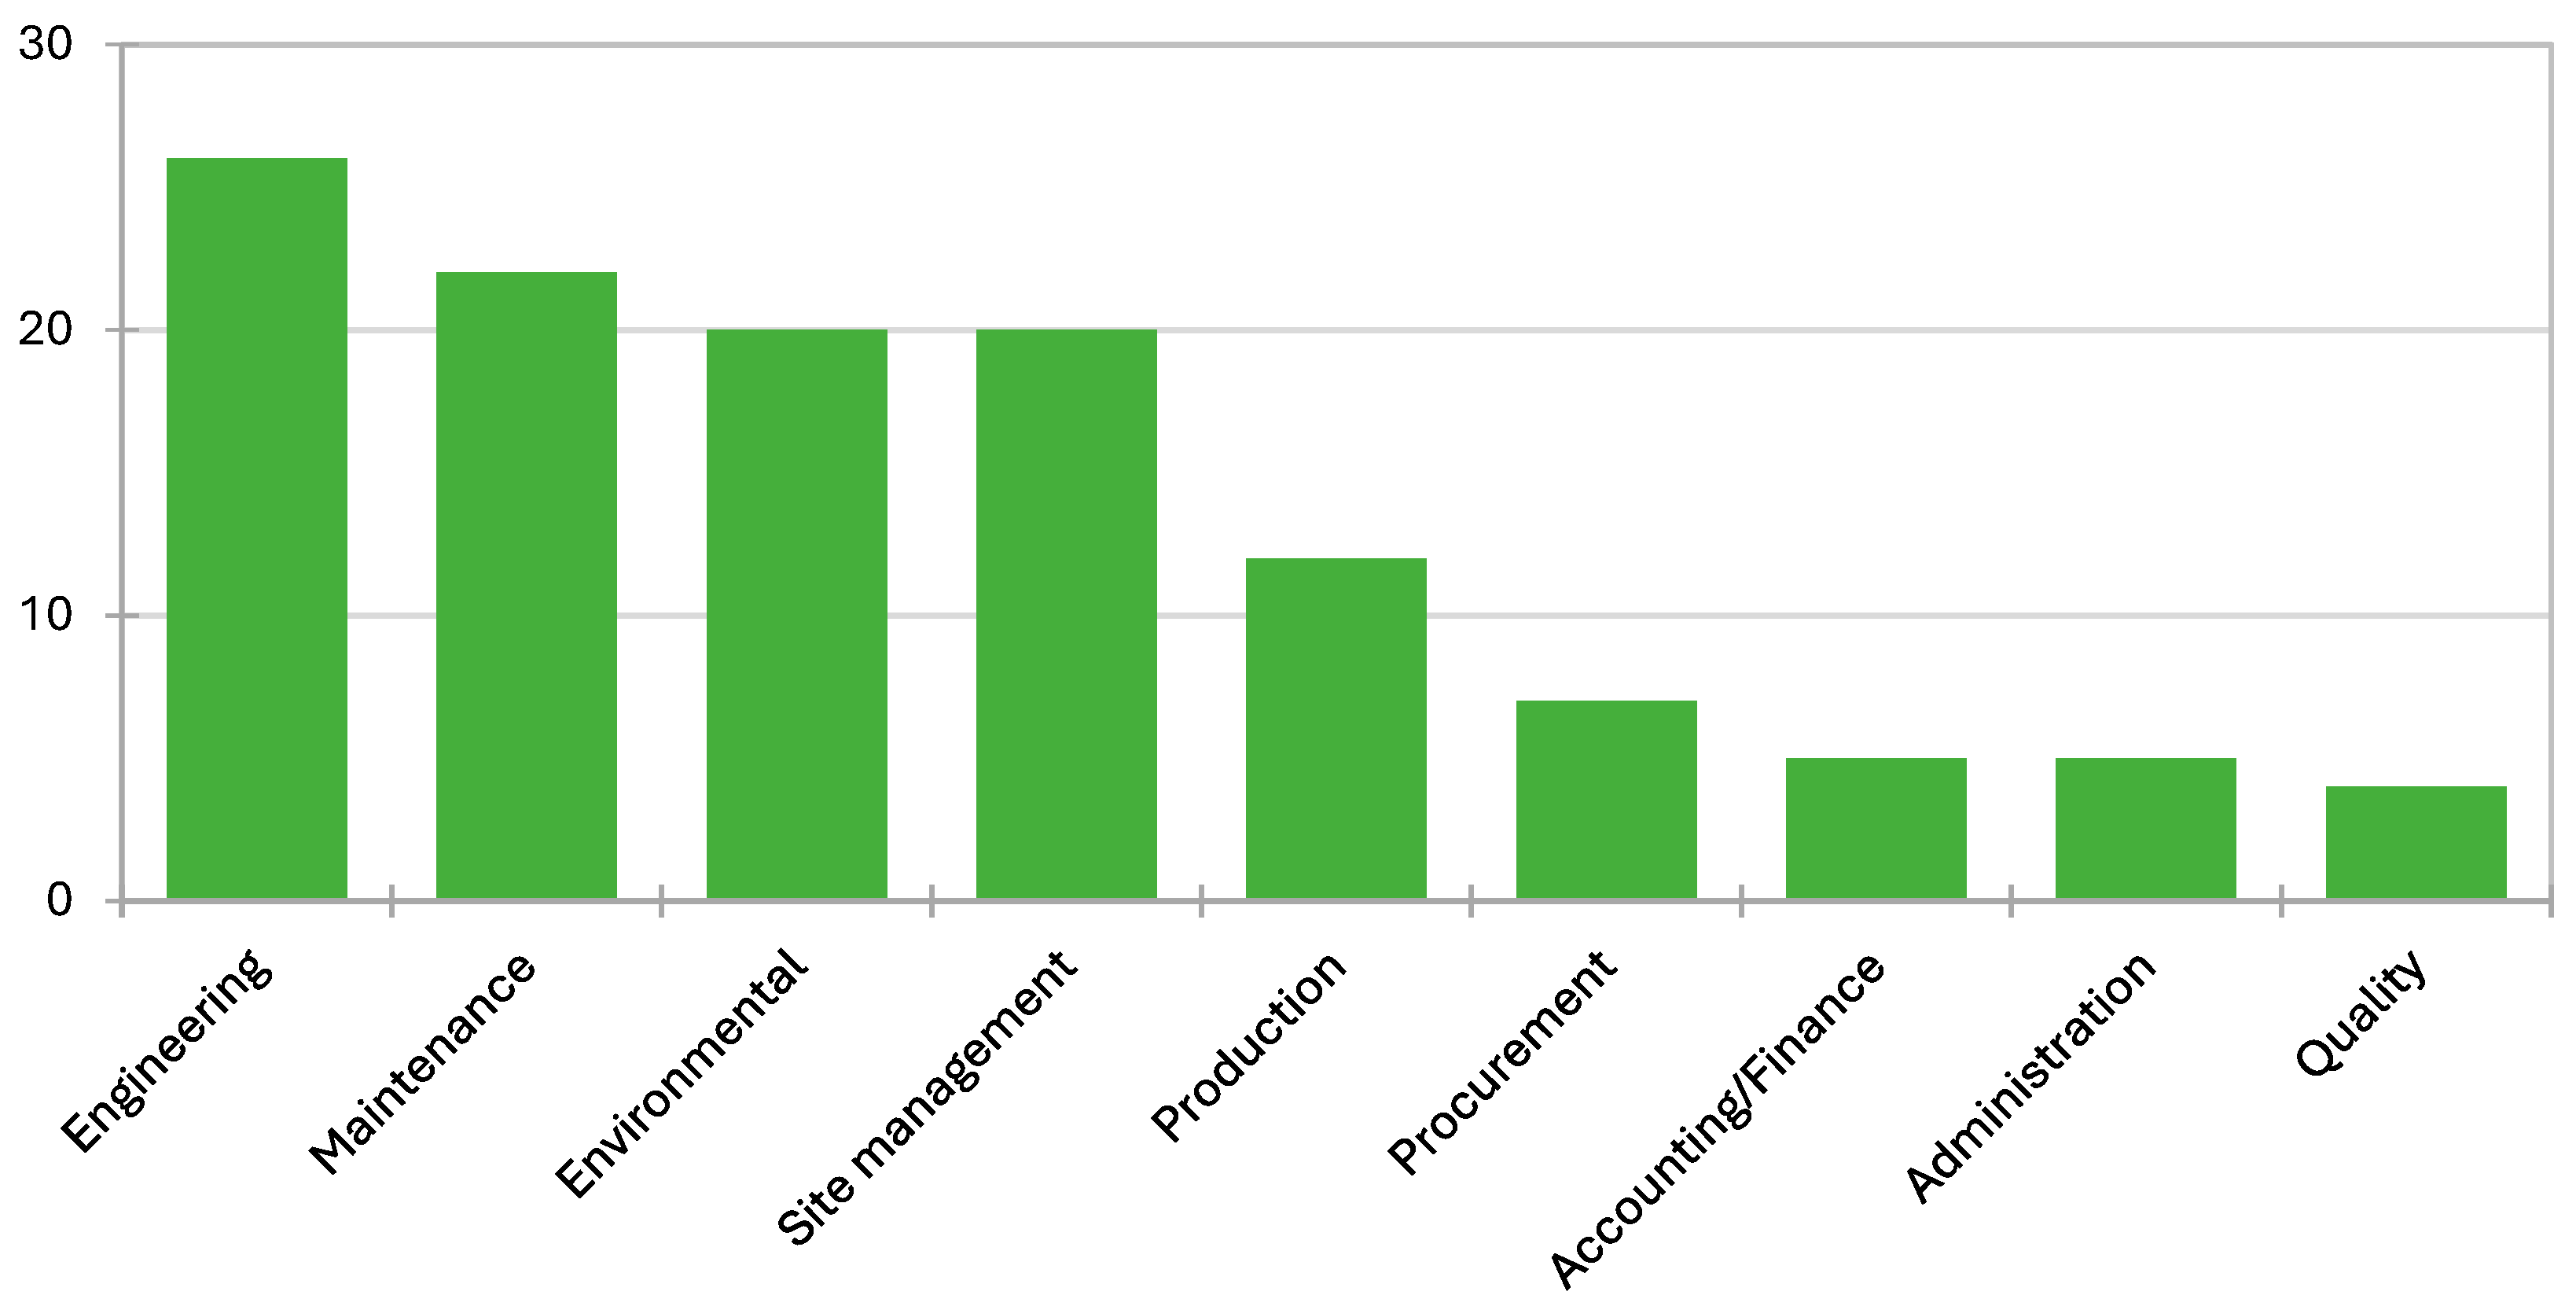
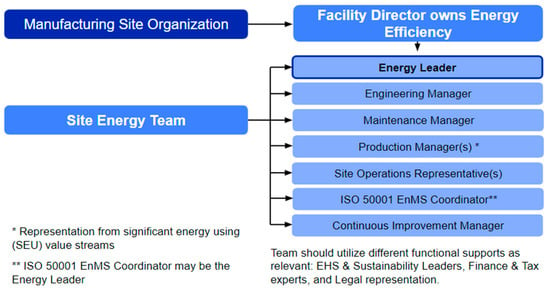
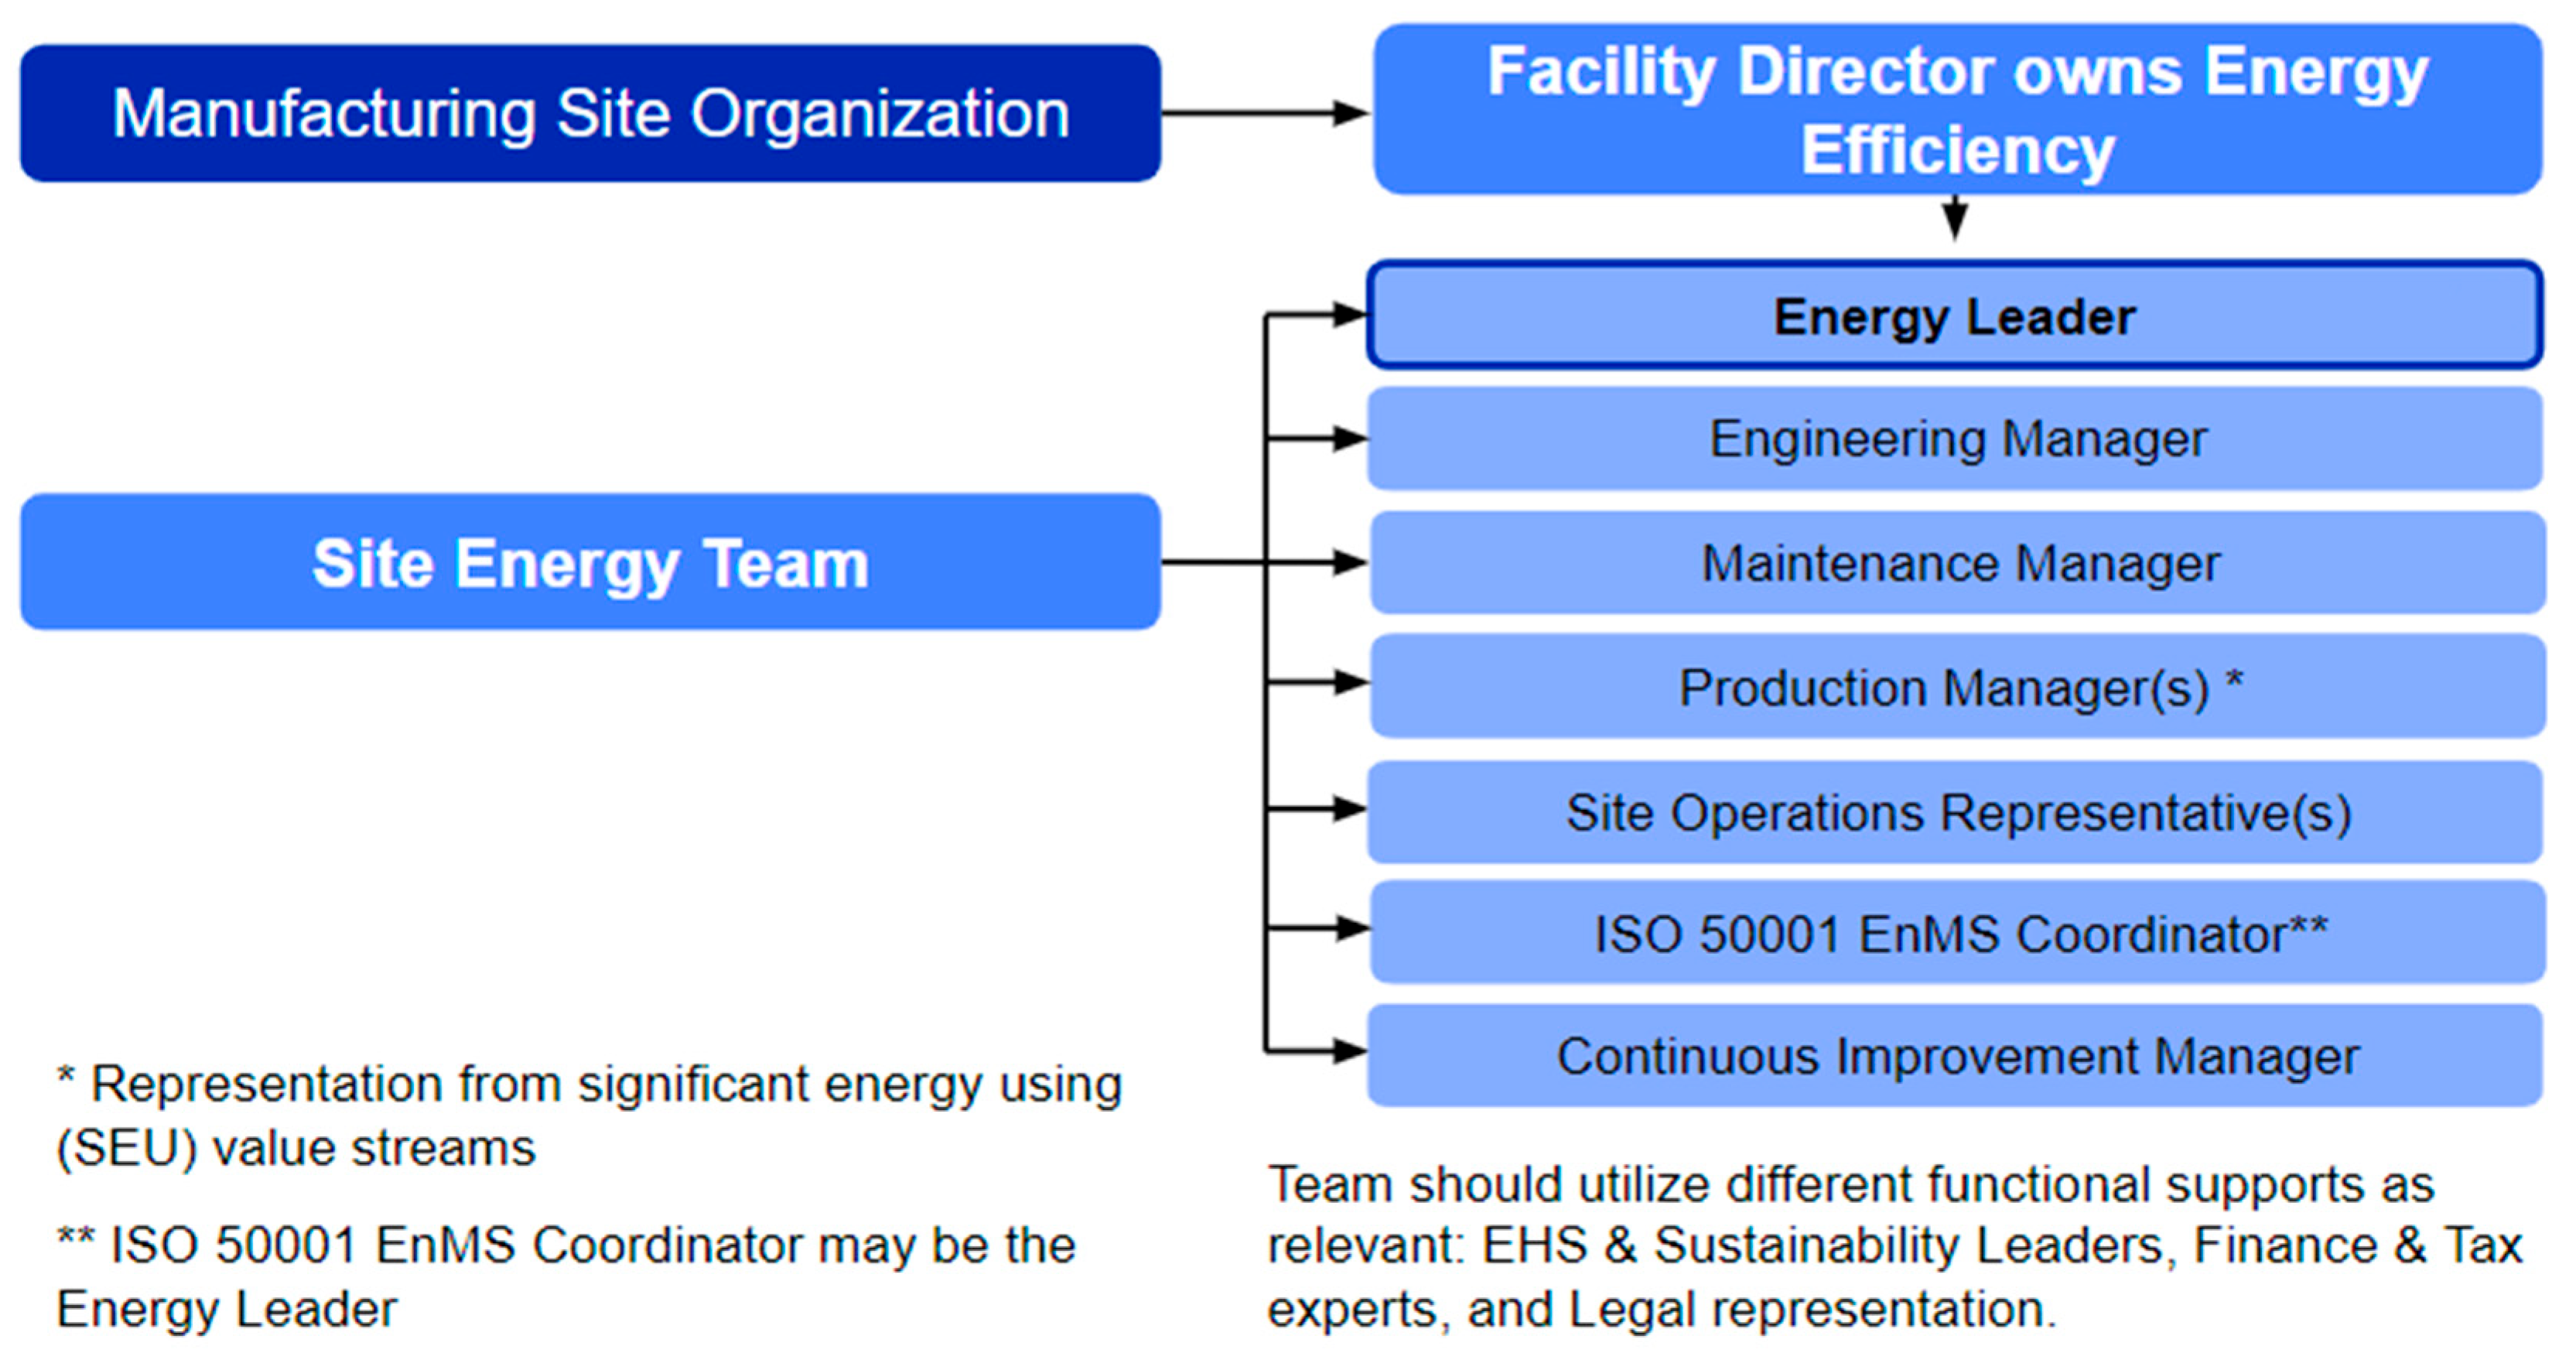

Disclaimer/Publisher’s Note: The statements, opinions and data contained in all publications are solely those of the individual author(s) and contributor(s) and not of MDPI and/or the editor(s). MDPI and/or the editor(s) disclaim responsibility for any injury to people or property resulting from any ideas, methods, instructions or products referred to in the content. |
© 2026 by the authors. Licensee MDPI, Basel, Switzerland. This article is an open access article distributed under the terms and conditions of the Creative Commons Attribution (CC BY) license.