


Abstract
Preferential flow limits productive CO2–oil contact in heterogeneous extra-heavy-oil systems. This study compares viscosity reduction followed by gel conformance control (VR → PA) with the reverse order during immiscible CO2 huff-n-puff. PVT measurements, dissolution tests, chemical screening, and six treatment schemes in parallel artificial cores with independently collected oil production were combined. At 56.6 °C and 12.01 MPa, below the measured minimum miscibility pressure of 35.9 MPa, dissolved CO2 reduced live-oil viscosity from 5505 to 45 mPa·s. Final recovery was 7.16 ± 0.05% for VR → PA, 5.77 ± 0.05% for CO2 alone, and 6.77 ± 0.03% for PA → VR (two independent dual-core models per scheme; mean ± half range). The corresponding gains were 1.39 percentage points over CO2 alone and 0.39 percentage points over the reverse order. After PA in the final VR → PA cycle, the high-permeability oil-production share fell from 69.4% to 60.5%, and low-permeability incremental recovery reached 2.17%. The water and single-agent controls, separate plugging tests, and cycle-resolved responses support a conceptual sequence of mobilization followed by conformance improvement. The sequence ranking is an observation under the tested conditions and does not establish a statistically significant sequence effect. The contribution to CCUS-EOR is improved oil recovery and a treatment strategy for contact management; CO2 utilization and storage enhancement were not quantified because the cyclic tests did not record a complete CO2 balance.
1. Introduction
Carbon capture, utilization, and storage combined with enhanced oil recovery (CCUS-EOR) uses captured CO2 as a working fluid to produce additional oil while retaining part of the injected gas in the reservoir. Its technical value therefore depends on two linked outcomes: the injected CO2 must contact and mobilize recoverable oil, and its flow must be controlled so that the gas occupies a broader reservoir volume rather than rapidly returning through preferential pathways. Heavy and extra-heavy oils are suitable targets because dissolved CO2 can reduce viscosity, swell the oil, and provide solution-gas drive during depressurization [1,2,3,4,5,6,7,8]. Cyclic injection is particularly useful in complex reservoirs where a stable interwell displacement pattern is difficult to establish.
A principal constraint in heterogeneous systems is limited effective contact. During repeated huff-n-puff cycles, high-permeability pathways can remain preferentially accessible, while oil in less-permeable regions contributes little to production. Local equilibrium viscosity reduction and swelling do not establish the volume of oil contacted during a finite injection and soaking period [9,10,11,12,13,14,15,16,17,18,19,20,21,22,23,24,25,26]. Controlling preferential pathways is therefore relevant to oil recovery. Its relevance to CO2 utilization and storage must be distinguished from a demonstrated improvement in those outcomes, which requires gas-balance measurements in addition to oil production.
A viscosity reducer (VR) and a gel plugging agent (PA) offer complementary means of addressing oil mobility and preferential flow. VR can reduce the apparent viscosity of an oil–aqueous mixture and increase production from accessible oil. PA can increase resistance in a dominant pathway, potentially allowing subsequent injection to access less-permeable regions [2,3,25,27,28,29,30,31,32,33,34,35,36,37,38,39,40,41,42,43,44]. Their order could matter if plugging precedes mobilization of recoverable oil in the active pathway. However, the timing of this trade-off depends on the remaining oil distribution, chemical placement, and the cyclic operating schedule.
Recent studies provide a broader context for chemical-assisted cyclic CO2 recovery. Foam–gel work in 2023 combined mobility control and preferential-pathway restriction [45], while gel studies in 2024–2025 examined plugging mechanisms and protection of productive pore space [40,42]. Field reports describe cyclic CO2 in mature heavy oil [46], contrasting economic outcomes in shale pilots [47], and separate recovery and retention performance at Tall Cotton [48]. Operating-parameter optimization [49] and 2026 visualization/simulation of heterogeneous fractured systems [50] further show that contact, pressure, soaking, and connectivity influence performance. These advances motivate examining treatment order while keeping oil-recovery evidence separate from carbon-accounting claims.
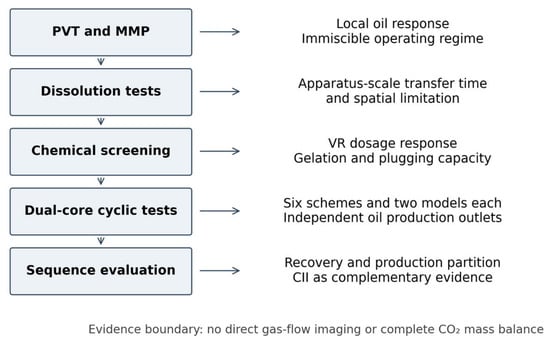
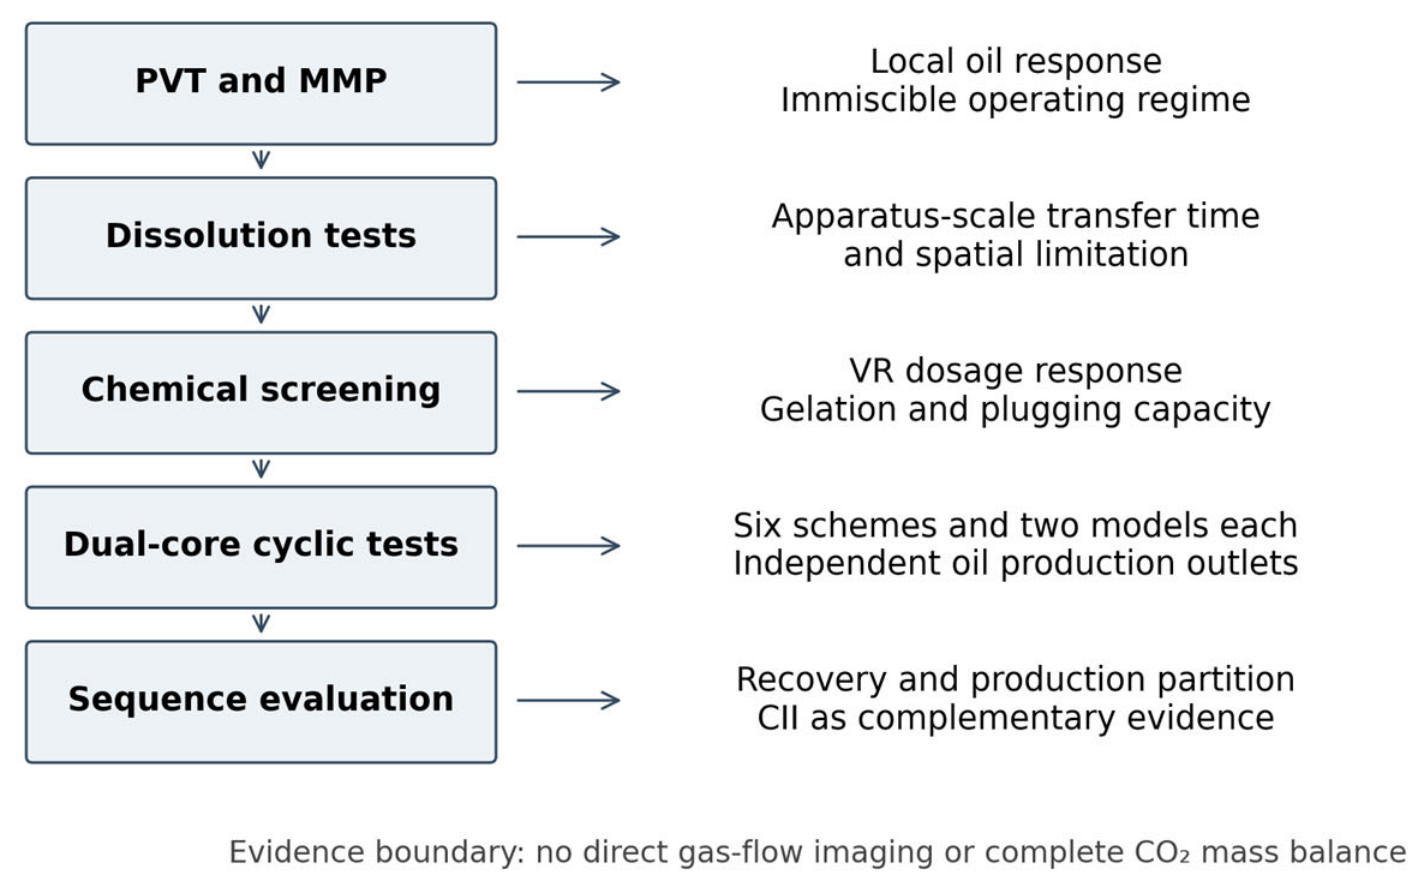
Previous work establishes the roles of CO2 dissolution, chemical-assisted mobilization, and gel or foam conformance control [2,5,27,28,45]. The remaining question addressed here is how reversing nominally matched VR and PA slugs changes recovery from preferential and less-permeable pathways during the cyclic injection. Six schemes separate the water–slug response, the two single-agent responses, and the opposing treatment orders (Figure 1). Independent oil collection resolves the producing pathway. Under the tested conditions, the observed mean whole-model recovery for VR → PA was 1.39 percentage points above CO2 alone and 0.39 percentage points above PA → VR; this descriptive ranking does not establish a statistically significant sequence effect. The Discussion evaluates the supporting mechanism, pre-treatment variability, model limitations, field considerations, and qualitative economics using existing results and published evidence. Figure 1 links each experimental stage to its contribution.
Figure 1.
Integrated experimental workflow. PVT and dissolution tests characterize oil response and contact limitation; chemical screening establishes operational viscosity reduction and plugging capacity; independently metered dual-core tests with independently collected and measured oil production resolve recovery and production partition for sequence evaluation. Gas diversion is interpreted from this combined evidence.
2. Materials and Methods
2.1. Materials and Dual-Core Models
The crude oil was collected from the CL1601 block of the Dagang Oilfield and was dehydrated and degassed before testing. Its dead-oil viscosity was 5048 mPa s at the reservoir temperature of 56.6 °C and 42,085 mPa s at 20 °C. The density at 20 °C was 0.970 g cm−3. The original oil contained 37.3 wt% saturates, 28.7 wt% aromatics, 29.8 wt% resins, and 4.2 wt% asphaltenes, corresponding to an initial CII of 0.709. The formation water had a total dissolved-solids concentration of 5644.5 mg L−1 and was classified as NaHCO3-type water. High-purity CO2 (99.99%) was used in all tests (Table 1).
Table 1.
Key properties of the fluids used in this study.
The commercial VR and PA were supplied by Tianjin Dagang Oilfield Bingang Petroleum Technology Group Co., Ltd. (Tianjin, China). All aqueous solutions were prepared with formation water. The VR was a nonionic polyether formulation used at a reported nominal dosage of 0.40 wt%. Formation water was the aqueous preparation medium. The chemical class is relevant because nonionic polyether formulations can promote oil–water interfacial dispersion and emulsification: redistribution of the viscous oil into a flowing aqueous mixture can reduce its measured apparent viscosity. Microscopic experiments on viscosity-reducer-assisted heavy-oil emulsification support this general mechanism [51]. For the present material, performance is defined operationally by the standardized oil/water-ratio screening described in Section 2.4, rather than by an assumed molecular architecture or emulsion type. The reported 0.40 wt% is retained as a nominal commercial-formulation dosage rather than converted to an active-component concentration; the precise concentration mass basis, active-component fraction, and molecular-weight distribution require product-specific specification. The PA stock contained 1.0 wt% polymer, 0.01 wt% oligomeric phenolic resin, and 0.10 wt% composite chromium lactate. These component concentrations describe the stock formulation and should be distinguished from the nominal gel concentrations used in screening.
The VR was a nonionic polyether formulation. The PA was a polymer-gel system containing 1.0 wt% polymer, 0.01 wt% oligomeric phenolic resin, and 0.10 wt% composite chromium lactate in the stock formulation. All aqueous solutions were prepared with the formation water. The agents were supplied by Tianjin Dagang Oilfield Bingang Petroleum Technology Group Co., Ltd.
Artificial homogeneous long cores were fabricated by integral compaction of an epoxy-resin cemented matrix. Core lengths ranged from 29.18 to 29.74 cm and diameters from 2.482 to 2.520 cm. Twelve low-permeability cores (91.2–110.8 × 10⁻³ μm2) and 12 high-permeability cores (467.2–520.6 × 10⁻³ μm2) were paired to form 12 dual-core models. The permeability ratio ranged from 4.7 to 5.4, and the combined pore volume ranged from 67.32 to 72.73 mL. Because pore volume varied among models, all production comparisons were based on recovery factor rather than produced oil mass.
The parallel arrangement isolates the response of two inlet-connected pathways with independently collected production. A permeability ratio of 4.7–5.4 creates a controlled contrast in pathway accessibility; it was not selected as a measured distribution for the full CL1601 reservoir. Each internally homogeneous core removes within-core geological variation, allowing pathway recovery to be compared under the same cyclic procedure. Actual reservoirs also contain capillary and wettability contrasts, fractures, layering, gravity effects, and distributed crossflow. The model therefore tests an order-dependent response under a defined contrast, while Section 4.3 and Section 4.4 discuss the conditions needed for field interpretation.
2.2. Apparatus
Phase-behavior and dissolution-kinetics measurements were conducted with a high-pressure PVT system rated to 70 MPa and 150 °C, with pressure and temperature accuracies of ±0.01 MPa and ±0.1 °C, respectively. Live-oil viscosity was measured using a high-pressure capillary viscometer with a 1 mm inner-diameter coil, a temperature-controlled oven, a constant-rate pump, a 150 mL transfer vessel, a backpressure regulator, and differential-pressure sensors. The MMP was measured in a 12 m slim tube with a 6.35 mm inner diameter and an approximate permeability of 3 D.
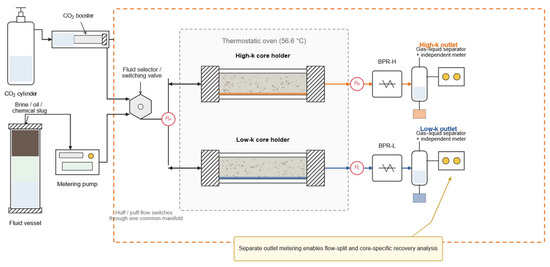
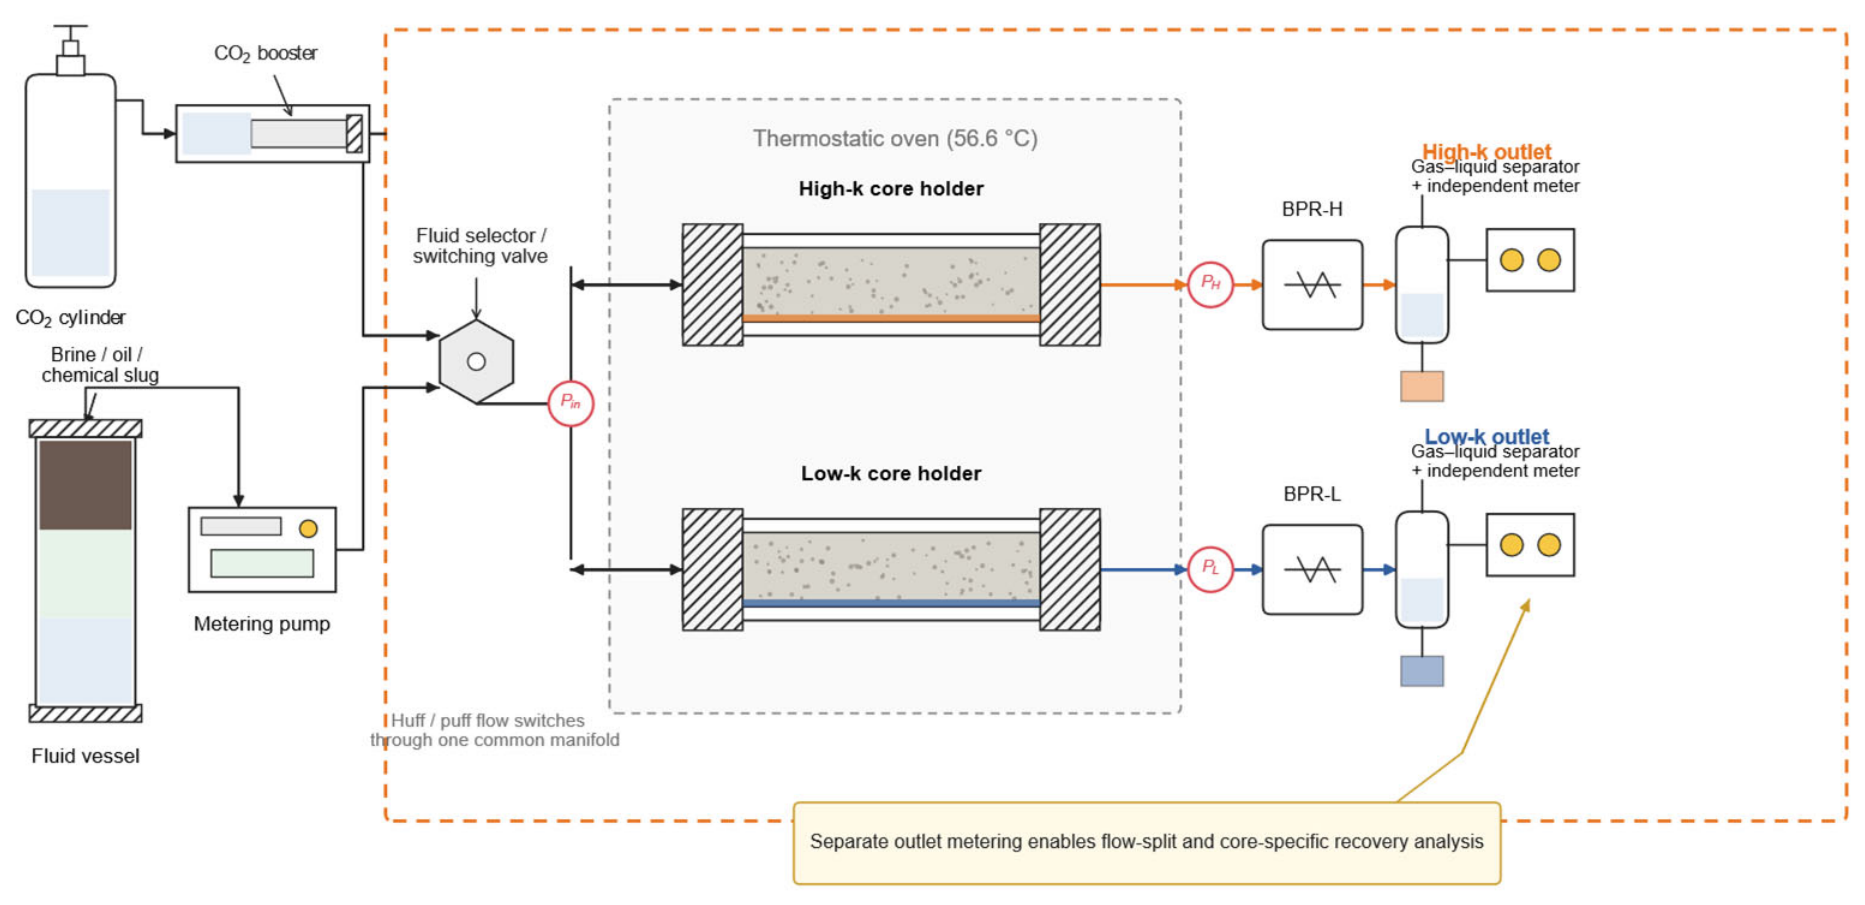
The multi-cycle experiments used the parallel dual-core system shown in Figure 2. A common injection manifold connected the CO2 booster, liquid metering pump, fluid vessels, and the high- and low-permeability cores inside a thermostatic oven. Each core had an independent backpressure regulator and outlet separator. Produced-oil volumes were measured and recorded separately for each core after each cycle, supporting pathway-specific recovery and the high-permeability oil-production share. The gas–liquid separators provided phase separation; core-specific cyclic gas-production volumes and paired cycle-resolved CO2 injection/production quantities were not recorded. Consequently, a CO2 mass balance, utilization factor, or retained quantity cannot be calculated for these cycles. The gas–oil ratios reported in Section 2.3 and Section 3.1 and Section 3.2 were obtained from separate PVT and dissolution tests and are not cyclic gas-balance measurements.
Figure 2.
Schematic of the dual-core parallel CO2 huff-n-puff system with independent oil collection and metering at each outlet.
The multi-cycle experiments used the dual-core parallel system shown in Figure 2. A common injection manifold connected the CO2 booster, liquid metering pump, fluid vessels, and the high- and low-permeability cores inside a thermostatic oven. Each core had an independent backpressure regulator, gas–liquid separator, and production meter. This arrangement allowed core-specific oil and gas production to be measured after each cycle and enabled calculation of both pathway-specific recovery and the high-permeability production share.
2.3. Phase-Behavior and Mass-Transfer Tests
2.3.1. CO2–Oil PVT and MMP Measurements
Degassed oil was charged into the PVT cell and equilibrated at 56.6 °C and 12.22 MPa. Live-oil volume, density, and viscosity were measured as the reference state. CO2 was then added stepwise. After each addition, the system was equilibrated and the bubble-point pressure, volume, density, and viscosity were measured. These data were used to calculate CO2 solubility, formation-volume factor, swelling factor, and viscosity reduction.
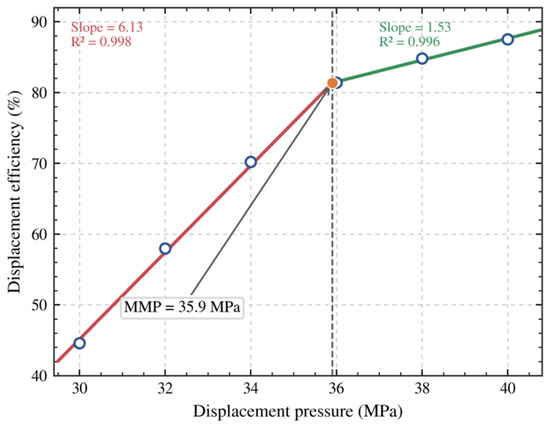
For the MMP test, slim-tube displacement experiments were performed at 56.6 °C and pressures of 30, 32, 34, 36, 38, and 40 MPa. Displacement efficiency was determined after injecting 1.2 pore volumes (PV). The MMP was obtained from the intersection of the low- and high-pressure linear regressions.
2.3.2. Dissolution Kinetics and Effective Action Distance
Static dissolution was measured at 11 MPa and 56.6 °C with CO2 and oil contacting through molecular diffusion only. Dynamic dissolution was measured at 12.22 MPa and 56.6 °C under imposed mixing. Pressure decline was converted to dissolved gas–oil ratio. The times required to reach 50% and 95% of the final dissolved gas–oil ratio were determined from the measured curves.
To quantify the spatial extent of viscosity reduction, samples were withdrawn sequentially along the axial direction from the initial CO2–oil interface. Mixing distance was calculated from the displaced cell volume, and viscosity and gas–oil ratio were measured for each segment. The effective action distance was defined operationally as the region over which viscosity remained measurably below the 5505 mPa s live-oil reference.
2.4. Chemical-Agent Screening
VR performance was evaluated at 60 °C using seven concentrations from 0.05 to 1.20 wt% and eight oil/water mass ratios from 1:9 to 8:2. Oil and VR solution were equilibrated for 1 h, mixed at 250 rpm for 2 min, and immediately measured using a rotational viscometer. The concentration selected for the huff-n-puff tests was based on the mean response, the range across oil/water ratios, the worst-case response at 8:2, and the marginal gain with increasing dosage.
Gel solutions with nominal concentrations of 0.6, 0.8, 1.0, 1.2, and 1.5 wt% were evaluated at 56.6 °C. Initial viscosity and viscosity after 1 and 2 h were measured. Initial and final gel strengths and 90 d stability were evaluated using the Sydansk visual code (A-I). Plugging tests were conducted in artificial fractured cores with fracture widths of 0.5, 1.0, and 1.5 mm. Permeability and stable differential pressure were measured before and after gelation, and plugging efficiency, resistance factor, and breakthrough pressure gradient were calculated.
2.5. Multi-Cycle Huff-n-Puff Procedure
Each long core was dried, evacuated, saturated with formation water, and characterized for pore volume and water permeability. The core was then saturated with crude oil at 56.6 °C and 1 mL min−1 until no water was produced, followed by aging for 72 h. A low- and a high-permeability core were connected in parallel and equilibrated at 56.6 °C. Cycle 1 was depletion production, with pressure reduced at 0.5 MPa min−1 until oil production ceased. Cycles 2–4 were huff-n-puff cycles. CO2, with or without a 0.02 PV aqueous slug, was injected from the operating end until pressure reached 14 MPa. The system was soaked for 72 h and then depressurized stepwise until no additional oil was produced. Oil from each core was collected separately after each cycle, and its SARA composition was determined. As clarified in Section 2.2, no quantitative cyclic gas records were available for a CO2 balance; the separately measured PVT and dissolution gas–oil ratios do not supply these missing cycle-resolved quantities.
Six schemes were tested, each with two independent dual-core models (Table 2). A0 was the CO2-only control. A1, A2, and A3 evaluated water, VR, and PA slugs, respectively. A4 applied VR in cycle 3 and PA in cycle 4, whereas A5 used the reverse sequence. The first two cycles followed the same operating procedure in all schemes, providing a common pre-chemical operating history rather than identical measured baseline recoveries.
Table 2.
Design of the multi-cycle CO2 huff-n-puff experiments.
The 0.02 PV aqueous slug provides a common dosage basis for comparing water, VR, PA, and the opposing chemical orders, corresponding to 1.35–1.45 mL for the reported model pore volumes. A4 and A5 each received one VR slug and one PA slug, so reversing order preserved nominal chemical quantities. The 14 MPa endpoint and 72 h soak were held constant to compare sequences under one operating schedule. This design does not establish an optimal field recipe or an equal CO2 dose: equal pressure endpoints can require different gas quantities when injectivity and fluid distribution change. The reported gains are therefore oil-recovery comparisons under the specified pressure-controlled procedure, not gains per-unit CO2 injected.
2.6. Data Reduction and Uncertainty
The static viscosity-reduction ratio was calculated as
where η0 and η1 are the crude-oil and emulsion viscosities, respectively. CO2-induced viscosity reduction and the swelling factor were calculated as
where μL and μCO2 are live-oil viscosities before and after CO2 dissolution, and VL and VCO2 are the corresponding reservoir-condition volumes.
θ = (η0 − η1)/η0 × 100%
fμ = (μL − μCO2)/μL × 100%
B = VCO2/VL
The cumulative recovery factor of core i, the pore-volume-weighted recovery factor of the dual-core model, and the high-permeability production share were calculated as
where subscripts L and H denote the low- and high-permeability cores, respectively. Plugging efficiency was calculated as
where Kb and Ka are permeabilities before and after gel treatment. The CII of each produced-oil sample was calculated from the SARA mass fractions as
Ri = Voi/Voi,OOIP × 100%
Rm = (RLVpL + RHVpH)/(VpL + VpH)
ηH = RHVpH/(RLVpL + RHVpH) × 100%
Ep = (1 − Ka/Kb) × 100%
CII = (wsat + wasp)/(waro + wres)
For each scheme, the two independent dual-core models are reported as the arithmetic mean ± half range, where half range is one-half of the absolute difference between x1 and x2. The bars describe the two observed values; they are not confidence intervals, standard errors, or estimates of population uncertainty. Approximate endpoint ranges calculated from rounded summaries describe the observed separation of the two orders. Section 4.4 adds a sensitivity check for a possible cycle-2 recovery difference, explicitly using assumed baseline differences rather than reconstructed measurements. Neither calculation establishes statistical significance. CII = 0.9 is used as a visual reference rather than a validated precipitation threshold for this oil.
2.7. AI-Assisted Manuscript and Figure Preparation
ChatGPT 5.6 sol (OpenAI) was used to assist with language editing, text refinement, drafting Python 3.15.0 plotting code, and preparing layouts and labels for the workflow and conceptual mechanism schematics in Figure 1 and Figure 12. The schematics were rendered with Matplotlib 3.10.8 from the procedures and observations reported in this study. They are explanatory diagrams rather than experimental images or direct visualizations of CO2 flow. The authors reviewed the text, labels, arrows, and numerical annotations against the reported methods and results and retained responsibility for the content.
3. Results
3.1. Deep Immiscibility and Strong Local PVT Response
The slim-tube displacement efficiency increased rapidly from 44.59% at 30 MPa to 81.40% at 36 MPa and then increased more gradually to 87.53% at 40 MPa (Figure 3). The intersection of the two linear trends gave an MMP of 35.9 MPa. The initial system pressure of approximately 12.0–12.2 MPa and the 14 MPa injection endpoint were both below the MMP, confirming that the huff-n-puff tests were conducted under immiscible conditions.
Figure 3.
Minimum miscibility pressure determined from the intersection of two linear displacement-efficiency trends at 56.6 °C.
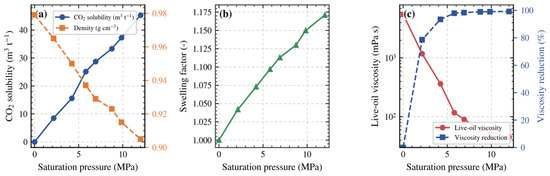
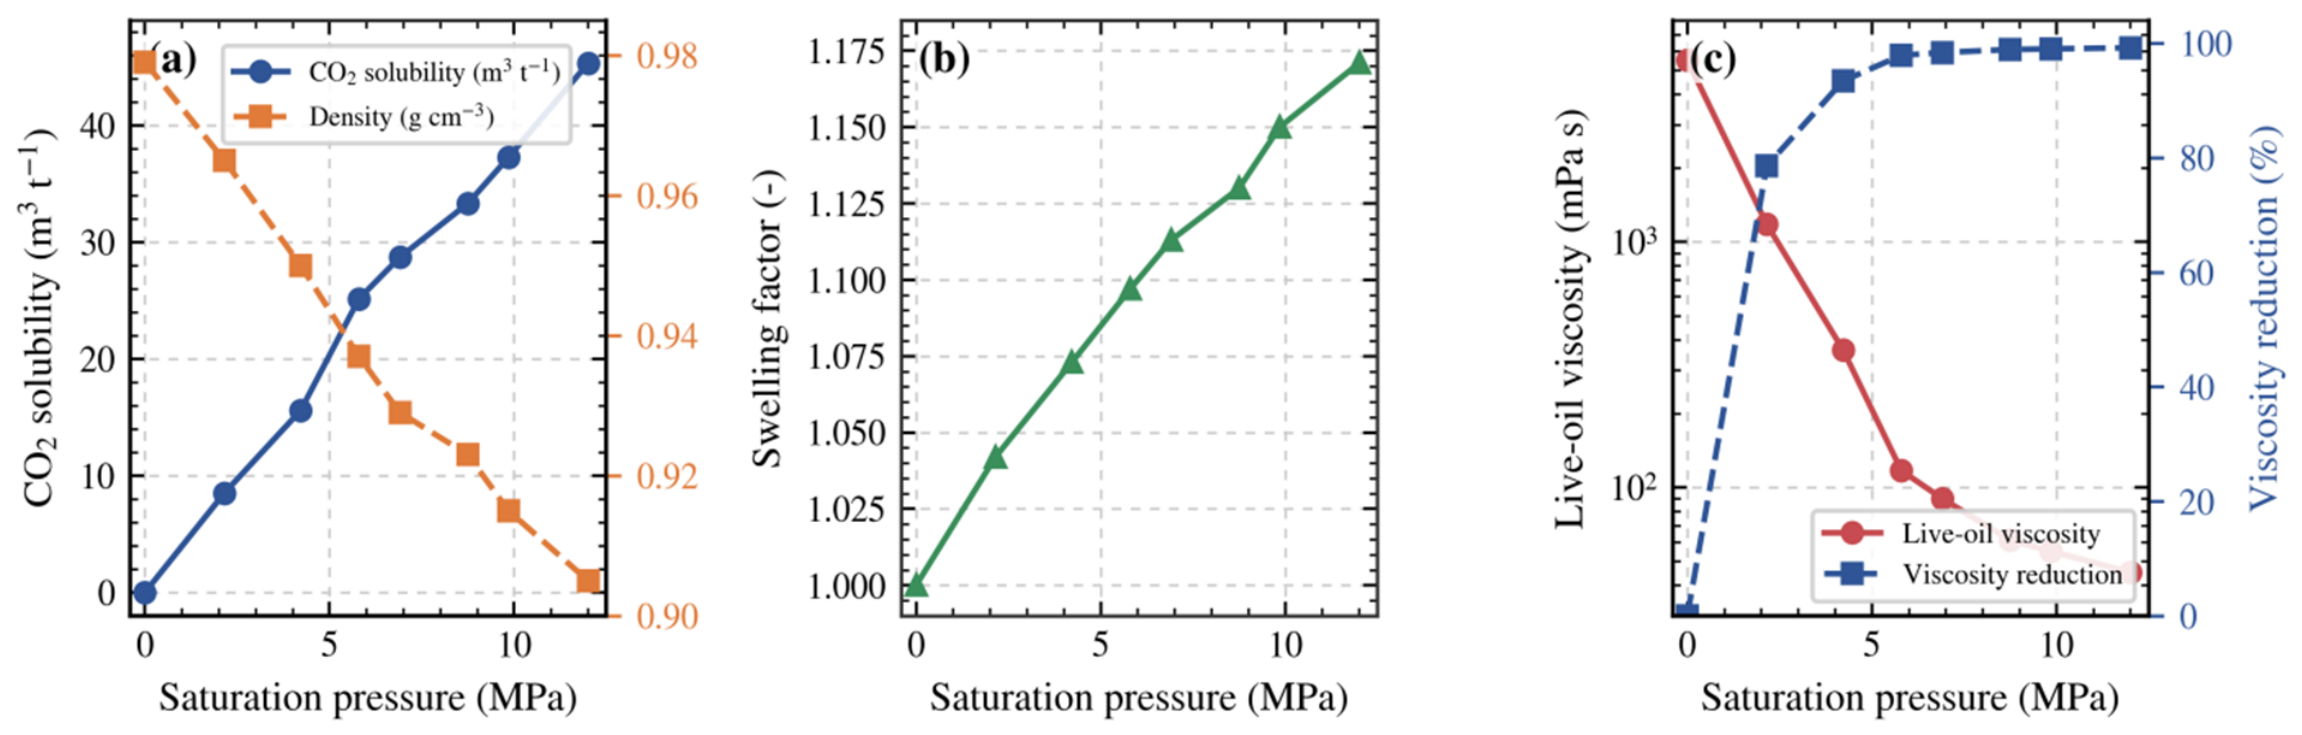
Despite deep immiscibility, CO2 produced a strong PVT response (Table 3 and Figure 4). Solubility increased almost linearly with saturation pressure and reached 45.32 m3 t−1 at 12.01 MPa. The swelling factor increased to 1.171, while density decreased from 0.979 to 0.905 g cm−3. The most pronounced response was viscosity: dissolution of only 8.50 m3 t−1 CO2 reduced viscosity from 5505 to 1181 mPa s, and the maximum measured solubility reduced viscosity to 45 mPa s, corresponding to 99.18% viscosity reduction. The response approached a plateau above approximately 25 m3 t−1 dissolved CO2.
Table 3.
Phase behavior of the CO2–extra-heavy-oil system at 56.6 °C.
Figure 4.
Phase behavior of the CO2–extra-heavy-oil system: (a) CO2 solubility and density; (b) swelling factor; (c) viscosity and viscosity reduction.
Although the system remained immiscible, contacted oil exhibited a viscosity decrease exceeding two orders of magnitude at the highest measured dissolved-gas content. Inadequate local viscosity reduction therefore cannot, by itself, explain declining later-cycle recovery. The plateau in viscosity response at higher dissolved-gas contents highlights the importance of contact with remaining oil outside the repeatedly contacted region. This interpretation concerns the spatial opportunity for oil mobilization; it does not quantify utilization per unit injected CO2.
3.2. Dissolution Kinetics and Effective Action Distance
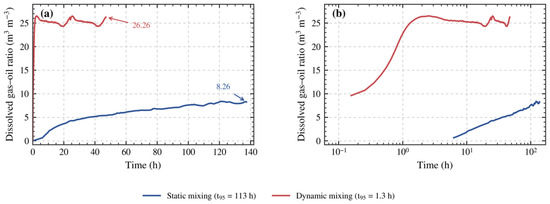
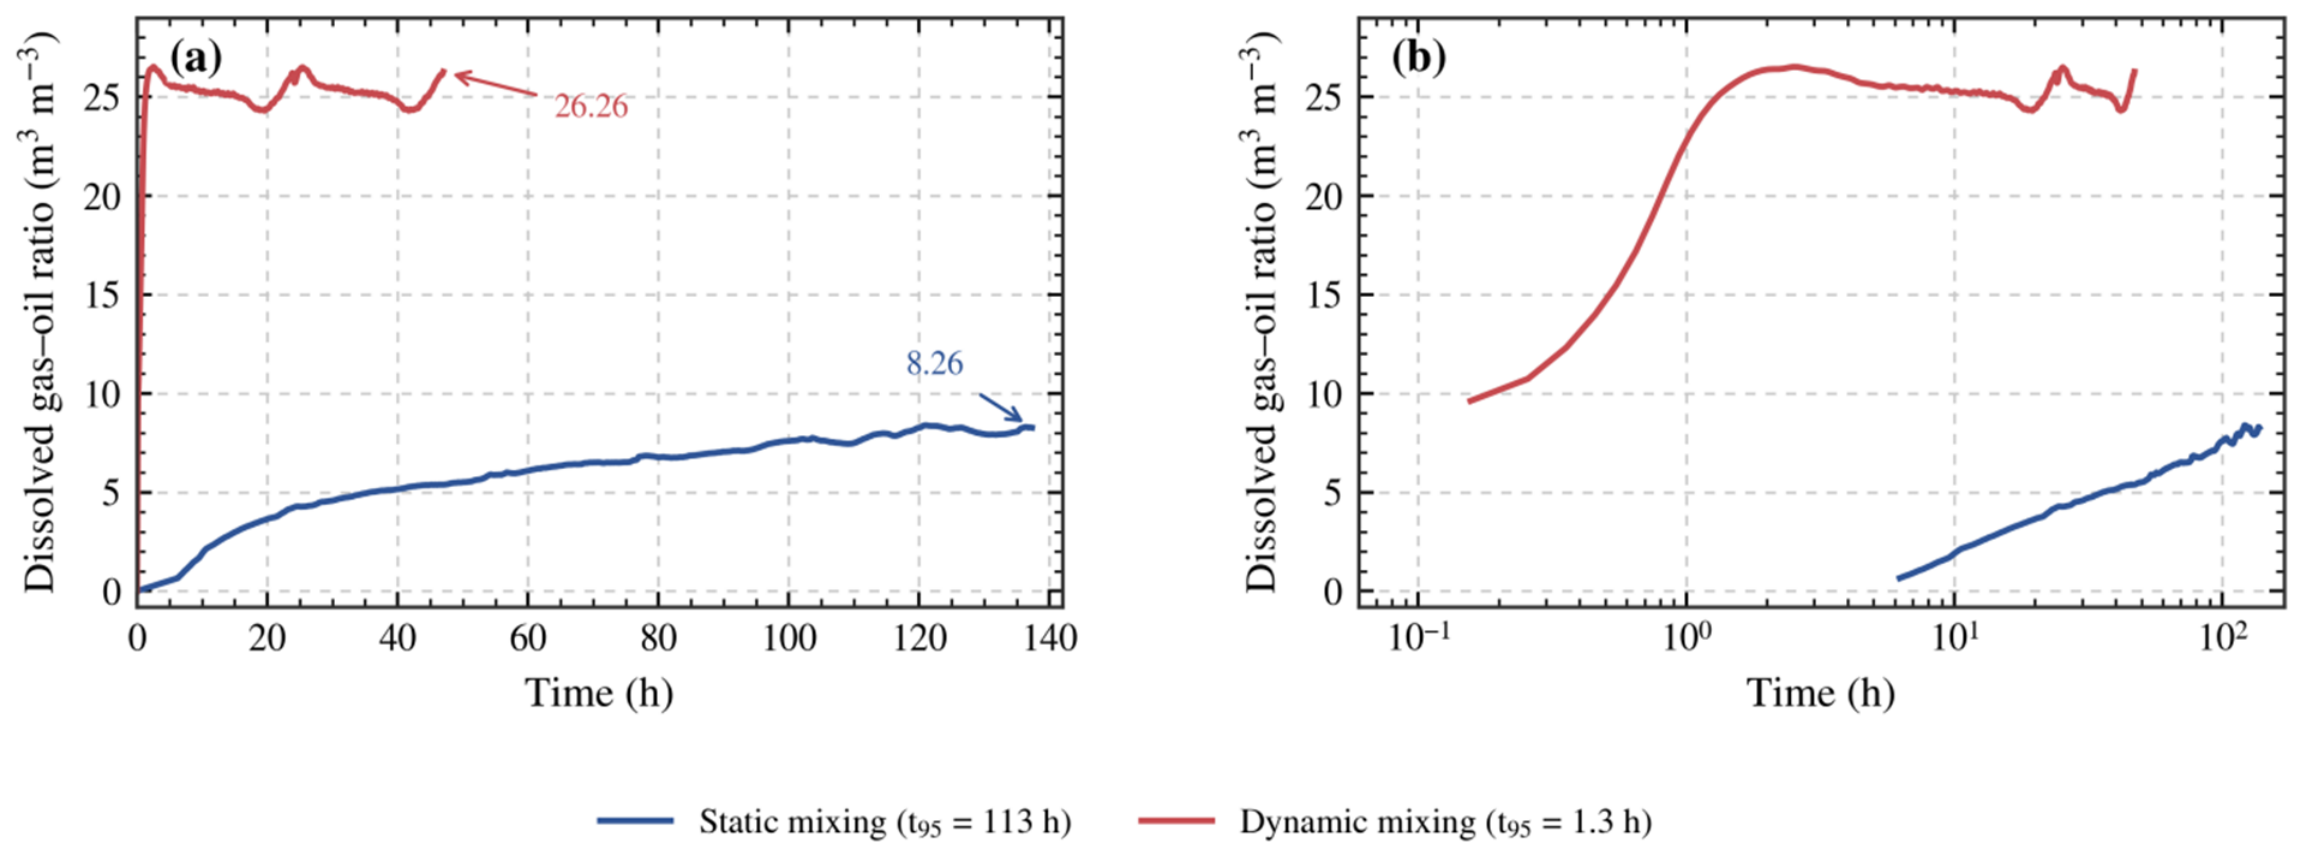
Static and dynamic dissolution exhibited markedly different time scales (Figure 5). Under static conditions, 23 h were required to reach 50% of the final dissolved gas–oil ratio and 113 h to reach 95%. After 137 h, the dissolved gas–oil ratio was only 8.26 m3 m−3. Under dynamic mixing, the corresponding times were 24 min and 1.3 h, and the final dissolved gas–oil ratio reached 26.26 m3 m−3, approximately 3.2 times the static value. The comparison demonstrates the strong sensitivity of CO2–oil mass transfer to convective renewal of the interface under the defined apparatus conditions; it should not be generalized to all reservoirs without accounting for geometry and flow.
Figure 5.
Dissolved gas–oil ratio versus time under static and dynamic mixing: (a) linear time scale; (b) logarithmic time scale.
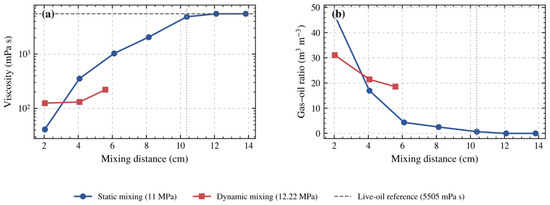
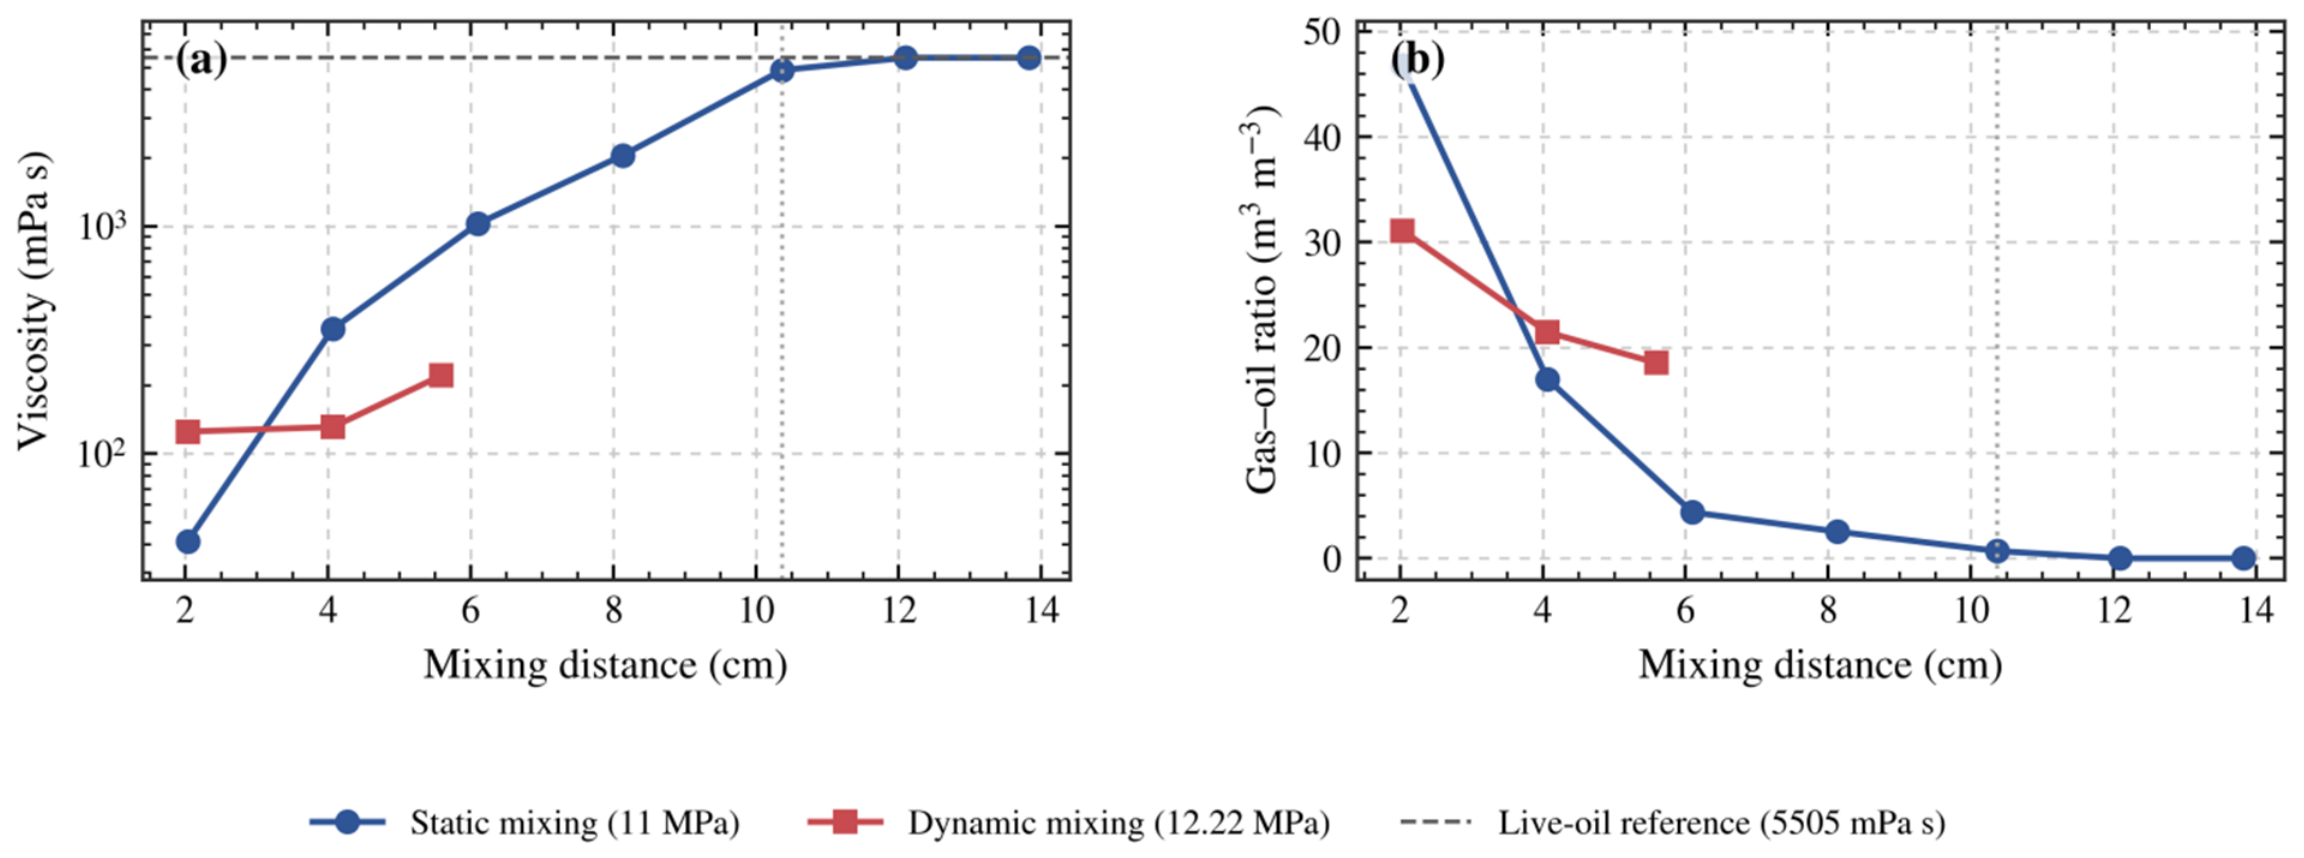
The distance-resolved measurements directly revealed the spatial limitation (Figure 6). At 2.03 cm from the static contact surface, viscosity was 41 mPa s, and the gas–oil ratio was 46.8 m3 m−3. Viscosity increased monotonically with distance, reaching 4857 mPa s at 10.37 cm, where the viscosity reduction was only 11.77%. At 12.10 cm and beyond, viscosity returned to the 5505 mPa s live-oil reference, and the gas–oil ratio fell to zero. Dynamic mixing produced a much more uniform profile over the measured range, with viscosities of 125, 131, and 221 mPa s at 2.03, 4.07, and 5.59 cm, respectively.
Figure 6.
Viscosity and dissolved gas–oil ratio versus mixing distance under static and dynamic conditions: (a) viscosity; (b) gas–oil ratio.
The kinetic and spatial observations support a contact-limited interpretation under the tested conditions. CO2 strongly changes oil properties where contact occurs, whereas the static tests show slow transfer and a limited zone of viscosity reduction. As early cycles deplete accessible oil, further recovery depends on renewing contact with remaining oil. These observations provide a physical basis for combining viscosity reduction and conformance control. The measured distances are specific to the apparatus and conditions and do not define a reservoir-scale treatment radius.
3.3. Chemical-Agent Selection
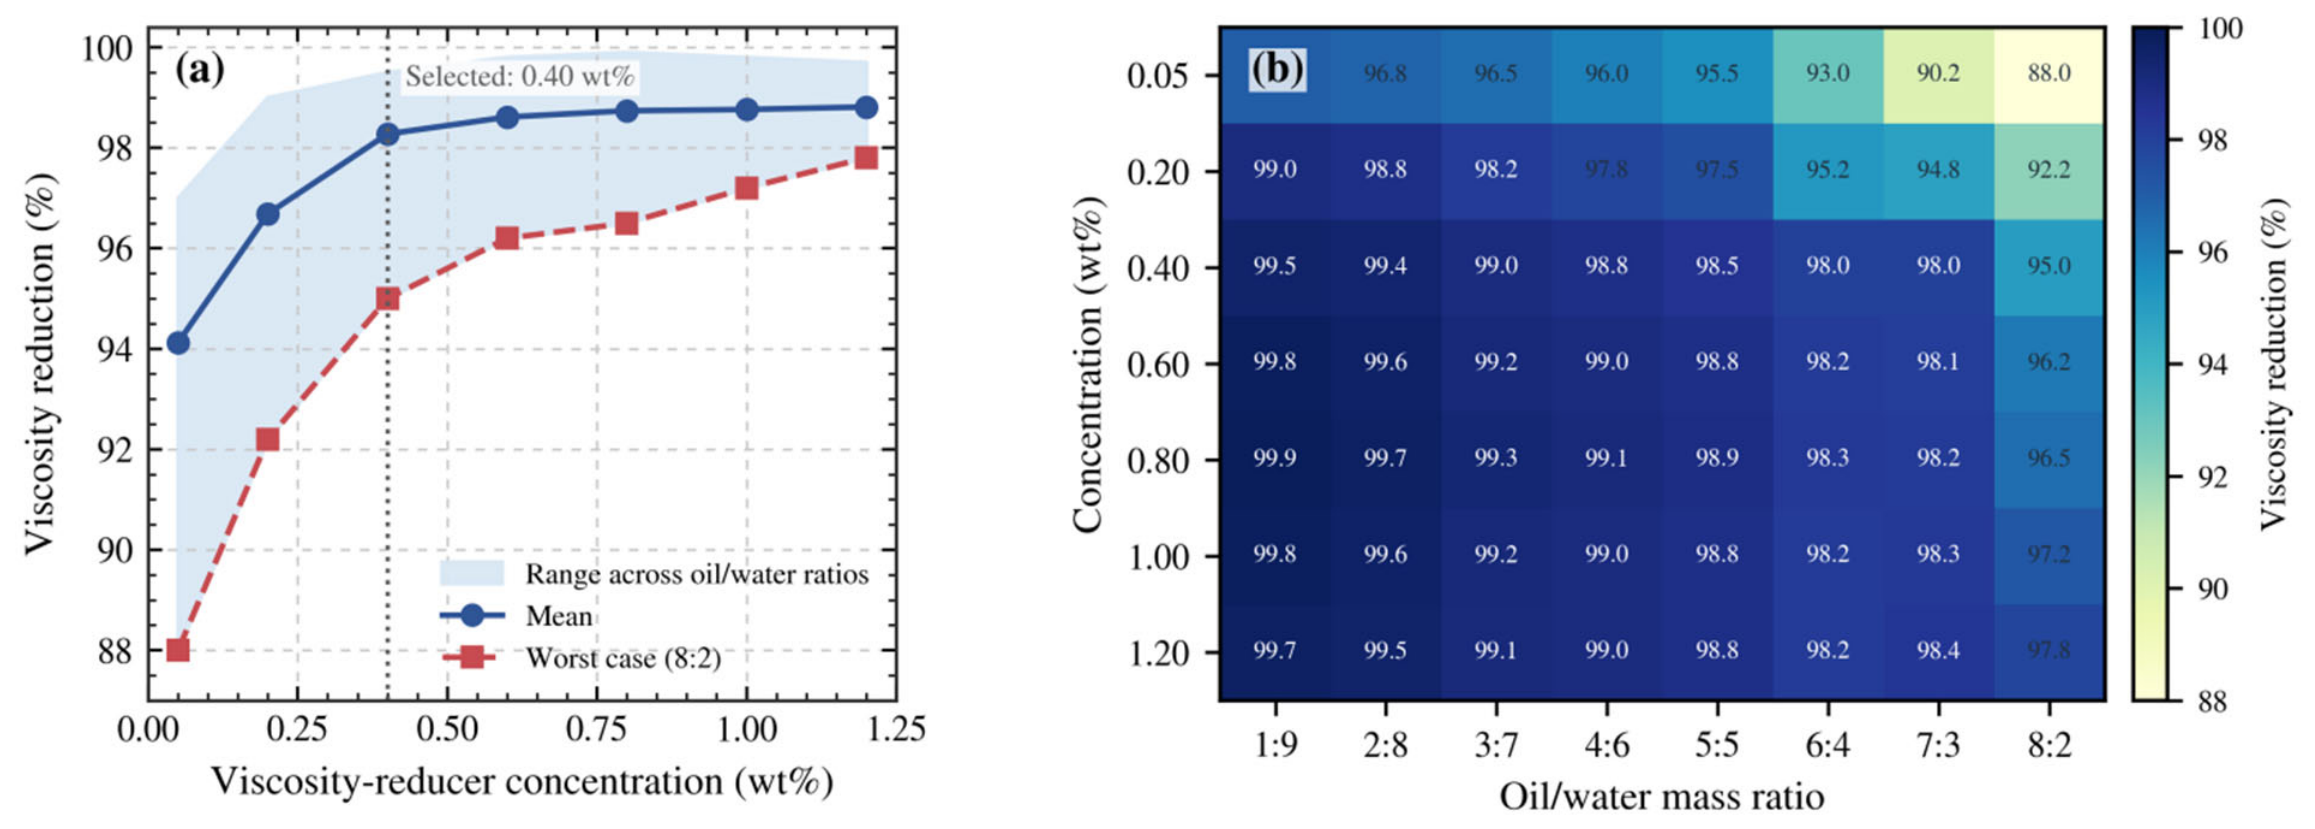
The mean VR performance increased with concentration, but the marginal gain became small above 0.40 wt% (Figure 7). Increasing concentration from 0.05 to 0.20 wt% improved the mean viscosity reduction by 2.56 percentage points, and increasing it from 0.20 to 0.40 wt% provided another 1.59 percentage points. The increment from 0.40 to 0.60 wt% was only 0.34 percentage points. At the most oil-rich condition (oil/water = 8:2), 0.40 wt% VR still achieved 95.0% viscosity reduction. Increasing the dosage to 1.20 wt% improved this value by only 2.8 percentage points. Accordingly, 0.40 wt% was selected for the huff-n-puff experiments.
Figure 7.
VR screening as a function of concentration and oil/water mass ratio: (a) mean, range, and worst-case response; (b) response matrix.
Gel screening identified a useful 1.0–1.2 wt% concentration range under the tested conditions (Table 4). All formulations reached initial D strength at 42 h. The 1.0 and 1.2 wt% systems reached H strength at 96 and 70 h, respectively, and retained H strength after 90 d; the 1.5 wt% system gelled faster but decreased to G after 90 d. Selection therefore balances resistance development with stability. The 70–96 h final-strength times bracket or exceed the 72 h soak, making gelation timing an engineering control on the sequence response. Bulk visual strength is used as a screening indicator; in-core resistance development depends additionally on dilution, shear, transport, and CO2 exposure.
Table 4.
Gelation performance of the PA at 56.6 °C.
Separate tests in artificial fractured cores showed substantial plugging capacity (Table 5). Permeability decreased from 4052–9475 mD before treatment to 127–345 mD afterward; Equation (7) gives plugging efficiencies of 96.36–96.87%. The breakthrough pressure gradient decreased from 73.72 to 46.79 MPa·m−1 as fracture width increased from 0.5 to 1.5 mm. These measurements support the PA’s ability to increase flow resistance [29,30,31,32,33,34,35,36,37,38,39,40,41,42,43,44]. They were obtained in separate fractured-core tests and do not locate gel formation within the parallel-core huff-n-puff models. Bio-based gels and foam–gel combinations provide further examples of mobility and conformance control [45,52], with placement and stability dependent on the application.
Table 5.
Plugging performance of the PA in artificial fractures.
3.4. Multi-Cycle Recovery Performance
The first two cycles provide a common pre-chemical operating history. Across the 12 models, cycle-1 recovery ranged from 1.14% to 1.33% and cycle-2 recovery from 4.07% to 4.45%. This observed baseline spread is retained in the interpretation of the later chemical response. Section 4.4 quantifies the effect of a possible cycle-2 difference on the 0.39-percentage-point final sequence contrast instead of treating the models as the exact equivalent.
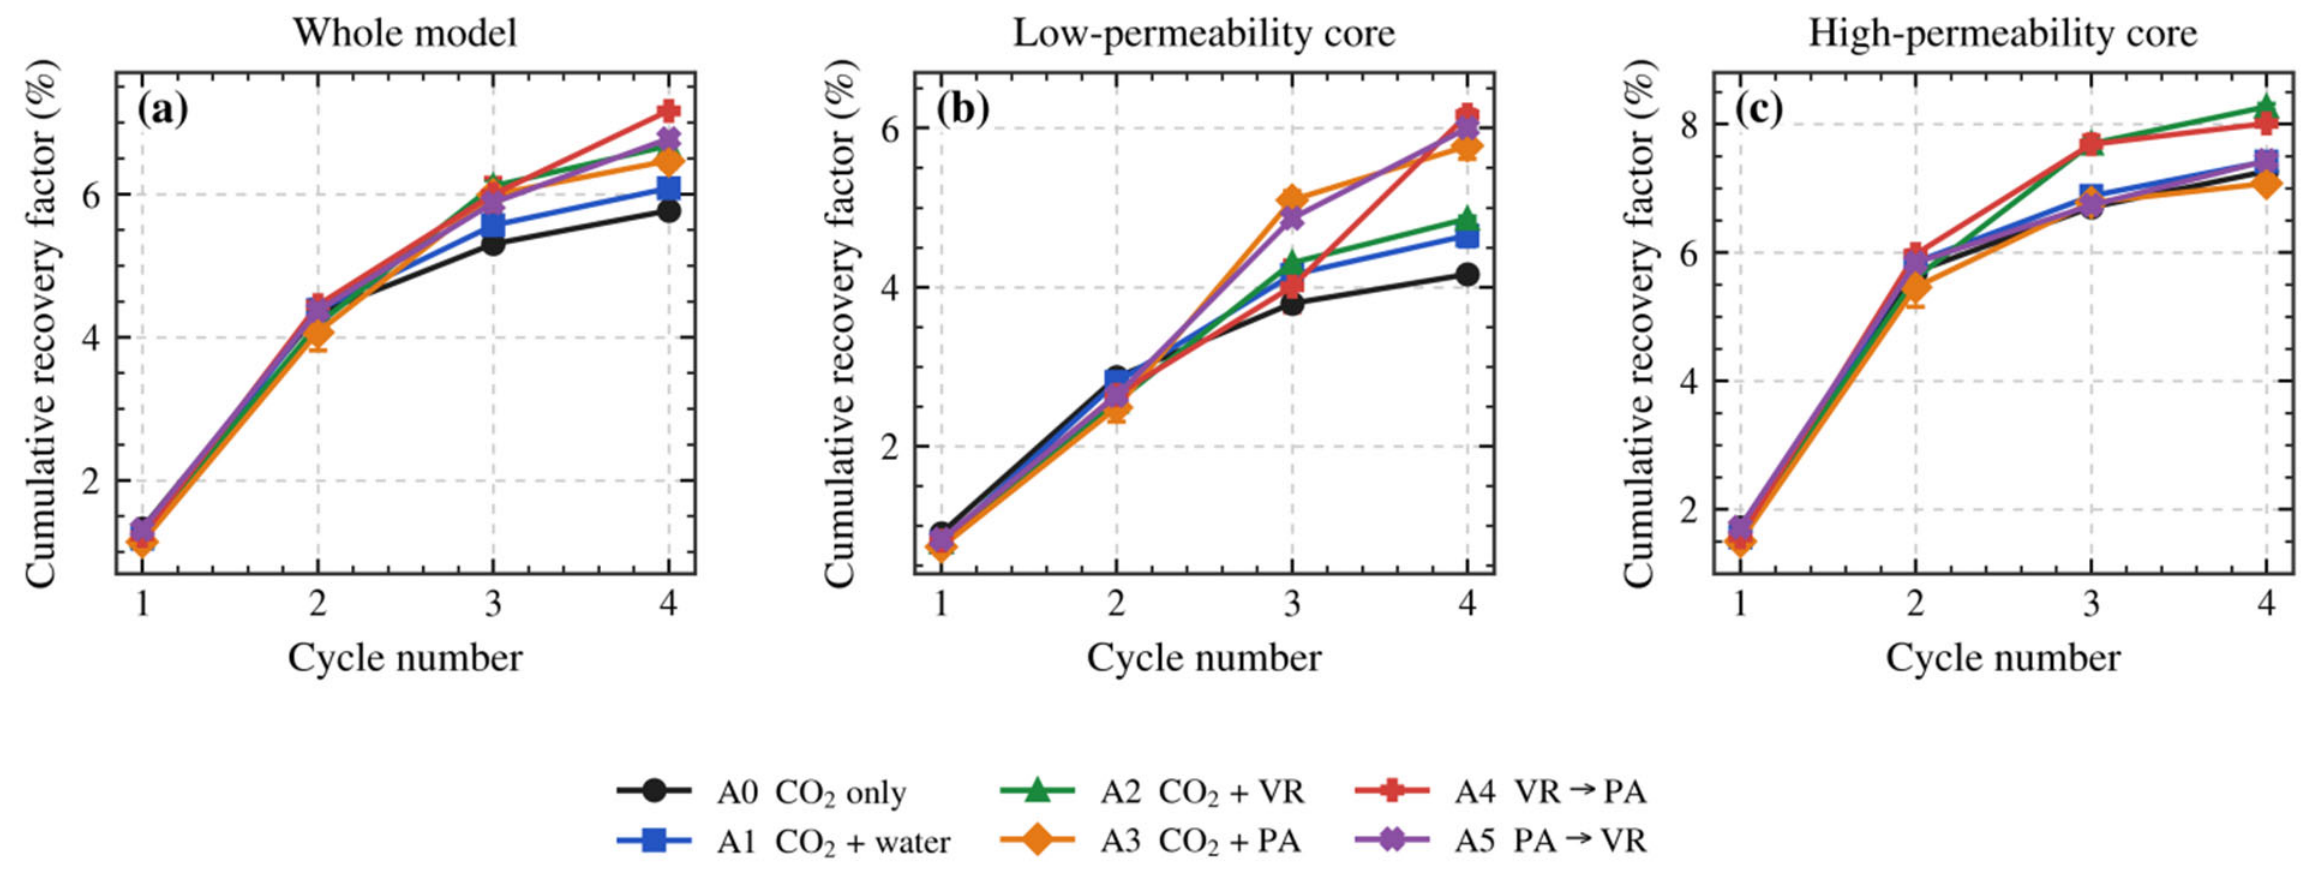
Differences in observed mean recovery followed the introduction of the aqueous slugs (Table 6 and Figure 8). Under the tested conditions, mean whole-model recovery factors after four cycles were 5.77 ± 0.05% for A0 (CO2 only), 6.08 ± 0.12% for A1 (water), 6.68 ± 0.07% for A2 (VR), 6.47 ± 0.10% for A3 (PA), 7.16 ± 0.05% for A4 (VR → PA), and 6.77 ± 0.03% for A5 (PA → VR). Relative to A0, the corresponding observed mean differences were 0.31, 0.91, 0.70, 1.39, and 1.00 percentage points.
Table 6.
Four-stage recovery performance: cycle 1 depletion and cycles 2–4 huff-n-puff (n = 2; mean ± half range).
Figure 8.
Cumulative recovery factor versus cycle number: (a) whole model; (b) low-permeability core; (c) high-permeability core. Points are means of two independent dual-core models. Error bars show half ranges of these two observations (n = 2), not confidence intervals, standard errors, or statistical uncertainty.
Under the tested conditions, the water-slug scheme showed a small observed mean recovery gain, consistent with persistent mobility and contact limitations. The chemical schemes had higher observed means than the water-slug scheme, with the combined schemes ranking above the single-agent schemes. These comparisons are descriptive. This response is consistent with chemical-assisted CO2 recovery reported in other reservoir systems [2,25,27,28], but the separated outlet measurements show that VR and PA did not produce improvement through the same pathway.
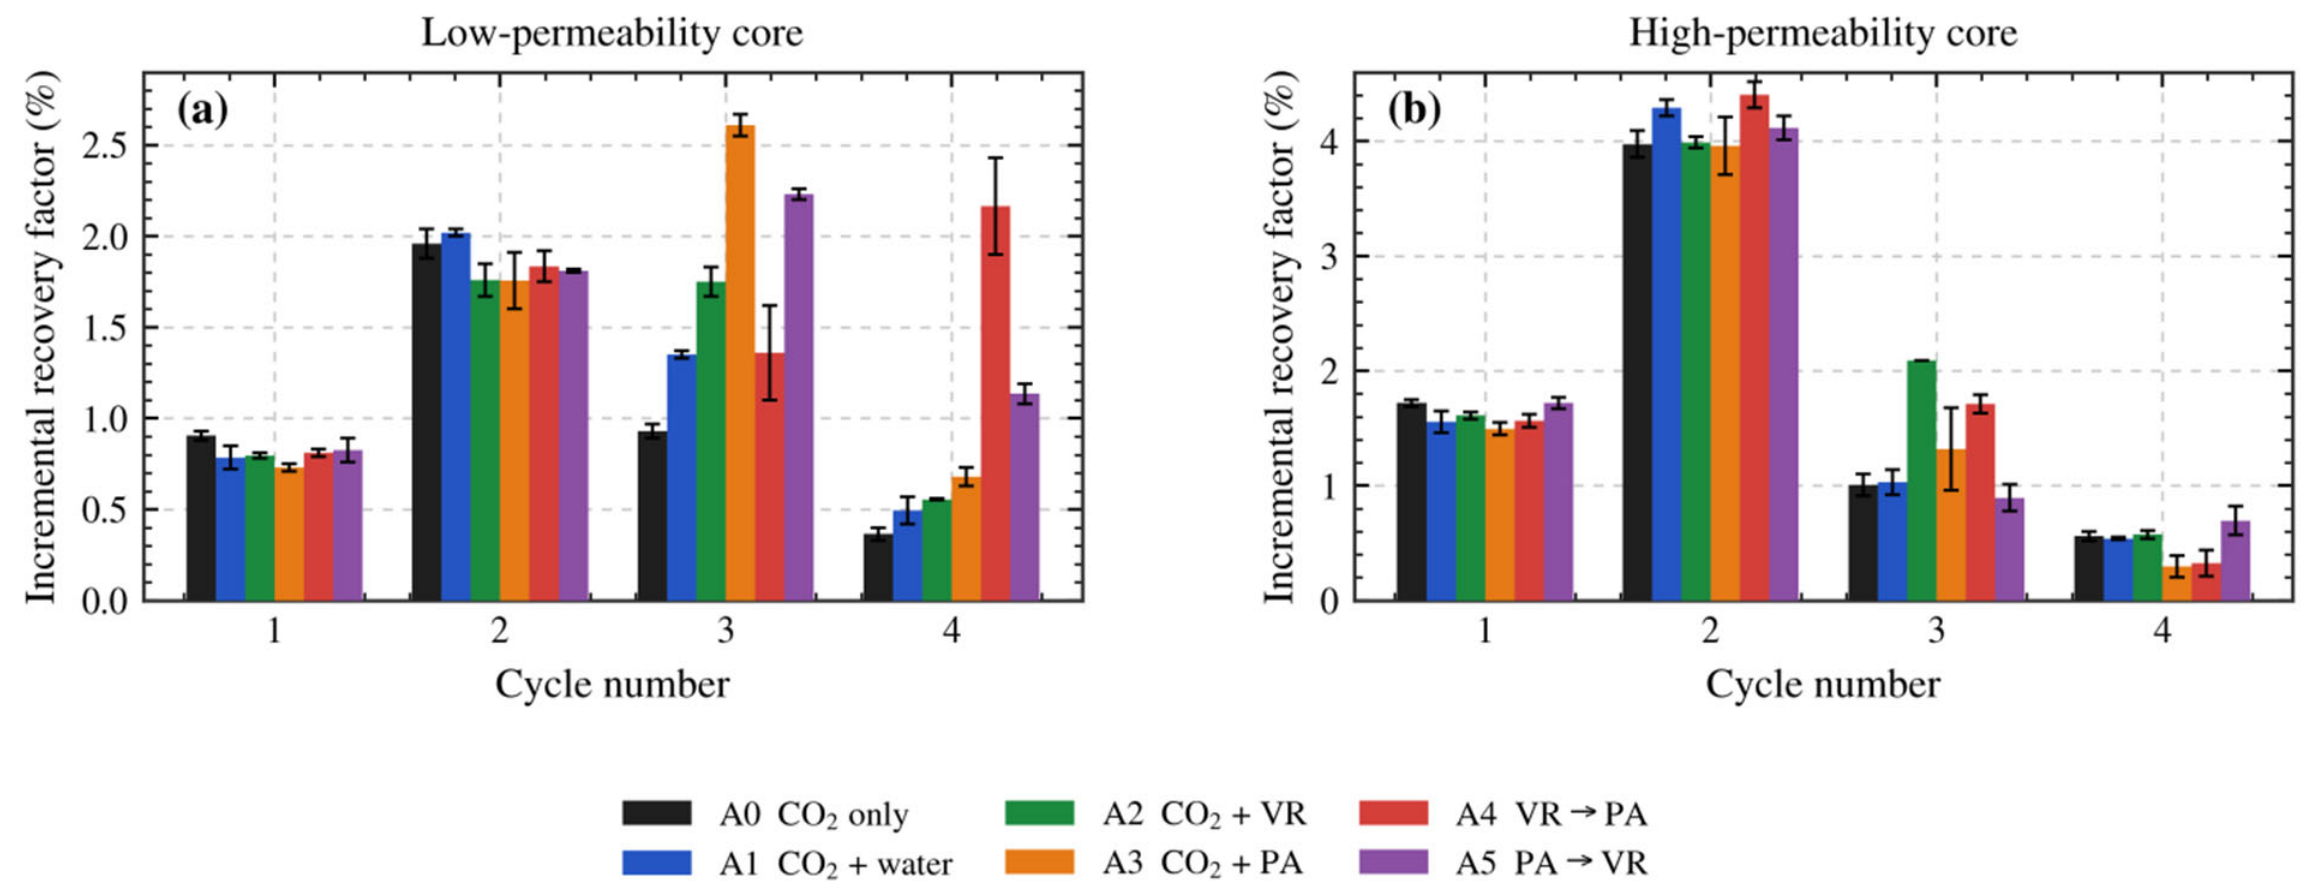
The cycle-specific increments reinforce this conclusion (Figure 9). In the high-permeability core, the cycle-3 increment of A2 reached 2.09%, approximately twice that of the CO2-only control. In the low-permeability core, the cycle-3 increment of A3 reached 2.61%, approximately 2.8 times the control.
Figure 9.
Cycle-specific incremental recovery factor: (a) low-permeability core; (b) high-permeability core. Points are means of two independent dual-core models. Error bars show half ranges of these two observations (n = 2), not confidence intervals, standard errors, or statistical uncertainty.
3.5. Distinct Roles of the Viscosity Reducer and Plugging Agent
Repeated VR treatment produced a final high-permeability recovery of 8.27%, the highest among all schemes and 1.01 percentage points above A0. Low-permeability recovery increased from 4.16% for A0 to 4.86% for A2. Together with the viscosity-screening results, this distribution is consistent with VR improving oil mobilization in the preferentially contacted pathway. Such a response can help convert existing CO2–oil contact into additional oil production. The engineering value of VR therefore depends on the amount of movable oil remaining in the region already accessible to the injected gas.
PA treatment produced a different oil-production distribution. In A3, low-permeability recovery increased from 4.16% for A0 to 5.78%, whereas high-permeability recovery was 7.07%, compared with 7.26% for A0. The cycle-3 low-permeability increment was 2.61%, compared with 0.93% for A0. This concurrent change, together with the separate plugging measurements, is consistent with conformance improvement. It does not establish the CO2 injection split, the location of the gel, or a change in gas residence time.
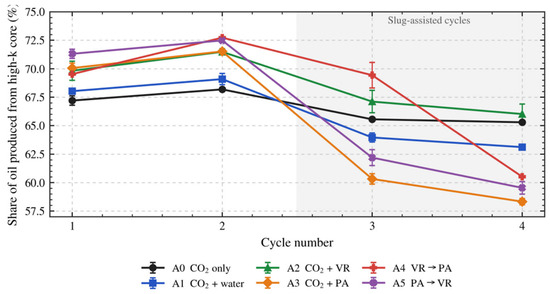
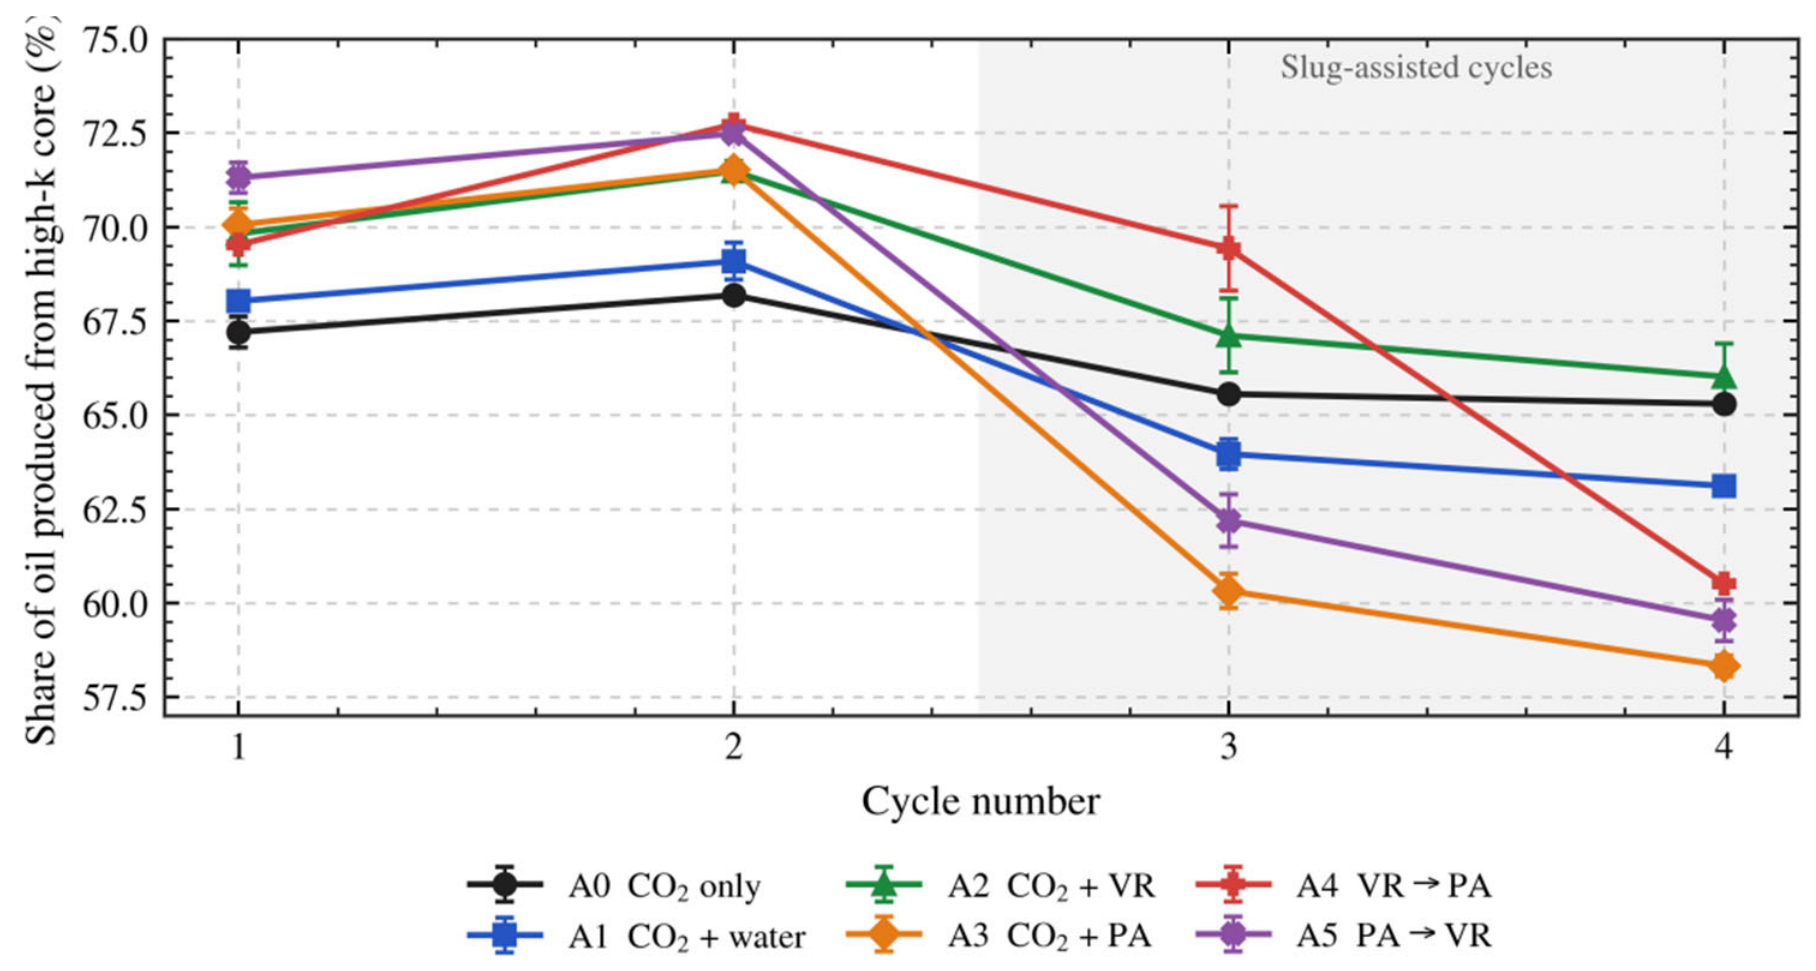
The high-permeability oil-production share records the redistribution of produced oil (Figure 10). Before chemical treatment, all schemes produced approximately 68–73% of their oil from the high-permeability core. When PA was introduced in cycle 3, this share fell from 71.5% to 60.3% in A3 and from 72.5% to 62.2% in A5. In A2, it decreased from 71.5% to 67.1% after VR treatment and ended at 66.0%, close to the 65.3% control value. In A4, it remained at 69.4% during cycle-3 VR treatment and fell to 60.5% after cycle-4 PA treatment. The timing supports an association between PA placement and a larger production contribution from the low-permeability pathway. Combined with the gel plugging measurements, this is consistent with flow diversion, although oil-production share is not a direct measurement of the CO2 flow split or gas-channeling rate.
Figure 10.
Share of oil produced from the high-permeability core versus cycle number. Points are means of two independent dual-core models. Error bars show half ranges of these two observations (n = 2), not confidence intervals, standard errors, or statistical uncertainty.
3.6. Observed Responses to Slug Order
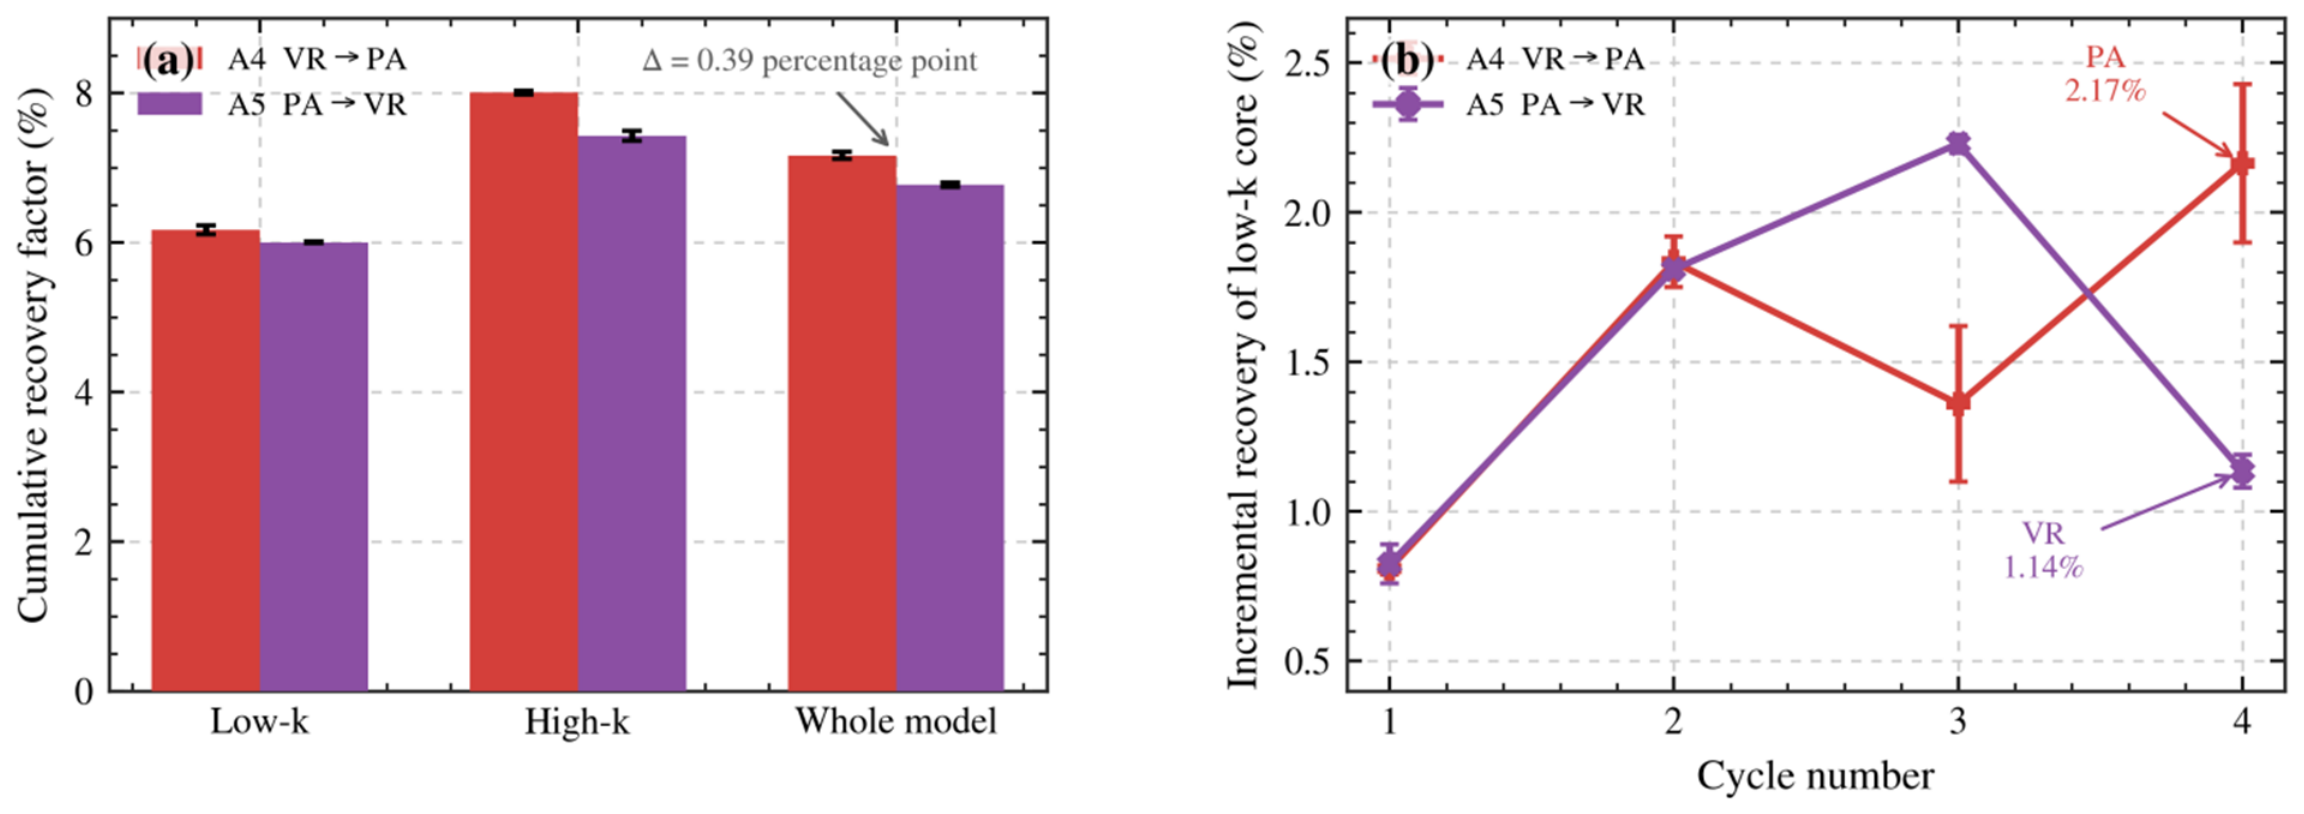
A4 and A5 reversed the order of the same nominal 0.02 PV VR and PA slugs in cycles 3 and 4. Under the tested conditions, VR → PA had an observed mean final whole-model recovery of 7.16 ± 0.05%, compared with 6.77 ± 0.03% for PA → VR (Figure 8; Table 6). The mean contrast was 0.39 percentage points, or 5.8% relative to PA → VR. Approximate observed ranges were 7.11–7.21% and 6.74–6.80%, giving a descriptive endpoint-difference envelope of 0.31–0.47 percentage points. This separation in the tested models is supported by cycle- and pathway-resolved responses, but two models per scheme and pre-treatment differences preclude a statistically established sequence effect. Table 7 examines the sensitivity of the treatment-stage interpretation to baseline differences.
Table 7.
Literature context by reservoir setting, intervention, and reported outcome. Metrics, baselines, and laboratory or field scales differ; the values are contextual and must not be interpreted as a quantitative performance ranking across studies.
For A4, the cycle-3 VR slug first increased recovery from the preferentially contacted high-permeability pathway. The final high-permeability recovery reached 8.00%, close to the 8.27% obtained in A2 with repeated VR treatment. When PA was introduced in cycle 4, the high-permeability production share decreased from 69.4% to 60.5%, while the low-permeability core contributed an incremental recovery of 2.17% (Figure 9a). This was the largest observed mean cycle-4 low-permeability increment among the schemes under the tested conditions and approximately 5.9 times the cycle-4 control value. Consequently, the final low-permeability recovery increased to 6.17%.
In the tested A5 models, applying PA first was followed by a decrease in the high-permeability production share from 72.5% to 62.2% during cycle 3, but the final high-permeability recovery reached 7.43%, close to the 7.26% control (Figure 11). The subsequent cycle-4 VR slug produced a low-permeability increment of 1.14% and a final low-permeability recovery of 6.00%, both lower observed means than the corresponding A4 values under the tested conditions. A possible conceptual explanation is that conformance control preceded further mobilization of accessible oil; the measurements do not directly demonstrate this mechanism.
Figure 11.
Observed comparison of VR → PA (A4) and PA → VR (A5) under the tested conditions: (a) final cumulative recovery in the low-permeability core, high-permeability core, and whole model; (b) cycle-specific incremental recovery in the low-permeability core. Values are means of two independent dual-core models; error bars show half ranges, not confidence intervals or standard errors. The comparison is descriptive and does not establish a statistically significant sequence effect.
The combined response is consistent with a conceptual sequence of mobilizing accessible oil before increasing resistance in the preferential pathway. Under the tested conditions, the observed mean final high- and low-permeability recoveries for VR → PA were 0.57 and 0.17 percentage points above those for PA → VR, respectively. This observed ranking combines a larger high-pathway contribution with a larger late low-pathway contribution; it does not establish a statistically significant sequence effect. Earlier conformance control may be more useful where the active pathway is already depleted or severe channeling dominates, as discussed in Section 4.3.
3.7. Produced-Oil CII Response
CII provides complementary evidence that the chemical cycles alter produced-oil composition. In A4, the high-permeability CII fell by 0.202 during VR treatment; in A5, the later VR cycle reduced it by 0.215. The timing is consistent with a formulation-dependent compositional response. Bulk SARA ratios are also affected by CO2 extraction, fractionation, selective retention or precipitation, and chemical-dependent partitioning [53,54,55,56,57,58,59,60,61]. Accordingly, CII is interpreted as compositional evidence alongside recovery and production partition, rather than as an independent spatial tracer or proof of sweep expansion. The 0.9 reference does not establish a universal precipitation threshold.
4. Discussion
Under the tested conditions, the two chemical orders were associated with different observed mean final recoveries and different timing of production from the two pathways. The comparison describes the observed ranking in these models. The following discussion combines the existing controls and measurements to interpret this response, compares it with laboratory and field studies, and evaluates the limits of sequence attribution and practical deployment. Field performance and carbon benefits are considered at the level supported by the available evidence.
4.1. Mechanistic Interpretation and Supporting Evidence
The PVT results establish strong local mobilization potential: at 56.6 °C and 12.01 MPa, viscosity decreased to 45 mPa·s and swelling reached 17.1%, while the measured MMP was 35.9 MPa. Dissolution and distance-resolved tests explain why this potential need not translate into extensive recovery. The static and mixed configurations reached 95% of their respective final gas–oil ratios in 113 and 1.3 h, and the static viscosity response disappeared at approximately 12 cm. The time ratio of approximately 87 includes differences in pressure and contact configuration. Together, these apparatus-scale observations identify contact renewal as a practical target for chemical assistance [5,15,16,17,23,24].
Three comparisons support the proposed conformance contribution. First, water-assisted A1 increased final low-permeability recovery by 0.49 percentage points over A0, while PA-assisted A3 increased it by 1.62 points. Second, after cycle-3 PA, the high-permeability oil share fell by 11.2 points in A3 and 10.3 points in A5; after cycle-3 VR in A2, the fall was 4.4 points. Third, the independent fractured-core tests showed 96.36–96.87% plugging efficiency. The agent-dependent timing and the measured resistance-generating capacity support a conformance interpretation beyond a generic aqueous-slug response. Oil partition remains influenced by mobilization, saturation, and phase behavior, so these observations support the mechanism without specifying a measured CO2 injection split.
Figure 12.
Conceptual mechanism inferred from experimental observations. The measured evidence consists of local PVT response, operational VR screening, separate PA plugging tests, and cycle-resolved oil recovery and production partition. The proposed mobilization–conformance sequence explains these observations; gas-flow redirection is an interpretation rather than a directly imaged flow field. The recovery comparison represents the observed ranking under the tested conditions (n = 2 per scheme), not a statistically established sequence effect.
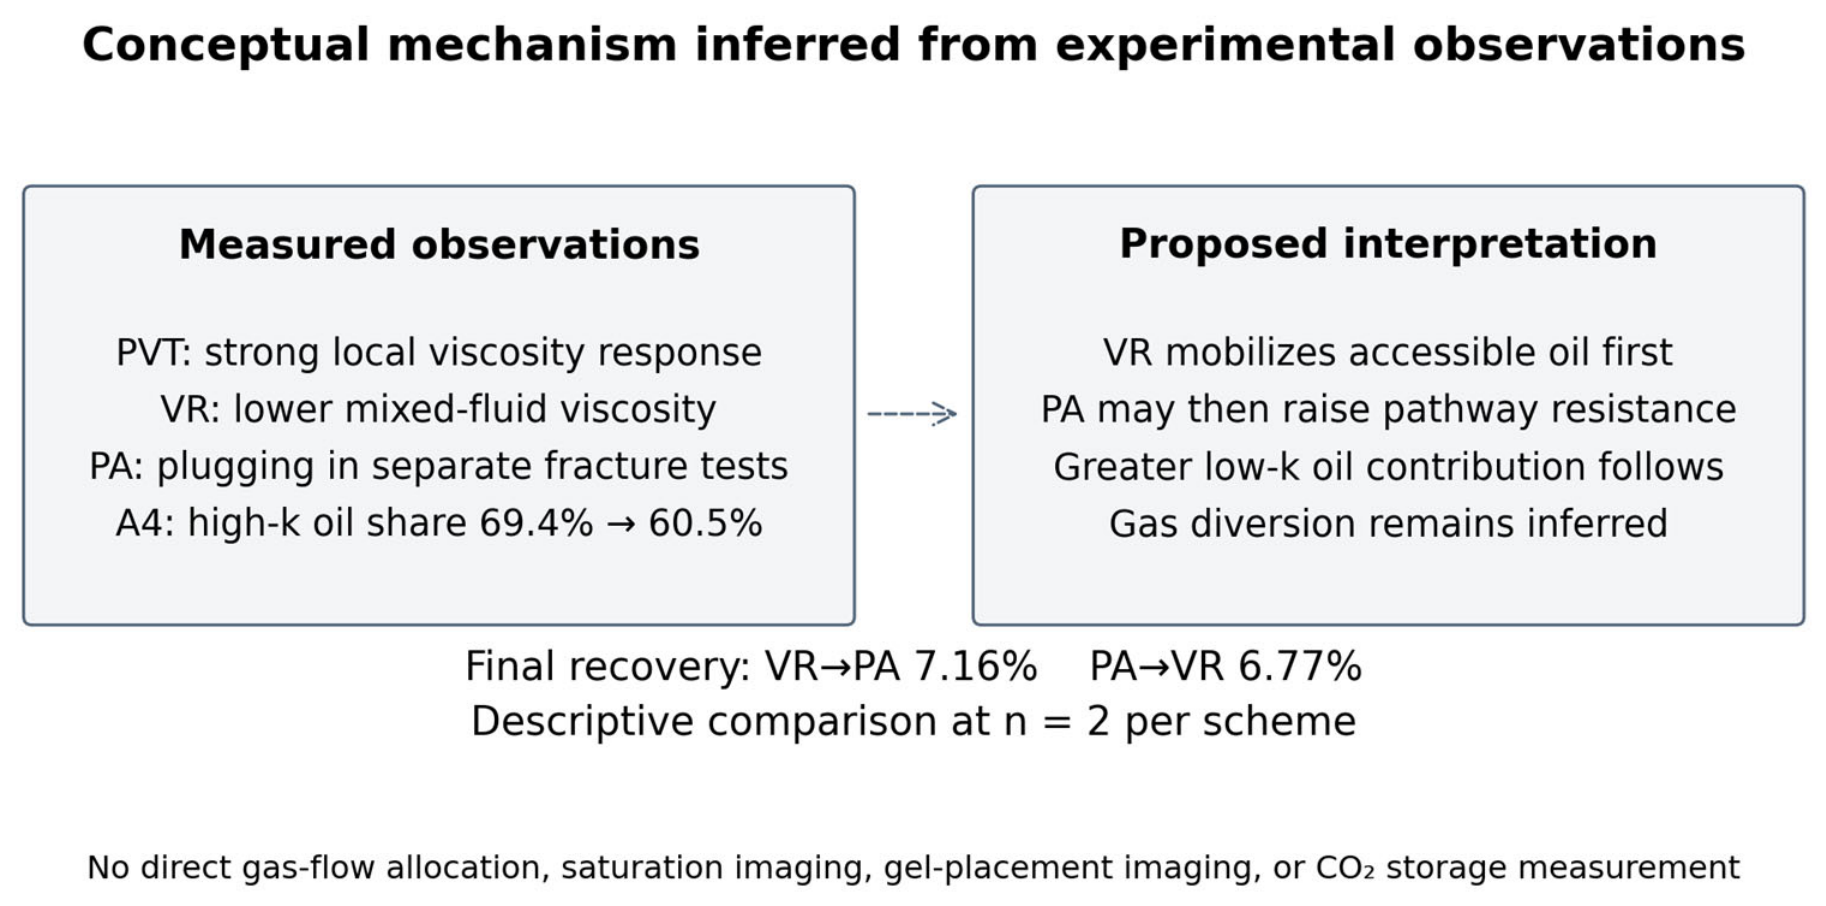
The descriptive order comparison provides further context for the conceptual mechanism under the tested conditions. A4 maintained a 69.4% high-permeability oil share during the VR cycle, then produced a 2.17% low-permeability increment during the PA cycle. A5 reduced the high-permeability share earlier but ended with lower high-permeability recovery (7.43% versus 8.00%). Preserving access to movable oil before resistance increases is a plausible explanation for the observed VR → PA ranking under the tested conditions. Recent visualization and simulation work shows how fractures, pressure, and soaking alter contact and residual-oil distribution [50], helping define the conditions under which this conceptual sequence should be evaluated.
4.2. Comparison with Previous Studies and Field Evidence
Prior studies establish chemical-assisted mobilization and conformance control [2,27,28,45]. Table 7 places the present comparison in this literature context: nominal chemical quantities are held constant while the order is reversed, and oil production is resolved independently for both permeability pathways. The 1.39-percentage-point observed mean gain over CO2 alone and the 0.39-point observed mean contrast between orders are descriptive within-study comparisons under the tested conditions (n = 2 per scheme). The table includes laboratory recovery-factor increments, field cumulative oil volumes, visualization outcomes, and CO2 utilization factors. These metrics differ in definition, baseline, reservoir setting, and scale. The values are contextual and must not be interpreted as a quantitative ranking of performance across studies.
Published field work gives practical context while illustrating the need for site-specific evaluation. Hao et al. [28] reported 3790.86 m3 cumulative oil from gel-assisted CO2 field pilots. This reported production total differs from the controlled recovery-factor gain used here. Mature-heavy-oil and shale pilots [46,47] show that reservoir selection and execution influence outcomes; in the shale pilot report, only one of three treated wells showed satisfactory performance [47]. Tall Cotton analysis [48] separately evaluated recovery and retention and reported utilization factors of approximately 6–50 Mscf/bbl. These are external field results, not carbon metrics derived from the present tests. The operating-parameter and visualization studies [49,50] further explain why sequence cannot be selected independently of pressure, soaking, fracture connectivity, and remaining oil.
4.3. Scale-Up and Field Application Considerations
Field selection should first consider whether reservoir pressure and temperature permit useful CO2-induced viscosity reduction, whether movable oil remains in the preferentially contacted region, and whether less-connected oil can benefit from selective resistance control. Permeability distribution, fractures, wettability, water chemistry, completion geometry, and allowable injection pressure affect chemical placement. The laboratory permeability ratio of 4.7–5.4 represents one controlled contrast, not a field-selection cutoff. Reservoir-specific information is needed before choosing a placement target or transferring the laboratory order.
The observed ranking under the tested conditions motivates the hypothesis that VR first may be useful when movable oil remains in the accessible pathway; earlier PA may be preferable when that pathway is depleted or severe channeling limits contact elsewhere. This is a conditional engineering interpretation, not a statistically established field sequence preference. Gel placement must restrict the dominant pathway without eliminating useful injectivity. Larger slugs or faster gelation can increase resistance but also damage near-wellbore access; smaller or diluted slugs may provide inadequate restrictions. The measured 70–96 h bulk final-strength times relative to the 72 h soak highlight the importance of timing, but bulk gel strength does not specify in-core placement. Recent studies show that pressure, soaking, heterogeneity, and pore-space protection affect recovery [40,49,50]. Monitoring oil/water production, pressure response, and injectivity is therefore central to assessing placement; gas metering is additionally necessary if utilization or retention is an evaluation objective. Well-integrity and plugging studies [62] provide related operational context, not evidence of storage by the present sequence.
4.4. Limitations and Uncertainty
The experimental domain comprises CL1601 oil, internally homogeneous epoxy-cemented parallel cores, a 4.7–5.4 permeability contrast, 56.6 °C cyclic temperature, 0.02 PV aqueous slugs, and a 14 MPa/72 h injection–soaking schedule. The findings are restricted to this domain. Fractures, capillary and wettability variation, layering, distributed crossflow, and gravity were not reproduced. Bulk screening and separate plugging tests support agent selection but do not establish chemical transport or gel placement during cyclic injection. With two independent models per scheme, the results describe the tested responses and do not establish population-level statistical significance. A calibrated reservoir simulation or a new sensitivity experiment is not part of this study.
A summary-based sensitivity check makes the effect of pre-treatment variation explicit. Let D4 be the final A4–A5 recovery difference and D2 the corresponding cycle-2 difference before chemical treatment. The treatment-stage contrast is Dtreat = D4 − D2 (Equation (9)). The reported D4 is 0.39 percentage points, with an approximate endpoint envelope of 0.31–0.47 points. The all-model cycle-2 range spans 0.38 points and provides a conservative scenario bound for D2; it is not a measured A4–A5 baseline difference. Table 8 shows that an assumed +0.20-point initial A4 advantage leaves a mean treatment-stage contrast of 0.19 points, while the +0.38-point scenario leaves 0.01 points. Combining the stated endpoint and baseline bounds gives −0.07 to 0.85 points (Equation (10)). This check shows why the observed final ranking should not be treated as proof that the entire difference was caused by order. The scenarios are calculated from displayed summaries and assumptions, not additional observations or confidence intervals.
Dtreat = (RA4,4 − RA4,2) − (RA5,4 − RA5,2) = D4 − D2
Dtreat,envelope = [0.31 − 0.38, 0.47 + 0.38] = [−0.07, 0.85] percentage point
Table 8.
Sensitivity of the sequence interpretation to assumed pre-treatment differences. Values are percentage points; these scenarios are not additional measurements.
The principal mechanism evidence is oil recovery and production partition, supported by operational viscosity screening and separate plugging tests. CII provides complementary compositional information. Direct gas allocation, saturation imaging, in-core gel placement, and product-specific molecular characterization were not available for this experiment; their absence limits discrimination between alternative mechanisms. In addition, the cycle-resolved CO2 quantities needed to evaluate utilization or retention were not recorded. Recovery and pressure endpoints cannot reconstruct those quantities. The interpretation therefore concerns observed oil recovery and a plausible conformance mechanism, without assigning CO2 utilization, storage efficiency, or net-emission benefits.
4.5. Economic Implications
The 1.39-percentage-point improvement over CO2 alone is a laboratory recovery gain and does not by itself establish economic viability. VR → PA and PA → VR used the same nominal VR and PA slug quantities. Their 0.39-point observed mean difference is a descriptive comparison under the tested conditions, without additional nominal chemical consumption; it is not a statistically established benefit attributable to order. Field viability would depend on chemical supply and placement costs, treatment volume, CO2 supply and handling, injectivity, downtime, and the value of incremental oil. Early plugging could reduce production from remaining accessible oil, whereas insufficient plugging could limit the value of the treatment. Published heavy-oil and shale pilots [46,47] illustrate the importance of reservoir-specific execution, and operating-parameter work [49] shows that the preferred schedule depends on the evaluation objective. The present tests contain neither field cost records nor field-scale incremental-oil forecasts; economic interpretation is consequently qualitative, with no profitability, cost-saving, or investment-return claim.
4.6. Relevance to CCUS-EOR and Limits of Storage Interpretation
The sequence results are relevant to the oil-recovery and contact-management component of CCUS-EOR. The larger late contribution from the low-permeability pathway, together with the separate plugging response, is consistent with more effective access to remaining oil under the tested procedure. This may be useful where preferential flow limits productive CO2–oil contact. However, the cyclic experiments did not record the complete injected and produced CO2 quantities needed for a reliable gas balance. The PVT solubility measurements characterize local oil response and cannot substitute for those records. More oil production or a lower high-permeability oil share does not establish higher utilization per-unit CO2, increased retained inventory, or long-term storage. Published studies that quantify retention [8,48] use distinct gas-balance or reservoir-performance information. Accordingly, this study reports an observed oil-recovery ranking under the tested conditions and supports a conceptual contact-management strategy; its storage relevance is a potential implication, with no quantitative storage or net-emission claim.
5. Conclusions
For CL1601 extra-heavy oil in the tested parallel-core system, VR followed by PA produced the highest observed mean recovery and a larger late low-permeability response. The main conclusions are restricted to the tested oil, permeability contrast, slug quantities, and cyclic schedule.
(1) Strong local CO2 mobilization occurred under immiscible conditions: at 56.6 °C and 12.01 MPa, viscosity decreased from 5505 to 45 mPa·s and swelling reached 17.1%, with an MMP of 35.9 MPa. Dissolution kinetics and distance-resolved measurements identify contact renewal as an important complement to local viscosity reduction.
(2) VR and PA contributed through different production responses. Repeated VR gave the highest high-permeability recovery (8.27%); PA increased low-permeability recovery and demonstrated 96.36–96.87% plugging efficiency in separate fracture tests. These observations support coupling mobilization with conformance control.
(3) Under the tested conditions, the observed mean recovery for VR → PA was 7.16 ± 0.05%, 1.39 percentage points above CO2 alone (24.1% relative), and 0.39 points above PA → VR (5.8% relative). The approximate endpoint-difference envelope was 0.31–0.47 points. With two independent models per scheme and sensitivity to pre-treatment differences, these results describe an observed ranking under the tested conditions; they do not establish a statistically significant sequence effect or a universal optimal order.
(4) After PA in the final VR → PA cycle, high-permeability oil share decreased from 69.4% to 60.5%, and low-permeability incremental recovery reached 2.17%. Together with the controls and plugging tests, this supports a conceptual mobilization–conformance sequence. Its practical relevance depends on remaining oil, selective placement, gelation, and injectivity. The contribution demonstrated here is oil recovery; CO2 utilization, retained quantity, storage efficiency, and net-emission benefits were not quantified.
Author Contributions
Conceptualization, Z.J. (Zhenhai Jiang); methodology, Z.J. (Zhenhai Jiang) and Z.J. (Zejiang Jia); software, N.Z.; formal analysis, Z.J. (Zhenhai Jiang), N.Z., Y.Z. (Yang Zhang), Z.W. and P.A.; investigation, J.W. and X.W.; resources, Z.J. (Zhenhai Jiang), J.W., N.Z. and X.W.; data curation, J.W., Z.J. (Zejiang Jia) and Z.W.; writing—original draft preparation, Z.J. (Zejiang Jia); writing—review and editing, Z.J. (Zhenhai Jiang), J.W., Z.J. (Zejiang Jia), Y.Z. (Yang Zhang), L.B. and Y.Z. (Yudong Zhao); funding acquisition, Z.J. (Zhenhai Jiang) and X.W. All authors have read and agreed to the published version of the manuscript.
Funding
This research was funded by the National Science and Technology Major Project of China, grant number 2025ZD1407100, and the PetroChina Science and Technology Special Project, grant number 2026ZS009.
Data Availability Statement
The data presented in this study are available from the corresponding author upon reasonable request.
Acknowledgments
The authors acknowledge the technical support of the Oil Production Technology Research Institute, PetroChina Dagang Oilfield Company. During the preparation of this manuscript, the authors used ChatGPT 5.6 sol (OpenAI) to assist with language review, text refinement, and preparation of plotting code and schematic layouts and labels, including Figure 1 and Figure 12. The authors carefully reviewed, edited, and validated all AI-assisted content and take full responsibility for the accuracy, interpretation, and conclusions presented in this work.
Conflicts of Interest
Authors Zhenhai Jiang, Jianzhu Wang, Zejiang Jia, Nan Zhang, Yang Zhang, Xiaoyan Wang, Zhijun Wang, Peng An, Lei Bao, and Yudong Zhao were employed by PetroChina Dagang Oilfield Company. The authors declare that, apart from the employment and funding disclosed in this statement, the research was conducted in the absence of any other commercial or financial relationships that could be construed as a potential conflict of interest. The authors declare that this study received funding from the National Science and Technology Major Project of China (Grant No. 2025ZD1407100) and the PetroChina Science and Technology Special Project (Grant No. 2026ZS009). The funders were not involved in the study design, collection, analysis, or interpretation of data, the writing of this article, or the decision to submit it for publication.
References
- Zhu, C.F.; Guo, W.; Wang, Y.P.; Li, Y.J.; Gong, H.J.; Xu, L.; Dong, M.Z. Experimental study of enhanced oil recovery by CO2 huff-n-puff in shales and tight sandstones with fractures. Pet. Sci. 2021, 18, 852–869. [Google Scholar] [CrossRef] [Scilit]
- Zeng, T.; Miller, C.S.; Mohanty, K.K. Combination of a chemical blend with CO2 huff-n-puff for enhanced oil recovery in oil shales. J. Pet. Sci. Eng. 2020, 194, 107546. [Google Scholar] [CrossRef] [Scilit]
- Burrows, L.C.; Haeri, F.; Cvetic, P.; Sanguinito, S.; Shi, F.; Tapriyal, D.; Goodman, A.; Enick, R.M. A Literature Review of CO2, Natural Gas, and Water-Based Fluids for Enhanced Oil Recovery in Unconventional Reservoirs. Energy Fuels 2020, 34, 5331–5380. [Google Scholar] [CrossRef] [Scilit]
- Jia, B.; Tsau, J.S.; Barati, R. A review of the current progress of CO2 injection EOR and carbon storage in shale oil reservoirs. Fuel 2019, 236, 404–427. [Google Scholar] [CrossRef] [Scilit]
- Zhou, X.; Yuan, Q.; Peng, X.; Zeng, F.; Zhang, L. A critical review of the CO2 huff ‘n’ puff process for enhanced heavy oil recovery. Fuel 2018, 215, 813–824. [Google Scholar] [CrossRef] [Scilit]
- Sheng, J.J. Enhanced oil recovery in shale reservoirs by gas injection. J. Nat. Gas. Sci. Eng. 2015, 22, 252–259. [Google Scholar] [CrossRef] [Scilit]
- Sheng, J.J. Optimization of huff-n-puff gas injection in shale oil reservoirs. Petroleum 2017, 3, 431–437. [Google Scholar] [CrossRef] [Scilit]
- Zhou, X.; Li, X.; Shen, D.; Shi, L.; Zhang, Z.; Sun, X.; Jiang, Q. CO2 huff-n-puff process to enhance heavy oil recovery and CO2 storage: An integration study. Energy 2022, 239, 122003. [Google Scholar] [CrossRef] [Scilit]
- Tian, C.; Pang, Z.; Liu, D.; Wang, X.; Hong, Q.; Chen, J.; Zhang, Y.; Wang, H. Micro-action mechanism and macro-prediction analysis in the process of CO2 huff-n-puff in ultra-heavy oil reservoirs. J. Pet. Sci. Eng. 2022, 211, 110171. [Google Scholar] [CrossRef] [Scilit]
- Liu, J.; Li, H.; Tan, Q.; Liu, S.; Zhao, H.; Wang, Z. Quantitative study of CO2 huff-n-puff enhanced oil recovery in tight formation using online NMR technology. J. Pet. Sci. Eng. 2022, 216, 110688. [Google Scholar] [CrossRef] [Scilit]
- Tang, W.Y.; Sheng, J.J.; Jiang, T.X. Further discussion of CO2 huff-n-puff mechanisms in tight oil reservoirs based on NMR monitored fluids spatial distributions. Pet. Sci. 2023, 20, 350–361. [Google Scholar] [CrossRef] [Scilit]
- Huang, F.; Xu, R.; Jiang, P.; Wang, C.; Wang, H.; Lun, Z. Pore-scale investigation of CO2/oil exsolution in CO2 huff-n-puff for enhanced oil recovery. Phys. Fluids 2020, 32, 092011. [Google Scholar] [CrossRef] [Scilit]
- Li, L.; Zhang, Y.; Sheng, J.J. Effect of the Injection Pressure on Enhancing Oil Recovery in Shale Cores during the CO2 Huff-n-Puff Process When It Is above and below the Minimum Miscibility Pressure. Energy Fuels 2017, 31, 3856–3867. [Google Scholar] [CrossRef] [Scilit]
- Yu, W.; Lashgari, H.R.; Wu, K.; Sepehrnoori, K. CO2 injection for enhanced oil recovery in Bakken tight oil reservoirs. Fuel 2015, 159, 354–363. [Google Scholar] [CrossRef] [Scilit]
- Li, S.; Li, Z.; Dong, Q. Diffusion coefficients of supercritical CO2 in oil-saturated cores under low permeability reservoir conditions. J. CO2 Util. 2016, 14, 47–60. [Google Scholar] [CrossRef] [Scilit]
- Li, S.; Li, B.; Zhang, Q.; Li, Z.; Yang, D. Effect of CO2 on Heavy Oil Recovery and Physical Properties in Huff-n-Puff Processes Under Reservoir Conditions. J. Energy Resour. Technol. 2018, 140, 072907. [Google Scholar] [CrossRef] [Scilit]
- Nguyen, P.; Carey, J.W.; Viswanathan, H.S.; Porter, M. Effectiveness of supercritical-CO2 and N2 huff-and-puff methods of enhanced oil recovery in shale fracture networks using microfluidic experiments. Appl. Energy 2018, 230, 160–174. [Google Scholar] [CrossRef] [Scilit]
- Su, X.; Yue, X.A.; Moghanloo, R.G. Interplay between Rock Permeability and the Performance of Huff-n-Puff CO2 Injection. ACS Omega 2020, 5, 16575–16583. [Google Scholar] [CrossRef] [Scilit] [PubMed]
- Zhang, Y.; Yu, W.; Li, Z.; Sepehrnoori, K. Simulation study of factors affecting CO2 Huff-n-Puff process in tight oil reservoirs. J. Pet. Sci. Eng. 2018, 163, 264–269. [Google Scholar] [CrossRef] [Scilit]
- Huang, K.; Zhu, W.; Sun, L.; Wang, Q.; Liu, Q. Experimental study on gas EOR for heavy oil in glutenite reservoirs after water flooding. J. Pet. Sci. Eng. 2019, 181, 106130. [Google Scholar] [CrossRef] [Scilit]
- Elwegaa, K.; Emadi, H.; Soliman, M.; Gamadi, T.; Elsharafi, M. Improving oil recovery from shale oil reservoirs using cyclic cold carbon dioxide injection—An experimental study. Fuel 2019, 254, 115586. [Google Scholar] [CrossRef] [Scilit]
- Song, Y.; Song, Z.; Zeng, H.; Tai, C.; Chang, X. N2 and CO2 Huff-n-Puff for Enhanced Tight Oil Recovery: An Experimental Study Using Nuclear Magnetic Resonance. Energy Fuels 2022, 36, 1515–1521. [Google Scholar] [CrossRef] [Scilit]
- Peng, Z.; Sheng, J. Diffusion Effect on Shale Oil Recovery by CO2 Huff-n-Puff. Energy Fuels 2023, 37, 2774–2790. [Google Scholar] [CrossRef] [Scilit]
- Gao, Y.; Li, Q.; He, X.; Yu, H.; Wang, Y. Quantitative Evaluation of Shale-Oil Recovery during CO2 Huff-n-Puff at Different Pore Scales. Energy Fuels 2021, 35, 16607–16616. [Google Scholar] [CrossRef] [Scilit]
- Wei, J.; Zhou, X.; Zhou, J.; Li, J.; Wang, A. CO2 Huff-n-Puff after Surfactant-Assisted Imbibition to Enhance Oil Recovery for Tight Oil Reservoirs. Energy Fuels 2020, 34, 7058–7066. [Google Scholar] [CrossRef] [Scilit]
- Gong, H.; Qin, X.; Shang, S.; Zhu, C.; Xu, L.; San, Q.; Li, Y.; Dong, M. Enhanced Shale Oil Recovery by the Huff and Puff Method Using CO2 and Cosolvent Mixed Fluids. Energy Fuels 2020, 34, 1438–1446. [Google Scholar] [CrossRef] [Scilit]
- Hao, H.; Hou, J.; Zhao, F.; Huang, H.; Liu, H. N2 -foam-assisted CO2 huff-n-puff process for enhanced oil recovery in a heterogeneous edge-water reservoir: Experiments and pilot tests. RSC Adv. 2021, 11, 1134–1146. [Google Scholar] [CrossRef] [Scilit] [PubMed]
- Hao, H.; Yuan, D.; Hou, J.; Guo, W.; Liu, H. Using starch graft copolymer gel to assist the CO2 huff-n-puff process for enhanced oil recovery in a water channeling reservoir. RSC Adv. 2022, 12, 19990–20003. [Google Scholar] [CrossRef] [Scilit] [PubMed]
- Kang, W.; Kang, X.; Lashari, Z.A.; Li, Z.; Zhou, B.; Yang, H.; Sarsenbekuly, B.; Aidarova, S. Progress of polymer gels for conformance control in oilfield. Adv. Colloid Interface Sci. 2021, 289, 102363. [Google Scholar] [CrossRef] [Scilit] [PubMed]
- Bai, B.; Leng, J.; Wei, M. A comprehensive review of in-situ polymer gel simulation for conformance control. Pet. Sci. 2022, 19, 189–202. [Google Scholar] [CrossRef] [Scilit]
- Seidy Esfahlan, M.; Khodapanah, E.; Tabatabaei-Nezhad, S.A. Comprehensive review on the research and field application of preformed particle gel conformance control technology. J. Pet. Sci. Eng. 2021, 202, 108440. [Google Scholar] [CrossRef] [Scilit]
- do Amparo, S.Z.S.; de Vasconcelos, C.K.B.; Almeida, A.I.A.R.; Sena, L.E.B.; Lima, M.C.F.S.; Medeiros, F.S.; Caliman, V.; Silva, G.G.; Viana, M.M. Microwave-assisted synthesis of PAM preformed particle gels reinforced with carbon nanomaterials for conformance control in oil recovery. Fuel 2022, 330, 125650. [Google Scholar] [CrossRef] [Scilit]
- Salunkhe, B.; Schuman, T.; Al Brahim, A.; Bai, B. Ultra-high temperature resistant preformed particle gels for enhanced oil recovery. Chem. Eng. J. 2021, 426, 130712. [Google Scholar] [CrossRef] [Scilit]
- Wang, K.; Liu, G.; Guo, Y.; Yang, H.; Chen, Z.; Su, G.; Wang, Y.; Wei, B.; Yu, X. Preparation and properties of degradable hydrogels as a temporary plugging agent used for acidizing treatments to enhance oil recovery. Colloids Surf. A Physicochem. Eng. Asp. 2022, 637, 128218. [Google Scholar] [CrossRef] [Scilit]
- Zhou, B.; Kang, W.; Yang, H.; Zhu, T.; Zhang, H.; Li, X.; Sarsenbekuly, B.; Sarsenbek, T. Preparation and properties of an acid-resistant preformed particle gel for conformance control. J. Pet. Sci. Eng. 2021, 197, 107964. [Google Scholar] [CrossRef] [Scilit]
- Elaf, R.; Ben Ali, A.; Saad, M.; Hussein, I.A.; Bai, B. Development of eco-friendly chitosan-g-polyacrylamide preformed particle gel for conformance control in high-temperature and high-salinity reservoirs. Geoenergy Sci. Eng. 2023, 230, 212136. [Google Scholar] [CrossRef] [Scilit]
- Zhang, H.J.; Zhu, D.Y.; Gong, Y.L.; Qin, J.H.; Liu, X.N.; Pi, Y.H.; Zhao, Q.; Luo, R.T.; Wang, W.S.; Zhi, K.K.; et al. Degradable preformed particle gel as temporary plugging agent for low-temperature unconventional petroleum reservoirs: Effect of molecular weight of the cross-linking agent. Pet. Sci. 2022, 19, 3182–3193. [Google Scholar] [CrossRef] [Scilit]
- Al Brahim, A.; Bai, B.; Schuman, T. Comprehensive Review of Polymer and Polymer Gel Treatments for Natural Gas-Related Conformance Control. Gels 2022, 8, 353. [Google Scholar] [CrossRef] [Scilit] [PubMed]
- Pi, Y.; Liu, J.; Cao, R.; Liu, L.; Ma, Y.; Gu, X.; Li, X.; Fan, X.; Zhao, M. Visualized Study on a New Preformed Particle Gels (PPG) + Polymer System to Enhance Oil Recovery by Oil Saturation Monitoring Online Flooding Experiment. Gels 2023, 9, 81. [Google Scholar] [CrossRef] [Scilit]
- Zhu, D.Y.; Zhang, J.; Zhang, T.; Gao, Y.Q.; Guo, S.; Yang, Y.L.; Lu, J.M. Damage mechanism analysis of polymer gel to petroleum reservoirs and development of new protective methods based on NMR technique. Pet. Sci. 2025, 22, 1225–1233. [Google Scholar] [CrossRef] [Scilit]
- Ge, J.; Wu, Q.; Ding, L.; Guo, H.; Zhao, A. Preparation and rheological Evaluation of a thixotropic polymer gel for water shutoff in fractured tight reservoirs. J. Pet. Sci. Eng. 2022, 208, 109542. [Google Scholar] [CrossRef] [Scilit]
- Bai, Y.; Pu, W.; Jin, X.; Shen, C.; Ren, H. Review of the micro and Macro mechanisms of gel-based plugging agents for enhancing oil recovery of unconventional water flooding oil reservoirs. J. Mol. Liq. 2024, 399, 124318. [Google Scholar] [CrossRef] [Scilit]
- Cheng, K.; Liu, Y.; Qi, Z.; Tian, J.; Luo, T.; Hu, S.; Li, J. Laboratory Evaluation of the Plugging Performance of an Inorganic Profile Control Agent for Thermal Oil Recovery. Energies 2022, 15, 5452. [Google Scholar] [CrossRef] [Scilit]
- Guo, P.; Tian, Z.; Zhou, R.; Chen, F.; Du, J.; Wang, Z.; Hu, S. Chemical water shutoff agents and their plugging mechanism for gas reservoirs: A review and prospects. J. Nat. Gas. Sci. Eng. 2022, 104, 104658. [Google Scholar] [CrossRef] [Scilit]
- Hao, H.; Li, J.; Deng, S.; Xian, B.; Tang, Z.; Yang, S.; Hou, J. N2 Foam Flooding Combined with Gel Plugging for Enhanced Oil Recovery in High-Temperature Reservoirs: Laboratory Experiments and Numerical Simulations. ACS Omega 2023, 8, 23913–23924. [Google Scholar] [CrossRef] [Scilit] [PubMed]
- Gao, C.H.; Ji, C.Y. A carbon dioxide huff and puff project at a mature heavy oil Field in Dagang, China. Greenh. Gases Sci. Technol. 2023, 13, 616–619. [Google Scholar] [CrossRef] [Scilit]
- Gao, C.H.; Liu, G. Field pilots of carbon dioxide huff and puff method at a shale oil field. Greenh. Gases Sci. Technol. 2024, 14, 352–355. [Google Scholar] [CrossRef] [Scilit]
- Karacan, C.Ö. Performance analysis of oil recovery and CO2 retention in a greenfield residual oil zone: CO2-EOR in Tall Cotton Field (Permian Basin, West Texas, USA). Carbon Capture Sci. Technol. 2025, 17, 100544. [Google Scholar] [CrossRef] [Scilit]
- Xia, Z.; Yin, H.; Wang, X.; Fu, J.; Shi, D. Sensitivity analysis and optimization of operational parameters during CO2 huff and puff in the shale oil reservoir: A case study. Geoenergy Sci. Eng. 2025, 252, 213948. [Google Scholar] [CrossRef] [Scilit]
- Chen, N.; Yao, C.J.; Liu, B.S.; Zhao, J.; Li, C.F. Microscopic experiments and simulations of CO2 huff-n-puff displacement mechanism considering heterogeneity and fractures. Pet. Sci. 2026, 23, 2793–2807. [Google Scholar] [CrossRef] [Scilit]
- Jiang, Y.; Wang, C.; Zhang, F.; Qi, Z.; Liu, G.; Zhao, J.; Zhou, Y.; Wang, B.; Lian, G.; Liu, P. Microscopic Visualization Experimental Study on the Effect and Mechanism of Viscosity Reducer on Emulsification of Heavy Oil. Energies 2023, 16, 2538. [Google Scholar] [CrossRef] [Scilit]
- Shamlooh, M.; Elaf, R.; Hussein, I.A.; Saad, M.; Bai, B. Chitosan/Polyacrylamide Green Gels for Water Control in High-Temperature Reservoirs. Energy Fuels 2022, 36, 3816–3824. [Google Scholar] [CrossRef] [Scilit]
- Fakher, S.; Ahdaya, M.; Elturki, M.; Imqam, A. An experimental investigation of asphaltene stability in heavy crude oil during carbon dioxide injection. J. Pet. Explor. Prod. Technol. 2020, 10, 919–931. [Google Scholar] [CrossRef] [Scilit]
- Fakher, S.; Ahdaya, M.; Elturki, M.; Imqam, A. Critical review of asphaltene properties and factors impacting its stability in crude oil. J. Pet. Explor. Prod. Technol. 2020, 10, 1183–1200. [Google Scholar] [CrossRef] [Scilit]
- Hartono, K.F.; Permadi, A.K.; Siagian, U.W.R.; Hakim, A.L.L.; Paryoto, S.; Resha, A.H.; Adinugraha, Y.; Pratama, E.A. The impacts of CO2 flooding on crude oil stability and recovery performance. J. Pet. Explor. Prod. Technol. 2024, 14, 107–123. [Google Scholar] [CrossRef] [Scilit]
- Sulaimon, A.A.; De Castro, J.K.M.; Vatsa, S. New correlations and deposition envelopes for predicting asphaltene stability in crude oils. J. Pet. Sci. Eng. 2020, 190, 106782. [Google Scholar] [CrossRef] [Scilit]
- Sieben, V.J.; Tharanivasan, A.K.; Andersen, S.I.; Mostowfi, F. Microfluidic Approach for Evaluating the Solubility of Crude Oil Asphaltenes. Energy Fuels 2016, 30, 1933–1946. [Google Scholar] [CrossRef] [Scilit]
- Sieben, V.J.; Stickel, A.J.; Obiosa-Maife, C.; Rowbotham, J.; Memon, A.; Hamed, N.; Ratulowski, J.; Mostowfi, F. Optical Measurement of Saturates, Aromatics, Resins, And Asphaltenes in Crude Oil. Energy Fuels 2017, 31, 3684–3697. [Google Scholar] [CrossRef] [Scilit]
- Soleymanzadeh, A.; Yousefi, M.; Kord, S.; Mohammadzadeh, O. A review on methods of determining onset of asphaltene precipitation. J. Pet. Explor. Prod. Technol. 2019, 9, 1375–1396. [Google Scholar] [CrossRef] [Scilit]
- Struchkov, I.A.; Rogachev, M.K.; Kalinin, E.S.; Roschin, P.V. Laboratory investigation of asphaltene-induced formation damage. J. Pet. Explor. Prod. Technol. 2019, 9, 1443–1455. [Google Scholar] [CrossRef] [Scilit]
- Shi, X.; Wang, Q.; Zhao, K.; Wu, Y.; Dong, H.; Zhang, J.; Yao, Y. Experimental Investigation of Enhanced Oil Recovery Mechanism of CO2 Huff and Puff in Saturated Heavy Oil Reservoirs. Energies 2024, 17, 6391. [Google Scholar] [CrossRef] [Scilit]
- Movahedi, H.; Schiefler, A.A.; Dwivedi, S.; Sørensen, H.O.; Poulsen, H.F.; Bovet, N. Novel Temperature-Responsive Organic Polymer Gel for Efficient Abandonment of Aged Porous Chalk Formations Characterized by X-ray Computed Tomography. Energy Fuels 2024, 38, 19478–19493. [Google Scholar] [CrossRef] [Scilit]

Disclaimer/Publisher’s Note: The statements, opinions and data contained in all publications are solely those of the individual author(s) and contributor(s) and not of MDPI and/or the editor(s). MDPI and/or the editor(s) disclaim responsibility for any injury to people or property resulting from any ideas, methods, instructions or products referred to in the content. |
© 2026 by the authors. Licensee MDPI, Basel, Switzerland. This article is an open access article distributed under the terms and conditions of the Creative Commons Attribution (CC BY) license.