


Abstract
With the continuous development of power systems, WAMS have become increasingly important for real-time system monitoring. As the core devices of WAMS, PMUs can provide synchronized, high-precision, and high-resolution measurements of power system states. However, in practical applications, PMUs deployed in different regions often operate at different sampling rates, resulting in multi-rate measurement data and posing challenges for data fusion. To address this issue, this paper proposes a multi-rate PMU data fusion method based on low-rank TT. Specifically, the proposed method first performs tensor-based modeling of multi-rate measurement data, embedding multidimensional correlations into a high-order tensor representation. Then, a data completion model is constructed through low-rank TT decomposition to effectively capture cross-timescale dependencies. Finally, an efficient numerical solution is developed to expand low-resolution measurements into high-resolution data, thereby achieving unified data fusion. Case studies on both simulated and real-world PMU measurement data demonstrate that the proposed approach outperforms traditional interpolation and matrix completion methods, achieving superior reconstruction accuracy and robustness.
1. Introduction
With the rapid development of modern power systems and the large-scale integration of renewable energy sources, system operations are becoming increasingly dynamic, complex, and uncertain [1,2,3]. To achieve real-time monitoring and precise control of grid operations, it is essential to obtain high-quality real-time measurement data. However, traditional SCADA systems [4] often fail to meet the requirements of modern power systems due to their low sampling rates, frequent data anomalies, and lack of synchronized measurements. Consequently, PMUs have been widely deployed in power systems [5]. Leveraging high-precision clock synchronization technologies, PMUs can provide synchronized and high-resolution measurements of voltage and current phasors, as well as system frequency and its rate of change, with refresh rates ranging from tens to hundreds of frames per second. These unique capabilities render PMUs indispensable for dynamic state estimation [6], wide-area protection [7], stability control [8], and situational awareness [9]. However, in the practical operation of WAMS, PMUs from different vendors or deployed in different regions often operate at inconsistent sampling rates, such as 30 Hz, 60 Hz, or 120 Hz [10]. This heterogeneity leads to discrepancies in the temporal resolution of measurement data. Directly applying multi-source PMU data to dynamic state estimation or wide-area monitoring can pose challenges, including time-alignment difficulties, information redundancy, and missing data, which in turn affect estimation accuracy and system reliability. Therefore, it is necessary to investigate fusion techniques for multi-rate PMU data. By mapping low-sampling-rate measurements to high-resolution time series, PMU data with different sampling rates can be aligned and integrated, thereby providing more consistent, higher-quality measurement support for power system analysis and research.
With the continuous evolution of power systems, data-driven approaches have gained increasing prominence in system monitoring and control. To obtain accurate, real-time operational data, it is necessary to deploy multiple types of measurement devices within the grid, ensuring the consistency and timeliness of information across wide-area, highly dynamic scenarios. However, due to variations among manufacturers and device specifications, the sampling frequencies of measurement units are often not fully synchronized. This highlights the need for data fusion techniques to enable unified, coordinated use of heterogeneous measurement data [11]. First, in conventional SCADA-based measurement systems, a structured framework for data fusion has been progressively developed. This framework typically covers the essential stages of data acquisition, format unification, temporal synchronization, semantic alignment, and evaluation of fusion results. Through these steps, the framework provides a precise categorization of power system data types, identifies different levels of fusion, and specifies the key processing tasks. For instance, Zhao et al. [12] introduce a SCADA data fusion method based on time-series correlation mining. By analyzing temporal correlations among multiple SCADA measurements, their approach enables the integration of heterogeneous data sources, thereby improving both the consistency and reliability of the fusion process. The study also highlights that exploiting temporal features in SCADA data within a data-driven framework is critical to enhancing the overall effectiveness of information fusion.
With the increasing deployment of PMUs in power systems, the integration of SCADA and PMU data has attracted considerable attention. While SCADA offers wide coverage of system measurements, its sampling frequency is relatively low. In contrast, PMUs can deliver time-synchronized phasor data at high sampling rates, providing a valuable enhancement for high-resolution monitoring of grid operations. With the progressive deployment of SCADA and PMUs in power systems, the fusion of these two data sources has become a prominent research topic. Diakos et al. [13] develop a framework on the RTDS platform for cross-site phasor data acquisition, aggregation, archiving, and time-aligned distribution, and validate its effectiveness in synchronization and integrity management using practical phasor data concentrator test cases, thereby laying a solid data-level foundation for subsequent studies. Building on this, Zhu et al. [14] address the disparity in sampling rates between SCADA and PMU measurements by employing a predictive interpolation approach, which maps the low-frequency SCADA time series onto the higher-frequency PMU scale. Furthermore, Tian et al. [15] propose an asynchronous fusion estimation framework from a control and signal-processing perspective, capable of handling multi-rate sampling and randomly occurring delays, and provides a unified algorithmic approach for coordinating SCADA and PMU data. Moreover, He et al. [16] address the discrepancies between SCADA and micro-PMU measurements in terms of sampling frequency, data format, and timestamp, and develop a unified information model that incorporates large-scale real-time data stream processing. They further establish a wide-area monitoring and control station in an innovative distribution system to validate the feasibility of their approach. In addition, numerous studies have focused on developing hybrid state estimation approaches that integrate SCADA and PMU measurements to enhance estimation accuracy [17,18,19].
However, in practical applications, PMUs deployed across different regions often operate at different sampling rates, making direct fusion analysis infeasible. Consequently, it is essential to conduct dedicated research on data fusion to address this issue. In addition, when time, spatial location, and multiple PMUs are considered, the resulting measurements are no longer adequately represented by conventional one-dimensional vectors or two-dimensional matrices. Instead, they extend into higher-order tensor structures, which necessitate the development of new data fusion methods capable of capturing and exploiting the inherent multidimensional correlations. To address the aforementioned issues, this paper proposes a novel data fusion approach tailored to high-order tensor representations of PMU measurements, which enables the effective integration of data from multiple PMUs operating at different sampling rates. The main contributions of this paper include:
- 1.
- For high-order PMU measurements with multiple sampling rates in power systems, this paper proposes a tensor completion-based data fusion framework. The proposed method effectively extends low-frequency measurements to higher sampling rates, thereby addressing the challenges of time alignment and consistent integration of PMU data collected at different reporting frequencies;
- 2.
- To effectively capture the higher-order correlations across time, space, and multiple PMU measurements, this paper employs a low-rank TT model to construct the data fusion framework. As a data-driven approach, the proposed framework exhibits strong scalability and can be readily extended to diverse PMU measurement scenarios in power systems;
- 3.
- To enable efficient solution of the proposed data fusion model, we employ a BCD scheme with SVT on TT-style unfoldings for iterative optimization. Furthermore, experiments are conducted using both simulated datasets and real PMU measurements. The performance of the proposed approach is then compared with that of conventional interpolation-based and matrix-based methods, thereby demonstrating its effectiveness and advantages.
The remainder of this paper is organized as follows. Section 2 presents the basic tensor notations and the corresponding tensor data completion model. Section 3 introduces the proposed tensor-train-based data fusion model, along with its solution method, followed by Section 4, which presents numerous case studies. Finally, Section 5 concludes the paper.
2. Notations and Preliminaries
In this section, we first introduce some basic tensor notations. Then, we briefly introduced traditional data completion methods, including matrix and tensor format.
2.1. Notations
Most of the notational conventions used in this study follow the guidelines in [20]. In this paper, a scalar is represented using regular italic letters, for example, . Bold lowercase and bold uppercase letters are adopted to denote vectors and matrices, respectively, such as and . Higher-order data structures are written using calligraphic letters; an N-th order tensor is expressed as . Here, denotes the dimensionality of the k-th mode, and N represents the total number of modes.
A specific entry of a tensor is indexed as , where corresponds to its coordinate across all modes. Given two tensors and of identical size , their inner product is defined by
which naturally induces the Frobenius norm of a tensor:
In many applications, a high-order tensor can be rearranged into a matrix by unfolding it along a particular mode, a process commonly referred to as matricization. For an Nth-order tensor , the mode-k unfolding is written as and yields a matrix of size . This operation rearranges the tensor entries so that all mode-k fibers become the rows of . The inverse mapping, which reconstructs the original tensor from its unfolded form, is denoted by .
2.2. Tensorization of PMU Data
Conventionally, PMU measurements are organized as a second-order matrix, where one dimension corresponds to the number of PMUs and the other to the number of acquired samples. When spatial information is incorporated, this representation can naturally be extended to a third-order tensor. However, as the sampling interval decreases and more measurements are collected, the temporal mode may become significantly larger than the other dimensions, potentially obscuring critical temporal correlations.
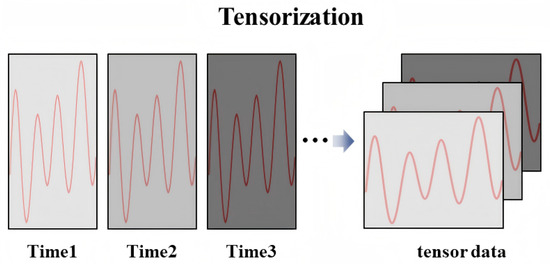
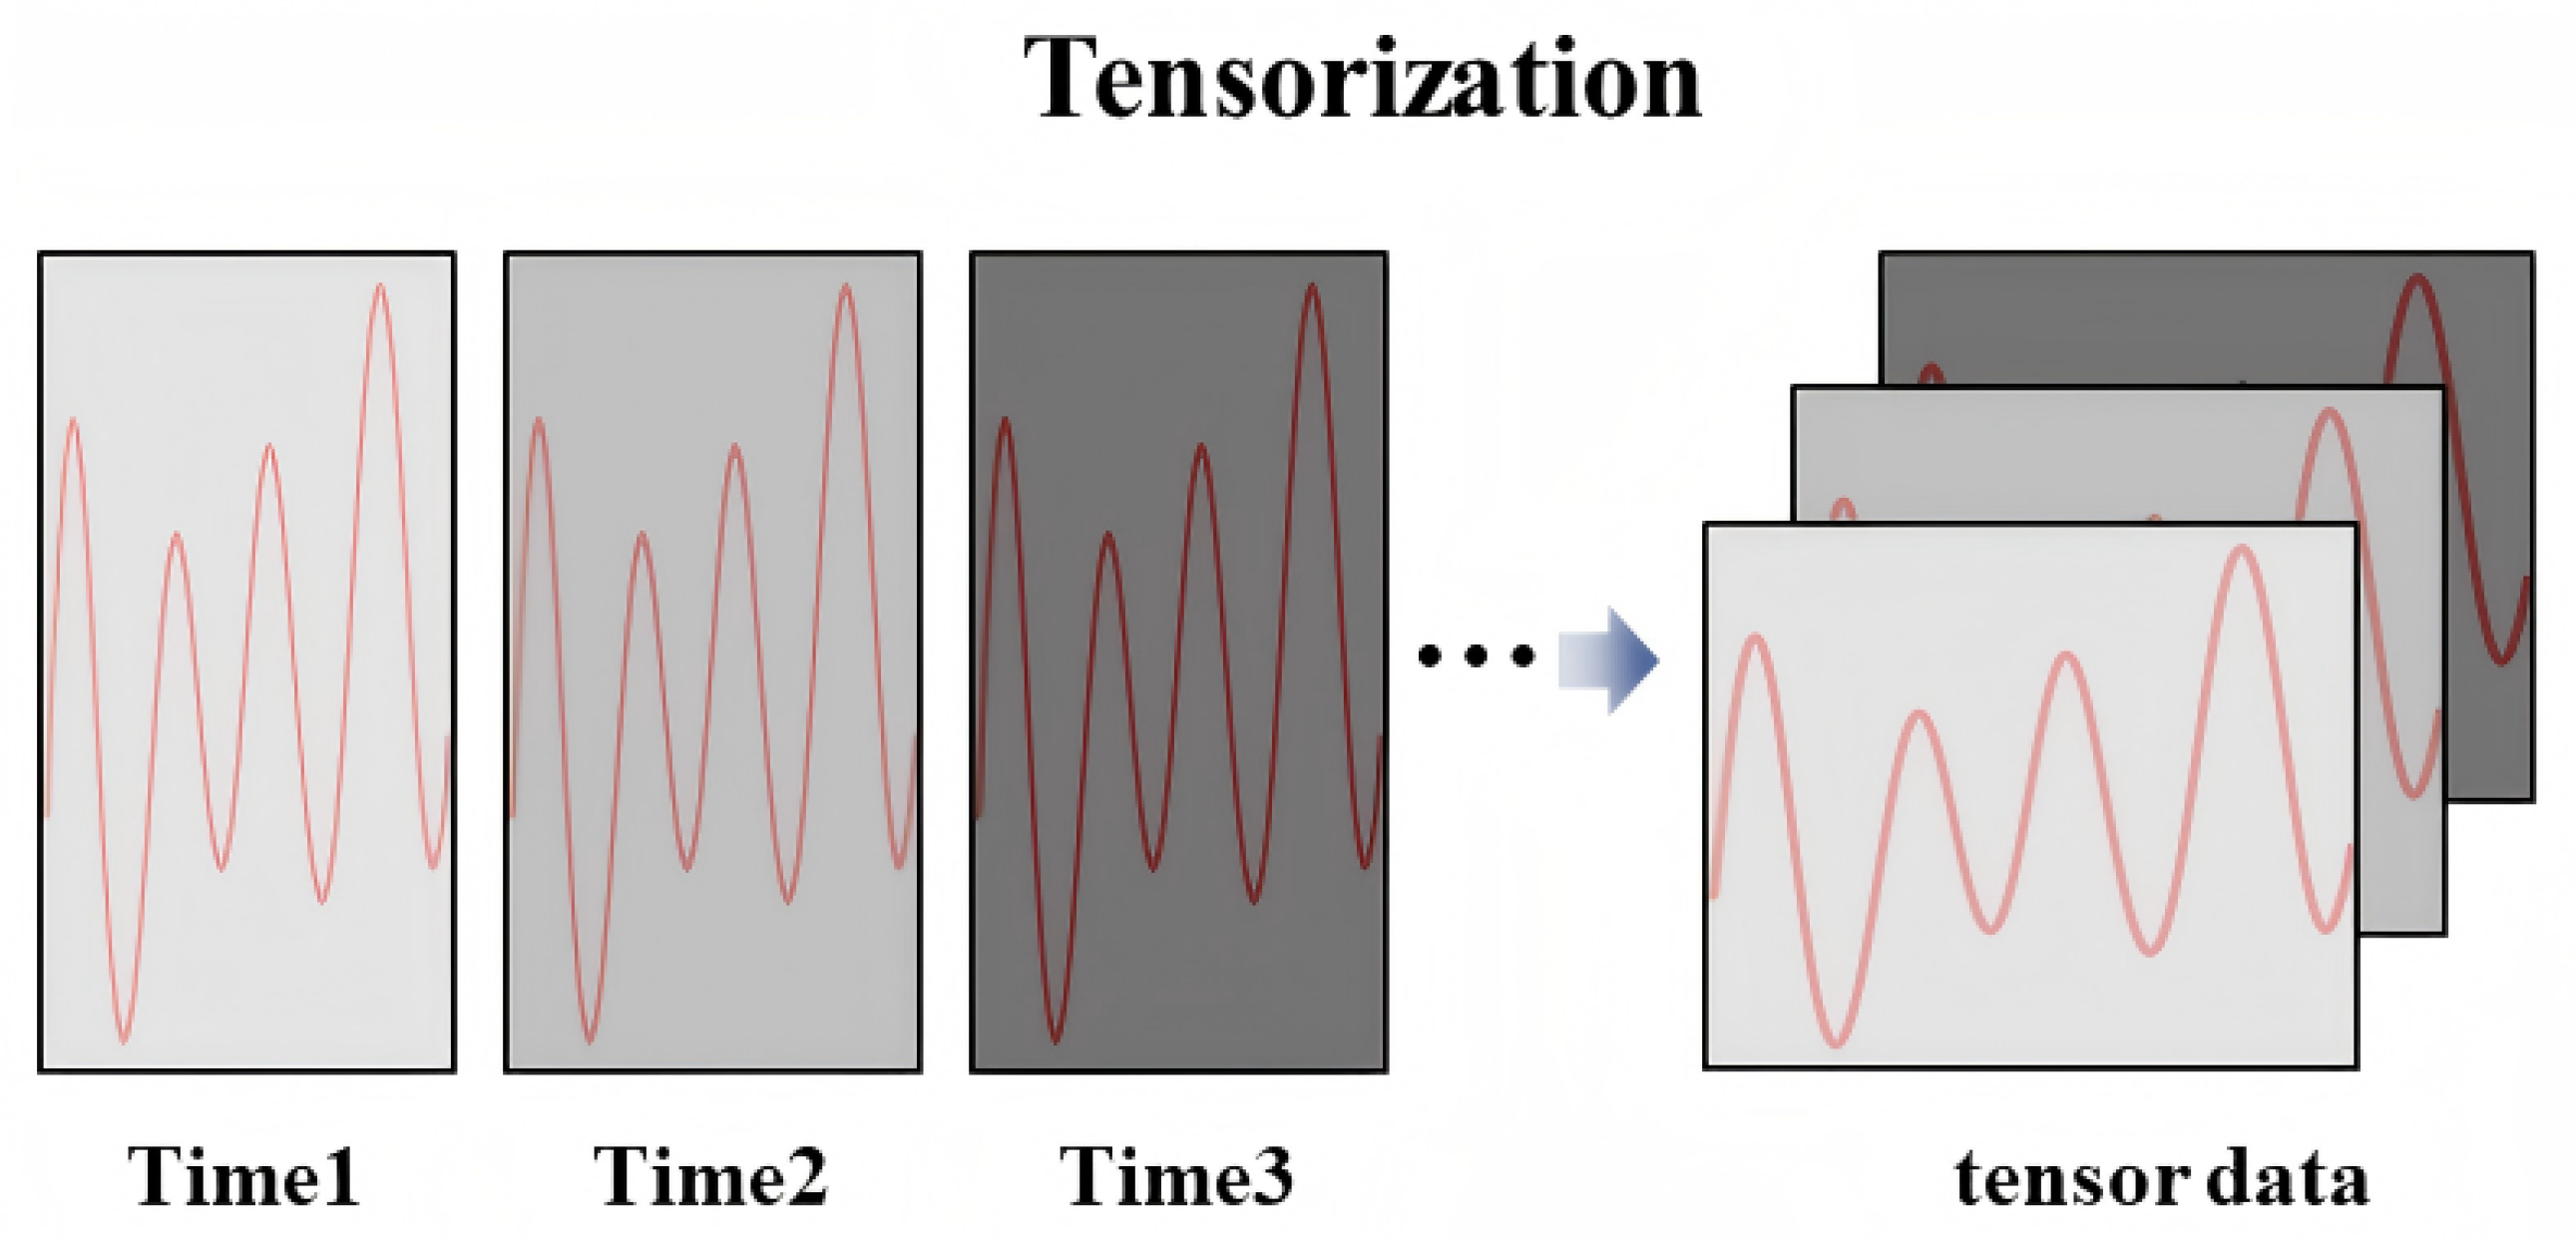
To mitigate this issue, we draw inspiration from the ket-augmentation technique widely used in image processing [21]. By restructuring the raw time series into multiple refined temporal scales, the data are lifted to a higher-order tensor representation, enabling a more effective characterization of temporal dependencies [22]. Specifically, the original time axis is decomposed into hierarchical components, such as sampling frequency, seconds, and minutes. Consequently, we can further enrich the tensor order and improve the fidelity of the reconstructed PMU data, as illustrated in Figure 1.
Figure 1.
Diagram of the Tensorization Structure for PMU Time-Series Data.
2.3. Model Framework for Measurement Data Completion
To address the challenge that PMU measurements collected at different time scales and sampling rates cannot be directly integrated, this work employs data completion techniques to reconstruct the original low-resolution measurements and thereby achieve effective data fusion [23]. By exploiting the inherent correlations across temporal, spatial, and measurement dimensions, the proposed approach enhances the temporal resolution of low-frequency data. As a foundation, we first review conventional matrix-based and tensor-based data completion models.
2.3.1. Matrix Completion
The matrix completion problem seeks to reconstruct an incomplete data matrix from a subset of observed entries [24]. Successful recovery typically relies on specific structural characteristics of the data, such as similarity or underlying dependencies. In the context of power system measurements, we assume that the PMU data matrix exhibits a low-rank structure. This assumption is reasonable because PMU measurements generally contain strong temporal coherence and spatial correlation among buses, both of which naturally give rise to low-rank behavior in the measurement matrix [25]. These intrinsic properties motivate the use of matrix completion methods to reconstruct missing or low-resolution PMU data. The matrix completion problem can then be reformulated as the following rank-minimization problem:
where represents the partially observed PMU measurement matrix, and correspond to two time scales, such as sampling instants and broader temporal intervals; and denotes the index set of available measurements. By estimating the missing entries of through rank minimization, we obtain a completed measurement matrix consistent with the observations in .
2.3.2. Tensor Completion
Tensor completion extends the idea of matrix completion to higher-dimensional data and can likewise be formulated as a rank-minimization problem. Since a tensor admits multiple rank definitions, we adopt the Tucker rank [26], leading to the following formulation:
where denotes the observed PMU measurement tensor, is the mode-k unfolding of , and are non-negative weights satisfying . In this formulation, the Tucker rank of a tensor is expressed through the ranks of its unfolding matrices, that is,
Given that PMU measurements can be organized into higher-order structures via tensorization, this multidimensional representation enables the application of Tucker-rank-based tensor completion to reconstruct missing or low-resolution PMU data.
Matrix completion is restricted to two-dimensional structures and therefore cannot exploit the multiway dependencies that arise when PMU measurements are reorganized into higher-order tensors. In addition, Tucker-based tensor completion alleviates this issue by extending rank minimization to multi-dimensional data. However, its reliance on mode-wise unfoldings means that each unfolding rank reflects only the relationship between a single mode and the remaining aggregated modes. Because holds naturally, these ranks tend to be small even before optimization, limiting their ability to represent global correlations within the data. Consequently, Tucker-rank minimization may not fully capture the inherent spatial–temporal structure present in PMU measurements. To better exploit these higher-order dependencies, we introduce in the next section a tensor completion framework based on the TT rank, which provides a more balanced and effective representation for multi-dimensional data reconstruction.
3. Proposed Methodology
In this section, we first establish the foundation for reconstructing low-frequency PMU measurements through data completion. We then present a new tensor decomposition and a new form of tensor rank. Finally, we develop a corresponding reconstruction model and solution method to obtain the high-frequency measurement data required for subsequent data fusion.
3.1. Data Reconstruction for Data Fusion
Although matrix- and tensor-completion frameworks can be applied to reconstruct PMU measurements, directly assigning zeros to the missing entries is inappropriate. Zero initialization may introduce artificial low-rank patterns. For example, it can generate entire rows or columns of zeros, which can distort the unfolding matrices and render the rank-minimization model ill-posed.
To avoid this issue, we employ an interpolation-based initialization that provides a more realistic estimate of the missing values. Specifically, we apply MATLAB’s interp function to the observed low-resolution PMU time series to obtain a high-resolution approximation, as follows
where and denote the low-resolution measurements and their interpolated counterparts, respectively. The interpolated data are then transformed into a tensor through the tensorization operator, , which serves as the initial input for the subsequent tensor-completion procedure.
3.2. TT Decomposition and TT Rank
Here, we introduce the TT decomposition as an alternative representation for high-order tensors.
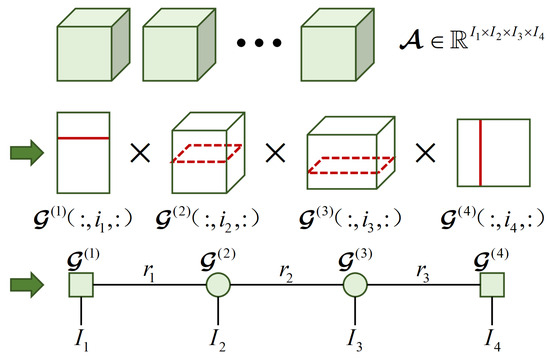
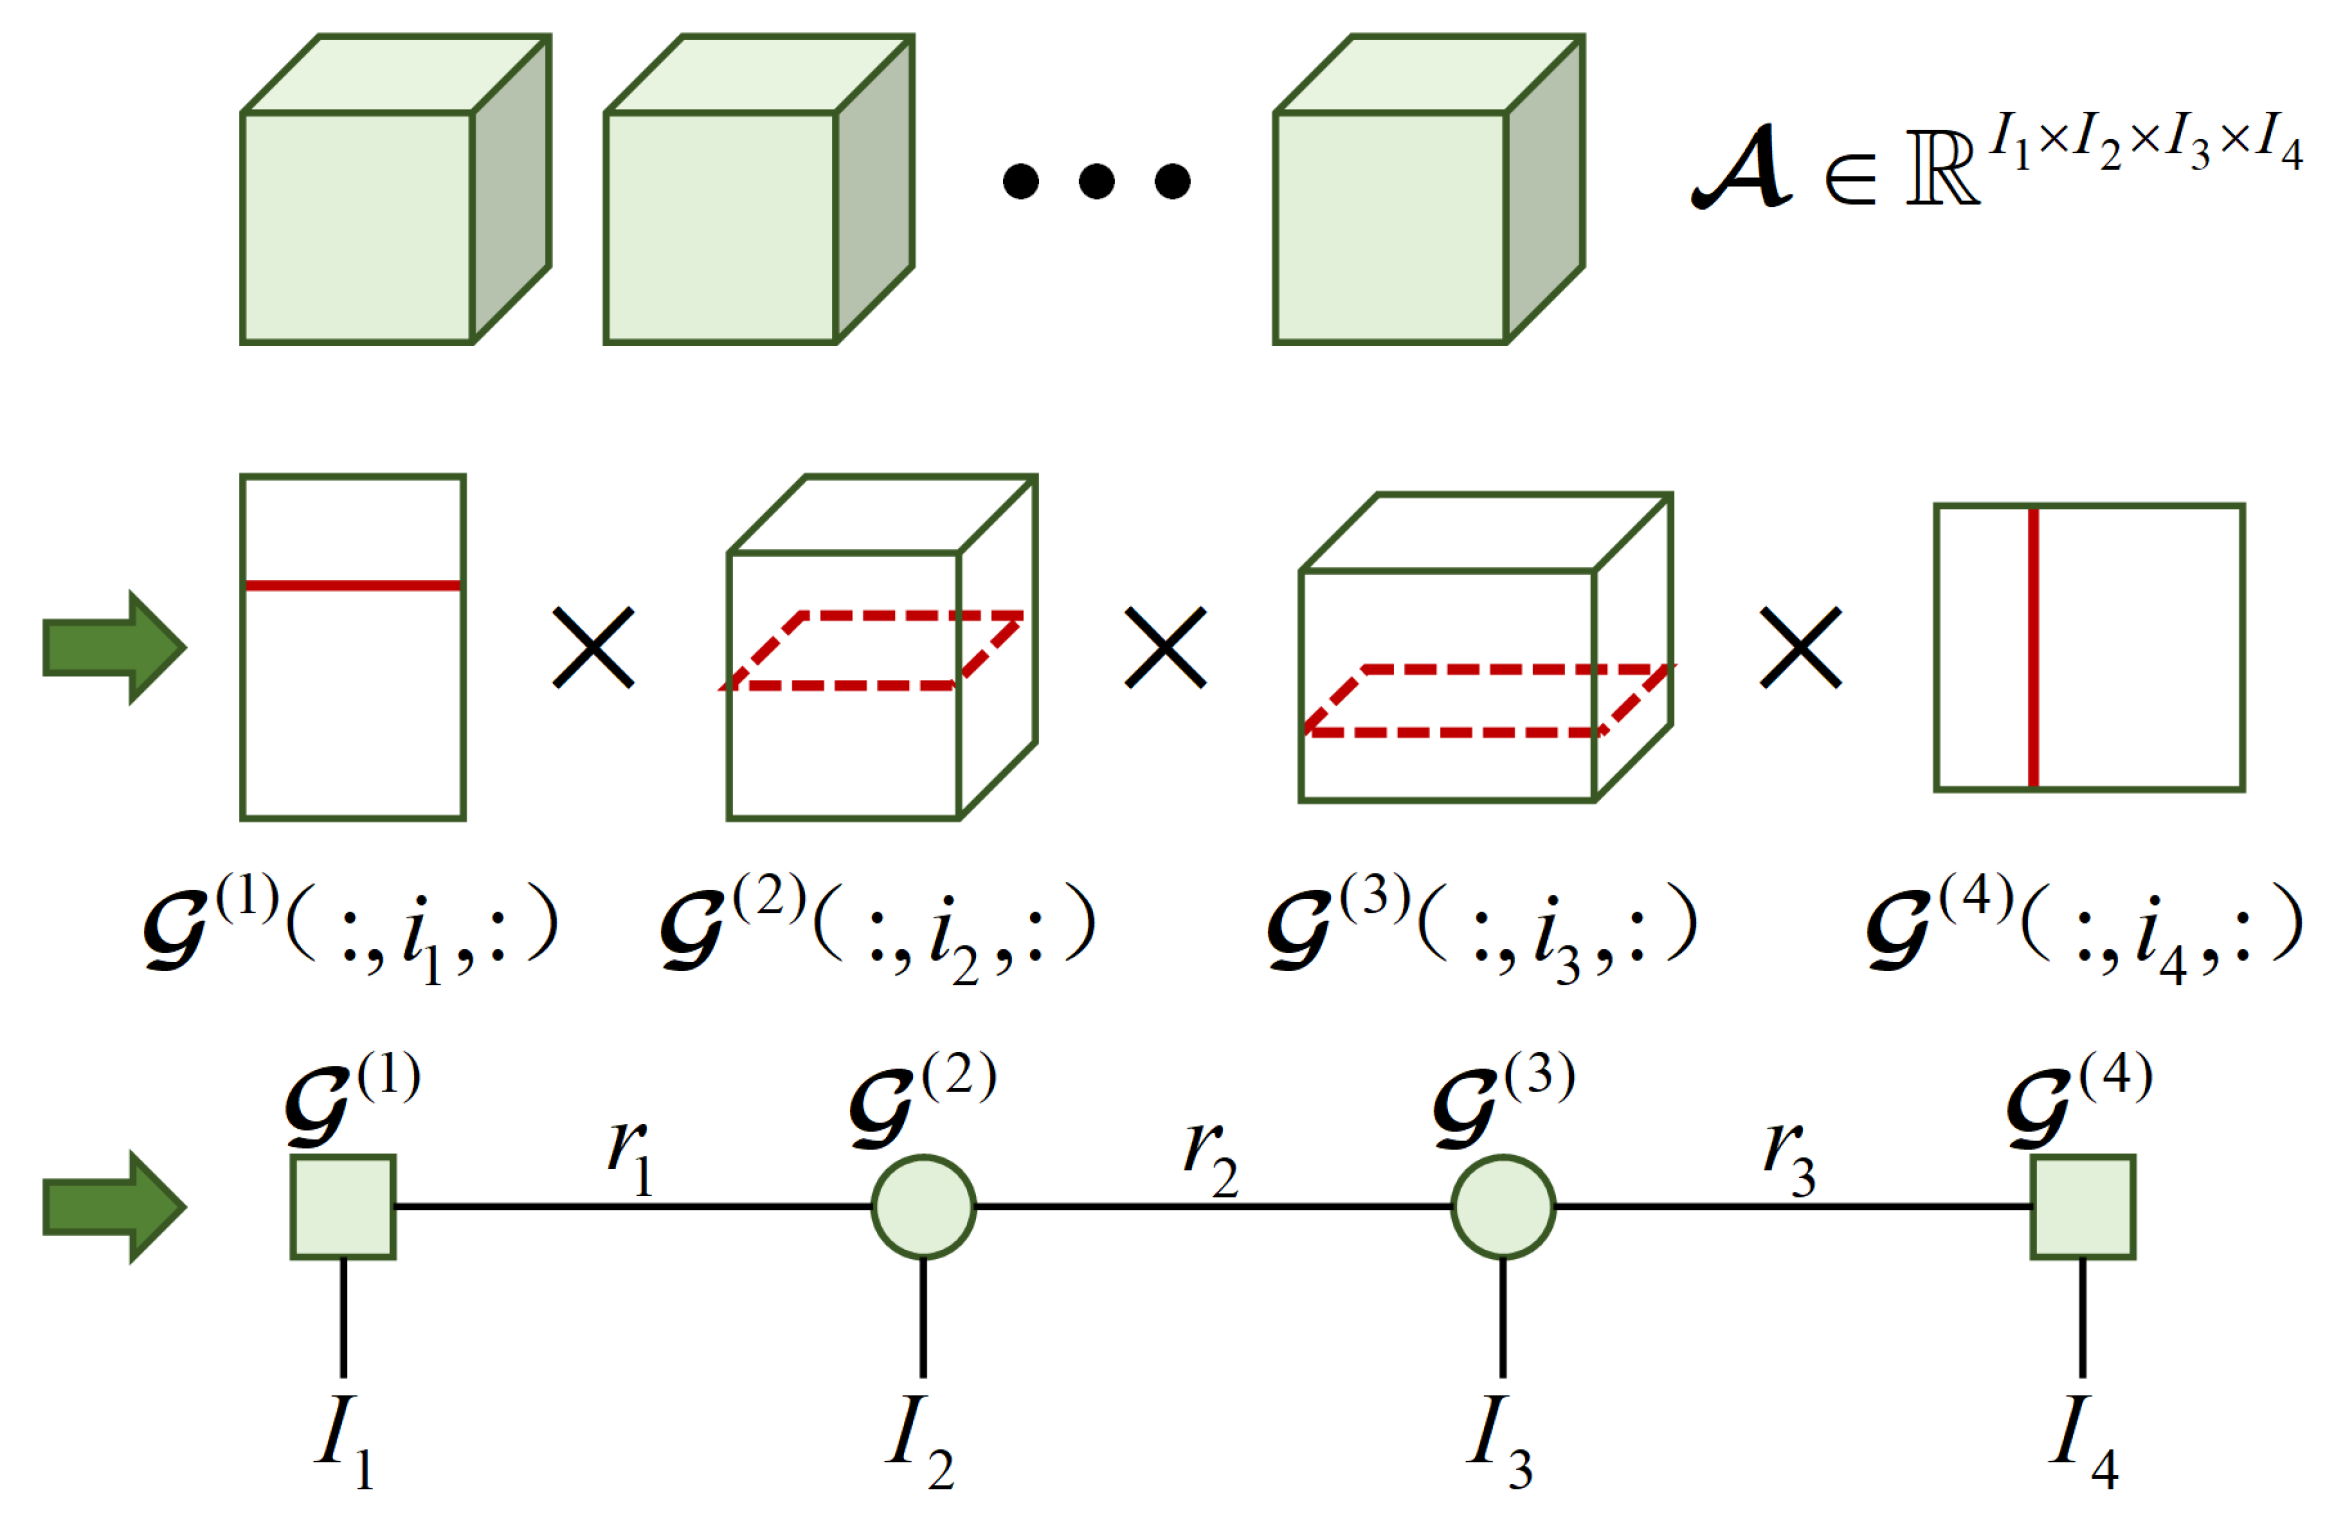
The TT decomposition expresses a high-dimensional tensor as a product of several third-order cores. For any entry of , we have
where each core contains the structural information along mode k, and denotes the TT rank with . The detailed decomposition structure is illustrated in Figure 2.
Figure 2.
Illustration of the TT decomposition for a fourth-order tensor.
To relate the TT decomposition to the TT rank, we define the TT-style unfoldings [27] as
Then, the matrix multiplication form of can be written as , which implies that the ranks of these unfoldings determine the TT rank. Thus, the TT rank of can be concisely expressed as [28]
This TT representation offers a more balanced matricization and captures multiway correlations more effectively than the Tucker format, making it well-suited for PMU data reconstruction and fusion.
3.3. TT-Rank-Based Nuclear Norm Reconstruction for PMU Data Fusion
Using the TT representation, the Tucker-rank-based model in (2) can be rewritten as the following TT-rank minimization problem:
where denotes the kth TT-style unfolding of , and is the observed tensor with entries indexed by .
Since direct rank minimization is NP-hard, we adopt its convex surrogate and replace the rank function with the nuclear norm of each unfolding, which yields
The weights are chosen as
To facilitate numerical optimization, we introduce auxiliary matrices and obtain the following equivalent formulation:
where is a positive penalty parameter defined by and is an empirical constant.
We solve (10) by a BCD scheme. The decision variables are divided into two blocks, namely and , which are updated alternately. For fixed , the subproblem for reduces to
which is a standard SVT [24] problem. Its closed-form solution is given by
where is the threshold parameter, and denotes the shrinkage operator. More precisely, letting the singular value decomposition (SVD) of be
The SVT operator can be written as
where is applied elementwise to the singular values .
After updating all , we then update the tensor with the new auxiliary matrices fixed. The entries of are refreshed according to
where is the inverse operator of the kth unfolding.
Due to the convexity of (10), the BCD iterations converge to a stationary point. In practice, the algorithm is terminated once
where l is the iteration index and is a prescribed tolerance. The procedure of the proposed method is given in Algorithm 1.
Then, we analyze the computational complexity of the proposed algorithm. For an N-th order tensor , we consider a simplified setting for complexity analysis, where all tensor modes have the same dimension, i.e., . Also, all TT ranks are assumed to be equal, namely . Under these assumptions, the main computational cost of Algorithm 1 originates from the SVT operations performed on the TT-style unfoldings. By aggregating the cost over all unfoldings, the overall computational complexity of the proposed method can be approximated as [28]. It is worth noting that the proposed method is data-driven and independent of power system topology. As a result, its computational cost scales with the number of PMU measurement channels and the length of the data window, rather than with the physical size of the power system.
Although the computational complexity is relatively high, the proposed algorithm is primarily designed for offline or quasi-offline data fusion in practical WAMS applications, such as post-event analysis, historical data reconstruction, and multi-rate data alignment over sliding time windows. In typical real-time WAMS operations, strict latency requirements are mainly imposed on protection and control functions, whereas data fusion and resolution unification are often performed at a higher level with relaxed timing constraints. Therefore, the computational cost of the proposed method does not constitute a major limitation in its intended application scenarios.
In terms of memory usage, the proposed algorithm stores the tensor variable and one unfolded matrix together with its SVD factors at each iteration. Since the block coordinate descent scheme updates the unfoldings sequentially, only one unfolding is stored at a time. As a result, the peak memory requirement per iteration scales as , which grows linearly with the data size and remains manageable for typical offline WAMS applications.
| Algorithm 1 TT-Based Nuclear Norm Minimization Method |
|
4. Results and Discussions
In this section, we conduct comprehensive experimental studies to validate the proposed method. We first apply it to simulated PMU measurements from the IEEE 39-bus system to examine its ability to reconstruct high-resolution signals from low-resolution observations, thereby demonstrating its effectiveness in extending sampling frequency. Subsequently, we evaluate the method using real PMU measurement data to assess its robustness under practical noise conditions. By reconstructing high-resolution sequences from coarse measurements, the proposed approach enables consistency across different sampling rates and establishes a unified data basis for data fusion and multi-frequency collaborative analysis.
4.1. Test with Simulated PMU Measure Data
In this section, we conduct simulation-based validation using the IEEE 39-bus system. PMUs are installed at all generator buses, and the initial low-resolution measurements are sampled at 10 Hz over a 10-min duration. To evaluate the proposed method’s capability to enhance temporal resolution, 10 Hz measurements are used to reconstruct higher-resolution sequences at 30 Hz and 60 Hz. The reconstructed signals are then compared with the corresponding ground-truth high-resolution data. By examining the reconstruction performance across different target sampling frequencies, we can more comprehensively assess the effectiveness and applicability of the proposed approach in recovering high-frequency temporal details under various frequency-extension scenarios.Meanwhile, to further validate the practical applicability of the proposed method, additional experiments are conducted on the IEEE 118-bus system.
To construct the tensorized PMU measurement data, we reorganize the original 10 Hz, 10-min time series into a four-order tensor of size . The first order corresponds to the number of samples collected within each second at a 10 Hz sampling rate. The second order represents the six 10-s segments that form one minute. The third order (10) further subdivides each minute into ten parts, and the final order denotes the total measurement duration of ten minutes. This tensorization satisfies , which matches the length of the original time-series data and enables more effective modeling of multi-scale temporal correlations. For the parameter , we assign its value empirically based on practical experience [28]. Moreover, since the convergence criterion in (17) may already be fulfilled in the first iteration once the normalization is imposed, an additional condition is introduced to ensure that the algorithm continues to update the solution. Specifically, we require , which guarantees a monotonic decrease in the reconstruction error. In the implementation, the maximum number of iterations is set to 1000, and the tolerance parameter in (17) is chosen as .
The experimental results are shown in Figure 3, where the 10 Hz low-resolution PMU measurements are used to reconstruct high-resolution signals at 30 Hz and 60 Hz. As illustrated in the figure, both reconstructed waveforms maintain high fidelity to the reference data. When temporal correlations in the measurements are strong, the proposed method accurately recovers the intermediate samples and yields high-quality reconstructions. These findings indicate that the approach can effectively enhance sampling resolution and provide a feasible solution for fusing PMU data with different reporting rates and achieving precise temporal alignment.
Figure 3.
Reconstruction performance comparison between interpolation-only and TT-based methods under temporal resolution enhancement of simulated PMU data. (a) Three-fold enhancement: the 30 Hz signal reconstructed from 10 Hz measurements closely matches the true high-resolution waveform. (b) Six-fold enhancement: the 60 Hz from 10 Hz measurements.
In addition, we conduct comparative experiments that include the nearest interpolation approach and a matrix-based data completion method. To assess the reconstruction accuracy, we adopt several error metrics commonly used for time-series evaluation. The MAE and RMSE quantify the absolute and squared deviations between the reconstructed and reference signals, while the coefficient of determination measures the extent to which the reconstructed data preserve the variability of the original waveform. Their definitions are
where N denotes the number of samples, and represent the j-th reference and reconstructed data points, and is the mean of the reference measurements. For the simulation studies, the high-rate ground truth is obtained directly from time-domain power system simulations by using a sufficiently small integration step size. The resulting high-resolution data are treated as the reference signals, from which lower-rate PMU measurements are generated by down-sampling. Since both the low-rate and high-rate signals are derived from the same PMU data stream, their timestamps are inherently aligned through the downsampling process, and no additional time synchronization is required.
Table 1 summarizes the reconstruction accuracy of the different methods under three-fold and six-fold resolution enhancement. The nearest interpolation shows acceptable performance, but its RMSE and MAE are clearly higher than those of the proposed TT–based approach, indicating limited ability to recover fine-scale temporal variations. The accuracy of the matrix nuclear norm method clearly degrades as the reconstruction ratio increases, reflecting the inherent limitations of matrix representations in capturing multi-dimensional correlations. In contrast, the TT nuclear norm method consistently achieves the lowest RMSE and MAE and yields an value close to 1 under both enhancement ratios. This demonstrates that exploiting multi-mode structure through tensorization effectively preserves temporal features during frequency expansion, making TT-based reconstruction significantly more robust and accurate for PMU data fusion.
Table 1.
Comparison of Simulated PMU Data Reconstruction Performance Across Different Methods.
To further evaluate the computational performance of the proposed method in practical applications, we conduct runtime comparison experiments, and the results are summarized in Table 2. The nearest interpolation method has negligible computational cost because it does not involve iterative optimization. By contrast, both the matrix nuclear norm–based method and the proposed TT method rely on repeated singular value thresholding operations and therefore incur higher computational overhead. Nevertheless, the overall runtime remains within a few seconds, which is acceptable for the intended offline WAMS applications.
Table 2.
Runtime comparison of different reconstruction methods using simulated PMU data.
Although the above experiments are mainly conducted on the IEEE 39-bus system, it should be noted that the proposed method focuses on data completion and reconstruction of individual PMU measurement time series. Its implementation does not depend on the underlying power system topology or network scale. Consequently, the reconstruction performance is primarily determined by the temporal structure, sampling rate, and data length of the PMU measurements, rather than by the number of system buses. From this perspective, the difference between the IEEE 39-bus system and larger systems is marginal at the level of single-PMU reconstruction, with the main distinction being the increased number of PMU channels.
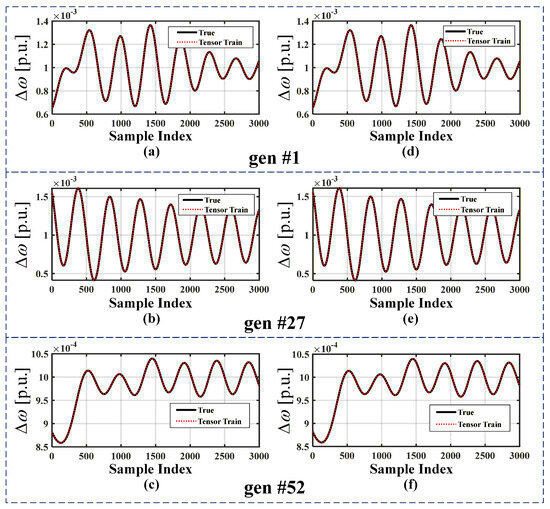
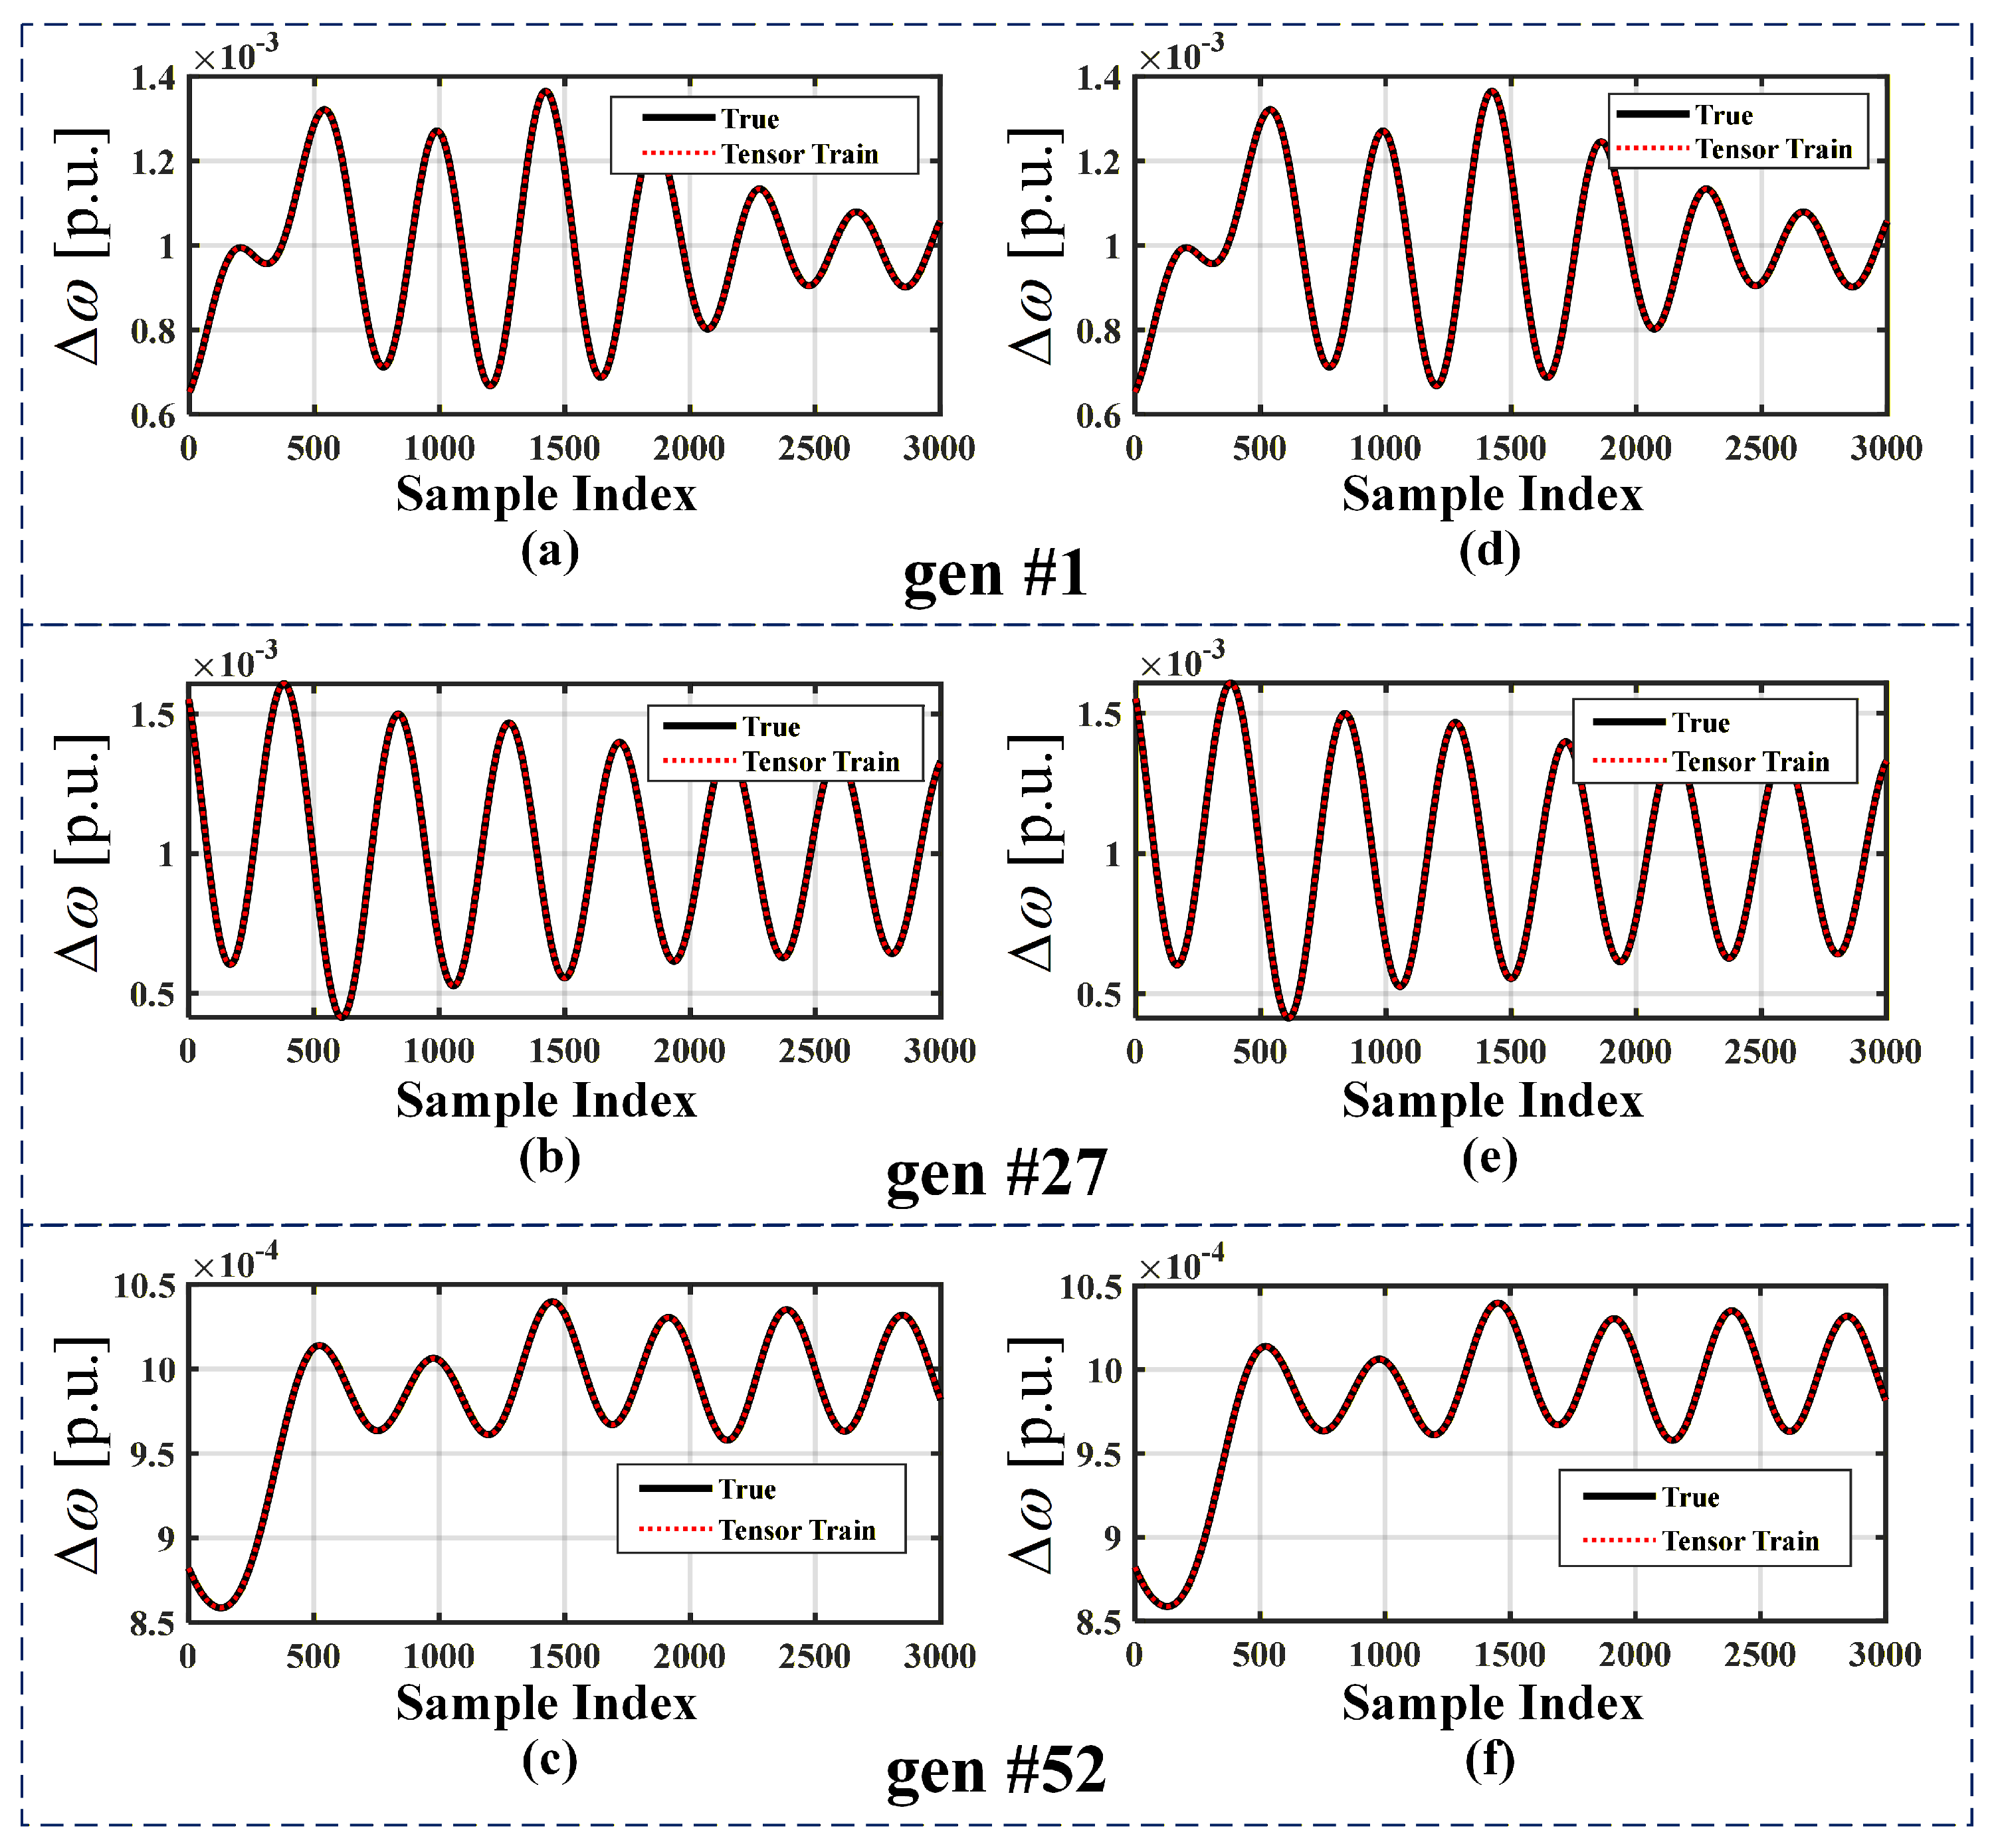
Nevertheless, to further strengthen the validation, additional simulation experiments are performed on the IEEE 118-bus system. The simulated PMU data in Figure 4 are generated from post-fault dynamic responses of the power system following a disturbance, rather than steady-state operating conditions. Three PMU measurement channels with different dynamic characteristics are selected for reconstruction analysis. To complement the previous experiments, PMU frequency reconstruction is considered here, and the corresponding results are shown in Figure 4. The results demonstrate that, under a larger system scale, the proposed method achieves reconstruction performance consistent with that observed in the IEEE 39-bus system, thereby confirming its stability and applicability as the system size increases.
Figure 4.
Frequency reconstruction results for three generators with different dynamic characteristics in the IEEE 118-bus system. (a–c): three-fold enhancement; (d–f): six-fold enhancement.
To further examine the influence of the parameter on reconstruction performance, we conduct a sensitivity analysis by varying over a wide range while keeping all other settings unchanged. The reconstruction accuracy under different values is summarized in Table 3. As expected, the reconstruction accuracy consistently improves as increases. This behavior is consistent with the role of in the SVT operation, where larger values correspond to weaker singular value truncation and thus allow more signal components to be retained. Meanwhile, the performance gains become progressively smaller as increases, indicating that the reconstruction results remain stable in the large- regime.
Table 3.
Reconstruction performance under different values of .
In practice, is selected to be sufficiently large to prevent excessive singular value truncation while ensuring stable convergence of the algorithm. As shown in Table 3, a fixed large is used throughout this work, which consistently yields high reconstruction accuracy across all tested cases. It is worth noting that serves as a numerical regularization parameter that controls the truncation behavior of the SVT operator, rather than representing an explicit noise model. Consequently, its selection is primarily governed by reconstruction stability and low-rank enforcement, and is not strongly dependent on the measurement noise level. In the original experiments, relatively large values of were selected to ensure stable convergence and to avoid overly aggressive singular value shrinkage. For completeness, an additional experiment with has been conducted. The results exhibit the same performance trend as those reported in Table 3.
Although PMUs are installed at multiple generator buses in the IEEE 39-bus system, the tensorization and reconstruction in this work are performed independently for each PMU measurement time series. Specifically, after the initial interpolation step, the data are organized into a high-order tensor of size . This tensor structure is not based on spatial partitioning of network nodes but is constructed by reorganizing a single time series into multiple temporal modes via a temporal tensorization scheme. Such temporal tensorization has been used in data processing applications to reveal correlations across different time scales [29], thereby facilitating low-rank representations and high-accuracy reconstruction.
To further examine the rationality of the chosen tensor structure, additional experiments are conducted using different combinations of temporal modes. As shown in Table 4, all tested tensor structures achieve comparable and consistently high reconstruction accuracy, indicating that the proposed method is not sensitive to the specific temporal factorization of the data. It can be observed that tensor structures with higher order tend to provide slightly improved reconstruction performance, suggesting that higher-order tensorization is beneficial for exploiting multi-scale temporal structures. In addition, we independently reconstruct the data for each PMU measurement channel. Although multiple PMUs are deployed across the power system, the tensorization and TT completion are applied at the single-channel time-series level. This design ensures that the computational complexity of the proposed method scales linearly with the number of PMU channels. As a result, the method can be flexibly applied to systems with an arbitrary number of PMUs without being affected by the network topology.
Table 4.
Reconstruction performance under different structures of PMU measure data.
4.2. Test with Real PMU Measurement Data
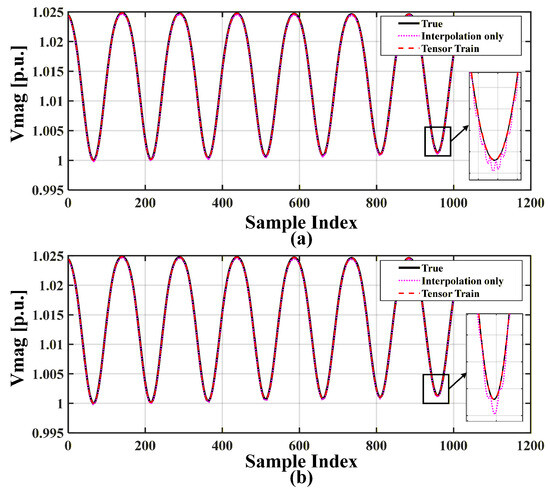
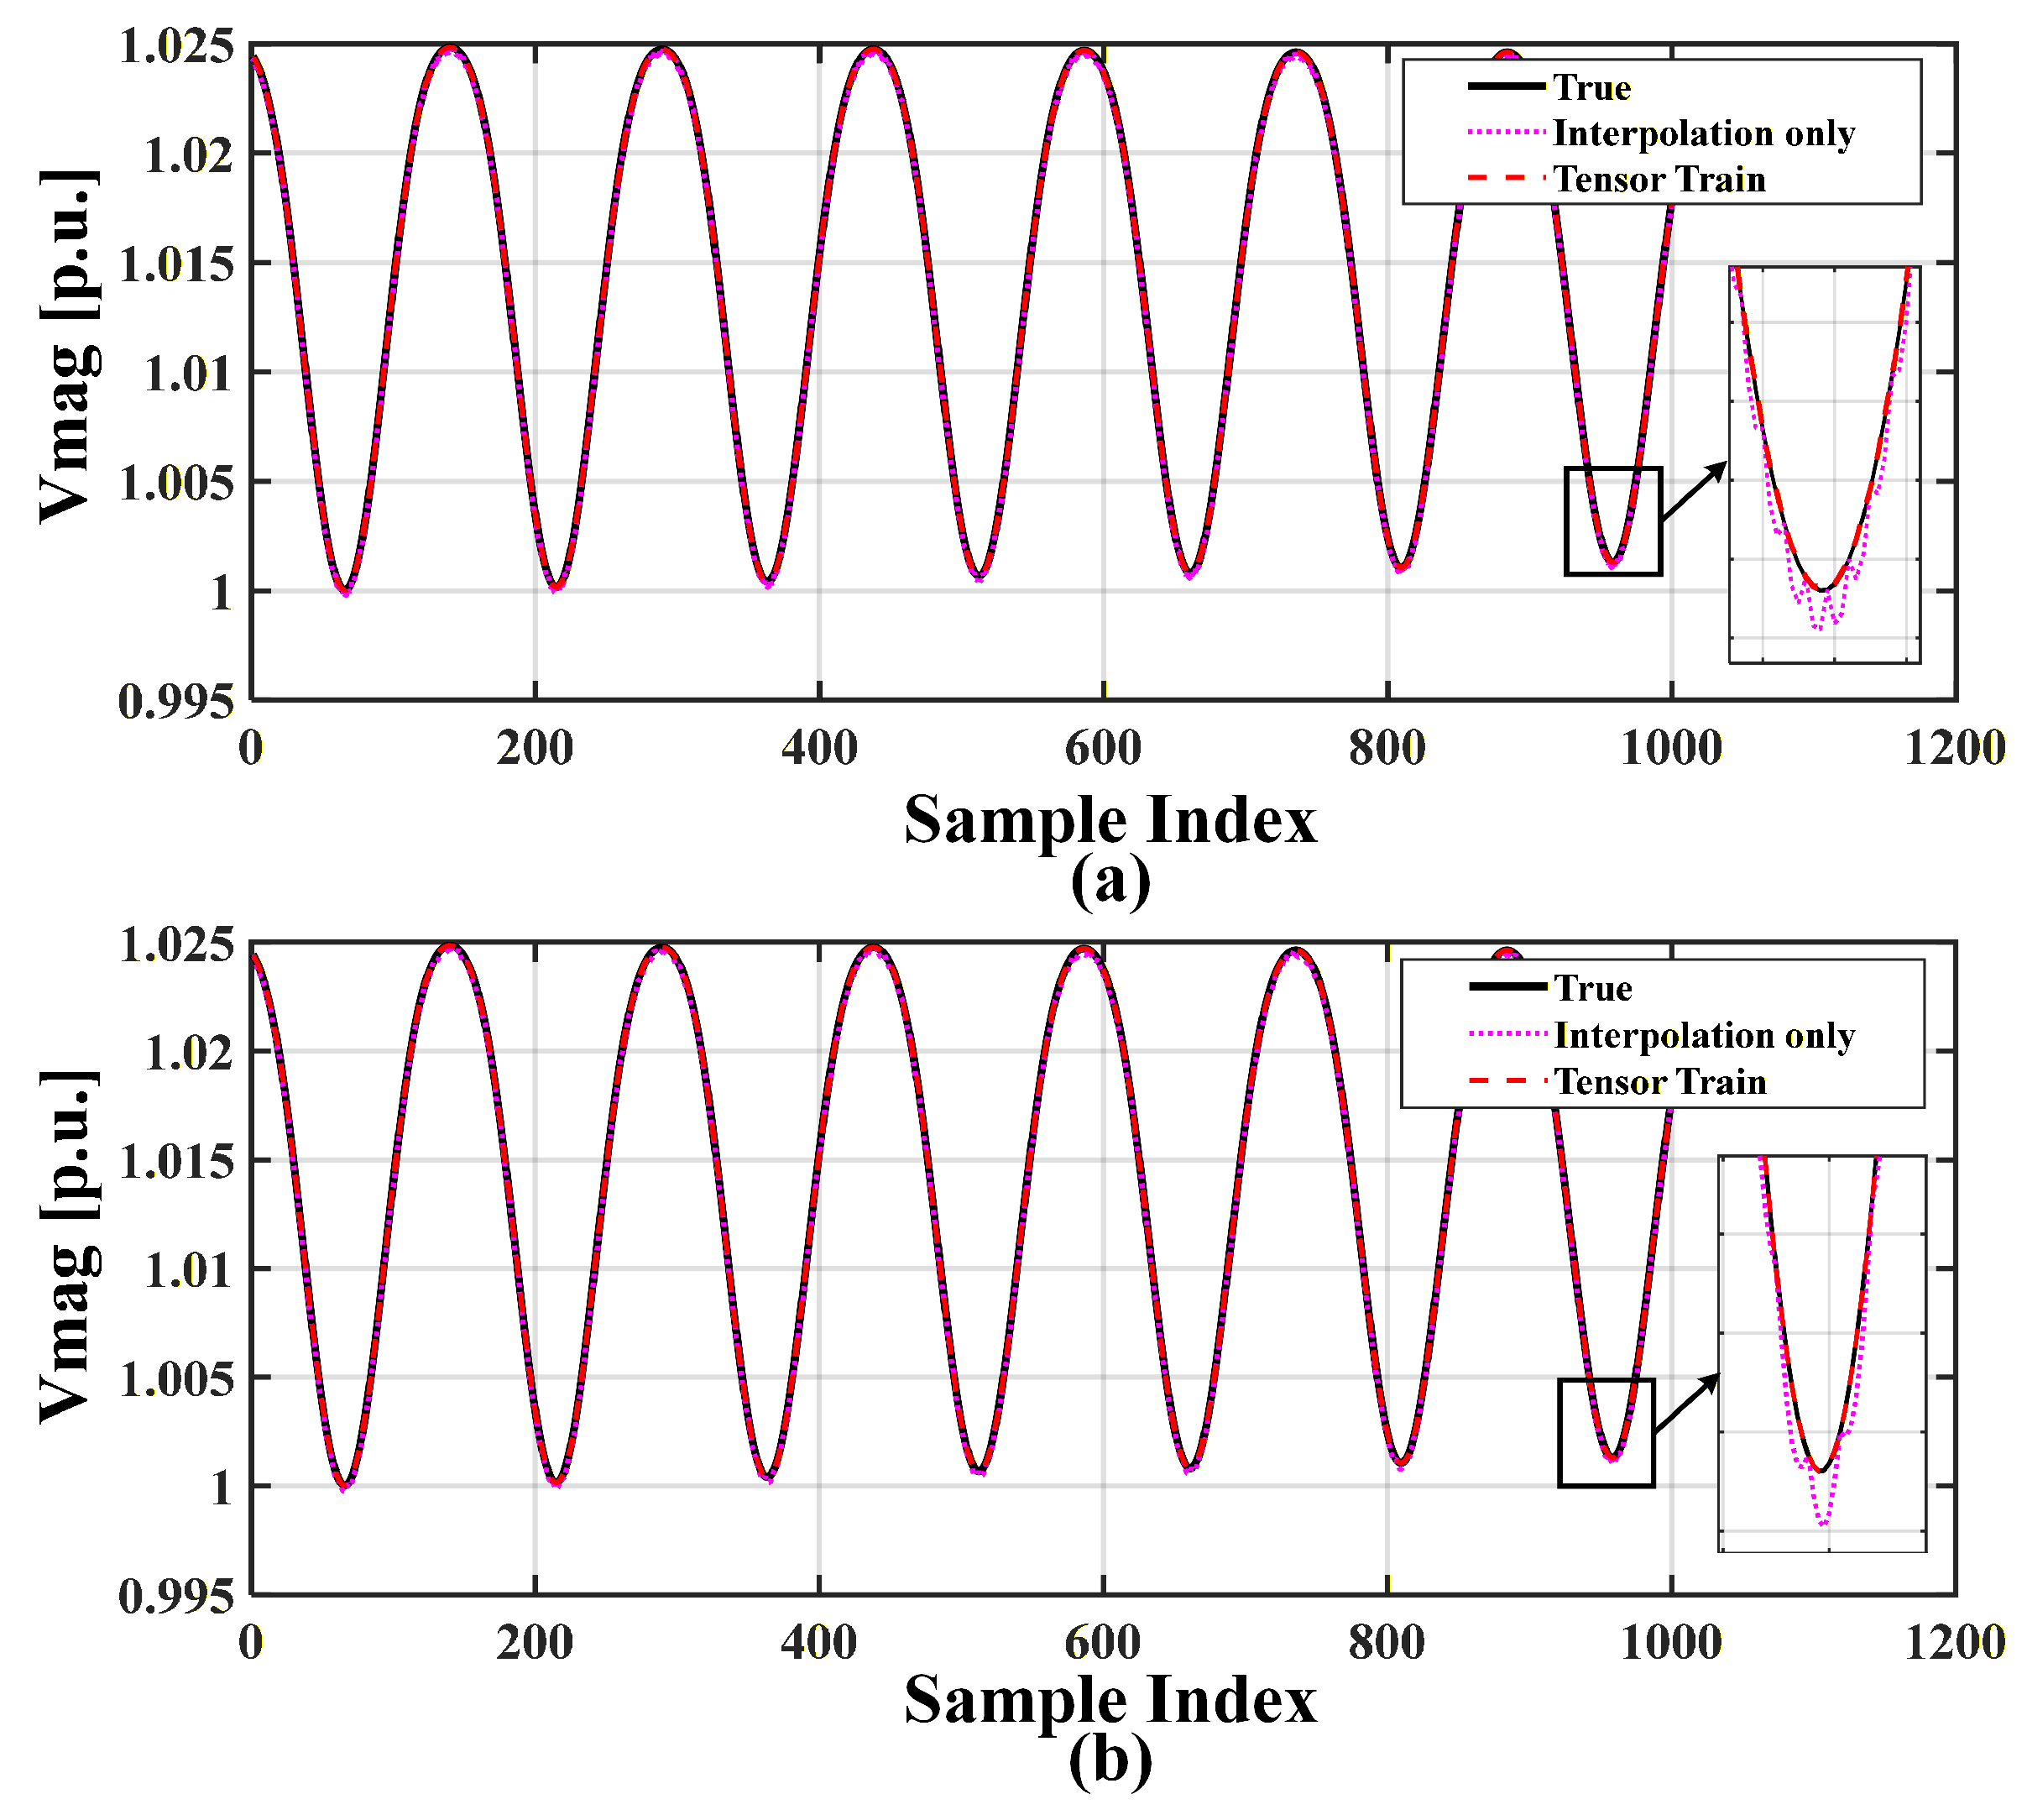
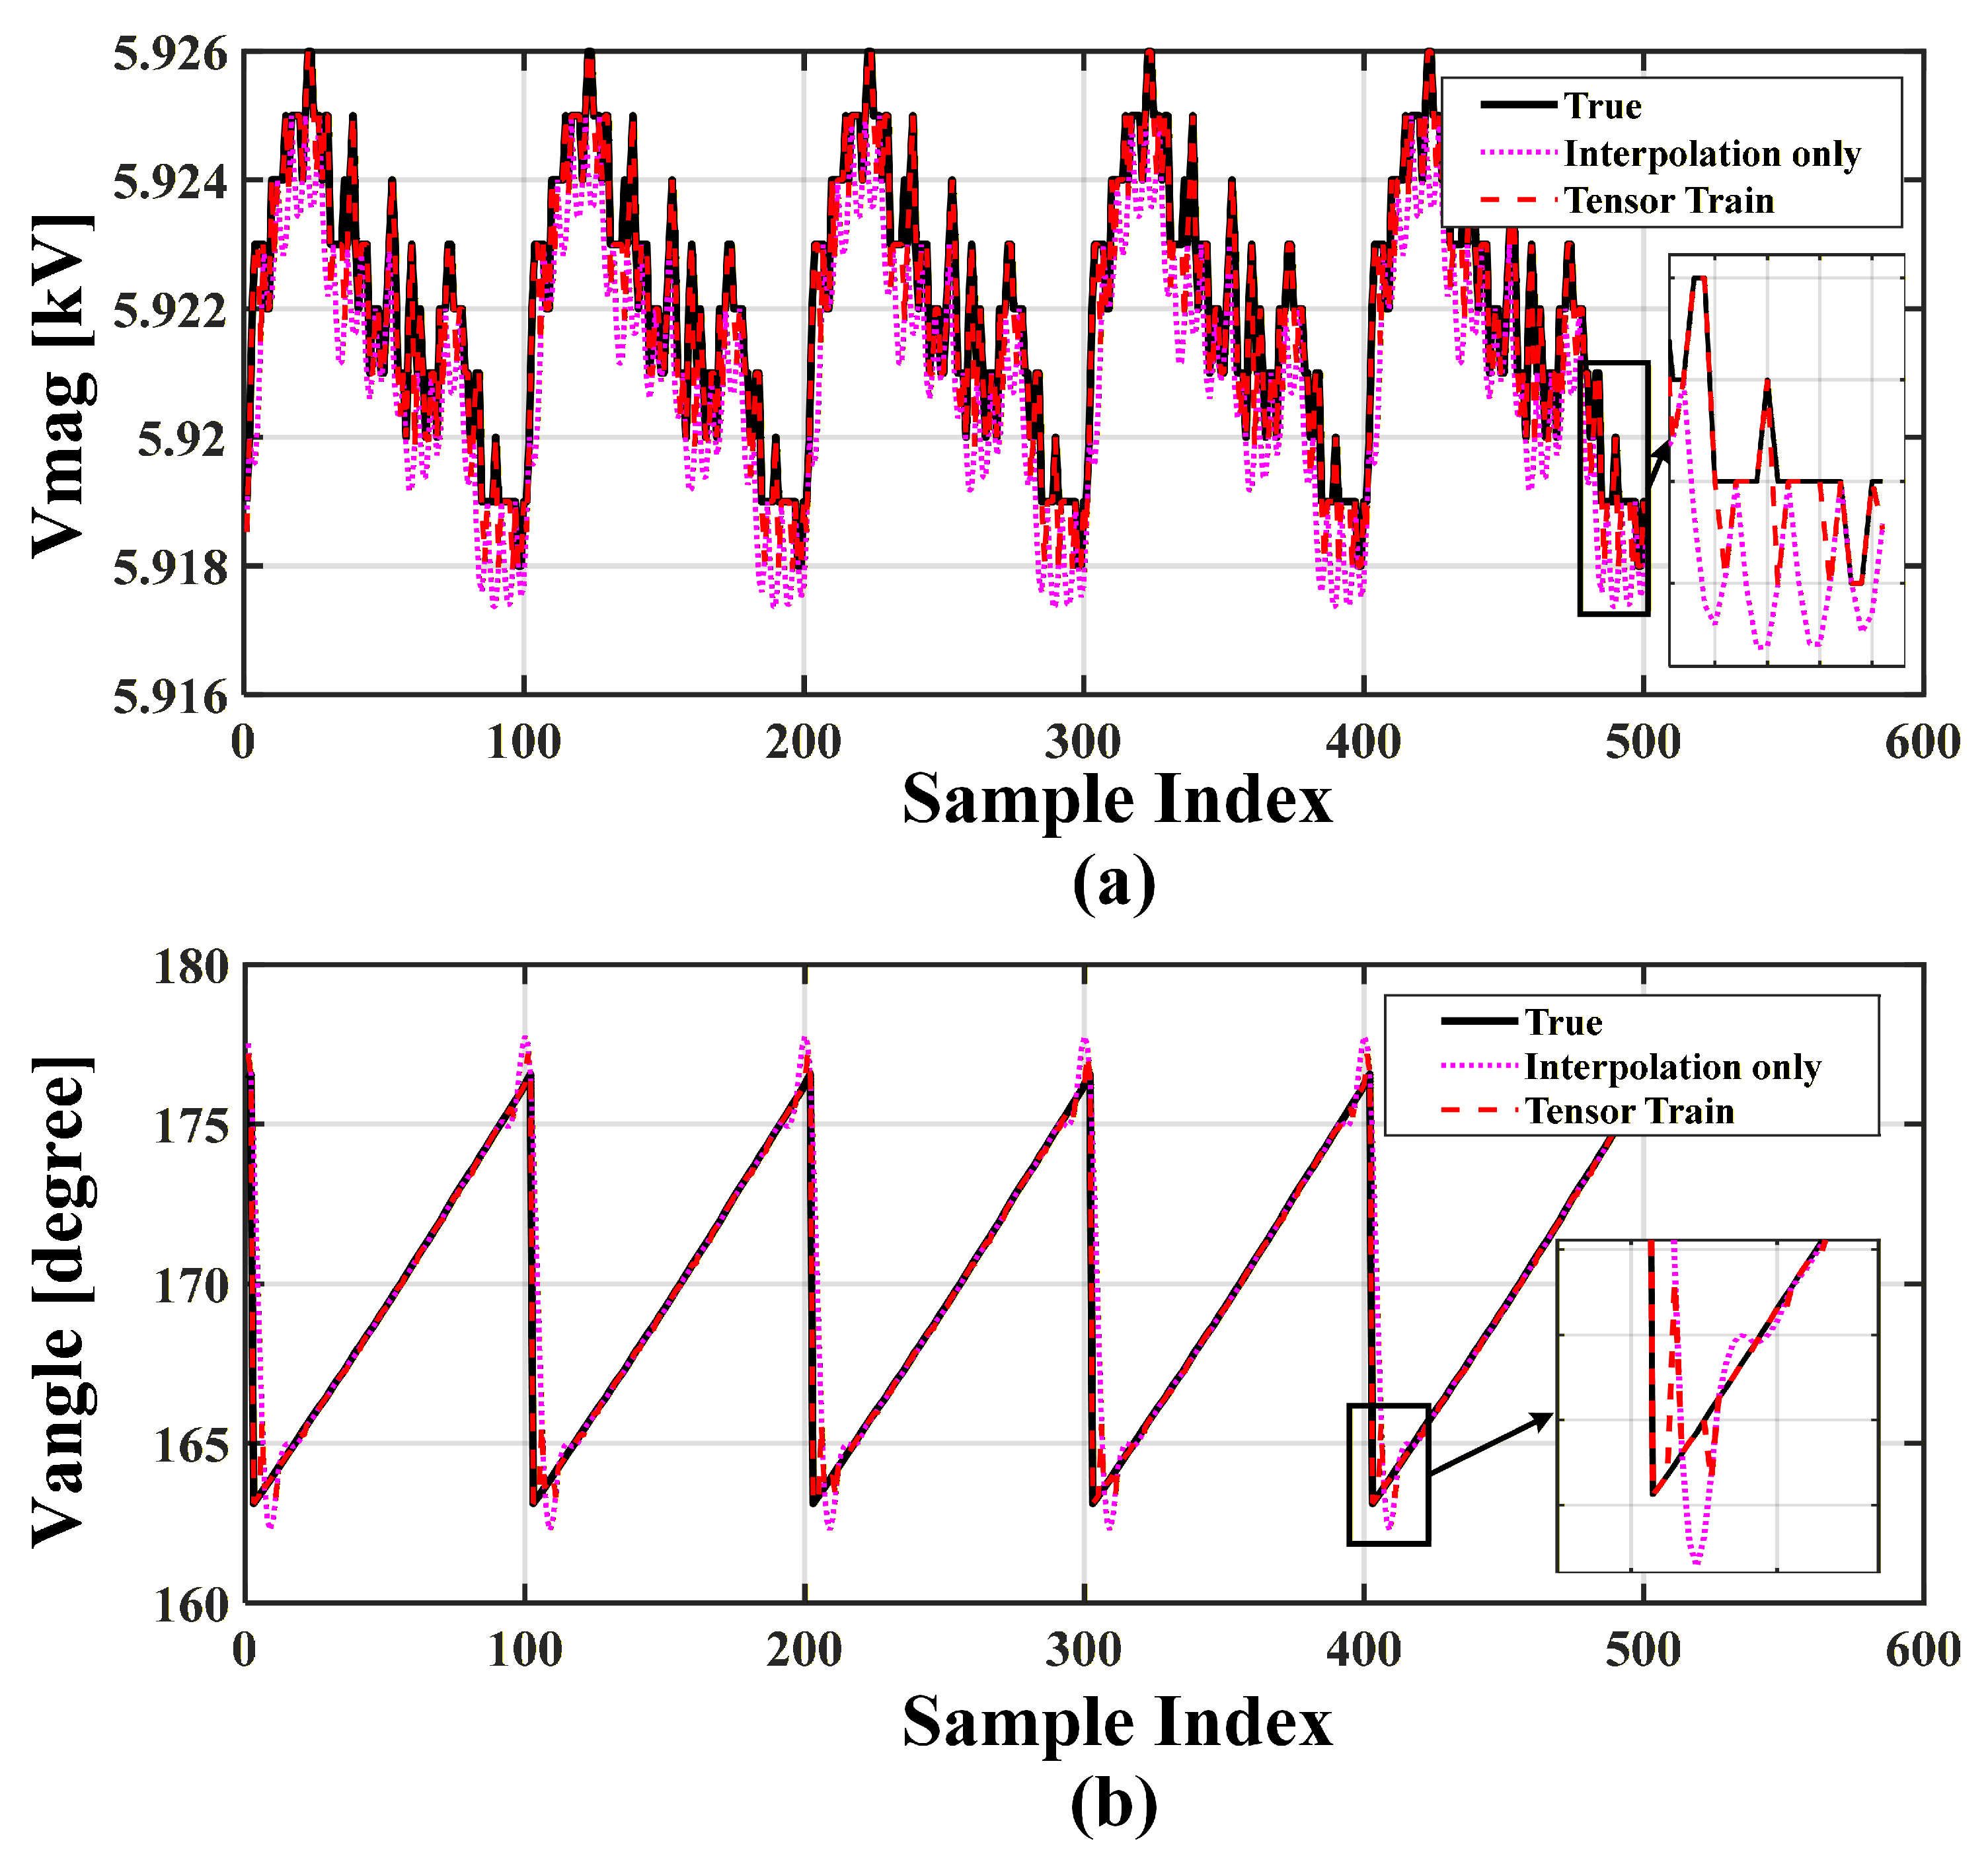
To further assess the practicality of the proposed method, we conduct experiments using real PMU measurements. Both voltage magnitude and phase-angle data are tested independently. The original 10 Hz measurements are reconstructed to a 50 Hz resolution over a sampling duration of 200 s. In this experiment, the measurement data are organized into a tensor for reconstruction, and the tolerance parameter is chosen as and , respectively.
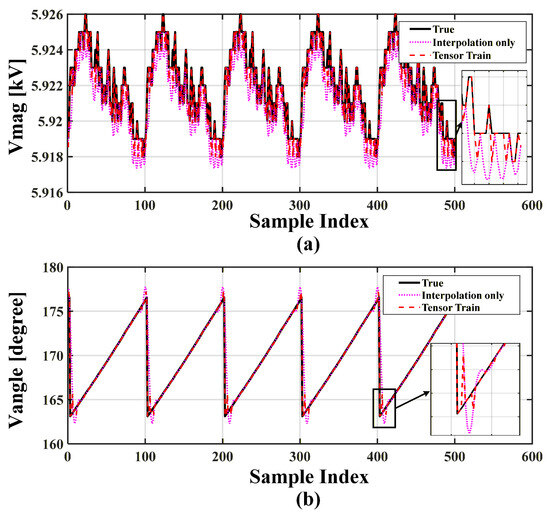
As shown in Figure 5, the proposed method demonstrates strong reconstruction performance on real PMU measurements. By enhancing the sampling rate from 10 Hz to 50 Hz, both voltage magnitude and phase-angle signals are recovered with high fidelity. The reconstructed voltage magnitude closely matches the actual waveform, while small local fluctuations are observed and are mainly influenced by measurement noise in practical PMU data. Meanwhile, the phase-angle reconstruction accurately preserves the original temporal evolution and maintains consistency at sharp transition points. These results indicate that the proposed approach can effectively exploit temporal correlations in real PMU data and reliably restore high-resolution measurements, which is essential for practical data fusion and time-synchronized analysis.
Figure 5.
Reconstruction performance comparison between interpolation-only and TT-based methods for sampling rate enhancement from 10 Hz to 50 Hz. (a) Voltage magnitude reconstruction. (b) Voltage phase-angle reconstruction.
Further, the quantitative results in Table 5 confirm the effectiveness of the proposed TT-based reconstruction method on real PMU data. For real PMU data, the highest available sampling rate 50 Hz is used as the reference signal. Lower-rate measurements are generated by temporal down-sampling of the 50 Hz data. The reconstructed high-rate signals are then compared with the original 50 Hz measurements. It should be noted that the 50 Hz PMU measurements are subject to measurement noise and finite accuracy. However, their uncertainty is typically much smaller than the reconstruction error introduced by temporal down-sampling, and thus they serve as a sufficiently accurate reference for evaluating reconstruction performance. For both voltage magnitude and phase-angle signals, nearest interpolation yields the poorest performance, especially in terms of , indicating its limited ability to capture the temporal dynamics of PMU measurements. The matrix nuclear norm method provides a clear improvement, demonstrating that low-rank structures are beneficial for PMU data reconstruction. Among all methods, the TT nuclear norm approach achieves the best overall performance, consistently attaining the lowest RMSE and MAE, as well as the highest values for both quantities. Notably, the improvement is more pronounced in phase-angle reconstruction, where the proposed method maintains high accuracy even in the presence of sharp transitions. These results suggest that exploiting multi-dimensional temporal correlations through tensor representations is particularly effective for reconstructing high-resolution PMU measurements from low-rate data.
Table 5.
Comparison of Real PMU Data Reconstruction Performance Across Different Methods.
To further assess the computational performance of the proposed method under practical operating conditions, runtime comparison experiments are conducted using real PMU measurement data, and the results are summarized in Table 6. It can be observed that the nearest interpolation method incurs negligible computational cost for both voltage magnitude and phase-angle reconstruction, since it does not involve iterative optimization. By contrast, the matrix nuclear norm–based method and the proposed TT method require relatively longer computation time. Compared with the matrix-based approach, the TT method exhibits a slightly increased runtime due to the modeling of higher-order temporal structures. Nevertheless, the overall runtime remains within the order of seconds for all tested cases, indicating that the proposed method is computationally feasible for offline PMU data fusion using real measurement data.
Table 6.
Runtime comparison of different reconstruction methods using real PMU data.
The real PMU measurement data used in this study are limited by data access and confidentiality requirements in practical engineering applications, and only approximately 200 s of continuous measurements are available. Such limitations are common in real-world power system studies. Although the data duration is relatively short, the selected data segment covers multiple oscillatory behaviors and variations in operating conditions, which are sufficient to provide a meaningful evaluation of the reconstruction performance of the proposed method.
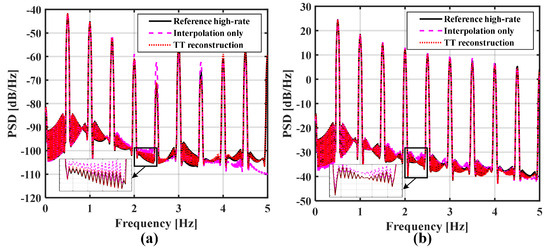
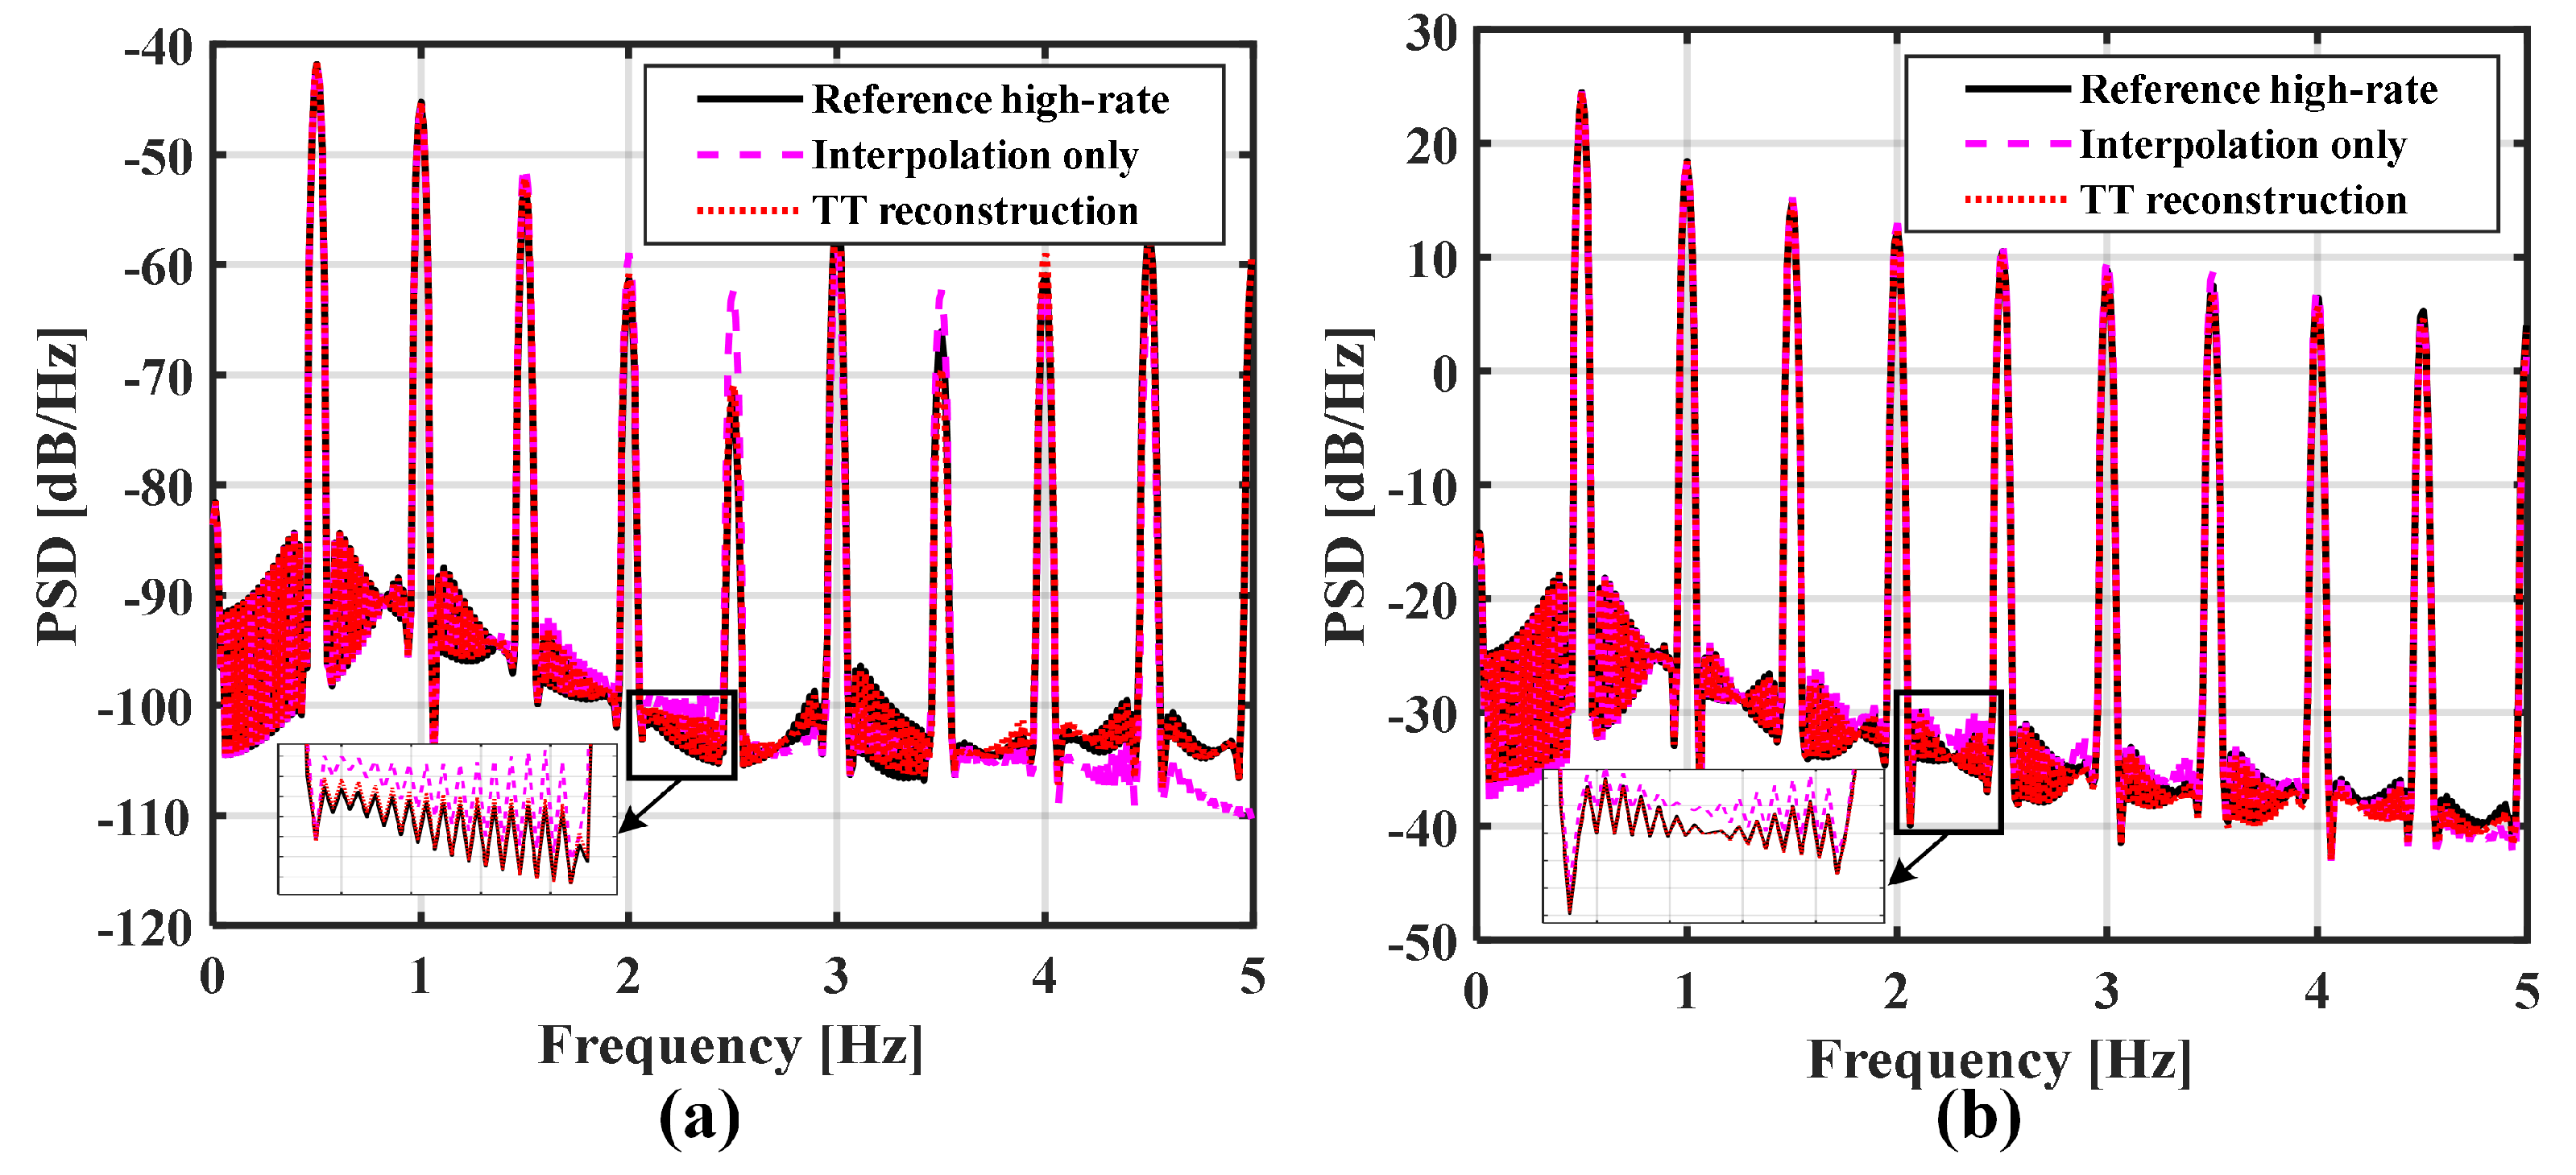
To clarify what spectral components are identifiable from low-rate PMU inputs, a frequency-domain consistency analysis is conducted. Specifically, the 50 Hz PMU measurements serve as the high-rate reference, while 10 Hz samples serve as the low-rate input. Since the Nyquist frequency of a 10 Hz signal is 5 Hz, the Welch PSDs of the reference signal, the interpolation-only baseline, and the proposed TT method are compared within the identifiable band of 0–5 Hz, as shown in Figure 6. It can be observed that within this band, the TT-based reconstruction closely matches the reference spectrum in both dominant peaks and overall spectral shape, whereas the interpolation-only method exhibits noticeable spectral distortions due to smoothing and filtering. These results indicate that the proposed method is not intended to recover arbitrary high-frequency dynamics beyond the Nyquist limit, but rather to generate a temporally refined, smooth, high-rate trajectory that remains consistent with the low-rate measurements and preserves identifiable low-frequency dynamics.
Figure 6.
Frequency-domain consistency of the reconstructed PMU signals within the identifiable band for 10 Hz input. The 50 Hz PMU data are used as the high-rate reference. (a) Voltage magnitude. (b) Voltage phase angle.
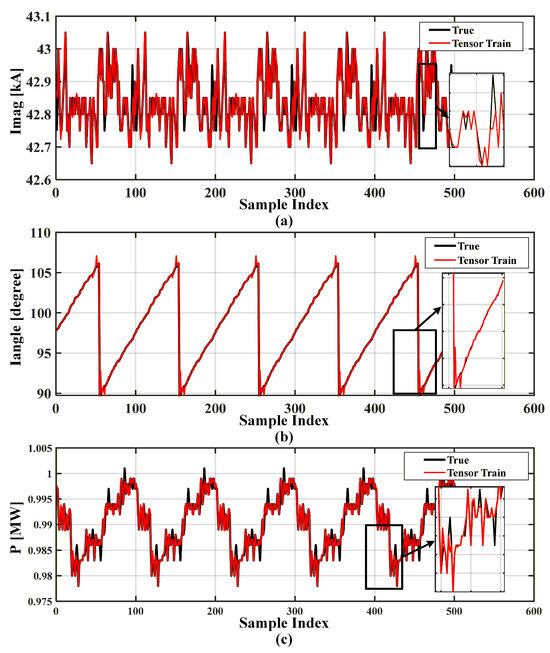
It should be noted that the real PMU dataset used in this study is limited to 200 s of continuous measurements due to data accessibility and confidentiality constraints. To partially mitigate this limitation, additional experiments are conducted on multiple measurement channels, including current magnitude, current phase angle, and active power, to demonstrate the robustness of the proposed method across different physical quantities. As shown in Figure 7, the proposed method achieves consistent reconstruction performance across multiple real PMU measurement channels. For current magnitude, current phase angle, and active power, the reconstructed signals closely match the high-rate reference data in both overall trends and local variations. These results demonstrate that the proposed method can also be effectively applied to PMU measurements with diverse physical characteristics and statistical behaviors.
Figure 7.
Reconstruction results of real PMU measurements using the proposed TT-based method: (a) current magnitude, (b) current phase angle, and (c) active power.
4.3. Discussion
Here, we discuss the underlying assumptions, potential limitations, and practical guidance for applying the proposed TT-based reconstruction method, aiming to clarify the conditions under which it performs well and the scenarios in which its performance may degrade.
- 1.
- The proposed method is based on two fundamental assumptions. First, PMU measurement data are assumed to exhibit a low-rank structure when organized into an appropriate high-order tensor representation. This assumption is reasonable for practical power systems, since system dynamics are governed by physical laws that induce coherent behavior across different nodes and time scales. Second, the method assumes the presence of temporal and spatio-temporal correlations in PMU data. When these correlations are sufficiently strong, the TT representation can capture the underlying multi-scale dependencies and support accurate reconstruction.
- 2.
- The reconstruction performance of the proposed method may degrade under certain conditions. One limiting case arises when the temporal resolution enhancement ratio becomes too large, so that the information contained in the low-rate measurements is insufficient to reliably recover high-frequency components. Performance degradation may also occur when PMU data exhibit weak correlations, for example, under highly stochastic operating conditions or during severe disturbances. In such situations, the low-rank assumption becomes less valid, resulting in lower reconstruction accuracy.
- 3.
- From an engineering perspective, different reconstruction methods are suitable for different application scenarios. Interpolation-based approaches are attractive when computational efficiency is the primary concern and only modest reconstruction accuracy is required. Matrix nuclear norm–based methods are more appropriate for relatively short data records, where higher-order spatio-temporal structures are not explicitly exploited. In contrast, the proposed TT-based approach is particularly advantageous for applications that demand high reconstruction accuracy, involve long-duration measurements, or exhibit pronounced multi-scale and high-order characteristics. In these cases, the TT representation can leverage latent correlations that are difficult to capture with matrix-based models, thereby improving reconstruction performance.
- 4.
- It should be noted that the real PMU experiments in this work are based on approximately 200 s of continuous measurements due to data accessibility constraints. Although limited in duration, the selected data segments include multiple fluctuations and diverse measurement types, providing a meaningful validation of the proposed method. In future work, longer continuous PMU datasets will be employed to further evaluate the method under extended time horizons and diverse operating conditions.
5. Conclusions and Future Work
This paper addresses the problem of temporal resolution enhancement for PMU measurements and proposes a data reconstruction method based on tensor train decomposition to facilitate effective fusion of PMU data with heterogeneous sampling rates. By reorganizing low-frequency PMU measurements into a high-order tensor representation, the proposed approach fully exploits temporal correlations across multiple time scales. Simulation studies on the IEEE 39-bus system, together with experiments using real PMU measurement data, demonstrate the effectiveness and practicality of the proposed method under different resolution enhancement scenarios. Overall, the proposed reconstruction framework provides a reliable and computationally efficient solution for temporal alignment and resolution unification of multi-source PMU data, offering valuable support for wide-area monitoring, situational awareness, and subsequent data fusion applications.
In addition, the proposed method can be readily extended to longer-duration PMU data analysis without modification to the core algorithm. In future work, the authors plan to further collaborate with industry partners to obtain longer-term real PMU measurement data and systematically evaluate the proposed approach under more complex and diverse operating conditions.
Author Contributions
Y.L.: Supervision; Writing—Reviewing and Editing; T.Z.: Software; Writing—Original Draft; Y.C.: Investigation; Writing—Reviewing and Editing; S.Z.: Formal analysis; Writing—Reviewing and Editing; J.Z.: Methodology; Writing—Reviewing and Editing; B.S.: Methodology; Formal Analysis. All authors have read and agreed to the published version of the manuscript.
Funding
The work was supported by the Smart Grid-National Science and Technology Major Project (2025ZD0806000).
Data Availability Statement
The data used to support the findings of this study are available from the corresponding author upon request.
Conflicts of Interest
Authors Yuan Li, Yonghua Chen, Shu Zheng, and Jingtao Zhao were employed by the Nari Technology Company. The remaining authors declare that the research was conducted in the absence of any commercial or financial relationships that could be construed as a potential conflict of interest. The funders had no role in the design of the study; in the collection, analyses, or interpretation of data; in the writing of the manuscript; or in the decision to publish the results.
Abbreviations
The following abbreviations are used in this manuscript:
| WAMS | Wide Area Measurement Systems |
| PMU | Phasor Measurement Unit |
| TT | Tensor Train |
| SCADA | Supervisory Control And Data Acquisition |
| BCD | Block Coordinate Descent |
| SVT | Singular Value Thresholding |
| MAE | Mean Absolute Error |
| RMSE | Root Mean Square Error |
| PSD | Power Spectral Density |
References
- Ruan, J.; Wang, Q.; Chen, S.; Lyu, H.; Liang, G.; Zhao, J.; Dong, Z.Y. On vulnerability of renewable energy forecasting: Adversarial learning attacks. IEEE Trans. Ind. Inform. 2023, 20, 3650–3663. [Google Scholar] [CrossRef] [Scilit]
- Shan, J.; Xu, Y.; Gu, W.; Zheng, Z.; Yu, R.; Yao, Y.; Liu, K.; Lu, S.; Abolmasoumi, A.H.; Mili, L. Dynamic State Estimation for Photovoltaic Under Variations of Solar Irradiance. IEEE Trans. Ind. Inform. 2025, 21, 7609–7620. [Google Scholar] [CrossRef] [Scilit]
- Liu, K.; Xu, Y.; Zheng, Z.; Yao, Y.; Gu, W.; Liu, C.; Lu, S.; Mili, L.; Shi, C. Decentralized Bayesian Inference for Inertia Estimation In Modern Power System Using Ambient Measurements. IEEE Trans. Power Syst. 2025, 40, 5354–5368. [Google Scholar] [CrossRef] [Scilit]
- Dobakhshari, A.S.; Azizi, S.; Paolone, M.; Terzija, V. Ultra fast linear state estimation utilizing SCADA measurements. IEEE Trans. Power Syst. 2019, 34, 2622–2631. [Google Scholar] [CrossRef] [Scilit]
- Bose, A. Smart transmission grid applications and their supporting infrastructure. IEEE Trans. Smart Grid 2010, 1, 11–19. [Google Scholar] [CrossRef] [Scilit]
- Zhu, J.; Gao, W.; Li, Y.; Guo, X.; Zhang, G.; Sun, W. Power System State Estimation Based on Fusion of PMU and SCADA Data. Energies 2024, 17, 2609. [Google Scholar] [CrossRef] [Scilit]
- Eissa, M.; Masoud, M.E.; Elanwar, M.M.M. A novel back up wide area protection technique for power transmission grids using phasor measurement unit. IEEE Trans. Power Deliv. 2009, 25, 270–278. [Google Scholar] [CrossRef] [Scilit]
- Zenelis, I.; Wang, X. Wide-area damping control for interarea oscillations in power grids based on PMU measurements. IEEE Control Syst. Lett. 2018, 2, 719–724. [Google Scholar] [CrossRef] [Scilit]
- Appasani, B.; Jha, A.V.; Mishra, S.K.; Ghazali, A.N. Communication infrastructure for situational awareness enhancement in WAMS with optimal PMU placement. Prot. Control Mod. Power Syst. 2021, 6, 1–12. [Google Scholar] [CrossRef] [Scilit]
- Paramo, G.; Bretas, A.; Meyn, S. Research trends and applications of PMUs. Energies 2022, 15, 5329. [Google Scholar] [CrossRef] [Scilit]
- Liu, K.; Zeng, Y.; Xu, J.; Jiang, H.; Huang, Y.; Peng, C. Multi-source electricity information fusion methods: A survey. Front. Energy Res. 2023, 10, 1080882. [Google Scholar] [CrossRef] [Scilit]
- Zhao, L.; Huang, L.; Lv, Q.; Yang, T.; Wei, D. WAMS/SCADA Data Fusion Method Study Based on Time-Series Data Correlation Mining. In Advances in Artificial Systems for Medicine and Education, AIMEE 2017, Advances in Intelligent Systems and Computing; Springer: Berlin/Heidelberg, Germany, 2017; pp. 120–133. [Google Scholar]
- Diakos, K.; Wu, Q.; Nielsen, A.H. Phasor measurement unit and phasor data concentrator test with real time digital simulator. In Proceedings of the 2014 IEEE PES Asia-Pacific Power and Energy Engineering Conference (APPEEC), Hong Kong, China, 7–10 December 2014; IEEE: New York, NY, USA, 2014; pp. 1–5. [Google Scholar]
- Zhu, J.; Gao, W. Multi-rate measurement fusion for power system state estimation. Proc. J. Phys. Conf. Ser. 2024, 2814, 012034. [Google Scholar] [CrossRef] [Scilit]
- Tian, S.; Zhu, F.; Shen, J.; Yang, X.; Fu, Y.; Mi, Y.; Ling, P. Distributed state estimation of active distribution network considering mixed-frequency measurement data hierarchical encryption. Appl. Energy 2025, 388, 125661. [Google Scholar] [CrossRef] [Scilit]
- He, X.; Dong, H.; Yang, W.; Li, W. Multi-source information fusion technology and its application in smart distribution power system. Sustainability 2023, 15, 6170. [Google Scholar] [CrossRef] [Scilit]
- Ghosal, M.; Rao, V. Fusion of PMU and SCADA data for dynamic state estimation of power system. In Proceedings of the 2015 North American Power Symposium (NAPS), Charlotte, NC, USA, 4–6 October 2015; IEEE: New York, NY, USA, 2015; pp. 1–6. [Google Scholar]
- Ghosal, M.; Rao, V. Fusion of multirate measurements for nonlinear dynamic state estimation of the power systems. IEEE Trans. Smart Grid 2017, 10, 216–226. [Google Scholar] [CrossRef] [Scilit]
- Saadabadi, H.; Dehghani, M. Large-scale power systems state estimation using PMU and SCADA data. In Proceedings of the 2016 24th Iranian Conference on Electrical Engineering (ICEE), Shiraz, Iran, 10–12 May 2016; IEEE: New York, NY, USA, 2016; pp. 906–911. [Google Scholar]
- Kolda, T.G.; Bader, B.W. Tensor decompositions and applications. SIAM Rev. 2009, 51, 455–500. [Google Scholar] [CrossRef] [Scilit]
- Latorre, J.I. Image compression and entanglement. arXiv 2005, arXiv:quant-ph/0510031. [Google Scholar] [CrossRef] [Scilit]
- Cichocki, A.; Phan, A.H.; Zhao, Q.; Lee, N.; Oseledets, I.; Sugiyama, M.; Mandic, D.P. Tensor networks for dimensionality reduction and large-scale optimization: Part 2 applications and future perspectives. Found. Trends® Mach. Learn. 2017, 9, 431–673. [Google Scholar]
- Xiao, Y.; Lu, M.; Huang, Z.; Wang, Y.; Lin, L.; Zhang, C. Dynamic state estimation of power system considering asynchronous measurement. In Proceedings of the 2020 International Conference on Electrical Engineering and Control Technologies (CEECT), Melbourne, Australia, 10–13 December 2020; IEEE: New York, NY, USA, 2020; pp. 1–6. [Google Scholar]
- Cai, J.F.; Candès, E.J.; Shen, Z. A singular value thresholding algorithm for matrix completion. SIAM J. Optim. 2010, 20, 1956–1982. [Google Scholar] [CrossRef] [Scilit]
- Gao, P.; Wang, M.; Ghiocel, S.G.; Chow, J.H.; Fardanesh, B.; Stefopoulos, G. Missing data recovery by exploiting low-dimensionality in power system synchrophasor measurements. IEEE Trans. Power Syst. 2015, 31, 1006–1013. [Google Scholar] [CrossRef] [Scilit]
- Liu, J.; Musialski, P.; Wonka, P.; Ye, J. Tensor completion for estimating missing values in visual data. IEEE Trans. Pattern Anal. Mach. Intell. 2012, 35, 208–220. [Google Scholar] [CrossRef] [Scilit]
- Lee, N.; Cichocki, A. Fundamental tensor operations for large-scale data analysis in tensor train formats. arXiv 2014, arXiv:1405.7786. [Google Scholar]
- Bengua, J.A.; Phien, H.N.; Tuan, H.D.; Do, M.N. Efficient tensor completion for color image and video recovery: Low-rank tensor train. IEEE Trans. Image Process. 2017, 26, 2466–2479. [Google Scholar] [CrossRef] [Scilit]
- Sun, B.; Xu, Y.; Gu, W.; Huang, X.; Mili, L.; Fan, Y.; Lu, S.; Wu, Z.; Korkali, M. PMU Data Compression in Power Systems Using Adaptive Rank-Based Tensor Ring. IEEE Trans. Ind. Inform. 2025, 21, 5264–5275. [Google Scholar] [CrossRef] [Scilit]

Disclaimer/Publisher’s Note: The statements, opinions and data contained in all publications are solely those of the individual author(s) and contributor(s) and not of MDPI and/or the editor(s). MDPI and/or the editor(s) disclaim responsibility for any injury to people or property resulting from any ideas, methods, instructions or products referred to in the content. |
© 2026 by the authors. Licensee MDPI, Basel, Switzerland. This article is an open access article distributed under the terms and conditions of the Creative Commons Attribution (CC BY) license.